33
GWRC activiteiten rondom GWRC activiteiten rondom klimaatverandering en energie Stowa Afvalwater symposium Amersfoort - 25 Mei 2010

GWRC activiteiten rondomGWRC activiteiten rondom klimaatverandering en energie
Stowa Afvalwater symposium Amersfoort - 25 Mei 2010
Global Water Research Coalition
• Network of water research organisations active in the urban water cycle
• Objectives:– Exchange of information and knowledge
– Development of research strategies for global issuesp g g
– Coordination of research efforts
Global cooperation for generation and sharing of water knowledge
2
water knowledge
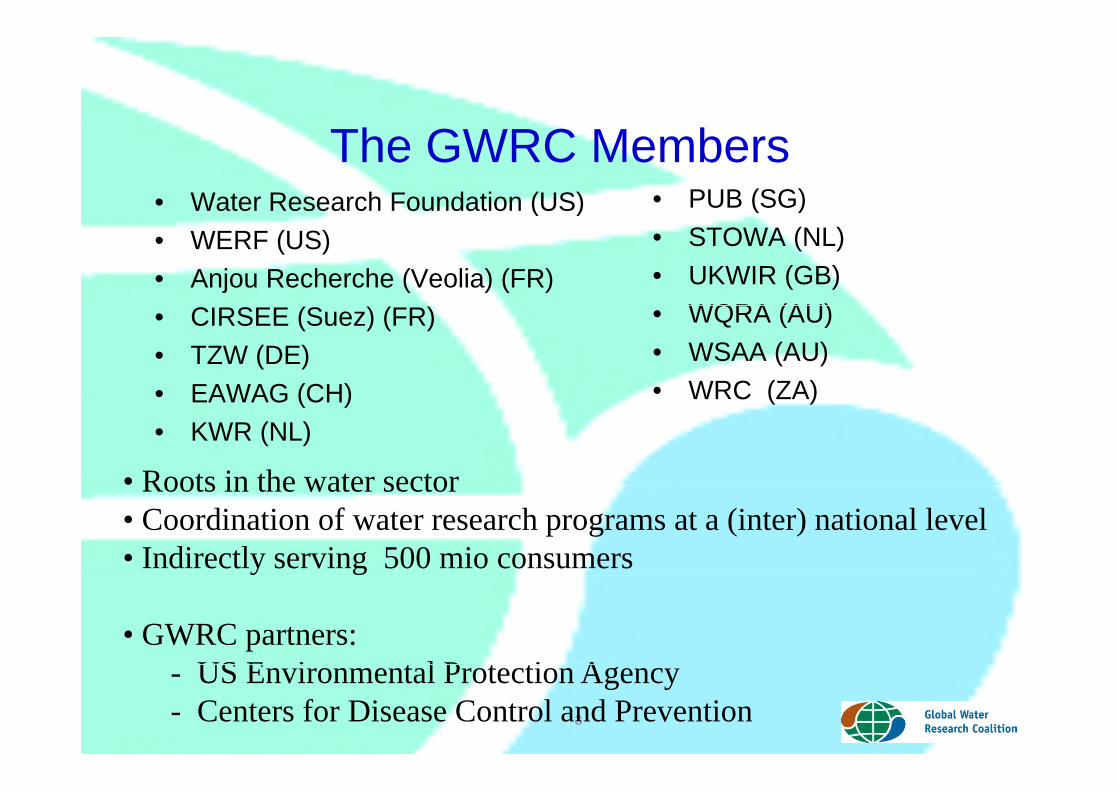
The GWRC Members• Water Research Foundation (US) • PUB (SG)( )• WERF (US)• Anjou Recherche (Veolia) (FR)
• STOWA (NL)• UKWIR (GB)
WQRA (AU)• CIRSEE (Suez) (FR)• TZW (DE)• EAWAG (CH)
• WQRA (AU)• WSAA (AU)• WRC (ZA)• EAWAG (CH)
• KWR (NL)WRC (ZA)
• Roots in the water sectorRoots in the water sector • Coordination of water research programs at a (inter) national level• Indirectly serving 500 mio consumers
• GWRC partners: US E i t l P t ti A
3
- US Environmental Protection Agency- Centers for Disease Control and Prevention
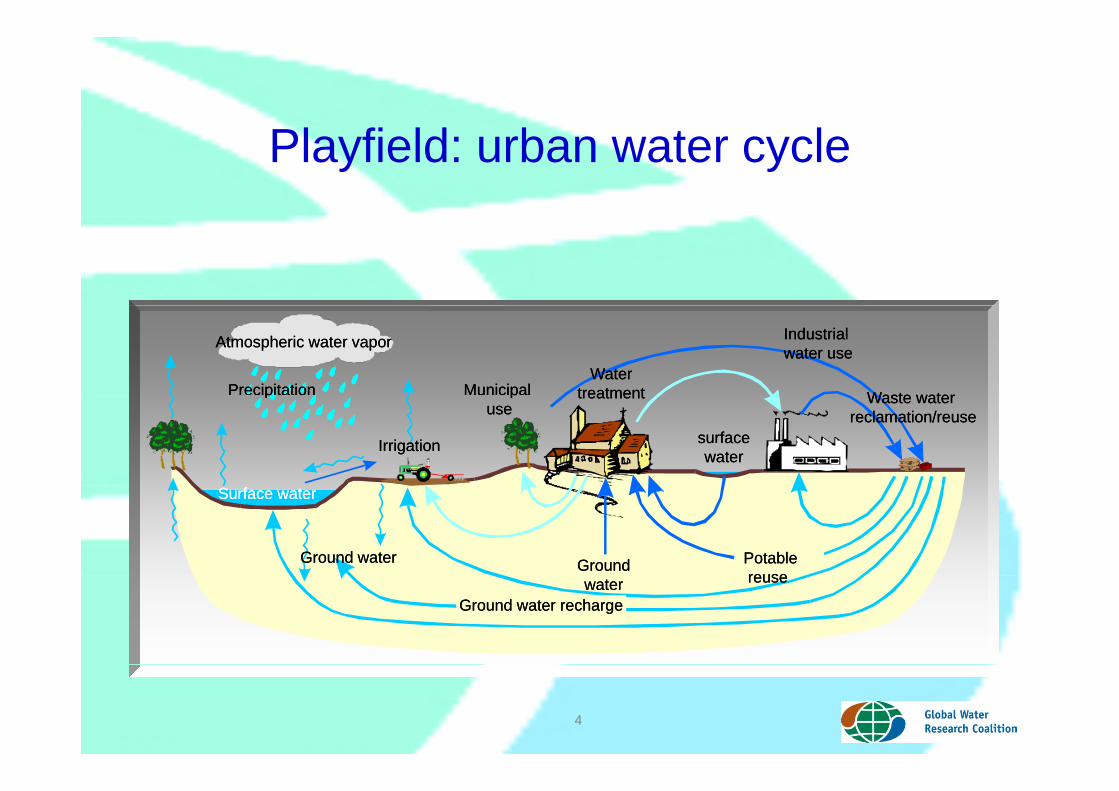
Playfield: urban water cycle
Waste waterWaste water
Industrial Industrial water usewater use
WaterWatertreatmenttreatmentMunicipal Municipal Precipitation Precipitation
Atmospheric water vapor Atmospheric water vapor
Waste water Waste water reclamation/reusereclamation/reuse
surfacesurfacewaterwater
treatmenttreatmentppuseuse
Irrigation Irrigation
pp
PotablePotablereusereuse
Surface waterSurface water
GroundGroundGround waterGround waterreusereusewaterwater
Ground water rechargeGround water recharge
4

Research AgendaResearch Agenda
• Water Quality – Algal toxins, Water-borne pathogens, hardness & CVD, ..
EDC & Pharmaceuticals NDMA PFAC/S– EDC & Pharmaceuticals, NDMA, PFAC/S…– Nanoparticles
• Asset Managementg• Wastewater Treatment (i.e. MBR EQ)• Water Reuse• Energy • Climate Change
• Desalination, Water Footprint, Rain & Gray water, Pipe Materials Water Quality in Distribution System
5
Pipe Materials, Water Quality in Distribution System

8

Water Energy & Climate ChangeWater, Energy & Climate Change
Impact Climate Change- Water quantity & quality
Demand & Energy - Population growth
- Infrastructure- Emission standards
- Urbanisation- Usage, costs of energy
Urban Water Cycle
GHG emissions Resource Recovery - Direct Indirect- Energy, chemicals, …- CO2, N2O, CH4 ….
- Energy: CH4, fuel cells, algae oil, …
- Water, nutrients, …
9

Energy and Resource Recovery fromEnergy and Resource Recovery from Sludge
• GoalsP id t t f– Provide status of knowledge on energy and resource recovery from sludgesludge
– Identify research needs and knowledge gaps
– Inform workshop on Water and Energy

Products Recoverable from SewageProducts Recoverable from Sewage Sludge
Type of Product Use of Product
Methane Electricity, heat, fuelMethane Electricity, heat, fuel
Gases Electricity, heatOil, fat, grease Biodiesel, methane, , g ,
Phosphorus FertilizersNitrogen FertilizersMetals Coagulants
Inorganic Materials Building Materials Inoculum Bio hydrogen gas productionInoculum Bio-hydrogen gas production
Crystal proteins, spores Bio-pesticides productionOrganic compounds Organic acid productiong p g p
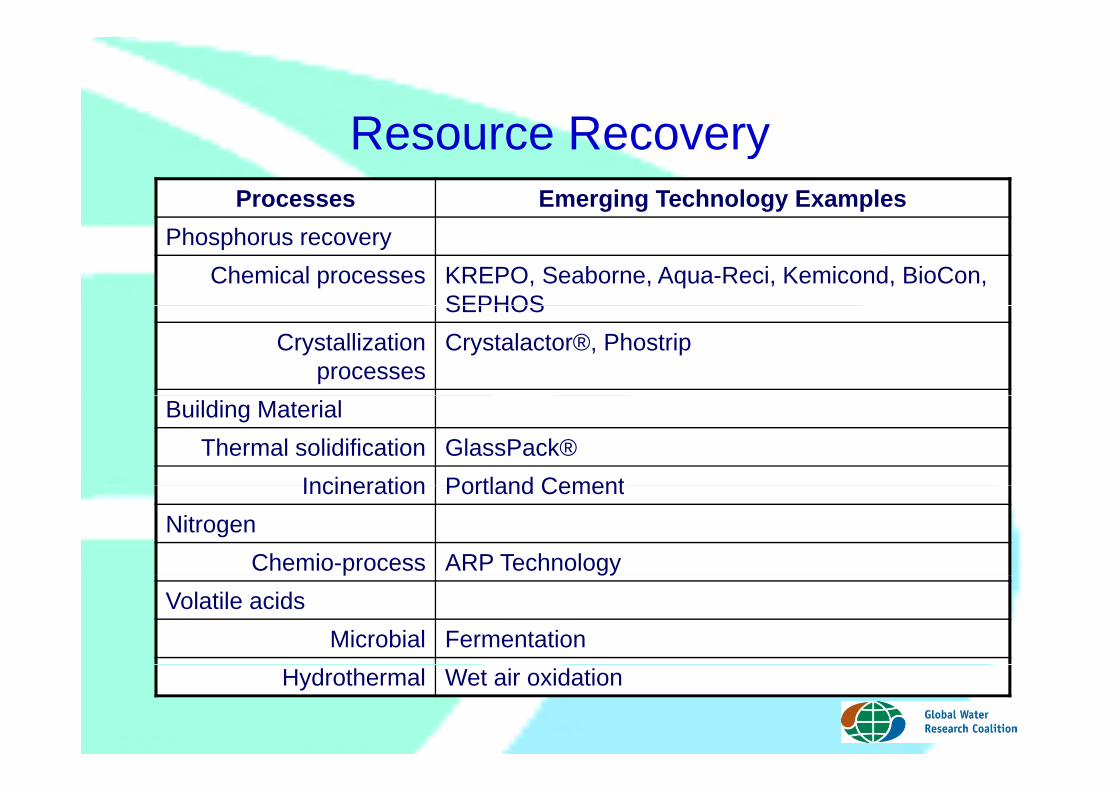
Resource RecoveryResource RecoveryProcesses Emerging Technology Examples
Phosphorus recoveryChemical processes KREPO, Seaborne, Aqua-Reci, Kemicond, BioCon,
SEPHOSSEPHOSCrystallization
processesCrystalactor®, Phostrip
Building MaterialThermal solidification GlassPack®
Incineration Portland CementIncineration Portland CementNitrogen
Chemio-process ARP Technologyp gyVolatile acids
Microbial FermentationHydrothermal Wet air oxidation

Water Energy and Climate ChangeWater, Energy and Climate Change
13

Water & Climate Change projectsBuyers' Guide to Climate Risk Information for Water Utilities Water RF
Regulatory Barriers to Sustainable Water/Wastewater Industry Water RF (2011)
Climate Change Impacts on Soils and Underground Infrastructure KWR & STOWA
Vulnerability Assessment and Risk Management Tools for Climate Change Water RF (2012)
Sustainable Water Infrastructure for Cost-Effective Responses to Climate Change
Water RF (2012)
Guidance Document on Carbon Trading for the Water Utility Sector WERF (2010)
Characterize Climate Change Impacts to the Wastewater Utility Industry WERF
Demonstration of Net Sequestration of Carbon in Biosolids as Compost or Land UKWIRApplication
Impacts of Underground Carbon Geologic Sequestration on the Quality of Groundwater (SotS report available)
Water RF (2012)
Nitrous Oxide Production in Wastewater Treatment Plants Stowa (2010)
Wastewater Industry GHG Emissions Inventory and Verification Handbook WERF
Developing Climate Change Resources for Water Quality: Clearinghouse W b it
Water RF (2011)Website

W t & EWater & EnergyO ll l / bi i• Overall goal /ambition: An energy neutral urban water cycle by 2030!
• Supported by GWRC members with concepts, tools, technologies ….
Via a 3 - phase approach:
1. Implement the State of the Science: the low hanging fruit
2. Optimisation/innovation of present2. Optimisation/innovation of present systems: 20 % reduction
3. Paradigm shift: 80% reduction
15

W & E jWater & Energy projectsProject Lead agent
Energy Efficiency in the Water Industry: A Compendium of Tools, Best Practices, and Case Studies
UKWIR (2010)
Wastewater Treatment Technology Roadmap in an energy and C-Constrained World (links to NL RWZI 2030 => WEN factory)
PU B – Singapore (2010)
Green Energy Life Cycle Assessment Tool (GELCAT) WERF (2010)
International Toolbox for Water Utility Process Performance Evaluation to Optimize Energy Management and GHG Emissions
Water RF (2011)
Energy Management (Phase 1) - Guidebook for Wastewater WERF/SAICgy g ( )OperationsEnergy Management (Phase 2) - Demonstration of Application of Guidebook to Manage Energy Consumption
PUB & WERF
Anaerobic Wastewater Treatment Assessment EAWAG, Stowa, WERF

17

Energy Efficiency in the Water Industry: A Compendium of Best Practices and Case
Studies
To identify opportunities to help deliver:
Incremental improvements in energy efficiency through optimisation of existing assets and operations.
More substantial improvements in energy efficiency from the adoption of novel (but proven at full scale) technologies.
(Technologies that have been tested only at laboratory or pilot scale are excluded from the study)
A comprehensive report on Best Practice, which includes as its main strength a selection of Case Studies.
18
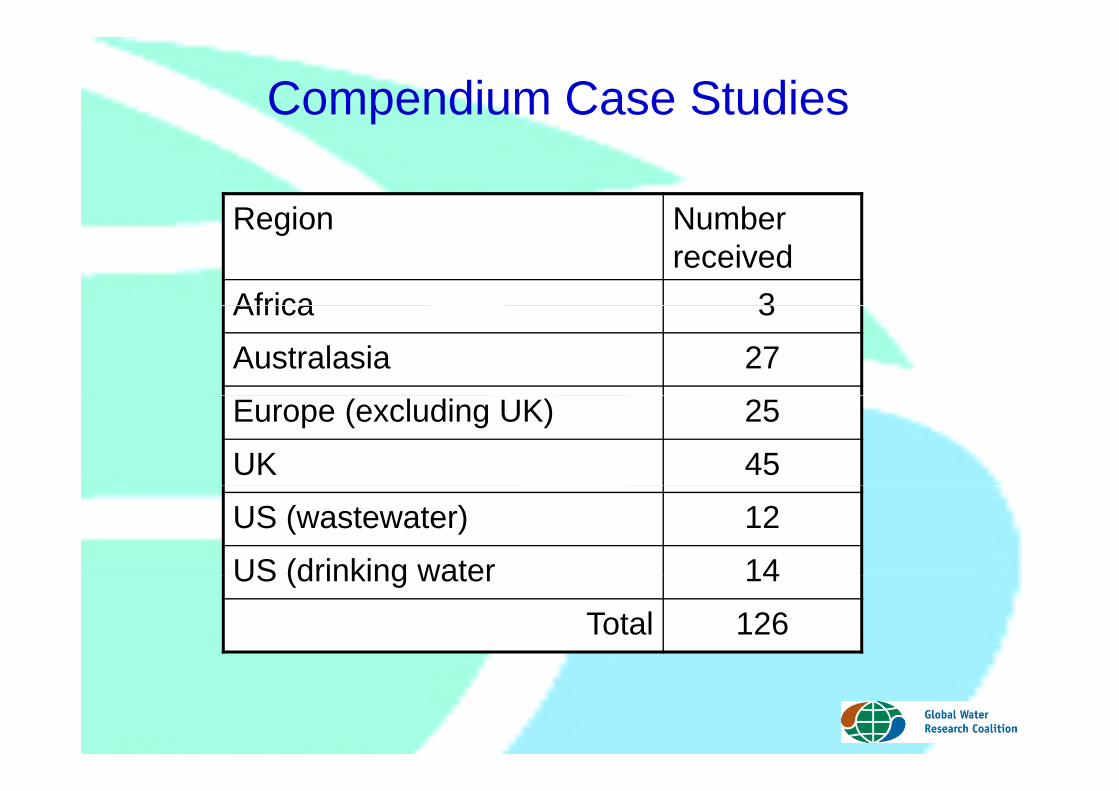
Compendium Case Studies
Region NumberRegion Number received
Africa 3Africa 3
Australasia 27
Europe (excluding UK) 25
UK 45
US (wastewater) 12
US (drinking water 14US (drinking water 14
Total 126

Clean Water Waste Water Water Cycle Energy Saving Matrix Raw Water Treatment Distribution Sewerage Treatment Disposal
Energy Estimate (% of whole) 25 10 65 25 60 15 C ti (W t & BW1 AW1 AWU2 BW1 SESW1 MC1 Conservation (Water & Energy)
BW1, AW1, AWU2, CRWD1, CWW1
BW1, SESW1, MC1, AW1, AWU2, CRWD1,
CWW1 Leakage Reduction SESW2, EM1 SESW2, EM1 SESW2, EM1, SW5
Dem
and
Mana
gem
ent
Infiltration/Inflow Reduction HW2, HW3 HW2, HW3 HW2, HW3 Optimise Gravity Flow KWR1 Optimise Gravity Flow KWR1 Pumping and pumps UU3, ScW5, SSW2,
AW1, TVW1, TVW2 SEW1, SWW3, NM1, HW1, SAW1, MW1
AWU1
SSW1, TVW3, TVW4, UU1, AW2, ScW6,
KWR2, PUB1, SAW1, WC1, WC2
MCW1, QWD1
ScW2, UU4, UU5
SAW1
AW6, SAW1,MW2
Pum
ping
Catchment Transfer KWR1
Clarification / Primary YW4, ScW4 ST4, ESP1 Aeration
AW4, AW5, AW7, DCWW1, ScW3,
SnW1, WW1, YW3, YW5, UU6, UU7, ST6,
ST7, BW1, SW1 nt
Mixing / Coagulation KWR3, PC1 Nutrient Removal
WW3, NW2, PUB2
ST1, ST3, VE2 RAS Pumping NW1, Membrane Treatment ST2, PUB3 Disinfection / UV
Trea
tmen
Disinfection / UV KWR4 WW2 Ozonation KWR5 Thickening / Dewatering ST8, ST9 Digestion / Co-digestion YW2, ST5, VE4,
EAW3, PUB4, PUB6 BCC1, SEW2 Sl
udge
,
CM1 S
Sludge Drying PUB5, SE1 Building Services AW3, SW2 SW2
Mini Hydro-Turbines ScW1, SWW2
VE1, MW3, SAW2, SEW1 YW1, CSD1 VE3
Wind Turbines Wind Turbines CWD1 ACUA1 Solar Power NJAW1 IEUA2
Gene
ratio
n
Biogas / CHP
UU2, SWW1, SE2, EAW1, EAW2, MW4, SAW3, SW3, SW4,
CWW2, IEUA1, CB1, CC1 KC1 LAC1

Case Study Exampley pTaunton WwTW Activated Sludge Plant, Wessex Water, UK
Ref Enquiry Item Response information, description and remarks
1 Location: Country, urban or rural: UK, rural
2 Sector: clean, waste or sludge: Waste Water
3 Works Owner or Operator: with financial set-up, regulatory or not.
Wessex Water; EA regulated
4 Size: flows and loads or population equivalent:
7131kg/d BOD and 20,727m3/dequivalent:
5 Energy Provider: with costs, incentives, taxes and conditions:
WPD, triad applicable
6 Process: physical, chemical, or Biological, secondary aeration treatmentbiological description:
7 Component: all or part of the works:
Consists of 3-lane ASP
8 Specific energy problem: Focus on optimising process leading to less aeration8 Specific energy problem: Focus on optimising process leading to less aeration
9 Process/Plant changes: mechanical, electrical or controls:
Installation of ammonium control which regulates DO input according to ammonium measured in last pocket of each lane
28 April 2009
SIWW
10 Civil/Physical Changes: to water / effluent quality, civil works, or process:
Ensure equal flow split to each lane by re-calibrating penstocks

Case Study Example – continuedy p
11 Operational Changes: skill levels, procedures and maintenance routines:
None particular but probes require maintenance
12 Risks and Dependencies: risk assessment of project and changes.
-
13 Implementation: design build Materials cost £25k and £5k to install13 Implementation: design, build, procurement, installation and commissioning:
Materials cost £25k and £5k to install
14 Energy Efficiency gains: kWh & kWh/m3
~ 480,000kWh PAkWh/m3
15 Cost / Benefit analysis: financial appraisal or payback time.
-
16 Project review: could it be improved Level of saving dependent on attitude to compliance riskor developed?
17 Confidence grade: on data provided. Highly transportable and adaptable.
Observations:Wessex Water have not included a cost / benefit analysis but if electricity costs £0.07/kWh, the payback period is less than one year. The motivation appears to have been energy cost saving, so it
f lwas successful.

European case studies
By:
Stowa and KWR &Stowa and KWR & Suez, Veolia, Eawag, TZW
In:
Belgium Denmark FranceBelgium, Denmark, France,Germany, Hungary, Netherlands, NorwayySpain, Switzerland
23

Energy efficiency savingsEnergy efficiency savings- Drinking water
K1 Reduced energy use for UV-treatment due to enhanced coagulation
7.7 million kWh/y (35%)
K2 Hydraulic connection of water pumping stations 700,000 kWh/y (5%)
K3 Variable frequency drivers at a water collection ll
100,000 kWh/y (15-20%)well
K4 Retrofitting the water treatment into ozonisation combined with two-stage GAC filtration
3 million kWh/y
K5 Energy saving from a coagulation optimisation procedure
60,000 kWh/y (5-10%)
T1 Pigging the head loss of raw water pipe 3 bar lower head loss
T2 Variable frequency drivers at distribution pumps 15% lower energyconsumption
24
consumption

Case study Belgium GrobbendonkCase study Belgium, Grobbendonk Pidpa
• Variable frequency drivers at a water collection well– 100,000 kWh/yy– 15-20%
25
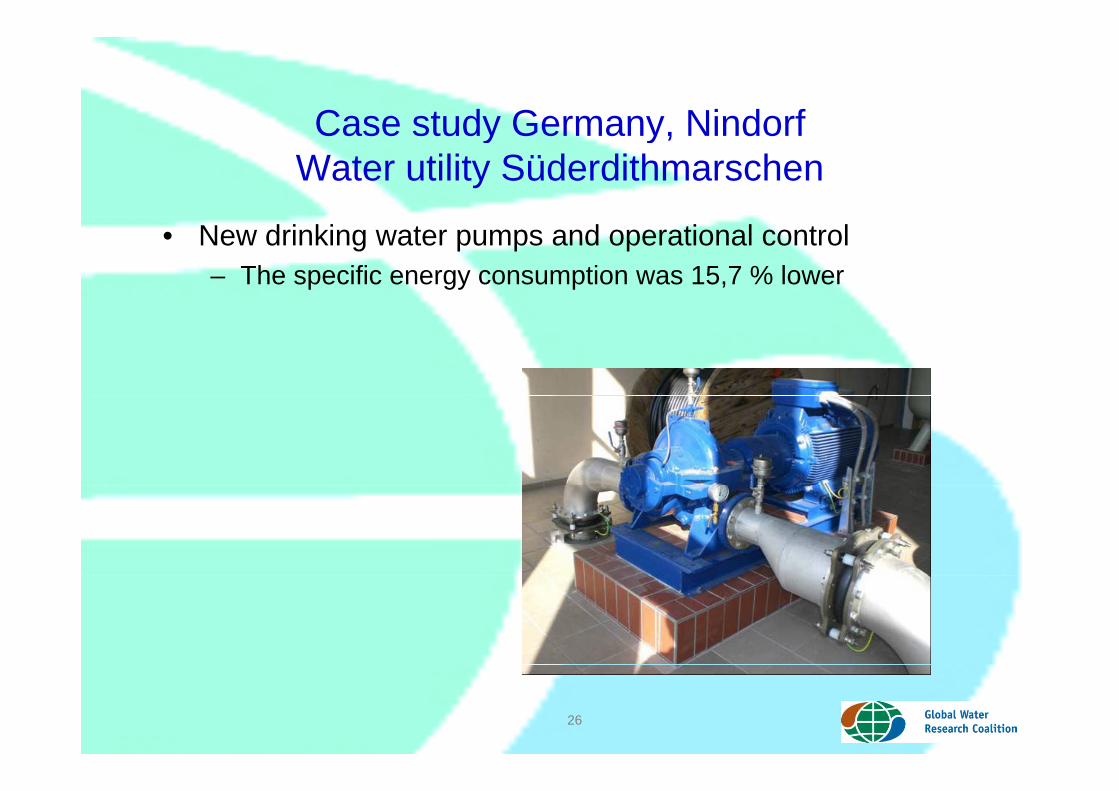
Case study Germany NindorfCase study Germany, NindorfWater utility Süderdithmarschen
• New drinking water pumps and operational control– The specific energy consumption was 15,7 % lower
26

Energy efficiency savingsEnergy efficiency savings- Wastewater
S2 Optimisation of MBR operation 0.1-0.3 kWh/m3
S3 Increase of sludge production with AB-process 20% lower energy demand and 20% more bibiogas
S4 Advanced primary settling 200,000 kWh/y
S6 Sludge age depending on temperature 10-15%
S7 Energy efficient plate aerators 25%S7 Energy efficient plate aerators 25%
V3 Energy optimisation with advanced online process control
1.3 million kWh/y (16%)
27
process control

Case study Denmark AvoreCase study Denmark, AvoreAWS
• Energy optimization with advanced online process control– 1 3 million kWh/y (16%)1.3 million kWh/y (16%)– specific from 0,32 kWh/m3 to 0,28 kWh/m3
Power (GWh), Incineration & DewateringPower (GWh), Incineration & DewateringPower (GWh), Incineration & DewateringPower (GWh), Biological WWTP steps
10
12GWh
-6%
Power (GWh), Biological WWTP stepsPower (GWh), Biological WWTP steps
10
12GWh
-6%10
12GWh
-6%
6
8
-16%6
8
-16%6
8
-16%
2
4
2
4
2
4
28
02003 2004 2005 2006 2007 2008
02003 2004 2005 2006 2007 2008
02003 2004 2005 2006 2007 2008

Case study Netherlands SliedrechtCase study Netherlands, SliedrechtWaterboard Hollandse Delta
• Energy efficient plate aerators– Plate aerators have a higher efficiency compared with g y p
conventional fine bubble aeration, resulting in a 25% decrease of energy demand
29

Energy efficiency savingsEnergy efficiency savings- Sludge
S1 Sharon/Anammox in N-rich sludge water from dewatered digested sludge
additional 500 kg/d N-removal at equal energy g g q gyuse
S8 Belt thickening instead of decanters 230,000 kWh/y (60%)
S9 Energy production out of RPM reduction 25,000-45,000 kWh/y
SE1 Energy savings using sludge combustion from 1000-2000 to 200-gy g g gexhaust gases for thermal drying 250 kWh/ton ds (90%)
SE2 Energy and economic savings using biogas for electricity and heat generation
19.2 million kWh/y (25%)electricity and heat generation
E1 Biogas production from sludge digestion 3.3 million kWh/y generated (80% of electricity need)
30
electricity need)

Case study Netherlands HapertCase study Netherlands, HapertWaterboard De Dommel
• Belt thickening instead of decanters– Belt thickeners have a higher energy efficiency than
decanters resulting in 230 000 kWh/y energy savingsdecanters, resulting in 230,000 kWh/y energy savings.
32
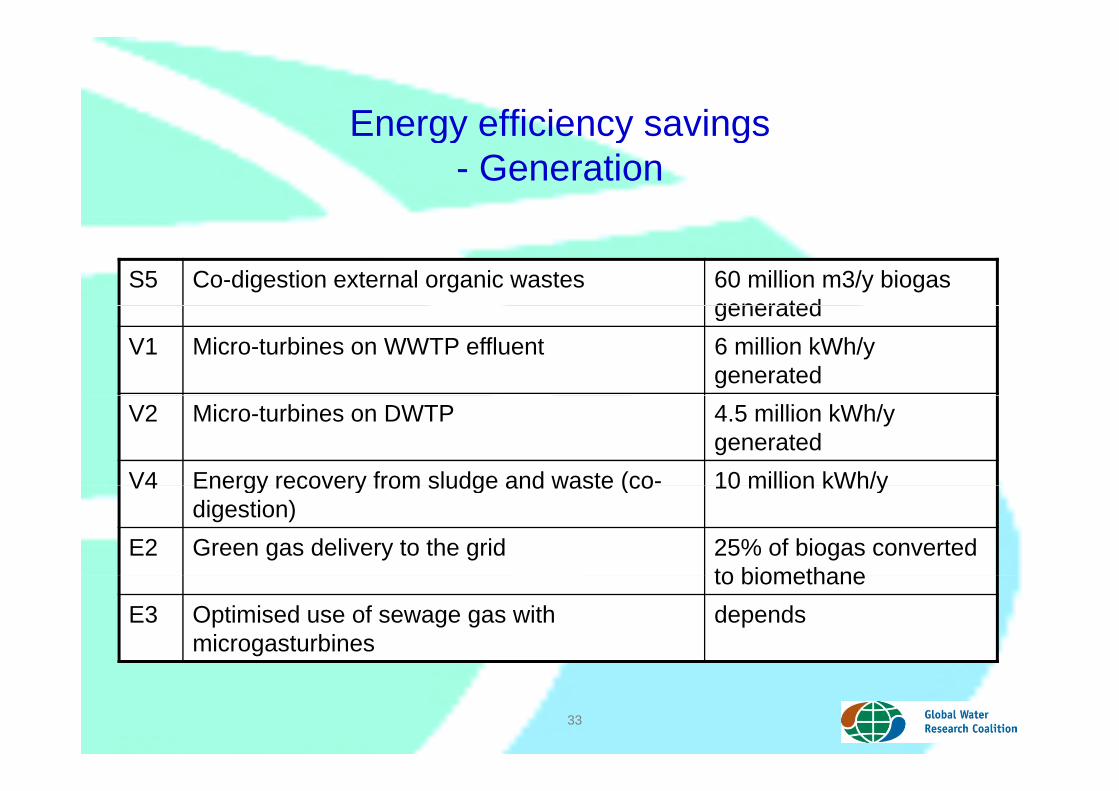
Energy efficiency savingsEnergy efficiency savings- Generation
S5 Co-digestion external organic wastes 60 million m3/y biogas generatedgenerated
V1 Micro-turbines on WWTP effluent 6 million kWh/y generated
V2 Micro-turbines on DWTP 4.5 million kWh/y generated
V4 Energy recovery from sludge and waste (co- 10 million kWh/yV4 Energy recovery from sludge and waste (codigestion)
10 million kWh/y
E2 Green gas delivery to the grid 25% of biogas converted to biomethaneto biomethane
E3 Optimised use of sewage gas with microgasturbines
depends
33

Case study FranceCase study France SIEVI & Veolia
• Micro-turbines on DWTP– Installation of 4 micro-turbines on drinking water supply
network:network: – 4.5 million kWh/y generated
34

Case study Hungary BudapestCase study Hungary, BudapestBudapest Sewage Works
• Energy recovery from sludge and waste (co-digestion)– 10 million kWh/y10 million kWh/y
Filter beltReceived waste
polymer
Filter beltReceived waste
polymerpolymer
ThickenerFilter belt
thickenerThermophilic digester
55°C reject water reject water
raw sludge
excess sludge ThickenerFilter belt
thickenerThermophilic digester
55°C
55°C reject water reject waterreject water reject water
raw sludge
excess sludge
raw sludge
excess sludge
GasholderFlare
GasholderFlare
Dewatering centrifuge
37 °C
Boilers
Cogenerations
Heat
Heat+
Dewatering centrifuge
37 °C37 °C
Boilers
Cogenerations
Boilers
Cogenerations
Heat
Heat+
Heat
Heat+
35
C Mesophilic digester
polymerDesulph.
reject water Heat+electricity
C C Mesophilic digester
polymerpolymerDesulph.
reject waterreject water Heat+electricity
Heat+electricity

Wh h k i d !When the work is done ….!
36


