H + D2 reaction dynamics. Determination of the product state distributions at a collision energy of 1.3 eV Ernesto E. Marinero,a) Charles T. Rettner,a) and Richard N. Zare Department of Chemistry, Stanford University, Stanford, California 94305 (Received 28 November 1983; accepted 18 January 1984) Two-photon resonance, three-photon ionization has been used to determine the HD product internal state distribution formed by the reaction of fast H atoms with thermal D2 molecules. A mixture of HI and D2 is irradiated by a 266 nm laser pulse to dissociate the former, giving a center- of-mass collision energy of about 1.30 ± 0.04 eV for H + D 2 . After a sufficiently short delay to ensure essentially collision-free conditions, a second laser is fired which causes multiphoton ionization of individual HD quantum states as well as D atoms, depending upon the choice of wavelength. Reaction occurs in a well-defined effusive flow which emerges from a glass orifice placed between the acceleration plates of a differentially pumped time-of-flight mass spectrometer. Ion signals are referenced to those obtained from HD or D produced in an auxiliary microwave discharge. Relative formation rates are reported for HD(v = 1, J = 0--6) and HD(v = 2, J = 0--6). Nascent D atoms are also observed and an upper limit is placed on the production ofHD(v = 3). Rotational surprisal plots are found to be linear for the HD product state distribution yielding a slope ofe R = 5.1 for HD(v = 1) and e R = 4.7 for HD(v = 2). These are extrapolated to provide full distributions for HD(v = 0--2, J = 0--6). The present product state distributions are compared with the recent experimental data of Gerrity and Valentini as well as with the quasiclassical trajectory calculations of Blais and Truhlar. I. INTRODUCTION The simplest bimolecular reaction involving neutral reagents is the hydrogen atom exchange reaction H+H2--H2 +H and its isotopic analogs. Its simplicity arises partly from the small number of electrons, which facilitate the construction of an accurate potential surface for the H3 system, and partly from the lightness of the hydrogen atoms, which limit the accessible product quantum states (channels). Starting with the early efforts of London, Eyring, and Polanyi,I,2 the H + H2 reaction family has been the focus of extensive theo- retical efforts to model reaction dynamics. 3 Today, the H3 potential surface is the most accurately known for any neu- tral reactive system,4 and it is one of the few systems for which the dynamics have been treated quantum mechanical- ly in three dimensions. 5 - 7 Such rigorous calculations in- crease in difficulty as the energy of the system exceeds threshold and consequently these have been carried out to date only over a limited range of collision energies. Never- theless, these results serve as an important test in developing approximate theories of reaction dynamics. 3 For this fundamental reaction, experimentalists have been hard pressed to keep up with theory. This is a conse- quence of a number of factors. The H + H2 reaction system has a large activation energy (-0.33 eV) requiring the gener- ation offast H atoms. Moreover, the reaction cross section is small, on the order of 1 X 10- 16 cm 2 , so that product yields are low. Finally, the reaction product is difficult to detect, especially in a quantum-state-specific manner. Consequent- ly, while state-to-state reaction dynamics have been investi- gated for a number of chemically interesting systems, 8-10 a) Present address: IBM Research Laboratory. San Jose. California 95193. such studies have only become possible for the H + H2 sys- tem within the last year. Two groups have independently reported somewhat similar experiments designed to over- come the above difficulties. Both employed a laser-photoly- sis method to produce fast H atoms for reaction with D2 and have utilized sensitive nonlinear spectroscopic techniques to determine quantum state distributions for the HD product. Gerrity and Valentini 11 have used coherent anti-Stokes Ra- man spectroscopy (CARS) while Rettner, Marinero, and Zare l2 have employed multiphoton ionization (MPI). We present here a full account of our previous prelimi- nary report and include new results for the HD product in v = 2, J = 0--6. A novel laser photolysis MPI time-of-flight instrument is described in some detail and our findings are compared to those of Gerrity and Valentini II and to the re- cent three-dimensional quasiclassical calculations of Blais and Truhlar. 13 II. EXPERIMENTAL A. General In order to study the detailed dynamics of the H + H2 family of reactions, it is necessary to bring together the rea- gents at sufficiently high collision energies and densities to ensure a measurable product yield. Moreover, these condi- tions must be compatible with a method for the sensitive quantum-state-specific detection of the reaction products. These requirements place stringent constraints on the design of the experiment. Our basic approach utilizes an effusive flow of a mixture of the reagents, where we take no advan- tage of the beam directionality other than to create a local- ized high density. In our scheme, hydrogen atoms are pro- duced in the presence of D2 by laser photolysis and reaction products are interrogated by a second laser which is fired 4142 J. Chern. Phys. 80 (9). 1 May 1984 0021-9606/84/094142-15$02.10 @ 1984 American Institute of Physics Downloaded 01 Jun 2011 to 171.66.91.53. Redistribution subject to AIP license or copyright; see http://jcp.aip.org/about/rights_and_permissions
Transcript
H + D2 reaction dynamics. Determination of the product state distributions at a collision energy of 1.3 eV
Ernesto E. Marinero,a) Charles T. Rettner,a) and Richard N. Zare Department of Chemistry, Stanford University, Stanford, California 94305
(Received 28 November 1983; accepted 18 January 1984)
Two-photon resonance, three-photon ionization has been used to determine the HD product internal state distribution formed by the reaction of fast H atoms with thermal D2 molecules. A mixture of HI and D2 is irradiated by a 266 nm laser pulse to dissociate the former, giving a centerof-mass collision energy of about 1.30 ± 0.04 eV for H + D2. After a sufficiently short delay to ensure essentially collision-free conditions, a second laser is fired which causes multiphoton ionization of individual HD quantum states as well as D atoms, depending upon the choice of wavelength. Reaction occurs in a well-defined effusive flow which emerges from a glass orifice placed between the acceleration plates of a differentially pumped time-of-flight mass spectrometer. Ion signals are referenced to those obtained from HD or D produced in an auxiliary microwave discharge. Relative formation rates are reported for HD(v = 1, J = 0--6) and HD(v = 2, J = 0--6). Nascent D atoms are also observed and an upper limit is placed on the production ofHD(v = 3). Rotational surprisal plots are found to be linear for the HD product state distribution yielding a slope ofeR = 5.1 for HD(v = 1) and eR = 4.7 for HD(v = 2). These are extrapolated to provide full distributions for HD(v = 0--2, J = 0--6). The present product state distributions are compared with the recent experimental data of Gerrity and Valentini as well as with the quasiclassical trajectory calculations of Blais and Truhlar.
I. INTRODUCTION
The simplest bimolecular reaction involving neutral reagents is the hydrogen atom exchange reaction
H+H2--H2 +H
and its isotopic analogs. Its simplicity arises partly from the small number of electrons, which facilitate the construction of an accurate potential surface for the H3 system, and partly from the lightness of the hydrogen atoms, which limit the accessible product quantum states (channels). Starting with the early efforts of London, Eyring, and Polanyi,I,2 the H + H2 reaction family has been the focus of extensive theoretical efforts to model reaction dynamics.3 Today, the H3 potential surface is the most accurately known for any neutral reactive system,4 and it is one of the few systems for which the dynamics have been treated quantum mechanically in three dimensions.5
-7 Such rigorous calculations in
crease in difficulty as the energy of the system exceeds threshold and consequently these have been carried out to date only over a limited range of collision energies. Nevertheless, these results serve as an important test in developing approximate theories of reaction dynamics. 3
For this fundamental reaction, experimentalists have been hard pressed to keep up with theory. This is a consequence of a number of factors. The H + H2 reaction system has a large activation energy (-0.33 eV) requiring the generation offast H atoms. Moreover, the reaction cross section is small, on the order of 1 X 10- 16 cm2, so that product yields are low. Finally, the reaction product is difficult to detect, especially in a quantum-state-specific manner. Consequently, while state-to-state reaction dynamics have been investigated for a number of chemically interesting systems, 8-10
a) Present address: IBM Research Laboratory. San Jose. California 95193.
such studies have only become possible for the H + H2 system within the last year. Two groups have independently reported somewhat similar experiments designed to overcome the above difficulties. Both employed a laser-photolysis method to produce fast H atoms for reaction with D2 and have utilized sensitive nonlinear spectroscopic techniques to determine quantum state distributions for the HD product. Gerrity and Valentini 11 have used coherent anti-Stokes Raman spectroscopy (CARS) while Rettner, Marinero, and Zare l2 have employed multiphoton ionization (MPI).
We present here a full account of our previous preliminary report and include new results for the HD product in v = 2, J = 0--6. A novel laser photolysis MPI time-of-flight instrument is described in some detail and our findings are compared to those of Gerrity and Valentini II and to the recent three-dimensional quasiclassical calculations of Blais and Truhlar. 13
II. EXPERIMENTAL
A. General
In order to study the detailed dynamics of the H + H2 family of reactions, it is necessary to bring together the reagents at sufficiently high collision energies and densities to ensure a measurable product yield. Moreover, these conditions must be compatible with a method for the sensitive quantum-state-specific detection of the reaction products. These requirements place stringent constraints on the design of the experiment. Our basic approach utilizes an effusive flow of a mixture of the reagents, where we take no advantage of the beam directionality other than to create a localized high density. In our scheme, hydrogen atoms are produced in the presence of D2 by laser photolysis and reaction products are interrogated by a second laser which is fired
4142 J. Chern. Phys. 80 (9). 1 May 1984 0021-9606/84/094142-15$02.10 @ 1984 American Institute of Physics
Downloaded 01 Jun 2011 to 171.66.91.53. Redistribution subject to AIP license or copyright; see http://jcp.aip.org/about/rights_and_permissions
Marinero, Rettner, and Zara: H+D, reaction dynamics 4143
after a delay that is long enough for some reaction to occur, but prior to any substantial product-state relaxation. This so-called "pump-and-probe" approach is basically a laser version of the classical flash-photolysis method 14 and has previously been successfully employed by a number of workers, particularly in studies of the reaction of excited atoms. IS- 18 While this basic scheme permits reagents to be brought together at relatively high densities and under essentially collision-free conditions, in this instance it also provides the necessary means of generating the reagent collision energy. Since the -0.33 eV activation energy of these reactions corresponds to some 4000 K, such photochemical activation is vital to the success of any mixed-gas approach.
This method of producing fast hydrogen atoms for reactive studies far predates the advent oflasers. More that 35 years ago, Williams and Ogg19 photolyzed HI with the 253.7 nm line of a mercury lamp and observed greatly enhanced H atom reaction rates. Later studies were concerned with reactions such as D + H2, CH4 , and C2H/o,21 and H + D2, CD4 ,
and C2D6.21 This culminated in the elegant studies of Kuppermann and White22 who used different photolysis wavelengths to determine the threshold for the reaction D + H2· The introduction of powerful UV laser sources has brought about a revival of interest in this photolytic production of "hot" hydrogen atoms. While the first laser workers were concerned with energy transfer (T -V) processes.23-25 Quick and Moore26 recently reported the first reactive studies.
Let us now consider the "probe" aspects of our pumpand-probe scheme. The quantum-state-specific detection of molecular hydrogen has been demonstrated using MPI27,28 CARS,II,26,29-31 and laser-induced fluorescence (LIF),32.33 as well as high-resolution photoelectron spectroscopy (PES).34-36 Of these, the MPI and LlF methods offer the highest reported sensitivities, of which we have chosen the MPI approach, while Gerrity and Valentini II have successfully employed CARS to detect nascent HD reaction products.
State-specific detection of HD is achieved by resonant two-photon excitation to the double-minimum E, F I ~g+ state. A subsequent photon is then absorbed to produce HD+ ions which are sensitively detected. The basic twophoton excitation scheme was first demonstrated by Kligler et aI.37 who detected near-infrared emission from the H2 E, F I ~g+ to the H2 B I ~u+ state, while Marinero et al.27,28
have recently described a more sensitive multi photon ionization scheme. Figure I displays the potential energy curves involved in this process. Note that at the high laser intensities ( - 109 W cm - 2) required to excite the two-photon step, ionization , caused by absorption of a subsequent photon, competes strongly with and may even dominate over radiative decay.
The sensitivity of the MPI technique depends heavily on the ability to collect ions with close-to-unit efficiency and to employ a charged-particle multiplier to amplify signals. In addition, in these experiments, it is necessary to utilize mass selection of the detected ions to separate them from the large numbers of background ions produced by the highintensity UV sources used. The operation of an electron multiplier and time-of-flight mass selection both dictate pres-
22
20
18
16 ..... > Q) ..... >- 14 (!) c: w z w
12
10
2
o 1.0 2.0 3.0
INTERNUCLEAR DISTANCE <.4.) FIG. I. Relevant potential energy curves involved in the two-photon resonant, three-photon ionization of molecular hydrogen.
sures $; 10-5 Torr. However, the reaction cross section is so smalV -1 X 10- 16 cm2, that a detectable product flux demands pressures;::: 10 mTorr. Thus, a differentially pumped system is required, in which reaction products are extracted from a relatively high pressure region into an independently pumped section where the ions are separated according to mass before detection.
Unfortunately, some of the more obvious designs for such an arrangement proved to be unacceptable. Two particular problems deserve mention: (i) since high voltages are required for efficient ion extraction, careful design is required to avoid electrical breakdown; and (ii) since photon energies in excess of 5 eV are needed, care must be taken to prevent spurious ionization arising from the production of photoelectrons by the scattered laser light. Finally, we note that the vacuum system should be kept as clean as possible. This is necessary to minimize the concentration of easily ionized organic contaminants as well as that of molecular hydrogen which emanates from the stainless steel vacuum walls.
B. Detailed description
1. Production of fast H atoms
Fast H atoms are produced by photolyzing hydrogen iodide (HI) using the fourth harmonic ofa Nd:YAG laser at 266 nm (Quanta-Ray, DCR-2) operated at 10 Hz. Figure 2
J. Chern. Phys., Vol. 80, No.9, 1 May 1984
Downloaded 01 Jun 2011 to 171.66.91.53. Redistribution subject to AIP license or copyright; see http://jcp.aip.org/about/rights_and_permissions
4144 Marinero, Rettner, and Zare: H+D2 reaction dynamics
Synchronization Frequency
Doubled Dye Laser
Photolysis Laser
266 nm
7104 Oscilloscope
x10 PREAMP
MCP HI/D2 1nlet
Time-of-Flight Mass Spectrometer
Boxcar Signal
Averager
PB
"---- Brewster Angled Window
PB r~~--H-----~-+~~
Telescope
50
Raman Shifter
35
FlG. 2. Experimental setup for product-state distribution measurements of the H + D2-+HD + D reaction. The number by each lens is its focal length in cm; PB = Pellin-Broca prism; and MCP = multichannel plate ion detector.
presents an overview of the experimental layout. A PellinBroca suprasil prism isolates the 266 nm output. The resulting pulse (10 mJ, - 5 ns duration) is collimated to a - 2 mm diameter beam using an inverted telescope, consisting of 35 and 10 cm lenses. The beam is then steered through the vacuurn chamber using a single kinematically mounted dielectric mirror. The photolysis beam is linearly polarized with its electric vector pointing in the plane of Fig. 2.
Hydrogen iodide was chosen as the source of H atoms as it has the largest photodissociation cross section of any suitable hydride at 266 nm. At this wavelength the photolysis of HI has two channels; H + WP3/2) and H + WPlnl, which results in a - 2: 1 ratio of "fast" to "slow" H atoms. 38
-41 These yield CM collision energies with D2 of 1.30 ± 0.04 eV and 0.55 ± 0.03 eV, respectively, as shown in the Appendix. The HI gas was obtained from Scientific Gas Products and was purified by repeated freeze-pump-thaw cycles to 77 K. This served to remove H2 gas which is always present in the HI sample.
2. Multiphoton ionization of reaction products
Both reaction products, HD(v,J) and D are detected by three-photon ionization. The probe beam is derived by Raman shifting a Y AG-pumped frequency-doubled dye laser (Quanta-Ray, DCR-1A/PDL/WEX system) which is synchronized to the photolysis laser at variable delay by a 50 MHz pulse delay generator (Hewlett-Packard, 8015A). Using a fast biplanar photodiode (ITT, 4115) in combination with a 1 GHz oscilloscope (Tektronix, 7104) we measured a
TABLE I. Vacuum wave numbers (cm- I) of the HD E, F 11:.+ - X 11:.+ transitions" utilized to measure ground state populations.
"The transition frequencies are based on the measurements ofG. H. Dieke, Phys. Rev. SO, 797 (1936) for the HD E, F-B system combined with the measurements of l. Dabrowski and G. Herzberg, Can. J. Phys. 54, 525 (1976) for the HD B-X system.
temporal jitter of - ± 1 ns between the probe and photolysis lasers, over a delay range - ± 1 its. For our typical dye laser energies - 75 mJ in a - 5 ns pulse, we obtain - 15 mJ offrequency-doubled radiation, which upon Raman shifting in a cell ofH2 (7 atm), yields ~ 100 ItJ for the various antiStokes orders.
After recollimation the Raman cell output is dispersed by a Pellin-Broca prism which directs the desired horizontally polarized order into a second (mirror image) prism which deflects it through the reaction chamber (see Fig. 2). An f = 10 cm MgF 2 lens focuses the probe beam to ~ 40 Itm diameter spot at the center of the reaction zone. The beam propagates counter to the photolysis laser and exits the reaction chamber through a quartz Brewster-angled window after which a small fraction is picked off with a 90· prism and imaged onto a pyroelectric joulemeter (Molectron 13-05) to provide a monitor of the anti-Stokes energy. The back-to-back Pellin Broca arrangement ensures that the direction of the probe beam is independent of wavelength.
The quantum-state-specific detection of HD (v = 0-3, J = 0--6) requires tunable radiation in the 200-226 nm range to excite the Q-branch members of the E,F I~t (v = O)-X I~t (v = 0-3) two-photon transitions. Table I lists the frequencies of the Q-branch lines of the (0,0), (0,1), (0,2), and (0,3) bands of this system. Table II describes the excitation scheme employed for each of these bands.
In addition, we detect the D atom product of the reaction, as well as the H-atom reagent, via three-photon ionization resonantly enhanced by their Is-2s two-photon transitions at 82281.32 and 82258.95 cm- I
, respectively.42 Again, details of the excitation scheme are specified in Table II.
3. Detection of ions
As discussed in Sec. II A, in order to optimize both the reaction product yield and the ion collection efficiency, it is necessary to employ a differentially pumped system in which the reaction occurs in a localized region of high reagent density. This is accomplished by introducing the HI and D2 via a 3 cm long, 0.6 mm diameter fine glass tube which is placed close to the focus of the probe beam and is held on an external translator to permit vertical adjustment with respect to
J. Chem. Phys., Vol. 80, No.9, 1 May 1984
Downloaded 01 Jun 2011 to 171.66.91.53. Redistribution subject to AIP license or copyright; see http://jcp.aip.org/about/rights_and_permissions
Marinero, Rettner, and Zare: H+D, reaction dynamics 4145
TABLE II. Detection scheme employed in the MPI detection ofHD (u = 0-3) and H and D atoms.
the laser beam axis. In practice, the focal point (beam waist) of the desired anti-Stokes order is finely positioned with respect to the tube orifice by adjusting the beam collimation using the 35 cm lens at the exit of the Raman shifter (Fig. 2). This is necessary because of the different degrees of divergence of each anti-Stokes order.
Under typical operating conditions, the probe beam is positioned -0.75 mm below the tube orifice, where we estimate the densities of O 2 and HI to be -30 and -5 mTorr, respectively. These densities are obtained via calibration measurements in which we compare ion signals (H+ and 0/) that result from gases introduced through the glass tube and through a separate needle valve, directly into the
H,D Is-2s
H D
609.4 609.2
2nd 2nd
-400 -400
Sulforhodamine 640
chamber. Here the H+ signal arises when the probe laser, itself, dissociates the HI, and H atoms are ionized as discussed in Sec. II B 2. O 2 is detected in the same manner as for HO. Through this procedure, we estimate the density ratio between the bulk chamber and the relevant position (0.75 mm downstream) in the effusive flow. Thus the pressure at this point is found to be a factor of - 80 times that in the bulk chamber. With the HI/02 source on, the reaction chamber pressure rises to - 5 X 10⁻⁴ Torr.
As shown in Fig. 3, the reaction volume and glass delivery tube are located between the acceleration plates of a time-of-flight (TOF) mass spectrometer. Ions are extracted from the reaction chamber via a 1.5 mm wide, 7 mm long
Vertical 1 - Teflon Adjustment
~ Extractor
To Multichannel Plate
<
1 Vertical Adjustment
~~~ Repeller
Approx. Scale
I I I I
I Grid I
:/ ~! I I
I : I I
I I I
Glass Tube
/
Laser Axis
'V ,'x \ I \
I \
r--------
o 0.5 1 cm
J. Chem. Phys., Vol. 80, No.9, 1 May 1984
\
FIG. 3. Detailed drawing of the reaction zone and ion acceleration plates. The glass delivery tube is also shown. Note that both the glass delivery tube and the slit assembly are vertically adjustable using external translators (see the text).
Downloaded 01 Jun 2011 to 171.66.91.53. Redistribution subject to AIP license or copyright; see http://jcp.aip.org/about/rights_and_permissions
4146 Marinero, Rettner, and Zare: H+D, reaction dynamics
10 em LENS
EXTRACTOR
TEFLON
POSITION OF
REPELLER
I I I I I
l _____ J _~ _ _:: _ _:: _ _.: ,:-l _______ _
----------------------~
BREWSTER ANGLED WINDOW
I I
<Qf<:*l":~¥::" PHOTOLYSIS
LASER
. 'GRIDS
FIG. 4. Cross-sectional view of the reaction chamber and microwave discharge reference source. The horizontal grids screen the ion optics from the discharge tube orifice. The upper grid is held at the same voltage as the repeller plate, while the lower grid is grounded.
ARGON IN
" MICROWAVE DISCHARGE
FOR CALIBRA TION
;f HD IN
TO CRYOTRAP AND PUMP ,
aperture (aligned parallel to the laser beam axis) in the extractor electrode. The vertical position of this slit can be adjusted via an external micrometer and is held at a voltage of - + 1800 V, while the repeller plate is biased to + 2400 V. These two electrodes, as well as additional grids, form part of an assembly which is supported on a fixed Teflon disk, to which a seal is made through a single O-ring (see Fig. 3).
It might be anticipated that the introduction of an insulating material, such as the glass delivery tube, between the extractor electrodes would cause severe problems due to the buildup of static charges. This could distort the electric field lines, leading to loss of ion signal andlor a lack of repro ducibility. Indeed, we have found exactly such behavior for larger insulators, such as a 6 mm diameter tube. However, the present tube appears not to interfere in this respect. We attribute this difference to the smallness of the current delivery tube.
Electrical breakdown between the repeller plate (held at - 2400 V) and the extraction slit assembly is avoided by confining the reaction zone between the acceleration plates of the TOF (Fig. 3). Such a confined high local density also minimizes the attenuation of ion signals due to scattering and ion-molecule reactions.
After crossing the slit assembly the ions experience an acceleration field of -2.5 kV Icm over a -7 mm region between the extraction grid and the first grounded grid of the TOF. A second grounded grid placed 70 cm away from the first one, defines the field-free, ion-drift region. A multichannel plate (MCP) (Galileo FTD 2(02) is situated 5 mm behind the second grounded grid and its upper channel plate is held at - 2000V.
4. HO(v = 0-3) and 0 atom reference source
In order to measure nascent distributions of HD (v = 0-3,J) as well as the translational energy of the frag-
ments, we incorporated a microwave discharge reference source into the reaction chamber which can provide both D atoms and vibrationally excited HD molecules. This is schematically shown in Fig. 4. The discharge cavity is placed outside the vacuum chamber and the discharge products flow along a - 20 cm long passivated43 Pyrex tube to emerge through a-I mm diameter orifice placed - 3 cm away from the laser axis. The microwave flow tube incorporated an internal nozzle arrangement and a secondary port through which buffer gases could be introduced. The purpose of this feature was to enable us to relax collisionally the rotational populations of vibrationally excited HD in order to calibrate our product distributions against a known Boltzmann distribution.
It may be expected that the rotational temperature of the microwave generated vibrationally excited HD is not necessarily that of the flow-tube walls (essentially at 295 K). Indeed, in the absence of buffer gases the rotational distributions for v = 1,2 were found to be in agreement with a Boltzmann distribution at 325 K. The addition of argon cooled this somewhat, reaching - 310 K for mixtures containing - 90% argon. The slight differences between the power-corrected discharge signals and those predicted from idealized Boltzmann distributions were interpreted as being due to a small rotational dependence of the transition probabilities. Calibration against discharge signals was always made under identical conditions oflaser power and ion optics voltage settings. For the data reported here, we employed calibration factors (phenomenological transition probabilities) obtained from pure HD discharges, but which agreed within experimental uncertainties with those obtained in the presence of argon buffer. For HD(v = 1) J = 0-6, these factors are 1.00, 1.02, 0.89, 0.86, 0.90, 1.00, and 0.92, and for HD(v = 2)J = 0-6, they are 1.00, 1.05, 1.07, 1.14, 1.04, 1.00, and 1.00, respectively. In both cases, uncertainties are - 10% except for the J = 6 points, which are accurate to
J. Chem. Phys., Vol. 80, No.9, 1 May 1984
Downloaded 01 Jun 2011 to 171.66.91.53. Redistribution subject to AIP license or copyright; see http://jcp.aip.org/about/rights_and_permissions
Marinero, Rettner, and Zare: H + D2 reaction dynamics 4147
only - 25%. Notice that these correction factors are all close to unity, a finding that has been reported previously for H2
27,28 and has been found in detailed calculations of the . . 44
two-photon line strengths for these same transItIOns. Two horizontal grids screened the microwave dis
charge from the ion optics, as shown in Fig. 4. The one closest to the Pyrex tube orifice was held at ground potential while the upper one was biased to the same voltage as the repeller plate. The microwave discharge proved also to be invaluable in checking the spatial overlap of the photolysis and probe lasers within the reaction volume. This was accomplished in the following manner. The probe laser was tuned to excite a given Q line of the HD E,F-X (v;;;. 1 ) system and the subsequent ionization ofthe HD absorber monitored using the oscilloscope. As the ionization of the E,F state is not complete and its lifetime is - lOOns, 37 it became possible to observe a secondary HD+ peak when the photolysis laser was sent through the excitation volume some 50 ns after the probe laser. The amplitude of this secondary peak was directly related to the degree of spatial overlap between the two beams.
Finally, notice that optical baffles are employed to reduce the level of scattered light impinging on the ion optics. This is necessary because at the photon energies used here, the radiation can give rise to spurious photoelectron signals. In addition, these baffle arms are terminated with an annular section which is held at the bias potential of the repeller plate in order to minimize the number of charged particles entering the reaction zone.
III. RESULTS A number of checks were made to ensure that the re
sults reported here refer to the H + D2 reaction. Signals require the presence of both HI and D2; in the absence of the photolysis laser no signals corresponding to HD(v;;;.l) or D are observed from the probe laser. Moreover, the magnitude of these signals depends sensitively on the delay between the photolysis and probe pulses, as will be described below. We have also excluded the possibility that we are observing HD(v> 1) arising from excitation ofHD impurity in the D2 sample. This might be caused by electron or ion impact or by fast H atom energy transfer. The Dz sample is initially quite pure (nominally 99.9% D) but operationally we detect (by MPI) -0.5% HD contamination in the D2, probably due to wall exchange processes. On replacing the D2 by "pure" HD( > 98%), the HD(v;;;.l) signal increased by less than a factor of 2 indicating that HD excitation contributes < 1 % to the HD(v;;;.l) signal we observe in the H + D2 reaction. These findings show that the energy transferlH atom exchange cross section for the process
H + HD(v = O)_H + HD(v> 1)
must be of the same magnitude or smaller than the reaction cross section for H + D2-HD(v> 1) + D. Moreover, we find that the HD(v = 1,J) distribution from H + HD(v = 0) yields a distinctly different rotational distribution than that from H + D 2• Finally, we consider the possibility that HD(v> 1) might arise from the reaction of D atoms with HI. These D atoms could originate from either the H + D2 reac-
tion or from the photolysis of DI present in the HI sample. The former process requires a consecutive reaction scheme which might contribute to the HD(v> 1) signal at later times but can be ruled out at earlier times from the temporal evolution of the signal reported below. The latter process can also be excluded on the grounds that the HI sample only contains DI at natural abundance ( < 0.1 %), and that, as stated before, the HD(v> 1) signals depend on the presence of both HI and D2.
A. HO(v = 1) Rotational distribution
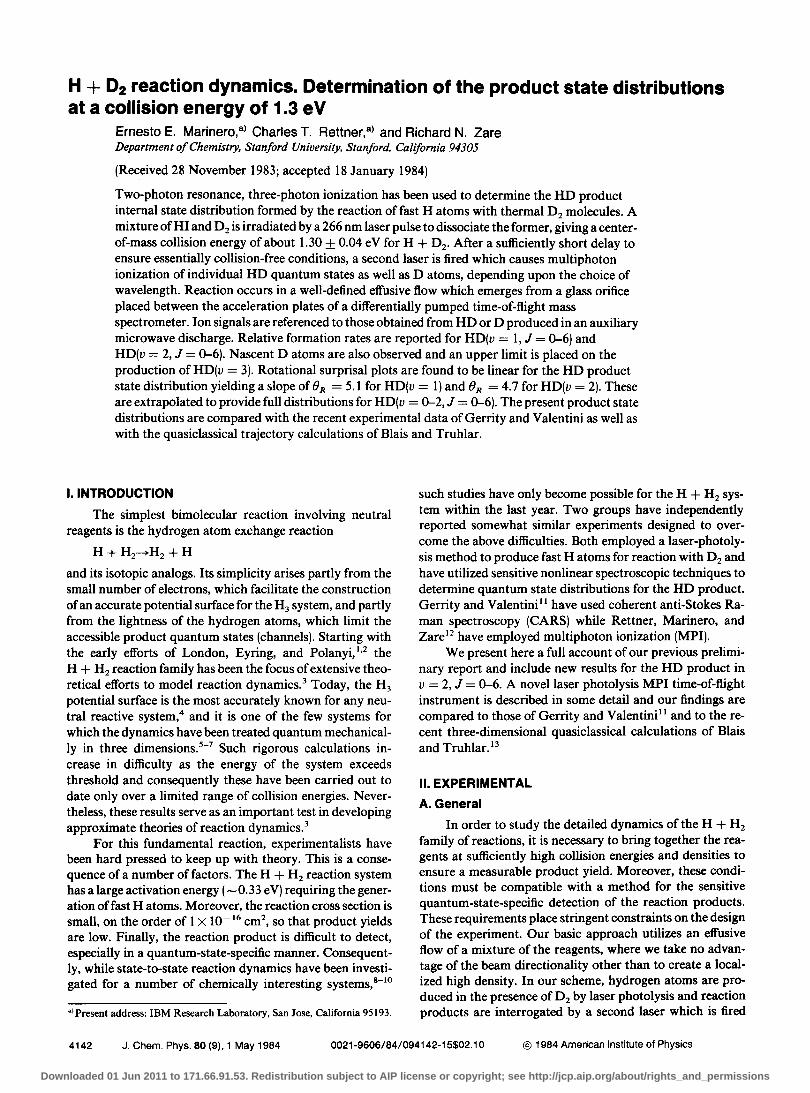
As mentioned above, the HD+ ion signals from the HD(v;;;'l) reaction products depend sensitively on the relative delay between the photolysis and probe lasers. When the probe laser precedes the photolysis laser, no signals are observed. Signals begin to appear when the two lasers are fired simultaneously and peak at a delay of -100 ns, as shown in Fig. 5 for the HD(v = 1, J = 2) product which is obtained at a D2 density _1015 molecules cm- 3
•
Under these conditions, for an H atom velocity of 1.8 X 10⁴ m S-I, one hard sphere collision (a = 4 X 10- 16
cm2) requires on average -1.4 "'S, while the reaction of H + D2 (a~1.0x 10- 16 cmZ
)3 requires -5.8 ",s. Further, since the photolysis volume has a radius of - 1 mm, a time of ~ 60 ns must pass before the fraction of fast H atoms escaping from this volume becomes appreciable. Consequently, we attribute the initial growth of the signal in Fig. 5 to collisions between fast H atoms and D2, while at a delay time greater or on the order of lOOns, this growth is arrested by the escape of the H atoms from the reaction volume.
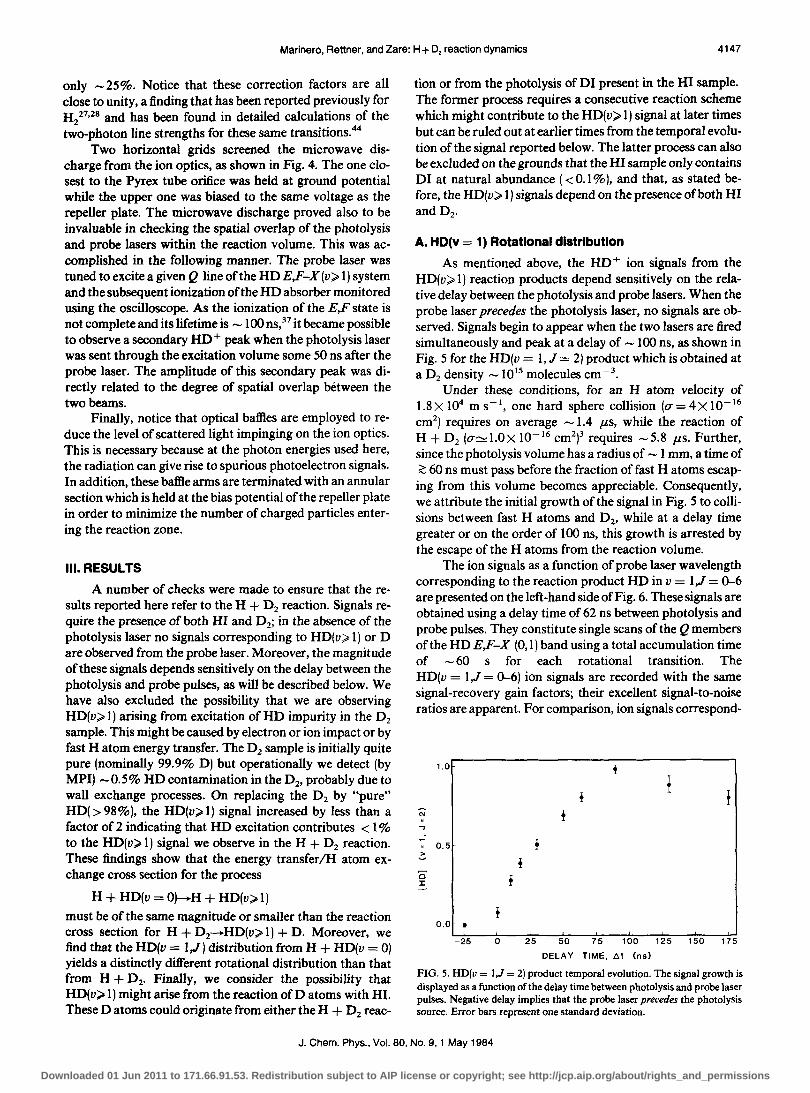
The ion signals as a function of probe laser wavelength corresponding to the reaction product HD in v = 1,J = ~6 are presented on the left-hand side of Fig. 6. These signals are obtained using a delay time of 62 ns between photolysis and probe pulses. They constitute single scans of the Q members of the HD E,F-X (0,1) band using a total accumulation time of - 60 s for each rotational transition. The HD(v = 1,J = ~6) ion signals are recorded with the same signal-recovery gain factors; their excellent signal-to-noise ratios are apparent. For comparison, ion signals correspond-
'" " ....,
'0 :r
1.0
0.0 •
-25 o
! t
25 50 75 100 125 150 175
DELA Y TIME, tot (ns)
FIG. 5. HD(v = I,J = 2) product temporal evolution. The signal growth is displayed as a function of the delay time between photolysis and probe laser pulses. Negative delay implies that the probe laser precedes the photolysis source. Error bars represent one standard deviation.
J. Chem. Phys., Vol. 80, No.9, 1 May 1984
Downloaded 01 Jun 2011 to 171.66.91.53. Redistribution subject to AIP license or copyright; see http://jcp.aip.org/about/rights_and_permissions
4148 Marinero, Rettner, and Zare: H+D, reaction dynamics
'"' '"l .,....
" > o :r: ~ o 0:: u..
W o ::> I::J Cl. ~ ~
+ o :r:
REACTION DISCHARGE
J=O~
J = 1
J=2
J=3
J=4
J=5
/\ A. X200 J=6 ~ '-- --vJ' ~
I I I I I
-10 ~O +10 -10 ~O +10
PROBE LASER WAVELENGTH (pm)
FIG. 6. MPI signals for the HD(v = I,J = 0-6) product of the H + D2 reaction and for HD(v = I) generated in the reference microwave discharge. These signals arise from the two-photon Q-branch excitation of the HD E,F '"I-g+ -x '"I-t (0,1) band. Thus the A.o values correspond to one half the transition frequencies listed in Table I, where I pm = 10-3 nm"",0.23 cm - '. Note the change in signal gain for the discharge data.
ing to HD in v = 1 generated in the microwave discharge are shown on the right-hand side of Fig. 6. It should be noted that the gain factor utilized to record HD(v = I,J = 6) from the discharge source is a factor of 200 times greater than that used for HD(v = I,J = 0). This is a consequence of the fact that under the conditions of our discharge environment the rotational energy difference of 1756 cm -I between these two levels leads to a population ratio of - 180: 1 for a rotational temperature of 325 K. Thus it is evident that the HD(v = 1) reaction product is rotationally hot.
In addition, even though the line profiles are dominated by the laser bandwidth, careful inspection shows that the line shapes of the HD(v = 1) reaction products are significantly broader (;;;. 20%), indicating that these species are also translationally hot. A simple Doppler analysis, assuming a Gaussian spread of HD laboratory velocities and taking account of the laser bandwidth yields an estimate of the nascent HD laboratory velocity component parallel to the probe beam direction. We obtain a mean velocity of - 3800 ± 600 m s - I, measured at a delay of - 60 ns. It is emphasized however, that the HD velocity profile may not be Gaussian and that this measurement is highly sensitive to velocity-chang-
....... .. ...... z
....... .. ...... z
....... .. ...... Z
HD(v = 1,J) Relative Population
(a) ~t =5 ns
(b) ~t=62 ns
(C) ~t =425 ns
o 2 3 4 5 6
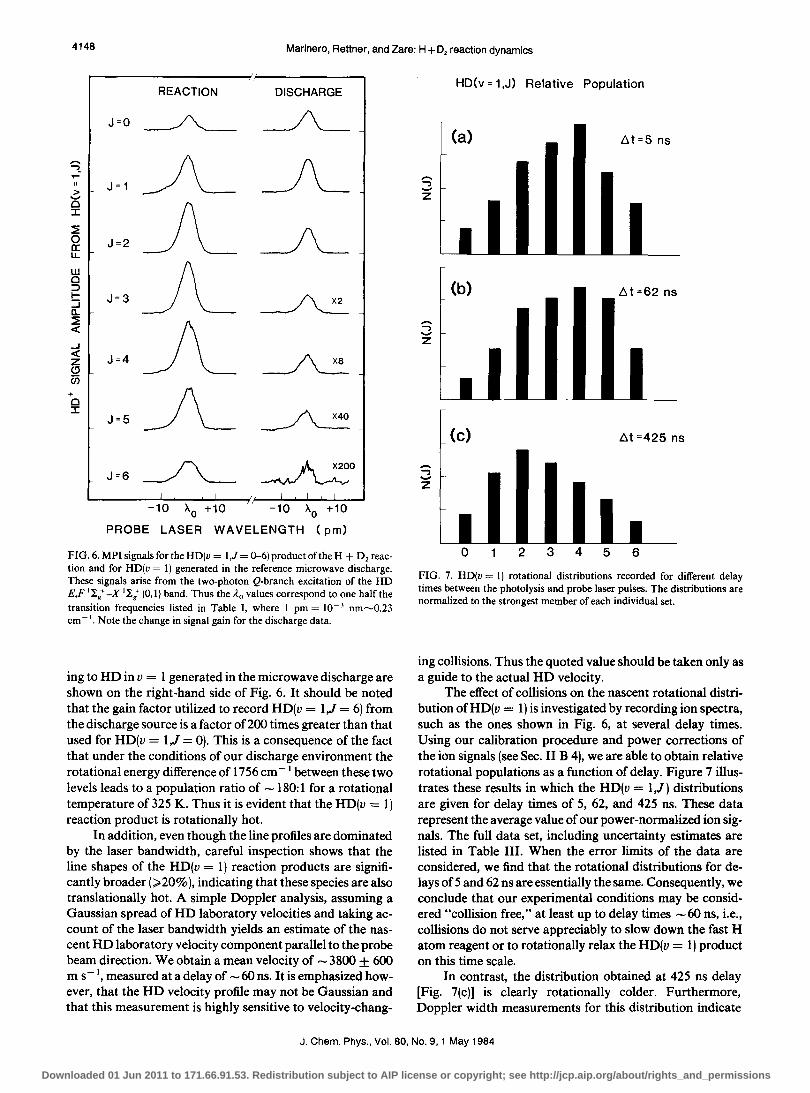
FIG. 7. HD(v = I) rotational distributions recorded for different delay times between the photolysis and probe laser pulses. The distributions are normalized to the strongest member of each individual set.
ing collisions. Thus the quoted value should be taken only as a guide to the actual HD velocity.
The effect of collisions on the nascent rotational distribution of HD(v = 1) is investigated by recording ion spectra, such as the ones shown in Fig. 6, at several delay times. Using our calibration procedure and power corrections of the ion signals (see Sec. II B 4), we are able to obtain relative rotational populations as a function of delay. Figure 7 illustrates these results in which the HD(v = 1,J) distributions are given for delay times of 5, 62, and 425 ns. These data represent the average value of our power-normalized ion signals. The full data set, including uncertainty estimates are listed in Table III. When the error limits of the data are considered, we find that the rotational distributions for delays of 5 and 62 ns are essentially the same. Consequently, we conclude that our experimental conditions may be considered "collision free," at least up to delay times -60 ns, i.e., collisions do not serve appreciably to slow down the fast H atom reagent or to rotationally relax the HD(v = 1) product on this time scale.
In contrast, the distribution obtained at 425 ns delay [Fig. 7(c)] is clearly rotationally colder. Furthermore, Doppler width measurements for this distribution indicate
J. Chern. Phys., Vol. 80, No.9, 1 May 1984
Downloaded 01 Jun 2011 to 171.66.91.53. Redistribution subject to AIP license or copyright; see http://jcp.aip.org/about/rights_and_permissions
Marinero, Rettner, and Zare: H+D, reaction dynamics 4149
TABLE III. Rotational distributions for HD(v = 1) (..:it = 5, 62, and 425 ns) and HD(v = 2) (..:it = 65 ns) normalized to HD(v = I, J = 4) at ..:it = 62 ns. The entries are power-normalized peak heights.
a The uncertainty ranges quoted represent the margins required to encompass all data points and include due allowance for calibration errors. These margins are considered to be approximately equal to one standard deviation.
bThese have been normalized to the HD(v = I),.<:it = 62 ns data using Eq. (I). The quoted error bars refer only to accuracy within the HD(v = 2) distribution. Relative to the HD(v = I) distribution there is an additional uncertainty of about ± 40%.
that the translational velocity at this delay time is also appreciably lower, approximating thermal values.
We have chosen throughout this work to utilize ion signal heights to derive rotational populations. We find that the peak heights increase linearly as the HD concentration is increased up to an HD pressure - 5 X 10⁻⁵ Torr. For larger HD concentrations, saturation and space-change effects destroy this linearity. We also note that the same linear response is observed for HD pressures up to - 5 X 10⁻⁵ Torr mixed with other reagent gases up to total pressures of - 100 mTorr. It is recognized that in principle the area of the ion signals should be employed for the extraction of relative populations, to allow for possible variation in the linewidths due to different degrees of Doppler broadening. However, because our line profiles are dominated by the laser bandwidth, the variation oflinewidth with rotational level is found to be considerably less than variation due to the noise present in the data.
B. HO(v = 2) rotational distribution
Signals for HD(v = 2) are smaller than for HD(v = I). Therefore all HD(v = 2) product measurements are carried out at delay times of - 60 ns since the signal at this delay is larger than at earlier times while they are still expected to be free of significant collisional relaxation effects. Figure 8 presents the counterpart of Fig. 6 for HD(v = 2). The signal-tonoise ratio is clearly less than for the HD(v = 1) reaction product. The detection of the higher J members is facilitated in this case compared to that for HD(v = 1) by the form of the probe-laser power curve. Once again the line profiles of the HD(v = 2) reaction products exceeds that of the discharge and are approximately the same as those for the HD(v = I) products.
Relative rotational populations are presented in Fig. 9 for HD(v = 2,J) and compared to those for HD(v = I,J) for the same time delay ( - 60 ns). Here each distribution is normalized to the most populated rotational level, and not to each other. Clearly the rotational distributions for the two
'"' <. C\I
" > '5 J:
~ o a: u. w o ::> I::::i a. ~ « -I « z C)
Ci5 + o J:
J=O
J = 1
J=2
J=3
J=4
J=5
/
REACTION DISCHARGE
~~
~JL AA ~A ~~ ~A
* -10 '>"0 +10 -10'>"0 +10
PROBE LASER WAVELENGTH (pm)
FIG. 8. MPI signals for the HD(v = 2,J = 0--6) product of the H + D2 reaction and for HD(v = 2) generated in the reference microwave discharge. These signals arise from the two-photon Q-branch excitation of the HD E,F I I./ -X I I./ (0,2) band. Thus the AD values correspond to one-half the transition frequencies listed in Table I, where 1 pm = 10- 3 nm=O.21 cm - I. Note the change in signal gain for the discharge data.
vibrational levels are markedly different, the HD(v = I,J) distribution peaking at J = 4, while the HD(v = 2,J) distribution peaks at J = 2.
In order to compare the populations of HD products formed in v = 1 and v = 2, we have measured the absolute ion signals for the Q(2) and Q(3) transition ofthe (0,1) and (0,2) bands of the E,F-X system. This was done employing essentially the same experimental conditions except for different probe laser powers. Since we do not have a suitable calibration reference for vibrational populations, the determination of the HD(v = 1):HD(v = 2) population ratio requires a knowledge of the signal power dependence as well as the relevant multiphoton line strengths. For anti-Stokes energies :$ 200 IlJ, the Q (2) and Q (3) lines were found to vary as r , where n = 2.4 ± 0.2, for the (0,1) band, and n = 2.2 ± 0.2 for the (0,2) band. The transition probabilities for two-photon resonant three-photon ionization are presently unknown for this system. However, an estimate can be made if we assume that the multi photon ionization process has the same probability as the two-photon transitions to the E,F state. Since ionization proceeds through v = ° of the E,F state in both cases, this assumption is equivalent to assuming
J. Chern. Phys., Vol. 80, No.9, 1 May 1984
Downloaded 01 Jun 2011 to 171.66.91.53. Redistribution subject to AIP license or copyright; see http://jcp.aip.org/about/rights_and_permissions
4150 Marinero, Rettner, and Zare: H+D, reaction dynamics
....... .., ..... Z
(a)
(b)
o 2 3 4 J
HD (v = 1, J)
HD (v =2, J)
5 6
FIG. 9. Rotational distribution of (a) HD(v = 1) and (b) HD(v = 2) obtained for a delay time of - 60 ns. The distributions are relative (see the text) and clearly show that the maximum of each distribution occurs at a different rotational level.
that the - 1700 cm - I difference in the energies of the final (ionizing) photons, is unimportant. This is supported somewhat by the fact that the two transitions exhibit similar power dependences. The order of these power dependences are expected to be between 2.0 (for saturation of the final absorption step) and 3.0, when this step is only weakly pumped. Thus the similar power dependences imply similar cross sections for the absorption of the third photon. However, this premise has not been tested in detail and therefore deductions based on it must be considered somewhat tentative.
Two-photon transition probabilities have been provided for us by HUO,44 who finds that the transition probabilities of the Q (2) and Q (3) lines of the (0,2) band are a factor of 1.28 ± 0.18 times stronger than for Q (2) and Q (3) of the (0,1) band. Thus we obtain from our data the population ratios
and
[HD(v = 1,J = 2)] = 2.9 + 1.1 [HD(v = 2,J = 2)] -
[HD(v = 1,J = 3)] = 4.2 ± 1.7, [HD(v = 2,J = 3)]
(la)
(lb)
where uncertainties reflect only the inaccuracies involved in
measurements and in the two-photon transition probabilities, no allowance being made for possible errors arising from varying absorption efficiencies for the third photon.
c. HD(v = O} rotational distribution
Although we have detected the HD(v = 0) product in J = 0 to 6, it was not possible to extract a rotational distribution in this case. Here the -0.5% HD impurity in the D2 sample produced a background signal, introducing a large uncertainty in the estimation of those rotational levels that are strongly populated at room temperature. Furthermore, it was found that the firing ofthe photolysis laser can slightly change (-10%) the overall detection efficiency, thereby somewhat compromising results obtained by a simple subtraction of the HD( v = O,J) signals, particularly for J = 0 to 3 which have relatively large thermal populations. In the absence of a background contribution from HD impurity, this interference is not apparent, but simply serves to slightly (and consistently) change the detection efficiency, which is always optimized by adjustment of voltages and the slit position prior to measurement. In effect, the photolysis laser slightly changes the optimum geometry for ion detection . We believe that this phenomenon in no way alters any of the reported distributions, for which there is no background HD interference. We note that this small change in detection efficiency responds with a time constant of several seconds and may arise from surface charge buildup, following the introduction of the intense UV photolysis source. Although measurements are possible for J > 6, these have not been carried out owing to the lack of a suitable reference source.
In the case of J = 4, 5, and 6, the residual background signal amounts to 39%, 21 %, and 8%, respectively, of the nascent signal amplitude. An absolute comparison of the signal levels of HD products in v = 0 and v = 1 was not attempted because of the aforementioned interference. However, a relative comparison of the power-normalized signals for J = 6 ofHD(v = 0) to that ofHD(v = 1) yields a ratio of -3.
For the normalized rotational distribution J = +-6 of HD(v = 0), we note that J = 6 is substantially more populated than in the case of v = 1 or 2. The ratio of the relative populations of J = 5 to J = 6 for HD(v = 0) is measured as 1.3 ± 0.3, compared to ratios of 1.8 ± 0.5 and 3.4 ± 1.3 for HD(v = 1) and HD(v = 2), respectively, for a time delay of ..1t-60 ns. This indicates that the shape of the rotational distribution for HD(v = 0) around J = 5,6 may fall off less rapidly than for the other vibrational levels studied. Finally, we believe that by reducing the HD impurity level and/or by eliminating or fully quantifying the interference effect, it will be possible to extract a distribution for HD(v = 0, J = 0-6).
D. HD(v= 3) A search was conducted in order to detect HD reaction
products in v = 3. As indicated in Table II, the detection scheme utilized for two-photon excitation, involves the second anti-Stokes of frequency doubled Fluorescein 548 with an energy of -450 f-LJ. This pump power increment can be expected to enhance the detection sensitivity of our system by a factor of 6-11 over that obtained for the detection of
J. Chern. Phys., Vol. 80, No.9, 1 May 1984
Downloaded 01 Jun 2011 to 171.66.91.53. Redistribution subject to AIP license or copyright; see http://jcp.aip.org/about/rights_and_permissions
Marinero, Rettner, and Zare: H+D. reaction dynamics 4151
HD(v = 2). Moreover, the two-photon transition probabilities for the (0,2) and (0,3) bands of the E,F-X system are calculated to be in the ratio of 1.4 ± 0.2.44
In spite of the enhanced sensitivity and comparable two-photon transition probabilities, the search revealed no evidence for product HD in v = 3 within our signal-to-noise limitations. In contrast, HD(v = 3) generated in the microwave discharge was readily detected. A measurement of the signal amplitudes for product HD in v = 2 under identical experimental conditions to those utilized in our search for HD(v = 3), permits us to set an upper bound on the reaction yield for HD in u = 3. We find
[HD(u = 2,J = 3)] ;;;.18 . (2) [HD(u = 3,J = 0)]
E. Deuterium atom reaction product
The D-atom product evolution from the H + D2 reaction is shown in Fig. 10. The D-atom signal amplitude is plotted vs the delay between the photolysis and probe lasers. When the probe laser precedes the photolysis laser, no D+ signals are observed. A measurable product signal is obtained at zero delay and subsequently grows to a maximum for a delay time of - 75 ns. Further increase of this delay results in reduction of the D-atom product signal amplitude. Based on the same considerations outlined in Sec. III A, we attribute the initial growth to collisions between fast H atoms and D2 which generate nascent D atoms. The decay portion of the signal evolution is due to the escape of both fast H atoms and the D-atom products from the photolysis volume.
Figure 11 presents the D-atom Doppler profile from the H + D2 reaction for a delay time of8 ns. This is compared in Fig. 11 with the corresponding profile for thermal D atoms generated in the microwave discharge. It is evident from this figure that the nascent D atoms possess a high degree of translational energy.
Using the thermal D-atom result to correct for laser bandwidth, we can obtain a rough estimate of the mean D atom laboratory velocity parallel to the probe laser direction. Assuming that the velocity distribution is Gaussian, we obtain a mean velocity of 8400 ± 800 m s - J. From similar
1.0
8 0.5
0.0 t
25 a 25
t
50 75 100 125 150 175
DELAY TIME. tot (ns)
FIG. 10. Deuterium atom product evolution from the H + D2 reaction as a function of the delay between the photolysis and probe laser pulses. Error bars represent one standard deviation.
-l c( Z (!l c;,; z Q + o
-8
REACTION 6t=8 ns
THERMAL DISCHARGE
-4
Zlo 82281.32 cm- 1
4 8
FIG. II. Deuterium atom line shapes. The upper trace corresponds to the nascent D atom product from H + D2; the lower trace is for thermal D atoms produced in the microwave discharge. The reaction product exhibits marked Dopper broadening.
measurements we find that after - 250 JlS, this distribution is somewhat colder, i.e., 2900 ± 300m S-I, but still somewhat hotter than for thermal (300 K) D atoms for which we obtain a mean velocity ~ 1900 ± 200 m s - 1.
F. Reaction cross section
An estimate for the reaction cross section oiu,J) into a given product state can be made using the relationship
d [HD(u,J)] =,..J J)V [H] [D ] dt V\U, rei 2 , (3)
where Vre1 is the reagent CM relative velocity. This requires a knowledge of (i) the absolute rate of HD product appearance, (ii) the initial density and velocity of the fast H atom reagent, and (iii) the density of the D2 reagent. Condition (i) may be satisfied by calibration, for example by comparing HD + ion signals from the reaction to those from a known density of HD present in the D2 sample. The velocity of H atom reagents is known here, and H-atom densities can be estimated from a knowledge of the initial HI density, the laser energy, the diameter of the photolysis beam, and the dissociation cross section.38 Thus condition (ii) can also be met. Finally, the density of D2 reagent can be obtained by calibration. Unfortunately careful measurements have not yet been made simultaneously on all of these quantities. Nevertheless, we are able to estimate all of these factors to better than an order of magnitude, which provides a crude estimate of the reaction cross section. We estimate the rate of appearance of HD(v = 0, J = 4) product by comparing the density of nascent HD in this state after 60 ns to the density present
J. Chern. Phys., Vol. 80, No.9, 1 May 1984
Downloaded 01 Jun 2011 to 171.66.91.53. Redistribution subject to AIP license or copyright; see http://jcp.aip.org/about/rights_and_permissions
4152 Marinero, Rettner, and Zare: H + D, reaction dynamics
from the HD impurity. This leads to a rate of appearance for HD(v = 0, J = 4) of -1 X 10¹⁸ molecules S-I. The D2 and HI densities are - 1 X 10¹⁵ and - 2 X 1014 cm - 3
, respectively, and there is approximately 10% dissociation, 60% of which is to produce the fast H atoms. 38-4 I This leads to [H]-1 X 1013 cm-3, while Vrel -1.8X 106 cm S-I. Thus we find that
u(v = 0, J = 4)~5 =~ X 10- 17 cm2, (4)
where the error margins represent roughly one standard deviation. Recalling that there is a -2:1 ratio of 1.3-0.55 eV relative collision energies and using Blais and Truhlar's estimate13 that the former contributes about twice the latter to the formation ofHD(v = O,J = 4), the corrected 1.3 eV partial cross section is approximately 75% of that shown in Eq. (4). To obtain a total reaction cross section requires a knowledge of the partitioning into the HD(v = O,J = 4) product channel. Blais and Truhlar13 calculate that - 5 % of the HD reaction product is produced in this state for 1.3 eV collisions. Using this value yields an estimate of
UTOTAL = L u(v,J) = 7.5 =~.5X 10- 16 cm2 (5) v.J
for the reaction ofH + D2 at a collision energy of -1.3 eV. This estimate comes surprisingly close to encompassing the total cross section obtained by Blais and Truhlar,13 1.13 ± 0.02 X 10- 16 cm2
• We do not consider the difference to be statistically significant.
IV. DISCUSSION
A. Energetics
The photolysis of HI at 266 nm proceeds through two channels, leading to H + W P3/2) and H + W Pl/2 )' which result in H atom velocities of 17 660 and 11 460 m s - I in the ratio of - 2: 1,38-41 corresponding to center-of-mass collision energies with D2 of 1.30 ± 0.04 and 0.55 ± 0.03 eV, respectively (see the Appendix). However, the cross section for production of HD(v~ 1) is expected to be much smaller at the lower collision energy.l3AS Indeed, in a quasiclassical trajectory study, Blais and Truhlarl3 found that for this combination of reagents, the contribution from the -0.55 eV collisions to HD(v = 0,J~5) is at most 18%, and usually much less. Thus we conclude that the results presented pertain almost exclusively to a collision energy of 1.30 eV. Since we are dealing with a nearly thermoneutral system (11H = + 0.04 eV), the reaction dynamics serve only to channel the collision energy into the different degrees offreedom of the product. Thus control of the collision energy is of fundamental importance here; any uncertainty in the collision energy is qualitatively equivalent to an uncertainty in the product-state distribution. This emphasizes the value of the pump-and-probe technique employed, since other (e.g., beam) techniques might produce wide distributions of collision energies, obscuring comparison with theoretical predictions.
Simultaneous conservation of energy and of linear momentum requires that for an initial H atom velocity of 17 660 m s-I, HD(v = I,J = 0) and HD(v = 2,J = 0) products must have laboratory velocities in the ranges - 1000 to
8100 and 300 to 6700 m s-I, respectively, where the lower velocity limit corresponds to backward scattering in the center-of-mass frame and the upper limit to forward scattering. Here the negative sign in front of the HD(v = l,J = 0) backscattering velocity indicates that the HD is backscattered in the laboratory with respect to the direction of the H atom reagent velocity. Note that for higher J levels, slightly lower velocities should result; HD(v = 1, J = 9) e.g., would have similar velocities to the nearly isoenergetic HD(v = 2, J = 0) state.
The D atom product will take laboratory velocities in the range 12100 to - 5100 m S-I, for backward and forward eM scattering, when the corresponding product is HD(v = O,J = 0). For HD(v = 1,J = 0) and HD(v = 2,J = 0) this range becomes 10400 to - 3400 and 8300 to - 1300 m s -I, respectively. Again, negative values correspond to laboratory backscattering. Since both theoryl3 and experiment I I indicate that HD(v = 0) is the dominant product, the effective range of D atom velocities may weIl be closest to the first of these, i.e., -12 100 to - 5100 ms- I
.
This overall picture is also supported by Figs. 5 and 10. In Fig. 5 it is seen that the falloff in the HD(v = I,J = 2) signal only becomes appreciable for times ~ lOOns, while in Fig. 10 it is apparent that the D atoms fly out more rapidly, as a consequence of their higher velocities.
In principle, careful analyses of Doppler profiles could provide insight into the angular distribution of scattered products. We estimated nascent D and HD(v = 1) velocities of -8400 and 3800 m S-I, respectively. These appear closest to the "backscattering" limits, as might be expected for a
. . f I 10- 16 2 3 13 reactIOn cross sectIOn 0 on y - cm . .
B. HD product state distributions
With velocities of S 8000 m s -I, the HD(v~ 1) product molecules will move less than 0.5 mm in 60 ns, or no more than a quarter of the diameter of the photolysis volume. Thus when we probe at such a delay, we are essentially detecting the density corresponding to the time-integrated flux of reaction products into each product quantum state. Notice that provided the probe laser is approximately centered and is fully contained within the photolysis volume, its actual diameter does not affect this argument. Hence, we conclude that the measured product quantum-state distributions correspond directly to the relative rates 0/ reaction into these states. At longer times, where significant "fly-out" can occur, it would be necessary to correct the observed distribution to allow for the differing product-state velocities.
1. Comparison with quasiclassical calculations
Figure 12 shows the HD(v = 1 and v = 2) rotational state distributions for..1t = -60 ns given in Table III. Here the HD(v = 2) data has been normalized with respect to that for HD(v = 1) using the average of the measured ratios for theJ = 2 andJ = 3 populations [see Eq. (1)]. In keeping with the uncertainties involved in these determinations, the absolute position of the HD(v = 2) points relative to HD(v = 1) is
J. Chern. Phys., Vol. 80, No.9, 1 May 1984
Downloaded 01 Jun 2011 to 171.66.91.53. Redistribution subject to AIP license or copyright; see http://jcp.aip.org/about/rights_and_permissions
Marinero, Rettner, and Zare: H+D, reaction dynamics 4153
1.0
..... .., :i, Z
A..._---tl __ -u
, I
I
----&-----6
I I
I
/.q ~- \
~ \ --_0'" \ \ \ \ \ \ \
b
v=2
o 1 234 5 6 HD Rotational Quantum Number, J
FIG. 12. HD(v = 1 and v = 2) rotational distributions. The solid line and symbols refer to this work while the dashed line and open symbols show the results of the quasic1assical trajectory studies of Blais and Truhlar (Ref. 13).
only considered accurate to within about ± 40%, whereas within a given vibrational state, uncertainties of .;;; ± 15% apply for each point, except for the J = 6 data which, due to larger calibration errors, are considered accurate to ± 30% (see Table III).
Also shown in Fig. 12 are the results of the three-dimensional quasiclassical trajectory studies of Blais and Truhlar.13 These relative reaction rates have estimated errors in the range ± 15%-40%, being most accurate for the higher rates. Allowing for the uncertainties associated with the two distributions, the overall agreement between theory and experiment is striking. In particular, both sets of data peak at J = 4 for HD(v = 1) and indicate that HD(v = 1, J = 0) is formed at a slower rate than HD(v = 2, J = 2). However, it is also clear that the experimental results differ from the theoretical calculations at high J, indicating a lower degree of rotational excitation than predicted.
We believe that this discrepancy lies outside of the combined uncertainties. The origin of this disagreement is presently unknown but may reflect either the inaccuracy in the potential energy surface, the breakdown of a quasiclassical treatment of the dynamics, or the presence of an undetected systematic error in this work. While the H3 potential surface has been determined to "chemical accuracy," i.e., the calculated points are thought to lie within 0.1 kcallmol of the Bom-Oppenheimer limit, the overall surface may not be so accurate because (1) calculations were carried out only for a limited range of nuclear configurations and (2) the number of points above 1 eV are few. We also do not understand the differences between quantum and quasiclassical dynamics at these collision energies. Finally, we are aware that our experimental procedure may contain hidden systematic errors that we have not yet uncovered.
2.Su~risalanalysis
A number of theoretical studies on the reaction of H with H2 have found that the H2 product rotational distributions yield linear surprisals,5,46-51 or, more loosely speaking, appear "temperature-like." These include two independent 3 D quantum calculations.5,46,47 Although this work strictly applies to the H2(v = 0) product of the H + H2 reaction, these results suggested that a similar surprisal analysis might prove useful for our data. This is particularly so since Wyatt46 obtained a linear surprisal for a total energy as high as 0.8 eV, while Schatz and Kuppermann5 found linear surprisals for a number of different energies up to 0.7 e V.
The surprisal I for a given product quantum state is defined as52
J(v,J) = -In[p(v,J)/pO(v,J;Ell, (6)
where P (v,J) is the observed probability of accessing the (v,J) level and pO(v,J;E) is the prior or statistically most likely probability for a total energy E. It can be shown that for the single constraint of conservation of energy,
pO(v,J;E) cx(21 + I)(Ptrans)
(7) where Ev and EJ are the vibrational and rotational energies of the product. This is calculated for each v,J product level, taking E as 1.51 eV. Here E includes the D2 reagent zeropoint vibrational energy53 (0.19 eV) and the average rotational energy (0.025 eV), taken for a Boltzmann distribution at 300 K. The HD(v,J) energy levels are obtained from Dabrowski and Herzberg54 and include the HD zero-point vibrational energy (0.23 eV).
Figure 13 shows the resulting surprisals plotted against the fraction of energy appearing as rotation, gR = EJ/(E - Ev ), for HD(v = 1), Fig. 13(a), and HD(v = 2), Fig. 13(b). It is apparent that both give reasona-
4.0 (a) v=1
3.0 ~
'" c:
'" ~ 2.0 8R = 5.1 ,.... + .., 1.0 C\I
..:::: ..... .., ;; 4.0 ....
(b) z v=2 L-I
c: 3.0 T II
II: Cl 2.0 .... -
1.0 8R = 4.7
0.0 0.2 0.4 0.6 9R
FIG. 13. Rotational surprisal plots for (a) HD(v = 1) and (b) HD(v = 2).
J. Chem. Phys., Vol. 80, No.9, 1 May 1984
Downloaded 01 Jun 2011 to 171.66.91.53. Redistribution subject to AIP license or copyright; see http://jcp.aip.org/about/rights_and_permissions
4154 Marinero, Rettner, and Zare: H + D2 reaction dynamics
1.0 (a)
•
0.5
(b) 1.0
0.5
•
• ---.. , ,
II I, I ,
I , , , , . , \ , , '--
'" . \ \ \ \ . \
-, , , \ \
\ \ , , . , , , , ,
v =1
v=2
0.0 ~0~~~2--~~4--~-6L-~~--~~10--~-1L2~--1~4~
J
FIG. 14. HO product rotational distributions for (a) v = I and (b) v = 2. The solid curve shows the result ofinverting the surprisal procedure using in (a) OR = 5.09 for HO(v = 1) and in (b) OR = 4.67 for HO(v = 2). The dashed curve corresponds to the results of Blais and Truhlar (Ref. 13) while the solid circles indicate the data of Gerrity and Valentini (Ref. 11). Our data points are shown as solid squares.
ble straight lines, with least-squares correlation coefficients ofO.969(v = 1) and 0.982(v = 2). This is in keeping with the previous theoretical findings. Moreover, the slopes of the two plots are found to be remarkably similar, dlldgR = OR = 5.09 for v = 1 and 4.67 for u = 2. We note that simple Boltzmann plots ofln[P(v,J)I(2.l + l)]vsEJ also give reasonable straight lines, corresponding to "temperatures" of 1620 K for HO(u = 1) and 810 K for HO(v = 2).
The real value of any surprisal analysis is that it permits energy distributions to be expressed with a minimum of parametersS2 and allows tentative extrapolation of data to include quantum levels not observed. The solid line in Fig. 14(a) displays the idealized quantum state distributions obtained for HO(u = 1) by inverting the surprisal procedure, assuming linear surprisals with the above-mentioned slopes. Similarly Fig. 14(b) shows the corresponding result for HO(v = 2). In both cases, the actual experimental points are shown as well as the trajectory results of Blais and Truhlar, 13
which have been normalized such that ~JP (u,J) is the same as for our surprisal data. In addition, Fig. 14(a) also displays the experimental results of Gerrity and Valentini II for HO(u= I).
1.0
0.5
1 , , , , , ,;
" 0.0
o 2
I
.... ' I
I 1
"
4
I I
/"
, ,
6
1\ , \ 1 \ -' , -- \
8 J
... ... ''\ ,
\
10
\ , \ \
v=Q
\ \ \
\ \
\ \
12
\ \ ,
14
FIG. 15. HO(v = 0) rotational distribution for the reaction ofH + O 2• The solid curve represents an idealized distribution corresponding to a linear surprisal plot with a slope of OR = 4.9 (see the text). The dashed curve indicates the results of Blais and Truhlar (Ref. 13).
These idealized distributions can be used to obtain an estimate of the relative vibrational state popUlations of HO(u = 1) and HO(u = 2). Using the measured ratios of HO(u = I, J = 2 and 3) to HO(u = 2, J = 2 and 3) [see Eq. (1)] to provide for normalization, we obtain
IP(u= I,J)
J = 5.0 ± 2.0. (8)
IP(v=2,J) J
For completeness, Fig. 15 displays an idealized rotational distribution for HO(v = 0) obtained by using OR = 4.9, i.e., the average of that found for v = 1 and u = 2. Obviously, such an extrapolation cannot be made on rigorous grounds, but it is hoped that this distribution may serve as a guide to that expected for the HO(u = 0) product formed only by collisions at -1.30 eV. In comparing this distribution with those obtained by Blais and Truhlar l3 and Gerrity and Valentini, II it must be borne in mind that their distributions have a contribution from the -0.55 eV collisions.
Why this fundamental reaction should lead to linear rotational surprisals is by no means obvious. Indeed, as remarked by Wyatt, " ... a linear rotational surprisal is certainly not demanded in general by quantum mechanics. The results are the final step in a long road from Coulomb's law, via the Schrodinger equation ... " 46 Schatz and Kupperman48 have suggested that these temperature-like distributions may be a consequence of the restricted bending motion of the transition state, where a Gaussian wave packet, arising from the zero-point motion in the bend, becomes projected onto the free-rotor states of the diatomic product. However, while presenting a nice qualitative picture of the dynamics, this model does not quantitatively survive the transition from two to three dimensions.5 Pollak51 has suggested that linear rotational surprisals for the H + H2 system arise as a consequence of a transform of momentum constraint, while Levine52 has stated that linear rotational surprisals are expected when the amount of impulsive rotational energy release is
J. Chem. Phys., Vol. 80, No.9, 1 May 1984
Downloaded 01 Jun 2011 to 171.66.91.53. Redistribution subject to AIP license or copyright; see http://jcp.aip.org/about/rights_and_permissions
Marinero, Rettner, and Zare: H + D, reaction dynamics 4155
small. Along the same lines, Schatz and Ross50 have shown that linear rotational surprisals can result from a generalized Franck-Condon model of the reaction dynamics. In this latter work it is demonstrated that linear surprisals arise when the potential surface dominates any kinematic coupling. However, linearity is not predicted at high rotational excitation. Indeed, since our data are restricted to J < 6, we do not know if the linearity will extend to the maximum J 's populated.
Of course, linear surprisals are by no means confined to the H + H2 family of reactions and are more the rule than the exception in dynamical studies.52 That is not to say that this behavior can be rationalized. We believe that measurements for the H + D2 system may be able to shed light on this phenomenon. A comprehensive study would require extention to other collision energies and include HD(v = 0) and J> 6. In the absence of suitable experimental results, it would also be interesting to apply a surprisal analysis to quasiclassical trajectory results, for example. In particular, one may seek to learn at which point the kinematic coupling begins to dominate the H-D-D potential in controlling the product state distribution and what factors determine the slope.
C. Concluding remarks
A laser-based experimental procedure has been demonstrated for studying the detailed dynamics of the H + D2~HD + D reaction. Here the collision energy has been controlled using photolysis of HI, and both reaction products have been characterized using multiphoton ionization. The results obtained should provide a stringent test of detailed theories, even though the data have been limited to a single isotopic combination of reagents and to a single collision energy. The present study, together with the complementary work of Gerrity and Valentini, II should be regarded as only a first step on this road. We anticipate that the journey may be long but it will lead ultimately to a full understanding of the state-to-state dynamics of the H + H2 family, the simplest of all bimolecular reactions.
Note added in proof R. Gotting, H. R. Mayne, and J. P. Toennies, J. Chem. Phys. (in press) have recently obtained angular and velocity distributions of HD formed in the crossed molecular beam reaction D + H2 for an effective CM collision energy of -1.0 eV. They also find a strong preference for product translational energy and report that the angular distribution changes from predominantly backward scattering at low energies to one that is essentially constant with angle for CM collision energies of -2.0 eV. We thank J. P. Toennies for communicating these results to us prior to publication.
ACKNOWLEDGMENTS
We thank the Shell Companies Foundation, Inc., the U.S. Office of Naval Research under NOOOI4-C-78-0403, the U.S. Air Force Office of Scientific Research under AFOSR F49620-83-C-0033, and the U.S. National Science Foundation under NSF CHE 80-06524 and NSF CHE 81-08823. We are also grateful for the loan of equipment from the San Francisco Laser Center, operated under NSF CHE
79-162S0. We are also indebted to W. M. Huoforproviding the relative two-photon transition probabilities for HD, and to R. S. Blake for experimental assistance.
APPENDIX: CENTER-Of-MASS COLLISION ENERGY
On photodissociation of stationary HI(v = 0..1 = 0) we have
hv = Dg(HI) + Etrans + Ee(1) , (AI)
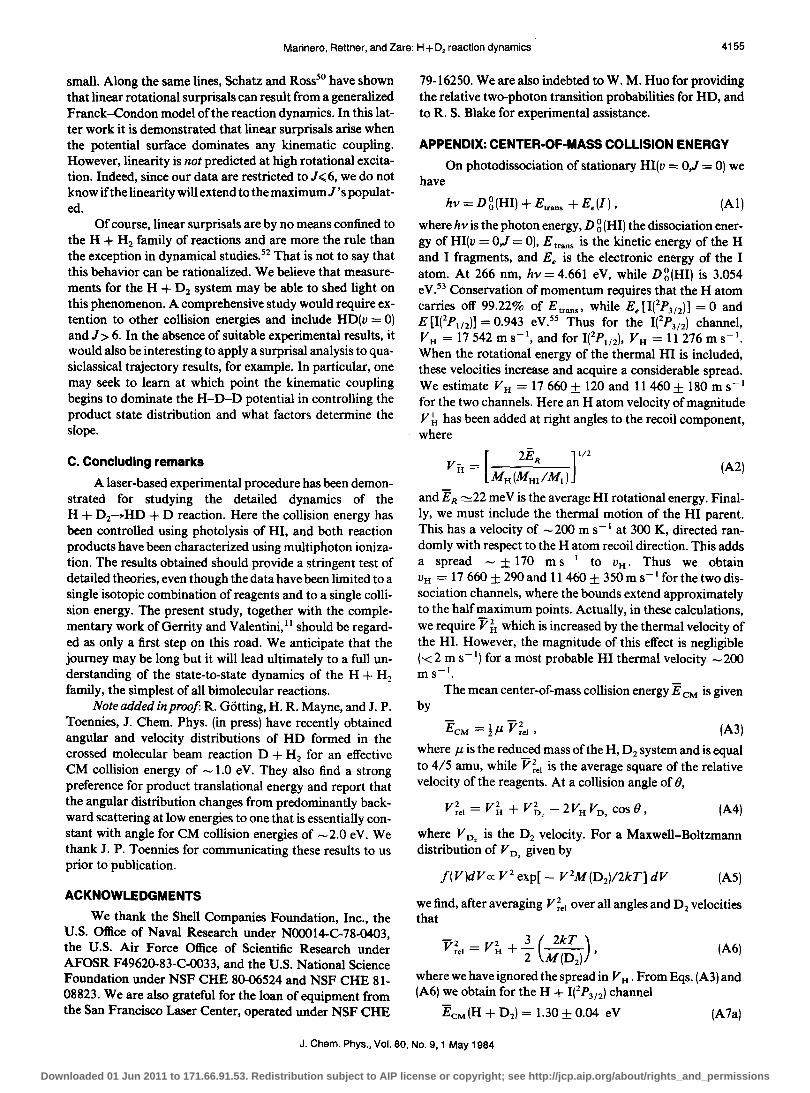
where hv is the photon energy, D g (HI) the dissociation energy of HI(v = 0..1 = 0), E trans is the kinetic energy of the H and I fragments, and Ee is the electronic energy of the I atom. At 266 nm, hv = 4.661 eV, while Dg(HI) is 3.0S4 eV.53 Conservation of momentum requires that the H atom carries off 99.22% of E trans' while Ee [WPm)] = 0 and E[WPI12)] = 0.943 eV.55 Thus for the WPm) channel, V H = 17 S42 m S-I, and for WPlnl, V H = 11 276 m S-I.
When the rotational energy of the thermal HI is included, these velocities increase and acquire a considerable spread. We estimate V H = 17660 ± 120 and 11460 ± 180 m S-I
for the two channels. Here an H atom velocity of magnitude V ~ has been added at right angles to the recoil component, where
(A2)
and E R ~22 me V is the average HI rotational energy. Finally, we must include the thermal motion of the HI parent. This has a velocity of - 200 m s - I at 300 K, directed randomly with respect to the H atom recoil direction. This adds a spread - ± 170 m s - I to vH • Thus we obtain VH = 17660 ± 290 and 11460 ± 350m S-I for the two dissociation channels, where the bounds extend approximately to the half maximum points. Actually, in these calculations, we require V~ which is increased by the thermal velocity of the HI. However, the magnitude of this effect is negligible (.< 2 m s - I) for a most probable HI thermal velocity - 200 ms- I .
The mean center-of-mass collision energy E CM is given by
ECM =!Jl V;eI , (A3)
where Jl is the reduced mass of the H, D2 system and is equal to 4/S amu, while V;el is the average square of the relative velocity of the reagents. At a collision angle of e,
(A4)
where V D2 is the D2 velocity. For a Maxwell-Boltzmann distribution of V D2 given by
I( V)dV a: V 2 exp[ - V 2M (D2 )/2kT] dV (AS)
we find, after averaging V;el over all angles and D2 velocities that
V 2 - V2 + 3 ( 2kT ) (A6) reI - H 2 M (D
2) ,
where we have ignored the spread in V H • From Eqs. (A3) and (A6) we obtain for the H + WP3/2) channel
ECM(H + D2) = 1.30 ± 0.04 eV (A7a)
J. Chern. Phys., Vol. 80, No.9, 1 May 1984
Downloaded 01 Jun 2011 to 171.66.91.53. Redistribution subject to AIP license or copyright; see http://jcp.aip.org/about/rights_and_permissions
4156 Marinero, Rettner, and Zare: H + D, reaction dynamics
and for the H + W PI d channel
ECM(H + D z) = 0.55 ± 0.03 eV.
IF. London, Z. Elektrochem. 35, 552 (1929).
(A7b)
2H. Eyring and M. Polanyi, Z. Phys. Chern. Abt. B 12, 279 (1931). See also H. Pelzer and E. P. Wigner, ibid. 15,445 (1932).
3For reviews see D. G. Truhlar and R. E. Wyatt, Annu. Rev. Phys. Chern. 27, 1 (1976); M. Baer, Adv. Chern. Phys. 49, 191 (1982).
4p. Siegbahn and B. Liu, J. Chern. Phys. 68, 2457 (1978); D. G. Truhlar and C. J. Horowitz, ibid. 68, 2466 (1978); 71,1514 (1979).
'G. C. Schatz and A. Kuppermann, J. Chern. Phys. 62, 2502 (1975); 65, 4642,4668 (1976).
6A. B. Elkowitz and R. E. Wyatt, J. Chern. Phys. 62, 2504 (1975); 63, 702 (1975).
7R. B. Walker, E. B. Stechel, and J. C. Light, J. Chern. Phys. 69, 2922 (1978).
"State-to-State Chemistry, edited by P. R. Brooks and E. F. Hayes, ACS Symp. Ser. No. 56 (American Chemical Society, Washington, D.e. 1977).
9J. C. Whitehead, Compo Chern. Kinet. 24, 357 (1982). 10M. R. Levy, Prog. React. Kinet. 10, 1 (1979). liD. P. Gerrity and J. J. Valentini, J. Chern. Phys. 79,5202 (1983). 12C. T. Rettner, E. E. Marinero, and R. N. Zare, in Physics of Electronic and
Atomic Collisions, edited by J. Eichler, I. V. Hertel, and N. Stolterfoht (North-Holland, Amsterdam, 1984), p. 51.
I3N. C. Blais and D. G. Truhlar, Chern. Phys. Lett. 102,120 (1983). 14R. G. W. Norrish and G. Porter, Nature 164, 685 (1950); G. Porter, Proc.
R. Soc. London Ser. A 200,284 (1950); R. J. Donovan and H. M. Gillespie, in A Specialist Periodical Report: Reaction Kinetics, edited by P. R. Ashmore (Chemical Society, London, 1975), Vol. I, Chap. 1, pp. 14-92.
I5A. e. Luntz, R. Schinke, W. A. Lester, Jr., and Hs. H. Giinthard, J. Chern. Phys. 70, 5908 (1979).
16G. K. Smith and J. E. Butler, J. Chern. Phys. 73, 2243 (1980). I7W. H. Breckenridge and H. Umemoto, J. Chern. Phys. 75,4153 (1981). 18J. F. Cordova, C. T. Rettner, and J. L. Kinsey, J. Chern. Phys. 75, 2742
(1981). 19R. R. WiJliams, Jr. and R. A. Ogg, Jr., J. Chern. Phys. 15,691 (1947). 2°H. A. Schwarz, R. R. WilJiams, Jr., and W. H. Hamill, J. Am. Chern. Soc.
74,6007 (1952); R. J. Carter, W. H. Hamill, and R. R. WiJliams, Jr., ibid. 77,6457 (1955).
21R. M. Martin and J. E. Willard, J. Chern. Phys. 40, 3007 (1964). 22A. KuppermanandJ. M. White, J. Chern. Phys. 44, 4352 (1966); A. Kup
permann, Isr. J. Chern. 7, 303 (1969). See also L. A. Melton and R. G. Gordon, J. Chern. Phys. 51, 5449 (1969).
23C. R. Quick, Jr., R. E. Weston, Jr., and G. W. Flynn, Chern. Phys. Lett. 83, 15 (1981).
24F. Magnotta, D. J. Nesbitt, and S. R. Leone, Chern. Phys. Lett. 83, 21 (1981); C. A. Wight and S. R. Leone, J. Chern. Phys. 78, 4875 (1983).
2'e. F. Wood, G. W. Flynn, and R. E. Weston, Jr., J. Chern. Phys. 77, 4776 (1982).
26C. R. Quick, Jr., and D. S. Moore, J. Chern. Phys. 79, 759 (1983).
27E. E. Marinero, C. T. Rettner, and R. N. Zare, Phys. Rev. Lett. 48, 1323 (1982).
28E. E. Marinero, R. Vasudev, and R. N. Zare, J. Chern. Phys. 78, 692 (1983).
29J. W. Nib1er, J. R. McDonald, and A. B. Harvey, Opt. Commun. 18, 371 (1976).
30M. Pealat, J.-P. E. Taran, J. Taillet, M. Bacal, and A. M. Bruneteau, J. Appl. Phys. 52, 2687 (1981).
31M. Pealat, D. Debarre, J.-M. Marie, J.-P. E. Taran, A. Tramer, and e. B. Moore, Chern. Phys. Lett. 98, 299 (1983).
32E. E. Marinero, C. T. Rettner, R. N. Zare, and A. H. Kung, Chern. Phys. Lett. 95, 486 (1983); e. T. Rettner, E. E. Marinero, R. N. Zare, and A. H. Kung, J. Phys. Chern. (in press).
33F. J. Northrup, J. C. Polanyi, S. C. Wallace, and J. M. WiJliamson, Chern. Phys. Lett. 105, 34 (1984).
34L. Asbrink, Chern. Phys. Lett. 7, 549 (1970). 35A. Niehaus and M. W. Ruf, Chern. Phys. Lett. 11, 55 (1971). 36J. E. Pollard, D. J. Trevor, J. E. Reutt, Y. T. Lee, and D. A. Shirley, Chern.
Phys. Lett. 88, 434(1982); J. Chern. Phys. 77, 34 (1982); J. E. Pollard, D. J. Trevor, Y. T. Lee, and D. A. Shirley, ibid. 77, 4818 (1982).
37D. J. Kligler and C. K. Rhodes, Phys. Rev. Lett. 40, 309 (1978); D. J. Kligler, J. Bokor, and C. K. Rhodes, Phys. Rev. A 21,607 (1980).
38J. Romand, Ann. Phys. 4, 527 (1949). 39R. Schmiedl, H. Dugan, W. Meier, and K. H. Welge, Z. Phys. A 304, 137
(1982). 40G. N. A. van Veen, K. A. Mohamed, T. BaJler, and A. E. de Vries, Chern.
Phys.80, 113 (1983). 41R. D. Clear, S. J. Riley, and K. R. Wilson,J. Chern. Phys. 63,1340(1974). 42G. C. Bjorklund, e. P. Ausschnitt, R. R. Freeman, and R. H. Storz, Appl.
Phys. Lett. 33, 54 (1978). 43 A. Sepehrad, R. M. Marshall, and H. PurneJl, Int. J. Chern. Kinet. 11, 411
(1979). 44W. M. Huo (private communication). 4'G.-D. Barg, H. R. Mayne, and J. P. Toennies, J. Chern. Phys. 74, 1017
(1981). 46R. E. Wyatt, Chern. Phys. Lett. 34, 167 (1975). 47M. J. Redmon and R. E. Wyatt, Int. J. Quantum Chern. Symp. 9, 403
(1975). 4"G. C. Schatz and A. Kuppermann, J. Chern. Phys. 65,4624 (1976). 49R. B. Bernstein, Int. J. Quantum Chern. Symp. 10,267 (1976). 50G. e. Schatz and J. Ross, J. Chern. Phys. 66, 2943 (1977). "E. PoJlak, Chern. Phys. Lett. 47,513 (1977). 52R. D. Levine, B. R. Johnson, and R. B. Bernstein, Chern. Phys. Lett. 19, I
(1973). For reviews of the information-theoretic approach to data analysis see: R. D. Levine, Annu. Rev. Phys. Chern. 29, 59 (1978); R. B. Bernstein and R. D. Levine, Adv. At. Mol. Phys.11, 215 (1975); R. D. Levine and J. L. Kinsey, in Atom-Molecule Collision Theory, A Guide for the Experimentalist, edited by R. B. Bernstein (Plenum, New York, 1979), p. 693.
53K. P. Huber and G. Herzberg, Molecular Spectra and Molecular Structure IV. Constants of Diatomic Molecules (Van Nostrand Reinhold, New York, 1979).
54I. Dabrowski and G. Herzberg, Can. J. Phys. 54, 525 (1976). sse. E. Moore, Natl. Bur. Stand. (U.S.) Circ. 467 (1958) Vol. 3.
J. Chern. Phys., Vol. 80, No.9, 1 May 1984
Downloaded 01 Jun 2011 to 171.66.91.53. Redistribution subject to AIP license or copyright; see http://jcp.aip.org/about/rights_and_permissions