Hα emission in the presence of dust in an Ar-C 2 H 2 radio-frequency discharge This article has been downloaded from IOPscience. Please scroll down to see the full text article. 2003 New J. Phys. 5 39 (http://iopscience.iop.org/1367-2630/5/1/339) Download details: IP Address: 161.45.205.103 The article was downloaded on 27/08/2013 at 22:56 Please note that terms and conditions apply. View the table of contents for this issue, or go to the journal homepage for more Home Search Collections Journals About Contact us My IOPscience
Transcript
Hα emission in the presence of dust in an Ar-C2H2 radio-frequency discharge
This article has been downloaded from IOPscience. Please scroll down to see the full text article.
2003 New J. Phys. 5 39
(http://iopscience.iop.org/1367-2630/5/1/339)
Download details:
IP Address: 161.45.205.103
The article was downloaded on 27/08/2013 at 22:56
Please note that terms and conditions apply.
View the table of contents for this issue, or go to the journal homepage for more
Home Search Collections Journals About Contact us My IOPscience
I Stefanovic1,2, E Kovacevic1, J Berndt1 and J Winter1
1 Institute for Experimental Physics II, Ruhr-University, 44780 Bochum,Germany2 Institute of Physics, PO Box 57, 11001 Belgrade, YugoslaviaE-mail: [email protected]
New Journal of Physics 5 (2003) 39.1–39.12 (http://www.njp.org/)Received 5 February 2003Published 29 April 2003
Abstract. We present the results of time resolved spectroscopy measurementsof the Hα line of atomic hydrogen in an Ar–C2H2 radiofrequency plasma. Thepresence of the fast (high-energy) and slow (low-energy) components of thehydrogen atoms can be deduced from the Doppler broadening of the Hα line. Withthe appearance of the dust particles, the Hα profile became narrower, indicatingreduction of the fast component. We discuss several mechanisms for the formationof the fast hydrogen atoms in our plasma. The main cause for the reduction ofthe hydrogen atom fast component is the plasma change from electropositiveto electronegative, decreasing the sheath’s width and voltage. The change ofplasma conditions coincides with the end of the dust coagulation/agglomerationwhen the dust particles become multiply negatively charged. We propose here anew experimental technique for detection of the dust coagulation/agglomerationphase.
Investigations of particulate formation in plasmas are of great interest for various branches ofscience and technology from astrophysics and powder chemistry to electronics and applicationsfor environmental control. The source for dust formation is either the sputtering of theelectrode/wafer material (heterogeneous dust growth) or plasma polymerization (homogeneousdust growth). In numerous experiments the dust particles were immersed into the plasma fromoutside to analyse formation of plasma crystals; references can be found in [1].
The presence of dust particles can influence the plasma conditions to a great extent. Severalinvestigations in silane [2]–[6] as well as hydrocarbon radio-frequency (RF) plasmas [1] showedthe changes in electrical properties of the discharge: increase of resistive component of thedissipated power and change in the harmonic frequency spectra. The change in the seventhharmonic voltage amplitude was proposed as a process control parameter for particle growth [7].
The most drastic change in plasma conditions was assigned to the early stage of dust growth,i.e. coagulation or agglomeration [8, 9]. After reaching some critical size the electron loss onthe dust exceeds the electron losses to the wall, causing the increase of the local electric fieldto compensate these losses. As a consequence, the electron concentration decreases and theelectron temperature increases. This process is usually called the α–γ ′ transition.
In a previous paper we reported on some aspects of the dust behaviour in an argon–acetylene gas mixture. It is well known that some discharge conditions and monomer typesfavour the formation of dust. In the case of hydrocarbon plasmas acetylene compounds have animportant role that was recognized by a number of authors [10, 11]. Consequently, acetyleneundergoes a polymerization process instantaneously, especially at low flow rate, whereas thepolymerization process in other hydrocarbon plasmas often follows the formation of acetylenein the discharge [11]. Polymerization in CH4 plasmas may be induced, as an example, aftertransient increase of the power in the discharge [7]. In an Ar/C2H2 gas mixture we observedthe periodic formation and disappearance of the dust particles [12]. By means of ion massspectroscopy we detected the strong increase of the positive ion count-rates for all relevant ionsin the discharge at the very beginning of the particle growth cycle. This increase was correlatedwith the changes in the reflected electrical power. It had a transient character and cannot beexplained in the frame of the α–γ ′ transition. Also, the timescale for this process is severalorders of magnitude larger than reported for the α–γ ′ transition in silane discharges [8, 9].
In addition to changes in electrical properties, the emission properties of the plasmachange [9]. In this paper we measure and analyse the Doppler-broadened Balmer alpha (Hα,λ = 656.3 nm) emission of atomic hydrogen. A number of authors have already investigated thisphenomenon in different DC [13]–[17] and RF [13, 18]–[21] plasma sources. The measurementsshow strongly increased far wings of Hα in pure hydrogen [14, 15] or Ar–H2 mixtures [16, 17, 21].The calculated spectral distribution of Hα emission in pure hydrogen in low-temperatureplasmas [15] as well as Monte Carlo simulations [22] for high-temperature plasmas showed goodagreement with the measured ones, assuming various processes for the formation of fast H atoms.
We have carried out experimental investigations of positive ion production in conjunctionwith optical emission measurements. During the transient regime we detected a Hα emissionwith a strong fast-H-atom component. We report here, for the first time, the correlation betweenthe appearance of the fast H atoms and the formation of the dust. After analysing the experimentaldata we propose a simple, qualitative model to explain the influence of the dust formation onemission profiles of the Hα line.
New Journal of Physics 5 (2003) 39.1–39.12 (http://www.njp.org/)
The investigations were performed in an RF capacitively coupled parallel plate reactor workingat 13.56 MHz (figure 1). The electrode system consists of plane, stainless steel electrodes, 30 cmin diameter and separated by 8 cm. The reactor was operated at room temperature, with a mixtureof acetylene and argon. The continuous gas flow of 8 sccm for argon and 0.5 sccm for acetylenewas controlled with mass flow controllers. The total gas pressure was about 0.1 mbar. Thegas residence time was about 1 min. The applied RF power was 10–50 W measured before thematch-box.
Infrared (IR) absorption spectroscopy was used to monitor the dust formation dynamicsas previously described [12]. The IR beam from the commercial Bruker FTIR spectrometerwas directed through KBr windows in the plasma chamber and focused with an off-axis goldmirror onto a liquid-nitrogen-cooled mercury–cadmium–telluride detector (MCT). By means ofthe multi-pass technique we were able to change the optical path length in the plasma from 0.6 m(two passes through the plasma reactor) to 7.2 m (24 passes).
During the measurement there was a significant deposition of DLC films on the electrodesand discharge chamber walls. To minimize their influence on the nucleation processes we cleanedthe discharge chamber after each measurement session by oxygen plasma with high through-flowrunning continuously for at least half an hour. After this treatment the plasma vessel was pumpedfor several hours. The residual gas pressure was 6 × 10⁻⁶ mbar.
We followed the time evolution of the IR scattering signal as well as different absorptionline intensities by measuring full FTIR spectra with the time resolution of 1 min.
New Journal of Physics 5 (2003) 39.1–39.12 (http://www.njp.org/)
For detection of positive ions and neutrals, we used a Balzers plasma process monitor (PPM)421, which consists of a quadrupole mass spectrometer equipped with ion extraction optics andan ion energy analyser.
The PPM was mounted on the chamber through the side port so that ions were sampled fromthe side of the plasma. A bellows assembly allowed us to vary the distance between the samplingorifice (100 µm diameter) and the edge of the electrodes. For the measurements presented hereit was placed 10 cm outside the electrodes (outside the bulk of the plasma) on the mid-planebetween the electrodes and was at floating potential. The time resolved measurements of ioncount-rates were made with 1 min resolution time.
The emission spectroscopy measurements were performed by the use of an ActonResearch monochromator/spectrograph with a Czerny–Turner mount. The 750 mm focallength monochromator/spectrograph had a reciprocal linear dispersion of 0.74 nm mm−1 with a1800 gr mm−1 grating. The spectroscopic data were collected by a 1024×256 pixel format, frontilluminated ICCD camera from Princeton Instruments. The resolution power of our spectroscopicsystem was 0.06 nm or 3 pixels with a 10 µm entrance slit width. All data presented here wereobtained by observing the emission at 90◦ from the central axis of the electrodes, i.e. parallel tothe electrode surfaces. The inter-electrode space was imaged onto the 3 mm high, 10 µm wideentrance slit by the system of optical mirrors and lenses. The specially designed imaging opticsof the spectrograph allowed us to measure spatially resolved optical emission. The signal-to-noise ratio was improved by averaging 50 frames for one spectrum. The exposition time for oneframe was 1 s. The spectra were collected in a 1 min interval, enabling us to follow the timedevelopment of the spectral emission.
3. Results
Representative spectral profiles of the Hα radiation, corresponding to the hydrogen atomic tran-sition from the n = 3 to 2 level (λ = 656.3 nm), emitted from an RF discharge in an Ar/C2H2
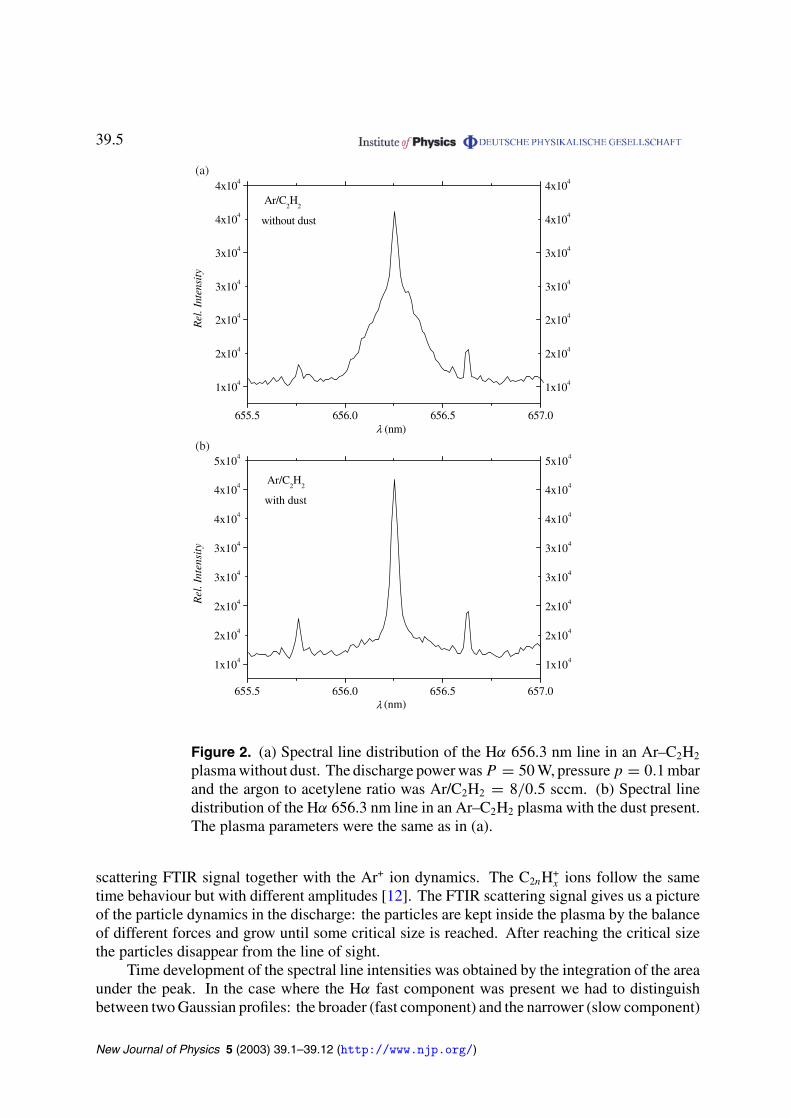
mixture, are shown in figures 2(a) and (b), respectively. During one measurement we coulddistinguish between two typical Hα profiles. In the first one (figure 2(a)) we recognize a broadcomponent of the Balmer-alpha line due to the strong Doppler broadening (‘fast’ component—emission from the fast hydrogen atoms) and a narrow component (‘slow’ component—emissionfrom the low-energy hydrogen atoms). In the second case (figure 2(b)) we observe a largefraction of the slow component and the fast component is present as minor wings only.
From the Doppler width we determined the average kinetic energy of the fast hydrogenatoms to be 30 eV. The energy of the slow hydrogen atoms could only be estimated since mostof the profile consists of the spectrograph instrumental broadening.
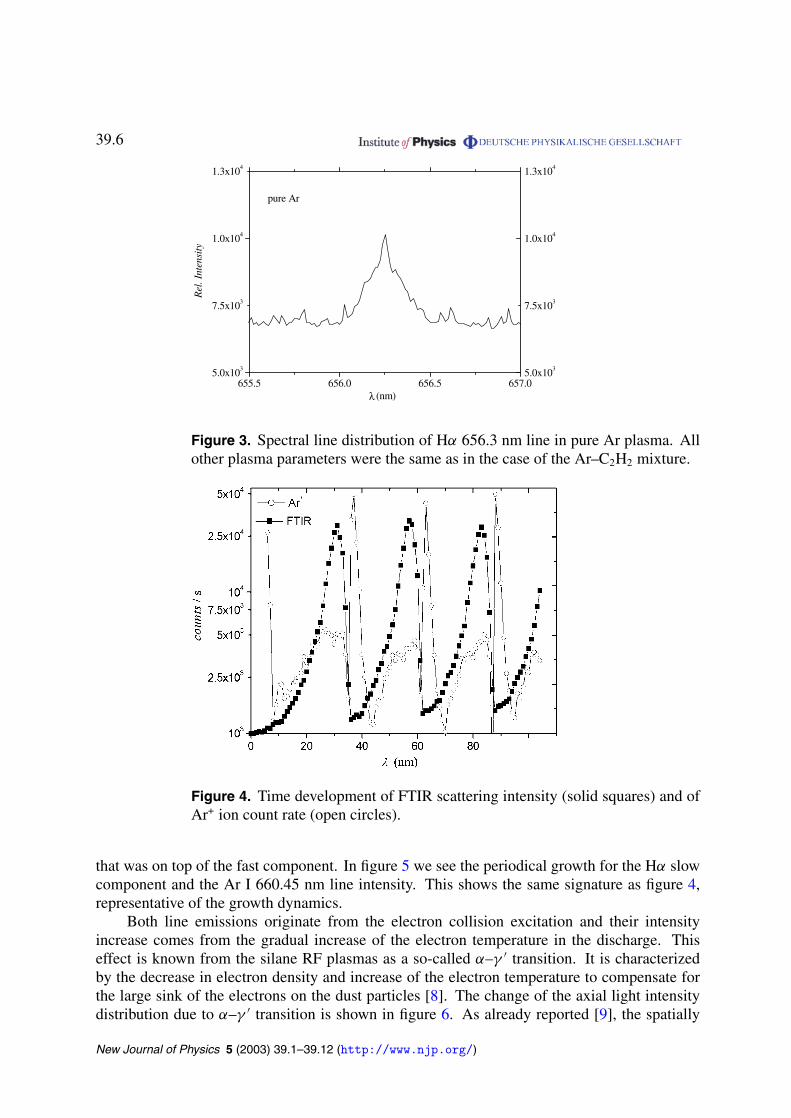
To gain more insight into the influence of dust on the Hα spectral distribution we repeatedthe same measurements in a pure Ar plasma. The observed Hα emission came from the hydrogenadsorbed on the surfaces of the electrodes and walls. The result presented in figure 3 is verysimilar to the case of the Ar–C2H2 plasma without dust. It is obvious that Ar+ ions or fast Aratoms play a significant role in the formation of the fast hydrogen atoms in the vicinity of theelectrode surfaces as already stated (see [21] and references therein). The fast H atom emissionextended to the plasma bulk, where they were excited in the very efficient collisions with Aratoms [23].
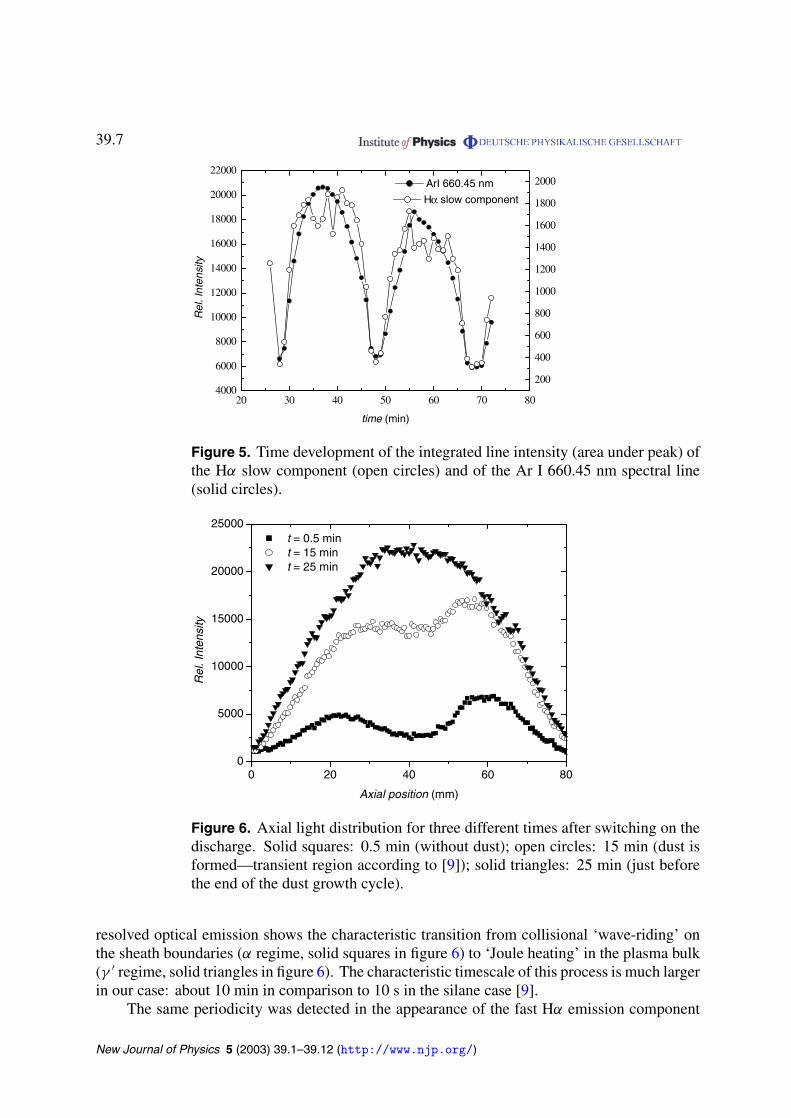
We have already reported the presence of periodical build-up and disappearance of the dustparticles in an Ar–C2H2 mixture [12]. In figure 4 we present the time development of the dust
New Journal of Physics 5 (2003) 39.1–39.12 (http://www.njp.org/)
Figure 2. (a) Spectral line distribution of the Hα 656.3 nm line in an Ar–C2H2
plasma without dust. The discharge power was P = 50 W, pressure p = 0.1 mbarand the argon to acetylene ratio was Ar/C2H2 = 8/0.5 sccm. (b) Spectral linedistribution of the Hα 656.3 nm line in an Ar–C2H2 plasma with the dust present.The plasma parameters were the same as in (a).
scattering FTIR signal together with the Ar+ ion dynamics. The C2nH+x ions follow the same
time behaviour but with different amplitudes [12]. The FTIR scattering signal gives us a pictureof the particle dynamics in the discharge: the particles are kept inside the plasma by the balanceof different forces and grow until some critical size is reached. After reaching the critical sizethe particles disappear from the line of sight.
Time development of the spectral line intensities was obtained by the integration of the areaunder the peak. In the case where the Hα fast component was present we had to distinguishbetween two Gaussian profiles: the broader (fast component) and the narrower (slow component)
New Journal of Physics 5 (2003) 39.1–39.12 (http://www.njp.org/)
Figure 3. Spectral line distribution of Hα 656.3 nm line in pure Ar plasma. Allother plasma parameters were the same as in the case of the Ar–C2H2 mixture.
Figure 4. Time development of FTIR scattering intensity (solid squares) and ofAr+ ion count rate (open circles).
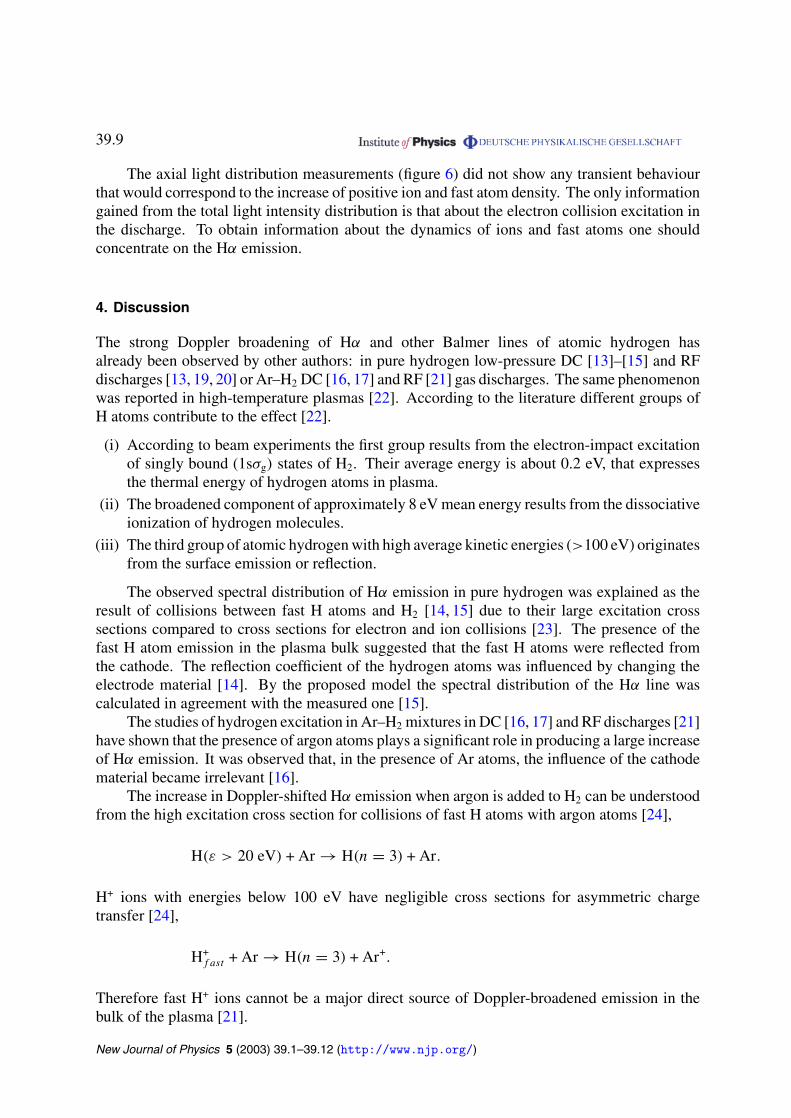
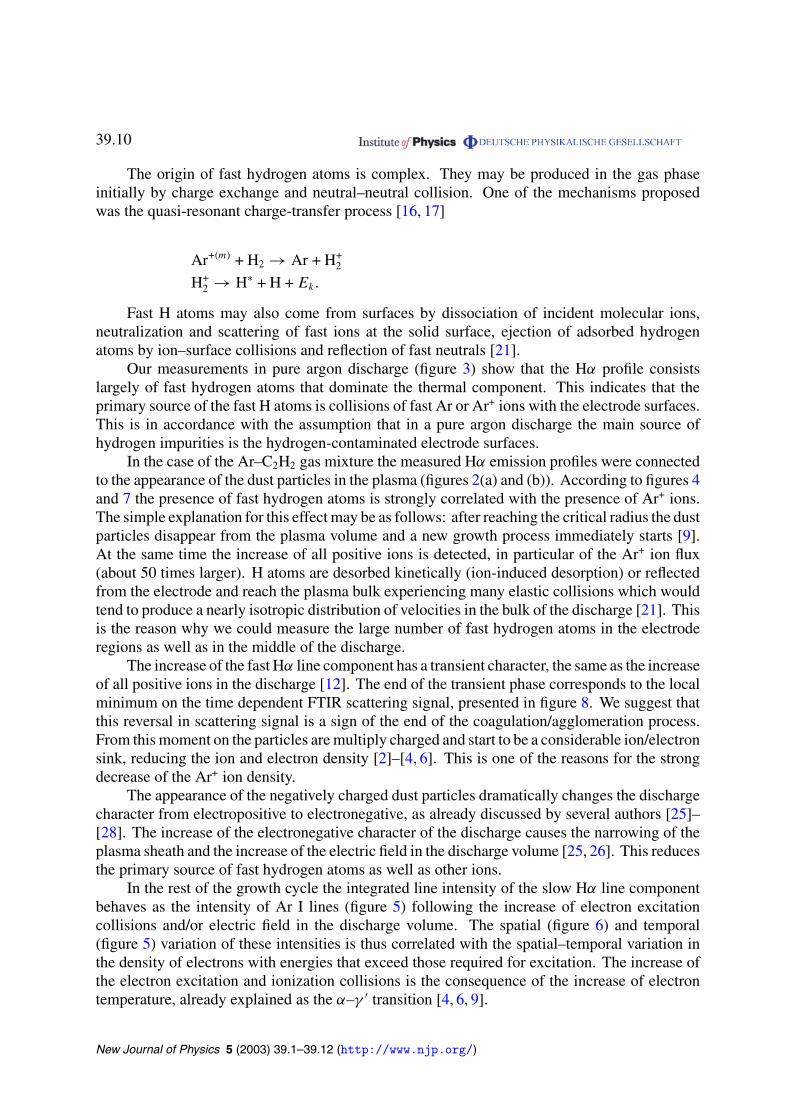
that was on top of the fast component. In figure 5 we see the periodical growth for the Hα slowcomponent and the Ar I 660.45 nm line intensity. This shows the same signature as figure 4,representative of the growth dynamics.
Both line emissions originate from the electron collision excitation and their intensityincrease comes from the gradual increase of the electron temperature in the discharge. Thiseffect is known from the silane RF plasmas as a so-called α–γ ′ transition. It is characterizedby the decrease in electron density and increase of the electron temperature to compensate forthe large sink of the electrons on the dust particles [8]. The change of the axial light intensitydistribution due to α–γ ′ transition is shown in figure 6. As already reported [9], the spatially
New Journal of Physics 5 (2003) 39.1–39.12 (http://www.njp.org/)
Figure 5. Time development of the integrated line intensity (area under peak) ofthe Hα slow component (open circles) and of the Ar I 660.45 nm spectral line(solid circles).
0 20 40 60 800
5000
10000
15000
20000
25000
Rel
.Int
ensi
ty
Axial position (mm)
t = 0.5 mint = 15 mint = 25 min
Figure 6. Axial light distribution for three different times after switching on thedischarge. Solid squares: 0.5 min (without dust); open circles: 15 min (dust isformed—transient region according to [9]); solid triangles: 25 min (just beforethe end of the dust growth cycle).
resolved optical emission shows the characteristic transition from collisional ‘wave-riding’ onthe sheath boundaries (α regime, solid squares in figure 6) to ‘Joule heating’ in the plasma bulk(γ ′ regime, solid triangles in figure 6). The characteristic timescale of this process is much largerin our case: about 10 min in comparison to 10 s in the silane case [9].
The same periodicity was detected in the appearance of the fast Hα emission component
New Journal of Physics 5 (2003) 39.1–39.12 (http://www.njp.org/)
Figure 7. Time development of the integrated intensity (area under peak) of theHα fast component (stars), and the Ar I 660.45 nm line intensity (solid circles).
0 2 4 6 8
0
10000
20000
30000
40000
50000
Ar+ ion-count rate
Rel
.Int
ensi
ty
time (min)
0 2 4 6 8 10
0.000
0.005
0.010
0.015
0.020FTIR scattering signal
Abs
orba
nce
10
Figure 8. Time development of FTIR dust scattering signal (triangles) and Ar+
ion count-rate (open circles) for the first 10 min of the dust growth cycle.
but with the opposite character (figure 7).Comparing the behaviour of the Ar+ ion concentration (figure 4) with the presence of the
fast hydrogen atoms (figure 7) we see the strong correlation between them.Besides the change in concentration of positive ions and fast H atoms there is the change
of the scattering FTIR signal, shown in figure 8 on a shorter timescale. The local minimum inthe scattering signal is associated with the change in particle size/density and corresponds to theend of the transient regime.
New Journal of Physics 5 (2003) 39.1–39.12 (http://www.njp.org/)
The axial light distribution measurements (figure 6) did not show any transient behaviourthat would correspond to the increase of positive ion and fast atom density. The only informationgained from the total light intensity distribution is that about the electron collision excitation inthe discharge. To obtain information about the dynamics of ions and fast atoms one shouldconcentrate on the Hα emission.
4. Discussion
The strong Doppler broadening of Hα and other Balmer lines of atomic hydrogen hasalready been observed by other authors: in pure hydrogen low-pressure DC [13]–[15] and RFdischarges [13, 19, 20] or Ar–H2 DC [16, 17] and RF [21] gas discharges. The same phenomenonwas reported in high-temperature plasmas [22]. According to the literature different groups ofH atoms contribute to the effect [22].
(i) According to beam experiments the first group results from the electron-impact excitationof singly bound (1sσg) states of H2. Their average energy is about 0.2 eV, that expressesthe thermal energy of hydrogen atoms in plasma.
(ii) The broadened component of approximately 8 eV mean energy results from the dissociativeionization of hydrogen molecules.
(iii) The third group of atomic hydrogen with high average kinetic energies (>100 eV) originatesfrom the surface emission or reflection.
The observed spectral distribution of Hα emission in pure hydrogen was explained as theresult of collisions between fast H atoms and H2 [14, 15] due to their large excitation crosssections compared to cross sections for electron and ion collisions [23]. The presence of thefast H atom emission in the plasma bulk suggested that the fast H atoms were reflected fromthe cathode. The reflection coefficient of the hydrogen atoms was influenced by changing theelectrode material [14]. By the proposed model the spectral distribution of the Hα line wascalculated in agreement with the measured one [15].
The studies of hydrogen excitation in Ar–H2 mixtures in DC [16, 17] and RF discharges [21]have shown that the presence of argon atoms plays a significant role in producing a large increaseof Hα emission. It was observed that, in the presence of Ar atoms, the influence of the cathodematerial became irrelevant [16].
The increase in Doppler-shifted Hα emission when argon is added to H2 can be understoodfrom the high excitation cross section for collisions of fast H atoms with argon atoms [24],
H(ε > 20 eV) + Ar → H(n = 3) + Ar.
H+ ions with energies below 100 eV have negligible cross sections for asymmetric chargetransfer [24],
H+f ast + Ar → H(n = 3) + Ar+.
Therefore fast H+ ions cannot be a major direct source of Doppler-broadened emission in thebulk of the plasma [21].
New Journal of Physics 5 (2003) 39.1–39.12 (http://www.njp.org/)
The origin of fast hydrogen atoms is complex. They may be produced in the gas phaseinitially by charge exchange and neutral–neutral collision. One of the mechanisms proposedwas the quasi-resonant charge-transfer process [16, 17]
Ar+(m) + H2 → Ar + H+2
H+2 → H∗ + H + Ek.
Fast H atoms may also come from surfaces by dissociation of incident molecular ions,neutralization and scattering of fast ions at the solid surface, ejection of adsorbed hydrogenatoms by ion–surface collisions and reflection of fast neutrals [21].
Our measurements in pure argon discharge (figure 3) show that the Hα profile consistslargely of fast hydrogen atoms that dominate the thermal component. This indicates that theprimary source of the fast H atoms is collisions of fast Ar or Ar+ ions with the electrode surfaces.This is in accordance with the assumption that in a pure argon discharge the main source ofhydrogen impurities is the hydrogen-contaminated electrode surfaces.
In the case of the Ar–C2H2 gas mixture the measured Hα emission profiles were connectedto the appearance of the dust particles in the plasma (figures 2(a) and (b)). According to figures 4and 7 the presence of fast hydrogen atoms is strongly correlated with the presence of Ar+ ions.The simple explanation for this effect may be as follows: after reaching the critical radius the dustparticles disappear from the plasma volume and a new growth process immediately starts [9].At the same time the increase of all positive ions is detected, in particular of the Ar+ ion flux(about 50 times larger). H atoms are desorbed kinetically (ion-induced desorption) or reflectedfrom the electrode and reach the plasma bulk experiencing many elastic collisions which wouldtend to produce a nearly isotropic distribution of velocities in the bulk of the discharge [21]. Thisis the reason why we could measure the large number of fast hydrogen atoms in the electroderegions as well as in the middle of the discharge.
The increase of the fast Hα line component has a transient character, the same as the increaseof all positive ions in the discharge [12]. The end of the transient phase corresponds to the localminimum on the time dependent FTIR scattering signal, presented in figure 8. We suggest thatthis reversal in scattering signal is a sign of the end of the coagulation/agglomeration process.From this moment on the particles are multiply charged and start to be a considerable ion/electronsink, reducing the ion and electron density [2]–[4, 6]. This is one of the reasons for the strongdecrease of the Ar+ ion density.
The appearance of the negatively charged dust particles dramatically changes the dischargecharacter from electropositive to electronegative, as already discussed by several authors [25]–[28]. The increase of the electronegative character of the discharge causes the narrowing of theplasma sheath and the increase of the electric field in the discharge volume [25, 26]. This reducesthe primary source of fast hydrogen atoms as well as other ions.
In the rest of the growth cycle the integrated line intensity of the slow Hα line componentbehaves as the intensity of Ar I lines (figure 5) following the increase of electron excitationcollisions and/or electric field in the discharge volume. The spatial (figure 6) and temporal(figure 5) variation of these intensities is thus correlated with the spatial–temporal variation inthe density of electrons with energies that exceed those required for excitation. The increase ofthe electron excitation and ionization collisions is the consequence of the increase of electrontemperature, already explained as the α–γ ′ transition [4, 6, 9].
New Journal of Physics 5 (2003) 39.1–39.12 (http://www.njp.org/)
The spectral line profile of Hα radiation from a dust-producing Ar/C2H2 plasma shows twodifferent shapes (one with a great amount of the fast component and one with a dominant slowcomponent), strongly dependent on the appearance and growth of the dust particles.
The periodicity in the dust build-up/disappearance process, characteristic for the Ar/C2H2
RF discharges, consequently leads to a concomitant periodicity in the fast H atom and Ar+ ionappearance. However, the temporal evolution of the fast Hα component shows a big differencecompared to other measured spectral line profiles (rapid peaking at the beginning of the growthcycle).
Furthermore, the peaking of the fast Hα line component has transient character, exactly thesame as the strong peaking of the concentrations of all positive ions in the discharge [12], bothcorresponding to the behaviour of the scattered FTIR signal (first local maximum/minimum,figure 8). These rapid/drastic changes are correlated with the coagulation process in the plasma.The build-up of the multiply charged dust changes the plasma character from electropositive toelectronegative, narrowing the sheath width and lowering the sheath potential. This explains thedrop in the Ar+ ion count rate and reduction of the Hα fast component.
In the rest of the dust growth cycle the power deposition in the plasma is volume dominateddue to the increase of the electric field in the volume compensating for the attachment losses ofions and electrons. This process is similar to the α–γ ′ transition described for silane plasmasbut with the larger timescale [4, 6, 9].
The measurements of the Hα line shape may thus be used to determine the point of theparticle coagulation/agglomeration. This could be a complementary technique to the laser lightscattering which loses its sensitivity with decreasing particle radius.
Acknowledgments
One of the authors (IS) is grateful to Z Lj Petrovic for many fruitful discussions. This work wassupported by DFG (project B1, SFB 591).
References
[1] Bouchoule A (ed) 1999 Dusty Plasmas (New York: Wiley)[2] Boeuf J P 1992 Phys. Rev. A 46 7910[3] Belenguer Ph et al 1992 Phys. Rev. A 46 7923[4] Boeuf J P and Belenguer Ph 1992 J. Appl. Phys. 71 4751[5] Kortshagen U and Bhandarkar U 1999 Phys. Rev. E 60 887[6] Fridman A A, Boufendi L, Hbid T, Potapkin B V and Bouchoule A 1996 J. Appl. Phys. 79 1303[7] Hong S H, Berndt J and Winter J 2003 Plasma Sources Sci. Technol. 12 46[8] Bouchoule A and Boufendi L 1993 Plasma Sources Sci. Technol. 2 204[9] Perrin J, Bohm Ch, Etemadi R and Lioret A 1994 Plasma Sources Sci. Technol. 3 252
[10] See for exampleKobayashi H, Bell A T and Shen M 1974 Macromolecules 7 277Tibbitt J M, Jensen R, Bell A T and Shen M 1977 Macromolecules 10 647Stoykov S, Eggs C and Kortshagen U 2001 J. Phys. D: Appl. Phys. 34 2160
[11] Deschaneux Ch, Affolter A, Magni D, Hollenstein Ch and Fayet P 1999 J. Phys. D: Appl. Phys. 32 1876[12] Kovacevic E, Stefanovic I, Berndt J and Winter J 2003 J. Appl. Phys. 93 2924[13] Vrhovac S B, Radovanov S B, Bzenic S A, Petrovic Z Lj and Jelenkovic B M 1991 Chem. Phys. 153 233
New Journal of Physics 5 (2003) 39.1–39.12 (http://www.njp.org/)
[14] Petrovic Z Lj and Phelps A V 1991 Proc. Int. Seminar on Reactive Plasmas (Nagoya) paper E-3, p 351[15] Petrovic Z Lj, Jelenkovic B M and Phelps A V 1992 Phys. Rev. Lett. 68 325[16] Kuraica M and Konjevic N 1992 Phys. Rev. A 46 4429[17] Kuraica M, Konjevic N and Platisa M 1992 Spectrochim. Acta B 47 1173[18] Baravian G, Chouan Y, Ricard A and Sultan G 1987 J. Appl. Phys. 61 5249[19] Djurovic S and Roberts J R 1991 J. Appl. Phys. 70 82[20] Radovanov S B, Dzierzega K, Roberts J R and Olthoff J K 1995 Appl. Phys. Lett. 66 2637[21] Radovanov S B, Olthoff J K, Van Brunt J and Djurovic S 1995 J. Appl. Phys. 78 746[22] Reiter D, Bogen P and Samm U 1992 J. Nucl. Mater. 196–198 1059[23] Phelps A V 1990 J. Chem. Phys. Ref. Data 19 653[24] Phelps A V 1992 J. Chem. Phys. Ref. Data 21 883[25] Gottscho R A 1987 Phys. Rev. A 36 2233[26] Boeuf J P 1987 Phys. Rev. A 36 2782[27] Bletzinger P 1990 J. Appl. Phys. 67 130[28] Kakuta S, Tochikubo F, Petrovic Z Lj and Makabe T 1993 J. Appl. Phys. 74 4923
New Journal of Physics 5 (2003) 39.1–39.12 (http://www.njp.org/)