HIGH DENSITY ORCHARD SYSTEMS FOR EUROPEAN PEAR: THE 2013 NC-140 REGIONAL ROOTSTOCK PROJECT (Hopland) Rachel Elkins, University of California Cooperative Extension, Lake and Mendocino Counties Bruce Lampinen, Department of Plant Sciences, University of California, Davis ABSTRACT The California pear industry has shrunk considerably in the past two decades, both in number of growers and total acreage (USDA-NASS 2014; Elkins, Bell and Einhorn 2012). Many remaining California growers are considering replanting options, or have already replanted relatively small acreages. In coordination with Oregon State University (OSU) and Cornell University, three replicated trials were established in Spring 2013 in Mendocino County, California (CA), Hood River, Oregon (OR), and Geneva, New York (NY) to evaluate multiple training system, spacing, and rootstock combinations for the European pear cultivar ‘Bartlett’ (California), ‘D’Anjou’ (Oregon), and ‘Bosc’ (New York). California treatments consisted of Tall Spindle (TS), “V” Trellis (V-T) , parallel 2-leader (2-L), and nursery-formed Bi-axis (B-A) x 3’, 4.5’ and 6’ spacings x OHxF 69, OHxF 87, and Pyro 2-33 rootstocks (36 total combinations) in a split-split plot design. 2016 overall trial yield was 76% less than 2015, averaging less than 1.0 kg/tree. Completely unpruned trees in an adjacent row to treatment trees yielded similarly and documented nearby mature commercial tree yields were also 14% lower. Yield was highest for V-T and lowest for B-A. There was a trend (p = .07) toward higher yields for 6’ and OHxF 87 yields were highest, with significant interaction between training systems and rootstocks. Fruit size was only 6.9% larger than 2015, with OHXF 87 size increasing most (208 vs. 172 gm.) despite having the highest yield (0.60 kg/tree). Fruit was harvested at lower maturity in 2016 (August 8) than 2015 (August 12-13) (8.6 vs. 9.2 kg. and 14.0 vs. 12.6 °B). Mid-day stem water potential (MSWP) never reached baseline in either 2015 or 2016. Highest stress was in mid-August in 2015 and mid-September in 2016, but trees recovered well after late season irrigations. Pyro 2-33 MSWP was lower in 2014-2015. OHxF 87 MSWP was more variable. (OHxF 69 MSWP is not measured). Cumulative from 2013-2016, survival rate is 97.2%. TS trees were tallest and also had the largest cultivar single trunk cross-sectional area (TCSA) (B-A trees had the largest total TCSA with both scaffolds combined). TS and V-T and trees were most precocious and efficient. There was a trend for 6’ spacing to have the largest and most fruit. OHxF 87 was the most productive and efficient rootstock and Pyro 2-33 the least. There was a slight trend toward more root suckers in the V-T. For spread versus unspread B-A trees on OHxF 87, there was a trend toward higher yield in unspread versus spread trees, with no difference in fruit size. Spread trees were significantly smaller (shorter) and thus had higher yield efficiency. Effects of training, spacing, and rootstocks on tree growth, suckering, fruiting and harvest maturity will continue in 2017.
Transcript
HIGH DENSITY ORCHARD SYSTEMS FOR EUROPEAN PEAR: THE 2013 NC-140 REGIONAL ROOTSTOCK PROJECT (Hopland) Rachel Elkins, University of California Cooperative Extension, Lake and Mendocino Counties Bruce Lampinen, Department of Plant Sciences, University of California, Davis ABSTRACT The California pear industry has shrunk considerably in the past two decades, both in number of growers and total acreage (USDA-NASS 2014; Elkins, Bell and Einhorn 2012). Many remaining California growers are considering replanting options, or have already replanted relatively small acreages. In coordination with Oregon State University (OSU) and Cornell University, three replicated trials were established in Spring 2013 in Mendocino County, California (CA), Hood River, Oregon (OR), and Geneva, New York (NY) to evaluate multiple training system, spacing, and rootstock combinations for the European pear cultivar ‘Bartlett’ (California), ‘D’Anjou’ (Oregon), and ‘Bosc’ (New York). California treatments consisted of Tall Spindle (TS), “V” Trellis (V-T) , parallel 2-leader (2-L), and nursery-formed Bi-axis (B-A) x 3’, 4.5’ and 6’ spacings x OHxF 69, OHxF 87, and Pyro 2-33 rootstocks (36 total combinations) in a split-split plot design. 2016 overall trial yield was 76% less than 2015, averaging less than 1.0 kg/tree. Completely unpruned trees in an adjacent row to treatment trees yielded similarly and documented nearby mature commercial tree yields were also 14% lower. Yield was highest for V-T and lowest for B-A. There was a trend (p = .07) toward higher yields for 6’ and OHxF 87 yields were highest, with significant interaction between training systems and rootstocks. Fruit size was only 6.9% larger than 2015, with OHXF 87 size increasing most (208 vs. 172 gm.) despite having the highest yield (0.60 kg/tree). Fruit was harvested at lower maturity in 2016 (August 8) than 2015 (August 12-13) (8.6 vs. 9.2 kg. and 14.0 vs. 12.6 °B). Mid-day stem water potential (MSWP) never reached baseline in either 2015 or 2016. Highest stress was in mid-August in 2015 and mid-September in 2016, but trees recovered well after late season irrigations. Pyro 2-33 MSWP was lower in 2014-2015. OHxF 87 MSWP was more variable. (OHxF 69 MSWP is not measured). Cumulative from 2013-2016, survival rate is 97.2%. TS trees were tallest and also had the largest cultivar single trunk cross-sectional area (TCSA) (B-A trees had the largest total TCSA with both scaffolds combined). TS and V-T and trees were most precocious and efficient. There was a trend for 6’ spacing to have the largest and most fruit. OHxF 87 was the most productive and efficient rootstock and Pyro 2-33 the least. There was a slight trend toward more root suckers in the V-T. For spread versus unspread B-A trees on OHxF 87, there was a trend toward higher yield in unspread versus spread trees, with no difference in fruit size. Spread trees were significantly smaller (shorter) and thus had higher yield efficiency. Effects of training, spacing, and rootstocks on tree growth, suckering, fruiting and harvest maturity will continue in 2017.
INTRODUCTION The California pear industry has shrunk considerably in the past several decades, both in number of growers and total acreage. There are many reasons for this, which have been described (Elkins, Bell and Einhorn, 2012). Supply and demand have balanced, leading remaining growers to consider replanting older low density orchards. Several have either already replanted relatively small acreages, or are considering doing so. Economic evaluation, as well as one such planting in the Ukiah Valley of Mendocino County that has now completed its 12th year, have shown that higher density plantings can be successful (Elkins et al 2011; Elkins and DeJong, 2011; Elkins et al 2008; Elkins and DeJong, 2002; Chris Ruddick, pers. communication). The NC140 Regional Rootstock Research Project (www.nc140.org) is a USDA NIFA multi-state project for perennial fruit (and nut) crops. Regional projects must be resubmitted for authorization every five years; the 2018-2022 NC140 Regional Research Project Proposal is currently being drafted (the 2012-2017 proposal may be download from NC140 web site). The goal of NC-140 is to develop and disseminate information generated from trials throughout the U.S. Each participating state establishes and evaluates similar (“uniform”) trials using the same rootstocks and similar plot design so that regional differences can be determined. Progress and results are shared at an annual two-day meeting (California hosted in 2015, 2016 Pennsylvania, 2017 North Carolina) and via the NC140 website. Each state submits an annual report which is distributed and discussed at the meeting. State reports are then compiled into a national report for USDA. California began participating in NC140 in 1995 (apples, Scott Johnson) and peaches (Johnson and Ted DeJong) were added in 1999. The first pear trial was initiated in 1987 by the late Dr. Eugene Mielke of OSU (Azarenko et al 2002), followed by the 2002, 2004, 2005, 2006, and 2013 trials. Rachel Elkins is the California voting representative for all crops (currently only pear) and leads the pear trials in California, summarizing and reporting California information at the annual meeting. She also co-organizes pear data for the national trials for reporting and publications with Associate Professor Todd Einhorn (formerly of Oregon State University (OSU), now at Michigan State University (MSU), East Lansing). Her expenses to the meetings are currently covered by Hatch funds through the UC Davis Department of Plant Sciences. In coordination with and OSU and Cornell University, an NC-140 project to study high density systems and techniques was initiated in Spring 2013. Three replicated trials were established in Mendocino County, California
(CA), Hood River, Oregon (OR), and Geneva, New York (NY) to evaluate multiple combinations of training systems, spacings, and promising commercially-available rootstocks for the European pear cultivars ‘Bartlett’ (California), ‘D’Anjou’ (Oregon), and ‘Bosc’ (New York). The 2013 trial succeeds the 10-year 2005 multi-state rootstock trial that was formally completed in 2014 (Elkins 2014; Elkins et al 2008). The 2013 NC-140 trial compares 27 (OR, NY) or 36 (CA) combinations of training systems, spacings, and rootstocks. The California trial was planted May 1 - 2, 2013 in Hopland, Mendocino County, California and has completed four growing seasons (4th leaf). Treatments consist of four (versus three in OR and NY) training systems and three spacings that have shown promise in high density plantings, particularly apple and pear, and three commercially-available rootstocks which have shown promise in previous NC-140 trials. Similar to the 2005 NC-140 trial, the 2013 trial is the only formal, replicated pear systems trial in California. The information gained from the trial will benefit future planting decisions. OBJECTIVES The objectives of this multi-state, multi-factor trial are to evaluate alternative rootstocks, planting systems, and cultivars relative to: ● Cultivar compatibility (‘Bartlett; CA, ‘Bosc’ NY, ‘D’Anjou’ OR); ● Early and consistent production; ● Improved labor efficiency/increased attractiveness for picking crews and amenability to future mechanization; ● Ability to apply a systems approach to canopy management; and ● Improved fruit quality (higher percentage of “target” fruit, which may or may not be accompanied by increased
production per acre). While not a specific objective of the orchard systems project, improved pesticide application efficacy (cost, coverage) will be observed and documented once trees are fully trained out.
PROCEDURES Trial locations: 1) OSU Mid-Columbia Agricultural Research and Extension Center, Hood River, OR (‘D’Anjou’, Todd Einhorn,
PI); 2) Cornell Geneva Experiment Station, NY (‘Golden Russet®’ Bosc’, Terence Robinson, PI); 3) Shadowbrook Farms (Kurt Ashurst), Hopland, Mendocino County, CA (‘Bartlett’, Rachel Elkins, PI; Bruce
Lampinen, Ted DeJong, and Chuck Ingels, collaborators). Soil type is a very deep Russian loam adjacent to the east bank of the Russian River.
Training systems: 1) Tall spindle (TS) (developed by Terence Robinson for apple) (unheaded at planting); 2) Tatura “V” trellis (V-T) (22° at the base, planted in-line with every other tree pulled to the opposite side of the trellis); 3) Bi-axis (B-A) planted parallel to the row. Developed by Dr. Stefano Mussachi, formerly of the University of Bologna, Italy, now with Washington State University. B-A trees are pre-formed in the nursery; the California B-A trees were headed high to a “knip” at planting so are one year behind those left unheaded. Trees were spread into a parallel “V” after the 2013 growing season in order to more quickly fill the growing space, reduce main scaffold vigor, and hasten fruiting; 4) 2-leader (2-L) planted parallel to the row, created by choosing two appropriately placed “feathers” just above or below the first wire (left unheaded), or if none available, heading the leader and choosing two new scaffolds. In all cases where tree vigor was adequate, “feathers”, i.e. branches grown in the nursery, were left on unless broken and utilized to begin cropping. In addition to the main trial block, an adjacent row of extra B-A and single leader trees was left completely unheaded and unpruned. A replicated sub-trial was initiated on one set of these extra B-A trees on OHxF 87 to
compare the effect of spreading vs. not spreading on vigor and precocity. The remaining trees in the extra row were left completely unpruned as an unreplicated control. These trees were divided into two sets on either OHxF 69 or OHxF 87 to be analyzed separately. Cultivar and Rootstocks: ‘Bartlett’ on OHxF 69, OHxF 87, Pyro 2-33. Rootstocks were chosen based on best available data in comparison with standard size rootstocks. Micropropagated rootstock plants (North American Plant, Lafayette, Oregon) were delivered to Willow Drive Nursery (Ephrata, WA), acclimated, fall budded, grown and planted May 1-2, 2013. A total of (about) 700 trees were planted, of which 540 are part of the main systems trial. Spacing: 3’ (1m), 4-5’ (1.5m), and 6’ (2m) in-row x 12’ (4m) between rows. Final height is 10-12’ (3.3-4m) (TBD). The unreplicated “fifth” row in-row spacing is 6’ (2m). Design: Split-split plot: main plot = training system, sub-plot = spacing, sub-sub-plot = rootstock. 5 replicated blocks, each plot consisting of 27 trees (27/training system; 9/spacing; 3/rootstock) (4 treatment rows per block). Blocking is across the field with trees oriented north to south (east-west sun exposure). Approximately 2 acres of land in a high-producing orchard along the Russian River was cleared and prepared in 2012 in preparation for fumigation, however, the fumigation was unable to occur due to weather and regulatory delays1. Data Collection Tree training and crop load management: From 2013 through 2016 training emphasized leader development, proper shaping, and thinning to optimize fruiting wood distribution. Nearly all training was performed between the start of terminal bud growth and terminal bud set in October. Emphasis was on encouraging: 1) leaders to reach the top wire by reducing the influence of competing scaffolds, 2) filling intra-row and inter-tree space along the supporting wire, and 3) ensuring ideally spaced and optimally vigorous fruiting wood development. Clothes pins and rubber tubing tie were the main training aides,
and nearly all pruning was done using thinning rather than heading cuts. Fruit was removed on weak trees but left if vigor appeared adequate. Tree survival, growth and vigor (2013-2016): Percent surviving trees was determined. Tree height was measured and trunk cross-sectional area (TCSA) of both cultivar (10 cm. above graft union) and rootstock (5 cm. below graft union) measured. Measuring above and below the union allowed comparing single-leader trees with the bi-axis trees which were nursery budded very low at the base. Root suckers were counted. Baseline canopy light interception was initially measured on October 19, 2013 using a Kawasaki Mule-mounted lightbar, then annually through 2015 to eventually develop a predictive model to inform future plantings. (In 2016 the new smartphone iPAR “app” was utilized instead of the large lightbar system, however measurement data was corrupted; these will be resumed in 2017). From 2013-2015 four plant cameras, each focused on one training system, recorded the daily and weekly progress of tree growth (e.g. terminal height growth, number of leaves, flowers, fruit) and biotic and abiotic interactions. One photo per day at 10:00 a.m. served as a continuous recording of seasonal growth pattern. The displays on the cameras failed in 2016, precluding further data collection (2017 to be determined). Productivity and harvest maturity: Flower clusters (2013-2015), fruit number and size, and yield (2014-2016) per tree were measured and both cultivar and rootstock yield efficiency (YE) calculated (see above for why rootstock TCSA was recorded). 2015-2016 data also included number of fruit removed prior to harvest (an indicator of overall vigor) and firmness (kg) and soluble solids (°Brix). In 2014-2016, weekly mid-day stem water potential (MSWP) was measured from May through early October using a pressure chamber (PMS Model 610 Pressure Chamber, PMS Instrument Company, Albany, OR) to assess whether and how much water stress might affect vigor and yield (crop load and fruit size), and vise versa. Measurements were taken from trees representing all training systems but only Pyro 2-33 and OHxF 87 rootstocks.
Data summarization and analysis Data was analyzed using ANOVA and means separated using Tukey HSD test, p<0.05 (rootsuckers by Duncans MRT, p<0.10) (Statgraphics Centurion XVI, StatPoint Technologies, Warrenton, VA). Due to unequal tree age of one of the replicates, only four replicates were utilized for most analyses, with data from the fifth replicate used as appropriate. From 2013-2016, there were some significant interactions among treatments, mainly training x rootstock, but also starting for spacing x rootstock starting in 2016. For this report, only overall differences among the three main treatments are discussed (training, spacing, rootstock), as data for each individual combination (36 total) is still being summarized. 2013-2016 CUMULATIVE AND 2015-2016 RESULTS (Tables 1-13, Figures 1-6) (2013- 2014 results summarized in previous reports (Elkins 2014, Elkins 2015)). Tree survival, growth, and vigor (Tables 1-3): Out of 540 trees, 15, or 2.8%, have succumbed (data not shown): 2 2-L/Pyro 2-33, 2 2-L/OHxF 87, 5 B-A/OHxF 87, 2 B-A OHxF 69, 1 B-A/Pyro 2-33, 1 TS/OHxF 69, 1 V-T/Pyro 2-33, and 1 V-T/OHxF 69, for a total of 4 Pyro 2-33, 4 OHxF 69, and 7 OHxF 87. Only two have died since 2014. 2-L trees had the smallest cultivar single leader TCSA with all other systems being equal. TS trees were tallest, with many well above the 10’ wire. There were no spacing TCSA differences but 3’ trees were tallest. OHxF 69 trees were tallest, followed by OHxF 87 than Pyro 2-33. There were few suckers but OHxF 87 had the most and OHxF 69 had fewest. From 2013-2016 completely unpruned OHxF 69 and OHxF 87 trees had more fruit and yield and higher yield efficiency than trained trees (not compared statistically), though 2016 yield was comparable to trained trees. OHxF 69 trees were larger, with no other significant differences versus OHxF 87 (Tables 6, 8-9). 2016 MSWP of Pyro 2-33 trees was lower than 2014 but slightly higher than 2015. OHxF 87 MSWP was lower in 2016 than either 2014 or 2015. Values were consistently below baseline in all years. Maximum stress occurred in mid-August in 2016 versus mid-September in 2015. There were few differences among training systems (though OHxF 87 exhibited slightly more variability) however Pyro 2-33 exhibited slightly more stress than OHxF 87 (range 28-33 bars versus 26-31 bars) on August 11, 2016, the date of lowest recorded MSWP (Figures 1-6).
Fruiting and harvest maturity (Tables 1-4): Allowing for very low 2016 yield, from 2013-2016 TS and V-T trees were the most precocious based on number of fruit (over double that of 2-L and B-A) and yield, and were also most efficient, followed by 2-L and lastly, B-A. There are yet to be spacing differences, however there is a trend toward 3’ having larger fruit and 6’ having the highest yield. Pyro 2-33 and OHxF 87 fruit were largest (185 and 177 gms, respectively) and OHxF 69 smallest (173 gm). OHxF 87 yielded the most (3.6 kg/tree), followed by OHxF 69 (2.8 kg), and lastly Pyro 2-33 (1.1 kg). For treatments except V-T (8.4%), an average of 15-23% total fruit per tree was removed prior to harvest either to preserve vigor or facilitate leader development. Pyro 2-33 had the largest fruit (likely due to low yield), followed by OHxF 87 and OHxF 69 (177 and 173 gm). Firmness and soluble solids (Tables 5, 7): Values for both were lower in 2016 (8.6 kg and 12.6°B versus 9.05 kg and 14.0°B). B-A fruit was firmest and OHxF 87 sweetest. Only soluble solid training x rootstock interactions were significant, though there were trends toward other interactions. There was a trend toward higher firmness and soluble solids for unpruned OHxF 87 in 2016. Spread versus unspread Bi-Axis/OHxF 87 (Tables 6-9): From 2013-2016, only tree height differed significantly, with unspread trees 29% larger than spread (263 versus 204 cm). In 2016, unspread trees trended toward more fruit and higher yield and yield efficiency. There were no differences in firmness and soluble solids. 2015-2016 DISCUSSION AND 2017 PLANS After four growing seasons, training and rootstock appear to be the most important factors in determining early tree growth and productivity. Tall spindle and V-Trellis are the most productive training systems to date, with V-Trellis having the largest fruit of the two. Spacing has yet to play a discernible role, except (slightly) for tree height. OHxF 87 yield and fruit size exceeds that of OHxF 69 and Pyro 2-33 lags well behind both OHxF rootstocks. V-Trellis has required the least fruit removal to maintain vigor and promote leader development. Pyro 2-33 appears to be slightly more prone to water stress than OHxF 87, perhaps due to its larger canopy size. Spreading of B-A trees appears to reduce vigor, but perhaps also fruiting potential. Completely forgoing pruning in early years appears to encourage early fruiting without compromising tree size (caliper).
A field meeting was held in February 2015, and during the NC-140 Annual Meeting in November 2015. At least one will be held in 2017. Tree training and data collection will continue in 2017 (Year 5). REFERENCES Elkins, R. and B. Lampinen. 2015. High density orchard systems for European pear: the 2013 NC-140 regional rootstock project. 2014 California Pear Research Report, p. 83-95. Elkins, R. 2014. Improving economic and environmental sustainability in California pear production through changes in rootstock use: the NC-140 Regional Rootstock Project. 2013 California Pear Research Report, p. 101-119. Elkins, R., R. Bell and T. Einhorn. 2012. Needs assessment for future U.S. pear rootstock research directions based on the current state of pear production and rootstock research. J. of the American Pomological Society 66(3):153-163. Elkins, R et al. 2011. Evaluation of potential rootstocks to improve pear tree precocity and productivity. Acta Hort 909:183-194.
Elkins, R. and T.M. DeJong. 2011. Performance of ‘Golden Russet® Bosc’ on five training systems and nine rootstocks. Acta Hort 903:689-694. Elkins, R. and T.M. DeJong. 2002. Effect of training system and rootstock on growth and productivity of ‘Golden Russet® Bosc’ pear trees. Acta Hort 596:603-608. Elkins, R., K. Klonsky, R. DeMoura and T.M. DeJong. 2008. Economic Evaluation of High Density versus Standard Orchard Configurations; Case Study Using Performance Data for ‘Golden Russet Bosc’ Pears. Acta Hort 800:739-746. USDA-NASS. rev. 2014. California pears, 1920-2012. California Historic Commodity Data. USDA National Agricultural Statistics Service, California Field Office, 2 pp. ACKNOWLEDGEMENTS We thank Kurt Ashurst and his field crew (Shadowbrook Farms) for hosting the trial and contributing capital, labor, and advice to ensure success; UC field research staff members Nick Dudley, Lynn Fraser, Joe Evans, Ryan Keiffer, Collin and Connor McVey, Sam Metcalf, Perry Pietro, Alberto Ramos Luz, Makaila Rodrigues, and Carolyn Shaffer for collecting, summarizing, and presenting data; North American Plants (NAP), Willow Drive Nursery, and Yuba City Cold Storage for trees and storage care; A & P Ag Systems for trellis design and supplies; Mendocino County Farm Supply for additional supplies; Rainbow Ag Services for irrigation/frost control system; collaborators Todd Einhorn (project leader), Stefano Mussachi and Terence Robinson for intellectual and moral support. We thank California Pear Advisory Board for partial funding.
Average Fruit No.
(per tree)
Average
Fruit Size3
(g)
Average Yield
(kg)
2016 Cultivar
TCSA (cm2)
Average Cumulative Cultivar
Yield Efficiency4
(kg/cm2 )
2016 Rootstalk
TCSA (cm2)
Average Rootstock
Yield Efficiency4
(kg/cm2 )
2016 Tree
Height
(cm)
S(
Training1 2-Leader 9.6 b 186 a 1.7 b 14.8 c 0.11 b 23.7 b 0.07 b 223 b Bi-axis# 7.8 b 186 a 1.4 b 39.2 a 0.04 c 26.2 b 0.05 b 229 b Tall Spindle 21.3 a 166 b 3.6 a 19.3 b 0.18 a 33.1 a 0.10 a 249 a V-Trellis 19.8 a 175 ab 3.4 a 18.4 b 0.17 a 32.8 a 0.10 a 228 b Spacing1
3 feet 14.2
184 2.4
22.6
0.13
28.4
0.08
239 a
4.5 feet 13.9 174 2.4 22.9 0.12 29.2 0.08 228 b 6 feet 15.8 176 2.7 23.3 0.13 29.3 0.08 229 b Rootstock1 Pyrodwarf 2-33 6.2 c 185 a 1.1 c 20.3 c 0.06 c 25.6 c 0.04 c 233 ab OHxF 69 16.5 b 173 b 2.8 b 25.8 a 0.13 b 33.2 a 0.08 b 237 a OHxF 87 21.2 a 177 a 3.6 a 22.7 b 0.18 a 28.9 b 0.12 a 225 b
Training x Rootstock ***(<0.001) NS (0.34) ***(<0.001) NS (0.14) ***(<0.001) *(0.04) ***(<0.001) NS (0.12) Spacing x Rootstock *(0.02) NS (0.38) *(0.02) NS (0.33) NS (0.07) NS (0.83) NS (0.09) NS (0.85) Training x Spacing NS (0.40) NS (0.54) NS (0.42) NS (0.75) NS (0.52) NS (0.59) NS (0.58) ***(<0.001) Training x Spacing x Rootstock *(0.05) NS (0.74) NS (0.12) NS (0.28) NS (0.41) NS (0.18) NS (0.40) NS (0.17)
Table 1: Cumulative effect of training system, spacing, and rootstock on number and size of fruit, tree yield and
growth, yield efficiency and root suckers of 4th leaf 'Bartlett' pear trees, Hopland, Mendocino County, California,
2013-2016.
1 Within columns, treatment means significantly different (Tukey HSD test, P <0.05). 2 *, **, *** Indicate significance at P <0.05, 0.01, 0.001 respectively. NS indicates not significant. 3 Average fruit size 2014 to 2016. 4 Based on cumulative yield (2014-16) and final TCSA (2016). 5 Root sucker data normalized, SQRT (root suckers+1.0) for P -values..
2-Leader 2.0 b 197 0.40 ab 14.8 c 0.03 ab 23.7 b 0.04 223 b 0.35 a Bi-axis# 1.5 b 180 0.30 b 39.2 a 0.01 c 26.2 b 0.02 229 b 0.17 ab Tall Spindle 2.2 ab 175 0.41 ab 19.3 b 0.02 b 33.1 a 0.02 249 a 0.10 b V-Trellis 3.0 a 176 0.59 a 18.4 b 0.03 a 32.8 a 0.04 228 b 0.18 ab Spacing1 3 feet 2.0 ab 193 0.41 22.6 0.02 28.4 0.03 239 a 0.21 4.5 feet 1.9 b 181 0.36 22.9 0.02 29.2 0.03 228 b 0.17 6 feet 2.7 a 172 0.50 23.3 0.02 29.3 0.04 229 b 0.22 Rootstock1 Pyrodwarf 2-33 1.4 b 171 ab 0.27 b 20.3 c 0.02 b 25.6 c 0.03 b 233 ab 0.20 OHxF 69 2.2 b 166 b 0.40 b 25.8 a 0.02 b 33.2 a 0.02 b 237 a 0.16 OHxF 87 3.0 a 208 a 0.60 a 22.7 b 0.03 a 28.9 b 0.04 a 225 b 0.24 ANOVA (P -values)2 Training ***(<0.001) NS (0.53) ***(<0.001) ***(<0.001) ***(<0.001) ***(<0.001) NS (0.09) ***(<0.001) *(0.04) Spacing * (0.02) NS (0.43) NS (0.07) NS (0.58) NS (0.32) NS (0.58) NS (0.20) **(0.003) NS (0.90) Rootstock ***(<0.001) **(0.002) ***(<0.001) ***(<0.001) ***(<0.001) ***(<0.001) **(0.01) NS (0.08) NS (0.64) Block ***(<0.001) **(0.01) ***(<0.001) ***(<0.001) ***(<0.001) ***(<0.001) ***(<0.001) NS (0.02) NS (0.59) Interaction (P -values)2
Table 2: Effect of training system, spacing, and rootstock on number and size of fruit, tree yield and growth, yield efficiency and root suckers of 4th leaf 'Bartlett' pear trees, Hopland, Mendocino County, California, 2016.
1 Within columns, treatment means significantly different (Tukey HSD test, P <0.05). 3 Measured 10 cm above union. 5 Average height of Bi-axis and 2-leader scaffolds. 2 *, **, *** Indicate significance at P <0.05, 0.01, 0.001 respectively. NS indicates not significant. 4 Measured 5 cm below union. 6 Yield efficiency and root sucker data normalized,
# Total of two scaffolds
Harvest date, 8/8/2016
SQRT(value+1) for P -value.
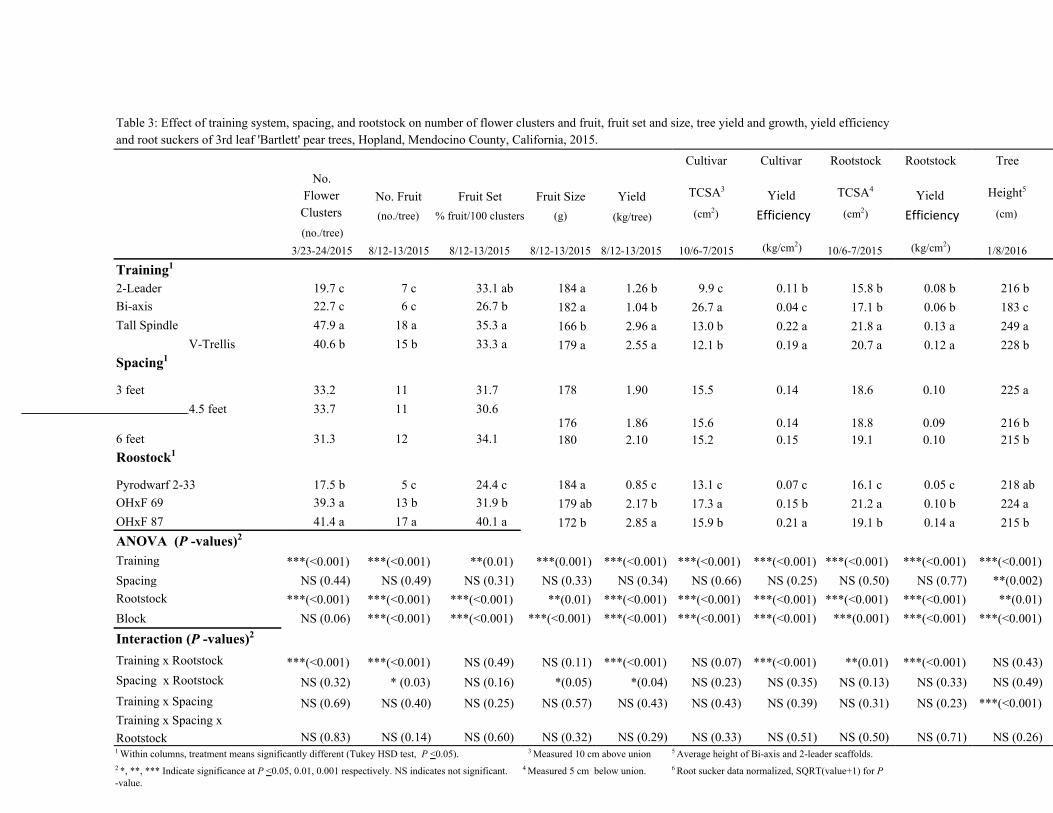
Table 3: Effect of training system, spacing, and rootstock on number of flower clusters and fruit, fruit set and size, tree yield and growth, yield efficiency and root suckers of 3rd leaf 'Bartlett' pear trees, Hopland, Mendocino County, California, 2015.
Training1 2-Leader 19.7 c 7 c 33.1 ab 184 a 1.26 b 9.9 c 0.11 b 15.8 b 0.08 b 216 b Bi-axis 22.7 c 6 c 26.7 b 182 a 1.04 b 26.7 a 0.04 c 17.1 b 0.06 b 183 c Tall Spindle 47.9 a 18 a 35.3 a 166 b 2.96 a 13.0 b 0.22 a 21.8 a 0.13 a 249 a
Pyrodwarf 2-33 17.5 b 5 c 24.4 c 184 a 0.85 c 13.1 c 0.07 c 16.1 c 0.05 c 218 ab OHxF 69 39.3 a 13 b 31.9 b 179 ab 2.17 b 17.3 a 0.15 b 21.2 a 0.10 b 224 a OHxF 87 41.4 a 17 a 40.1 a 172 b 2.85 a 15.9 b 0.21 a 19.1 b 0.14 a 215 b ANOVA (P -values)2 Training ***(<0.001) ***(<0.001) **(0.01) ***(0.001) ***(<0.001) ***(<0.001) ***(<0.001) ***(<0.001) ***(<0.001) ***(<0.001) Spacing NS (0.44) NS (0.49) NS (0.31) NS (0.33) NS (0.34) NS (0.66) NS (0.25) NS (0.50) NS (0.77) **(0.002) Rootstock ***(<0.001) ***(<0.001) ***(<0.001) **(0.01) ***(<0.001) ***(<0.001) ***(<0.001) ***(<0.001) ***(<0.001) **(0.01) Block NS (0.06) ***(<0.001) ***(<0.001) ***(<0.001) ***(<0.001) ***(<0.001) ***(<0.001) ***(0.001) ***(<0.001) ***(<0.001)
Interaction (P -values)2 Training x Rootstock ***(<0.001) ***(<0.001) NS (0.49) NS (0.11) ***(<0.001) NS (0.07) ***(<0.001) **(0.01) ***(<0.001) NS (0.43) Spacing x Rootstock NS (0.32) * (0.03) NS (0.16) *(0.05) *(0.04) NS (0.23) NS (0.35) NS (0.13) NS (0.33) NS (0.49) Training x Spacing NS (0.69) NS (0.40) NS (0.25) NS (0.57) NS (0.43) NS (0.43) NS (0.39) NS (0.31) NS (0.23) ***(<0.001) Training x Spacing x Rootstock NS (0.83) NS (0.14) NS (0.60) NS (0.32) NS (0.29) NS (0.33) NS (0.51) NS (0.50) NS (0.71) NS (0.26) 1 Within columns, treatment means significantly different (Tukey HSD test, P <0.05). 3 Measured 10 cm above union 5 Average height of Bi-axis and 2-leader scaffolds. 2 *, **, *** Indicate significance at P <0.05, 0.01, 0.001 respectively. NS indicates not significant. 4 Measured 5 cm below union. 6 Root sucker data normalized, SQRT(value+1) for P -value.
Table 4: Effect of training system, spacing, and rootstock on the amount of fruit dropped or removed from 'Bartlett' pear 3rd-4th leaf trees, Hopland, Mendocino County, California, 2015-2016.
Dropped and Removed Fruit (% / per tree) 6/10-11/2015 6/6 & 17/2016 Training1 2-Leader 18.9 a 3.3 b Bi-axis 18.5 a 0.1 b Tall Spindle 4.3 b 18.5 a V-Trellis 5.4 b 3.0 b Spacing1 3 feet 14.4 7.2 4.5 feet 10.0 7.0 6 feet 11.1 4.4 Rootstock1 Pyrodwarf 2-33 13.0 4.6 OHxF 69 13.1 6.9 OHxF 87 9.3 7.1 ANOVA2 (P -values) Training ***(<0.0001) *** (<0.001) Spacing NS (0.08) NS (0.67) Rootstock NS (0.13) NS (0.83) Block NS (0.11) NS (0.06) Interaction2 P -values
Training x Rootstock NS (0.33) NS (0.49) Spacing x Rootstock * (0.02) NS (0.30) Training x Spacing NS (0.19) NS (0.67) Training x Spacing x Rootstock NS (0.84)
~3 1 Within columns, treatment means significantly different (Tukey HSD test, P <0.05). 2 *, *** Indicate significance at P <0.05 and 0.001. NS indicates not significant.
Table 5: Effect of training system, spacing, and rootstock on firmness and soluble solids of 3rd-4th leaf 'Bartlett' pear trees, Hopland, Mendocino County, California, 2015-2016.
Firmness (kg. force) Soluble Solids (°Brix)
8/12-13/2015 8/8/2016 8/12-13/2015 8/8/2016 Training1 2-Leader 9.4 ab 8.8 14.1 12.9 a Bi-axis 9.5 a 8.7 13.9 12.2 b Tall Spindle 9.4 ab 8.5 14 12.5 ab V-Trellis 9.1 b 8.6 14.1 12.8 a Spacing1 3 feet 9.4 8.6 13.9 12.6 ab 4.5 feet 9.3 8.6 14.1 12.4 b 6 feet 9.4 8.7 14.1 12.9 a Rootstock1
Pyrodwarf 2-33 9.5 8.7 13.7 b 12.3 b OHxF 69 9.3 8.6 14.0 ab 12.6 ab OHxF 87 9.2 8.7 14.4 a 12.9 a ANOVA2 (P -values) *(0.02) NS (0.24) NS (0.53) ** (0.002) Training NS (0.82) NS (0.44) NS (0.64) ** (0.01) Spacing NS (0.19) NS (0.85) **(0.01) *** (0.001) Rootstock *(0.03) *(0.04) *(0.03) NS (0.36) Block Interaction2 P -values
Training x Rootstock NS (0.54) NS (0.07) **(0.01) NS (0.39) Spacing x Rootstock NS (0.56) NS (0.15) NS (0.18) NS (0.91) Training x Spacing NS (0.28) NS (0.92) NS (0.13) NS (0.23) Training x Spacing x Rootstock NS (0.43) NS (0.18)
1 Within columns, treatment means significantly different (Tukey HSD test, P <0.05). 2 *, ** Indicate significance at P <0.05, 0.01. NS indicates not significant.
Table 6: Cumulative effect of rootstock on fruit number and size, tree yield and growth, yield efficiency and root suckers of completely unpruned 4th leaf 'Bartlett' pear trees, Hopland, Mendocino County, California, 2013-2016.
1 Within columns, treatment means significantly different (Duncan Multiple Range test, P <0.05). 2 *, **, *** Indicate significance at P <0.05, 0.01, and 0.001 respectively. NS indicates not significant. 3 Based on fruiting years 2014-2016. 4 Based on cumulative yield (2014-2016) and final TCSA (2016).
Table 7: Effect of rootstock on firmness and soluble solids of completely unpruned 3rd-4th leaf 'Bartlett' pear trees, Hopland, Mendocino County, California, 2015-2016.
Block NS (0.20) NS (0.24) **(0.01) * (0.03) 1 Within columns, treatment means significantly different (Duncan multiple range test), P <0.05).
Table 8 : Effect of rootstock on number and size of fruit, tree yield and growth, yield efficiency and root suckers of completely unpruned 'Bartlett' pear trees, Hopland, Mendocino County, California, 2016.
Cultivar Cultivar Rootstock Rootstock Tree Root No. Fruit Fruit Size Yield TCSA3 Yield Efficiency TCSA4 Yield Efficiency Height Suckers (no./tree) (g) (kg/tree) (cm2) (kg/cm2) (cm2) (kg/cm2) (cm) (no./tree) Treatment1 8/8/2016 8/8/2013 8/8/2016 11/18/2016 11/18/2016 11/18/2016 11/18/2016 OHxF 69 18.7 a 196 3.2 24.4 0.14 a 42.3 0.08 a 282 a 0.0 OHxF 87 8.9 b 186 1.6 20.9 0.08 b 36.8 0.05 b 245 b 0.0 ANOVA (P -values)2
Treatment * (0.02) NS (0.44) ** (0.01) NS (0.06) * (0.04) NS (0.09) * (0.04) ** (0.01) ~ Block NS (0.19) NS (0.29) NS (0.21) NS (0.11) NS (0.62) NS (0.27) NS (0.79) ** (0.004) ~ 1 Within columns, treatment means significantly different (Tukey HSD test, P <0.05). 2 *, ** Indicate significance at P <0.05 and 0.01 respectively. NS indicates not significant. 3 Measured 10 cm above union. 4 Measured 5 cm below union. Harvest date: 8/8/16
Table 9: Effect of rootstock on number of clusters and fruit, fruit set and size, tree yield and growth, yield efficiency and root suckers of completely unpruned 'Bartlett' pear trees, Hopland, Mendocino County, California, 2015.
Cultivar Cultivar Rootstock Rootstock Tree Root
No. Clusters No. Fruit2 Fruit Set Fruit Size Yield TCSA3 Yield Efficiency TCSA4 Yield Efficiency Height Suckers3
Block ** <(0.001) * <(0.001) ** (0.01) NS (0.44) *** (0.001) NS (0.13) *** <(0.001) NS (0.11) *** <(0.001) ** (0.01) ~ 1 Within columns, treatment means significantly different (Duncan multiple range test), P <0.05). 2 **, *** Indicate significance at P <0.01, 0.001 respectively. NS indicates not significant. 3 Measured 10 cm above union 4 Measured 5 cm below union. Harvest date: 8/12/15
Table 10: Cumulative effect of scaffold spreading on number and size of fruit, tree yield and growth, yield efficiency, and root suckers of 4th leaf Bi-axis-trained 'Bartlett' pear trees on OHxF 87 rootstock, Hopland, Mendocino County, California, 2013-2016.
Table 11: Effect of scaffold spreading on number and size of fruit, tree yield and growth, yield efficiency, and root suckers of 4th leaf Bi-axis-trained 'Bartlett' pear trees on OHxF 87 rootstock, Hopland, Mendocino County, California, 2016.
No. Fruit
Fruit Size
Yield
Cultivar TCSA3
Cultivar Yield
Efficiency
Rootstock TCSA
Treatment1 (per tree) (g) (kg/tree) (cm2)
Spreading 12.4 188 2.2 58.2
No Spreading 20.2 188 3.8 59.2
P -value2 NS (0.13) NS (0.96) NS (0.10) NS (0.9Rootstock
Yield
Tree Height
Root Suckers
1 Means analyzed by T-test, P <0.05).
2 ** Indicates significance at P <0.01. NS indicates not significant. 3 Average of two scaffolds.
Table 12: Effect of scaffold spreading on number of clusters and fruit, fruit set, fruit size, tree yield and growth and yield efficiency of 3rd leaf Bi-axis-trained 'Bartlett' pear trees on OHxF 87 rootstock, Hopland, Mendocino County, California, 2015.
No. Clusters No. Fruit (per scaffold) Fruit Set (%fruit/100 clusters)
North South Total North South Average Scaffold Scaffold (per tree) (cm2) (kg/cm2) Scaffold Scaffold (per tree)
Spreading 0.65 0.46 1.11 22.4 0.44 158 169 164
No Spreading 0.50 0.43 0.92 24.2 0.34 211 216 213
P -value2 NS(0.09) NS(0.71) NS(0.14) NS(0.60) NS(0.06) ** (0.01) ** (0.003) ** (0.002) 1 Means analyzed by T-test, P <0.05).
2 ** Indicates significance at P <0.01. NS indicates not significant.
Table 13: Effect of scaffold spreading on firmness and soluble solids on Bi-axis-trained 3rd-4th leaf 'Bartlett' pear trees on OHxF 87 rootstock, Hopland, Mendocino County, California, 2015-2016.
Firmness (kg force)
2015
Soluble Solids (°Brix)
Firmness (kg force)
20163
Soluble Solids (°Brix)
Treatment1
South North Scaffold Scaffold
Average (per tree)
North South Average Scaffold Scaffold (per tree)
Spreading 8.4 8.8 8.7 14.0 14.5 14.4 8.2 13.1
No Spreading 8.20 8.6 8.7 14.2 14.3 14.3 8.3 13.1
P -value2 NS(0.55) NS(0.60) NS(1.00) NS(0.69) NS(0.38) NS(0.73) NS(0.84) NS(0.86) 1 Means analyzed by T-test, P<0.05). 2 ** Indicates significance at P <0.01. NS indicates not significant. 3Harvest date: 8/17/15, Testing dates: 8/24-31/16. 4Harvest date 8/8/16, tested 8/26, 28 & 31.
Figure 1: Effect of training system and spacing on seasonal average mid-day stem water potential (MSWP) of 2nd-4th leaf "Bartlett" pear trees on Pyro 2-33 rootstock, Hopland, Mendocino County, California, 2014-2016.
Figure 2: Effect of training system and spacing on seasonal average mid-day stem water potential (MSWP) of 2nd-4th leaf "Bartlett" pear trees on OHxF 87 rootstock, Hopland, Mendocino County, California, 2014-2016.
Irrigation on * Ground damp, irrigation recently on # hazy or very cloudy w weather station down X No data
Figure 3. Effect of training system and spacing on weekly mid-day stem water potential (MSWP) of 4th-leaf 'Bartlett' pear trees on Pyro 2-33 rootstock, Hopland, Mendocino County, California, 2016.
* Ground Damp + hazy clouds # Too cloudy H harvesting other orchards S skipped -
sample testing P Prepare for Pear Festival
Figure 4. Effect of training system and spacing on weekly mid-day stem water potential (MSWP) 3rd-leaf 'Bartlett' pear trees on Pyro 2-33 rootstock, Hopland, Mendocino County, California, 2015.
Irrigation on * Ground damp, irrigation recently on # hazy or very cloudy w weather station down X No data
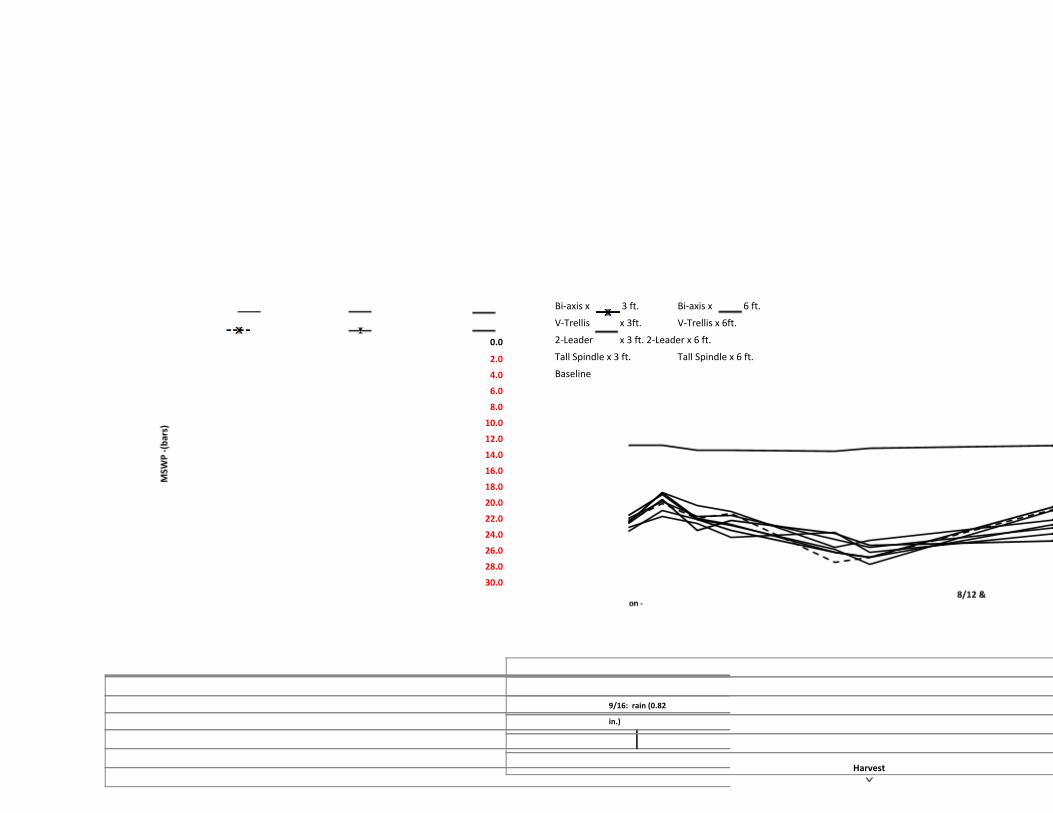
Figure 5. Effect of training system and spacing on weekly mid-day stem water potential (MSWP) of 4th-leaf 'Bartlett' pear trees on OHxF 87 rootstock, Hopland, Mendocino County, California, 2016.
Bi-axis x 3 ft.
Bi-axis x 6 ft. V-Trellis x 3ft.
V-Trellis x 6ft.
2-Leader x 3 ft.
2-Leader x 6 ft. Tall Spindle x 3 ft. Tall Spindle x 6 ft. Baseline
* Damp $ hazy clouds/high scattered clouds # Very cloudy X No data
Figure 6. Effect of training system and spacing on weekly mid-day stem water potential (MSWP) 3th leaf OHxF 87 'Bartlett' pear trees, Hopland, Mendocino County, California, 2015.