The External Environment for Developing Countries Overview This brief was prepared by the Development Economics Prospects Group (DECPG) with colleagues from PRMTR and IFC (Risk/ Economics). The team is comprised of Mick Riordan (OECD, currencies), Jean-Pierre Chauffour, Mariem Malouche and Stacy Chow (trade), Shane Streifel (commodities), Eung Ju Kim (finance), Allen Dennis (IP and Europe) and Sabah Mirza (Annex). Facundo Martin and Gaurav Sinha of IFC prepared the Market Focus on EM equities. And John Baffes authored the Focus section on grain market developments. The report was prepared under the guidance of Andrew Burns of DECPG. This note reflects the views of the team, but is not formally cleared by the World Bank Group. September 2010 Following a strong second-quarter 2010 performance for the OECD economies, a better than anticipated expansion is now foreseen for the second half of 2010, albeit at a slower pace than the first half. Domestic demand in most mature economies—the United States and the European Union, but not Japan—expanded at the fastest pace since early 2006. [This suggests a phase change in the recov- ery process, where a policy switch from demand to supply support may be advisable]?. Backing that con- clusion, industrial production growth has been easing globally, since early 2010 in emerging economies and since late spring in mature ones, as capacity constraints become more binding. Compared with the pre-summer turmoil, the situation in the European Union has broadly stabi- lized, though recent run-ups in CDS swap rates and higher bond premiums vis-a-vis Germany continues as a concern for several Euro Area economies. The expected and necessary fiscal consoli- dation in most E.U. member states (and in other mature economies) may also pose a potential threat to economic growth, if not accompanied by growth-enhancing structural reforms. Despite wheat price spikes, ample production and stocks should preclude a generalized rise in food prices. Nevertheless, certain world regions (Middle East and North Africa, and South Asia) may be more affected by the combined effects of the weather-related supply shock and the policy actions under- taken by some key exporters (a temporary export ban by Russia). On the other hand, other key commodi- ties (notably oil) have experienced relatively stable prices, on the back of large stocks and the expansion of non-OPEC production (see FOCUS). Disparate developments in trade are being observed in mature and emerging economies. At the same time as import demand from the largest emerging markets has been moderating, that in some ma- ture economies has been increasing again. The aggregate value of global goods exports was up 25% in the first half of 2010, compared with 2009, coming to breach pre-crisis levels. But the momentum of trade growth has slowed substantially, with global export volumes now growing by a 2.1% annualized pace (from 32% at the start of 2010 (saar)). On the political economy front, additional trade-distorting meas- ures have been enacted, albeit as a reply to a supply shock. Capital flows to developing countries have only partially recovered. This remains true even in spite of the significant reduction observed in August, as this reflects a typical seasonal hiatus: year to date flows are still up 60% compared with 2009, led by private sector bond issuance. Syndicated bank loans lag sig- nificantly below their pre-crisis levels. (add sentence: Basel, EU restrictions, EM equities) Second-quarter GDP growth slows in U.S. [h^ J[j[h… mola_m ch Eoli Zih_ growth at seasonally-adjusted annualized rates 0 2 4 6 United States Japan Euro Area Q4-2009 Q1-2010 Q2-2010 Source: National Agencies through Datastream. Domestic demand growth was robust in the United States and Europe in Q2-10 domestic demand, growth at seasonally adjusted annualized rates -2 -1 0 1 2 3 4 5 United States Japan Euro Area Q4-2009 Q1-2010 Q2-2010 Source: World Bank, DEC Prospects Group.
Transcript
The External Environment for Developing Countries
Overview
This brief was prepared by the Development Economics Prospects Group (DECPG) with colleagues from PRMTR and IFC (Risk/
Economics). The team is comprised of Mick Riordan (OECD, currencies), Jean-Pierre Chauffour, Mariem Malouche and Stacy
Chow (trade), Shane Streifel (commodities), Eung Ju Kim (finance), Allen Dennis (IP and Europe) and Sabah Mirza (Annex).
Facundo Martin and Gaurav Sinha of IFC prepared the Market Focus on EM equities. And John Baffes authored the Focus section
on grain market developments. The report was prepared under the guidance of Andrew Burns of DECPG. This note reflects the
views of the team, but is not formally cleared by the World Bank Group.
September 2010
Following a strong second-quarter 2010 performance for the OECD economies, a better than anticipated expansion is now foreseen for the second half of 2010, albeit at a slower pace than the first half. Domestic demand in most mature economies—the United States and the European Union, but not Japan—expanded at the fastest pace since early 2006. [This suggests a phase change in the recov-ery process, where a policy switch from demand to supply support may be advisable]?. Backing that con-clusion, industrial production growth has been easing globally, since early 2010 in emerging economies and since late spring in mature ones, as capacity constraints become more binding.
Compared with the pre-summer turmoil, the situation in the European Union has broadly stabi-lized, though recent run-ups in CDS swap rates and higher bond premiums vis-a-vis Germany continues as a concern for several Euro Area economies. The expected and necessary fiscal consoli-dation in most E.U. member states (and in other mature economies) may also pose a potential threat to economic growth, if not accompanied by growth-enhancing structural reforms.
Despite wheat price spikes, ample production and stocks should preclude a generalized rise in food prices. Nevertheless, certain world regions (Middle East and North Africa, and South Asia) may be more affected by the combined effects of the weather-related supply shock and the policy actions under-taken by some key exporters (a temporary export ban by Russia). On the other hand, other key commodi-ties (notably oil) have experienced relatively stable prices, on the back of large stocks and the expansion of non-OPEC production (see FOCUS).
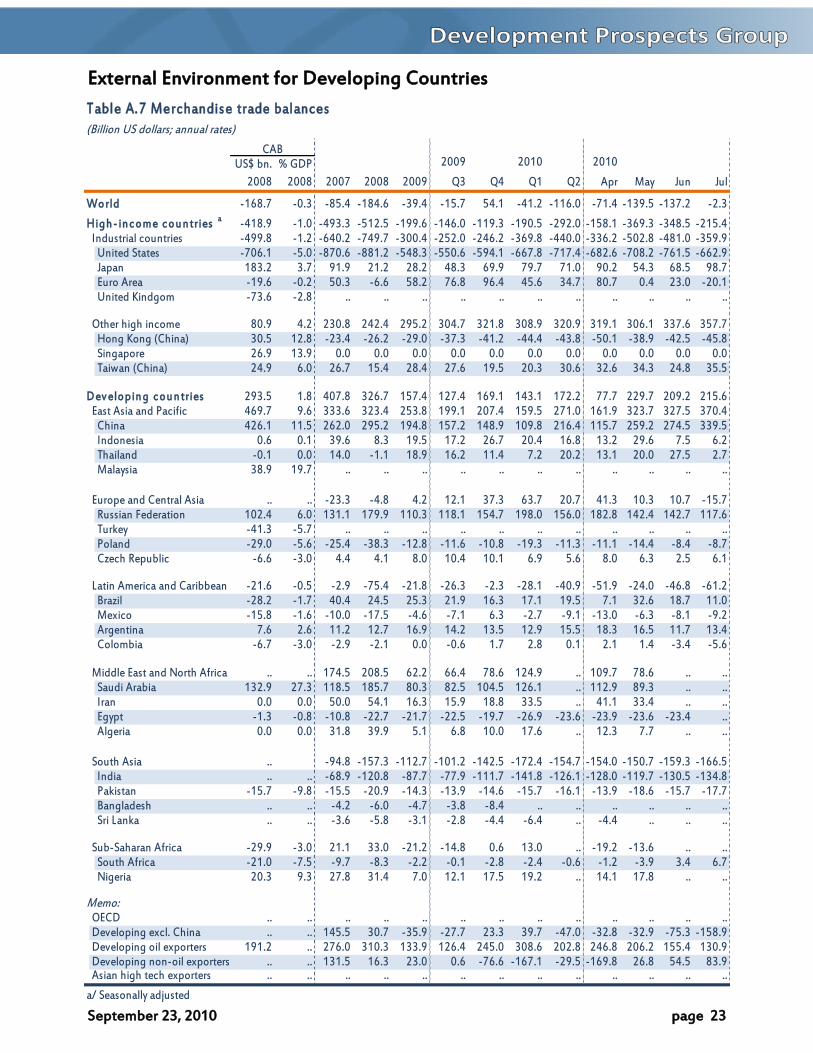
Disparate developments in trade are being observed in mature and emerging economies. At the same time as import demand from the largest emerging markets has been moderating, that in some ma-ture economies has been increasing again. The aggregate value of global goods exports was up 25% in the first half of 2010, compared with 2009, coming to breach pre-crisis levels. But the momentum of trade growth has slowed substantially, with global export volumes now growing by a 2.1% annualized pace (from 32% at the start of 2010 (saar)). On the political economy front, additional trade-distorting meas-ures have been enacted, albeit as a reply to a supply shock.
Capital flows to developing countries have only partially recovered. This remains true even in spite of the significant reduction observed in August, as this reflects a typical seasonal hiatus: year to date flows are still up 60% compared with 2009, led by private sector bond issuance. Syndicated bank loans lag sig-nificantly below their pre-crisis levels. (add sentence: Basel, EU restrictions, EM equities)
Second-quarter GDP growth slows in U.S. [h^ J[j[h… mola_m ch Eoli Zih_
growth at seasonally-adjusted annualized rates
0
2
4
6
United States Japan Euro Area
Q4-2009
Q1-2010
Q2-2010
Source: National Agencies through Datastream.
Domestic demand growth was robust in the United States and Europe in Q2-10
domestic demand, growth at seasonally adjusted annualized rates
-2
-1
0
1
2
3
4
5
United States Japan Euro Area
Q4-2009 Q1-2010 Q2-2010
Source: World Bank, DEC Prospects Group.
September 23, 2010 page 2
External Environment for Developing Countries
Global Indicators
(Percentage change per annum, unless otherwise specified)
2008 2009e 2010f 2011f
GDP volume: World 1.5 -2.1 3.3 3.3 Memo item: World GDP at PPP weights 1.3 -0.4 4.2 4.0 High-income countries 0.2 -3.3 2.3 2.4 Developing countries 5.7 1.8 6.2 6.0 Industrial production: World 0.5 -8.1 ... ... High-income countries -1.7 -12.4 ... ... Developing countries 5.8 1.4 ... ...
Source: DECPG, September, 2010. Estimates and projections for 2009 through 2011 based on GEP-2010 up-
date of June 9, 2010.
Note: a. Gross inflows 2010 based on preliminary year-to-date figures. Figures in bold represent changes this
month.
September 23, 2010 page 3
External Environment for Developing Countries
OECD Developments
Reported second-quarter growth masked under-lying developments. Though the third quarter of 2010 is coming to a close, understanding second quarter GDP returns for the United States, Japan and the Euro Area is important for assessing the state of the global economy for the second half of 2010. Market impressions of U.S. GDP (1.6%, saar) were ‚^cm[jjichncha‛, qcnb aliqnb mb[p_^ `lig 5% ch nb_ final quarter of 2009. And the sharp downturn in Ja-j[h’m GDP ni 1.5% (m[[l) `lig 5% ^olcha nb_ `clmn quarter of 2010 was further sign that the global _]ihigs ]iof^ \_ `[]cha [ ‚^io\f_ ^cj‛. M[le_n dcn-ters were eased by stellar growth in Germany (9%, saar) with external trade contributing 4 points to growth and investment (notably construction) surg-ing 20% and adding another 4 points. The Euro Area as a group experienced 3.9% GDP gains during the quarter, fastest in more-than 10 years.
Domestic demand robust in United States and Europe. Abstracting from developments in interna-tional trade during the quarter, it is clear that do-mestic demand growth in the United States and the Euro Area moved up briskly to recent highs—4.8% and 3.1% respectively. For the United States, domes-tic demand growth—comprising 20% fixed invest-ment, 4% government and 2% private consumption gains—is the strongest since the first quarter of 2006. For Europe, domestic absorption—7.7% fixed investment, and 2% in government and personal out-lays—also matches the performance of early 2006. This in turn suggests that public sector stimulus measures have played an important role in recent growth dynamics. In contrast, after supporting Ja-j[h’m aliqnb ch jl_pciom j_lci^m, ^ig_mnc] ^_g[h^ declined 0.4 percent in the second quarter.
A divergence in trade. Real imports of goods and services surged 32.4% (saar) in the United States, with net-exports reducing GDP growth in the second quarter by 3.7 points. Capital and consumer goods dominated imports, suggesting that a further rebuild of stocks was in process. In Japan, goods exports dropped sharply (7% in July, saar) as demand in China and other East Asia waned while the yen jumped to 15-year highs knocking a percentage point from growth. But export volumes in Germany ratcheted to a 37% advance in the quarter, under-pinned by shipments to Asia and the United States. The magnitudes these of trade developments are likely not sustainable. And as trade smoothes in step with declining global momentum now in evidence, domestic demand will take a larger stake in shaping growth through the remainder of 2010.
OECD growth for the second quarter may set the stage for stronger-than-anticipated economic activity in the second half of 2010, albeit moderating from first-half performance. Domestic demand in the United States and Europe stepped-up quickly; in the former, reported GDP was reduced by a surge in imports; in the Euro Area, a broader pick-up in consumer spending and investment complemented an improvement in trade.
Second-quarter GDP growth slows in U.S. [h^ J[j[h… mola_m ch Eoli Zih_
growth at seasonally-adjusted annualized rates
0
2
4
6
United States Japan Euro Area
Q4-2009
Q1-2010
Q2-2010
Source: National Agencies through Datastream.
Domestic demand growth
-2
-1
0
1
2
3
4
5
6
United States
Japan Euro Area
Q4-2009
Q1-2010
Q2-2010
Foreign contribution to GDP
-4
-3
-2
-1
0
1
2
3
4
United States
Japan Euro Area
Dig_mnc] ̂ _g[h^ ch U.S. [h^ Eolij_… offset and amplified by external tradegrowth at seasonally-adjusted annualized rates contributions to growth a annualized rates
Source: World Bank, DEC Prospects Group.
Second-quarter surge in trade unlikely to be sustained
U.S real imports of goods and services; German real exports of goods and services
-40
-30
-20
-10
0
10
20
30
40
Q1 2008 Q3 2008 Q1 2009 Q3-2009 Q1 2010
U.S. imports
German exports
Source: Thomson/Datastream and DEC Prospects Group
September 23, 2010 page 4
External Environment for Developing Countries
Despite soft labor markets and faltering wage growth, U.S. consumers continued to spend in July and August, a sign that domestic demand could carry a firm– through moderating tone into the second half of 2010. In-dustry growth is adjusting to the post-crisis environment, as inventories, sales and orders align to a view for only moderate activity ahead. Stagnant labor markets present the key headwind to growth looking forward.
Retail spending up. That U.S. domestic demand has the ability to sustain a firm tone in the second half of 2010 is evidenced by retail sales, which increased for a second month in August. Sales moved up 0.5% (m/m), or when volatile autos are excluded, increased 0.8% oh^_ljchh_^ \s ‚\[]e ni m]biif‛ m[f_m. Tb_ l_-cent upturn is shifting momentum back toward posi-tive ground, following a falloff from 9% growth in the first quarter to decline of 2.7% in July (saar). Broader measures of real outlays (PCE, which in-cludes services) are moving toward decline however, as household savings are rebuilt. Saving increased by 0.7 percent of income since October 2009 to a 6.1% rate in July. A key question for the outlook: will cur-rent saving levels suffice to permit consumers to spend with more vigor?; or will soft labor markets impose a still-tougher restraint on spending?
Manufacturing in better balance. Factory output gained 0.2% in August (m/m), for a 12th advance in the last 14 months. But the pace of growth has eased such that momentum has dropped to 4.5%, half the rate of the second quarter. This slowdown may be pc_q_^ [m [ ‚hilg[fct[ncih‛ `lig li\omn jimn-crisis recovery growth, as inventory-sales ratios have moved back into line (1.26 in July, down from an ex-cessive 1.48 at the start of 2009); and momentum of capital goods orders has dropped from earlier vi-brant growth (2.9% in the three months to July con-nl[mn_^ qcnb 55% ch nb_ `clmn ko[ln_l (m[[l)). Ih^omnls’m moderating tone is reflected in PMI surveys, with ISM activity falling from 60.4 in April to 56.3 in Au-gust (still above the 50 threshold for growth). Ser-vices sales are coming closer to that inflection point however, standing at 51.5 in the month, and likely to lead a softening profile of demand moving forward.
Jobs stagnant, wages falter. Following a series of welcome employment gains in the first 5 months of 2010 (1 million jobs), almost 300,000 positions have been lost over June to August. The finish to govern-ment home-buying incentives yielded a collapse in housing starts and further decline in construction employment. And improving job trends in services have given way to stagnation. Combined with slack labor markets, a slowdown in hourly earnings contin-ues, reaching growth of just 1.7% (y/y) in August. On a brighter note, new unemployment claims fell for a fourth successive week to September 10. In broader terms, evidence from previous recessions following financial crises suggests that a large loss of potential GDP has occurred, and hence that making inroads into unemployment may prove difficult. This places the U.S. labor market at the fore of forecasts risks.
U.S. retail up monthly in July & Augustbut momentum has faded as savings riseretail ex autos and real-PCE, ch% (saar) [L]; personal saving rate (%) right
4
5
6
7
8
-30
-25
-20
-15
-10
-5
0
5
10
Jan-09 Apr-09 Jul-09 Oct-09 Jan-10 Apr-10 Jul-10
Retail excluding autos (left scale)
Personal consumption (left scale)
Source: U.S. Department of Commerce.
U.S. employment growth stagnant while hourly earnings drop to 1.7% growth (y/y)
change in non-`[lg _gjfisg_hn (‘000), [L_`n]; biolfs _[lhcham (ch%, year/year)
U.S. factory output easing with I/S in better balance and orders down manufacturing production, ch% (saar) [Left]; capital goods orders, ch% (saar) [Right]
-60
-40
-20
0
20
40
60
-25
-20
-15
-10
-5
0
5
10
15
Jan-09 Apr-09 Jul-09 Oct-09 Jan-10 Apr-10 Jul-10
Capital goods orders, [right scale]
Source: Thomson/Datastream and DECPG calculations.
Mfgr production [left scale]
September 23, 2010 page 5
External Environment for Developing Countries
J[j[h’m `[fn_lcha aliqnb ch nb_ m_]ih^ ko[ln_l `ioh^ liinm ch [ l_nl_[n i` ^ig_mnc] ^_g[h^ l[nb_l nb[h ch _r-ternal trade developments. Volatility in the political situation depressed consumer and business sentiment. But appreciation of the yen to 15-year highs vs. the dollar (on a carry-nl[^_ q[p_, il [m ‚m[`_ b[p_h‛), [``_]n_^ exports and deflation expectations, prompting the Ministry of Finance to intervene to weaken the yen.
Demand falters. Following strong 2.3% gains in Japanese domestic demand during the first quarter, absorption retrenched substantially in the second. Household spending grew 2.2% in the first quarter (saar)—accounting for 1.3 points of the 5% GDP ad-vance—but nil in the second. This was linked to expi-ration of incentives for purchase of efficient autos, appliances and electronics—but clearly goes beyond such expiry. Business investment was moribund (up 1%, saar), well below Tankan expectations. And the winding down of stimulus measures led government spending to a weak 0.2% gain. While net exports subtracted a full point from growth, the remaining 2.5-point slowdown is tied to domestic outturns. This stands in stark contrast with developments in the United States and Europe, and does not bode j[lnc]of[lfs q_ff `il J[j[h’m h_[l-term outlook.
Political tensions, fiscal stimulus, and the yen. On the political front, struggles within the DPJ ap-pear to have eased with the recent defeat of Ichiro Ozawa in party elections. Prime Minister Naoto Kan announced a new Cabinet on September 17, with a fresh economic team, while retaining Finance Min-ister Yoshihiko Noda, a key player in recent efforts to weaken the yen. Indeed, the government promptly announced an $11 billion stimulus pack-age. The move of the yen to levels as strong as ¥82.5 against the dollar (8.6% gain over the year-to-date) prompted the MOF to intervene through sales of some $20 billion in yen securities on September 15, eliciting strongly worded reactions from abroad. Such appear not to have dissuaded Japanese au-thorities, as the countries goods export volumes have plummeted to decline of 7% in July from growth of 55% in February 2010 (saar), a drop in
which the rise of the yen has clearly played a role.
Germany spurs Euro Zone growth. Euro Area growth in the second quarter tripled from 1.3% in the first quarter to 3.9% (saar). GDP gains were driven by strong export performance as well as a re-balancing toward domestic demand—private invest-ment and consumption. However, these figures mask the underlying performance of individual countries. Much of the increase was due to a stellar 9% ad-vance in Germany, thanks to very strong exports. Ireland, Finland and Sweden also garnered strong gains; in contrast Greek GDP fell 6.8%. As global trade is easing, and with several Euro Zone countries announcing fiscal austerity measures to reign in their budget deficits, the pace of growth in Europe is likely to slow into the second half of 2010.
J[j[h’m 2nd quarter growth falters on weaker net exports and consumer spending
3.4
5.0
1.5
-2
0
2
4
6
Q4-2009 Q1-2010 Q2-2010
Prv Consumption Gvt Consumption Fixed Investmentchange in Stocks Net Exports GDP
Source: Japan Cabinet Office, MITI.
growth of real GDP, and contributions to growth in percentage points
J[j[h’m _rjiln pifog_m ̀ [ff ni h_a[ncp_ alioh^ on weaker Asian demand and stronger yen
goods export volumes, ch% (saar) [Left]; yen per U.S. dollar [right]
84
86
88
90
92
94
96
98
100
-75
-50
-25
0
25
50
75
Jan-09 May-09 Sep-09 Jan-10 May-10 Sep-10
Export volumes [left scale]
Yen per U.S. dollar [right scale]
Source: Thomson/Datastream and DECPG calculations.
-8-6-4-202468
1012
IRL DEUSWE FIN BEL NLD FRA ITA PRT ESP NORGRC
Euro zone growth mixed across countries
Germany
September 23, 2010 page 6
External Environment for Developing Countries
European growth surprised well to the upside in the second quarter, with a much better balanced and stronger profile of domestic demand and exports. Though a portion of the pickup in growth may be attributed to snap-back from adverse weather conditions in the first quarter, there was sufficient breadth of recovery across countries, and depth across demand components to offer some optimism that firmer economic activity could persist into the short-term before faltering by end-2010.
Indicators point to slowdown. Indicators have be-gun pointing to a European growth slowdown. The PMI new orders index has continued to fall from its March peak, in part due to a drop in export orders. Further, August results from the ZEW survey of in-vestor expectations in Germany reveal that, while current conditions are perceived to be favorable, investors expect that these conditions will deterio-rate over the next six months. The index dropped sharply from a reading of 14.6 in July to minus 4.3 in August. Further, increased risk premiums in the in-terbank and sovereign bond markets—due to con-tinued concern regarding the sustainability of public debt in some Euro Zone countries—is keeping the cost of capital at high levels. And the latest ECB sur-vey provides evidence of renewed tightening of bank credit standards for businesses. This will limit the extent to which credit growth can support recov-ery (see Finance).
Fiscal austerity measures announced in selected Euro Zone countries are a concern for growth prospects. Aided by government stimulus measures the contribution of government to GDP growth in the Euro Area has been positive. Hence the an-nounced fiscal cuts by Euro Zone countries are likely to further slow already softening growth prospects in for the second half of 2010. The announced meas-ures in several countries include: pension and tax system reforms, freezes in public sector pay, cuts in public investment, and reduction of welfare pro-grams such as subsidies to parents. Germany has an-nounced the largest cuts to date, amounting to €80bn. But these are to be phased in over the period to 2013, placing the cumulative reduction in budget shortfall at 3% of GDP over 2010 to 2015.
SPACE— BASEL… EU l_mnlc]ncihm ih ^_lcp[ncp_m _n]
Source: CESIFO
-10
0
10
20
30
40
50
60
Nov-09 Feb-10 May-10 Aug-10
Investor expectations of future economic conditions on downward
path in Germany
ZEW
Industrial production, ch% (3m/3m, saar)
Source: World Bank,DEC Prospects Group
U.S. LIBOR easing on expectations of continued loose policy on part of the Fed
Industrial production is decelerating globally. With the winding down of government stimulus programs, waning effect of the inventory cycle and slowdown in global trade, industrial production—though expanding—is doing so at a more moder-ate rate. The easing of industrial growth momen-tum in the BRIC countries, all of which experienced a faster rebound in production than high-income countries, has been ongoing since January 2010, dropping from 18.3% in January to 3.6% in July, (3m/3m, saar). In high-income countries, industrial production momentum began declining in May 2010 (dropping from 12.6% in May to 10.8% in June). The faster rebound in BRIC production has helped them to regain their pre-crisis output lev-els, in contrast with high-income countries that are yet to reach such point.
The deceleration in IP expansion is more marked in export-dependent economies. Ja-j[h’m ionjon gig_hnog b[m mb_^ 23 jichnm i` growth from its peak in January; China dropped 14 points from its March peak, and Germany 8 points from its May peak. In contrast, in the United States—less of an export-dependent economy—production growth momentum in recent months has been firming-up, reflecting the strength in re-covery of domestic demand. In July U.S wholesale inventories, powered by demand for business equipment, were up 1.3%, the strongest gain in two years. And despite continued weaknesses in the labor market, August retail sales were up 0.5%, the best outturn in 5 months.
Latest PMI indices for manufacturing paint a mixed picture. Globally, manufacturing PMI data remains above 50, signaling continued expansion. However, the headline index has been falling for four consecutive months through August, confirm-ing a continued slowing in global manufacturing output. In the Euro Zone, the August PMI decline is consistent with the moderation in industrial pro-duction witnessed. In the United States, the PMI survey for manufacturing showed a rise in August from 55.5 to 56.3, consistent with a firming of pro-duction. However, with the global slowdown, it is hin ]f_[l biq fiha nbcm qcff ]ihncho_. Cbch[’m Ao-gust PMI rebounded marginally, ending a three-month decline that took the July figure below the critical 50 mark.
Gfi\[f ch^omnlc[f jli^o]ncih cm hiq mfiqcha l[nb_l mb[ljfs ch [ jli]_mm i` ‚hilg[fct[ncih‛ `iffiqcha robust post-crisis gains. The slowdown is being led by the developing countries, where initial recov-ery had been more substantial. PMI indices, inventory-sales ratios, factory orders and a concomitant slowing of world trade growth point to a continuation of softer production growth.
0
2
4
6
8
10
12
14
16
18
20
Nov-09 Jan-10 Mar-10 May-10 Jul-10
Industrial growth momentum slows down across regions (3mm, saar)
BRC
HIY
DEV
2010 Peak
2010 Peak
51
52
53
54
55
56
57
58
59
Nov-09 Jan-10 Mar-10 May-10 Jul-10
Global PMI for manufacturing output continues downsllide
-10-505
101520253035
Nov-09 Feb-10 May-10
In contrast with other economies, industrial production firms up in the US
(3mm, saar)CHNDEUJPNUSA
September 23, 2010 page 8
External Environment for Developing Countries
International Trade
World merchandise recovered gradually to reach pre-crisis levels. Global goods export value increased by 25% in the first half of 2010 com-pared to the same period in 2009. This marks a dra-matic recovery, after the value of exports plunged 31% in the first half of 2009 contrasted with 2008. The recovery was supported by a sharp pick-up in export volumes due to economic recovery and in-ventory restocking earlier this year. Global export volumes increased by 22% percent during the first half of 2010 compared to the same period in 2009. But trade volume growth has slowed markedly to-ward more normalized levels (world exports ad-vanced at a 2.1% annualized rate as of June). Still, the World Bank is projecting world trade to re-cover by 11.2% in volume terms in 2010.
Import into the BRICs slowing; U.S. and Japa-nese imports gain momentum. BRICs (Brazil, Russia, India and China), and China in particular led the global trade recovery in late 2009. By Decem-ber 2009 import volumes exceeded their pre-crisis levels. In comparison, import demand from the United States, the Euro Area and Japan recovered more slowly. Imports gained momentum in the sec-ond quarter of 2010, and volumes recovered to pre-crisis peaks by June 2010. While the U.S. recovery was mainly driven by domestic demand, respond-ing in part to fiscal stimulus, recovery in Japan was export-led. The Euro Area offers a mixed picture: recovery in absorption as well as exports, thanks to the strong export performance in Germany.
Trade-distorting measures continue to accu-mulate. As of August 2010, Global Trade Alert, a W o r l d B a n k s p o n s o r e d w e b p o r t a l (www.globaltradealert.org), reports that countries worldwide implemented 638 trade-distorting measures since the G20 Summit of November 2008. Indeed, 2/3 of the measures were imple-mented by the G20, of which top users include the European Union, India, Indonesia and Russia. The recent surge in wheat prices offered an illustration i` mig_ ]iohnlc_m’ jlij_hmcns ni l_]iolm_ ni nl[^_ restricting measures. For example, Russia imposed a ban on grain exports from August 2010 to the end of the year, in response to smaller domestic yields due to drought and fires. This ban will most likely affect countries in the Middle East and South Asia, such as Pakistan and Egypt, which rely to a large extent on imports of Russian grains. Some importing countries, such as Morocco, aimed to mitigate domestic prices by temporarily removing import tariffs on wheat.
World merchandise trade has recovered to pre-crisis levels after a sharp increase in the first quarter of 2010. While an early rebound in developing countries trade led the recovery, U.S. and Japan import demand is gaining momentum. The G20 continue to accumulate trade-distorting measures despite commitments to ab-stain. Recent increase in wheat prices led to confined trade protectionist measures .
World trade growth has recovered to pre-crisis levels
US and Japan import demand gaining momentum
Import volume growth, saar, %, June 2008—August 2010
An unabated accumulation of trade distorting measures
-60
-50
-40
-30
-20
-10
0
10
20
30
40
0
200
400
600
800
1000
1200
08 Jan Jul 09 Jan Jul 10 Jan
Export volume $ billion (left scale)
Export volume s saar % (right scale)
-80
-60
-40
-20
0
20
40
60
80
100
08Jun Sept Dec Mar Jun Sept Dec Mar Jun
BRICs
Euro Area
Japan
US
395
638
70108120
204
G20 Worldwide
Measures that are Discriminatory
Measures that may Discriminate
Trade Liberalizing Measures
September 23, 2010 page 9
External Environment for Developing Countries
Commodity Prices
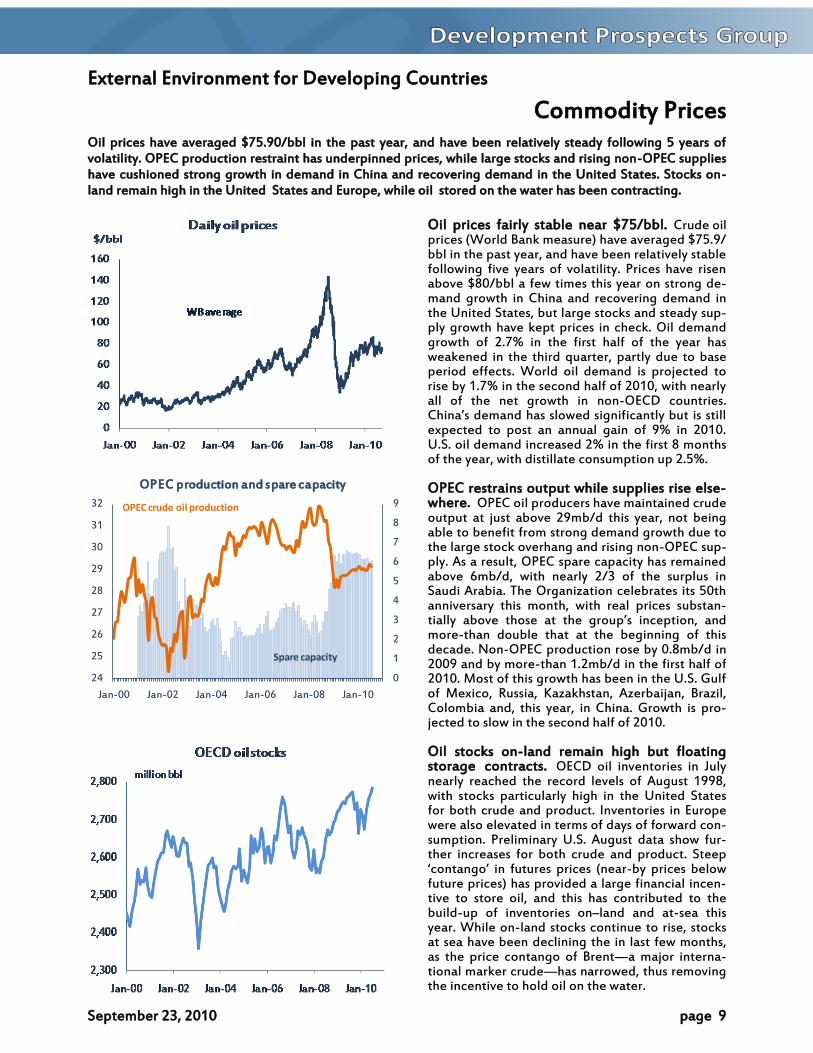
Oil prices fairly stable near $75/bbl. Crude oil prices (World Bank measure) have averaged $75.9/bbl in the past year, and have been relatively stable following five years of volatility. Prices have risen above $80/bbl a few times this year on strong de-mand growth in China and recovering demand in the United States, but large stocks and steady sup-ply growth have kept prices in check. Oil demand growth of 2.7% in the first half of the year has weakened in the third quarter, partly due to base period effects. World oil demand is projected to rise by 1.7% in the second half of 2010, with nearly all of the net growth in non-OECD countries. Cbch[’m ^_g[h^ b[m mfiq_^ mcahc`c][hnfs \on cm mncff expected to post an annual gain of 9% in 2010. U.S. oil demand increased 2% in the first 8 months of the year, with distillate consumption up 2.5%. OPEC restrains output while supplies rise else-where. OPEC oil producers have maintained crude output at just above 29mb/d this year, not being able to benefit from strong demand growth due to the large stock overhang and rising non-OPEC sup-ply. As a result, OPEC spare capacity has remained above 6mb/d, with nearly 2/3 of the surplus in Saudi Arabia. The Organization celebrates its 50th anniversary this month, with real prices substan-nc[ffs [\ip_ nbim_ [n nb_ alioj’m ch]_jncih, [h^ more-than double that at the beginning of this decade. Non-OPEC production rose by 0.8mb/d in 2009 and by more-than 1.2mb/d in the first half of 2010. Most of this growth has been in the U.S. Gulf of Mexico, Russia, Kazakhstan, Azerbaijan, Brazil, Colombia and, this year, in China. Growth is pro-jected to slow in the second half of 2010. Oil stocks on-land remain high but floating storage contracts. OECD oil inventories in July nearly reached the record levels of August 1998, with stocks particularly high in the United States for both crude and product. Inventories in Europe were also elevated in terms of days of forward con-sumption. Preliminary U.S. August data show fur-ther increases for both crude and product. Steep ‘]ihn[hai’ ch `onol_m jlc]_m (h_[l-by prices below future prices) has provided a large financial incen-tive to store oil, and this has contributed to the build-up of inventories on–land and at-sea this year. While on-land stocks continue to rise, stocks at sea have been declining the in last few months, as the price contango of Brent—a major interna-tional marker crude—has narrowed, thus removing the incentive to hold oil on the water.
Oil prices have averaged $75.90/bbl in the past year, and have been relatively steady following 5 years of volatility. OPEC production restraint has underpinned prices, while large stocks and rising non-OPEC supplies have cushioned strong growth in demand in China and recovering demand in the United States. Stocks on-land remain high in the United States and Europe, while oil stored on the water has been contracting.
0
1
2
3
4
5
6
7
8
9
24
25
26
27
28
29
30
31
32
Jan-00 Jan-02 Jan-04 Jan-06 Jan-08 Jan-10
OPEC production and spare capacity
Spare capacity
OPEC crude oil production
September 23, 2010 page 10
External Environment for Developing Countries
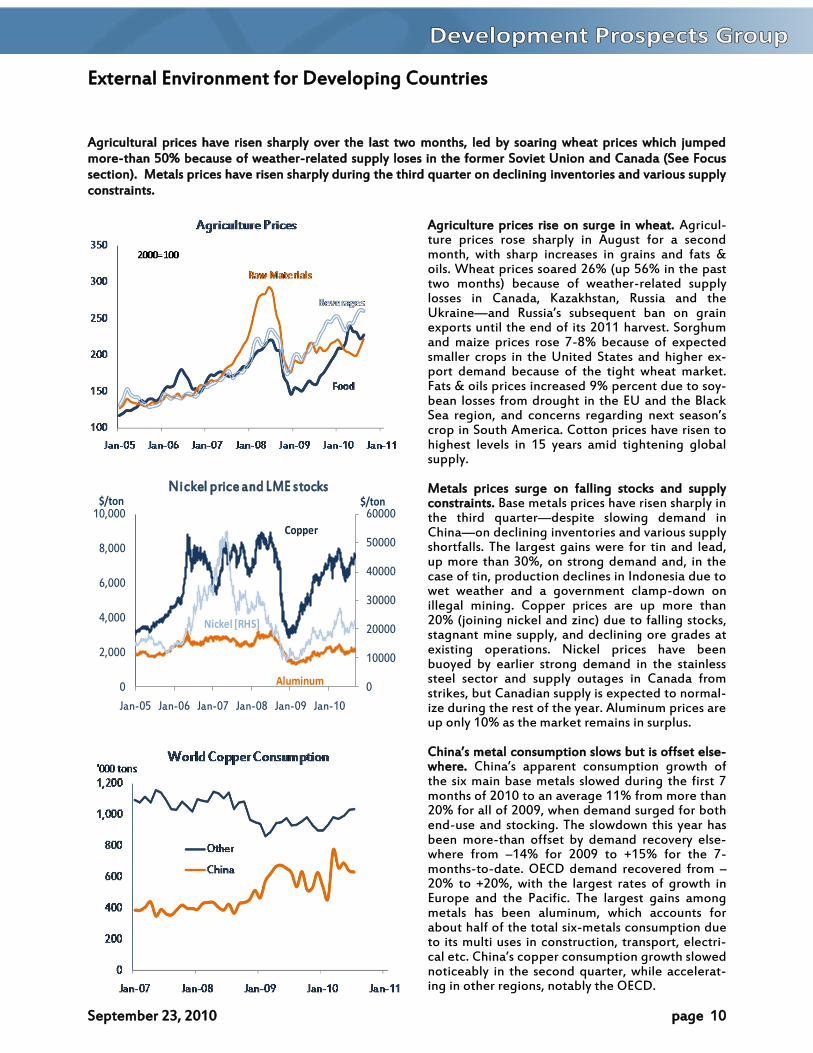
Agriculture prices rise on surge in wheat. Agricul-ture prices rose sharply in August for a second month, with sharp increases in grains and fats & oils. Wheat prices soared 26% (up 56% in the past two months) because of weather-related supply losses in Canada, Kazakhstan, Russia and the Ukraine—[h^ Rommc[’m mo\m_ko_hn \[h ih al[ch exports until the end of its 2011 harvest. Sorghum and maize prices rose 7-8% because of expected smaller crops in the United States and higher ex-port demand because of the tight wheat market. Fats & oils prices increased 9% percent due to soy-bean losses from drought in the EU and the Black S_[ l_acih, [h^ ]ih]_lhm l_a[l^cha h_rn m_[mih’m crop in South America. Cotton prices have risen to highest levels in 15 years amid tightening global supply. Metals prices surge on falling stocks and supply constraints. Base metals prices have risen sharply in the third quarter—despite slowing demand in China—on declining inventories and various supply shortfalls. The largest gains were for tin and lead, up more than 30%, on strong demand and, in the case of tin, production declines in Indonesia due to wet weather and a government clamp-down on illegal mining. Copper prices are up more than 20% (joining nickel and zinc) due to falling stocks, stagnant mine supply, and declining ore grades at existing operations. Nickel prices have been buoyed by earlier strong demand in the stainless steel sector and supply outages in Canada from strikes, but Canadian supply is expected to normal-ize during the rest of the year. Aluminum prices are up only 10% as the market remains in surplus. Cbch[’m g_n[f ]ihmogjncih mfiqm \on cm i``m_n _fm_-where. Cbch[’m [jj[l_hn ]ihmogjncih aliqnb i` the six main base metals slowed during the first 7 months of 2010 to an average 11% from more than 20% for all of 2009, when demand surged for both end-use and stocking. The slowdown this year has been more-than offset by demand recovery else-where from –14% for 2009 to +15% for the 7-months-to-date. OECD demand recovered from –20% to +20%, with the largest rates of growth in Europe and the Pacific. The largest gains among metals has been aluminum, which accounts for about half of the total six-metals consumption due to its multi uses in construction, transport, electri-][f _n]. Cbch[’m ]ijj_l ]ihmogjncih aliqnb mfiq_^ noticeably in the second quarter, while accelerat-ing in other regions, notably the OECD.
Agricultural prices have risen sharply over the last two months, led by soaring wheat prices which jumped more-than 50% because of weather-related supply loses in the former Soviet Union and Canada (See Focus section). Metals prices have risen sharply during the third quarter on declining inventories and various supply constraints.
0
10000
20000
30000
40000
50000
60000
0
2,000
4,000
6,000
8,000
10,000
Jan-05 Jan-06 Jan-07 Jan-08 Jan-09 Jan-10
Nickel price and LME stocks$/ton
Copper
Aluminum
Nickel [RHS]
$/ton
September 23, 2010 page 11
External Environment for Developing Countries
International Finance
Weak flows in August. Capital flows fell sharply in August, down 59% from the previous month. But year-to-date flows remain 60% higher than the like pe-riod of 2009, due largely to robust bond flows. Though bond issues faltered in August (historically the slowest month for issuance), emerging market borrowers have raised a record $118 billion thus far this year, taking advantage of extra low funding costs and growing investor appetite for EM bonds. In con-trast with 2009, the private sector, led by Latin American companies, has dominated issuance activ-ity in 2010, accounting for 46% of bonds sold year-to-date versus 16% in 2009. The pace of borrowing activity is likely to pick up in September and October given a strong pipeline. Equity issuance has also been robust in 2010 due to strong flows into China. Bank lending is up slightly from last year, but it has yet to recover from the market collapse in late 2008.
A tale of two markets. After showing signs of re-vival in early 2010, the syndicated loan market has failed to rebound to pre-crisis levels thus far this year. With volumes of $77 billion in 2010, this has not been the main source of debt financing for EM bor-rowers. And this is particularly true for Emerging Europe (notably Russia), where bank loans were a ]lcnc][f miol]_ i` `ch[h]cha `il nb_ jlcp[n_ m_]nil’m hard-currency needs. In the years before the credit crisis, syndicated lending to emerging markets was about 2-3 times as large as international bond issu-ance. In contrast, EM bond issuance is on course to reach record volumes this year amid a favorable mar-ket environment. Some of the issuance activity is generated by lack of alternative sources, as difficul-ties in obtaining bank loans are forcing companies to turn to the international bond markets.
Renewed sovereign debt jitters. Investor concern about the fiscal health of some Euro Zone economies has resurfaced recently as witnessed in widening CDS spreads for select sovereigns and elevated bond yields across the region. Spreads for Ireland, Greece, and Portugal began to increase in early-August, wid-ening as much as 237 basis points, while Spanish spreads have remained relatively steady. Despite the watershed events of the European Financial Stability Facility (EFSF) and the European bank stress test, concerns about long-term risks continued to over-hang many of these countries. Ireland came under particular scrutiny as bank funding pressures resur-faced, leading to a fresh high in Irish CDS spreads in mid-September. But recent bond issues from Ireland, Greece, and Spain have helped to ease tensions in the European debt markets—at least for the moment.
Capital flows into developing countries fell sharply in August. But year-to-date flows are up significantly from the like period of 2009, led by a surge in bond issuance. Syndicated bank lending remains subdued with over-all volumes still to recover to pre-crisis levels; bond issuance activity is at a record pace this year. European debt concerns have resurfaced recently, with CDS spreads rising once more in Ireland, Greece, and Portugal.
0
200
400
600
800
1000
1200
Oct-09 Dec-09 Feb-10 Apr-10 Jun-10 Aug-10
Greece
Portugal
Ireland
Spain
5-year sovereign CDS spreads (bps)
Sovereign debt of some European countries is under pressure once again
0
40
80
120
160
200
240
280
320
2005 2006 2007 2008 2009 2010e
Bond issuance
Bank lending
Bank lending has failed to recover to pre-crisis levels
$ billion
Capital flows to emerging markets s lowed in August
$ billion 2008
Total H1 Total Jan-Aug H1 Jun Jul Aug YTD
Total 390 110 353 167 196 27 52 21 268
Bonds 65 36 115 56 86 6 23 9 118
Banks 257 43 129 63 54 10 13 10 77
Equity 68 32 109 48 56 11 15 3 74
Lat. America 90 37 137 55 64 11 11 6 80
Bonds 20 15 62 22 36 4 10 5 51
E. Europe 157 22 72 39 51 9 13 4 69
Bonds 35 13 33 23 31 2 9 1 41
Asia 98 44 122 62 66 6 24 10 99
Bonds 7 6 16 8 14 0.4 2.7 3 20
Others 45 7 22 11 15 1 3 1 20
Source: DECPG
2009 2010
September 23, 2010 page 12
External Environment for Developing Countries
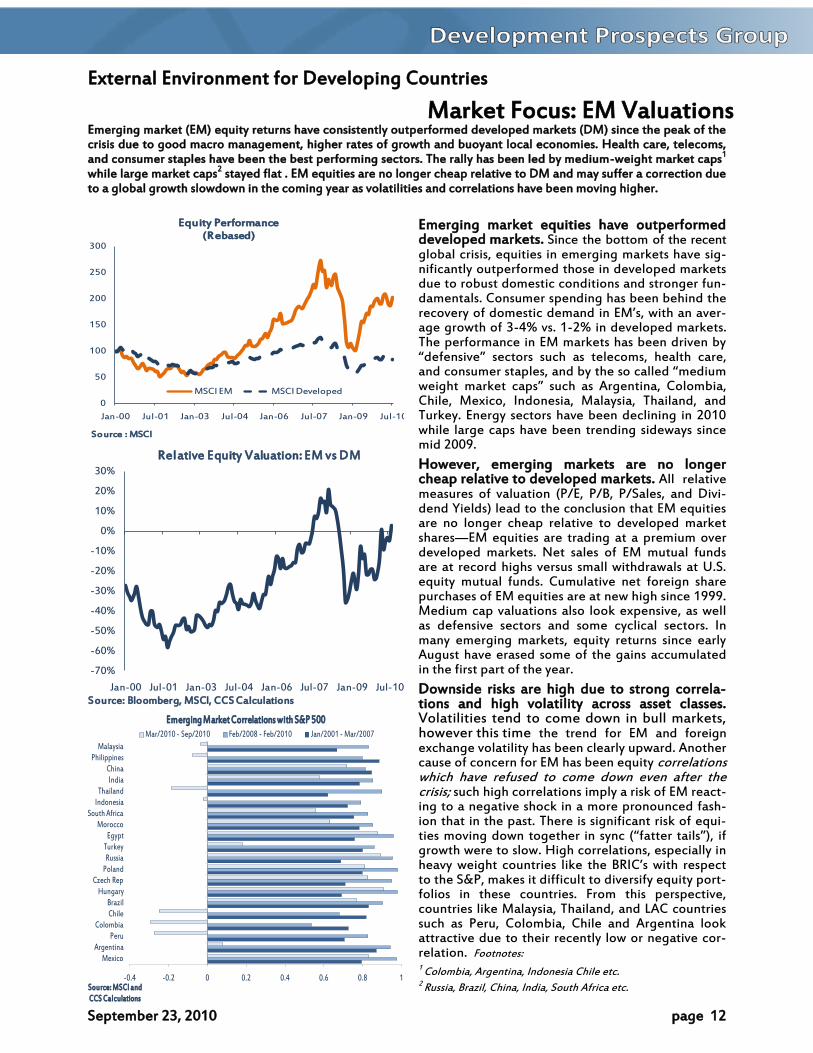
Emerging market (EM) equity returns have consistently outperformed developed markets (DM) since the peak of the crisis due to good macro management, higher rates of growth and buoyant local economies. Health care, telecoms, and consumer staples have been the best performing sectors. The rally has been led by medium-weight market caps1 while large market caps2 stayed flat . EM equities are no longer cheap relative to DM and may suffer a correction due to a global growth slowdown in the coming year as volatilities and correlations have been moving higher.
Emerging market equities have outperformed developed markets. Since the bottom of the recent global crisis, equities in emerging markets have sig-nificantly outperformed those in developed markets due to robust domestic conditions and stronger fun-damentals. Consumer spending has been behind the l_]ip_ls i` ^ig_mnc] ^_g[h^ ch EM’m, qcnb [h [p_l-age growth of 3-4% vs. 1-2% in developed markets. The performance in EM markets has been driven by ‚^_`_hmcp_‛ m_]nilm mo]b [m n_f_]igm, b_[fnb ][l_, [h^ ]ihmog_l mn[jf_m, [h^ \s nb_ mi ][ff_^ ‚g_^cog q_cabn g[le_n ][jm‛ mo]b [m Ala_hnch[, Cifig\c[, Chile, Mexico, Indonesia, Malaysia, Thailand, and Turkey. Energy sectors have been declining in 2010 while large caps have been trending sideways since mid 2009.
However, emerging markets are no longer cheap relative to developed markets. All relative measures of valuation (P/E, P/B, P/Sales, and Divi-dend Yields) lead to the conclusion that EM equities are no longer cheap relative to developed market shares—EM equities are trading at a premium over developed markets. Net sales of EM mutual funds are at record highs versus small withdrawals at U.S. equity mutual funds. Cumulative net foreign share purchases of EM equities are at new high since 1999. Medium cap valuations also look expensive, as well as defensive sectors and some cyclical sectors. In many emerging markets, equity returns since early August have erased some of the gains accumulated in the first part of the year.
Downside risks are high due to strong correla-tions and high volatility across asset classes. Volatilities tend to come down in bull markets, however this time the trend for EM and foreign exchange volatility has been clearly upward. Another cause of concern for EM has been equity correlations which have refused to come down even after the crisis; such high correlations imply a risk of EM react-ing to a negative shock in a more pronounced fash-ion that in the past. There is significant risk of equi-nc_m gipcha ^iqh nia_nb_l ch msh] (‚`[nn_l n[cfm‛), c` growth were to slow. High correlations, especially in b_[ps q_cabn ]iohnlc_m fce_ nb_ BRIC’m qcnb l_mj_]n to the S&P, makes it difficult to diversify equity port-folios in these countries. From this perspective, countries like Malaysia, Thailand, and LAC countries such as Peru, Colombia, Chile and Argentina look attractive due to their recently low or negative cor-relation. Footnotes: 1 Colombia, Argentina, Indonesia Chile etc. 2 Russia, Brazil, China, India, South Africa etc.
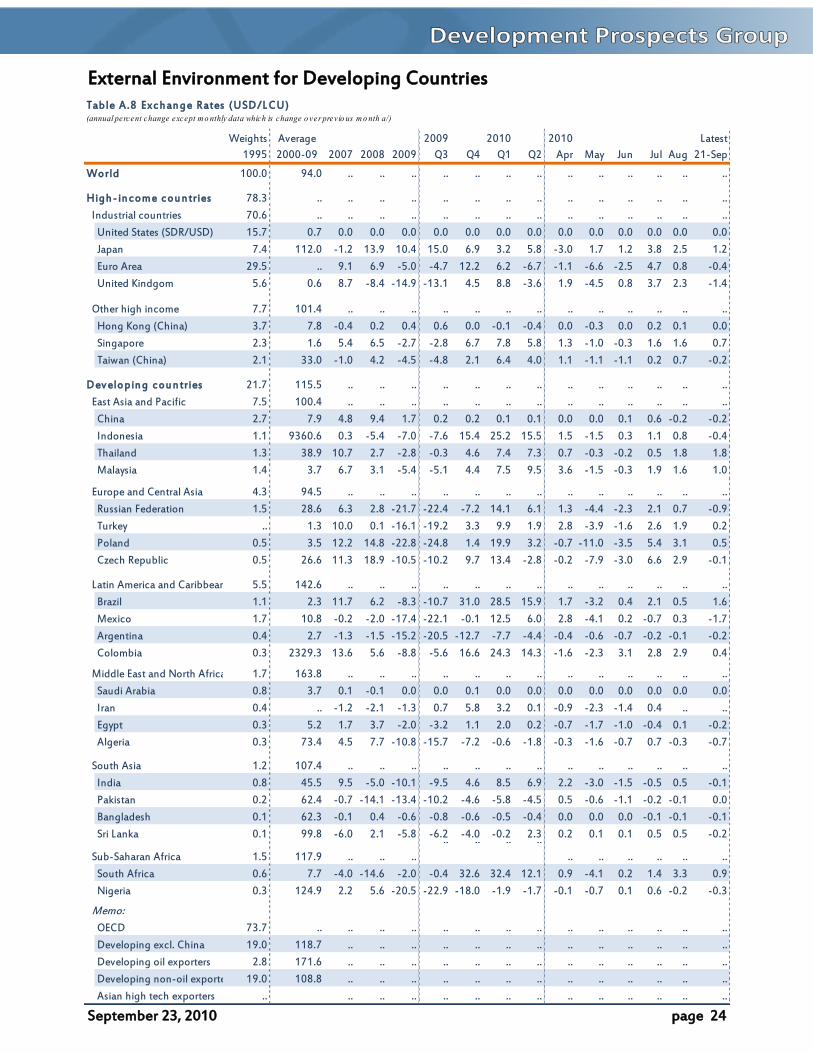
Y_h’m gip_ ni h_[l ¥80 jligjnm chn_lp_hncih. The yen has been appreciating sharply and continu-ously against the dollar since May, picking up 12.2% in the process, to reach a 15-year high of ¥83 on Sep-n_g\_l 14. F[]nilm ^lcpcha nb_ s_h’m lcm_ ch]fo^_ nb_ om_ i` nb_ ]oll_h]s ch mig_ncg_m fo]l[ncp_ ‚][lls nl[^_m‛, nb_ pc_q i` nb_ s_h [m [ ‚m[`_ b[p_h‛ ]ol-rency during the recent euro/dollar volatility tied to sovereign debt difficulties in Europe and an erstwhile favorable economic outlook for Japan. Observing the effects of the strong yen on exports, and the poten-tial for worsening deflationary trends, the Govern-ment of Naoto Kan embarked on unsterilized inter-vention on September 15, which sufficed to weaken the yen/dollar rate by 3.5% to ¥85.88 by the 17th of the month. Over the year to date, the yen is up 7.5% vs. the dollar and 18.8% vis-à-vis the euro.
Real effective exchange rates mixed. Given the broad rise– and then fall of the dollar against many emerging market currencies since the start of 2009, compounded by volatility in the dollar/euro cross rate, it is no surprise that real effective rates (REER) for the dollar and yen have been rising only moder-ately since the start of 2010, while that for the euro (here, Germany), has been easing. For the high-income countries, current REER levels remain below those prevailing in January 2009. In contrast, appre-ciating nominal currencies and a tendency toward tailing-off in inflation pressure have served to boost REERs for Brazil, Russia and India substantially. Re-cent modest gains of the Chinese RMB (1.2% vs. the dollar since March), together with only moderate inflation, has seen the RMB-REER up by 6.5% from its recent November 2009 trough.
Headline inflation easing broadly. With the nota-\f_ _r]_jncih i` Ih^c[, ‚b_[^fch_‛ CPI ch`f[ncih (c._. including prices of food and fuel) has been moderat-ing, or moving within a narrow band since the start of 2010. For the G-3 countries, while Japan remains in deflation, U.S. and German inflation have been mov-ing within a 0-2% band (year-over-year), converging more recently to a 1% pace. Inflation in Brazil ap-pears to have stabilized near 5% (still high), while sluggish economic activity in Russia has yielded a halving of inflation to 6% from mid-2009. Ih^c[’m double-digit inflation grounded in strong growth and higher commodity prices is an element of concern to the authorities, and several monetary tightening measures have been introduced to stem a further sharp move-up in prices. And in China, cumulative stimulus– food prices and other factors have CPI now moving above 3% from nil in late 2009.
Continued appreciation of the yen/dollar rate brought Japanese authorities to intervene on Septem-ber 15 to weaken the currency. Real effective exchange rates for the BRICs have been appreciating over the course of 2010, largely reflecting gains in nominal exchange rates. Headline inflation con-tinues to ease broadly across major centers, with the notable exceptions of India and China.
82.50
85.00
87.50
90.00
92.50
95.001.180
1.220
1.260
1.300
1.340
1.380
1.420
1.460
Jan-10 Mar-10 May-10 Jul-10 Sep-10
yen/USDUSD/Euro (inverse)
Eoli jc]em oj gi^_mnfs…. Japan weakens yen at 15-year high vs USD
USD per Euro (inverse) [Left] and Yen per USD [right]
Source: Thomson/Datastream and DECPG calculations.
Mixed developments in real effective exchange rates
real effective exchange rates, indexes, January 2009 = 100
85
95
105
115
125
2009M01 2009M05 2009M09 2010M01 2010M05
USAGermanyJapanChinaRussiaBrazilIndia
Source: IMF and DEC Prospects Group.
Headline CPI inflation broadly easingsave for India and China
USA Germany JapanChina Russia BrazilIndia Industrial production, ch% (3m/3m, saar)
Source: IMF and DEC Prospects Group.
September 23, 2010 page 14
External Environment for Developing Countries
Focus: Developments in international grain markets
Wheat prices surged in 2007 and 2008, reaching $420/ton by March 2008, the highest in real terms since 1973. With the onset of the financial crisis and two record harvests that restored global supplies, wheat prices declined below $200/ton by June 2010, still 50% higher than the 2000-2005 nominal average. Prices began rising once more in July reaching $290/ton in early August, following weather-related developments in Central Asia and Canada and subsequently the export ban by Russia. The price increases sparked fears of a repeat of the 2007/08 food price spike. The removal of subsidies on a number of commodities by the government of Mozambique (including fuel, electricity and bread) caused damage in Maputo, and numerous deaths.
The wheat market was considered oversupplied as recently as June. But news that the heat wave in Europe and Central Asia would affect the cur-l_hn m_[mih’m ]lij ]b[ha_^ nb_ ionfiie. Wheat prices began rising, with the nearby Chicago futures contract reaching $267/ton on August 4, up 65% from its June 29 closing. On August 5, the govern-ment of Russia announced a 5-month ban on grain exports; while in early September the ban was ex-tended until the end of the 2010-11 crop year. Though the effect of the Russian embargo on global grain markets may not have been that important—following the drought Russia was not going to export wheat apart from exports that had been agreed prior to the ban—but the announcement raised fears that other countries could follow suit, and global prices reacted to both contingencies. Indeed, Russia pro-posed that Kazakhstan and Belarus, which are Cus-toms Union members, also suffering from drought, ban grain exports as well.
Other grains have reacted modestly to the run up in wheat prices. Though maize prices are up 30% since June, soybean prices are up just 8%, and rice prices were unchanged during the last few months. Global market conditions are very different today than they were two years ago, thus reducing the likelihood of a generalized run-up in prices. Moreover, wheat markets differ substantially from other grain markets. Current high grain prices are driven by weather-related conditions in the wheat market; in 2007/08 they were driven by policy-induced actions in the rice market (in addition to a host of other factors). Wheat is widely traded, and the wheat market is less concentrated than the rice market, giving individual producers less pricing power. Wheat also has more substitutes than rice.
Concerns over grain supplies due to adverse weather in Central Asia--a region that hosts key grain supplier--and a subsequent ban on wheat exports by Russia, caused wheat prices to rally, reaching almost $270/ton at the beginning of August, up 65 percent from a month earlier. Despite fears of a generalized hike in food prices, global market conditions are very different now than they were two years ago. Thus barring policy actions and/or severe crop failures, a major food price surge is
0
200
400
600
800
1,000
Jan-04 Jan-05 Jan-06 Jan-07 Jan-08 Jan-09 Jan-10
Wheat, Maize, and Rice Prices, monthly averages, US$/ton
Wheat daily prices for 2010, CME Nearby contract, US$/ton
Announcement of the export ban by Russia (August 5)
Weather-related problems began unfolding
Source: DECPG
Source: Chicago Mercantile Exchange
Source: DECPG
September 23, 2010 page 15
External Environment for Developing Countries
Global supplies for all grains are much higher now than in 2007/08. Even with the Russian drought, the latest USDA global production pro-jection of 643 MT for the 2010/11 crop year im-plies a stock-to-use ratio of 0.26 next year. Opening stock-to-utilization rates were 48% in Ka-zakhstan and 20% in Ukraine. Despite the Russian shortfall, global wheat production in the current crop year (June 2010-May 2011), is expected to be 5%lower than in 2009, and more-than 5 to 8% higher than in 2007 and 2008. But, beginning stocks plus production is more than 10% higher this year com-pared to 2008. In contrast, in the two seasons leading to the 2008 price spike, global wheat production was 596 and 611 million metric tons, and stocks-to-use ratios reached record lows of 0.22 and 0.20, respec-tively.
Input prices have been relatively stable during 2010. Agriculture is an energy-intensive industry since fuel and fertilizer account for much of cash ex-penses. Oil and fertilizer prices—key determinants of the cost of grain production—were rising rapidly in 2007 and most of 2008. In fact high energy prices have been cited as the key factor behind the food price spike of 2007/08. The World Bank estimated that a 10% increase in energy costs would induce a 2% price increase in grains. However, oil prices have been relatively stable at around $75/bbl so far this year, and the market continues to be well-supplied. Fertilizer prices, not only have averaged less than half of their 2008 levels so far this year, but also they have exhibited remarkable stability as well.
Still, even modest disruptions in global grain markets may affect domestic prices with signifi-cant consequences for food security. Macroeco-nomic stability may also be at risk, as the food basket often carries a large weight in the consumer price index of many developing countries. This is all the more important as the countries that are most vul-nerable are low income countries. Indeed, of the 15 most vulnerable economies, 10 have per capita in-comes less-than $850. They include 7 countries from SSA (The Gambia, Ethiopia, Eritrea, Mauritania, Mo-zambique, Senegal and Uganda); and one each from MENA (Yemen), ECA (Kyrgyzstan) and LAC (Haiti). Moreover, three additional countries with high expo-sures to the markets (Egypt, Jordan, and Tunisia) are in the middle income group.
0
200
400
600
800
1,000
Jan-04 Jan-05 Jan-06 Jan-07 Jan-08 Jan-09 Jan-10
Energy and Fertilizer Nominal Price Indices, 2000=100
Source: US Department of Agriculture (September 10, 2010 Note: The years refer to marketing years (June-May), i.e., 2011
corresponds to June 2010-May 2011. The 2010 and 2011 figures
are estimates and projections, respectively.
Source: DECPG
Source: DECPG
September 23, 2010 page 16
External Environment for Developing Countries
In light of the long lags in transmitting global price changes to local markets, and limited country-level data we have for August prices, it is too early to make conclusive statements on the impact of the recent global wheat price spike at the national level. A few countries have seen a significant increase in wheat related items and in others, it appears that the impact has thus far been muted. For instance in Russia the price of buck-wheat, an important staple, increased by 33% on average nationally in August while wheat flour has increased by 11%. In Mauritania the imported price of wheat has gone up by 55% between July and Au-gust and pressures on foreign exchange reserves could result in the coming months. In Bangladesh wheat flour prices went up by 20% during the month of August while coarse rice (the main staple) prices remained virtually unchanged. However, it is impor-tant to stress that local factors can drive up domestic staple food prices even when global grain prices are on the decline. This was evident in the six months leading up to June 2010 when global grain prices fell while staple grain prices in countries like Afghani-stan, Nigeria and Mongolia were on the rise.
In many countries consumers derive a substan-tial part of their caloric intake from wheat. In addition to the macroeconomic challenges (previously discussed) that could arise in selected countries, food security remains a risk for some de-veloping countries. Recent FAO data show that in about 30 low and middle income countries, wheat accounts for more than 30% of total calorie intake. Such caloric dependence is very strong in some Cen-tral Asia countries (notably Azerbaijan, Turkmeni-stan, Tajikistan, and Uzbekistan) where the share exceeds 50%. For most sub-Saharan African coun-tries, the calorie intake from wheat is less than 15%, with the exception of Mauritania (33%), Mauritius (28%), Eritrea (19%), and South Africa (16%). How-ever, this does not imply that they are less vulnerable from a food security stand point. Indeed, given that the average calorie intake in SSA is lower compared to other regions, and for at least 13 SSA countries (including Eritrea) is lower than critical 2100 calo-ries/day level, any exogenous shock that reduces the intake of calories will render them even more food insecure.
Food aid flows often compensate domestic food deficits in low income countries where food is large import item. The World Food Program (WFP), which has very active emergency operations in many African countries, accounted for a large share of wheat import needs. In addition to emer-gency operations, some countries receive WFP assis-tance relief through relief operations. Top WFP emergency recipients include Somalia and Haiti, which during 2010 are expected to receive US$ 687 and 342 million. Top relief operation recipients are Afghanistan, Ethiopia, Congo, Kenya, Zimbabwe, and Uganda.
0% 10% 20% 30% 40% 50% 60%
Azerbaijan
Turkmenistan
Tajikistan
Uzbekistan
Tunisia
Algeria
Iran (Islamic Republic of)
Turkey
Georgia
Kyrgyzstan
Syrian Arab Republic
Calories derived from Wheat as a share of total calorie intake
Source: FAO
Country Commodity Percent change
Afghanistan Wheat 27%
Nigeria Sorghum 20%
Rwanda Beans 13%
Mongolia Rice 10%
Mali Millet 10%
Nepal Rice 9%
Burundi Beans -18%
Zimbabwe Maize -21%
Zambia Maize -22%
Tanzania Maize -25%
Uganda Maize -25%
Kenya Maize -43%
Country Own-production
as % of domestic
supplies
Wheat aid,
WFP 2009
(tons)
Wheat aid
as a share
of wheat
imports
Ethiopia 79% 627,624 104%
Burundi 47% 13,261 144%
Zimbabwe 37% 109,226 56%
Malawi 5% 21,140 22%
Mozambique 0% 118,036 33%
Mauritania 0% 21,666 7%
Togo 0% 24,062 29%
Price changes of key staples: April 08 - July 10
Source: Food Price Watch, September 2010, PREM
Wheat dependence on selected AFR countries
Source: WFP and DECPG staff calculations
September 23, 2010 page 17
External Environment for Developing Countries
Average 2009 2010 20101999-08 2007 2008 2009 Q3 Q4 Q1 Q2 Apr May Jun Jul
World 2.8 4.8 0.5 -8.1 11.6 11.7 11.7 11.0 0.1 0.2 0.6 -0.6High - in come cou n tries 1.4 2.8 -1.7 -12.4 10.9 9.5 9.5 9.7 0.2 0.2 0.8 -0.9