1 APPENDIX V DATA ACQUISITON AND PROCESSING V.A. Equipment Figure 1: R/V Gloria Michelle underway R/V Gloria Michelle is a Fisheries Research Stern Trawler who performs fisheries research in the north east. In 2005, a pole mounted Kongsberg Em3002 multibeam echosounder system was installed. The Sea Acceptance Test of the system was completed in March 11, 2006. The Hydrographic Systems Readiness Report was completed May 7, 2007. Specific rebuttals to each 2007 HSRR deficiency are included in the Descriptive Report. Manufactuer Device Model Number Serial Firmware version Firmware Date Kongsberg Em3002 PU EM3-218353 1536 1.7.1 10/5/2005 Kongsberg PC HWS-10 154 N/A N/A Kongsberg Transducer Em3002 372 N/A N/A NOAA Sounding pole none none N/A N/A Seatext SeaPath 200 (DG14) 3088 Unknown Unknown Seatext SeaPath MRU-6-E 2457 Unknown Unknown Furuno GPS GP-35 Unknown Unknown Unknown Odom Digibar Pro DB1200 98320 v 1.08 Unknown AML SV Plus 4998 Unknown Unknown Table 1: List of survey equipment
Transcript
1
APPENDIX V
DATA ACQUISITON AND PROCESSING V.A. Equipment Figure 1: R/V Gloria Michelle underway R/V Gloria Michelle is a Fisheries Research Stern Trawler who performs fisheries research in the north east. In 2005, a pole mounted Kongsberg Em3002 multibeam echosounder system was installed. The Sea Acceptance Test of the system was completed in March 11, 2006. The Hydrographic Systems Readiness Report was completed May 7, 2007. Specific rebuttals to each 2007 HSRR deficiency are included in the Descriptive Report.
Manufactuer Device Model Number Serial Firmware version Firmware DateKongsberg Em3002 PU EM3-218353 1536 1.7.1 10/5/2005Kongsberg PC HWS-10 154 N/A N/AKongsberg Transducer Em3002 372 N/A N/A
Odom Digibar Pro DB1200 98320 v 1.08 UnknownAML SV Plus 4998 Unknown Unknown
Table 1: List of survey equipment
2
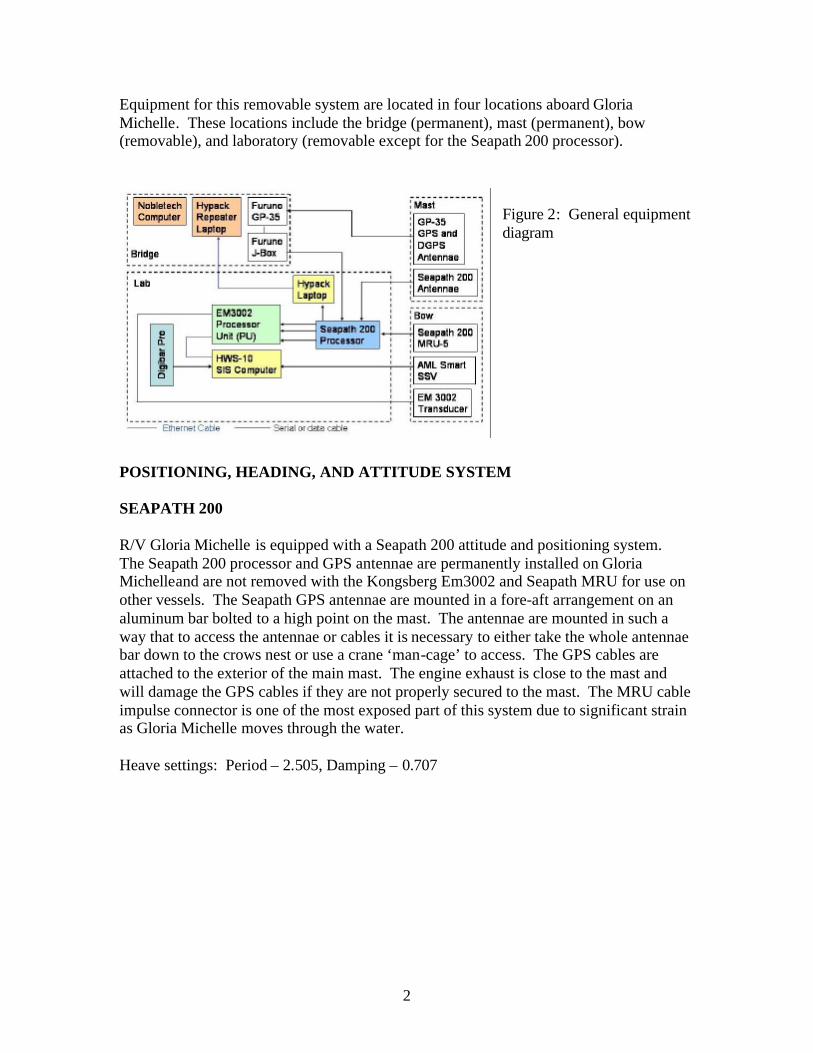
Equipment for this removable system are located in four locations aboard Gloria Michelle. These locations include the bridge (permanent), mast (permanent), bow (removable), and laboratory (removable except for the Seapath 200 processor).
Figure 2: General equipment diagram
POSITIONING, HEADING, AND ATTITUDE SYSTEM SEAPATH 200 R/V Gloria Michelle is equipped with a Seapath 200 attitude and positioning system. The Seapath 200 processor and GPS antennae are permanently installed on Gloria Michelleand are not removed with the Kongsberg Em3002 and Seapath MRU for use on other vessels. The Seapath GPS antennae are mounted in a fore-aft arrangement on an aluminum bar bolted to a high point on the mast. The antennae are mounted in such a way that to access the antennae or cables it is necessary to either take the whole antennae bar down to the crows nest or use a crane ‘man-cage’ to access. The GPS cables are attached to the exterior of the main mast. The engine exhaust is close to the mast and will damage the GPS cables if they are not properly secured to the mast. The MRU cable impulse connector is one of the most exposed part of this system due to significant strain as Gloria Michelle moves through the water. Heave settings: Period – 2.505, Damping – 0.707
3
Figure 3: Seapath 200 antennae arrangements
Seapath Configuration Report
This is a summary of all the parameters configured in Seapath.
15:43:22 - Sun 24 Jun 2007 (local) 19:43:22 - Sun 24 Jun 2007 (GMT)
From CG to antenna #1: X: -1.250 Y: -0.378 Z: -9.652 [m] GPS Processing Settings Height Aiding: Aid mode: Off Aided height: 0.000 [m] SV Masking: Elevation: 10.00 [deg] RTK Search Mode: NORMAL Range Rate Corrections: OFF Use GEO ranges in position solution: TRUE
GPS Reference stations Differential Corrections: Age Limit: 60.00 Use only stations: <Empty> Force stations: <Empty> Ignore stations: <Empty> SBAS SBAS Enable: Automatic mode SBAS Decode: Decode any satellites Enable SBAS WAAS Testmode: FALSE GPS Antenna Configuration Baseline lenght: 2.505[m] Heading offset: -2.02[deg] Height difference: -0.089[m] Attitude Processing Max pitch and roll angles: 15.00 Max average pitch and roll angles: 7.00 MRU Geometry MRU Lever Arm From CG to MRU: X: 10.464 Y: 0.000 Z: 2.060 [m] MRU Mounting Angles: Roll: -90.00 Pitch: 0.00 Yaw: 90.00 [deg] MRU Heave Filter Filter Mode: Hydrographic survey Heave mean level is roll/pitch dependent. Filter Parameters: Period: 2.50 [s] Damping: 0.707 []
Measurement Points Geometry MP1: Name: Measurement Point #1 From CG to MP; X: 10.465 Y: 0.000 Z: 2.337 [m] MP2: Name: Measurement Point #2 From CG to MP; X: 0.000 Y: 0.000 Z: 0.000 [m] MP3: Name: Measurement Point #3 From CG to MP; X: 0.000 Y: 0.000 Z: 0.000 [m]
5
MP4: Name: Measurement Point #4 From CG to MP; X: 0.000 Y: 0.000 Z: 0.000 [m]
Data Interface Host Common Common Host Settings: NMEA identification: IN Binary Message Token: 42 Network Common Common Network Settings: IP Network Address: 192.168.1.10 IP Network Mask: 255.255.255.0 NMEA Identification: IN Binary Message Token: 42 FTP Server Password: seapath Input Data Interface - Input Configuration Device Properties Format GPS Receiver #1 com11 38400 n 8 1 GPS Receiver #2 com13 38400 n 8 1 MRU com12 57600 n 8 1 rs-232 Gyro com9 9600 n 8 1 rs-232 <disabled> DGPS Link #0 com10 4800 n 8 1 rs-232 RTCM, RollOn, 6of8 DGPS Link #1 com0 9600 n 8 1 rs-232 <disabled> DGPS Link #2 com0 9600 n 8 1 rs-232 <disabled> DGPS Link #3 com0 9600 n 8 1 rs-232 <disabled> OpCom com1 9600 n 8 1
Output Data Interface - Output Configuration Device Properties MP# Interval Option Format Host Out #1 com5 9600 n 8 1 rs-232 1 - Measurement Point #1 1.00 0 NMEA Host Out #2 com6 19200 n 8 1 rs-232 1 - Measurement Point #1 0.01 0 Simrad EM3000/Hipap Host Out #3 com8 9600 n 8 1 rs-232 1 - Measurement Point #1 1.00 0 NMEA Host Out #4 com7 9600 n 8 1 rs-232 0 - CG 0.10 0 NMEA Host Out #5 com9 9600 n 8 1 rs-232 0 - CG 1.00 0 <disabled> Host Out #6 com16 9600 n 8 1 0 - CG 1.00 0 <disabled> Host Out #7 com17 9600 n 8 1 0 - CG 1.00 0 <disabled> Host Out #8 com18 9600 n 8 1 0 - CG 1.00 0 <disabled> Network Out #1 Port:3001, UDP/IP 0 - CG 1.00 0 <disabled> Network Out #2 Port:3002, UDP/IP 0 - CG 1.00 0 <disabled> Network Out #3 Port:3003, UDP/IP 0 - CG 1.00 0 <disabled> Network Out #4 Port:3004, UDP/IP 0 - CG 1.00 0 <disabled> Network Out #5 Port:3005, UDP/IP 0 - CG 1.00 0 <disabled> Network Out #6 Port:3006, UDP/IP 0 - CG 1.00 0 <disabled> Network Out #7 Port:3007, UDP/IP 0 - CG 1.00 0 <disabled> Network Out #8 Port:3008, UDP/IP 0 - CG 1.00 0 <disabled> Analog Out #1 Channel:1, g:0.00,o:0.00 0 - CG NA NA <disabled> Analog Out #2 Channel:1, g:0.00,o:0.00 0 - CG NA NA <disabled> Analog Out #3 Channel:1, g:0.00,o:0.00 0 - CG NA NA <disabled>
6
FURUNO GP-35 GPS Differential correctors to the Seapath 200 were supplied from the Furuno GP-35 GPS mounted on the aft starboard overhead on the bridge. The output from this GPS is distributed via a white plastic junction box in the cabinet below the GPS mounted on the aft bulkhead. This junction box provides NEMA position, course made good, and speed to the navigation computer and to computers and equipment specific to the other missions of Gloria Michelle. RTCM correctors are sent from the junction box to the Seapath processing unit.
Figure 4: GP-35 Bridge display Figure 5: GP-35 junction box SOUNDING SYSTEM KONGSBERG EM3002 MULTIBEAM ECHOSOUNDER The Kongsberg Em3002 is a high resolution MBES with dynamically focused beams with roll and pitch stabilization. With the pitch and roll stabilization, the system is able to maintain a constant swath with even in rough conditions, minimizing data gaps and holidays. This 300 kHz MBES system has a typical maximum survey depth of 150 meters. Besides bathymetry, the Em3002 MBES recordsbeam time series information,
allowing for high quality backscatter data. The Kongsberg Em3002 processing unit received attitude, time, position, and 1 PPS from the Seapath 200. The Kongsberg Em3002 processing unit was connected to the WS10 workstation via an ethernet connection. Figure 6: Pole bow mount assembly
7
The Kongsberg Em3002 transducer was attached to a purpose built assembly which also housed the Seapath 200 MRU and AML SV Plus. The assembly was mounted on a pole which could be deployed on the bow as needed. Once in place, the pole and assembly were rigid. Acquisition settings for this survey remained consistent through out the survey. The Equiangular beam spacing was used to maximize backscatter quality. Swath angular coverage was set to 60 degrees port and starboard, except for development line over wreck when the coverage was reduced to 40 degrees port and starboard. The ping Hz rate was monitored in real time during acquisition. The ping Hz rate was then compared to the vessel speed in meters per second. The Em3002 exceeded the NOA requirements for 3.2 pings/3 meters along track during the entire survey. The depth solution of this system was compared to a sounding pole. See below for detailed configuration settings. SETTINGS Position: Com 1 9600,8,n,1 GGA, ZDA, HDT Attitude/Heading : Com 2 Angular Offsets/Offset Angles Attitude 1, Com 2 Roll 1.7, Pitch -0.5 Acquisition settings Sector coverage Port 60, stbd 60 Coverage 300, 300 Angular coverage mode: Manual Beam spacing: eqangle Transmit control: Beam width: Normal Along direction: 0 Max ping freq: 40 Pitch stabilization on Filter off Absorption coefficient Source: salinity Salinity 33 parts per thousand Advanced parameters Pulse length: 150 us Bandwidth 8 khz SIS Processor Unit Parameters #// Database Parameters #// Seafloor Information System #// Kongsberg Maritime AS #// Saved: 2007.06.27 08:38:58
8
#// Build info: #* SIS: [Version: V3.3.2, Build: 88, Label: , CD generated: Mon Nov 20 15:38:15 2006] [Fox ver = 1.4.34] [db ver = 12, proc = 12.0] [OTL = 4.0.118] [ACE ver = 5.4.10] [Coin ver = 2.4.4] [Simage ver = 1.6.2a] [Dime ver = DIME v0.9] [STLPort ver = 461] [FreeType ver = 2.1.9] [TIFF ver = 3.8.2] [GeoTIFF ver = 1230] [GridEngine ver = 2.2.3] #* Language [3] #// Current language, 1-Norwegian, 2-German,3-English #* Type [3020] #* Serial no. [372] #* Number of heads [1] #* System descriptor [33554432] #// 02000000 #// ********************************************************************* #// Installation parameters #{ Input Setup #// All Input setup parameters #{ COM1 #// Link settings. #{ Com. settings #// Serial line parameter settings. #* Baud rate: [9600] #* Data bits [8] #* Stop bits: [1] #* Parity: [NONE] #} Com. settings #{ Position #// Position input settings. #* None [1] [0] #* GGK [1] [0] #* GGA [1] [1] #* GGA_RTK [1] [0] #* SIMRAD90 [1] [0] #} Position
A simple sounding pole was built to specifically test the depth solution from the Em3002 after being processed in Caris. The pole was built from four five foot sections of PVC pipe cemented together with PVC adhesive. A metal measuring tape was secured to the pole using electrical tape. This sounding pole was only used for comparison purposes with the multibeam and was not used directly for depth sounding for this survey. See Corrections to Echosoundings for more information on how this sounding pole was used. Figure 7: Sounding pole
SOUND SPEED SENSORS ODOM DIGIBAR PRO SOUND SPEED SPROFILER The Odom Digibar Pro is a velocimeter employing the sing-around method of sound speed determination. The sing-around process applies Del Grosso’s formula for calibration constants. The Digibar Pro tags each sound speed measurement with time and depth. The Digibar Pro uses the known distance between a transducer and associated reflector. Casts were deployed by hand over the side when the vessel was not making way. Casts were taken at least every four hours. Casts were downloaded to the SIS computer using
Hyperterminal by using the com port interface cable for the Digibar. Casts were output in a CSV format and converted using Velocwin into SIS and Caris friendly formats. Casts were extended to 12000 meters for the SIS software. Casts were recorded by a depth interval of 0.5 m except when current was strong. When strong currents prevented achieving desired depths the logging interval was changed to time at an interval of one second. Cast parameters: Depth average 4, Vel average 1 Probe constants: Gradient: 3342, Intercept: 2640 Data transfer: 19200,8,n,1
APPLIED SYSTEMS LIMITED SMART SV The AML Smart SV was mounted in the pole head assembly above the Em3002 transducer. The sensor was configured to continuously output sound speed values to the SIS computer through a junction box located in the equipment rack with the data storage devices. The junction box provides power the sensor and passes the NMEA data to the HWS-10 SIS computer. OTHER EQUIPMENT WILCO PETITE PONARO BOTTOM SAMPLER The Wilco Petite Ponaro bottom sampler is part of the University of New Hampshire Center of Coastal and Ocean Mapping (CCOM) inventory and was loaned out for this project. The sampler uses a spring release pin to close the scoops when the sampler hits
bottom. The sampler was hand deployed over the side when the vessel was not making way. A block on the starboard side was used to ease hauling the unit aboard. During this survey the bottom sampler failed to trigger multiple times. Figure 9: Wilco bottom sampler
SIMRAD AP-50 AUTOPILOT
The Simrad AP-50 autopilot was connected to the bridge Nobletech computer for line steering. Although possible, the Hypack autopilot NEMA string was not re-directed to the AP-50. Figure 10: Simrad AP-50 controller
24
DATA ACQUISITION SOFTWARE SEAFLOOR INFORMATION SYSTEM (SIS) SIS was used for all Kongsberg Em3002 data acquisition. The real-time coverage display was used as an approximate estimate on coverage during acquisition. Sound speed profiles were applied in real-time and compared with the AML surface sound speed values to assist in the determination of when additional casts were necessary. Full water column data were acquired for select lines during the survey for research purposes. SIS v3.3.2 build 88 CD generated nov 20 15:38:15 2006 HYPACK Hypack was used for survey management and acquisition of detached positions only. Hypack received NMEA position, headings, and speed data from the Seapath 200. Planned line files created in MapInfo were exported to a Hypack format. Using the Windows Broadcast applet in Hypack, a laptop was set up on the bridge so the crew could see the Hypack screen. Line coordinates were provided to the crew who manually entered those positions into Nobletech. Hypack Max v4.3a 4.3.52.0 Device driver: nmea.dll, COM1:9600,n,8,1 VELOCWIN Velocwin v8.83 was used to process all Odom Digibar sound speed casts. Casts were processed using the ‘most probable slop’ algorithm and extended to 12000 meters for SIS. Caris svp files and SIS asvp files were generated. SCC SCC V2.1.3 dated Friday April 2 13:24:48 2004 was used to interface with the Seapath 200. This software does not allow for real time monitoring of the system and only allows for the configuration of the system. Real time monitoring was achieved by monitoring the SIS status lights, Seapath 200 LED lights, and the attached VGA monitor connected to the Seapath 200. V.B. QUALITY CONTROL CROSSLINES Crossline analysis and comparison were performed using two methods. Both methods used separate surfaces reflecting main scheme only and crossline only data. These surfaces were generated at the same resolution as the product surfaces at 1 meter.
25
The first method was to import these surfaces into Fledermaus using the IVS program DMagic. Surfaces for each area were then compared against each other using the Tools/Surface Comparison tool. The second method was using the NOAA program Pydro. Separate surfaces for main scheme and crosslines were imported into Pydro. Thirty one Pydro check points were then selected by the hydrographer at nadir junctions of main scheme and crossline tracks. The ‘show tracks’ display option was selected to enable check point selection. Once the surfaces were imported and the check points selected the Pydro reports/point surface Stats tool was used to generate comparisons. See Separates for a complete listing of settings used and results for each check point. DATA PROCESSING ROUTINES Data were processed using a combination of Caris, MapInfo, Pydro and Fledermaus. Caris was used to apply correctors and create bathymetry surfaces. Pydro was used for feature management, crossline analysis and report generation. Fledermaus was used for crossline analysis and visualization creation. MapInfo was used for line planning and plot creation. Caris 6.1 HF# 1-13.
Caris Data were converted and processed in Caris in the following order; 1) Data conversion 2) Water levels 3) Sound speed profiles 4) Merge 5) Calculate TPE Figure 11: Data processing diagram
Figure 12: Data conversion settings
26
Water level correctors were applied using the ‘Multiple tide stations using tide zones’ and the CO-OPS provided preliminary zoning. Preliminary water levels were downloaded and applied at the end of each day. Verified water levels were later applied when those data became available. Sound speed profiles were applied using a master SVP file that contained all of the sound speed profiles for the survey using the ‘Nearest in distance within time -8 hrs’ option. Filters were not used for these data. During acquisition in SIS the depth range was set to a minimum depth of 10 meters and maximum depth of 70 meters. Data were not decimated. CUBE surfaces were generated at 1 meter resolution using the ‘default’ CUBE parameters. See V.C Corrections to Echosoundings for information on TPE values used during the Calculate TPE step. Fledermaus Surfaces were imported into Fledermaus for analysis using the following steps: 1) Import all finalized surfaces into DMagic, allpy surface shading, and assemble Fledermaus objects. 2) Open Fledermaus objects in Fledermaus 3) Select the Tools/Surface Difference tool for comparison of main scheme and crossline surfaces Pydro 1) Insert AWOIS items, ENC chart GP’s, raster charts 2) Complete Pydro PSS Metadata information 3) Insert main scheme and crossline surfaces using the ‘Insert Weighted Grids’ option 4) Manually create check points 5) Select the reports/surface stats to create report on crosslines 6) Insert individual HDCS lines and generate ‘Request for Smooth Tides’ report 7) Features compared with surveyed soundings to determine if significant. Caris 6.1 HF 1-13 Hyperterminal v5.1 Pydro 7.3 (r2119) DATA ANALYSIS Depth, uncertainty, and Std Dev layers were used to evaluate CUBE surfaces for noise and features. Significant features and those bottom features not adequately represented by the CUBE surfaces were flagged with ‘designated’. Only those noise that adversely affected the CUBE surfaces were flagged with ‘reject’. Surfaces were finalized with ‘Apply Designated Soundings’ set to ‘yes’.
27
V.C. CORRECTIONS TO ECHOSOUNDINGS DYNAMIC DRAFT Dynamic draft values determined during the 2007 HSRR were used for this survey. Data were acquired in reciprocal directions over the same portion of the seafloor in Vinyard Sound at different RPM settings. Dead in the water (DIW) data were also acquired. Surfaces from each RPM pair were compared with the DIW surfaces to determine the vertical change for each speed setting. Results were entered into the Caris HVF and applied in post-processing. HEAVE Heave values were calculated directly in the Seapath 200 and referenced to the transducer. The Seapath was configured to output the induced heave from pitch and roll. The result of this was that the zero heave point was at between -0.6 and -0.8 meters. Heave values were applied by SIS during acquisition. WATER LEVEL Water level observations from the NOAA Boston, MA tide gauge were downloaded and applied in Cairs using the tide zone file provided by CO-OPS. Verified water level observations were downloaded after acquisition was complete and applied to all data in Caris using the preliminary tide zone file. SOUND SPEED Sound speed at the transducer values were used in real time by SIS for beam forming. Sound speed profiles were downloaded from the Odom Digibar Pro and applied in SIS in real time as well as converted into Caris format. Sound speed profiles were joined together in a single file and applied to all data in Caris during post-processing.
28
PATCH TEST Patch Test Report Completed By Nicholas Forfinski NOAA R/V Gloria Michelle M-A902-TJ/GM-07 H11636 Location The patch test was performed near the R”12” buoy, approximately 1.8 km west of the southern end of sheet B, as shown in Figure 1. The goal originally was to use the buoy block as a target for determining the timing, pitch, and heading biases; however, more suitable targets were found in a rocky area 350 meters to the south.
Figure 1 - Patch Test Location. Procedure Navigation Timing Bias The navigation timing bias was determined by comparing coincident lines that were run at the same heading but different speeds over a conspicuous feature. Pitch Bias The pitch bias was determined by comparing coincident lines that were run at reciprocal headings but the same speed over a conspicuous feature. Heading Bias The pitch bias was determined by comparing two lines that were offset from each other such that the target of interest was located in the outer ranges of each swath. Roll Bias The roll bias was determined by comparing two coincident lines that were run at reciprocal headings and the same speed.
Sheet B
29
Table 1 lists the data acquired for the patch test. Table 1 - Patch Test Data
1rejected because of cross-track error Results The three survey personnel aboard Gloria Michelle at the time of the patch test independently derived bias estimates from the acquired data listed in Table 1, and then final values were decided upon collectively through a group review process during which each bias was applied to the data and assessed. Table 2 - Patch Test Bias Estimates
Bias Estimate 1 Estimate 2 Estimate 3 Implemented Value Nav Timing 0.15 0.03 0.13 0.1 Pitch -2.96 -3.30 -2.60 -2.6 Heading -0.50 -1.00 0.33 -0.39 Roll 0.07 0.10 0.03 0.03
Discussion The patch test bias estimates that were implemented in the HVF were based on the acquired Kongsberg data having been only merged in Caris. A waterline value of 1.48 meters was applied during the merge process (i.e., the “Apply” option in the waterline HVF sensor was set to ‘yes’). Variations in the speed of sound throughout the water column were accounted for real-time by loading a sound speed cast into the Kongsberg acquisition software, Seafloor Information System (SIS). Although the patch-test bias estimates based on the acquired data having only been merged in Caris resulted in processed depths that were consistent with the sounding pole
30
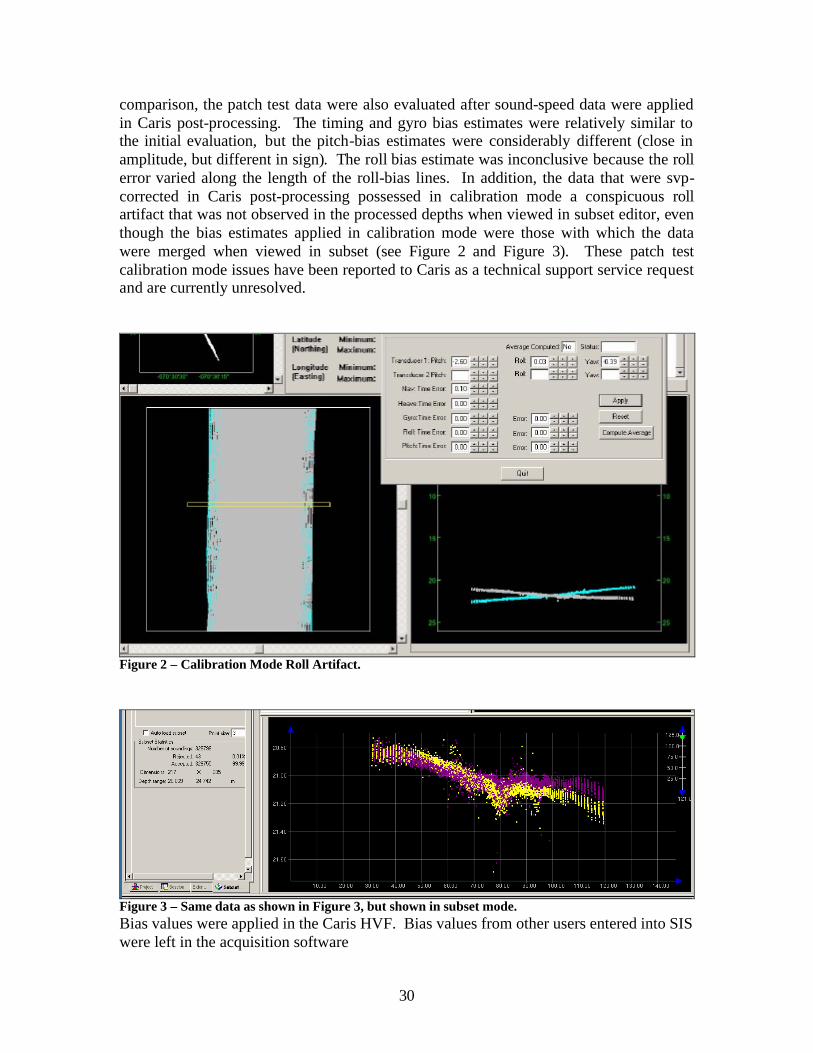
comparison, the patch test data were also evaluated after sound-speed data were applied in Caris post-processing. The timing and gyro bias estimates were relatively similar to the initial evaluation, but the pitch-bias estimates were considerably different (close in amplitude, but different in sign). The roll bias estimate was inconclusive because the roll error varied along the length of the roll-bias lines. In addition, the data that were svp-corrected in Caris post-processing possessed in calibration mode a conspicuous roll artifact that was not observed in the processed depths when viewed in subset editor, even though the bias estimates applied in calibration mode were those with which the data were merged when viewed in subset (see Figure 2 and Figure 3). These patch test calibration mode issues have been reported to Caris as a technical support service request and are currently unresolved.
Figure 2 – Calibration Mode Roll Artifact.
Figure 3 – Same data as shown in Figure 3, but shown in subset mode. Bias values were applied in the Caris HVF. Bias values from other users entered into SIS were left in the acquisition software
31
STATIC DRAFT Static draft measurements were taken daily on the port and starboard sides of the vessel while alongside. Although there were currents during some of the observations, the readings alongside and away from sea motion were considered more accurate. A steel measuring tape was used for the readings. Readings were taken from the water line to the top of the bulwark, next to the forward pad eyes on each side, two feet forward of the aft bulkhead of the aft house.
The vertical location from the bulwark at the pad eyes to the vessel coordinate system were determined by bringing a string across both sides of the vessel near the mast on the weather deck. A measurement was taken from that line to the overhead. A measurement from the deck on the top of the house to the marine surveyor RP was taken. An estimated plate thickness of 0.016 was used for the calculation. Figure 13: Tie-in of bulwark static draft measurements to IMTEC offsets
The reference point used for the survey is at the base of the mast on the house deck and is on the vertical plate at the base of the boom pivot point. The initial static draft measurements were based on the assumption that the MRU, Em3002, and vessel were in the same reference frame during the IMTEC full survey, which was not the case. See the Sounding pole Comparison section for more information. Figure 14: Image of bulwark to reference point measurements.
Table 2: Static draft observations Static draft values were applied in the Caris HVF for post-processing. The actual static draft values were calculated by using an assumed mis-alignment angle between the Seapath MRU and vessel reference frame of 3.3 degrees. This value was multiplied by the lever arm distance from the center of gravity to MRU and added to the center of gravity to bulwark and center of gravity to transducer values. 3.3 degree misalignment x MRU lever arm + CG to bulwark + CG to transducer sin(3.3deg) 10.465 1.279 2.337 4.218meters× + + = This value was subtracted from the average bulwark draft measurements for the Caris static draft entries.
33
SOUNDING POLE COMPARISSON A sounding pole comparison was performed on July 4, 2007 while Gloria Michelle was alongside Woods Hole, MA. The results of the comparison were that the Caris depths were on average 0.640 meters shoaler than the sounding pole measurements. This difference led to a re-evaluation of the static draft values and angular alignments of the MRU and vessel reference frames from the IMTEC marine survey.
Figure 15: Sounding pole comparison location in Woods Hole, MA The sounding pole was created from four five foot sections of 1 ¼” PVC pipe cemented together using PVC adhesive and PVC collars. A metal metric measuring tape was secured to the pole using electrical tape. The pole was deployed from the bow of Gloria Michelle, with the bottom of the pole as close as possible to the Em3002 head assembly. An
observer was stationed on a small boat near the bow of Gloria Michelle to take readings. The watch used for timing the sounding pole measurements was compared to UTC time,
with a difference of 4 hrs from the watch time and UTC time. Wave action accounted for a sounding pole measurement uncertainty of 0.05 meters. The sounding pole was re-seated on the bottom for each observation to minimize sinking in the bottom. Separate SIS lines were acquired for each sounding comparison for a total of 12 observations over 49 minutes. Since there is a slope going up to the pier, those soundings beyond 5 degress on each side of nadir were filtered in Caris. Data acquired before and after the sounding pole observation were also rejected in Caris. Caris data were corrected using a single sound speed cast from the location and zero tides. Figure 16: Deployed sounding pole
34
Initial Caris static draft values were used based on water line observations at the centerline of the vessel and the 2005 IMTEC marine survey. All of the sounding pole comparisons differed from the Caris depths with an average difference of 0.640 meters. After changing the Caris static draft value to reflect a misalignment between the MRU and vessel reference systems , the average difference was 0.007 meters. This misalignment correction was necessary since the Seapath was configured to output heave with respect to the transducer, but references the vessel center of gravity. Since the transducer and IMU were not aligned to the vessel reference frame during instillation or the IMTEC survey, there was an unaccounted for misalignment. The 2006 HSRR used a static draft value of the transducer. This value (1.48) was incorrect since it did not account for the mis-alignment or the fact the static draft readings should be referenced to the center of gravity.
Figure 17: Vertical offsets with respect to water line observations assuming that the Seapath and vessel reference frames were the same during the IMTEC survey. Figure 18: Vertical offsets with respect to the waterline observations assuming that there was a 3.3 degree misalignment between the Seapath and vessel reference frames during the IMTEC survey.
The resulting vertical offset from a 3.3 degree misalignment between the Seapath and vessel reference frames was added to the static draft value.
35
Time (LT) Time (UTC) Observer ReadingSIS file name
Table 3: Sounding pole comparison results before and after accounting for the Seapath and vessel reference frame misalignment OFFSETS IMTEC SURVEY An initial analysis of the December, 2005 IMTEC survey was difficult due to the ambiguity in finding measurement points, specifically the reference point for the survey The center of reference (REF_MAST) for the IMTEC survey was a punch mark, located on the aft vertical plate under the pivot point for the aft boom at the base of the mast on the deck above the weather deck. This point was used to tie in static draft measurements with the vessel reference frame. There were four measurement points on the Em3002 transducer for the IMTEC survey. The values indicated that the Em3002 transducer was misaligned from the vessel reference frame by 2.5 degrees.
Figure 19: IMTEC center of reference
36
SEAPATH 200 Offsets to all of the cardinal points for the Seapath were entered into the Seaapth. The Offset from the primary (ANT #1) to center of gravity (CG), CG to MRU, and CG to transducer (MP #1) as well as the general dimensions of the vessel were entered. The CG is an imaginary point without physical location calculated by the marine surveyor who performed the IMTEC survey.
Figure 20 on the left: Offsets looking aft from the bow Figure 21 on the right: Offsets looking to port from starboard
SIS No offsets were entered into SIS. The static draft value was left at zero meters. Two bias values from a previous survey were left in the SIS acquisition software. These values were 1.7 roll and -0.5 pitch. SIS applies these values by adding (or subtracting) these values to the attitude output from the Seapath. CARIS No offsets were entered into the HVF swath 1 or sensor entries. TPE offsets from the CG to transducer were entered using the Seapath offset values. The static draft values were entered and applied in post-processing.
37
UNCERTAINTY AND TPE Uncertainty values were selected based on the Caris/TPE website and NOAA Field Procedures Manual. The MRU to Trans and Nav to Trans values used the Seapath center of gravity as the center point.
HVF Entry HIPS TPE Value Source of Value CommentsTPE Values -OffsetsMRU to Trans X (m) 0.000 Direct Measurment 2005 IMTEC surveyMRU to Trans Y (m) 10.465 Direct Measurment 2005 IMTEC surveyMRU to Trans Z (m) 2.337 Direct Measurment 2005 IMTEC surveyNav to Tran X (m) 0.000 Direct Measurment 2005 IMTEC surveyNav to Trans Y (m) 10.465 Direct Measurment 2005 IMTEC surveyNav to Trans Z (m) 2.337 Direct Measurment 2005 IMTEC survey
Trans Roll (deg) 0.000 Direct Measurment 2005 IMTEC surveyTPE Values -StdDev
Position Nav (m) 1.000 Caris/TPE DGPS valueTiming Trans (s) 0.010 NOAA/Estimated Serial connections to PUNav Timing (s) 0.010 NOAA Serial connections to PUGyro Timing (s) 0.010 NOAA Serial connections to PU
Heave Timing (s) 0.010 NOAA Serial connections to PUPitch Timing (s) 0.010 NOAA Serial connections to PURoll Timing (s) 0.010 NOAA Serial connections to PUOffset X (m) 0.100 NOAA / Measurments Based on manual measurment accuracyOffset Y(m) 0.100 NOAA / Measurments Based on manual measurment accuracyOffset Z (m) 0.100 NOAA / Measurments Based on manual measurment accuracy
Vessel Speed (m/s) 0.100 NOAA Serial connections to PULoading (m) 0.000 NOAA Daily static draft measurments
Draft (m) 0.050 NOAA Accuracy of side measurments alongsideDelta Draft (m) 0.020 NOAA Estimated uncertainty of DD values
MRU Align StdDev gyro 0.020 NOAA Same value as yaw bias valueMRU Align StdDev Roll/Pitch 0.020 NOAA Similar value as roll/pitch bias values
Table 4: TPE values entered into Caris HVF where Caris/TPE is the Caris/TPE web site and NOAA is the NOAA Field Procedures Manual
Values for the compute TPE step were taken from guidance from the Field procedures Manual. The Tide measured value is based on the sensor type. The Zoning was based on the simple zoning for the area (the majority of data are in a single tide zone). Sound speed measured was based on the observed variability of the area. Surface was based on the observed accuracy of the sound speed sensor when compared to the sound