BOARD OF GOVERNORS OF THE FEDERAL RESERVE SYSTEM (For Immediate Release) March 25, 1959 CHANGES IN COMMERCIAL AND INDUSTRIAL LOANS BY INDUSTRY All major Industrial classifications were represented in the net increase of $535 million in commercial and industrial loans at weekly reporting member banks during the week ended March 18, which reflected quarterly tax date needs. The principal net increases were $158 million in loans to sales finance companies, $128 million to manufacturers of metals and metal products, $47 million to manufacturers of food, liquor, and tobacco products, $43 million to the whole-^ sale and retail trade, $36 million to public utilities, and $3% million to "other manufacturing and mining businesses. Changes in loans during the week and since year-end are shown belowj the third column shows the changes during the comparable period last year. Cumulative since year-end Week Dec. 31; 195^ Dec. 31,L957 ended / to / to Business of Borrower Mar. 18*-' Mar. 18, 1959 j Mar. 19, 1958 (In millions of dollars) Manufacturing and mining: Food, liquor, and tobacco Textiles, apparel, and leather Metals and metal products Petroleum, coal, chemicals, and rubber Other manufacturing and mining Trade--wholesale a&d retail Commodity d e a l e r s Sales finance companies Public utilities and transportation Construction All other types of business Classified changes - net Unclassified changes - net Net change in commercial <ind industrial loans + 47 - 218 - 375 + 14 + 131 + 152 +128 + 448 + 256 + 15 69 + 1 + 34 + 81 + 88 + 43 + 58 • 200 + 10 - 163 - 202 +158 - 57 - 438 + 36 - 201 - 168 + 13 + 6 - 20 - 14 - 101 - 48 +484 83 - 954 + 51 - 82 - 252 +535 - 165 -1,205 p/ Preliminary; see footnote on attached table. Digitized for FRASER http://fraser.stlouisfed.org/ Federal Reserve Bank of St. Louis
Transcript
BOARD OF GOVERNORS OF THE FEDERAL RESERVE SYSTEM
(For Immediate Release) March 25, 1959
CHANGES IN COMMERCIAL AND INDUSTRIAL LOANS BY INDUSTRY
A l l major Industrial c l a s s i f i c a t i o n s were represented in the net increase of $535 mil l ion in commercial and industrial loans at weekly reporting member banks during the week ended March 18, which re f l ec ted quarterly tax date needs.
The principal net increases were $158 mil l ion in loans to sa les finance companies, $128 mil l ion to manufacturers of metals and metal products, $47 mil l ion to manufacturers of food, l iquor, and tobacco products, $43 mil l ion to the whole-^ sale and r e t a i l trade, $36 mil l ion to public u t i l i t i e s , and $3% mil l ion to "other manufacturing and mining businesses.
Changes in loans during the week and since year-end are shown belowj the third column shows the changes during the comparable period l a s t year.
Cumulative since year-end Week Dec. 31; 195^ Dec. 31,L957 ended / to / to
Business of Borrower Mar. 18*-' Mar. 18, 1959 j Mar. 19, 1958 (In mil l ions of dollars)
Manufacturing and mining: Food, l iquor, and tobacco Text i les , apparel, and leather Metals and metal products Petroleum, coal , chemicals,
and rubber Other manufacturing and mining
Trade--wholesale a&d r e t a i l Commodity dealers Sales finance companies Public u t i l i t i e s and transportation Construction Al l other types of business
Class i f i ed changes - net Unclass i f ied changes - net
Digitized for FRASER http://fraser.stlouisfed.org/ Federal Reserve Bank of St. Louis
H.12(a) CHANGES IN COMMERCIAL AND INDUSTRIAL LOANS OF A SAMPLE OF WEEKLY REPORTING MEMBER BANKS BY INDUSTRY AND FEDERAL RESERVE DISTRICT, WEEK ENDED WEDNESDAY, MARCH l8, 1959
Business of Borrower
M a n u f a c t u r i n g a n d m i n i n g : Food, liquor, and tobacco Textiles, apparel, and leather Metals and metal products (including machinery & transportation equipment)
Petroleum, coal, chemicals, and rubber Other manufacturing and mining
|j Preliminary; final totals will appear in the F. R, Bulletin and San Francisco District final figures atpear in a release of the Reserve Bank, l/ About 210 weekly reporting member banks are reporting ch&ncGs in their larger loans as to industry; these banks hold about 95 P®i* cent of
total commercial and industrial loans of all weekly reporting member banks and about 75 per cent of those of all commercial banks.
Digitized for FRASER http://fraser.stlouisfed.org/ Federal Reserve Bank of St. Louis
BOARD OF GOVERNORS OF THE FEDERAL RESERVE SYSTEM
March 25, 1959
Note to Users of H.12 Release, Changes in Commercial and Industrial Loans by Industry
The attached tables show estimates of the dol lar amount and number of business loans outstanding on October 5, 1955 and October 16, 1957 at member banks supplying data for the Board's weekly release, Changes in Commercial and Industrial Loans by Industry (H.12), and at a l l other member banks. These estimates are based on data obtained in the 1955 and 1957 Businees Loan Surveys. Tables comparable to the attached, but showing data for 1955 only, were previously distributed with the H.12 release of June 11, 1958. Owing to errors in the f igures for wholesale trade and commodity dealers appearing in those tables , they should be discarded.
Digitized for FRASER http://fraser.stlouisfed.org/ Federal Reserve Bank of St. Louis
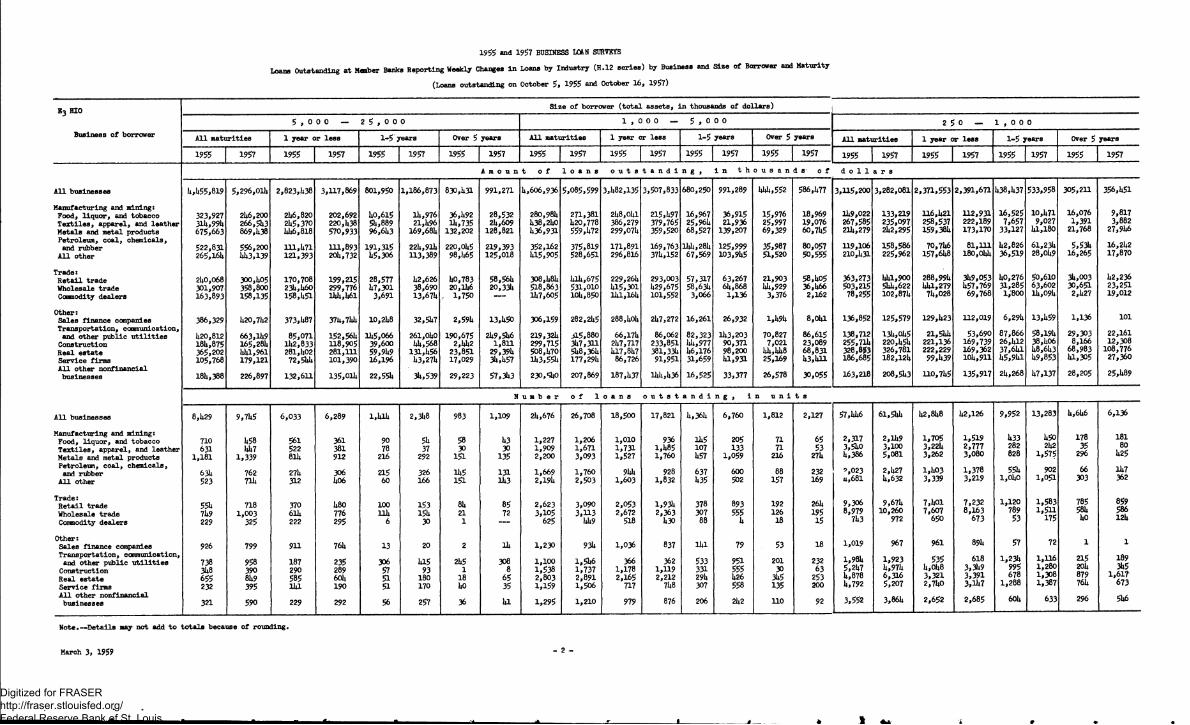
1955 and 1957 BUSINESS LOAN SURVEYS
Loans Outstanding at Member Banks Reporting Weekly Changes in Loans by Industry (H.12 ser ies) by Business and Size of Borrower and Maturity
(Loans outstanding on October 5, 1955 and October 16, 195?)
E3 HIO Size of borrower ( t o t a l asse ts , > i n thousands of dollars)
E3 HIO A l l b o r r o w e r s 1 0 0 , , 0 0 0 o r m o r e 2 5 , 0 0 0 — 1 0 0 , 0 0 0
All maturit ies 1 year or l ess 1-5 years Over 5 years All maturi t ies 1 year or less 1-5 years Over 5 years All maturities 1 year 0 1-5 y Over 5 years
Manufacturing and mining: Food, l iquor , and tobacco Text i les , apparel, and leather Metals and metal products Petroleum, coal, chemicals, and rubber
All other
11,696 17,239 22,21*1
8,399 26,287
a s 23,831
9,776 22,275
7,658 11*,872 15,156
1*,630 16,108
6,517 11,087 ll*,1*55
a,953 11*,276
3,127 1,981 5,197
2,793 8,732
2,880 1,798 7,590
3,509 6,629
3 1,889
976 1,1*1*7
781 372
1,786
1,313 1,370
% 1*1*7
268 166
517 129 819
1*29 135
262 21*
301*
31 71
575
ll1* 91*
$ 67
s
U 122
171* 8
a3 3
77
13 i 16 ;
122 1
11*1 33
517 215 38a
358 199
372
S
$
37a 160 250
120 9a
21*0 108 316
118 11*9
70 21 58
57 27
86 la
121*
80 35
% 75
181 78
1*6 28
119
239 105
Trade: Retai l t rade Wholesale t rade Commodity dealers
and other public u t i l i t i e s Construction Real es ta te Service firms All other noafiflayeial
businesses
5,595
15,550 26,705 25,71*9 62,128
35,930
U,99U
15,175 26,51*1 29,351 57,615
30,982
5,051*
U,1*5U 18,737 15,078 30,023
18,050
a,529
3,931 16,280 13,082 26,1*19
16,1*56
' 1*1*0
9,000 7,199 5,U30
26,518
16,266
389
9,1*10 9,060
10,583 25,122
11,076
101
2,096 770
5,21*1 5,587
1,615
76
1,835 1,201 5,686 6,073
3,1*50
682
1,1*09 1*9 1*3 92
53
597
1,21*6 27 70 99
93
61*7
31*6 8
27 1*2
37
563
26 1*1*
1*9
35
370 33 7 5
10
22
283 8
17 7
39
ms
£
6
13
612 1
27 a9
5
537
a92 81*
$
117
531
562 109 235 131
132
526
II M
71
a85
172 87
188 68
a6
12
109 19 11 29
22
3a
163 22
36
38
287
~~6 12
21*
12
226
i as
Note#—Details may not add t o t o t a l s because of rounding.
March 3, 1959 - 1 -
Digitized for FRASER http://fraser.stlouisfed.org/ Federal Reserve Bank of St. Louis
1955 and 1957 BUSINESS L<XN SURVEYS
Loans Outstanding at Member Banks Reporting Weekly Changes in Loans by Industry (H.12 series) by Business and Size of Borrower and Maturity
(Loans outstanding on October 5, 1955 and October 16, 1957)
E3 HIO Size of borrower ( total assets, in thousands of dollars)
5 , 0 0 0 —» 2 5 , 0 0 0 1 , 0 0 0 — 5 , 0 0 0 2 5 0 — 1 , 0 0 0 Business of borrower All maturities 1 year or less 1-5 years Over 5 years All maturities 1 year or less 1-5 years Over 5 years All maturities 1 year or less 1-5 years Over 5 years
and other public u t i l i t i e s Construction Real estate Service firms All other nonfinancial
businesses
926
738 3U8 655 232
321
799
958 390 81*9 395
590
9H
187 290
2 229
761*
235 289 601* 190
292
13
%
S 56
20
1*15 93
180 170
257
2
21*5 1
18 1*0
36
11*
308 8
65 35
1*1
1,230
1,100 1,538 2,803 1,159
1,295
93L
1,51*6 1,737 2,891 1,506
1,210
1,036
366 1,178 2,165
717
979
837
362 1,U9 2,212
7U8
876
H*1
533 331 291* 307
206
79
555 1*26 558 21*2
53
201 30
% 110
18
232 63
253 200
92
1,019
1,981* 5,21*7 1*,878 1*,792
3,552
967
1,923 l*,97l* 6,316 5,207
3,861*
961
535 1*,01*8 3,321 2,71*0
2,652
891*
618 3,31*9 3,391 3,11*7
2,685
57
1,231*
% 1,288
601*
72
1,116 1,280 1,308 1,387
633
1
215 201* 879 761*
296
1
189 3U5
1,61? 673
51*6
Note.—Details may not add to to ta ls because of rounding.
March 3, 1959
Digitized for FRASER http://fraser.stlouisfed.org/ Federal Reserve Bank of St. Louis
1955 and 1957 BUSINESS LOAN SURVEYS
T^ng Outstanding a t Member Banks Reporting Weekly Changes In Loans by Industry (H.12 ser ies) by Business and Size of Borrower and Maturity
(Loans outstanding on October 5, 1955 and October 16, 1957)
E3 HIO Size of borrower ( t o t a l asse ts , in thousands of dollars)
E3 HIO 5 0 - 2 5 0 U n d e r 5 0 N o t a s c e r t a i n e d
Business of borrower All maturit ies 1 year 1 -5 years Over 5 years All maturi t ies 1 year or l ess 1-5 years Over 5 years All maturities 1 year c «r l ess 1 -5 years Over 5 years
Manufacturing and mining: Food, l iquor , and tobacco Text i les , apparel, and leather Metals and metal products Petroleum, coal, chemicals, and rubber
All other
5U,ioo 139,610 112,562
60,863 124,436
54,989 90,783
105,298
40,787 102,690
35,005 132,481
84,007
21,174 90,412
41,004 82,785 80,848
23,818 76,367
9,256 3,816
17,045
33,481 22,702
8,152 5,114
16,482
13,305 17,766
9,840 3,312
11,510
6,208 11,322
5,833 2,883 7,968
3,665 8,557
9,411 22,088 19,190
12,767 27,137
5,022 10,394 15,700
5,919 16,048
5,872 19,979 10,316
2,147 15,184
3,024 8,923 8,510
1,954 8,781
2,451 1,694 5,307
9,246 9,776
1,670 1,321 5,209
1,622 6,917
1,088 416
3,567
1,375 2,177
328 150
1,980
2,343 350
9,343 23,315 29,151
120,978 13,320
10,884 18,520 23,856
171,962 21,876
7,801 22,460 20,038
28,397 10,632
8,507 15,965 4,754
7,343 10,769
965 677
2,525
24,001 2,076
1,271 2,030
13,419
38,370 8,485
576 179
6,589
68,579 612
1,107 525
5,684
126,249 2,623
Trade: Retai l t rade Wholesale t rade Commodity dealers
Manufacturing and mining: Food, l iquor , and tobacco Text i les , apparel, and leather Metals and metal products Petroleum, coal, chemicals, and rubber
All other
3,759 6,315 8,093
2,119 9,199
3,167 4,836 7,660
2,393 7,469
2,314 5,692 5,769
1,144 6,115
1,991 4,210 5,230
1,392 5,024
1,082 482
1,739
780 2,622
807 488
2,029
780 2,001
364 141 586
196 462
369 138 401
222 444
2,496 3,704 4,600
966 7,908
1,961 2,426 4,574
1,203 5,868
1,237 3,082 2,678
560 3,974
897 1,747 2,330
628 3,201
1 , 5 6 l 1,512
3,714
1,020 661
2,005
450 2,602
110 61
409
21 220
ii 238
if
328 882 951
362 1,417
348 470 707
% 1 154 601
141 294 253
89 352
119 433 319
114 786
186 167 383
199 265
14 12 79
94 30
20 9
71
S Trade: Retai l t rade Wholesale t rade Commodity dealers
and other public u t i l i t i e s Construction Real es ta te Service firms All other nonfinancial businesses
930
3,168 10,162
9,890 17,224
7,705
926
3,073 10,068 11,426 17,395
7,905
762
1,064 7,716 5,640
10,011
5,630
827
934 6,478 4,737 9,718
5,796
144
1,965 2,098 1,790 4,706
1,503
81
2,062 3,024 4,444 5,104
1,480
24
140 348
2,460 2,507
572
19
78 565
2,245 2,573
629
207
4,242 6,999 4,194
30,790
9,634
164
5,092 7,166 5,180
27,763
13,366
151
1,288 4,276 2,020
13,905
6,574
120
1,015 4,306 1,341
11,270
5,382
34
2,922 2,593 1,086
15,102
2,675
44
3,988 2,701 3,153
14,297
7,459
21
32 130
1,088 1,783
386
90
2,195
526
66
2,417 2,277 3,133 7,775
13,253
76
775 2,070 2,385 5,119
3,823
60
571
a s 2,443
1,878
39
2li4
1,235
1,331
5
1,562 1,072 1,513 5,032
11,190
37
432 1,378 1,024 3,563
928
1
284
& 301
186
100 59
778 322
1,564
Note.—Details may not add to t o t a l s because of rounding.
March 3, 1959
Digitized for FRASER http://fraser.stlouisfed.org/ Federal Reserve Bank of St. Louis
1955 and 1957 BUSINESS LOAN SURVEYS
Loans Outstanding a t Member Banks Not Reporting Weekly Changes In Loans by Industry, by Business and Size of Borrower and Maturity
(Loans outstanding on October 5, 1955 and October 16, 1957)
Ei+ 2 MO Size of borrower ( to ta l asse ts , in thousands of dol lars)
Ei+ 2 MO A l l b 0 r r 1 0 0 , 0 0 0 0 1 r mo 2 5 , 0 0 0 — 1 0 0 , 0 0 0
Business of borrower All maturi t ies 1 year or l ess 1-5 years Over 5 years All maturit ies 1 year or less 1 -5 years Over 5 years All maturit ies 1 year or less 1 -5 y ears Over 5 years
and other public u t i l i t i e s Construction Real es ta te Service firms All other nonfinancial
businesses
6,381
214:918 67,561* 11,833
11*9,852
51,875
6,587
33,881 81,1*53 52,318
172,040
52,1413
5,911
13,001 52,358 27,196 98,591
39,069
5,925
15,085 56,207 30,336 97,1*12
3l*,638
323
10,670 12,71*7
5,812 31*,91*6
8,116
566
16,812 21,905
8,960 51,093
11,830
11*7
1,21*6 2,1*59 8 , 8 2 b
16,315
U,690
95
1,983 3,3k2
13,021 23,536
5,916
539
138 131
21*
1*61
1*18 1*2
1* 28
30
529
215 35 12
110
5
1*56
235 33 1 8
30
11
51*
7 21
13
6
88 9 1 7
97
120
5
95
2 13
259
136
1*0 19
23
250
278 23 25 92
19
258
108
~2U 11*
18
2U8
2lU 11 12 I48
17
2
12
~~6
1
2
38 12
9 18
16
10 5
5
27
~ 26
2
Note.—Details may not add to t o t a l s because of rounding.
March 3, 1959 - 1* -
Digitized for FRASER http://fraser.stlouisfed.org/ Federal Reserve Bank of St. Louis
1955 and 1957 BUSINESS LOAN SURVEYS
loans Outstanding a t Member Banks Not Reporting Weekly Changes in Loans by Industry, by Business and Size of Borrower and Maturity
(Loans outstanding on October 5# 1955 and October 16, 1957)
Ei+ 2 HO Size of borrower ( to t a l asse ts , i n thousands of dollars) Ei+ 2 HO 5 , o o o — 2 5 , 0 0 0 1 , 0 0 0 — 5 , 0 0 0 2 5 0 — 1 , 0 0 0
Business of borrower All maturit ies 1 year 1-5 years Over 5 years All maturi t ies 1 year or l ess 1-5 years Over 5 years All maturit ies 1 year or less 1-5 years Over 5 years
Manufacturing and mining: Food, l iquor , and tobacco Texti les , apparel, and leather Metals and metal products Petroleum, coal, chemicals, and rubber
All other
23,937 7,231
U3,391
16,812 21,1*17
85,671 25,002
101,856
22,1*78 61,1*26
21,191 7,066
31*,U*o
7,1*53 15,21*6
73,1*38 19,812 65,301*
15,018 1*9,159
1,91*0 165
6,220
8,1*55 It,1*25
12,181 3,1*06
21,680
5,1*1*1 10,1*01
806
3,030
901* 1,71*7
51 1,781*
lit,872
2,020 1,866
59,926 59,025
120,981
5U,365 87,1*01*
88,031* 56,71*8
259,032
105,016 206,855
53,220 53,260 93,821*
38,260 68,785
76,861 1*6,867
171,008
57,039 178,1*78
2,512 3,571*
17,651
15,1*27 13,1*29
6,888 5,151*
70,591
1*5,790 15,261
l*,19l* 2,191 9,506
678 5,190
I*,285 1*,728
17,1*33
2,188 13,116
81*,576 67,286
171*,177
72,809 172,389
155,679 73,665
221*,708
110,755 233,928
66,519 61,851*
125,512
1*8,568 131,361*
123,280 59,702
150,1*60
73,271 159,511
5,501* 2,711
27,389
21,326 22,269
20,385 6,285
1*0,851
33,061* 1*6,812
12,553 2,721
21,277
2,915 18,756
12,01h 7,678
33,397
It,1*20 27,605
Trade: Retai l t rade Wholesale trade Commodity dealers
Manufacturing and mining: Food, l iquor , and tobacco Texti les , apparel, and leather Metals and metal products Petroleum, coal, chemicals, and rubber
All other
W5
328
213 165
281 101* 1*31*
191* 171*
98 79
21*9
127 115
2 i 222
139 121
7 2
61
77 25
37 21
172
1*8 37
30
18
9 25
9 21 1*0
7 16
650 1*72
1,261*
887 1,310
851* 601*
2,186
1,376 2,11*2
? 91*0
tu 603 1*91*
1,291*
91*5 1,635
92 58
210
291 233
190 1*0
706
398 326
36 28
115
1* 91
62 71
185
33 182
2,511* 1,577 5,033
2,675 6,326
3,323 1,91*2 6,31*3
3,568 6,809
1,851 1,1*1*1* 3,650
1,932 5,050
2,338 1,1*53 1*,021
2,320 It,1*67
283 75
828
659 802
690 266
1,563
1,125 1,651*
381 58
555 85
1*71*
295 223 758
123 689
Trade: Retai l t rade Wholesale trade Commodity dealers
and other public u t i l i t i e s Construction Real es ta te Service firms All other nonflnancial businesses
581
316
i : 103
66
596
s 220 287
86
572
167
1 50
571*
139 103 168 131*
81
9
101 25 6
15
8
22
82
U9 130
2
1*8
25
8
12
3 23
3
1,01*8
51*7 1,392 1,1*37
820
683
1,003
791* 2,000 2,791* 1,623
976
991
236 1,060 1,207
591*
5U9
936
315 1,1*02 2,076
983
707
1*6
221* 316 136 127
89
1*0
3 g
186
11
87 16 91* 99
1*1*
27
101 92
1*06 209
83
1,1*21*
2,079 7,1*30 6,792 6,362
3,71*1*
1,736
2,966 9,685
11,838 9,885
1*,792
1,303
l ,0Ul 5,996 U,908 1*,1*1*9
2,769
1,636
1,351 6,560 7,501 6,022
3,385
51
892 1 , 1 1 0
755 1,162
61*1*
9U
1,1*28 2,611 1,650 1,920
701
70
£
331
6
187 511*
2,687 1,91*3
706
Note.—Details nay not add to t o t a l s because of rounding.
March 3, 1959 - 5 -
Digitized for FRASER http://fraser.stlouisfed.org/ Federal Reserve Bank of St. Louis
1955 and 1957 BUSINESS LOAN SURVEYS
Loans Outstanding a t Member Banks Not Reporting Weekly Changes i n Loans by Industry, by Business and Size of Borrower and Maturity
(Loans outstanding on October 5, 1955 and October 16, 1957)
Bl+2 HIO Size of borrower ( to t a l assets , in thousands of dol lars)
Bl+2 HIO 5 0 — 2 5 0 U n d e r 5 0 N o t a s c e r t a i n e d
Business of borrower All maturi t ies 1 year or l ess 1-5 years Over 5 years All maturi t ies 1 year or less 1-5 years Over 5 years All maturities 1 year or less 1-5 3 ears Over 5 years
Manufacturing and mining: Pood, l iquor , and tobacco Text i les , apparel, and leather Metals and metal products Pe t ro lew, coal, chemicals, and rubber
All other
75,632 62,860
138,602
57,515 158,71*9
83,902 69,703
195,879
80,155 201*, 337
52,162 53,7W* 96,632
37,526 122,1*78
1*9,986 56,01*1
111*, 15U
5U,081 1311,612
10,809 3,610
21,396
16,802 19,232
17,611 9,519
1*2,783
18,871* 1*1*,361*
12,660 5,506
2 0 , 5 7 a
3,188 17,039
16,305 a,n*a
38,91*2
7,200 25,361
27,305 13,081 38A36
18,386 1*1,813
i 9 , a o o 11,178 31A38
20,188 a?,922
16,058 U,a29 2a,733
12,251 29,759
9,51*1 8,520
18,852
12,589 26,85a
6,160 92a
7,650
a,899 8,000
6,097 1,981 8,267
6 , 8 3 a 13,508
5,088 728
6,053
1,235 a,05a
3,762 676
a,320
765 7,560
5,211 а,681 8,555
б,996 8,717
a,652 5,553
13,02a
8,137 8,915
3,838
2 $ 3,2a2 5,825
2,886 5,ia? 5 , 1 5 2
5,716 6 , 0 9 a
818 97
1,756
2,366 1,926
% 2,296
1,750 1,326
55a 257 2U2
1,387 966
1,053 339
5,575
672 i ,a95
Trade: Reta i l t rade Wholesale trade Commodity dealers
71*3,538 21*0,385 33,303
1,067,61*2 3 6 2 , 1 * 2 0 1*7,625
528,327 190,680
27,660
687,623 251,918
39,026
87,1*69 23,55k 3,1*05
17U,657 60,169
5,631*
127,71*1 26,150 2,239
205,362 50,33a 2,965
368,670 52,975 6,626
386,922 55,a5a 6,163
238,7a? 39,01*1
5 , a ? a
229,890 37,51*1 5,120
65,398 8,019
?ae
86,119 6a,525 5,916
ao5
70,9ia 6 , 5 9 a
159
37,1*61 9,909 2,367
aa,308 15,216
2,520
2a,259 7,388 2,015
2a,965 10,227
1,992
a,233 98a ia2
7,362 2,301
51
8,969 1,537
210
11,981 2,687
a?6
Other: Sales finance companies Transportation, communication, and other public utilities Construction Real estate Service firms An other nonfinancial businesses
1*0,929
63,157 260,899 277,573 388,373
136,570
16,125
102,261* 323,685 353,727 519,256
182,991
37,681*
30,91*8 205,381 151,766 213,580
81*,1*21*
33,715
a , 7 5 3 232,1*56 171*,931 239,771*
111,189
2,1*51
23,289 36,01*1* 31*,066 65,236
16,688
9,110
1*1,229 61*, 395 51,361*
106,209
29,1*95
79a
8,919 19A75 88,71*1
109,557
35A58
1,300
1 6 , 2 8 2 26,83a
127,a32 173,273
a2,307
a,5a3
3a,936 96,825 60,729
227,853
66,566
3,21*1
as,725 96,a39 60,290
2 a ? , 6 6 3
69,775
a,202
16,077 69,576 33,1*07
119,309
ao,575
2,717
1 6 , 0 6 a 66,385 2a,557
109,012
39,580
338
17,393 21,607 9,302
5a,592
12,759
500
29,770 25,027
16,072
3
1,1*66 5,6a2
18,019 53,951
13,233
23
2,891 5,027
26,238 62,68a ia,123
a,6a3
7,089 i a , U 7
29,016
2,1*11
I8,9a5 i9,?ao 5a,290 1*6,820
27,771
a,502
a,5ao 11,790 19,oa9 2 2 , 2 5 9
2 a , 9 2 2
2,399
10,3a5 11,822 18,367 19,953
1 8 , a o
a
2,260
3',158 5,893
2,680
13
a,623 5,793
10,273 7,28a
3,085
137
289
7,756 e,ma
i , a ia
3,977 2,125
25,656 19,58a
6,2a5
N u m b e r o f 1 0 a n s o u t s t a n d i n g , i n u n i t s
All businesses 281*,61*9 368,170 212,1*36 21*3,733 1*2,61*2 79,295 29,570 a5,ia2 377 ,7^ 3 8 a , 2 3 0 265,65a 238,889 ea,990 na ,8?a 27,101 30,1*68 35,811 25,608 26,11*2 i a , 3 i i 7,275 7,3a2 2 , 3 9 a 3,956
Manufacturing and mining: Food, liquor, and tobacco Textiles, apparel, and leather Metals and metal products Petroleum, coal, chemicals, and rubber All other
Other: Sales finance companies Transportation, communication, and other public utilities Construction Real estate Service firms All other nonfinancial businesses
1,672
7,319 27,358 19,528 1*5,661
11*,21*3
1,823
11,137 3a,929 21*,1*23 60,1*05
18,1*79
1,1*97
3,858 21,607 12,5U7 30,679
10,21*9
1,1*50
5,U36 21*, 1*66 11*,052 31*,821*
12,1*21*
129
2,973 U, 1*1*8 2,1*33 8,1*33
1,907
321
1*,771 8,579 1*,100
ia,a?5
3 , a 8 2
a6
as? 1 , 3 0 3 а,5a9 б,550
2,087
5 2
9 3 0 I ,88a 6,271
II ,106
2,573
687
12,550 29,267 11,73a 88,663
27,05a
6ia
16,935 32,667 11,009 93,28a
25,3a3
6 0 7
6 , 5 5 a 22,101
7,197 57,a52
19,983
5 2 6
6,980 22,533 5,570
52,035
16,222
70
5,672 6,a29 2,122
22,927
a,986
79
9,a93 9,379 2,1*12
32,157
6,939
9
325 737
2,1*15 8 , 2 8 a
2,086
10
1*61 75a
3,027 9,092
2,182
169
1,60a 2 , 0 2 a 1,977 8,09a
6,038
102
1,120 1,971 2,005 6,1*38
2,688
15a
821 1,526 i , i a ? 5,206
$,aa?
99
1*15 1,098
956 3,357
1,770
5
?a2 1*19 3a9
2,262
1*68
3
535 775 1*27
1,955
520
10
ai 7 9
1*81 626
123
1 7 1 98
622 1,125
398
Note.—Details may not add to t o t a l s because of rounding.
March 3, 1959 — 6 —
Digitized for FRASER http://fraser.stlouisfed.org/ Federal Reserve Bank of St. Louis