FEDERAL RESERVE H.6 (508) F or immediate release January 23, 198f Money stock measures and related data have been benchmarked to the December 1979 and March 1980 call reports. In addition, daily deposits data from all nonmember commercial banks with total deposits greater than $15 mil- lion as of December 1979 were incorporated into the series. These nonmember banks have been reporting daily deposits data since November of last year in conjunction with the implementation of the Monetary Control Act of 1980. This revision also includes revised estimates of deposits at credit unions and other minor deposit items at all thrift institutions. In addition, the revi- sion incorporates benchmarks for overnight and term RP's, and the "L 11 series— M-3 plus other liquid assets—has been revised back to late 1969 to incorpor- ate new estimates of term Eurodollar assets of U.S. nonbank holders. Revised historical data for the past four years on a monthly basis and for the past two years on a weekly basis are attached. The benchmark adjustments had only a minor impact on the levels of Ml-A and Ml-B. The adjustments to M-2 and M-3 were larger in absolute terms, but still small in terms of the growth rates of those series. The level of M-2 was raised about $500 million in late 1979 and about $5.0 billion in late 1980. M-3 was unchanged in late 1979 but the level of the series was gradu- ally raised about $6.5 billion over the course of 1980. The major factor con- tributing to the upward adjustment in the broader money stock measures was a revised estimate of the RP data derived from the March call report, and is subject to further revision as later call reports become available. The Euro- dollar adjustments, affecting n L", reflect recently available estimates of Eurodollar CDs held in custody by banks in London for the account of banks in the U.S. which are beneficially owned by nonbank U.S. residents. The impact of benchmark adjustments on growth rates was minimal. (over) Digitized for FRASER http://fraser.stlouisfed.org/ Federal Reserve Bank of St. Louis
Transcript
FEDERAL RESERVE
H.6 (508) For immediate releaseJanuary 23, 198f
Money stock measures and related data have been benchmarked to the
December 1979 and March 1980 call reports. In addition, daily deposits data
from all nonmember commercial banks with total deposits greater than $15 mil-
lion as of December 1979 were incorporated into the series. These nonmember
banks have been reporting daily deposits data since November of last year in
conjunction with the implementation of the Monetary Control Act of 1980. This
revision also includes revised estimates of deposits at credit unions and
other minor deposit items at all thrift institutions. In addition, the revi-
sion incorporates benchmarks for overnight and term RP's, and the "L11 series—
M-3 plus other liquid assets—has been revised back to late 1969 to incorpor-
ate new estimates of term Eurodollar assets of U.S. nonbank holders. Revised
historical data for the past four years on a monthly basis and for the past
two years on a weekly basis are attached.
The benchmark adjustments had only a minor impact on the levels of
Ml-A and Ml-B. The adjustments to M-2 and M-3 were larger in absolute terms,
but still small in terms of the growth rates of those series. The level of
M-2 was raised about $500 million in late 1979 and about $5.0 billion in late
1980. M-3 was unchanged in late 1979 but the level of the series was gradu-
ally raised about $6.5 billion over the course of 1980. The major factor con-
tributing to the upward adjustment in the broader money stock measures was a
revised estimate of the RP data derived from the March call report, and is
subject to further revision as later call reports become available. The Euro-
dollar adjustments, affecting nL", reflect recently available estimates of
Eurodollar CDs held in custody by banks in London for the account of banks in
the U.S. which are beneficially owned by nonbank U.S. residents.
The impact of benchmark adjustments on growth rates was minimal.
(over)Digitized for FRASER http://fraser.stlouisfed.org/ Federal Reserve Bank of St. Louis
The weekly monetary data must be interpreted with particular
caution during the current period, when NOW accounts are being introduced
on a nationwide basis at depository institutions, accompanied by heavy
promotional efforts. Very large shifts of funds into interest-bearing
checking accounts have been evident in early January and have distorted
monetary statistics. The significance of these flows will be in
substantial part dependent on the ultimate sources of the funds. Because
of the irregularity of deposit and other flows, it will take some time
to assess the impact of these movements. Weekly data around year end are,
in any event, subject to erratic fluctuations. As these extraordinary
flows subside over the course of coming weeks, more reliable judgments
will be possible about the trend of deposit growth.
Digitized for FRASER http://fraser.stlouisfed.org/ Federal Reserve Bank of St. Louis
FEDERAL RESERVE statistical release
H.6 (508)
Table 1
MONEY STOCK MEASURES AND LIQUID ASSETSBillions of dollars, seasonally adjusted unless otherwise noted
For Immediate Release
JAN. 2 3 , 1981
Date
1979 -DEC.
1 9 8 0 - J A N .FEE.MAP..
APR.MAYJUNE
JULYAUG.SEPT.
OCT. PNOV. ?DEC. P
WEEK ENDING:
1980 -DEC. 3 P10 P1 7 J P24 P31 P
1 9 8 1 - J A N . 7 P14 ?
Ml-A
Currencyplus demand
deposits1
3 6 9 . 8
370.6373.5372.8
366.7367.1370.9
373.5379.5383.4
386.3388.4384.8
387.8386.0386.2383.3380.4
382.8374.1
M1-B
M1-Aplusother checkable
deposits at banksand thrift
institutions2
386.9
388.3391.439U2
386.3386.1391.3
395.5402.7408.0
412.0415.0411.9
414.7413.4413,4410.3407.2
419.2416,9
Addenda:
Overnight RPsat commercial
banks plusovernight
Eurodollars 3
NSA
25.3
27.028.326.3
22.123.324.6
29.131.633.0
32.532.633.1
30.434.435.832.528.5
32.635.6
Money marketmutual fund
shares
NSA
4 3 . 6
4 9 . 156.760.9
60.466.874.2
80.680.778.2
77.477.075.8
76.676.676.375.374.6
76.078.7
M2MI-Bplus
overnight RPsand Eurodollars,
MMMF shares, andsavings and smalltime deposits at
commercial banksand thrift
institutions^
1 5 2 6 . 0
1 5 3 4 . 71 5 4 7 . 61554.4
1550.41563.71587.6
1612.51632.51644.4
1656.51671.01674.8
M3
M2 plus largetime deposits
and term RPs atcommercial banks
and thriftinstitutions5
1 7 7 5 . 5
1 7 8 6 . 61 8 0 5 . 41 8 1 2 . 8
1 8 1 1 . 91825.71846.2
1867.71889.51904.6
1921.81946.31961.0
L
M3 plus otherliquid assets*)
2151 .8
2166 .42188 .62203.5
2213.72230.72243.6
2259.42285.22309.7
2323.5
1/ INCLUDES (1) DEMAND DEPOSITS AT ALL COMMERCIAL BANKS OTHER THAN THOSE DUE TO DOMESTIC BANKS, THE U.S.GOVEF.NMENT AND FOREIGN BANKS AND OFFICIAL INSTITUTIONS LESS CASH ITEMS IN THE PROCESS OF COLLECTION ANDF.R. FLOAT; AND (2) CURRENCY OUTSIDE THE TREASURY, F.R. BANKS AND THE VAULTS OF COMMERCIAL BANKS.
2/ M1-A PLUS NOW AND ATS ACCOUNTS AT BANKS AND THRIFT INSTITUTIONS, CREDIT UNION SHARE DRAFT ACCOUNTS ANDDEMAND DEPOSITS AT MUTUAL SAVINGS BANKS.
3/ OVERNIGHT(AND CONTINUING CONTRACT) RPS ARE THOSE ISSUED BY COMMERCIAL BANKS TO THE NCNBANK PUBLIC, ANDOVERNIGHT EURODOLLARS ARE THCSE ISSUED BY CARIBBEAN BRANCHES OF MEMBER BANKS TO U.S. NONBANK CUSTOMERS.
4/ SMALL DENOMINATION TIME DEPOSITS ARE THOSE ISSUED IN AMOUNTS OF LESS THAN" $100,000. M2 WILL DIFFER FROMTHE SUM OF COMPONENTS PRESENTED IN SUBSEQUENT TABLES BY A CONSOLIDATION ADJUSTMENT THAT HAS BEEN MADE TOAVOID DOUBLE COUNTING OF THE PUBLIC'S MONETARY ASSETS. THE DIFFERENCE REPRESENTS THE AMOUNT OF DEMANDDEPOSITS HELD BY THRIFT INSTITUTIONS AT COMMERCIAL BANKS.
5/ LARGE DENOMINATION TIME DEPOSITS ARE THOSE ISSUED IN AMOUNTS OF $100,000 OR MORE AND ARE NET OF THE HOLDING,OF DOMESTIC BANKS, THRIFT INSTITUTIONS, THE U.S. GOVERNMENT, MONEY MARKET MUTUAL FUNDS AND FOREIGN BANKS ANOFFICIAL INSTITUTIONS. TERM RPS ARE NET OF RPS HELD BY MONEY MARKET MUTUAL FUNDS.
6/ OTHER LIQUID ASSETS INCLUDE THE NONBANK PUBLIC'S HOLDINGS OF U.S. SAVINGS BONDS, SHORT-TERM TREASURYSECURITIES, COMMERCIAL PAPER, BANKERS ACCEPTANCES AND TERM EURODOLLARS NET Of MONEY MARKET MUTUAL FUNDHOLDINGS OF THESE ASSETS.
NOTE: P INDICATES PRELIMINARY DATA. SPECIAL CAUTION SHOULD BE TAKEN IN INTERPRETING WEEK-TO-WEEK CHANGESIN MONEY SUPPLY DATA, WHICH ARE OFTEN HIGHLY VOLATILE AND SUBJECT TO REVISION IN SUBSEQUENT WEEKS ANDMONTHS. PRELIMINARY DATA ARE SUBJECT TO WEEKLY REVISIONS UNTIL THEY ARE FINAL.
Digitized for FRASER http://fraser.stlouisfed.org/ Federal Reserve Bank of St. Louis
H.6 (508)
Table 1A
MONEY STOCK MEASURES AND LIQUID ASSETSBillions of dollars, not seasonally adjusted
Date
1979-DEC.
1 9 8 0 - J A N .FEB.MAR.
APP.MAYJUNE
JULYAUG.SEPT.
OCT. PNOV. PDEC. P
WEEK ENDING:
1980-DEC. 3 P10 P17 P2$ P31 P
1 9 8 1 - J A N . 7 P14 P
M1-A
Currencyplus demand
deposits 1
379.4
375.4365.3366.0
370.0361.5369.7
375.5377.3382.6
388.0391.1394,7
393.3394.5396.5393.3393.2
399.4384.0
M1-B
MI-Aplusother checkable
deposits at banksand thrift
institutions2
396.4
393.0383.2384.4
389.6380.5390.2
397.5400.5407.2
413.7417.7421.8
420.3421.9423.7420.3420.0
435.8426.9
Addenda:
Overnight RPsat commercial
banks plusovernight
Eurodollars3
25.3
27.028.326.3
22.123.324.6
29.131.633.0
32.532.633.1
30.434.435.832.528.5
3 2.635.6
Money marketmutual fund
shares
43.6
49.156.760.9
60.466.874.2
80.680.778.2
77.477.075.8
76.676.676.375.374.6
76.078.7
M2MI-Bplus
overnight RPsand Eurodollars,
MMMF shares, andsavings and smalltime deposits at
commercial banksand thrift
institutions4
1527.7
1538.11539.51551.3
1558.61560.81589.4
1618.01629.51642.3
1656.91665.81676.2
M3
M2 plus largetime deposits
and term RPs atcommercial banks
and thriftinstitutions^
1 7 8 0 . 8
1 7 9 1 . 91 7 9 7 . 41 8 1 0 . 6
1 8 1 8 . 11 8 2 1 . 71 8 4 5 . 6
1870.81886.61902.3
1923.01942.31966.0
L
M3 plus otherliquid assets**
2 1 5 4 . 3
2 1 7 3 . 02 1 8 6 . 02 2 0 4 . 1
2221.72225.02241.8
2260.72231.12299.2
2322.4
NOTE: SEE TABLE 1 FOR FOOTNOTES.
Digitized for FRASER http://fraser.stlouisfed.org/ Federal Reserve Bank of St. Louis
H.6 (508)
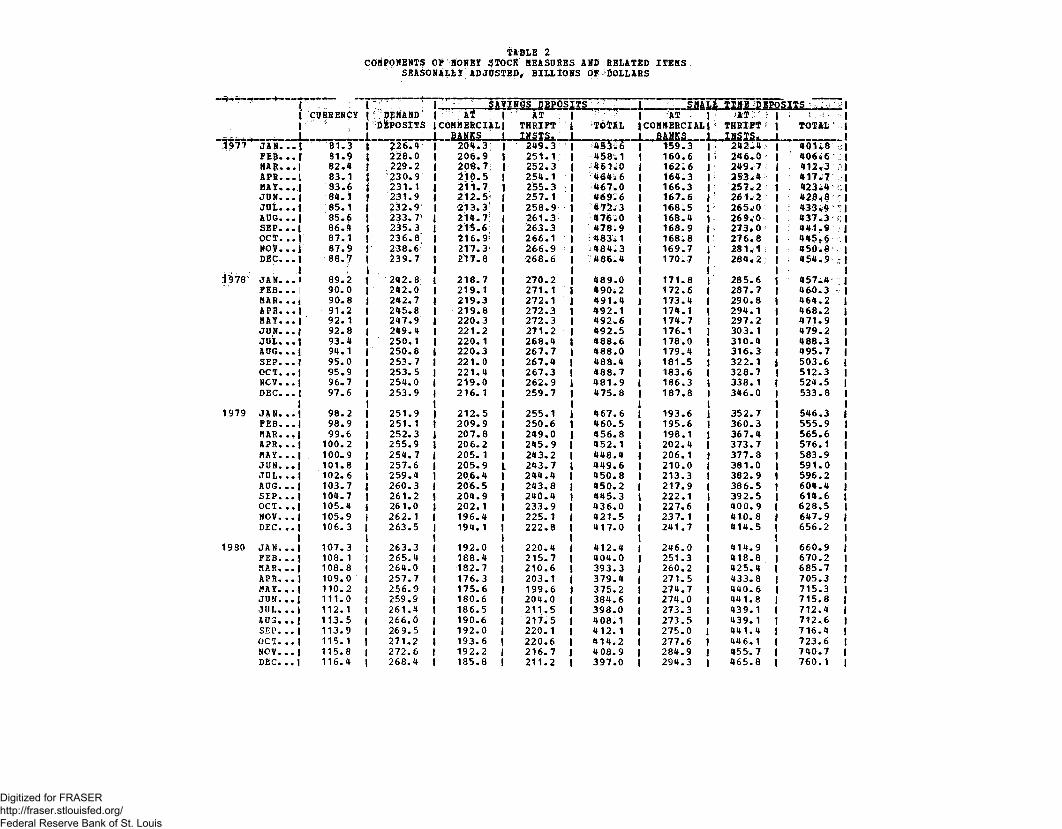
Table 2
MONEY STOCK MEASURES AND LIQUID ASSETSPercent change at seasonally adjusted annual rates
DEC.
SEPT.
JUNE
DEC.
TOURFROM
OCT.
JULY
JAN.
FROM:
1980
1980
1979
BIJEKSPOUR
15,
16 ,
16,
Date
(3 MONTHS PREVIOUS)
(6 MONTHS PREVIOUS)
(12 MONTHS PREVIOUS)
ENDING: JAN. 14 , 1981WEEKS ENDING:
1980 (13 WEEKS PREVIOUS)
1980 (26 WEEKS PREVIOUS)
1980 (52 WEEKS PREVIOUS)
M1-A
Currencyplus demand
deposits 1
1.5
7 . 5
4 . 1
-4.2
4 . 3
2 . 5
M1-B
M1-Aplusother checkable
deposits at banksand thrift
institutions 2
3 . 8
10.5
6 . 5
4 . 0
10.1
6 . 4
M2MI-Bplus
overnight RPsand Eurodollars,
MMMF shares, andsavings and smalltime deposits at
commercial banksand thrift
institution s^
7 . 4
1 1 . 0
9 . 8
M3
M2 plus largetime deposits
and term RPs atcommercial banks
and thriftinstitutionsS
1 1 . 3
12.4
10.4
NOTE: SEE TABLE 1 FOR FOOTNOTES,
Digitized for FRASER http://fraser.stlouisfed.org/ Federal Reserve Bank of St. Louis
H.6 (508)
Table 3COMPONENTS OF MONEY STOCK MEASURES AND LIQUID ASSETSBillions of dollars, seasonally adjusted unless otherwise noted
Date
1979-DEC.
1980 -JAN.FEB.MAR.
APR.MAYJUNE
JULYAUG.SEPT.
OCT. PNOV. PDEC. F
WEEK ENDING:
1980-DEC. 3 P10 P17 P24 P31 P
1981 -JAN. 7 ?14 P
Currency1
1 0 6 . 3
107.3108.1108.8
109.0110.2111.0
112. 1113.5113.9
115. 1115.8116.4
116.1116.1116.3116.7116.9
116.6116.4
Demanddeposits 2
263.5
263.3265.4264.0
257.7256.9259.9
261.4266.0269.5
271.2272.6268.4
271.7269.9269.9266.6263.5
266.1257.7
Othercheckabledeposits 3
NSA
17.0
17.717.918.4
19.519.020.4
22.023.224.6
25.726.627.1
26.927.327.227.026.8
36.442.8
OvernightRPs(net) 4
NSA
2 1 . 7
23.024.222.7
19.420.521.7
25.527.929.2
28.127.928.5
25.830.230.828.323.6
27.430.6
OvernightEuro-
dollarsS
NSA
3 . 6
4 . 14 . 13 . 6
2 . 72 . 82 . 9
3 . 63 . 73 . 7
4 .44 . 74 . 6
4 . 64 . 15 . 04 . 24 . 9
5 . 25 . 0
Moneymarketmutualfunds 6NSA
43.6
49. 156.760.9
60.466.874.2
80.680.778.2
77.477.075.8
76.676.676.375.374.6
76.078.7
Savings depositsat
commercialbanks
1 9 4 . 1
1 9 2 . 01 8 8 . 41 8 2 . 7
1 7 6 . 3175.6180.6
186.5190,6192.0
193.6192.2185.8
190.0188.7186.8184.2182.0
180.3178.4
atthrift
institutions
222.8
220.4215.7210.6
203. 1199.6204.0
211.5217.5220.1
220.6216.7211.2
total
417.0
412.44 04.0393.3
379.4375.2384.6
398.0408.1412.1
414.2408.9397.0
Small denomination time deposits?at
commercialbanks
2 4 1 . 7
246.0251.3260.2
271.5274.7274.0
273.3273.5275.0
277.6284.9294.3
289.3291.2293.2295.9299.5
299.8302.9
atthrift
institutions
414.5
414.9418.8425.4
433.8440.6441.8
439.1439.1441.4
446.1455.7465.8
total
656.2
660.9670.2685.7
705.?715.3715.8
712.4712.6716.4
723.6740. 7760. 1
1/ CURRENCY OUTSIDE THE U.S. TREASURY, F.R. BANKS AND VAULTS OF COMMERCIAL BANKS.2/ DEMAND DEPOSITS AT COMMERCIAL BANKS AND FOREIGN RELATED INSTITUTIONS OTHER THAN THOSE DUE TO DOMESTIC BANKS, THE U.S. GOVERNMENT
AND FOREIGN BANKS AND OFFICIAL INSTITUTIONS LESS CASH ITEMS IN THE PROCESS OF COLLECTION AND F.R. FLOAT.3/ INCLUDES ATS AND NOW BALANCES AT ALL INSTITUTIONS, CREDIT UNION SHARE DRAFT BALANCES AND DEMAND DEPOSITS AT MUTUAL SAVINGS
B A NK S .4/ INCLUDES OVERNIGHT AND CONTINUING CONTRACT RPS ISSUED TO THE NONBANK PUBLIC BY COMMERCIAL BANKS, NET OF AMOUNTS HELD BY MONEY
MARKET MUTUAL FUNDS.5/ ISSUED EY CARIBBEAN BRANCHES OF U.S. MEMBER BANKS TO U.S. NONBANK CUSTOMERS.6/ TOTAL MCNEY MARKET MUTUAL FUND SHARES OUTSTANDING.7/ SMALL DENOMINATION TIME DEPOSITS ARE THOSE ISSUED IN AMOUNTS OF LESS THAN $100,000.
Digitized for FRASER http://fraser.stlouisfed.org/ Federal Reserve Bank of St. Louis
H.6 (508)
Table 3—continued
COMPONENTS OF MONEY STOCK MEASURES AND LIQUID ASSETSBillions OT aoiiars, seasonally aa
Date
1979-DEC.
1980-JAN.FEB.MAR.
APR.MAYJUNE
JULYAUG.SEPT.
OCT. PNOV. PDEC. P
WEEK ENDING:
1980-DEC. 3 P10 P17 P24 P31 P
1981-JAN. 7 P14 P
ustea unless otilerwise noteaLarge denomination time deposits1
at commercialbanks2
188.7
189.7193.9195.4
197.5197.2192.7
187.8186.6189.0
190.4197.6206.4
202.4202.8204.5208.8212.1
213.5215.0
at thriftinstitutions
30.3
31.933.534.1
34.935.935.9
36.236.737.8
39.441.343.3
total
219.0
221.6227.4229.5
232.4233.1228.6
224.0223.3226.8
229-8238.8249.7
at commercialbanksNSA
23.8
23.723.722.2
22.522.523.5
24.727.326.4
28.028.928.9
31.527.326.729.034.7
30.729.2
Term RPs3at thrift
institutionsNSA
6 . 7
6 . 66 . 66 . 7
6 . 76 . 56 . 5
6 . 56 . 57 . 0
7 . 57 . 57 . 6
totalNSA
30.5
30.330.328.9
29.128.930.0
31.133.833.5
35.536.536.5
TermEurodollars
(net)4NSA
4 3 . 1
4 6 . 049.649.0
50.250.549. 1
48.347.944.3
43.0
Savingsbonds
80.0
79.278.176.8
75.274.073.3
72.872.673.2
74.6
Short-termTreasurysecurities^
127.5
127.8129.4137.2
147.3152.8149.5
145.9150.1159.1
155.0
Bankersacceptances^
28.4
27.726,927.9
28.528.329.1
28.928.530.0
31.0
Commercialpaper7
97.3
99.099.399.8
100.699.596.5
95.896.698.5
98.3
1/ LARGE DENOMINATION TIKE DEPOSITS ARE THOSE ISSUED IN AMOUNTS OF $100,000 OR MORE.2/ LARGE DENOMINATION TIME DEPOSITS AT COMMERCIAL BANKS LESS LARGE TIME HELD BY MONEY MARKET MUTUAL FUNDS AND THRIFT INSTITUTIONS.
TERM RPS ARE THOSE WITH ORIGINAL MATURITY GREATER THAN ONE DAY AND EXCLUDE CONTINUING CONTRACTS.TERM EURODOLLARS ARE THOSE WITH ORIGINAL MATURITY GREATER THAN ONE DAY NET OF TERM EURODOLLARS HELD BY MONEY MARKET MUTUALFUNDS.
5/ INCLUDES U.S. TREASURY BILLS AND COUPONS WITH REMAINING MATURITY OF LESS THAN 18 MONTHS HELD BY THE NONBANK PUBLIC LESS SUCHSECURITIES HELD BY MONEY SABKET MUTUAL FUNDS.NET OF BANKERS ACCEPTANCES HELD BY ACCEPTING BANKS, F.R. BANKS, FOREIGN OFFICIAL INSTITUTIONS, THE FEDERAL HOME LOAN BANKSYSTEM, AND MONEY MARKET MUTUAL FUNDS.TOTAL COMMERCIAL PAPER LESS COMMERCIAL PAPER HELD BY MONEY MARKET MUTUAL FUNDS.
3/
V
6/
7/
Digitized for FRASER http://fraser.stlouisfed.org/ Federal Reserve Bank of St. Louis
H.6 (508)
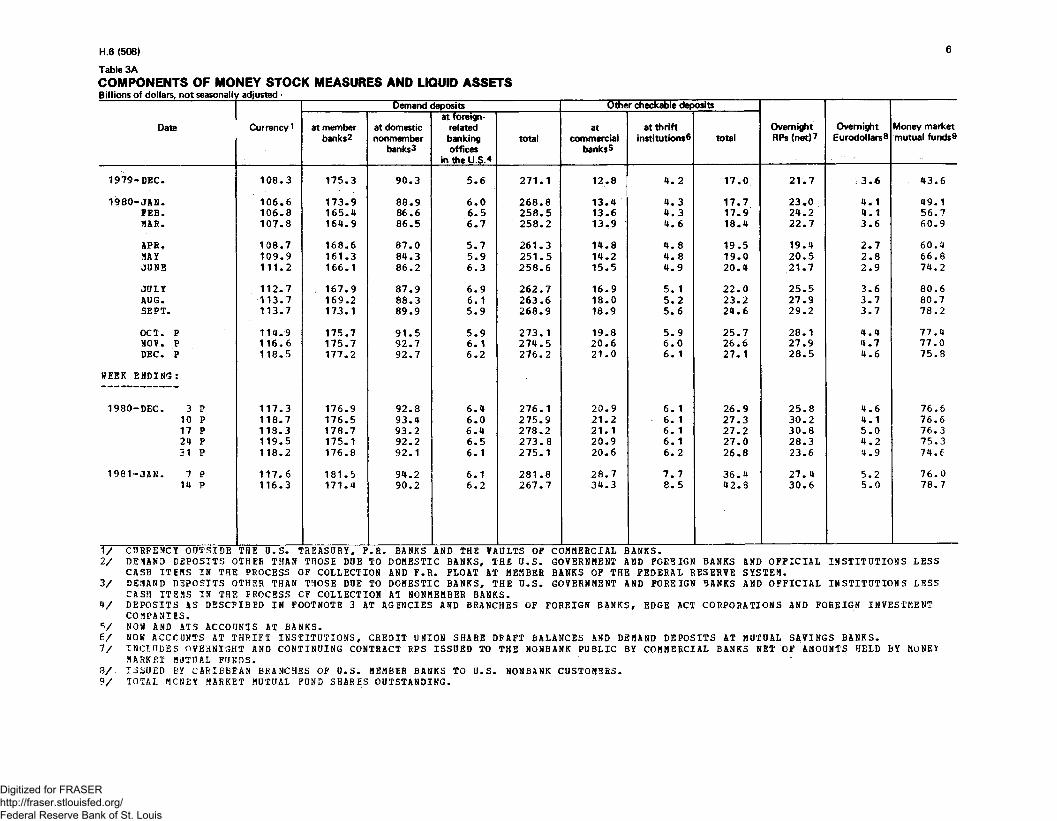
Table 3A
COMPONENTS OF MONEY STOCK MEASURES AND LIQUID ASSETSBillions or dollars, not seasonal̂ 1 adjusted -
Date
1979-DEC.
1 9 8 0 - J A N .FEB.MAP.
APB,MAYJUNE
JULYAUG.SEPT.
OCT. PNOV. PDEC. P
WEEK ENDING:
1980-DEC. 3 P10 P17 P24 P31 P
1 9 8 1 - J A N . 7 P1U P
Currency 1
1 0 8 . 3
1 0 6 . 61 0 6 . 8107.8
108.7109.9111.2
112.7113.7113.7
114.9116.6118.5
117.3118.7118.3119.5118.2
117.6116.3
at memberbanks?
175.3
173.9165.4164.9
168.6161.3166.1
167.9169.2173.1
175.7175.7177.2
176.9176.5178.7175.1176.8
181.5171.4
Demand deposits
at domesticnonmember
banks3
90.3
88*986.686.5
87.084.386.2
87.988.389.9
91.592.792.7
92.893.493.292.292.1
94.290.2
at foreign-relatedbankingoffices
in the U.S.*
5 . 6
6.06.56.7
5.75.96.3
6.96.15.9
5.96.16.2
6.46.06.46.56.1
6.16.2
total
271.1
268.8258.5258.2
261.3251.5258.6
262.7263.6268.9
273.1274.5276.2
276.1275.9278.2273.8275.1
281.8267.7
6ther checkable deposits
atcommercial
banksS
12.8
13.413.613.9
14.814.215.5
16.918.018.9
19.820.621.0
20.921.221.120.920.6
28.734.3
at thriftinstitutions^
4 . 2
4 . 34 . 34 . 6
4 . 84 . 84 . 9
5 . 15 . 25 . 6
5 .96 . 06 . 1
6 . 16. 16. 16 . 16 .2
7 . 78 .5
total
17,0
17.717.918.4
19.519.020.4
22.023.224.6
25.726.627.1
26.927.327.227.026.8
36.442.3
OvernightRPs(net)7
21.7
23*024.222.7
19.420.521.7
25.527.929.2
28.127.928.5
25.830.230.828.323.6
27.430.6
OvernightEurodollars
3 . 6
4-14.13.6
2.72.82.9
3.63.73.7
4.44.74.6
4.64.15.04.24.9
5.25.0
Money marketmutual funds9
43.6
49.156.760.9
60.466.874.2
80.680.778.2
77.477.075.8
76.676.676.375.374.6
76.078.7
1/ CURRENCY OUTSIDE THE U.S. TREASURY, F.R. BANKS AND THE VAULTS OF COMMERCIAL BANKS.2/ DE1AND DEPOSITS OTHER THAN THOSE DUE TO DOMESTIC BANKS, THE U.S. GOVERNMENT AND FOREIGN BANKS AND OFFICIAL INSTITUTIONS LESS
CASH ITEMS IN THE PROCESS OF COLLECTION AND F.R. FLOAT AT MEMBER BANKS OF THE FEDERAL RESERVE SYSTEM.3/ DEiAND DEPOSITS OTHER THAN THOSE DUE TO DOMESTIC BANKS, THE U.S. GOVERNMENT AND FOREIGN BANKS AND OFFICIAL INSTITUTIONS LESS
CASH ITEMS IN THE PROCESS CF COLLECTION AT NONMEMBER BANKS.4/ DEPOSITS AS DESCPIBED IN FOOTNOTE 3 AT AGENCIES AND BRANCHES OF FOREIGN BANKS, EDGE ACT CORPORATIONS AND FOREIGN INVESTMENT
COMPANIES.V NOW AND ATS ACCOUNTS AT BANKS.6/ NOW ACCOUNTS AT THRIFT INSTITUTIONS, CREDIT UNION SHARE DPAFT BALANCES AND DEMAND DEPOSITS AT MUTUAL SAVINGS BANKS.7/ INCLUDES OVERNIGHT AND CONTINUING CONTRACT RPS ISSUED TO THE NONBANK PUBLIC BY COMMERCIAL BANKS NET OF AMOUNTS HELD BY MONE*
MARKET MJTIUL FUNDS.8/. ISSUED EY CABIEBFAN BRANCHES OF U.S. MEMBER BANKS TO U.S. NON3ANK CUSTOMERS.9/ TOTAL MCNEY MARKET MUTUAL FUND SHARES OUTSTANDING.
Digitized for FRASER http://fraser.stlouisfed.org/ Federal Reserve Bank of St. Louis
H.6 (508)
Table 3A—continued
COMPONENTS OF MONEY STOCK MEASURES AND LIQUID ASSETSDinions OT aoiiars, not
Date
1979-DSC.
1980 -JAN.FEB.MAR.
APE.MAYJUNE
JULYAUG.SEPT.
OCT. PNOV. PDEC. P
WEEK ENDING:
1980-DEC. 310172431
1981-JAN. 714
seasonan
PPPPP
PP
/ adjusted
at commercialbanks
192 .3
1 9 1 . 1187 .3183 .4
1 7 8 . 0176.7181.2
187.6190.8191.6
192.9191.0184.1
188.8187.6185.2182.0179.6
179.3177.7
at savingsand loans
1 1 8 . 1
1 1 6 . 5113.5111.1
106.8104.8108.3
112.9116.0117.7
117.2114.0109.0
1 / SMALL DENOMINATION TIME DEPOSITS ARE
Savings deposits
TH
at mutualsavings banks
59.9
59.057.556.3
54.353.254.2
55.756.657.0
56.755.955.1
OSE ISSUED
atcredit unions
43.9
43.342.642.9
42.742.243.2
44.945.546.0
46.246.046.1
IN AMOUNTS OF
total
414.1
409.8400.9393.6
381.8376.9386.9
401.0408.8412.4
412.9406.8394.3
LESS THAN
at commercialbanks
239.3
245.5252.1261.0
271.8275.8275.4
273.6273.2275.0
278.4282.7291.3
285.8 ,288.0289.9293.0296.9
299.5301.7
$100,000.
Small denomination time deposits'!at savingsand loans
322.4
325.7329.1333.8
339.3341.7341.7
340.2338.5339.8
343.7349.1358.1
at mutualsavings banks
7 9 . 7
80.781.783.3
85.686.987.1
86.986.887.3
88.589.791.0
atcredit unions
9 . 8
10.210.510.9
11.212.012.4
12.212.612.7
13.113.513.8
total
6 5 1 .
662.673.689.
707.716.716.
712.711 .714.
723.734.754.
2
040
946
919
793
Digitized for FRASER http://fraser.stlouisfed.org/ Federal Reserve Bank of St. Louis
H.6 (508)
Table 3A—continued
COMPONENTS OF MONEY STOCK MEASURES AND LIQUID ASSETSBillions of dollars, not seasonally adjusted
Date
1979-DEC.
1980-JAN.FEB.MAR.
APR.MAYJUN2
JULYAUG.SEPT.
OCT. PMOV. PDEC. P
WEEK ENDING :
1980-DFC. 3 ?10 P17 P24 P31 P
1981-JAN. 7 P14 P
Large denomination time deposits'1
atcommercial
banks2
193.0
192.4194.9197.0
195.9196.2189.8
184.6185.4187.7
190.6198.9211. 1
205.0206.9209.4213.9216.9
217.5218.2
at savingsand loans
26.8
28.429.930.6
31.632.833.5
34. 135.035.9
37 .138.039 .1
at mutualsavingsbanks
2 . 7
2.82.82.8
2.92.92.9
2.92.92.9
2.93.03.0
total
222.6
223.5227.6230.4
230.4231.9226.2
221.7223.3226.5
230.6240.0253.2
Term RPs3
atcommercial
banks
23.8
23.723.722.2
22.522.523.5
24.727.326.4
28.028.928.9
31.527.326.729.034.7
30.729.2
at thriftInstitutions
6 . 7
6.66.66.7
6.76.56.5
6.56.57.0
7.57.57.6
total
30.5
30.330.328.9
29 .128.930.0
31 .133.833.5
35.536.536.5
TermEurodollars
(net)4
43.1
46.049.649.0
50.250.549.1
48.347.944.3
43.0
Savingsbonds
80 .0
79 .278 .276 .8
7 5 . 173 .973 .5
73.373.273. 1
73.0
Short-termTreasurysecurities5
127.1
130.4132. 6139.0
148.6152.6146.9
143.3148.9152.9
155.3
Bankersacceptances^
26 .1
26.828 .228 .9
29 .02 9 . 029 .4
28 .828 .83 CO
30 .8
Commercialpaper7
97.2
98. 7100.0
99.8
100.797.497.3
96.295.696.6
97.3
1/ LARGE DENOMINATION TIME DEPOSITS ARE THOSE ISSUED IN AMOUNTS OF $100,000 OR MORE.2/ TARGE OENOIINATION TIME DEPOSITS AT CCMMEKCIAL BANKS LESS LARGE TIME HELD BY MONEY MARKET MUTUAL FUNDS AND THRIFT
INSTITUTIONS.3/ 12P.3 *?PS AftS THOSE WITH ORIGINAL MATURITY GREATER THAN ONE DAY AND EXCLUDE CONTINUING CONTRACTS.4/ TEIia EURODOLLARS ARE THOSE WITH ORIGINAL MATURITY GREATER THAN ONE DAY NET OF TERM EURODOLLARS HELD BY MONEY MARKET MUTUAL
FUNDS.5/ INCLUDES U.S. TREASURY BILIS AND COUPONS WITH REMAINING MATURITY OF LESS THAN 18 MONTHS HELD BY THE NONBANK PUBLIC LESS SUCH
SECURITIES HELD 3Y MONEY MARKET MUTUAL FUNDS.6/ NET OF EANKEPS ACCEPTANCES HELD BY ACCEPTING BANKS, F.R. BANKS, FOREIGN OFFICIAL INSTITUTIONS, THE FEDERAL HOME LOAN BANK
SYSTEM, AND MONF.Y MARKET MUTUAL FUNDS.7/ TOTAL COMMERCIAL PAPER LESS COMMERCIAL PAPER HELD BY MONEY MARKST MUTUAL FUNDS,
Digitized for FRASER http://fraser.stlouisfed.org/ Federal Reserve Bank of St. Louis
H.6 (506)
Table 4
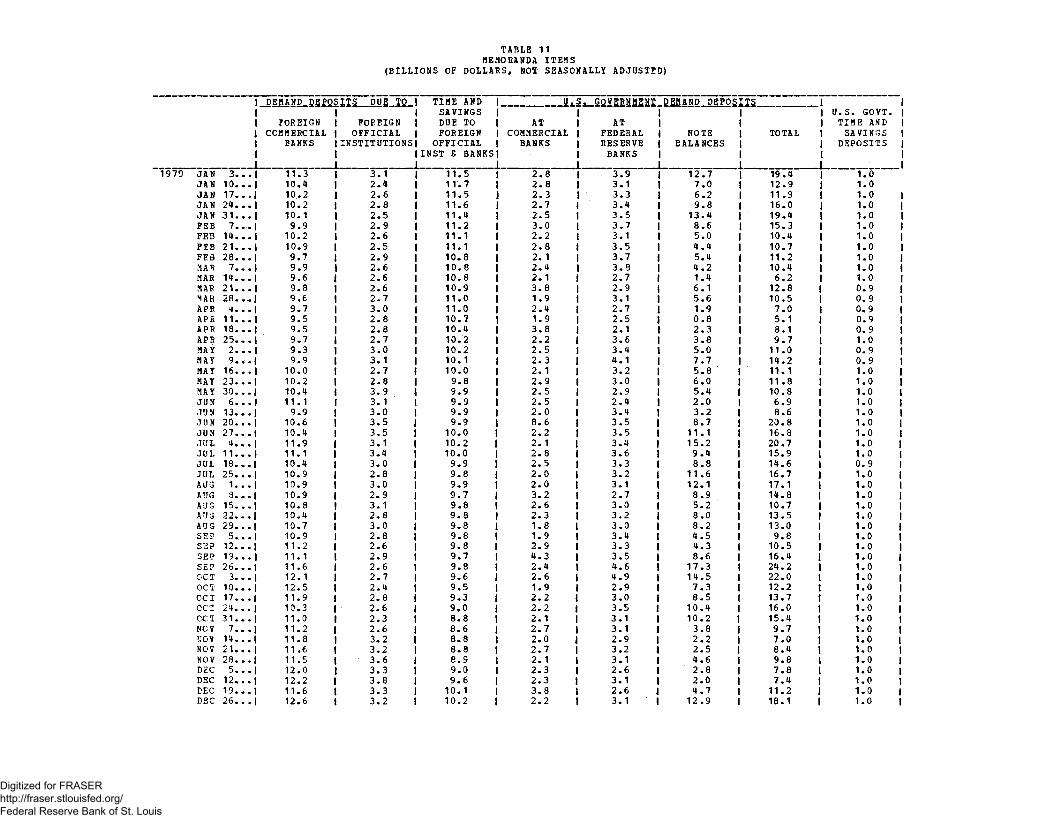
MEMORANDA ITEMS
Date
1979-DEC.
1 9 8 0 - J A N .FEB.HAB.
APE.HATJUNE
JULYAUG.SEPT.
OCT. PNOV. PDEC. P
'*E2K ENDING
1990-DEC.
1 9 8 1 - J A N .
•
31017243 1
714
PPPPP
PP
Demand deposits at banks due to
foreign commercialbanks
12.2
11.812.012.8
12.413.011.9
11.311.211.3
11.511.912.0
11.112.311.412.412.5
11.311.0
foreign officialinstitutions
3.4
3.53.33.2
3.83.73.2
3.33.22.9
3.03.43.6
3.83.43.23.74.2
3.43.3
Time and savingsdeposits due to
foreign commercialbanks and foreign
official institutions
9 .9
9.69.19.4
10.110.511.1
11.111.111.4
11.611.511.7
1 1 . 51 1 . 61 1 . 51 1 . 81 1 . 8
1 1 . 71 1 . 5
U.S.demand deposits at
commercial banks
2 .7
3.12.72.7
3.62.63.2
3.22.83.2
3.02.52.7
2.72.13.32.82.7
3.12.5
Federal ReserveBanks
3.0
3.13.42.7
2.62.82.9
3.13.33.3
3.23.02.7
2.82.22.82.33.3
3.03.1
government depositsnote balances at
commercialbanks and thrift
institutions
6.9
9 . 69 . 05 . 1
5.45.96.8
6.16.5
11.0
9.74.16.3
4.21.23.5
11.210.2
4.43.9
total demanddeposits andnote balances
12.7
15.815.110.5
11.711.313.0
12.412.617.4
16.09.6
11.7
9.75.59.6
16.216.3
10.59.5
time andsavings deposits atcommercial banks
1 .0
0 . 90 . 90 . 9
0.90.90.8
0.80.80.9
0.9C.80,9
0.80.80.9O.JB0 . 8
0 . 80 . 8
Digitized for FRASER http://fraser.stlouisfed.org/ Federal Reserve Bank of St. Louis
TABLE 1MONEY STOCK MEASURES AND LIQUID ASSETS
BILLIONS OF DOLLARS
(SEASONALLY ADJUSTED) (NOT SEASONALLY ADJUSTED)
1 9 7 7 J A N , . .F E B . , .M A P . . ,A P R . . ,MAY. . .J U N . . .J O L . . .AUG. , •S E P . . ,O C T . . .F O V . . .D E C . . .
1978 J A N . . .P E B . . .MAR. . .A P R . . .H A Y . . ,J U H . . .J O L . . .A D 6 . . .S E P * . .O C T . . .H O Y . . .D E C . . .
1979 J A N . . .F E B . « .K A R . . .A P I ? . . ,WRY. . .JUN. . .J O L * . .A U G . . .S E P . . .O C X . . .
u o v , . .&EC...I
1980 J A N . . .FEB.. .1M A R . . . JA P R . . .M A Y . . .J U N . . . |J U L . . .A U G . . .S E P . . . jO C T . . .N O V . . . JD E C . . .
Digitized for FRASER http://fraser.stlouisfed.org/ Federal Reserve Bank of St. Louis
80 JANJANJANJANJANF I BFEBFEBFEB1ARf*ARMARMARAPRAPRAPRA?BAPRMAYMAYMAYKAYJUNJUNJONJUNJULJOLJULJULJULAUGAUGAUGAT1GSEPSEPSEPSEPOCTOCTOC1OCTCCTNOVNOVNOVNOVDECDECDECDECDEC
Digitized for FRASER http://fraser.stlouisfed.org/ Federal Reserve Bank of St. Louis
SPECIAL SUPPLEMENTARY TABLEVariable Ceiling Time Deposits at
All Insured Commercial Banks and All Mutual Savings BanksOctober 29, 1980, November 26, 1980, and December 31, 1980
(Not seasonally adjusted)!/
Insured Commercial BanksOctober 29 November 26 December 31
Insured Commercial BanksOctober 29 November 26 December 31
Amount outstanding(millions of dollars):
2/6-month money market certificates
(Standard error of the estimate)2-1/2 year and over variableceiling certificates _3/
(Standard error of the estimate)
152,680(2253)
28,993(802)
165,359(1763)
30,678(953)
177,619(1837)
32,012(838)
41,531(798)
9,796(304)
44,211(680)
11,531(377)
49,446(530)
11,770(349)
Number of institution offering:
6-month money market certificates2-1/2 year and over variable
ceiling certificates
2/14,262
14,262
14,254
14,254
14,236
14,236
463
463
463
463
462
462
Percent of offering institutionspaying the ceiling rate during thesurvey period;
2/6-month money market certificates2-1/2 year and over variable ceiling
certificates
94
88
.2
.3
91.3
92.7
88
93
.8
.8
99
96
.7
.5
91
96
.3
.5
98.7
94.2
1/ Estimates for December are based on data collected by the Federal Reserve and the FDIC from a stratified randomsample of 500 commercial banks and 84 mutual savings banks.
2/ Money market certificates (MMCs) are nonegotiable time deposits in denominations of $10,000 or more with originalmaturities of exactly 26 weeks for which the maximum permissible rate of interest on new deposits is related tothe discount yield on the most recently issued six-month Treasury bill (auction average). See Table 1.16 in theFederal Reserve Bulletin for specific ceiling rates.
3/ This category includes all 4-year and over variable ceiling accounts having no legal minimum denomination issuedbetween July 1 and December 31, 1979 and all such 2-1/2 year and over variable ceiling accounts issued sinceJanuary 1, 1980. See Table 1.16 in the Bulletin for specific ceiling rates.
Digitized for FRASER http://fraser.stlouisfed.org/ Federal Reserve Bank of St. Louis