27
Chapter 3 John Arterburn
| Date post: | 02-Jan-2016 |
| Category: |
Documents |
| Upload: | phoebe-fowler |
| View: | 215 times |
| Download: | 0 times |

Chapter 3
John Arterburn

Chris Jordan et al.-ISEMP◦ Habitat Status and Trend
in the Wenatchee
Brent Phillips-Summit Environmental◦ Habitat Status and Trends
in the Okanogan from the OBMEP:Temperature Reporting
Chip McConnaha-ICFI◦ Habitat Status and
Trends in the Okanogan from the OBMEP:EDT3 modeling
Robert Al-Chokhachy-PIBO◦ PIBO Habitat Status and
Trend

Robert Al-Chokhachy, Brett Roper, and Eric Archer
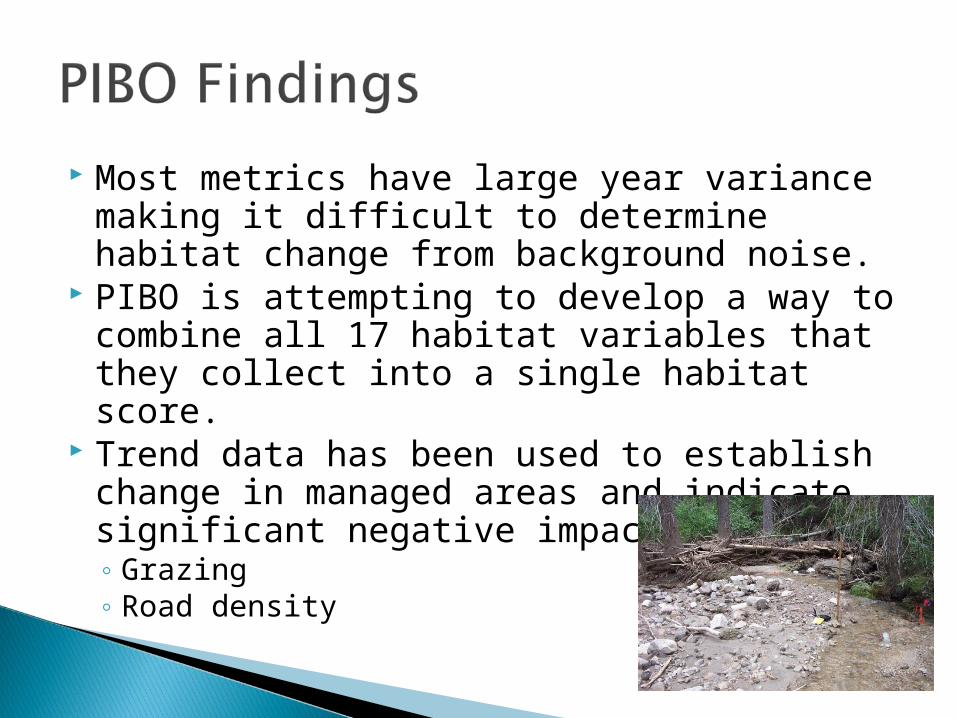
Most metrics have large year variance making it difficult to determine habitat change from background noise.
PIBO is attempting to develop a way to combine all 17 habitat variables that they collect into a single habitat score.
Trend data has been used to establish change in managed areas and indicate significant negative impacts from;◦ Grazing◦ Road density
Chris Jordan, Eric Ward, NOAA-Fisheries; Phil Larsen, PSMFC; Carol Volk, Volk Consulting; Pamela Nelle, Terraqua, Inc.
Habitat Status and Trends in the Wenatchee and Entiat basins.
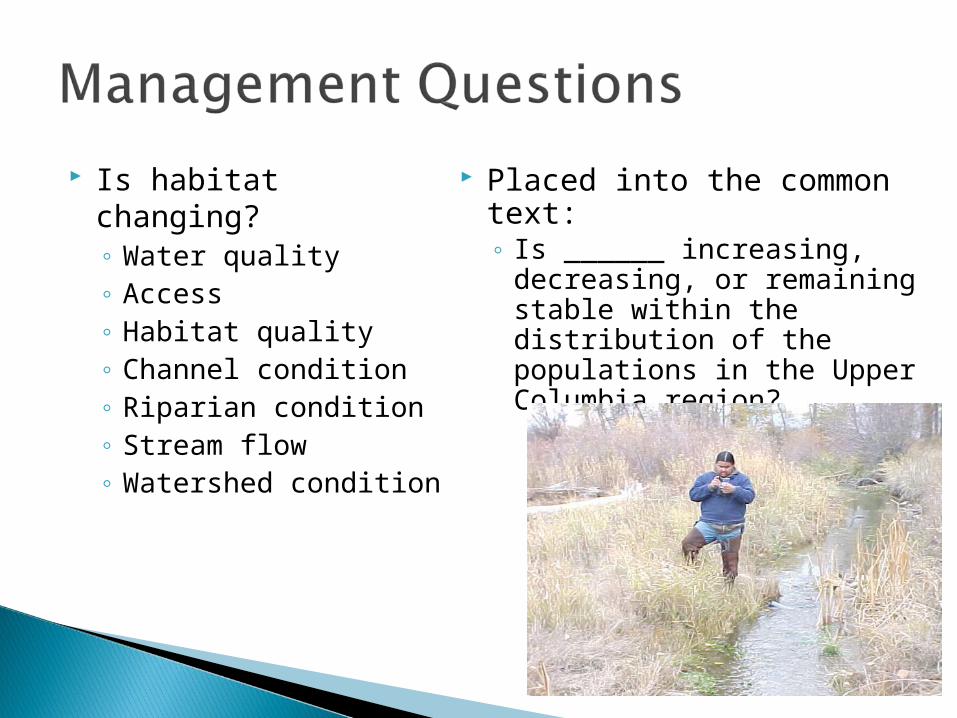
Is habitat changing?◦ Water quality◦ Access◦ Habitat quality◦ Channel condition◦ Riparian condition◦ Stream flow◦ Watershed condition
Placed into the common text:◦ Is ______ increasing,
decreasing, or remaining stable within the distribution of the populations in the Upper Columbia region?
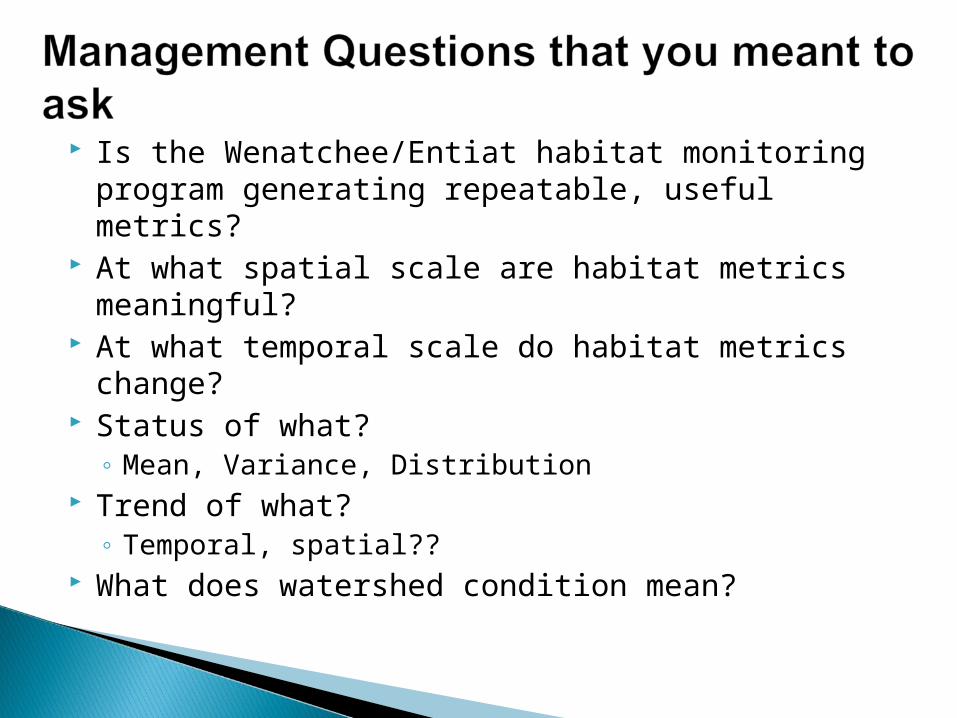
Is the Wenatchee/Entiat habitat monitoring program generating repeatable, useful metrics?
At what spatial scale are habitat metrics meaningful? At what temporal scale do habitat metrics change? Status of what?
◦ Mean, Variance, Distribution Trend of what?
◦ Temporal, spatial?? What does watershed condition mean?
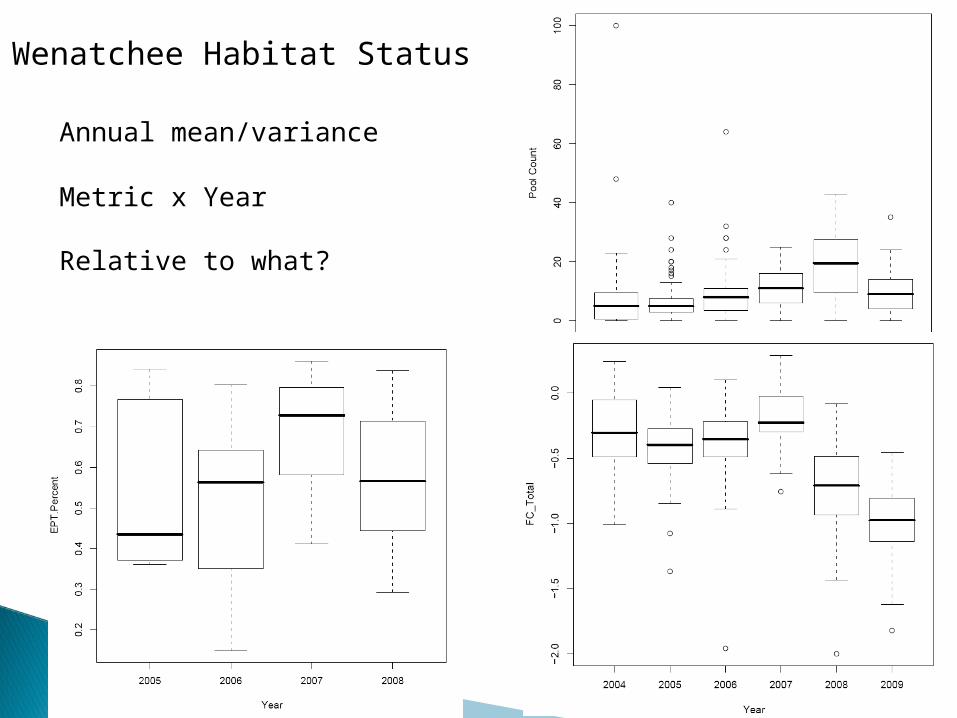
Wenatchee Habitat Status
Annual mean/variance
Metric x Year
Relative to what?
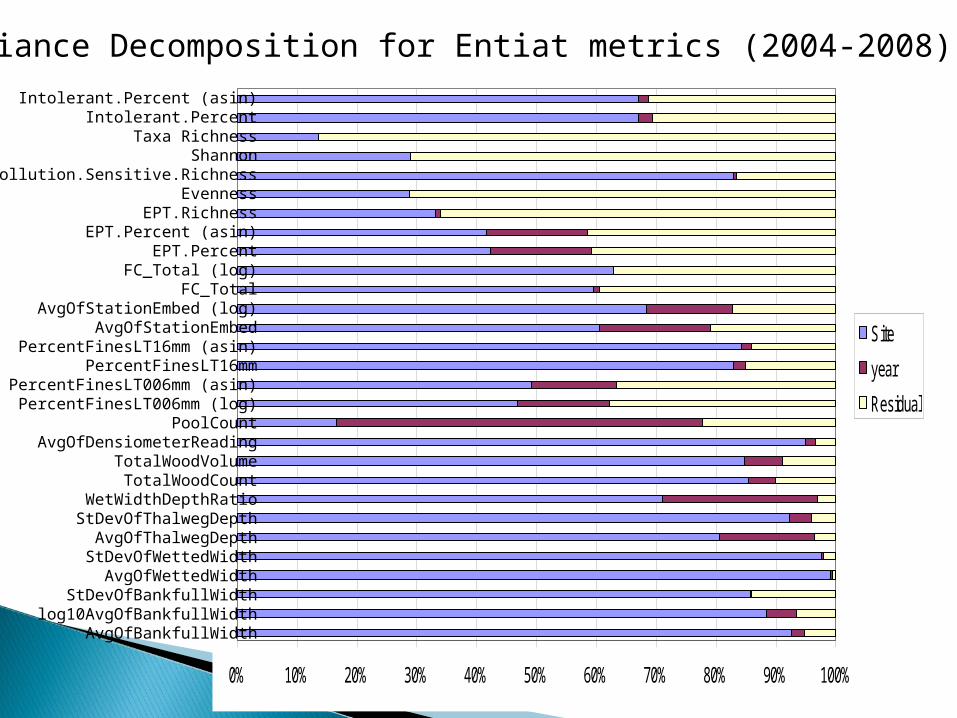
0% 10% 20% 30% 40% 50% 60% 70% 80% 90% 100%
Site
year
Residual
Intolerant.Percent (asin)Intolerant.Percent
Taxa RichnessShannon
Pollution.Sensitive.RichnessEvenness
EPT.RichnessEPT.Percent (asin)
EPT.PercentFC_Total (log)
FC_TotalAvgOfStationEmbed (log)
AvgOfStationEmbedPercentFinesLT16mm (asin)
PercentFinesLT16mmPercentFinesLT006mm (asin)PercentFinesLT006mm (log)
PoolCountAvgOfDensiometerReading
TotalWoodVolumeTotalWoodCount
WetWidthDepthRatioStDevOfThalwegDepth
AvgOfThalwegDepthStDevOfWettedWidth
AvgOfWettedWidthStDevOfBankfullWidth
log10AvgOfBankfullWidthAvgOfBankfullWidth
Variance Decomposition for Entiat metrics (2004-2008)
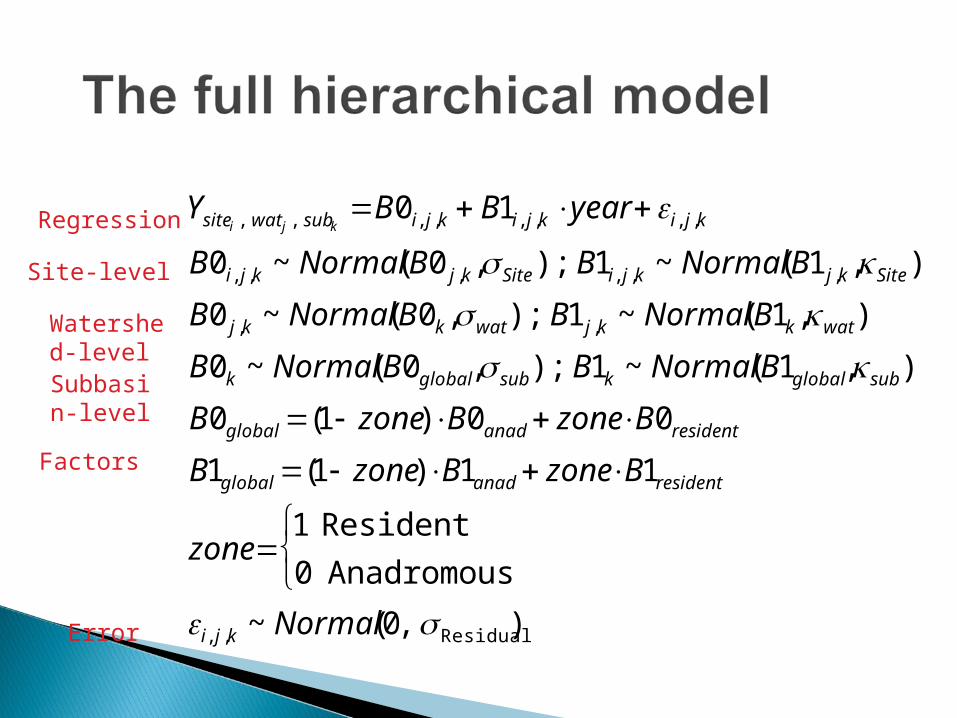
Ysite i , wat j , subk B0i, j ,k B1i, j,k yeari, j,kB0i, j,k ~ Normal(B0 j ,k, Site ); B1i, j ,k ~ Normal(B1 j,k,Site )B0 j ,k ~ Normal(B0k,wat ); B1 j ,k ~ Normal(B1k,wat )B0k ~ Normal(B0global , sub ); B1k ~ Normal(B1global , sub )B0global (1 zone)B0anad zoneB0residentB1global (1 zone)B1anad zoneB1resident
zone1 Resident
0 Anadromous
i, j ,k ~ Normal(0, Residual)
Site-level
Watershed-levelSubbasin-level
Factors
Error
Regression

Parameters / Models 4 10 13 16 17 18 19 20 22 25 27 29 31
Watershed variation (B0) X X X X X X X XSite variation (B0) X X X X X X XWatershed variation (B1) X X X X X X X XSite variation (B1) X X X X X X X XResident / anadromous (B0) X X X XResident / anadromous (B1) X X X X X
trend estimate (best model) 0 0 0
METRICS (log-transformed) / DIC score (low is good) trend estimate
AvgOfBankfullWidth 239 236 285 268 239 255 226 60 204 181 -195 150 148 0.0058StDevOfBankfullWidth 644 596 457 614 626 627 609 561 606 574 589 664 628 -0.0156AvgOfBankfullDepth 376 473 477 420 375 396 404 492 434 430 466 450 512 0.0414StDevOfBankfullDepth 571 687 474 660 534 570 538 472 485 484 499 484 517 -0.0120AvgOfWettedWidth 269 275 298 261 296 250 266 310 291 262 273 266 265 0.1347StDevOfWettedWidth 483 512 514 506 560 502 545 521 508 519 528 537 513 0.0755AvgOfThalwegDepth 369 389 351 341 372 374 376 374 336 362 356 351 377 0.1146StDevOfThalwegDepth 112 124 111 143 128 78 138 113 103 114 138 142 91 0.2199BFWidthDepthRatio 344 327 397 337 344 337 299 356 353 370 355 350 340 -0.0038WetWidthDepthRatio 259 234 274 290 293 297 278 253 284 280 275 279 262 0.0562TotalWoodCount 809 781 727 777 880 750 813 796 753 736 765 774 713 -0.0273TotalWoodVolume 925 805 903 786 1057 872 950 825 883 729 1021 787 655 -0.0347AvgOfDensiometerReading 573 557 427 590 505 494 537 404 439 368 391 365 351 -0.0202PoolCount 1496 1420 1537 1409 1471 1497 1444 1596 2084 1564 1539 1514 1626 0.5754FC_Total 745 1064 699 1056 718 704 742 712 711 729 714 696 746 -0.3454AvgOfStationEmbeddedness 712 453 310 446 516 538 513 335 274 458 472 384 605 -0.0271PercentFinesLT006mm 1684 1625 2093 1659 2728 1962 2599 1508 1716 1957 1486 1071 1812 1.0475PercentFinesLT16mm 599 565 578 527 542 588 593 558 593 566 573 562 534 0.0281
Model selection table
-Parameters involved in selected models, DIC scores
Monitoring made simple

Trends in habitat metrics exist◦ They exist at multiple spatial scales◦ Trend diversity exists in data space
How do we connect what we know about habitat metrics and our management questions?
What about habitat metric trends is biologically relevant? ◦ Do indicators based on single habitat metrics mean
anything?◦ Where are the fish in our consideration of habitat status
and trends?
2010 Upper Columbia RTT Analysis Workshop
Red Lion HotelJanuary 12, 2010
Presented by: Brent Phillips, R.P.Bio
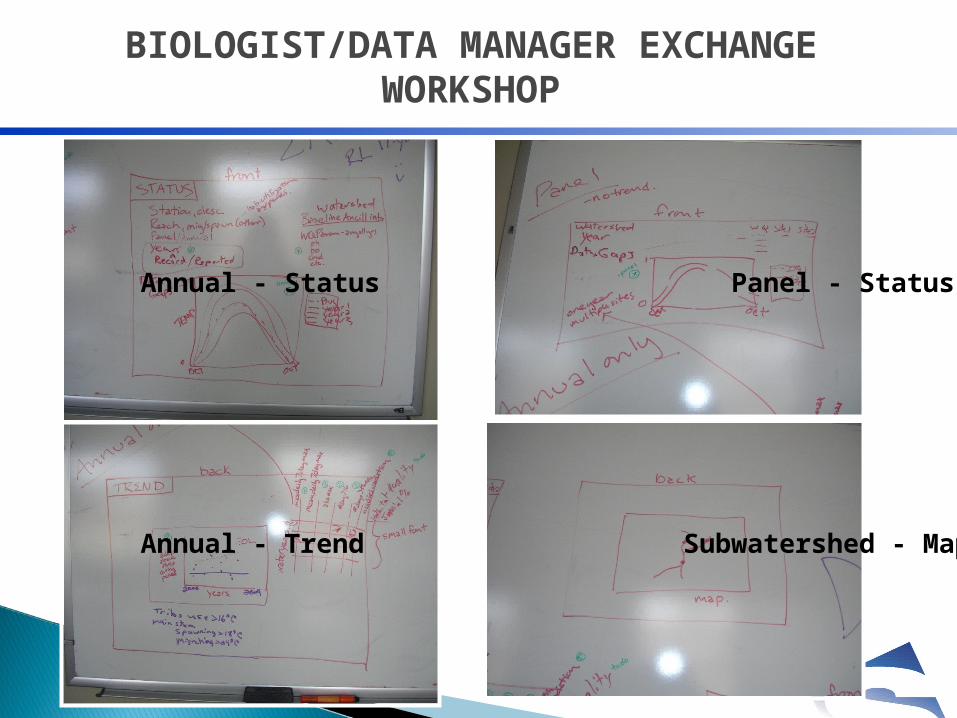
Annual - Status Panel - Status
Annual - Trend Subwatershed - Map
BIOLOGIST/DATA MANAGER EXCHANGE WORKSHOP

DATA AUDITING RULE SET
Finalized Data Auditing Rule Set (and order of implementation)
1. All temperatures below zero, will be changed to equal zero
2. Exclude the first and last days of each data series
3. When there is an hourly increment > 5 degrees C, exclude data records from that measurement until temperature recovers at least 3 degrees C.
4. If there are any remaining results > 30 degrees, data for the entire day will be excluded
Final query develop – in progress
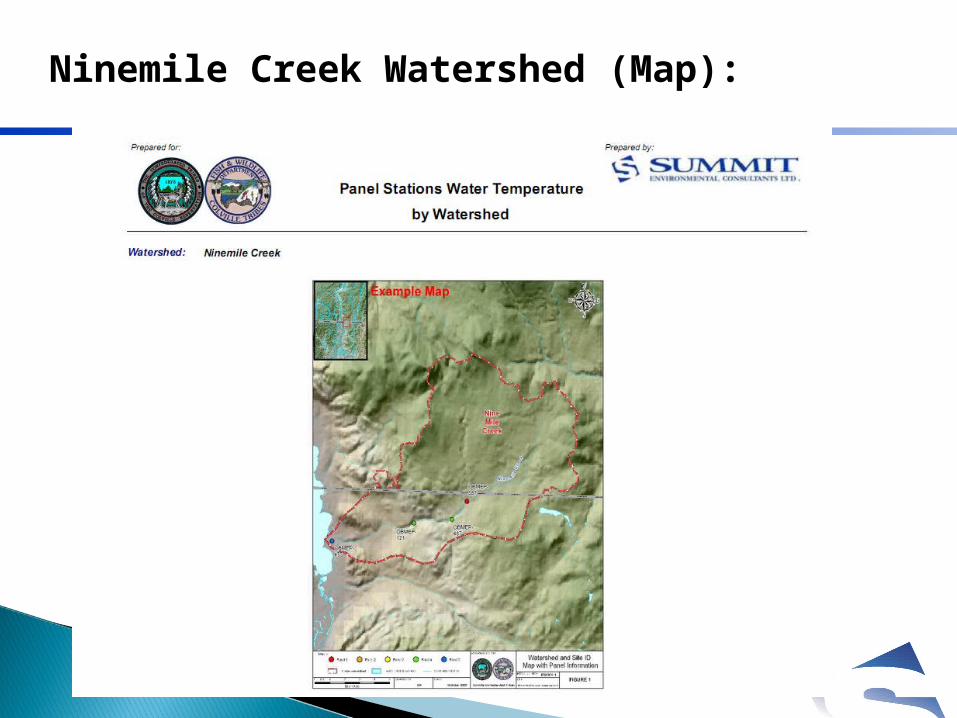
Ninemile Creek Watershed (Map):
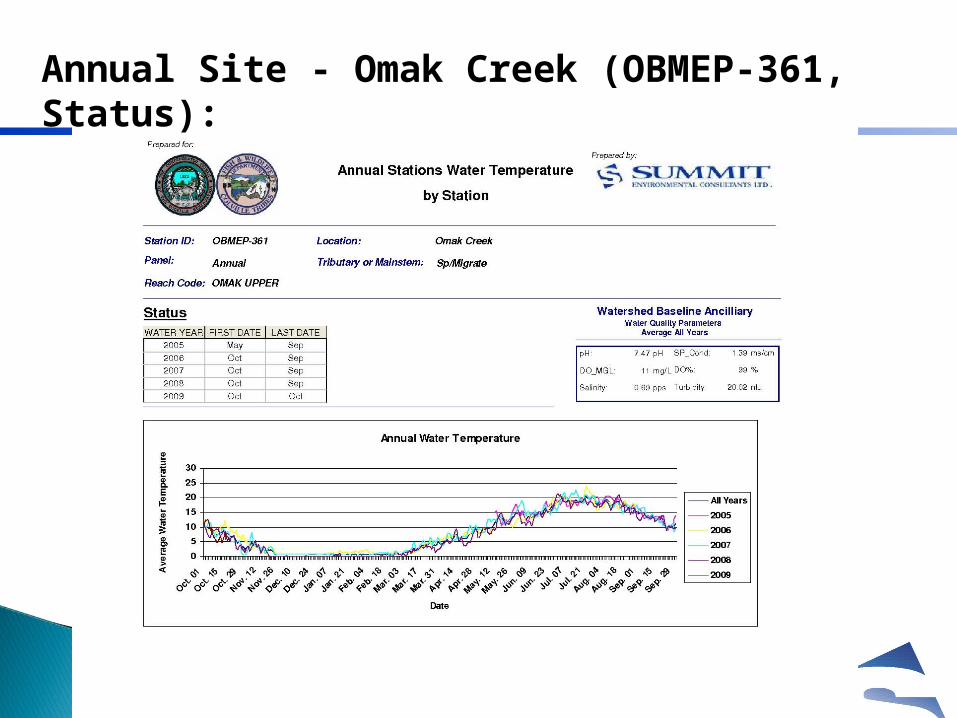
Annual Site - Omak Creek (OBMEP-361, Status):

Annual Site - Omak Creek (OBMEP-361, Trend):

Jesse SchwartzChip McConnaha

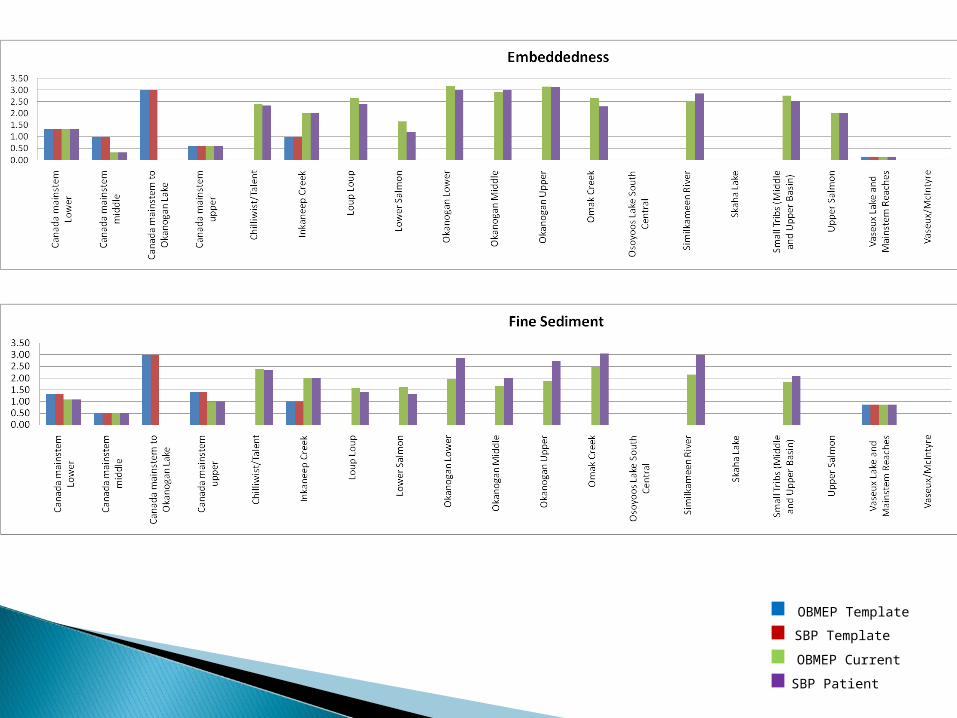
OBMEP Template
SBP Template
OBMEP Current
SBP Patient
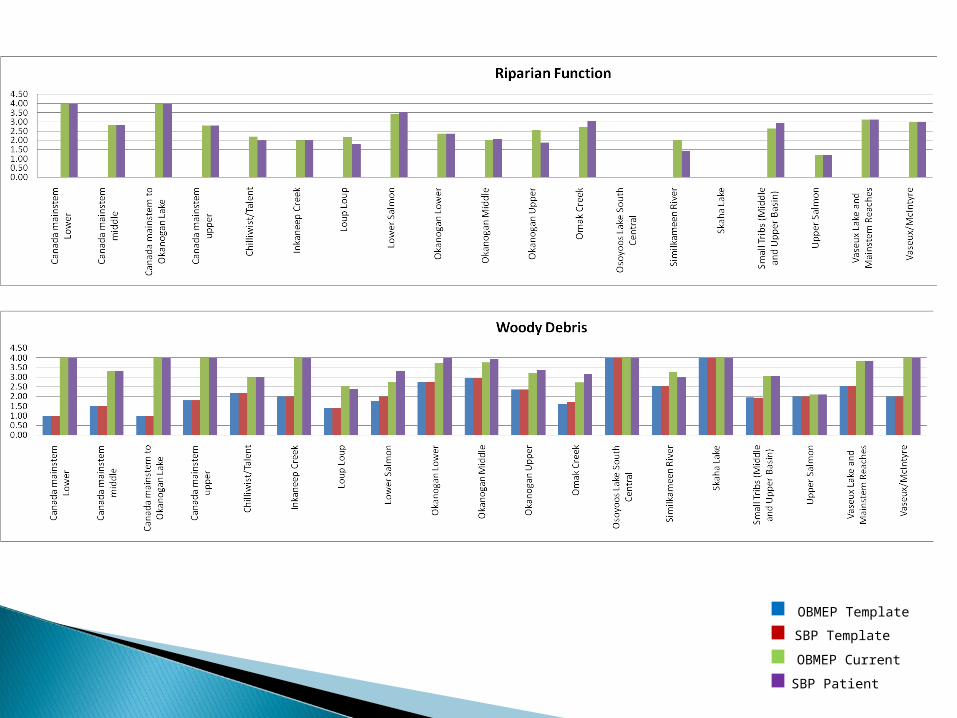
OBMEP Template
SBP Template
OBMEP Current
SBP Patient
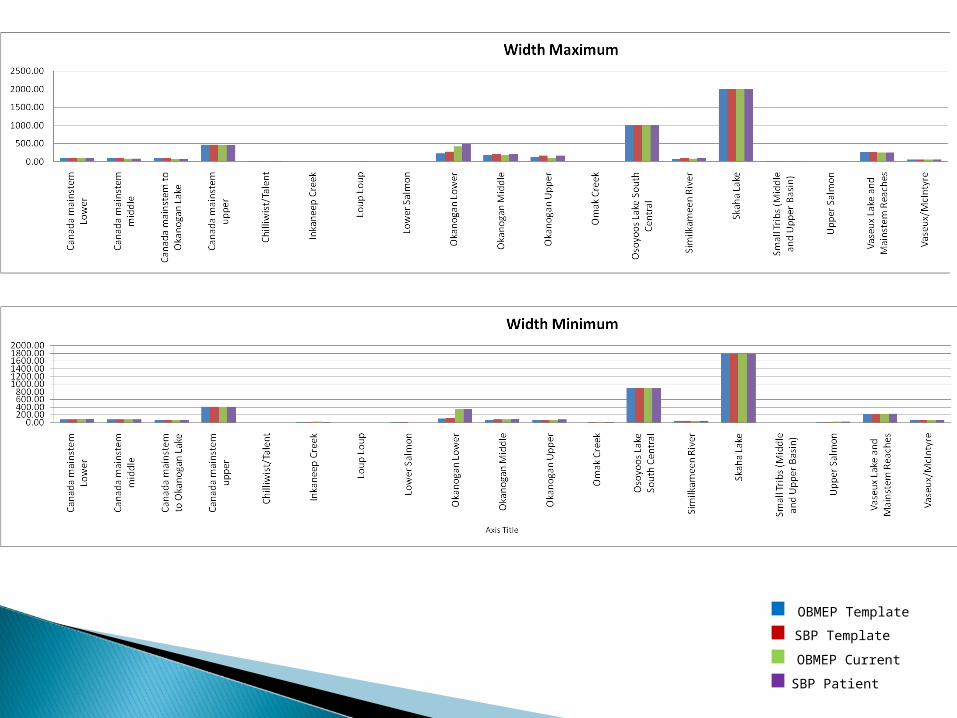
OBMEP Template
SBP Template
OBMEP Current
SBP Patient
OBMEP Template
SBP Template
OBMEP Current
SBP Patient
Deploy production version of EDT3 to implement status and trends report
Publish new user manual to guide users through the habitat status and trends evaluation process
The EDT3 model promises one of the few tangible methods for estimating changes in fish productivity to habitat restoration or degradation.
Stay tuned for more details in the next couple of years.

Some changes at small spatial scales More time is needed (Watershed scale change is slow
and “noisy”) Need to evaluate the validity of some metrics
◦ If too much variance then change the KMQ Data needed in Methow (update: funding has been
allotted through the FCRPS BiOp)
Report results for relevant metrics for use in adaptive management

Spatial Scale
Columbia River
ESU
Appropriate number of metric or indicators
Population
Site
Reach
Management Question Specificity
Specific
General
Direct measured metric
Species Specific Summations
Average of metric
Population level criteria
Count of Populations
Count of ESU’s
ESU level criteria
Species specific criteria


