1 HADLOW SCHOOL CHARTER 2014 - 2016 Hadlow School was founded in 1929 as a privately owned, primary boys’ school in the English preparatory school tradition. It was purchased in 1954 by the St Matthew’s Trust Board (now the Trinity Schools’ Trust Board) which has maintained the school’s association with the Church of the Province of New Zealand (Anglican). Hadlow provides a teaching and learning programme based on the Anglican interpretation of the Christian faith. Hadlow is now one of three schools and a preschool under the proprietorship of the Trinity School’s Trust Board, the others being Rathkeale College and St Matthew’s Collegiate School. The Trinity Schools’ Trust Board, as proprietor of Hadlow, is responsible for most of the school property and for the preservation and development of the Special Character of the school. The Special Character of Hadlow School is defined in Schedule 4, Clause 17 of the Integration Deed of Agreement between the Crown and the Trinity Schools’ Trust Board, dated 22 December 1998. Integral to this Special Character is the development of each child as a whole being, focusing on the development of the spiritual, academic, cultural and physical dimension of each child. An essential element of Hadlow School’s Special Character is the reinforcement of a strong, positive moral code based on Christian standards and values. MISSION To foster learning by educating for excellence through academic, physical, cultural, and spiritual challenges in a caring and safe environment. The Hadlow School Board of Trustees will ensure that every child at Hadlow School receives an education which addresses their needs and which fulfils our aim to educate for excellence in each of the spiritual, academic, cultural and physical dimensions. Education of Hadlow pupils will be based upon the Anglican interpretation of the Christian faith in accordance with the Special Character of the School pursuant to the Integration Agreement. The National Education Goals and the National Administration Guidelines will be complied with, and form part of this charter. Hadlow School welcomes all learners. The school is committed to their engagement in all school activities and to their achievement.
Transcript
1
HADLOW SCHOOL CHARTER 2014 - 2016
Hadlow School was founded in 1929 as a privately owned, primary boys’ school in the
English preparatory school tradition. It was purchased in 1954 by the St Matthew’s Trust
Board (now the Trinity Schools’ Trust Board) which has maintained the school’s association
with the Church of the Province of New Zealand (Anglican). Hadlow provides a teaching
and learning programme based on the Anglican interpretation of the Christian faith.
Hadlow is now one of three schools and a preschool under the proprietorship of the Trinity
School’s Trust Board, the others being Rathkeale College and St Matthew’s Collegiate
School. The Trinity Schools’ Trust Board, as proprietor of Hadlow, is responsible for most
of the school property and for the preservation and development of the Special Character of
the school.
The Special Character of Hadlow School is defined in Schedule 4, Clause 17 of the
Integration Deed of Agreement between the Crown and the Trinity Schools’ Trust Board,
dated 22 December 1998. Integral to this Special Character is the development of each child
as a whole being, focusing on the development of the spiritual, academic, cultural and
physical dimension of each child. An essential element of Hadlow School’s Special
Character is the reinforcement of a strong, positive moral code based on Christian standards
and values.
MISSION
To foster learning by educating for excellence through academic, physical,
cultural, and spiritual challenges in a caring and safe environment.
The Hadlow School Board of Trustees will ensure that every child at Hadlow School receives
an education which addresses their needs and which fulfils our aim to educate for excellence
in each of the spiritual, academic, cultural and physical dimensions. Education of Hadlow
pupils will be based upon the Anglican interpretation of the Christian faith in accordance with
the Special Character of the School pursuant to the Integration Agreement. The National
Education Goals and the National Administration Guidelines will be complied with, and form
part of this charter.
Hadlow School welcomes all learners. The school is committed to their engagement in all
school activities and to their achievement.
2
VISION
A Hadlow learner will be literate, self-managing, self-motivated, confident,
respectful, and responsible.
VALUES
At Hadlow we value:
committed learners
passionate teachers
innovation and inquiry
respect, friendliness and truthfulness
a balance of flexibility and structure to the day
specialist curriculum delivery
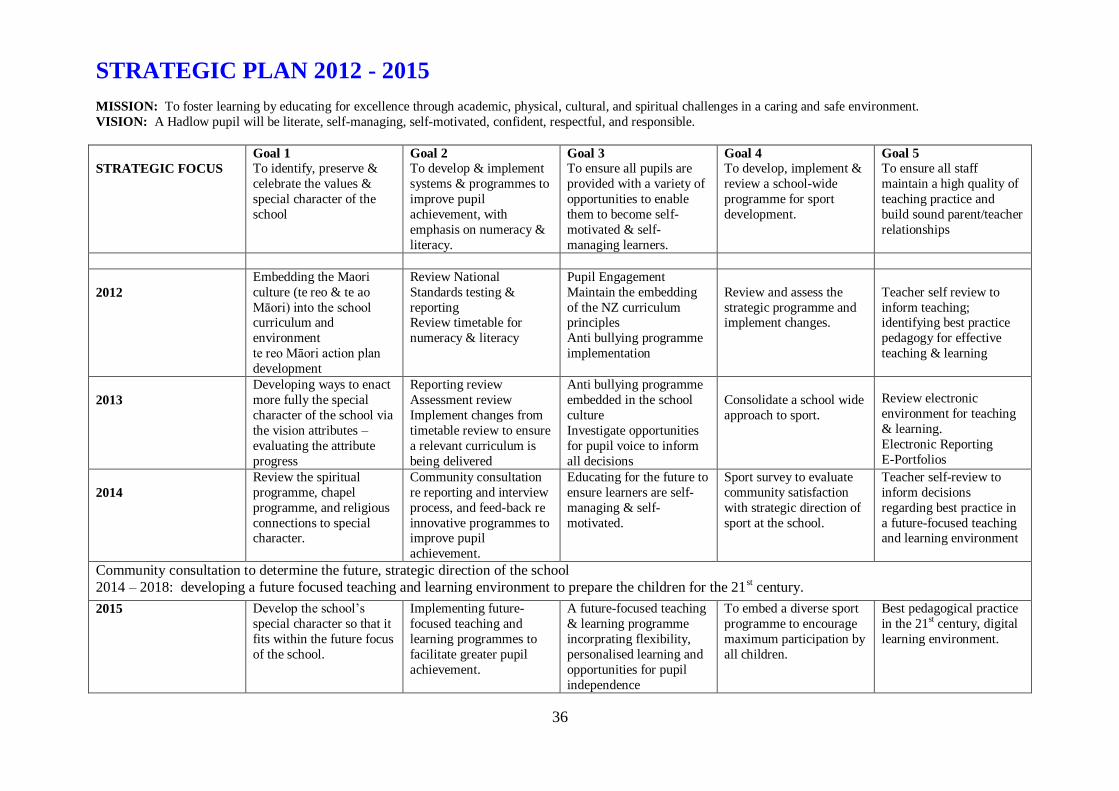
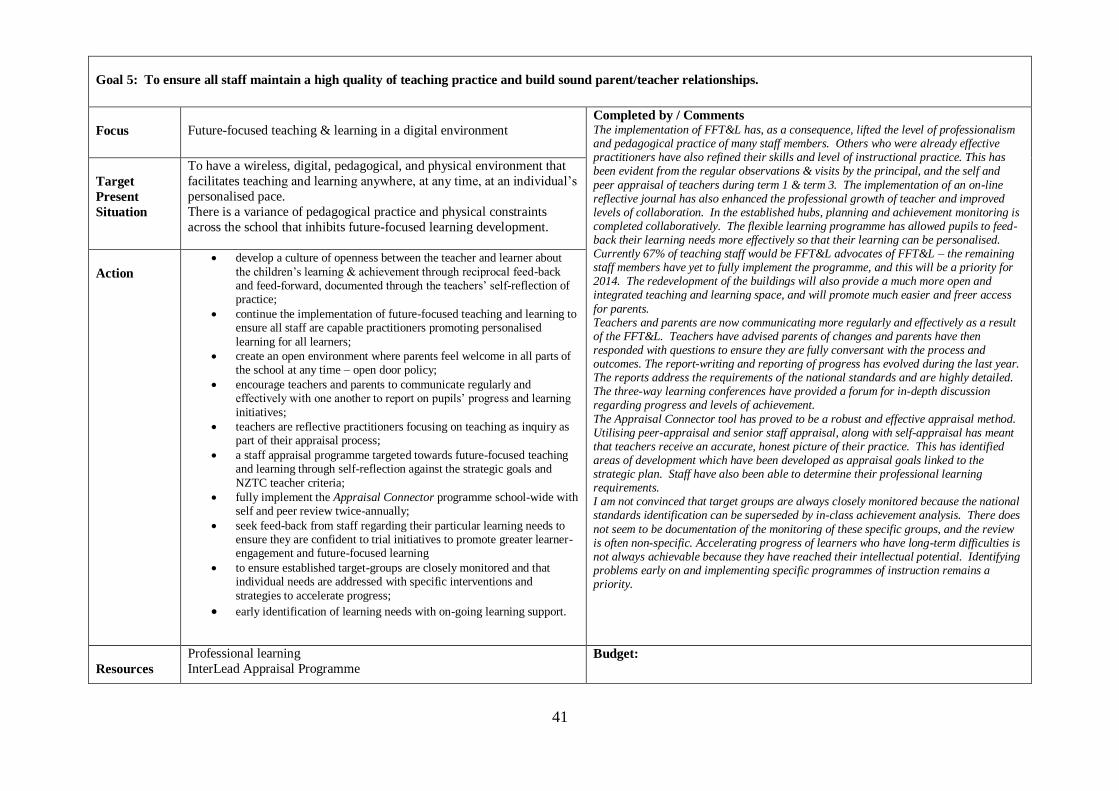
STRATEGIC PRIORITIES 2014 – 2016 1. To identify, preserve and celebrate the values and special character of the school.
2. To develop and implement systems and programmes to improve pupil achievement,
with emphasis on numeracy and literacy.
3. To ensure all pupils, including those with special education needs, are provided with
a variety of opportunities to enable them to become self-managing learners.
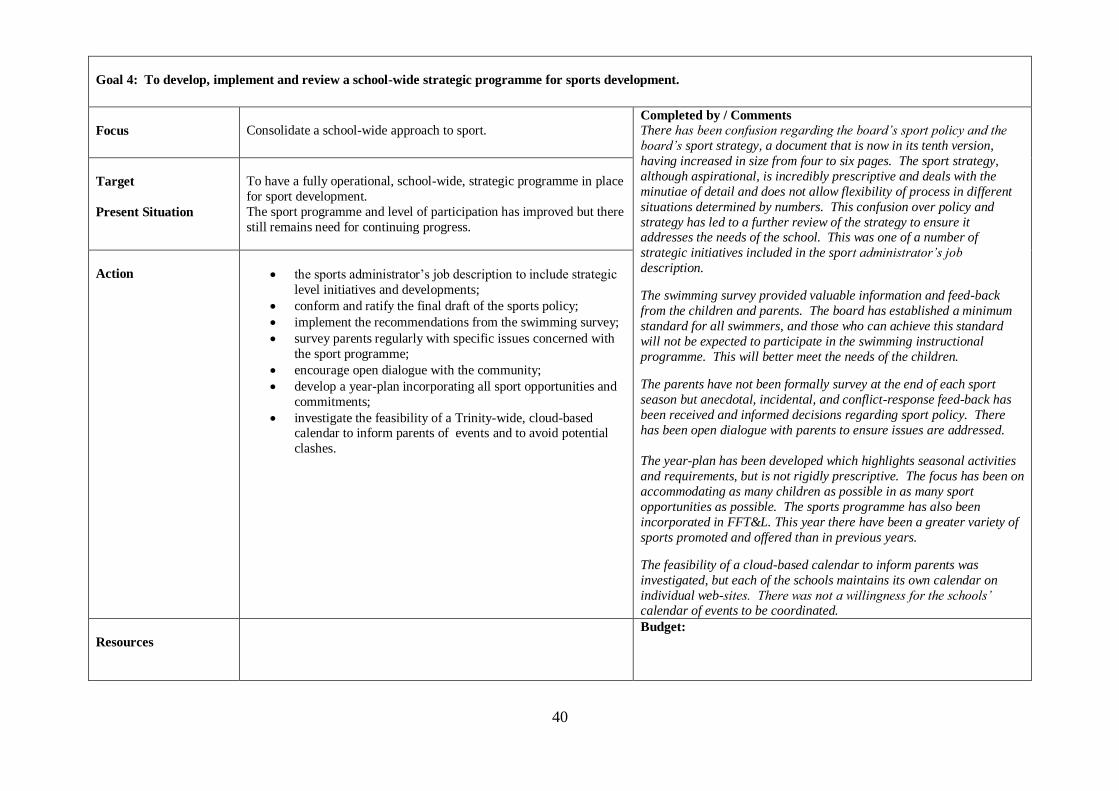
4. To develop, implement and review a school-wide programme for sport development.
5. To ensure all staff maintain a high quality of teaching practice and build sound parent-
teacher relationships.
TREATY OBLIGATIONS/CULTURAL DIVERSITY The Hadlow Board of Trustees will promote and foster tolerance and understanding of the
many different cultures and their values at the school. The school is predominantly European
in its pupil demographics with less than ten percent acknowledging a different cultural
affiliation. Maori and Asian children would make up this group. The school will consciously
develop policies and protocols to acknowledge New Zealand’s cultural diversity and, in
particular, the unique position of Maori as the tangata whenua. Hadlow School
acknowledges the principles of the Treaty of Waitangi. All pupils will have the opportunity
to acquire knowledge of Te Reo Maori and Tikanga Maori.
PARTNERSHIPS The Hadlow Board of Trustees acknowledges that learning is enhanced if a partnership is
established between the school and its community. To encourage and enhance that
partnership, the school will consult effectively with the school community on an on-going
basis, recognising that all people in the school community contribute to the values and
traditions and heritage of Hadlow School.
The Hadlow Board of Trustees will work constructively and cooperatively with the Trinity
Schools’ Trust Board as proprietor, pursuant to the Integration Agreement and the obligations
created by that agreement, particularly in relation to the Special Character of Hadlow as one
of the Trinity Schools. The Hadlow Board (and its trustees) as one of its functions will act as
agent for the Trinity Schools’ Trust Board as and when required or as and when is
appropriate, in order to fulfil the responsibilities or obligations created by the Integration
3
Agreement or by Statute or accepted by the Hadlow Board of Trustees pursuant to a
decision/resolution of the Hadlow Board.
SPECIAL CHARACTER STATEMENT Hadlow is an Anglican, coeducational, full primary day school offering programmes of
worship, religious studies, a strong moral code, and providing a well-rounded education
promoting excellence through academic, cultural, sporting and spiritual pursuits in which all
pupils and teaching staff are expected to participate fully.
Hadlow School is the junior school of the Trinity Schools, a family of schools offering
education from preschool to Year 13.
By the Trust Deed of 1921 of the St Matthew’s Schools’ Trust Board (now TSTB), the
Proprietor holds property to establish and maintain schools in connection with the Church of
the Province of New Zealand (Anglican). In this regard Hadlow Preparatory School was
purchased by the St Matthew’s Schools’ Trust Board as one of its family of schools.
Key Understandings:
1. Although Anglican, Hadlow welcomes pupils into its environment from all cultures,
religions and faiths who will undertake to uphold the Special Character of the school.
2. The moral code of conduct upheld at Hadlow is based on Christian standards and
values, and those of the Virtues Project.
3. All pupils are expected to fully participate in the extra-curricular programmes provided
at the school.
4. When parents enrol their children at Hadlow they are accepting the condition that their
children will participate in the programmes that make up the school’s Special Character.
4
0%
18%
52%
30%
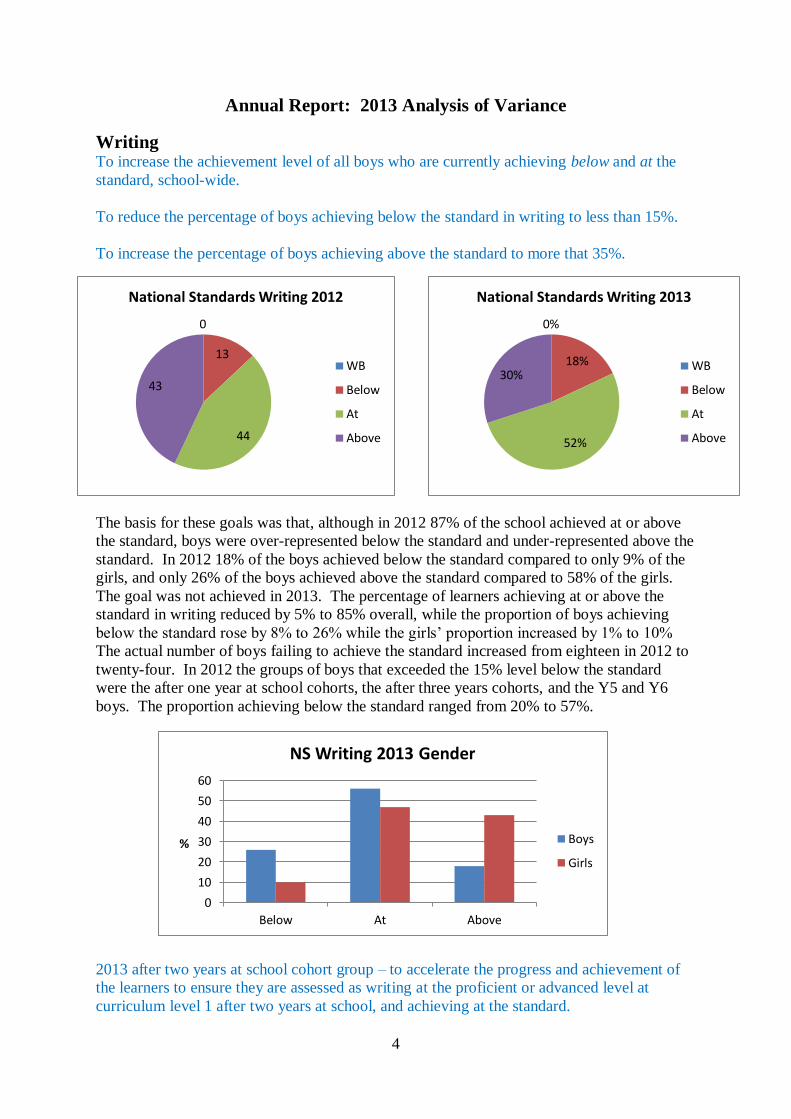
National Standards Writing 2013
WB
Below
At
Above
0
10
20
30
40
50
60
Below At Above
%
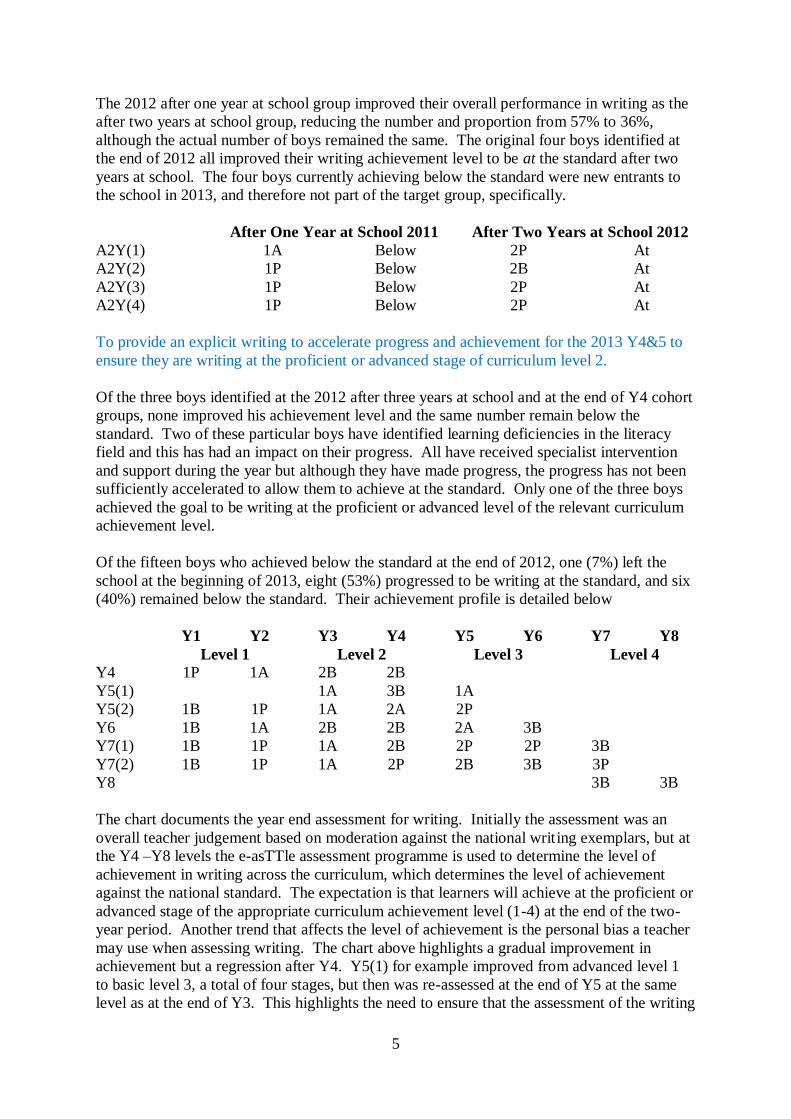
NS Writing 2013 Gender
Boys
Girls
0
13
44
43
National Standards Writing 2012
WB
Below
At
Above
Annual Report: 2013 Analysis of Variance
Writing To increase the achievement level of all boys who are currently achieving below and at the
standard, school-wide.
To reduce the percentage of boys achieving below the standard in writing to less than 15%.
To increase the percentage of boys achieving above the standard to more that 35%.
The basis for these goals was that, although in 2012 87% of the school achieved at or above
the standard, boys were over-represented below the standard and under-represented above the
standard. In 2012 18% of the boys achieved below the standard compared to only 9% of the
girls, and only 26% of the boys achieved above the standard compared to 58% of the girls.
The goal was not achieved in 2013. The percentage of learners achieving at or above the
standard in writing reduced by 5% to 85% overall, while the proportion of boys achieving
below the standard rose by 8% to 26% while the girls’ proportion increased by 1% to 10%
The actual number of boys failing to achieve the standard increased from eighteen in 2012 to
twenty-four. In 2012 the groups of boys that exceeded the 15% level below the standard
were the after one year at school cohorts, the after three years cohorts, and the Y5 and Y6
boys. The proportion achieving below the standard ranged from 20% to 57%.
2013 after two years at school cohort group – to accelerate the progress and achievement of
the learners to ensure they are assessed as writing at the proficient or advanced level at
curriculum level 1 after two years at school, and achieving at the standard.
5
The 2012 after one year at school group improved their overall performance in writing as the
after two years at school group, reducing the number and proportion from 57% to 36%,
although the actual number of boys remained the same. The original four boys identified at
the end of 2012 all improved their writing achievement level to be at the standard after two
years at school. The four boys currently achieving below the standard were new entrants to
the school in 2013, and therefore not part of the target group, specifically.
After One Year at School 2011 After Two Years at School 2012
A2Y(1) 1A Below 2P At
A2Y(2) 1P Below 2B At
A2Y(3) 1P Below 2P At
A2Y(4) 1P Below 2P At
To provide an explicit writing to accelerate progress and achievement for the 2013 Y4&5 to
ensure they are writing at the proficient or advanced stage of curriculum level 2.
Of the three boys identified at the 2012 after three years at school and at the end of Y4 cohort
groups, none improved his achievement level and the same number remain below the
standard. Two of these particular boys have identified learning deficiencies in the literacy
field and this has had an impact on their progress. All have received specialist intervention
and support during the year but although they have made progress, the progress has not been
sufficiently accelerated to allow them to achieve at the standard. Only one of the three boys
achieved the goal to be writing at the proficient or advanced level of the relevant curriculum
achievement level.
Of the fifteen boys who achieved below the standard at the end of 2012, one (7%) left the
school at the beginning of 2013, eight (53%) progressed to be writing at the standard, and six
(40%) remained below the standard. Their achievement profile is detailed below
Y1 Y2 Y3 Y4 Y5 Y6 Y7 Y8
Level 1 Level 2 Level 3 Level 4
Y4 1P 1A 2B 2B
Y5(1) 1A 3B 1A
Y5(2) 1B 1P 1A 2A 2P
Y6 1B 1A 2B 2B 2A 3B
Y7(1) 1B 1P 1A 2B 2P 2P 3B
Y7(2) 1B 1P 1A 2P 2B 3B 3P
Y8 3B 3B
The chart documents the year end assessment for writing. Initially the assessment was an
overall teacher judgement based on moderation against the national writing exemplars, but at
the Y4 –Y8 levels the e-asTTle assessment programme is used to determine the level of
achievement in writing across the curriculum, which determines the level of achievement
against the national standard. The expectation is that learners will achieve at the proficient or
advanced stage of the appropriate curriculum achievement level (1-4) at the end of the two-
year period. Another trend that affects the level of achievement is the personal bias a teacher
may use when assessing writing. The chart above highlights a gradual improvement in
achievement but a regression after Y4. Y5(1) for example improved from advanced level 1
to basic level 3, a total of four stages, but then was re-assessed at the end of Y5 at the same
level as at the end of Y3. This highlights the need to ensure that the assessment of the writing
6
0%
20%
40%
60%
80%
100%
1 2 3 4 5 6 7 8
Year Group
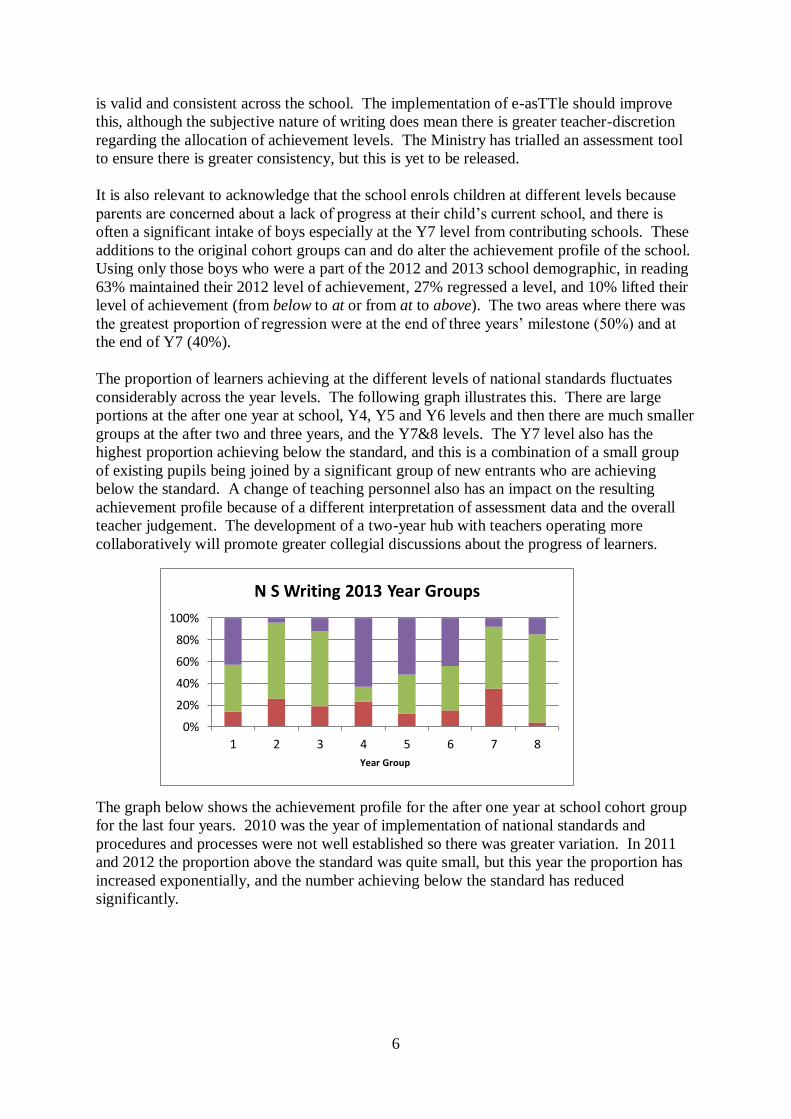
N S Writing 2013 Year Groups
is valid and consistent across the school. The implementation of e-asTTle should improve
this, although the subjective nature of writing does mean there is greater teacher-discretion
regarding the allocation of achievement levels. The Ministry has trialled an assessment tool
to ensure there is greater consistency, but this is yet to be released.
It is also relevant to acknowledge that the school enrols children at different levels because
parents are concerned about a lack of progress at their child’s current school, and there is
often a significant intake of boys especially at the Y7 level from contributing schools. These
additions to the original cohort groups can and do alter the achievement profile of the school.
Using only those boys who were a part of the 2012 and 2013 school demographic, in reading
63% maintained their 2012 level of achievement, 27% regressed a level, and 10% lifted their
level of achievement (from below to at or from at to above). The two areas where there was
the greatest proportion of regression were at the end of three years’ milestone (50%) and at
the end of Y7 (40%).
The proportion of learners achieving at the different levels of national standards fluctuates
considerably across the year levels. The following graph illustrates this. There are large
portions at the after one year at school, Y4, Y5 and Y6 levels and then there are much smaller
groups at the after two and three years, and the Y7&8 levels. The Y7 level also has the
highest proportion achieving below the standard, and this is a combination of a small group
of existing pupils being joined by a significant group of new entrants who are achieving
below the standard. A change of teaching personnel also has an impact on the resulting
achievement profile because of a different interpretation of assessment data and the overall
teacher judgement. The development of a two-year hub with teachers operating more
collaboratively will promote greater collegial discussions about the progress of learners.
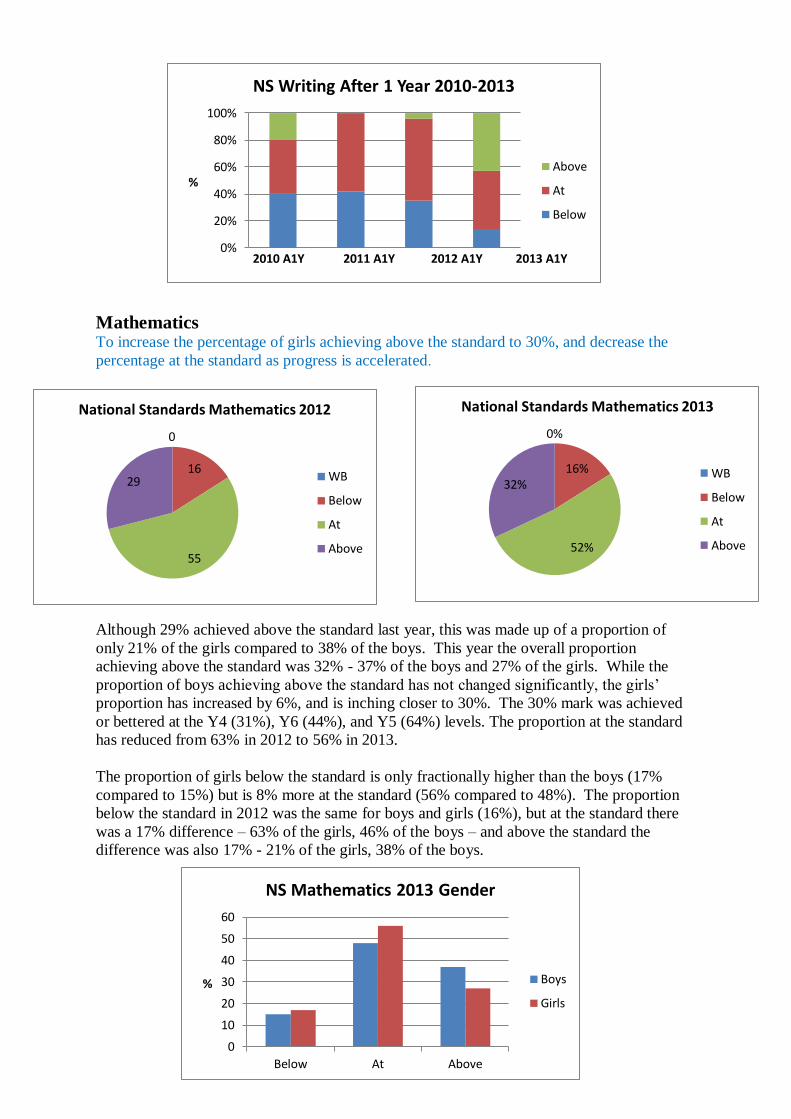
The graph below shows the achievement profile for the after one year at school cohort group
for the last four years. 2010 was the year of implementation of national standards and
procedures and processes were not well established so there was greater variation. In 2011
and 2012 the proportion above the standard was quite small, but this year the proportion has
increased exponentially, and the number achieving below the standard has reduced
significantly.
7
0%
20%
40%
60%
80%
100%
%
2010 A1Y 2011 A1Y 2012 A1Y 2013 A1Y
NS Writing After 1 Year 2010-2013
Above
At
Below
0%
16%
52%
32%
National Standards Mathematics 2013
WB
Below
At
Above
0
16
55
29
National Standards Mathematics 2012
WB
Below
At
Above
0
10
20
30
40
50
60
Below At Above
%
NS Mathematics 2013 Gender
Boys
Girls
Mathematics To increase the percentage of girls achieving above the standard to 30%, and decrease the
percentage at the standard as progress is accelerated.
Although 29% achieved above the standard last year, this was made up of a proportion of
only 21% of the girls compared to 38% of the boys. This year the overall proportion
achieving above the standard was 32% - 37% of the boys and 27% of the girls. While the
proportion of boys achieving above the standard has not changed significantly, the girls’
proportion has increased by 6%, and is inching closer to 30%. The 30% mark was achieved
or bettered at the Y4 (31%), Y6 (44%), and Y5 (64%) levels. The proportion at the standard
has reduced from 63% in 2012 to 56% in 2013.
The proportion of girls below the standard is only fractionally higher than the boys (17%
compared to 15%) but is 8% more at the standard (56% compared to 48%). The proportion
below the standard in 2012 was the same for boys and girls (16%), but at the standard there
was a 17% difference – 63% of the girls, 46% of the boys – and above the standard the
difference was also 17% - 21% of the girls, 38% of the boys.
8
0%
20%
40%
60%
80%
100%
2011 After 1YAS 2012 After 2YAS 2013 After 3YAS
NS Mathematics After 3 Years at School Cohort Progress
Above
At
Below
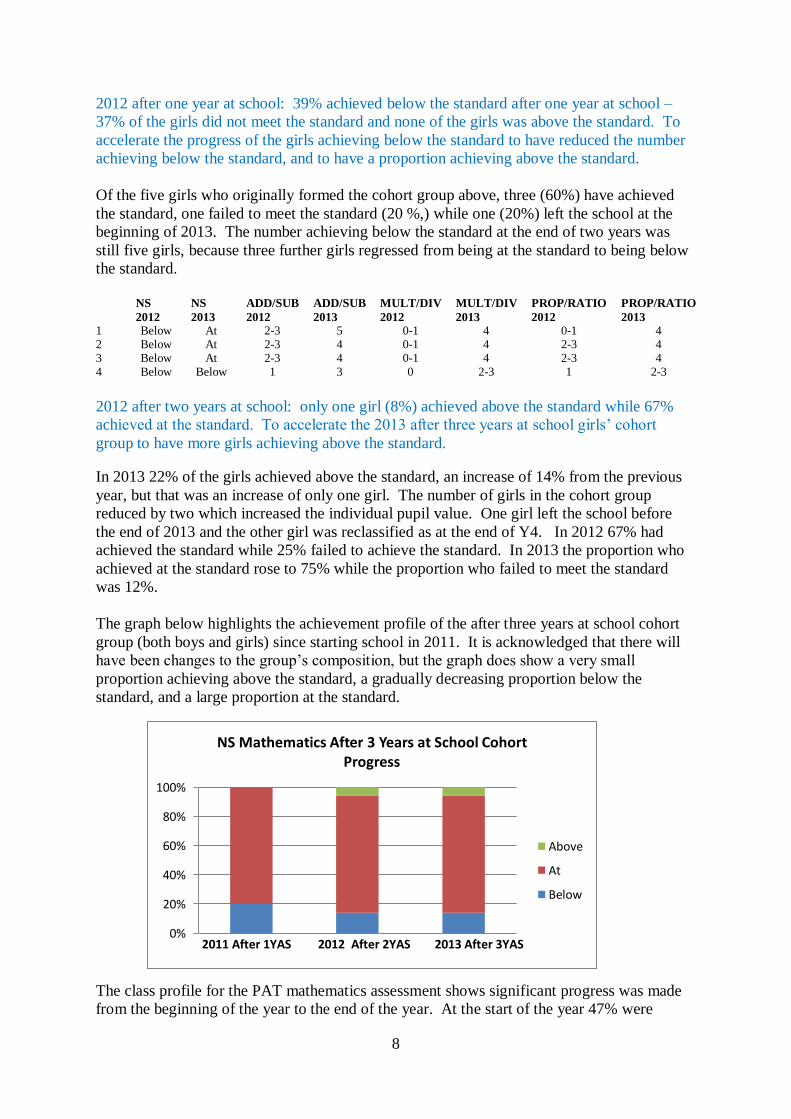
2012 after one year at school: 39% achieved below the standard after one year at school –
37% of the girls did not meet the standard and none of the girls was above the standard. To
accelerate the progress of the girls achieving below the standard to have reduced the number
achieving below the standard, and to have a proportion achieving above the standard.
Of the five girls who originally formed the cohort group above, three (60%) have achieved
the standard, one failed to meet the standard (20 %,) while one (20%) left the school at the
beginning of 2013. The number achieving below the standard at the end of two years was
still five girls, because three further girls regressed from being at the standard to being below
2012 after two years at school: only one girl (8%) achieved above the standard while 67%
achieved at the standard. To accelerate the 2013 after three years at school girls’ cohort
group to have more girls achieving above the standard.
In 2013 22% of the girls achieved above the standard, an increase of 14% from the previous
year, but that was an increase of only one girl. The number of girls in the cohort group
reduced by two which increased the individual pupil value. One girl left the school before
the end of 2013 and the other girl was reclassified as at the end of Y4. In 2012 67% had
achieved the standard while 25% failed to achieve the standard. In 2013 the proportion who
achieved at the standard rose to 75% while the proportion who failed to meet the standard
was 12%.
The graph below highlights the achievement profile of the after three years at school cohort
group (both boys and girls) since starting school in 2011. It is acknowledged that there will
have been changes to the group’s composition, but the graph does show a very small
proportion achieving above the standard, a gradually decreasing proportion below the
standard, and a large proportion at the standard.
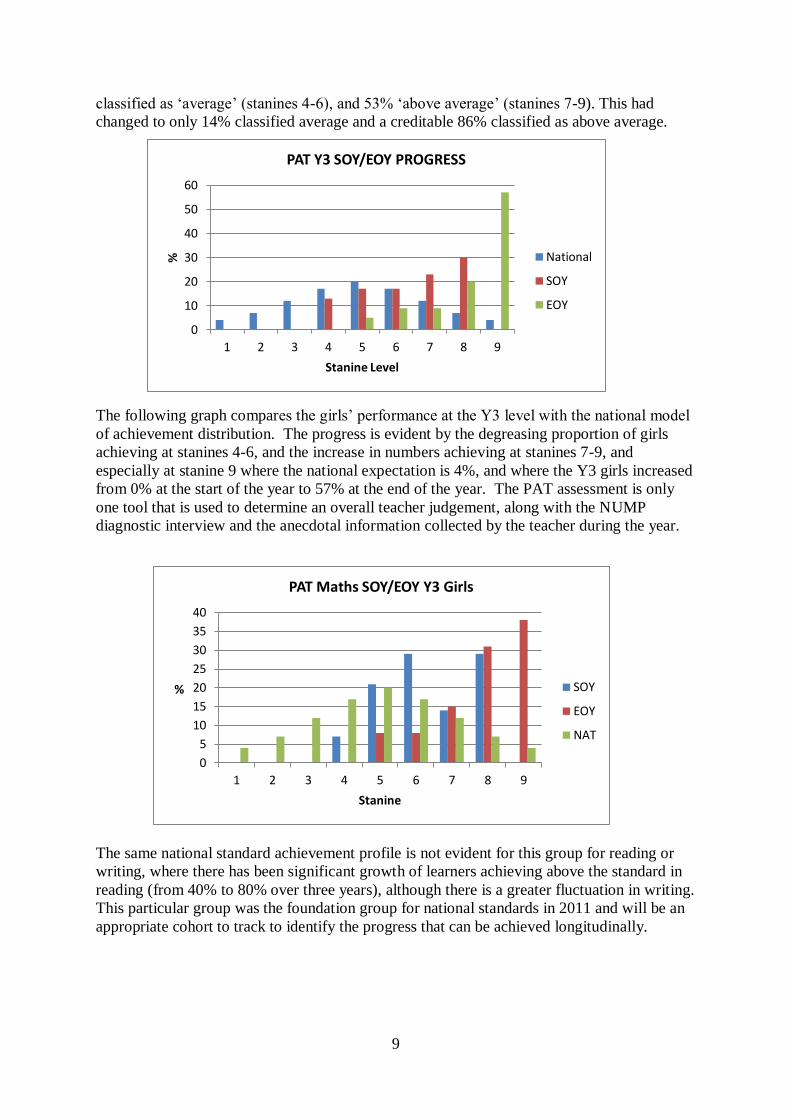
The class profile for the PAT mathematics assessment shows significant progress was made
from the beginning of the year to the end of the year. At the start of the year 47% were
9
0
10
20
30
40
50
60
1 2 3 4 5 6 7 8 9
%
Stanine Level
PAT Y3 SOY/EOY PROGRESS
National
SOY
EOY
0
5
10
15
20
25
30
35
40
1 2 3 4 5 6 7 8 9
%
Stanine
PAT Maths SOY/EOY Y3 Girls
SOY
EOY
NAT
classified as ‘average’ (stanines 4-6), and 53% ‘above average’ (stanines 7-9). This had
changed to only 14% classified average and a creditable 86% classified as above average.
The following graph compares the girls’ performance at the Y3 level with the national model
of achievement distribution. The progress is evident by the degreasing proportion of girls
achieving at stanines 4-6, and the increase in numbers achieving at stanines 7-9, and
especially at stanine 9 where the national expectation is 4%, and where the Y3 girls increased
from 0% at the start of the year to 57% at the end of the year. The PAT assessment is only
one tool that is used to determine an overall teacher judgement, along with the NUMP
diagnostic interview and the anecdotal information collected by the teacher during the year.
The same national standard achievement profile is not evident for this group for reading or
writing, where there has been significant growth of learners achieving above the standard in
reading (from 40% to 80% over three years), although there is a greater fluctuation in writing.
This particular group was the foundation group for national standards in 2011 and will be an
appropriate cohort to track to identify the progress that can be achieved longitudinally.
10
0%
10%
20%
30%
40%
50%
60%
70%
80%
90%
100%
2011 After 1YAS 2012 After 2YAS 2013 After 3YAS
NS Reading After 3 Years at School Cohort Progress
Above
At
Below
0%
20%
40%
60%
80%
100%
2011 After 1YAS 2012 After 2YAS 2013 After 3YAS
NS Writing After 3 Years at School Cohort Progress
Above
At
Below
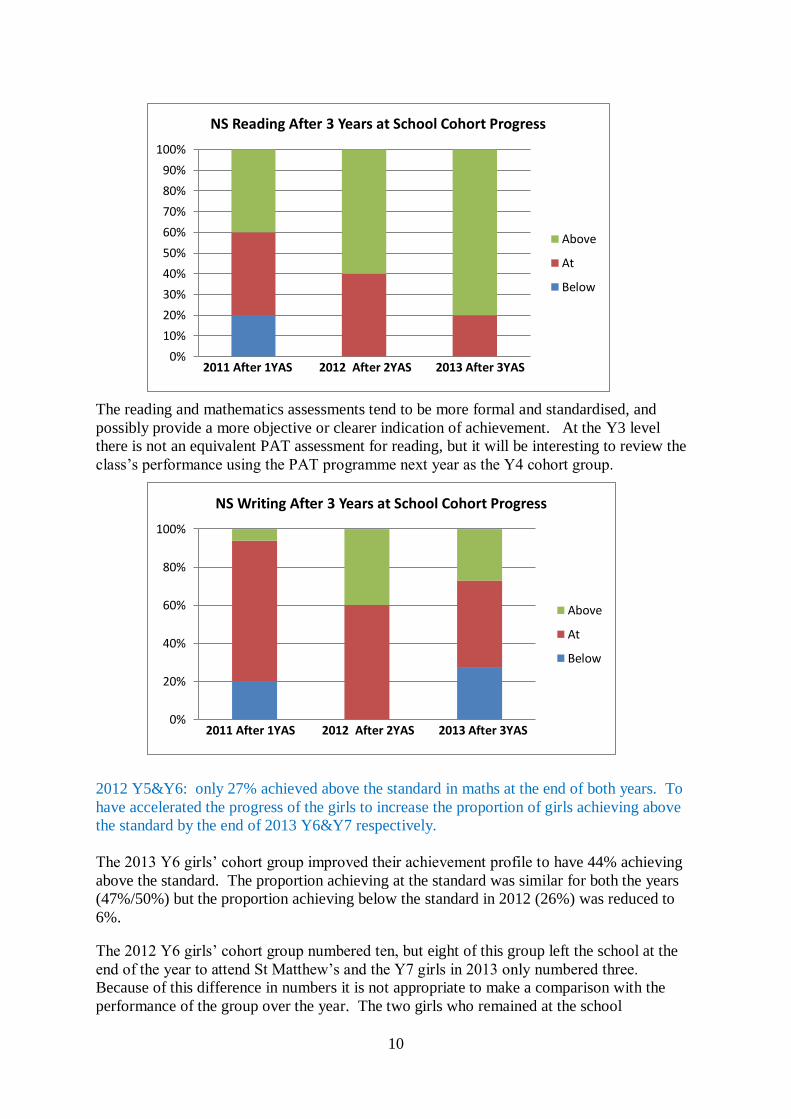
The reading and mathematics assessments tend to be more formal and standardised, and
possibly provide a more objective or clearer indication of achievement. At the Y3 level
there is not an equivalent PAT assessment for reading, but it will be interesting to review the
class’s performance using the PAT programme next year as the Y4 cohort group.
2012 Y5&Y6: only 27% achieved above the standard in maths at the end of both years. To
have accelerated the progress of the girls to increase the proportion of girls achieving above
the standard by the end of 2013 Y6&Y7 respectively.
The 2013 Y6 girls’ cohort group improved their achievement profile to have 44% achieving
above the standard. The proportion achieving at the standard was similar for both the years
(47%/50%) but the proportion achieving below the standard in 2012 (26%) was reduced to
6%.
The 2012 Y6 girls’ cohort group numbered ten, but eight of this group left the school at the
end of the year to attend St Matthew’s and the Y7 girls in 2013 only numbered three.
Because of this difference in numbers it is not appropriate to make a comparison with the
performance of the group over the year. The two girls who remained at the school
11
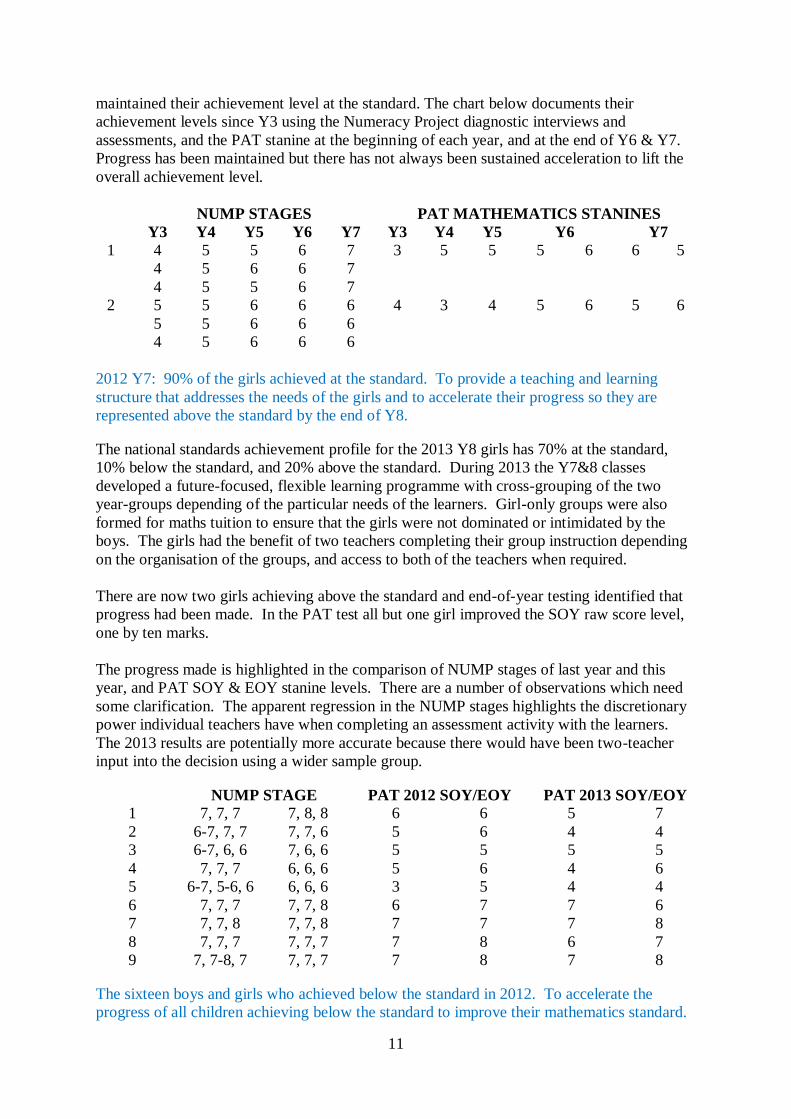
maintained their achievement level at the standard. The chart below documents their
achievement levels since Y3 using the Numeracy Project diagnostic interviews and
assessments, and the PAT stanine at the beginning of each year, and at the end of Y6 & Y7.
Progress has been maintained but there has not always been sustained acceleration to lift the
overall achievement level.
NUMP STAGES PAT MATHEMATICS STANINES
Y3 Y4 Y5 Y6 Y7 Y3 Y4 Y5 Y6 Y7
1 4 5 5 6 7 3 5 5 5 6 6 5
4 5 6 6 7
4 5 5 6 7
2 5 5 6 6 6 4 3 4 5 6 5 6
5 5 6 6 6
4 5 6 6 6
2012 Y7: 90% of the girls achieved at the standard. To provide a teaching and learning
structure that addresses the needs of the girls and to accelerate their progress so they are
represented above the standard by the end of Y8.
The national standards achievement profile for the 2013 Y8 girls has 70% at the standard,
10% below the standard, and 20% above the standard. During 2013 the Y7&8 classes
developed a future-focused, flexible learning programme with cross-grouping of the two
year-groups depending of the particular needs of the learners. Girl-only groups were also
formed for maths tuition to ensure that the girls were not dominated or intimidated by the
boys. The girls had the benefit of two teachers completing their group instruction depending
on the organisation of the groups, and access to both of the teachers when required.
There are now two girls achieving above the standard and end-of-year testing identified that
progress had been made. In the PAT test all but one girl improved the SOY raw score level,
one by ten marks.
The progress made is highlighted in the comparison of NUMP stages of last year and this
year, and PAT SOY & EOY stanine levels. There are a number of observations which need
some clarification. The apparent regression in the NUMP stages highlights the discretionary
power individual teachers have when completing an assessment activity with the learners.
The 2013 results are potentially more accurate because there would have been two-teacher
input into the decision using a wider sample group.
NUMP STAGE PAT 2012 SOY/EOY PAT 2013 SOY/EOY
1 7, 7, 7 7, 8, 8 6 6 5 7
2 6-7, 7, 7 7, 7, 6 5 6 4 4
3 6-7, 6, 6 7, 6, 6 5 5 5 5
4 7, 7, 7 6, 6, 6 5 6 4 6
5 6-7, 5-6, 6 6, 6, 6 3 5 4 4
6 7, 7, 7 7, 7, 8 6 7 7 6
7 7, 7, 8 7, 7, 8 7 7 7 8
8 7, 7, 7 7, 7, 7 7 8 6 7
9 7, 7-8, 7 7, 7, 7 7 8 7 8
The sixteen boys and girls who achieved below the standard in 2012. To accelerate the
progress of all children achieving below the standard to improve their mathematics standard.
12
0
50
100
150
Below At Above
%
2012/2013 Below the Standard
2012
2013
0%
13%
35% 52%
National Standards Reading 2013
WB
Below
At
Above
0
15
30 55
National Standards Reading 2012
Well Below
Below
At
Above
The thirty-two children (16 boys and 16 girls) cannot be compared validly with the national
standards profile of 2013 because the 2012 Y8 children were not at school in 2013, and there
is a new after one year at school group for 2013. The comparison can therefore only be the
twenty-three who were involved in both years. Of the 2012 group, one progressed from
below to above the standard; nine progressed to be at the standard, and thirteen remained
below the standard. That means 43% of the group progressed.
Reading
85% of the school is achieving at or above the standard in reading. To progress all children
from their present level of achievement against the standard, to decrease the percentage
achieving below the standard and to increase the percentage achieving above the standard.
The two graphs above highlight the distribution of the school population across the four
levels of achievement for the national standards’ reading. Although the graphs show an
increase in the proportion achieving above the standard and a decrease of the proportion
below the standard, they are not comparing the same cohort groups because of the inevitable
changes to the roll during the year and the departure of the 2012 Y8 group and first
assessment of the 2013 after one year at school cohort group.
The comparison with the different year levels does give a profile of achievement levels and
highlights where there are areas of high achievement and also areas of under achievement but
each year must be treated separately.
13
0%
20%
40%
60%
80%
100%
1 2 3 4 5 6 7 8
Year Group
NS Reading 2013 Year Groups
Above
At
Below
WB
0%
10%
20%
30%
40%
50%
60%
70%
80%
90%
100%
1 2 3 4 5 6 7 8
NS Reading 2012 Year Group Performance
Above
At
Below
Well Below
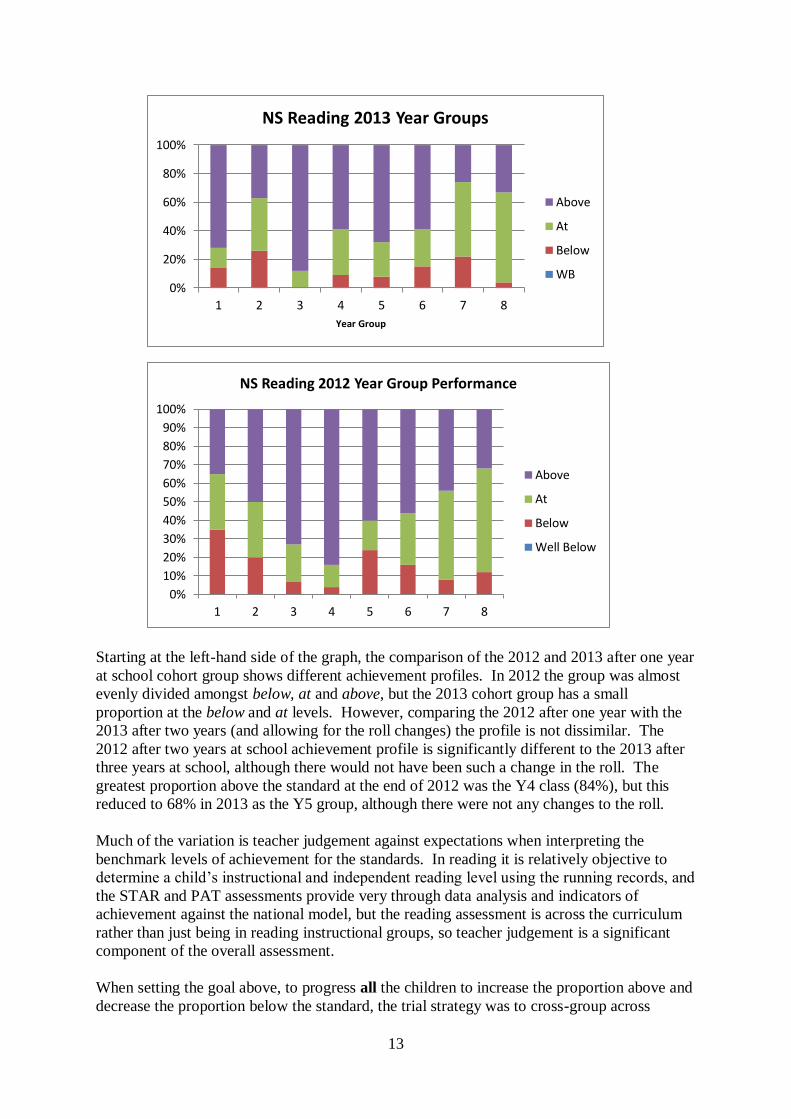
Starting at the left-hand side of the graph, the comparison of the 2012 and 2013 after one year
at school cohort group shows different achievement profiles. In 2012 the group was almost
evenly divided amongst below, at and above, but the 2013 cohort group has a small
proportion at the below and at levels. However, comparing the 2012 after one year with the
2013 after two years (and allowing for the roll changes) the profile is not dissimilar. The
2012 after two years at school achievement profile is significantly different to the 2013 after
three years at school, although there would not have been such a change in the roll. The
greatest proportion above the standard at the end of 2012 was the Y4 class (84%), but this
reduced to 68% in 2013 as the Y5 group, although there were not any changes to the roll.
Much of the variation is teacher judgement against expectations when interpreting the
benchmark levels of achievement for the standards. In reading it is relatively objective to
determine a child’s instructional and independent reading level using the running records, and
the STAR and PAT assessments provide very through data analysis and indicators of
achievement against the national model, but the reading assessment is across the curriculum
rather than just being in reading instructional groups, so teacher judgement is a significant
component of the overall assessment.
When setting the goal above, to progress all the children to increase the proportion above and
decrease the proportion below the standard, the trial strategy was to cross-group across
14
different year-levels to ensure that the particular needs of groups of children could be
addressed more effectively and efficiently by the teachers. The Y7&8 classes had initiated
this programme in 2012 and it was implemented school wide in 2013. The Y0&Y1 and the
Y5&Y6 classes operated as two-year level hubs with cross-grouping and collaborative
teaching. The Y2, Y3, & Y4 classes also cross-grouped and made use of teacher-support
personal which allowed them to reduce the teacher-pupil ration for reading from 1:23 to 1:12.
Children with particular learning needs were targeted, and received daily, individual or small-
group instruction and support. There still remains a small but significant group of under-
achievers who are making progress but are not achieving at a level required to be at the
standard. Further investigation and implementation of different strategies need to be
developed. The nature of the pupil intake at key levels also can have a significant effect on
the school’s achievement profile. Those children that join us ‘mid-stream’ often do so
because parents are dissatisfied with their children’s progress at the current school and we are
perceived to be a school which can lift achievement levels in the learners.
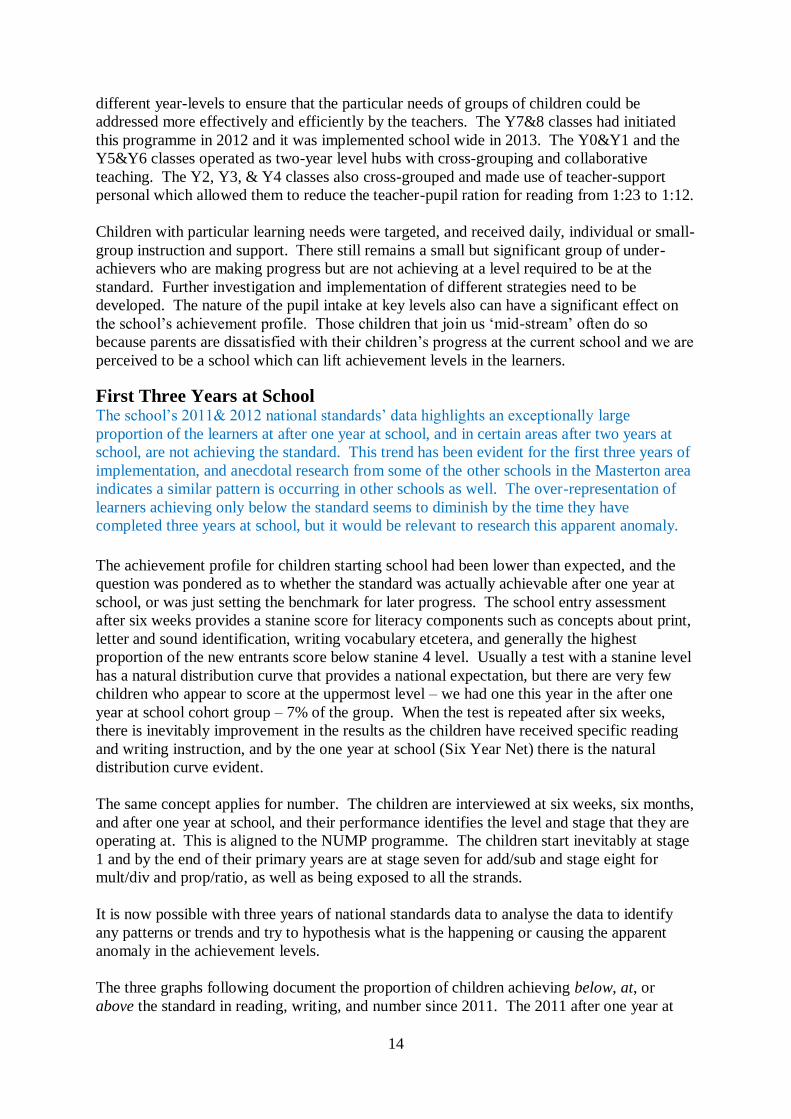
First Three Years at School The school’s 2011& 2012 national standards’ data highlights an exceptionally large
proportion of the learners at after one year at school, and in certain areas after two years at
school, are not achieving the standard. This trend has been evident for the first three years of
implementation, and anecdotal research from some of the other schools in the Masterton area
indicates a similar pattern is occurring in other schools as well. The over-representation of
learners achieving only below the standard seems to diminish by the time they have
completed three years at school, but it would be relevant to research this apparent anomaly.
The achievement profile for children starting school had been lower than expected, and the
question was pondered as to whether the standard was actually achievable after one year at
school, or was just setting the benchmark for later progress. The school entry assessment
after six weeks provides a stanine score for literacy components such as concepts about print,
letter and sound identification, writing vocabulary etcetera, and generally the highest
proportion of the new entrants score below stanine 4 level. Usually a test with a stanine level
has a natural distribution curve that provides a national expectation, but there are very few
children who appear to score at the uppermost level – we had one this year in the after one
year at school cohort group – 7% of the group. When the test is repeated after six weeks,
there is inevitably improvement in the results as the children have received specific reading
and writing instruction, and by the one year at school (Six Year Net) there is the natural
distribution curve evident.
The same concept applies for number. The children are interviewed at six weeks, six months,
and after one year at school, and their performance identifies the level and stage that they are
operating at. This is aligned to the NUMP programme. The children start inevitably at stage
1 and by the end of their primary years are at stage seven for add/sub and stage eight for
mult/div and prop/ratio, as well as being exposed to all the strands.
It is now possible with three years of national standards data to analyse the data to identify
any patterns or trends and try to hypothesis what is the happening or causing the apparent
anomaly in the achievement levels.
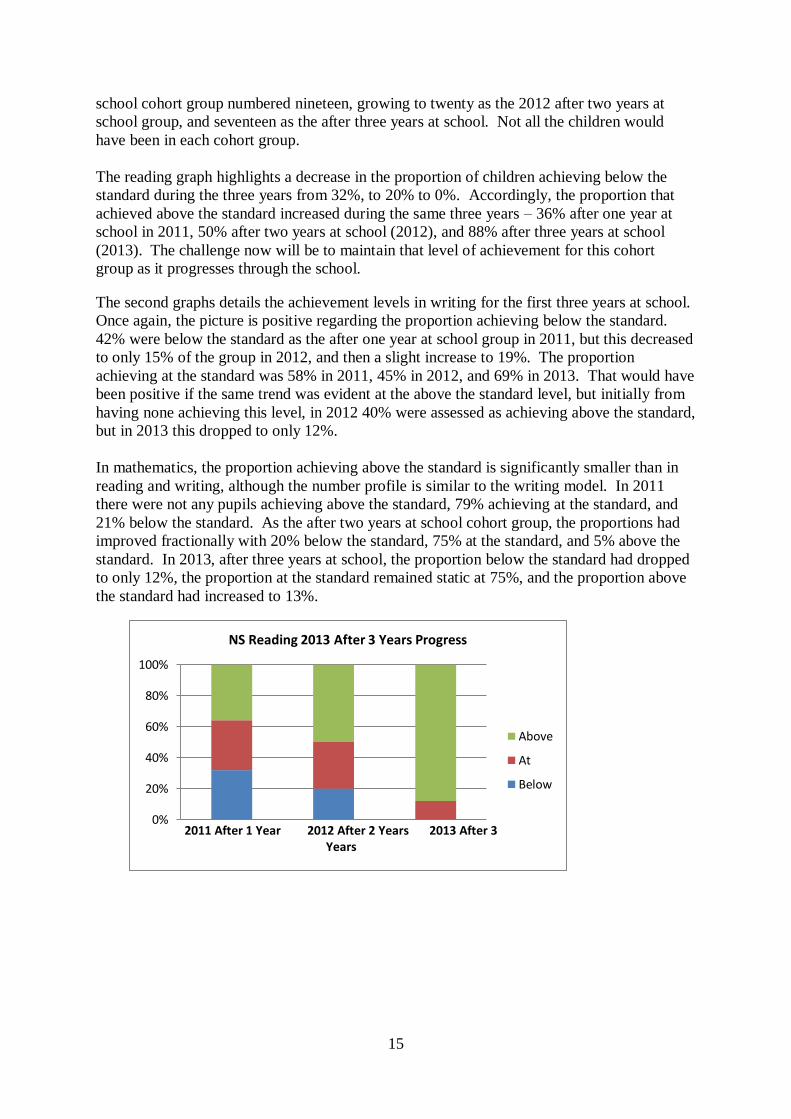
The three graphs following document the proportion of children achieving below, at, or
above the standard in reading, writing, and number since 2011. The 2011 after one year at
15
0%
20%
40%
60%
80%
100%
2011 After 1 Year 2012 After 2 Years 2013 After 3 Years
NS Reading 2013 After 3 Years Progress
Above
At
Below
school cohort group numbered nineteen, growing to twenty as the 2012 after two years at
school group, and seventeen as the after three years at school. Not all the children would
have been in each cohort group.
The reading graph highlights a decrease in the proportion of children achieving below the
standard during the three years from 32%, to 20% to 0%. Accordingly, the proportion that
achieved above the standard increased during the same three years – 36% after one year at
school in 2011, 50% after two years at school (2012), and 88% after three years at school
(2013). The challenge now will be to maintain that level of achievement for this cohort
group as it progresses through the school.
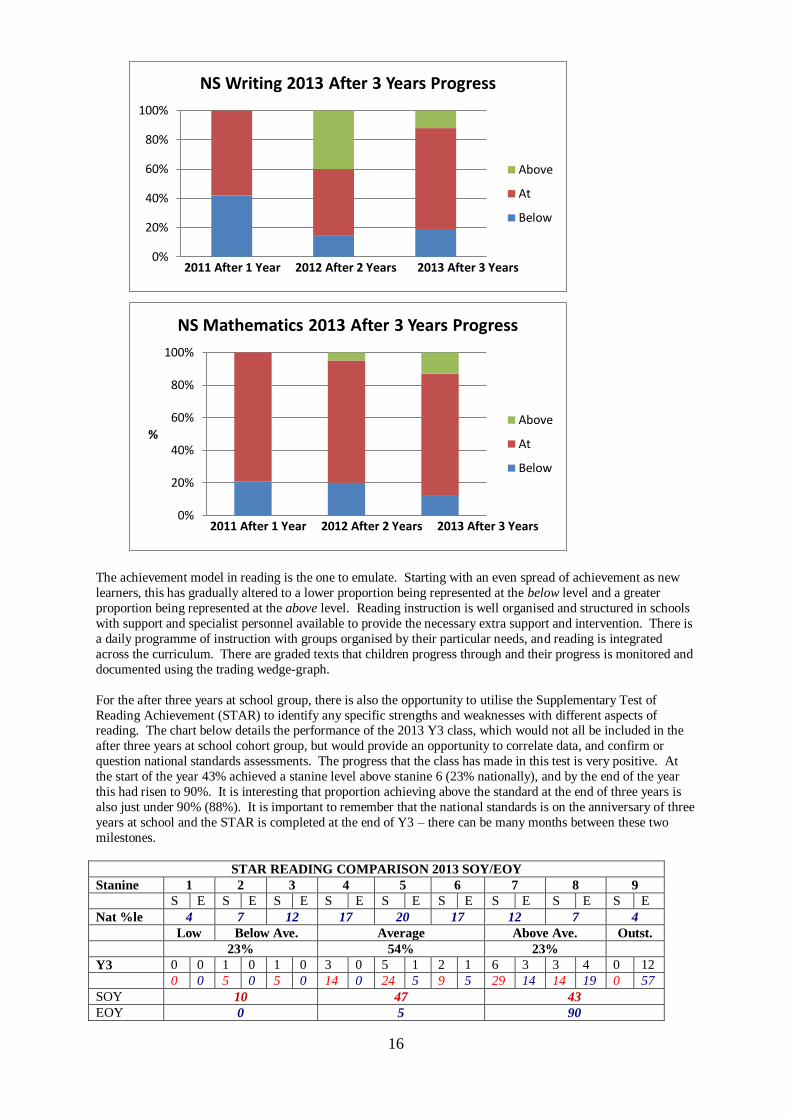
The second graphs details the achievement levels in writing for the first three years at school.
Once again, the picture is positive regarding the proportion achieving below the standard.
42% were below the standard as the after one year at school group in 2011, but this decreased
to only 15% of the group in 2012, and then a slight increase to 19%. The proportion
achieving at the standard was 58% in 2011, 45% in 2012, and 69% in 2013. That would have
been positive if the same trend was evident at the above the standard level, but initially from
having none achieving this level, in 2012 40% were assessed as achieving above the standard,
but in 2013 this dropped to only 12%.
In mathematics, the proportion achieving above the standard is significantly smaller than in
reading and writing, although the number profile is similar to the writing model. In 2011
there were not any pupils achieving above the standard, 79% achieving at the standard, and
21% below the standard. As the after two years at school cohort group, the proportions had
improved fractionally with 20% below the standard, 75% at the standard, and 5% above the
standard. In 2013, after three years at school, the proportion below the standard had dropped
to only 12%, the proportion at the standard remained static at 75%, and the proportion above
the standard had increased to 13%.
16
0%
20%
40%
60%
80%
100%
2011 After 1 Year 2012 After 2 Years 2013 After 3 Years
NS Writing 2013 After 3 Years Progress
Above
At
Below
0%
20%
40%
60%
80%
100%
%
2011 After 1 Year 2012 After 2 Years 2013 After 3 Years
NS Mathematics 2013 After 3 Years Progress
Above
At
Below
The achievement model in reading is the one to emulate. Starting with an even spread of achievement as new
learners, this has gradually altered to a lower proportion being represented at the below level and a greater
proportion being represented at the above level. Reading instruction is well organised and structured in schools
with support and specialist personnel available to provide the necessary extra support and intervention. There is
a daily programme of instruction with groups organised by their particular needs, and reading is integrated
across the curriculum. There are graded texts that children progress through and their progress is monitored and
documented using the trading wedge-graph.
For the after three years at school group, there is also the opportunity to utilise the Supplementary Test of
Reading Achievement (STAR) to identify any specific strengths and weaknesses with different aspects of reading. The chart below details the performance of the 2013 Y3 class, which would not all be included in the
after three years at school cohort group, but would provide an opportunity to correlate data, and confirm or
question national standards assessments. The progress that the class has made in this test is very positive. At
the start of the year 43% achieved a stanine level above stanine 6 (23% nationally), and by the end of the year
this had risen to 90%. It is interesting that proportion achieving above the standard at the end of three years is
also just under 90% (88%). It is important to remember that the national standards is on the anniversary of three
years at school and the STAR is completed at the end of Y3 – there can be many months between these two
milestones.
STAR READING COMPARISON 2013 SOY/EOY
Stanine 1 2 3 4 5 6 7 8 9
S E S E S E S E S E S E S E S E S E
Nat %le 4 7 12 17 20 17 12 7 4
Low Below Ave. Average Above Ave. Outst.
23% 54% 23%
Y3 0 0 1 0 1 0 3 0 5 1 2 1 6 3 3 4 0 12
0 0 5 0 5 0 14 0 24 5 9 5 29 14 14 19 0 57
SOY 10 47 43
EOY 0 5 90
17
0
10
20
30
40
1 2 3 4 5 6 7 8 9
%
STANINE LEVEL
STAR 2013 Y4 SOY/EOY
NAT
SOY
EOY
The following graph highlights the Y3 class’s performance against the national expectation,
(in blue) and the progress they made from the beginning of the year to the end.
In mathematics, the Progress and Achievement Test (PAT) can also be used to compare the
class assessment profile in national standards and in other assessment types. The chart below
records the class’s achievement profile at the start of the year and at year end.
PAT COMPARISON: MATHEMATICS 2013
Stanine 1 2 3 4 5 6 7 8 9
Nat %le 4 7 12 17 20 17 12 7 4
Below Average Average Above Average 23% 54% 23%
Y3 BOYS 0 0 0 0 0 0 2 0 1 0 0 1 3 0 3 0 0 7
Y3 GIRLS 0 0 0 0 0 0 1 0 3 1 4 1 2 2 4 4 0 5
Y3 TOTAL 0 0 0 0 0 0 3 0 4 1 4 2 5 2 7 4 0 12
13 0 17 5 17 9 23 9 30 20 0 57
0 0 47 14 53 86
None of the children scored at the below average area (stanine 1-3) although 13% did score at
stanine 4 at the start of the year. This is an area of concern. However, by the end of the year
there wasn’t anyone below stanine 5. It is once again very positive to note that initially only
53% of the class were above average (scoring stanine 7-9) but by the end of the year this had
reached 86%. Compare that to the national standards result which had only 13%. More
significantly perhaps, were the 57% at the highest stanine at year end. It is probably
appropriate for the current standardised testing material available to be modified to fit in with
the national standard milestones, or be delivered at the children’s anniversary (after three
years) to see whether there is a closer correlation.
Certainly, it would appear that our five-year-olds seem to start behind the eight ball in writing
and number, and take longer to be at or above the standard, but this may be because the time-
frame for the standardised testing that is available and the overall teacher judgement schedule
is different, and provides conflicting achievement profiles. I would acknowledge that the
national standards are not norms-based and so there won’t be a standard distribution curve,
but it is important to support teacher judgements with standardised test data.
For the last three years, because of my concern, I have compared the separate after one year
at school cohort groups. For the first three years since the introduction of national standards
the cohort group has been quite similar with three distinct levels of achievement with less
18
0%
50%
100%
%
2010 A1Y 2011 A1Y 2012 A1Y 2013 A1Y
NS Reading After 1 Year 2010-2013 Profile
Above
At
Below
0%
20%
40%
60%
80%
100%
%
2010 A1Y 2011 A1Y 2012 A1Y 2013 A1Y
NS Writing After 1 Year 2010-2013
Above
At
Below
0%
20%
40%
60%
80%
100%
1 2 3 4
%
2010 A1Y 2011 A1Y 2012 A1Y 2013 A1Y
NS Mathematics After 1 Year 2010-2013 Profile
Above
At
Below
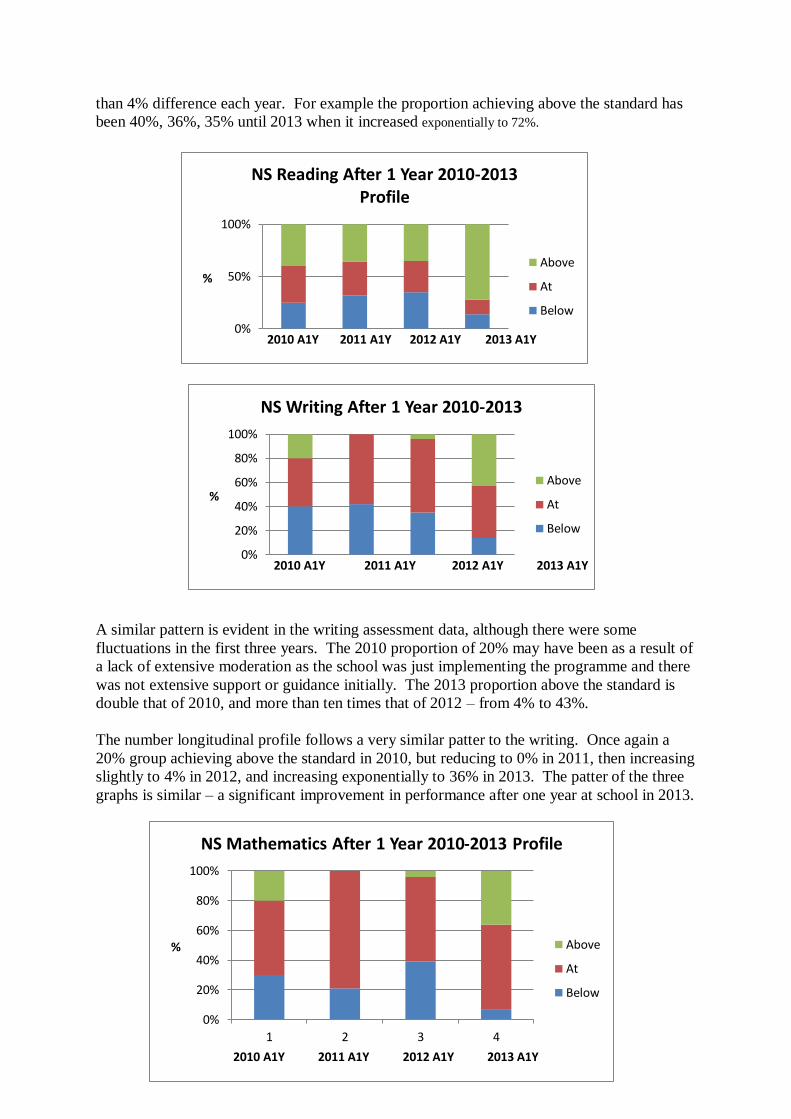
than 4% difference each year. For example the proportion achieving above the standard has
been 40%, 36%, 35% until 2013 when it increased exponentially to 72%.
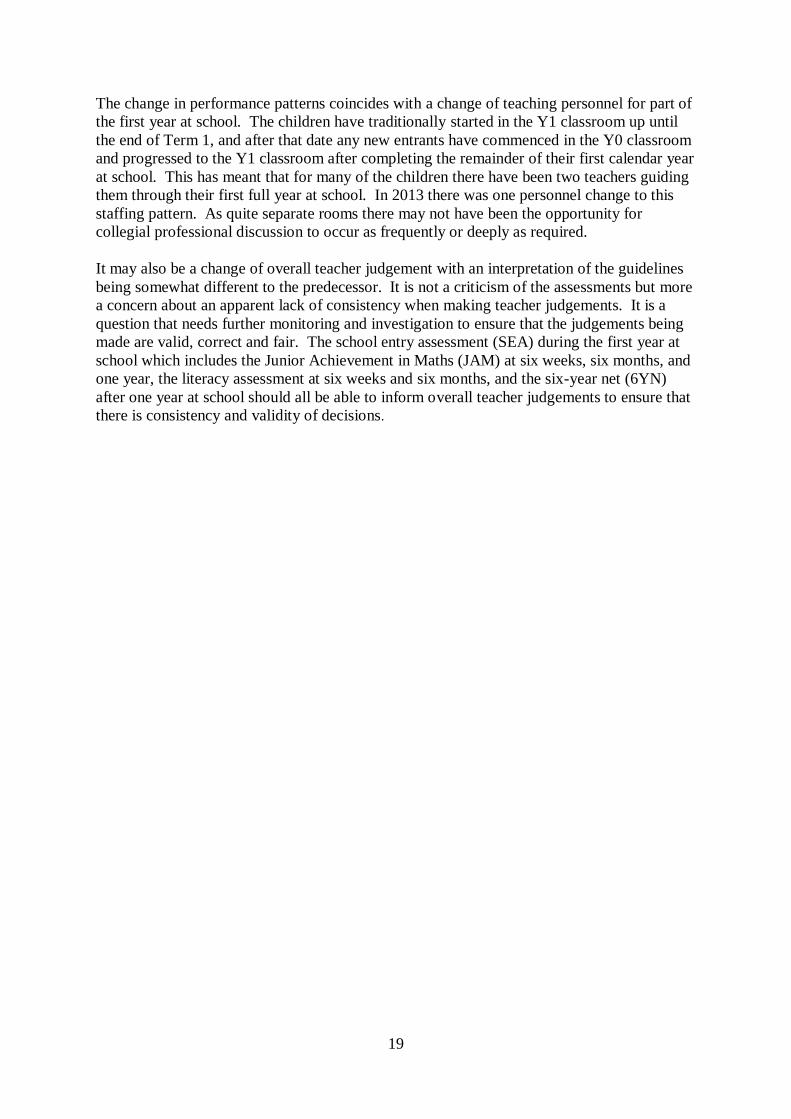
A similar pattern is evident in the writing assessment data, although there were some
fluctuations in the first three years. The 2010 proportion of 20% may have been as a result of
a lack of extensive moderation as the school was just implementing the programme and there
was not extensive support or guidance initially. The 2013 proportion above the standard is
double that of 2010, and more than ten times that of 2012 – from 4% to 43%.
The number longitudinal profile follows a very similar patter to the writing. Once again a
20% group achieving above the standard in 2010, but reducing to 0% in 2011, then increasing
slightly to 4% in 2012, and increasing exponentially to 36% in 2013. The patter of the three
graphs is similar – a significant improvement in performance after one year at school in 2013.
19
The change in performance patterns coincides with a change of teaching personnel for part of
the first year at school. The children have traditionally started in the Y1 classroom up until
the end of Term 1, and after that date any new entrants have commenced in the Y0 classroom
and progressed to the Y1 classroom after completing the remainder of their first calendar year
at school. This has meant that for many of the children there have been two teachers guiding
them through their first full year at school. In 2013 there was one personnel change to this
staffing pattern. As quite separate rooms there may not have been the opportunity for
collegial professional discussion to occur as frequently or deeply as required.
It may also be a change of overall teacher judgement with an interpretation of the guidelines
being somewhat different to the predecessor. It is not a criticism of the assessments but more
a concern about an apparent lack of consistency when making teacher judgements. It is a
question that needs further monitoring and investigation to ensure that the judgements being
made are valid, correct and fair. The school entry assessment (SEA) during the first year at
school which includes the Junior Achievement in Maths (JAM) at six weeks, six months, and
one year, the literacy assessment at six weeks and six months, and the six-year net (6YN)
after one year at school should all be able to inform overall teacher judgements to ensure that
there is consistency and validity of decisions.
20
National Standards NAG2A (b) reporting template School name and number: HADLOW PREPARATORY SCHOOL (4104)
NAG2A (b)
Schools are required to report school-level data on Ngā Whanaketanga Rumaki Māori and/or
National Standards under four headings:
i. School strengths and identified areas for improvement
ii. The basis for identifying areas for improvement
iii. Planned actions for lifting achievement
iv. How students are progressing in relation to Ngā Whanaketanga Rumaki Māori and/or
National Standards.
NAG2A (b)(i) Areas of strength
READING
The school has maintained progress in the achievement of reading since 2010. There were no
pupils achieving well below the standard and only 13% overall achieving below the standard.
This is an improvement on 2011 and 2012 of 2% overall. 87% of the school achieved at or
above the standard, with 52% achieving above the standard. The school has averaged 86%
achieving at or above the standard during the last three years. A number of cohort groups
achieved a high proportion above the standard – 88% of the after three years at school group,
72% at the after one year at school group, 68% of the Y5 class and 59% of the Y4 & Y6
classes. The total after three years at school group (100%) achieved at or above the standard;
96% of the Y8 group and 91% of the Y4 group achieved at or above the standard.
Girls were more strongly represented at the above the standard level – 61% compared to the
45% of the boys. The largest proportion of the school population achieved above the
standard (52%) with 35% achieving at the standard.
There has also been an improvement of performance at the after one year at school level.
Concern was raised last year about the school’s poorer performance at the first three years at
school, but this year only 14% of the after one year at school group failed to reach the
standard. A similar positive pattern is evident at the after three years at school - 7% below
the standard in 2011, 0% in 2012, and 0% in 2013.
WRITING
82% of the school is achieving at or above the standard in writing. Over the last three years
the school has averaged 83% at or above the standard. At the Y8 level 96% of the cohort
group achieved at or above the standard; 88% at Y5, 86% after one year at school, and 85%
at Y6. The after one year at school writing data is particularly impressive as this was an area
of concern identified last year. In 2011 none achieved above the standard, in 2012 the
proportion achieving above the standard after one year at school was only 4%, and this has
risen to 43% this year. Overall, 90% of the girls achieved at or above the standard, compared
to 66% of the boys. 43% of the girls achieved above the standard.
NUMBER
The school achieved 84% at or above the standard, and 32% overall above the standard. 85%
of the boys and 83% of the girls achieved at or above the standard. The after one year at
school cohort group achieved a proportion of 93% at or above the standard, the highest
proportion across the school. The after one year at school also had the smallest proportion
21
below the standard – 7%. 64% of the Y5 class achieved above the standard while 41% of Y6
and Y4 achieved above the standard. Fractionally fewer boys were represented below the
standard (15% compared to 17% of the girls) and were better represented above the standard
(37% compared to 27% of the girls). The gender difference has improved from 5% in 2011
to 2% this year. There are no pupils well below the standard.
NAG2A (b)(i) Areas for improvement
READING
There was an average of 13% achieving below the standard over the school-levels, and
although at some levels there were very small proportions achieving below the standard such
as none at the after three years at school level, only 4% at the Y8 level, and less than 10% at
the Y4&Y5 levels, over a quarter (26%) of the after two years at school cohort group failed
to achieve the standard, 22% of the Y7 class, and 14% of the Y6 class. Boys were over-
represented below the standard compared to the girls – 19% of the boys compared to only 6%
of the girls overall. Although the Y4 class had a very small boy cohort group, 33% of the
boys failed to achieve the standard. A similar proportion of boys also failed to achieve the
standard at after two years at school (28%), Y6 (27%), and after one year at school and Y7
(25%).
Although the school was well represented at the above the standard level, there are a
significant proportion achieving at the standard who could have their progress accelerated to
achieve above the standard. The largest group unfortunately is the Y8 class (63%) but this
group of learners will be transferring to secondary schools. 52% of the Y7 class (50% of the
boys and 67% of the girls) is also achieving only at the standard and through the flexible
learning programme with targeted teaching there is the potential to raise the proportion
achieving above the standard.
WRITING
18% below the standard is the highest proportion of under-achievers in the national standards.
The average over the last three years has been 17%, but last year we only had 13% below the
standard. There are not any pupils well below the standard in writing. Boys are over-
represented at the below level – 24 boys (26%) compared to nine girls (10%) failed to reach
the standard. Of the groups of boys, the most significant is the group of eight at the Y7 level
– they constitute 40% of the boys at the Y7 level. It is not possible to provide a valid
comparison with the 2012 Y6 boys’ performance because there is a significant intake of boys
at the Y7 level. There were only three 2012 Y6 boys (20%) who were below the standard
last year. Of the eight boys identified, four were new to the school this year, two were part of
the ‘below’ group last year, and two regressed from being at the standard last year to being
below.
There is a group of seven (26%) – four boys and three girls who are below the standard after
two years at school. Of the seven, four are new to the school this year, while three have
regressed from being at the standard after one year at school to below the standard in 2012.
This may be a different interpretation by the teacher regarding the overall teacher judgement.
Two further groups are the five (2 boys and 3 girls) who failed to reach the standard at the
end of Y4, and four (three boys and one girl) who failed to reach the standard at the end of
Y5.
22
NUMBER
Although the gender balance is relatively equitable overall, there are a greater proportion of
groups represented below and at the standard. 31% of the after two years at school girls, and
25% of the Y4 girls failed to reach the standard, while 25% of the Y7 boys achieved below
the standard. The proportion that achieved above the standard was also low at a number of
levels. No girls in the after two years at school cohort group or at the Y7 level, and no boys
in the after three years at school cohort group achieved above the standard. Only three boys
(15%) at the Y7 level achieved above the standard.
Significant proportions achieved only at the standard – 100% of the after three years at school
boys’ cohort group, 100% of the Y7 girls, and 83% of the after one year at school girls’
cohort group. 75% of the after three years at school cohort group overall, and 65% of the Y7
cohort group achieved at the standard.
NAG2A (b)(ii) Basis for identifying areas for improvement
READING
The school has maintained a relatively consistent achievement profile in reading since 2011 –
86% in 2011, 85% in 2012 and 87% in 2013 achieving at or above the standard. The
proportion achieving above the standard has averaged 50.3% over the last three years, with a
further 36% achieving at the standard during the same time-frame. In 2011 the proportion at
and above the standard was very similar (42% at, 44% above) but the break-down has swung
more to the above the standard level since 2012 – 55% above and 30% at in 2012, and 52%
above and 35% at this year. By raising the number achieving above the standard from being
at the standard would confirm that we are teaching to all children’s needs to progress their
achievement, rather than only focusing on the under-achievers to ensure they reach the
standard.
Boys and their reading needs will continue to be a focus to reduce the proportion failing to
achieve the standard. Boys are often significantly over-represented at the below the standard
level, compared to the girls. A particular boys’ focus will be the 2013 Y7 group which
numbers five (25%). This is an increase of two individuals since 2012 taking the proportion
from 20% to 25%. Prior to that, in 2011 the group numbered five and constituted 33% of the
boys at the Y5 level. There are smaller numbers of boys (2 – 3) at the Y4-Y6 levels and after
one and two years at school which will also need to be monitored to ensure their progress is
accelerated.
There are four girls at the after two years at school level (25%) who also have not reached the
standard in reading. This group has reduced in number since last year (2012) when as the
after one year at school group they numbered six and accounted for 38% of the cohort group.
WRITING
Writing has traditionally been the area of literacy which the school has not been able to
reduce the proportion significantly of those who are below the standard, or to increase
significantly the proportion of those achieving above the standard. There are extremes at the
different year levels regarding achievement above the standard. At the upper end of the
spectrum, 63% of the Y4 class, 52% of the Y5 class and 44% of the Y6 class achieved above
the standard. At each of these year levels it was the girls’ performance which lifted the
overall percentage – ten girls (62%) at Y4, nine at Y6 (56%) and eight at Y5 (73%) with a
significantly smaller number of boys. In fact the highest proportion of boys to achieve above
the standard was at Y4 where four of the boys actually accounted for 67% of the total.
23
Boys have been identified as significant under-achievers in writing for some time. There
were twenty-four boys below the standard overall, compared to only nine girls. There are also
more boys represented at the standard - fifty-three (56%) compared to forty-one (47%) girls.
The greatest difference however is above the standard where there were seventeen boys
(18%) compared to thirty-seven girls (43%).
Longitudinally, the 2013 Y4 class achieved 63% above the standard. As the 2012 after three
years at school cohort group, they achieved 68% above the standard, but as the 2011 after two
years at school, only 24%.It is noted that three new pupils started in this class at the
beginning of 2013, while three also left during this year. The question posed is the validity
and consistency of overall teacher judgements in writing, which is a much more subjective
and interpretative process. There is a similar pattern with the 2013 Y6 cohort group. 44%
achieved above the standard this year, and as the 2012 Y5 group 44% achieved above the
standard, but as the 2011 Y4 group only 16% achieved above the standard.
NUMBER
The school has maintained a fairly consistent achievement profile since 2011 – 16-19%
below, 51-55% at, and 29-32% above the standard. Girls tend to be over-represented at the
standard rather than above the standard and this has been a consistent pattern. 17% above in
2011 compared to 40% of the boys; 21% above in 2012 compared to 38% of the boys, and
27% above in 2013 compared to 37% for the boys. There has been a small increase in the
proportion of girls achieving above the standard since 2011, but there is potential for an even
greater increase in numbers.
A similar longitudinal pattern is evident at the after one year at school level. This year 36%
achieved above the standard for number, compared with 4% in 2012 and 0% in 2011.
Conversely, at the after three years at school level, the proportion achieving above the
standard has reduced significantly this year from 67% in 2011, 37% in 2012, to only 13% in
2013. The number achieving below the standard at the after one year at school level has
reduced accordingly – 21% in 2011, 39% in 2012, and 7% in 2013. From four learners to
nine leaners in 2012 and then only one in 2013.
Tracking the 2011 after one year at school cohort group shows progress has been made. 21%
achieved below the standard in 2011 and as the 2012 after two years at school group 20%
achieved below the standard, but as the 2013 after three years at school group only 12%
achieved below the standard. Conversely the proportion above the standard from 2011 has
risen from 0% to 13% as the original group has progressed up the school.
NAG2A (b)(iii) Planned actions for lifting achievement
READING
The further implementation of the future-focused teaching and learning programme with the
establishment of two-year group hubs with explicit group instruction on specific needs of the
learners will enhance the teaching and learning, raise the level of engagement, and facilitate
the development of greater self-management, self-motivation and confidence in reading.
Reading will be hub-based and the programme of instruction will be determined using start of
year assessment data performance, previous progress profiles, and hub-based collegial
discussions. One of the advantages of a two-year hub means that there will be the
opportunity for specific programmes to be developed over a two-year period with the same
teachers so anecdotal notes will be shared, and consistency of programme delivery will be
sustained over a two-year period.
24
The flexible learning programme will also allow the learners to prioritise their task
completion to their individual preference and give them greater ownership and therefore an
incentive to maximize their engagement with the learning. The need for supplementary or
follow-up activities will be reduced significantly as the learners develop greater
independence with their learning. Often teachers have needed to ‘occupy’ their learners in
work-sheets so they could complete group instruction, but with a flexible learning
programme this requirement is eliminated. Authentic follow-up activities that reinforce or
allow the children to apply the concept or skill being taught can be implemented. Because
the activity is authentic to the group instruction, and can be completed at the learner’s
discretion regarding time or priority, there is greater likelihood that the activity will be
completed well and may reinforce the previous learning more effectively.
Target groups will be identified and provided with reading tuition to meet their particular
needs. The literacy-resource teacher will liaise with the hub-leaders to determine the most
appropriate strategies to be implemented to accelerate the necessary progress. Greater and
more effective use will be made of support-teacher personnel to ensure that daily, explicit
teaching and learning occurs, and that all follow up work is monitored.
The literacy resource- teacher will be utilised school-wide, wherever the need is greatest. In
the past the priority has been for school entry and first three years at school national standards
testing has been administered by the literacy resource-teacher, but this will be devolved more
to the hub-teachers so that they are able to identify any trends or patterns in the data and have
access to the ‘big picture’ of particular children’s learning style and needs while analysing the
data.
There is a need for the school to research further and deeper into the particular causes that
some children have that inhibits their progress in reading. There needs to be more explicit
and closer scrutiny of assessment data to help to identify the impediment to progress that the
under-achievers currently have, and implement new and different strategies to support the
learning. Too often time and energy is put into one-to-one intervention and tuition for a finite
period of time without any significant improvement in performance. There seems to have
been an assumption that if there has been intervention then the issue has been addressed.
Anecdotally, we have groups of children that progress through the year-levels but do not
make any accelerated progress even though intervention has occurred.
Target groups will include: the Y7 group of boys who failed to meet the national standard in
reading: the group of seven after two years at school who failed to reach the standard; those
children who are currently achieving below the standard at the other year levels; and
accelerating those who are currently at the standard to be above the standard at the end of
2014.
WRITING
It is important that there is a re-focus on writing and the writing programme in 2014. The
comparison is often made that literacy is reading and writing and that they should be
integrated but often teachers have separate times for their focus on reading specifically, and
then writing. When teaching the skills of reading the groups have a common text which is
investigated collaboratively by all members. Once the reading instruction is completed the
group may have some follow up work to reinforce and embed the new skill learned, and then
they can apply that skill in their personal reading. Many children enjoy reading – perhaps not
always the instruction or the follow-up activities, but certainly their personal or own-choice
reading. Future-focused teaching and learning is a vehicle for personalising all learning and
25
so there is an opportunity to critically analyse the current teaching of the writing format, and
provide greater personalisation and flexibility.
Unfortunately, reading allows the learner to be the recipient of the creativity on the page, and
once immersed in that creativity, the child is often self-motivated to manage their own
reading. Writing on the other hand requires an audience for the writing to be authentic, and
the writer becomes the active component of the process, creating ideas, images and concepts
through print. In writing there are well established conventions which have to be learned and
memorised, supposedly, so the audience can understand the symbols and a reluctant writer is
constantly bombarded with corrections and those conventions; often the focus is on the
surface features rather than the pupil’s voice or the craft of writing; and often the writing is
assessed on the length of the story. A ‘next learning step’ on reports is often to be able to
write more words… The number of words should not be the critical factor. The quality
should be the focus.
Just as reading has to interest the reader, so writing must interest the writer, so unless their
imagination or motivation is ignited, the writing process can become very tiresome and
monotonous, and children easily become disillusioned with the writing process. There needs
to be explicit teaching of skills and concepts to provide the learner with a writer’s tool-kit,
but there also needs to be authenticity – an authentic context and a real need or requirement
to actually apply the learned skill or concept (the split infinitive is now perfectly acceptable).
A recent report comment highlighted this when the teacher identified that the child best
writing still comes from her personal experiences rather than dictated topics. We need to
switch the writers on rather than switch them off.
There will need to be a focus on writing as part of the professional learning programme with
a willingness from teachers to abandon past practices that have not realised positive changes
to children’s attitudes to and completion of writing. The dispositions inherent in the school’s
vision need to be the vehicle by which change can be implemented. The evaluation of the
learners’ level of literacy, self-motivation, self-management, confidence and responsibility
needs to inform the decisions about the writing process and programme. All writing needs to
be authentic, and requires an audience.
Target groups will include those children who are achieving below the standard, but
specifically the group of eight boys at the end of Y7, the six children after two years at
school, and the five children at the end of Y4. There also needs to be a focus on the children
achieving at the standard to accelerate their progress so they are achieving above the
standard. To achieve a similar proportion achieving above the standard to the reading result
would be the aim.
NUMBER
The implementation and development of a two-year cross grouping structure has meant that
mathematics tuition can be targeted more effectively to a greater number of learners within a
hub environment. Two teachers, with teacher-support personnel, plan and evaluate teaching
and learning programmes collaboratively, and learners are able to transfer between
instructional groups depending on their particular needs. The future-focused teaching and
learning programme allows greater flexibility for the teacher and learner and maximises the
teachers’ time at actually teaching explicitly. All mathematics’ teaching is completed in
small groups on a daily basis with appropriate and relevant follow-up, consolidation and
extension activities provided for the learners. The learners are able to complete the set tasks
at a time and place that suits them, so they assume greater ownership of their learning and
26
develop greater self-management, self-motivation, and confidence as a result The traditional
‘maths time’ can now occur at any stage of the school day as the children are working
flexibly and independently so they are available for specific instruction and tutorials. The
need for lengthy, repetitive work-sheets is eliminated. This, in turn, makes mathematics
more interesting and exciting for the learners.
The two-year cross-grouping has also created much more homogeneous groups which work
well because all the group members know they are at the same level and do not feel
intimidated by others who may be more advanced because the groups were also based on an
optimum number as well as the level of ability. Children are empowered to work with each
other and to ‘teach’ concepts to one another. Progress is now able to be monitored across a
wider range of learning levels and learners requiring extension or remediation can be catered
for effectively within the teaching and learning programme, rather than having to be
withdrawn.
Target groups will include the six pupils achieving below the standard after two years at
school (one boy (9%) and five girls (31%)); the five children at the end of Y4 (one boy (17%)
and four girls (25%); the five boys (25%) at the end of Y7. All other pupils currently
achieving below the standard will be focus learners to accelerate their progress so they
achieve at the standard.
A further target will be to raise the proportion of girls, and of those achieving at the standard,
to achieve above the standard.
NAG2A (b) (iv) Progress Statement
READING
The school has sustained a consistent level of achievement in reading during the last three
years as evidenced by the national standards’ data. There have not been any learners
achieving well below the standard and an average of only 14% achieving below the standard
during the last three years. Conversely, on average, over 50% of the school achieves above
the standard each year. This peaked at 55% in 2012 and is 52% this year. The school
operates a daily, explicit, group-based reading programme at all year levels. Group
instruction, utilising the teacher-support personnel, has meant the teacher-pupil ratio at the
Y2 – Y4 levels, for example, was reduced from 1: 24 to 1: 12 for much of 2013. In 2014, the
further implementation of the hub-structure will provide a longer, more consistent, child-
centred, teaching and learning programme which is anticipated to enhance the learning
experience for the children.
WRITING
The school’s achievement profile in writing for national standards has been an area of
concern because it does not mirror that of reading, the other component of literacy. The
proportion difference at below the standard has ranged from 1% to 6% since 2011, but at the
above the standard level the writing proportion has been up to 24% different. There have
never been any pupils achieving well below the standard. Boys have always been over-
represented at below the standard and under-represented at above the standard, compared to
the girls. They have averaged 24% below the standard over the last three years compared to
the girls’ average of 10%, and averaged only 18% over the last three years above the standard
compared to 44% for the girls. There has, however, been an improvement in the number
achieving above the standard overall – 20% in 2011, with a jump to 43% in 2012, and a
decline to 30% in 2013.
27
2012 was the most positive year for writing achievement with 87% achieving at or above the
standard compared to 82% in 2013 and 80% in 2011. The 43% achieving above the standard
in 2012 was an exceptional result which has not been sustained. A comparison of the 2012
and 2013 cohort groups highlights some anomalies. The proportion achieving above the
standard can be compared (2012 as the first percentage with the 2013 percentage second).
After one year at school 4%/43%, after two years at school 40%/4%, after three years at
school 67%/12%, at the end of Y4 68%/63%, at the end of Y5 44%/73%, at the end of Y6
48%/44%, at the end of Y7 28%/8%, and at the end of Y8 32%/15%. There have been staff
changes at the after one year, after two years, after three years, and at the end of Y5 which
may highlight a degree of difference in the moderation and assessment processes completed
by the teachers.
There is always change to numbers at different class levels, and this can lead to fluctuations
and changes to proportions, especially at the Y7 level. This is evident in the class’s profile
since 2011 – as the 2011 Y5, 20% achieved above the standard while 40% achieved below.
In 2012 as the Y6 48% achieved above the standard (an increase of 28%) while only 12%
were below. A significant change of the class demographics in 2013 resulted in only 8%
achieving above the standard while 40% were below. Of the fourteen who had been a part of
the cohort group since 2011, eight (57%) maintained their same level (one above, five at, and
two below), while one regressed from at to below, and four from above to at (43%). The new
pupils who joined the class in 2013 all achieved below the standard.
NUMBER
The school has maintained a high level of consistency in its achievement profile in number
since 2011. In fact, the first data was collected in 2010 as part of the trial phase, and even
then the staff seemed to have a clear understanding of the moderation of the overall teacher
judgement in mathematics. The NUMP programme does provide a well-structured diagnostic
and assessment component that provides valuable information for teachers. As well it is an
oral interview so any literacy difficulties usually associated with a test are eliminated. Using
other assessment tools such as PATs allows teachers to triangulate the assessment data to
inform their decisions regarding levels of achievement. In 2010 the school identified 14%
below the standard, and since that date the average proportion at this level has been 16%.
This has meant that we have not been able to reduce the overall proportion that is not
achieving the standard by accelerating their progress. This is in spite of implementing target
group foci and providing extra support and intervention. The level of cognitive capability of
many of the learners at this level may preclude any sustainable acceleration of progress.
The proportion achieving at the standard has also been relatively consistent – 52% in 2010,
51% in 2011, 55% in 2012, and 52% in 2013. That in turn creates consistency of levels of
achievement above the standard – 34% in 2010, 30% in 2011, 29% in 2012 and 32% in 2013.
The most significant increase is the proportion of girls achieving above the standard – from
17% in 2011 to 27% in 2013.
28
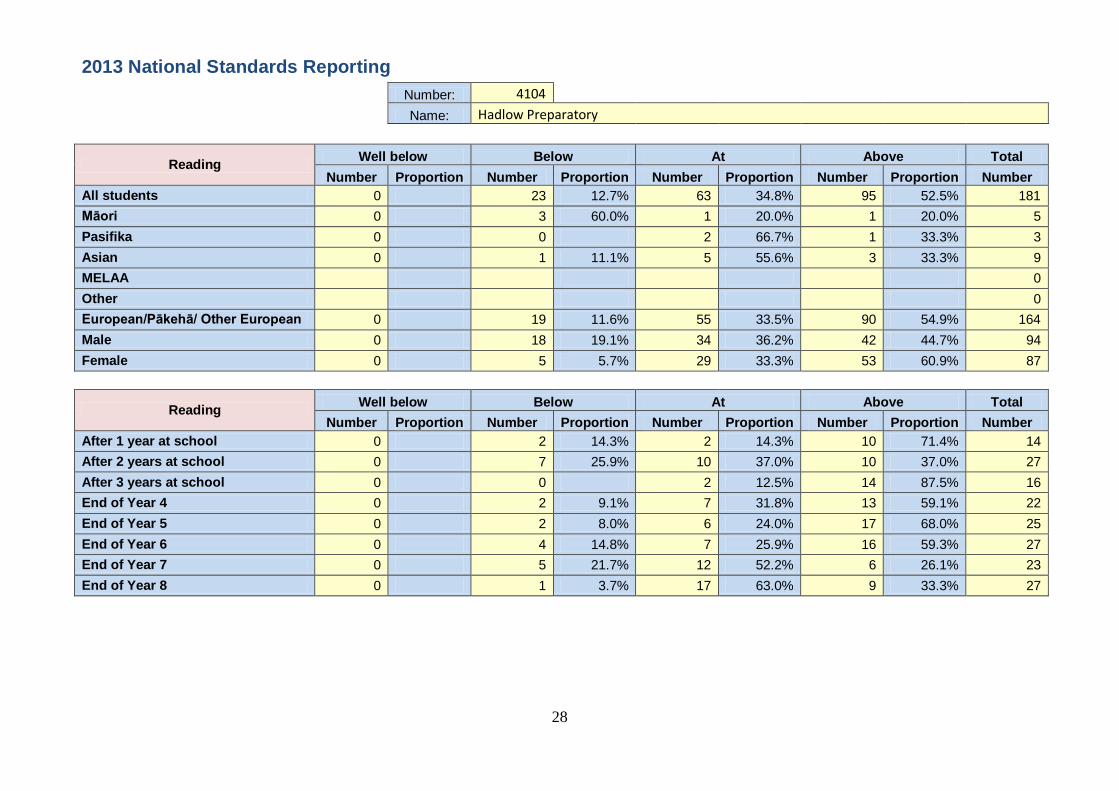
2013 National Standards Reporting
Number: 4104
Name: Hadlow Preparatory
Reading Well below Below At Above Total
Number Proportion Number Proportion Number Proportion Number Proportion Number
All students 0 23 12.7% 63 34.8% 95 52.5% 181
Māori 0 3 60.0% 1 20.0% 1 20.0% 5
Pasifika 0 0 2 66.7% 1 33.3% 3
Asian 0 1 11.1% 5 55.6% 3 33.3% 9
MELAA 0
Other 0
European/Pākehā/ Other European 0 19 11.6% 55 33.5% 90 54.9% 164
Male 0 18 19.1% 34 36.2% 42 44.7% 94
Female 0 5 5.7% 29 33.3% 53 60.9% 87
Reading Well below Below At Above Total
Number Proportion Number Proportion Number Proportion Number Proportion Number
After 1 year at school 0 2 14.3% 2 14.3% 10 71.4% 14
After 2 years at school 0 7 25.9% 10 37.0% 10 37.0% 27
After 3 years at school 0 0 2 12.5% 14 87.5% 16
End of Year 4 0 2 9.1% 7 31.8% 13 59.1% 22
End of Year 5 0 2 8.0% 6 24.0% 17 68.0% 25
End of Year 6 0 4 14.8% 7 25.9% 16 59.3% 27
End of Year 7 0 5 21.7% 12 52.2% 6 26.1% 23
End of Year 8 0 1 3.7% 17 63.0% 9 33.3% 27
29
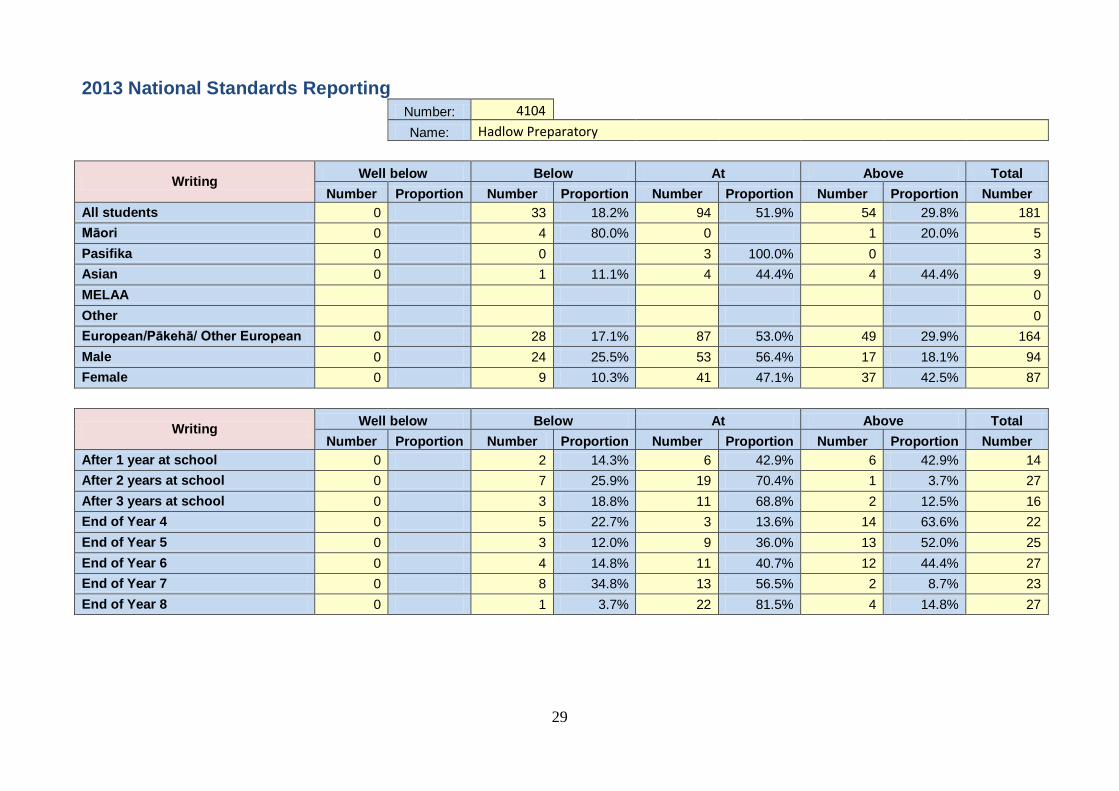
2013 National Standards Reporting
Number: 4104
Name: Hadlow Preparatory
Writing Well below Below At Above Total
Number Proportion Number Proportion Number Proportion Number Proportion Number
All students 0 33 18.2% 94 51.9% 54 29.8% 181
Māori 0 4 80.0% 0 1 20.0% 5
Pasifika 0 0 3 100.0% 0 3
Asian 0 1 11.1% 4 44.4% 4 44.4% 9
MELAA 0
Other 0
European/Pākehā/ Other European 0 28 17.1% 87 53.0% 49 29.9% 164
Male 0 24 25.5% 53 56.4% 17 18.1% 94
Female 0 9 10.3% 41 47.1% 37 42.5% 87
Writing Well below Below At Above Total
Number Proportion Number Proportion Number Proportion Number Proportion Number
After 1 year at school 0 2 14.3% 6 42.9% 6 42.9% 14
After 2 years at school 0 7 25.9% 19 70.4% 1 3.7% 27
After 3 years at school 0 3 18.8% 11 68.8% 2 12.5% 16
End of Year 4 0 5 22.7% 3 13.6% 14 63.6% 22
End of Year 5 0 3 12.0% 9 36.0% 13 52.0% 25
End of Year 6 0 4 14.8% 11 40.7% 12 44.4% 27
End of Year 7 0 8 34.8% 13 56.5% 2 8.7% 23
End of Year 8 0 1 3.7% 22 81.5% 4 14.8% 27
30
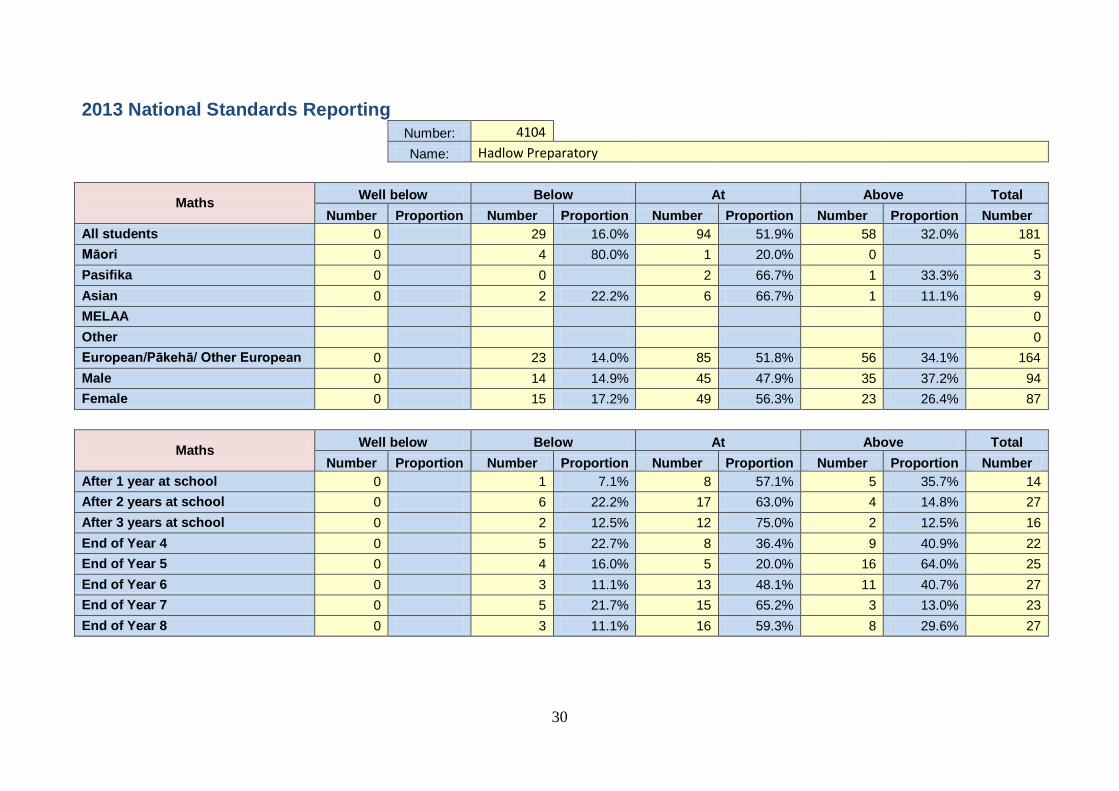
2013 National Standards Reporting
Number: 4104
Name: Hadlow Preparatory
Maths Well below Below At Above Total
Number Proportion Number Proportion Number Proportion Number Proportion Number
All students 0 29 16.0% 94 51.9% 58 32.0% 181
Māori 0 4 80.0% 1 20.0% 0 5
Pasifika 0 0 2 66.7% 1 33.3% 3
Asian 0 2 22.2% 6 66.7% 1 11.1% 9
MELAA 0
Other 0
European/Pākehā/ Other European 0 23 14.0% 85 51.8% 56 34.1% 164
Male 0 14 14.9% 45 47.9% 35 37.2% 94
Female 0 15 17.2% 49 56.3% 23 26.4% 87
Maths Well below Below At Above Total
Number Proportion Number Proportion Number Proportion Number Proportion Number
After 1 year at school 0 1 7.1% 8 57.1% 5 35.7% 14
After 2 years at school 0 6 22.2% 17 63.0% 4 14.8% 27
After 3 years at school 0 2 12.5% 12 75.0% 2 12.5% 16
End of Year 4 0 5 22.7% 8 36.4% 9 40.9% 22
End of Year 5 0 4 16.0% 5 20.0% 16 64.0% 25
End of Year 6 0 3 11.1% 13 48.1% 11 40.7% 27
End of Year 7 0 5 21.7% 15 65.2% 3 13.0% 23
End of Year 8 0 3 11.1% 16 59.3% 8 29.6% 27
31
National Standards Target Groups 2014 The National Standards achievement data has highlighted groups of learners who have not
reached the standard in the particular areas of testing. Of concern are the children who have
not accelerated their progress in the previous year to reach the standard.
After Two Years at School
This group is made up of seven children who failed to meet the standard, three who also
failed to meet the standard after one year at school, one who regressed from being at the
standard after one year at school, and three who were new entrants to the school at the start of
the year. Three of the children were classified as Year 2 and four were classified as Year 3.
The children were in learning environments where the teacher had qualified teacher support
personnel and the teacher-pupil ratio for instructional reading was reduced to 1: 12 for much
of the 2013 school year as a trial initiative of the future focused teaching & learning
programme.
Five of the named children who failed to reach the standard in reading also did not meet the
standard in writing, and four of them did not meet the standard in mathematics. This is of
grave concern and requires further and deeper analysis of their particular learning needs and
potential learning barriers. There needs to be a detailed assessment and analysis of their
current reading performance to determine what particular difficulties they experience.
The seven children are members of Hub 2 which is made up of the Y3&Y4 children and
inhabits two traditional classroom spaces which will be connected internally as the first stage
of creating a modern learning environment. All the Y3&Y4 children in the hub (irrespective
of their base class) will be cross-grouped for group instruction teaching utilising three
personnel, thus creating a teacher-pupil ratio across the hub of 1: 15. As well the hub is
initiating a flexible learning programme which will foster self-motivation, self-management,
confidence and independence and allow the children to choose the order and type of activities
they will complete. By engaging the learners more explicitly in their learning it is hoped that
the level of engagement will improve significantly, and that will result in a lift of
achievement.
At the End of Year 7
This group of five boys failed to achieve the standard at the end of 2013. Of the five boys in
this group, only one has been at the school since age five – the remainder were new entrants
at the Y7 level at the beginning of 2013. A positive aspect of the longitudinal data is that as
the at the end of Y6 there were four below the standard, and that figure increased to five as
the at the end of Y7 group in 2013, but only one of the original four of the 2012 group
remained. This meant that the proportion of those who didn’t meet the standard actually
reduced from 20% to 6.7% if you consider only those pupils who were a part of the cohort
group over two years. The inevitable intake at the beginning of Y7 does create a less positive
32
picture of achievement overall. Only fifteen of the at the end of Y6 group remained as part of
the at the end of Y7 group (65%).
The five members of this cohort group are all also in the writing target group, and three of
them are also in the mathematics target group. Of the one remaining longitudinal member,
his literacy standardised assessments tend to be at the stanine 3 or 4 level over a number of
years. PAT listening average is a 3, reading comprehension a 3.5, reading vocab a 3.8, STAR
3.75. This highlights specific barriers in literacy learning are apparent and the goal is to
identify what strategies need to be implemented to accelerate progress.
The cohort group is part of a two-class hub at the Y7&8 level which has been operating in a
future-focused teaching and learning model with collaborative teaching across both year-
levels. The hub operates a flexible learning programme which allows the learners to be self-
managing regarding their own learning and maximises the teacher-contact with instructional
groups. This has meant that more of the school-day can be dedicated to reading, writing, and
mathematics instructional groups, while the children pursue their own individual interests.
This programme has now been in operation at this level for two years and this has resulted in
a significant decline in off-task behaviour and the need for behaviour modification
programmes.
Significant use will be made of the school’s literacy resource person to intervene as a
specialist to interrogate the achievement performance profile to identify what strategies are
successful, and these will be implemented to sustain and accelerate progress. There will be
professional development opportunities for the teachers regarding reading and boys.
At the End of Year 4; At the end of Year 5; At the end of Year 6.
There are small numbers of individuals at each of these levels who also failed to meet the
standard in reading. There are two boys at the end of Y4, two boys at the end of Y5, and
three children (two boys and one girl) at the end of Y6. These represent 9.1% at Y4, 8.0%
atY5, and 14.8% at Y6. One child has been at the school for a minimum of two years while
the remainder have been at the school since five years of age.
For the two Y4 boys one achieved below after two years at school, achieved at the standard
after three years at school, but then regressed to be below the standard at the end of Y4. The
other boy has failed to reach the standards each year since starting. The same pattern is
evident at the end of Y5 – one who has failed to meet the standard each year, and one that
had his achievement accelerated but then regressed at the end of Y5. At Y6, of the three
pupils, two have failed to meet the standard but one had achieved the standard at the end of
Y5 but regressed at the end of Y6. One of the pupils is classified as special needs and did
receive ORRS funding for the first three years at school for teaching and learning support.
She was deemed to be independent and ineligible for teacher-aide funding from Y4.
Targets
to accelerate the progress of the seven pupils who failed to reach the target after two
years at school;
to provide a teaching and learning programme that meets the particular needs of the
learners so that they are able to reach their potential, and meet the standard;
to analyse the particular learning patterns to determine the barriers to learning – to
investigate what inhibits their learning and progress;
33
to accelerate the progress of the five boys who failed to reach the standard at the end
of Year 7;
to provide an explicit teaching and learning programme personalised to their
particular needs to maximise the opportunities to reach the standard at the end of Y 8;
to closely monitor the identified pupils who failed to reach the standard at the end of
Y4, 5 & 6, and provide a personalised teaching and learning programme which
identifies and highlights the barriers to their learning, and the strategies used to
facilitate the necessary progress;
to report against targets regularly at hub-leader meeting level to access the collegial
support of peers;
to reduce the number of pupils who are achieving below the standard.
The school’s National Standards achievement data profile for writing had the highest
proportion achieving below the standard – 18% overall. It also had the smallest proportion
achieving above the standard (30%) compared to reading (52%). The proportion achieving
below the standard increased from 13% from last year, and the proportion achieving above
the standard decreased from 43% last year. Writing will be a professional learning
development priority for this year.
After Two Years at School
Seven pupils who failed to reach the standard in writing – six of the same cohort group as for
reading, with one addition. Four (57%) were new to the school, while the remaining three
(43%) started at the school at five years. Of the three, only one has achieved below the
standard after one, and two years at school. The other two achieved the standard after one
year at school, but failed to meet the standard after two years at school.
At the End of Year 4
Five pupils (two boys & three girls) failed to reach the standard in writing. Of the five, two
are new to the school and have no achievement history, while one has consistently failed to
reach the standard, two have a ‘be, at, be’ profile for the previous three years. This would
indicate that there is potential to accelerate their progress through explicit teaching and
learning to meet their needs.
At the End of Year 7
There are a significant number of boys who failed to reach the standard at the end of Year 7.
The eight learners make up 34.8% of the class, and 40% of the boys. Once again, the group
is made up of new entrants to Year 7 for whom there is no achievement history. 50% of the
group are the new entrants. Of the remainder of the cohort group, two have consistently
achieved only below the standard while the other two had achieved at the standard at the end
of Y6 but were assessed as below the standard at the end of Y7.
At the End of Y5; At the End of Y6
There are three boys at the end of Y5 and two boys and one girl at the Y6 level who did not
achieve the standard. Of the three at the end of Y5 boys, only one has achieved below the
standard each year or annual milestone. The other two have fluctuated between below and at
during the three-year period (at, at, below; below, at, below). The Y6 girl is a special-needs
pupil who has delayed development which impacts on her gross and fine motor co-ordination
and intellectual capacity. She has not met the standard in the past. The two boys have met
the standard previously.
34
Targets
to accelerate the progress of the seven pupils who failed to reach the target after two
years at school;
to provide a teaching and learning programme that meets the particular needs and
interests of the learners so that they are able to reach their potential, and meet the
standard;
to analyse the particular learning patterns to determine the barriers to learning in
writing – to investigate what inhibits their learning and progress;
to critically interrogate the teaching & learning programme to ensure that it is
addressing the needs of the learners.
to accelerate the progress of those who failed to reach the standard at the end of Y4;
to provide an explicit, needs-based writing programme that captures the interest of the
learner;
to monitor and report on progress and through reflection, identify the potential causes
of the learning difficulties which inform the rate of progress of the group:
to accelerate the progress of those who achieved below the standard at the end of Y7;
to provide an individualised programme for the special-needs pupil to ensure that the
basic skills and knowledge are applied sustainably and progress is made;
to reduce the number of pupils achieving below the national standard.
After Two Years at School
There are six pupils who failed to meet the standard after two years at school in 2013. There
are five girls and one boy. All but the one boy have been at the school since five years of
age. Of these five, three have been in the Y3 class where the majority of the children have
completed three years at school. In fact, all of the after two years at school pupils in the Y3
class failed to meet the standard compared with only two out of twenty-three in the Y2 class.
Four of the pupils also failed to meet the standard in reading and writing – these children
were in the Y3 class grouping. The implementation of the hub structure and the composite
nature of the groups may reduce this anomaly. The majority of the group that failed to reach
the standard also were below the standard at their previous anniversary milestone.
At the End of Year 4
This group of six contains one pupil who achieved below the standard in mathematics,
reading and writing, and three girls who achieved below the standard in writing as well as
mathematics. One is new to the school in Y4 while the others all have a below, at, below
achievement pattern. This would potentially indicate that their progress can be accelerated to
reach the standard. There may also be a discrepancy with the overall teacher judgement at
one year level.
At the End of Year 5
Two boys and two girls failed to meet the standard in mathematics. The two boys also were
below the standard for reading and writing. One boy has a three-year achievement profile of
below, below, below; one of the girls has below, at, below, and the other two have at, at,
below. The boy who has consistently failed to reach the standard has some cognitive
deficiencies and has received significant support and intervention in the past. This has not
resulted in accelerating his progress. The two pupils who achieved at the standard for two
35
years need to be monitored closely to ensure that any specific gaps in their learning are
addressed.
At the End of Year 7
There are five boys who appear on the below the standard list, three of who also appear on
the same list for writing and reading, and two on the writing list. Two of the boys are new to
the school in Y7 while the other two have an achievement profile of below, below, and one of
at, below. Of the three, their PAT achievement profile shows a correlation with listening
comprehension as well as mathematics so there may be difficulties with processing concepts
through both the oral and written media. With the implementation of the NUMP programme
much of the assessment is oral which means a literacy difficulty does not compromise their
score, but in this case it is perhaps the lower ability to process abstract concepts that causes
the confusions and inability to apply a learned skill or concept in different contexts.
Targets
to provide a personalised mathematics programme that meets the needs of the target
group children;
to accelerate the progress of the learners so that concepts are sustained and able to be
applied in different contexts;
to investigate the apparent barriers to learning currently and implement alternative
strategies and programmes to remedy this;
to provide an individualised programme for the special-needs pupil to ensure that the
basic skills and knowledge are applied sustainably and progress is made;
to critically interrogate the teaching & learning programme to ensure that it is
addressing the needs of the learners;
to reduce the number of pupils achieving below the standard.
36
STRATEGIC PLAN 2012 - 2015 MISSION: To foster learning by educating for excellence through academic, physical, cultural, and spiritual challenges in a caring and safe environment.
VISION: A Hadlow pupil will be literate, self-managing, self-motivated, confident, respectful, and responsible.
STRATEGIC FOCUS
Goal 1
To identify, preserve &
celebrate the values &
special character of the
school
Goal 2
To develop & implement
systems & programmes to
improve pupil
achievement, with
emphasis on numeracy &
literacy.
Goal 3
To ensure all pupils are
provided with a variety of
opportunities to enable
them to become self-
motivated & self-
managing learners.
Goal 4
To develop, implement &
review a school-wide
programme for sport
development.
Goal 5
To ensure all staff
maintain a high quality of
teaching practice and
build sound parent/teacher
relationships
2012
Embedding the Maori
culture (te reo & te ao
Māori) into the school curriculum and
environment
te reo Māori action plan
development
Review National
Standards testing &
reporting Review timetable for
numeracy & literacy
Pupil Engagement
Maintain the embedding
of the NZ curriculum principles
Anti bullying programme
implementation
Review and assess the
strategic programme and implement changes.
Teacher self review to
inform teaching; identifying best practice
pedagogy for effective
teaching & learning
2013
Developing ways to enact
more fully the special
character of the school via
the vision attributes –
evaluating the attribute
progress
Reporting review
Assessment review
Implement changes from
timetable review to ensure
a relevant curriculum is
being delivered
Anti bullying programme
embedded in the school
culture
Investigate opportunities
for pupil voice to inform
all decisions
Consolidate a school wide
approach to sport.
Review electronic
environment for teaching
& learning.
Electronic Reporting
E-Portfolios
2014
Review the spiritual
programme, chapel
programme, and religious
connections to special character.
Community consultation
re reporting and interview
process, and feed-back re
innovative programmes to improve pupil
achievement.
Educating for the future to
ensure learners are self-
managing & self-
motivated.
Sport survey to evaluate
community satisfaction
with strategic direction of
sport at the school.
Teacher self-review to
inform decisions
regarding best practice in
a future-focused teaching and learning environment
Community consultation to determine the future, strategic direction of the school
2014 – 2018: developing a future focused teaching and learning environment to prepare the children for the 21st century.
2015 Develop the school’s
special character so that it
fits within the future focus
of the school.
Implementing future-
focused teaching and
learning programmes to
facilitate greater pupil
achievement.
A future-focused teaching
& learning programme
incorprating flexibility,
personalised learning and
opportunities for pupil
independence
To embed a diverse sport
programme to encourage
maximum participation by
all children.
Best pedagogical practice
in the 21st century, digital
learning environment.
37
Goal 1: To identify, preserve, and celebrate the values and special character of the school.
Focus
Developing ways to enact more fully the special
character of the school – what makes Hadlow different
from other schools in the Wairarapa – incorporating the
Anglican ethos and role of the Church.
Completed by / Comments Special Character Committee of the BOT & TSTB. The Special Character committee of the TSTB met regularly during the year to discuss and debate the meaning of special character er in relation to the three schools. The school’s special character is enshrined in the integration deed of agreement. The key elements of the special character definition are: being a part of the Trinity system, its affiliation to the Anglican tradition of the Church, the provision of an RE programme as an integral part of the
curriculum, the requirement for pupils to participate in worship, the upholding of a strong moral code based on Christian standards, and the unity of day & boarding components through a programme of religious, cultural, academic and recreational pursuits in which all pupils participate. The special character statement has been identified as:
regular prayer, worship and liturgy in keeping with the Anglican Prayer Book;
a programme of religious studies within the curriculum, and
interpersonal relationships which are founded on the values of the Gospel.
For the children, this means that they are trying to follow the example of Christ by praying and taking part in chapel services, learning about our religion and others in class, and treating each other with love, just as Jesus did. The other aspects of school life that are perceived to be special character technically are not. They are part of the tradition of a private boarding & day preparatory school based on the English model. The traditions of the school are not necessarily special character components and are not enshrined in any deed. It is the over-arching Christian perspective that should inform all decisions that are made at the school. The
traditions that need to be protected are primarily the religious education programme, the regular worshipping as a community, and the upholding of a strong moral code based on Christian values to inform how everyone should behave towards one another. This includes all members of the school community – pupils, staff, and parents. Because of the time taken to identify the core of the special character, there has not been any communication with, or education of, the school community to date. The place of special character does need to have a higher profile to ensure that it is acknowledged as a significant
aspect of school culture. The school chaplain, the archdeacon, and other diocesan representatives were involved in the review process.
Target
Present Situation
To have clarified the special character of the school in
such a way that it is understood by the school
community.
There is confusion of what constitutes the special
character of the school and teachers, parents and pupils
are unsure of what it entails and what it really means.
Action
review all special character statements to
determine the core of the school’s special
character statement;
differentiate between the legal special character statement that links to the integration
agreement and the procedures and practices that
make the school special;
clarify the expectations of the special character
for staff, pupils, and parents;
identify and document those established
traditions of the school that need to be
protected;
educate the school community about the special
character and its significance in the school
culture;
report regularly, through the weekly bulletin, under the heading of ‘special character’;
provide opportunities for regular feed-back
from parents;
involve the school chaplain and diocesan
representatives.
Resources
Integration Agreement
Policies & procedure documents which encapsulate
special character
Budget:
38
Goal 2: To develop and implement systems and programmes to improve pupil engagement in a future-focused learning environment.
Focus
Future-Focused Learning Completed by / Comments The school completed significant initiatives in firther implementing a future-focused teaching and learning model. The Y5-Y8 classes implemented and trialled a flexible learning model which promoted self-management and independent
learning. Instruction in reading, writing, and mathematics was explicit and personalised to the individual pupil’s needs. This flexible learning, and more explicit teaching developed significantly greater engagement with the learners. The Y0/Y1 classes also operated a single, collaborative teaching environment which provided greater personalising of children’s learning. The community was regularly informed and educated through
on-line links, visiting experts, and rhetoric in the newsletter. Meetings and discussions were also held with parents. The school architect was tasked with developing a property development plan which would transform the existing buildings into modern learning environments. Stage 1 of this development is planned for 2014. All teaching staff were involved in professional learning
developed with the three teacher-only days with Mark Treadwell and two full days at Amesbury School. Other staff also visited Stonefields and Pt England Schools. The principal attended the CEFPI conference which focused on FFT&L and the physical environment. The academic prize-list was reviewed and those awards which were deemed no longer appropriate were deleted.
There is not a community of teachers across the family of schools, although TSTB does promote innovation in education. There is however a developing community of teachers across the Masterton primary school cluster. Pupil voice was utilised extensively in the FFT&L trials and informed decisions.
Target
Present Situation
To continue to investigate and implement a structure and programmes that address
future-focused teaching and learning to raise the level of engagement of the learners,
more effectively meet individual needs, and promote greater teacher collaboration.
The school has embarked on a journey of transformation from the traditional education model to one with a future-focus to ensure that the needs of the children
are being met.
Action
continue to enthuse and educate the staff, pupils and school community regarding
the need to, and benefits of , implementing a future-focused learning and teaching environment;
complete a scoping, feasibility study to determine the potential physical changes
required to the current physical environment;
to provide a robust, wireless digital environment for all learners to access with BYO
electronic devices;
provide on-going, professional learning opportunities for all teachers, support staff
and the school community to ensure there is a shared vision for the future;
continue to strengthen the professional relationship established with Amesbury and
Stonefields Schools, and educational leaders in this field;
maintain an objective, investigative focus to learn from the trials and initiatives of
these schools, and to trial flexible learning programmes, cross-year group and cross-curricular models of teaching & learning to determine the most effective model for the school;
critically evaluate the current level of engagement of the learners in the classroom
and implement strategies to maximise the level of engagement for all learners;
provide opportunities for greater ownership of learning by the learners through on-
line and independent learning opportunities;
ensure that the prize-list and awards recognise and acknowledge engagement and
future-focused learning achievements;
promote and nurture a community of teachers and learners across the family of
schools to ensure there is a seamless transition between the schools;
ensure that pupil voice informs all decisions in the school.
Resources
Professional Learning, Feasibility Study for Property Changes, TSTB Information
Systems Strategic Plan Budget:
39
Goal 3: To ensure all pupils are provided with a variety of opportunities to enable them to become self-managing learners.
Focus
Future Focused Learning/Pupil Voice Completed by / Comments The principal completed on-going research on FFT&L as his leadership inquiry as part of the principals’’ learning group programme. The staff were also involved in reading and discussing relevant research texts and articles during the year.
The current structure of the school had been identified as creating two separate ‘schools’ with priority allegiance by staff to ‘their’ school rather than the school overall. This was a result of senior leadership practices which stressed compliance rather than initiative. With the implementation of FFT&L with two-year group-integration, and the development of a collaborative teaching model, the concept of hub leadership was realised. This model provides a two-year ‘base’ with greater stability for the children. This will be fully implemented in 2014. The leadership model was researched and contemporary structures were evaluated.
The key roles will transform to curriculum leader, assessment leader, and organisational leader as over-arching management positions, and the introduction of hub team-leaders will distribute the leadership and create a ‘one school’ community. Pupil Voice was implemented at the Y5-Y8 levels during the evaluation of the different flexible learning initiatives, and the feed-back was collated to provide valuable information that informed decisions regarding further implementation. The school was surveyed on interpersonal relationships and personal well-being. The
responses were analysed and provided the impetus for the implementation of the health programme and a school-wide instructional programme. A ‘post-box’ was provided for pupils to feed-back areas of concern, and these were discussed at assemblies. The out-of-school learning was enhanced with class learning excursions to Te Papa and Te Manawa, the EOTC physical pursuits programme and through the passion-time activities as part of the FFT&L programme.
The Wellbeing at School survey provided a snap-shot of the level of mutual respect and support amongst the staff and children. This became a focus for development during the year, and incidents of bullying (staff/staff, pupil/pupil) were reduced. The development of collaborative teaching hubs and a ‘one-school’ focus will further enhance this aspect of school life.
Targets
Present Situation
To promote learner-initiated, independent, personalised learning
with flexible, cross-year-grouping opportunities.
The current teaching and learning programme tends to be
structured with the overview of teaching and learning programmes determined without pupil voice.
Action
1. On-going research, reading and discussion
2. Develop structures for a school-wide learning
community:
- change the school structure
- investigate and implement changes to the
senior management structures
- provide professional learning opportunities that
will encourage and strengthen collaboration
and peer support school-wide
3. Pupil voice:
- to develop opportunities for authentic pupil
voice… in classroom
- to investigate and implement opportunities for
pupil voice… outside the classroom
- formulate the most appropriate conduits to
receive voice in the classroom and outside etc
4. To provide opportunities for out of school
learning making positive… etc
5. To create a robust culture of mutual respect
and support amongst all the children and staff Resources Budget:
40
Goal 4: To develop, implement and review a school-wide strategic programme for sports development.
Focus
Consolidate a school-wide approach to sport. Completed by / Comments
There has been confusion regarding the board’s sport policy and the
board’s sport strategy, a document that is now in its tenth version,
having increased in size from four to six pages. The sport strategy,
although aspirational, is incredibly prescriptive and deals with the
minutiae of detail and does not allow flexibility of process in different
situations determined by numbers. This confusion over policy and
strategy has led to a further review of the strategy to ensure it addresses the needs of the school. This was one of a number of
strategic initiatives included in the sport administrator’s job
description.
The swimming survey provided valuable information and feed-back
from the children and parents. The board has established a minimum
standard for all swimmers, and those who can achieve this standard
will not be expected to participate in the swimming instructional
programme. This will better meet the needs of the children.
The parents have not been formally survey at the end of each sport
season but anecdotal, incidental, and conflict-response feed-back has
been received and informed decisions regarding sport policy. There
has been open dialogue with parents to ensure issues are addressed.
The year-plan has been developed which highlights seasonal activities
and requirements, but is not rigidly prescriptive. The focus has been on
accommodating as many children as possible in as many sport
opportunities as possible. The sports programme has also been
incorporated in FFT&L. This year there have been a greater variety of
sports promoted and offered than in previous years.
The feasibility of a cloud-based calendar to inform parents was
investigated, but each of the schools maintains its own calendar on
individual web-sites. There was not a willingness for the schools’ calendar of events to be coordinated.
Target
Present Situation
To have a fully operational, school-wide, strategic programme in place
for sport development.
The sport programme and level of participation has improved but there
still remains need for continuing progress.
Action
the sports administrator’s job description to include strategic
level initiatives and developments;
conform and ratify the final draft of the sports policy;
implement the recommendations from the swimming survey;
survey parents regularly with specific issues concerned with
the sport programme;
encourage open dialogue with the community;
develop a year-plan incorporating all sport opportunities and
commitments;
investigate the feasibility of a Trinity-wide, cloud-based calendar to inform parents of events and to avoid potential
clashes.
Resources
Budget:
41
Goal 5: To ensure all staff maintain a high quality of teaching practice and build sound parent/teacher relationships.
Focus
Future-focused teaching & learning in a digital environment Completed by / Comments The implementation of FFT&L has, as a consequence, lifted the level of professionalism and pedagogical practice of many staff members. Others who were already effective practitioners have also refined their skills and level of instructional practice. This has been evident from the regular observations & visits by the principal, and the self and
peer appraisal of teachers during term 1 & term 3. The implementation of an on-line reflective journal has also enhanced the professional growth of teacher and improved levels of collaboration. In the established hubs, planning and achievement monitoring is completed collaboratively. The flexible learning programme has allowed pupils to feed-back their learning needs more effectively so that their learning can be personalised. Currently 67% of teaching staff would be FFT&L advocates of FFT&L – the remaining staff members have yet to fully implement the programme, and this will be a priority for 2014. The redevelopment of the buildings will also provide a much more open and integrated teaching and learning space, and will promote much easier and freer access
for parents. Teachers and parents are now communicating more regularly and effectively as a result of the FFT&L. Teachers have advised parents of changes and parents have then responded with questions to ensure they are fully conversant with the process and outcomes. The report-writing and reporting of progress has evolved during the last year. The reports address the requirements of the national standards and are highly detailed. The three-way learning conferences have provided a forum for in-depth discussion regarding progress and levels of achievement.
The Appraisal Connector tool has proved to be a robust and effective appraisal method. Utilising peer-appraisal and senior staff appraisal, along with self-appraisal has meant that teachers receive an accurate, honest picture of their practice. This has identified areas of development which have been developed as appraisal goals linked to the strategic plan. Staff have also been able to determine their professional learning requirements. I am not convinced that target groups are always closely monitored because the national standards identification can be superseded by in-class achievement analysis. There does
not seem to be documentation of the monitoring of these specific groups, and the review is often non-specific. Accelerating progress of learners who have long-term difficulties is not always achievable because they have reached their intellectual potential. Identifying problems early on and implementing specific programmes of instruction remains a priority.
Target
Present
Situation
To have a wireless, digital, pedagogical, and physical environment that
facilitates teaching and learning anywhere, at any time, at an individual’s
personalised pace.
There is a variance of pedagogical practice and physical constraints
across the school that inhibits future-focused learning development.
Action
develop a culture of openness between the teacher and learner about
the children’s learning & achievement through reciprocal feed-back and feed-forward, documented through the teachers’ self-reflection of practice;
continue the implementation of future-focused teaching and learning to ensure all staff are capable practitioners promoting personalised
learning for all learners;
create an open environment where parents feel welcome in all parts of the school at any time – open door policy;
encourage teachers and parents to communicate regularly and effectively with one another to report on pupils’ progress and learning
initiatives;
teachers are reflective practitioners focusing on teaching as inquiry as part of their appraisal process;
a staff appraisal programme targeted towards future-focused teaching and learning through self-reflection against the strategic goals and
NZTC teacher criteria;
fully implement the Appraisal Connector programme school-wide with self and peer review twice-annually;
seek feed-back from staff regarding their particular learning needs to ensure they are confident to trial initiatives to promote greater learner-engagement and future-focused learning
to ensure established target-groups are closely monitored and that individual needs are addressed with specific interventions and
strategies to accelerate progress;
early identification of learning needs with on-going learning support.
Resources
Professional learning
InterLead Appraisal Programme Budget:
42
SELF REVIEW ANNUAL PLAN 2013 TASK PERSONNEL TIME YES/NO
NAG 1 CURRICULUM REQUIREMENTS To set appropriate goals and targets in reading,
writing and mathematics to ensure that there is
accelerated progress for those who are not reaching
the standard.
Principal and senior
staff
Term 1 The collation of the National Standards and school-wide assessment
data identified areas of potential development that needed to be
addressed through explicit targeting of groups of pupils not reaching the
standard. The progress of individuals and groups were monitored
during the year and the teachers used their on-line reflective journal to
update any developments. The analysis of variance report at the end of
the year reported on the group’s progress.
To set goals and targets to ensure that all learners are
encouraged and challenged to reach their potential in
reading, writing and mathematics.
Principal & Staff Term 1 Goals and targets were confirmed in reading, writing, and mathematics.
Writing was identified as an area for further focus, especially for the
boys who were over-represented at below the standard. In mathematics
the focus was on lifting the level of girls’ achievement. In reading the goal was to lift the number achieving above the standard.
To evaluate the current the current school-day and
structure, and implement changes to maximise
opportunities for flexibility of teaching and learning
through a future-focused lens.
Staff Term 4 The staff reviewed the current structure to the school day as part as the
implementation of the future-focused teaching and learning model,
coupled with a more independent, child-centred, flexible learning
programme, based on two-year cross-grouping. This was consolidated
at the Y7&8 level and introduced at the Y5&6 level, and Y0&Y1. The Y2-Y4 implemented a cross-grouping programme for reading and for
mathematics.
Strategic Goal 2
To progress the implementation of a future-focused
teaching and learning environment which maximises
the engagement of the teachers and learners.
Board, principal &
senior staff
Term 4 The development of the future-focused teaching & learning environment
was progressed during the year. All teachers were able to visit
Amesbury School where they observed a FFT&L environment in action,
and were able to discuss the programme with the school’s staff. The
Y5-Y8 and Y0-Y1 areas developed flexible teaching and learning and
collaborative teaching practices. The Y2-Y4 classes initiated some
flexibility and cross-grouping, and this will be refined further in 2014.
NAG 2 SELF REVIEW
To review the strategic plan and set strategic goals to
address the strategic direction of the school.
Board of Trustees Term 1 The board met prior to the commencement of the 2013 school year and
reviewed the strategic plan, and set strategic goals that addressed special
character, sport, and teaching and learning.
To review the responses from the community
regarding the provision of sport at the school and implement agreed to recommendations
Sports Administrator Term 1 The sport administrator has addressed the concerns raised in the feed-
back from parents and has implemented the recommendations from the report wherever it was feasible with numbers to do so.
To review and respond to the community’s responses
regarding the delivery of a swimming programme at
the school, and implement recommendations
Sports Administrator Term 1 The board established a policy for swimming instruction as a result of
the responses from the community consultation. The board set a
minimum standard of ability which determined whether a child needed
43
to participate in the swimming instructional programme. Those pupils
who already exceeded the target length were not required to participate
in the programme. This was not communicated effectively and there
was some resistance from staff initially because of perceived logistical
issues.
To review the management structure of the school to
ensure personnel are fulfilling appropriate roles, and
that the model fits within a future-focused teaching
and learning direction
Principal, senior staff,
board of trustees
Term 3 The traditional management/leadership structure, based on the
hierarchical model was identified as creating a ‘two-school’ model,
rather than a unified, single, collaborative body The leadership
structure was seen as creating ‘fiefdoms’ and inhibited progress in the
implementation of a FFT&L model. After investigation it was
determined that the leadership model would be distributed and hub-leader positions would be created for 2014.
To review all school policies. Legislative Committee Terms 1 - 4 All school policies were reviewed by the board, but the board resolved
to review the requirement for some of the policies and to group the
manadatory policies under headings. Others would be redeveloped as
procedures.
Strategic Goal 3
To investigate and implement opportunities to
maximise pupil voice in decisions made at the school.
Principal & staff Term 4 The opportunities for pupil voice were maximised in the implementation
of the FFT&L programme. The pupils had the opportunity to reflect on
their week and feed-back to the teachers. The responses from the
children informed decisions made by the teachers. An opportunity to
include pupil voice in teacher appraisal is also being investigated.
Strategic Goal 4
To consolidate a school-wide approach to sport,
which meets the needs of the children and the school
community.
Sports Administrator Term 3 The school has a school-wide approach to sport, established and
developed by the sports administrator. Where numbers permit, all major
codes are addressed and a significant number of minor codes. The focus
this year has been on exposing a wide-range of sporting pursuits so that
children are aware of what is available and can then ‘have a go’. Specialist coaching is also now available during the school day.
NAG 3 PERSONNEL
To review all job descriptions to ensure specific tasks
are detailed and outcomes are clear.
Principal Term 1 The position descriptions were reviewed at the start of the school year
and then discussed with each staff member (teaching & non-teaching).
Changes to areas of responsibility and/or tasks were negotiated.
To fully implement the Appraisal Connector
programme with all staff and the reflective journal
with classroom teachers
Principal, Staff Term 4 The on-line appraisal programme was administered twice during the
year – at the end of T1 and T3. Teachers were required to self-appraise
and their assessment was compared with the principal’s and syndicate
leaders. The on-line reflective journal was also implemented in trial
form and teachers reflected on their personal appraisal goals.
To maintain the daily classroom visits and
observations, providing feed-back to the teachers and
children.
Principal, senior staff All year The principal completed regular classroom visits to observed the cross-
year grouping instruction, the independent learning opportunities, and
the level of engagement of the learners. The walk-throughs provided
valuable insight into the success of the FFT&L programme and
provided much anecdotal information.
To provide professional learning opportunities for all Principal Term 4 Future-focused education was the principal focus for professional
44
staff in future-focused education.
learning development this year. The staff read and discussed the MOE
publication on future-oriented learning, articles and other written
resources were distributed and discussed, and all teaching staff had two
days’ PD at Amesbury School, while others also visited Stonefields and
Point England Schools. The principal attended the CEFPI conference in
Auckland and the WRPPA conference in Wellington, focusing on
FFT&L.
NAG 4 PROPERTY & FINANCE
Strategic Goal 5
To have a future-focused, digital learning
environment.
IT Lead Teachers Term 1 The Y5-Y8 teachers implemented and trialled a number of cross-
grouping and flexible learning options during Term 1, with feed-back
provided by the children. The decision was made to create a Y7&8 and
Y5&6 hub with cross-grouping occurring within each one. With the opening of the Y0 class the Y0&1 teachers opted to develop a
collaborative hub in the former library space. The TSTB approved a
policy of BOYD which allows for optimum digital learning to occur.
The Y5-Y8 classes are all digital learning environments.
To install electric hand-driers in the pupils’ toilet
areas.
Principal Term 1 Electric hand-driers were installed in all of the pupils’ toilet areas. This
has eliminated the need for paper hand-towels and has minimised the
potential of sinks being blocked, and taps being left on to over-flow.
To introduce future-focused furniture in the Y8
classroom.
Principal, senior staff Term 1 The Y8 classroom trialled different levels of furniture to determine the
range of furniture that would be required in a FFT&L environment.
One consequence of a modern learning environment is that there is no
longer a requirement for a seat and desk for every child so the furniture
was eventually shared with the Y7 class.
To provide a contingency sum for the
investigation/feasibility study into building
modifications to create a 21st century learning environment.
Board of Trustees Term 1 The board of trustees allocated a contingency sum which allowed the
school to engage the school architects in developing a concept plan as to
how the existing buildings could be modified to create modern learning environments. The school now has an updated property development
plan which will transform the school as a modern learning environment.
To redecorate the walls & ceilings of the junior
school block.
Principal Term 4 The board’s decision to create a FFT&L environment has superseded
the planned upgrade of the junior rooms. This has been amended to
demolishing the current locker-room/toilet spaces and creating a glazed
break-out space.
Upgrade the school’s wire-less network to ensure it is
robust enough to provide anytime, anywhere, any
pace learning potential.
IT Lead-Teachers Term 1 The school initiated an upgrade of the wireless network to ensure it was
robust enough for the school’s needs. This was achieved, although the
school was then advised that it would be Snupped, and now has had all
the infrastructure modernised to accommodate ultra-fast broad-band
connectivity.
Recarpet the school library.
Principal Term 2 This was deferred as the library was moved to the former Y1 classroom,
and the library space became the Y0/Y1 trial hub.
Replace the black-out curtains in the school hall. Principal Term 1 The hall black-out curtains were replaced.
Replace the lighting in Sedgley Hall. Principal Term 2 The lighting in Sedgley Hall was deemed to be satisfactory and met the
45
particular needs of the dance/drama and music programmes.
Install the playland. Board of Trustees,
Friends
Term 1 The installation of the playland has not progressed for a number of
reasons. The former board was uncertain as to the appropriateness of
the structure within the school grounds, and then once they had resolved
to install it nobody was able to find the plans. The Friends had
incorporated the playland into their grounds development but internal
conflict meant that it did not proceed during the year.
NAG 5 HEALTH & SAFETY
Install sun-shade blinds in the Literacy & RE rooms.
Principal Term 1 Sun-shade blinds were installed in the Literacy & RE rooms in the
prefab classrooms. The sun-shade blinds provide a much more effective
sun barrier than the existing drapes.
To initiate contracts with maintenance companies to
ensure the school is a safe environment.
Principal Term 2 Maintenance contracts exist for grounds, care-taking, electrical work,
plumbing, gutter-cleaning, windows and doors, glazing, and exterior
painting. Minor maintenance and repairs has also been confirmed on a case by case requirement.
To review the school’s emergency, safety, and
pandemic plans.
Principal Term 1 The school’s emergency evacuation plan and the pandemic plan have
been reviewed. As part of the review it was identified that Sedgley Hall
was not a part of the school’s fire-alarm system, so a separate
evacuation plan had to be put in place.
To investigate the threat of emergency situations such
as ‘lock-downs’ and determine the need for specific
plans.
Principal, Board of
Trustees
Term 2 The threat of emergency situations requiring the school to go into lock-
down was not deemed likely. The exterior speakers (on the staff-room
building) were linked to a microphone in the principal’s office which
allows an emergency call to be made. This can then be reinforced with
a telephone call to each classroom.
To complete an evacuation drill each term, and
regularly complete earth-quake drills.
Principal Terms 1-4 A fire drill was completed each term. A separate drill may need to be
completed at Sedgley Hall as it operates on a different alarm.
NAG 6 LEGISLATION
To submit the updated school charter by the due date.
Board of Trustees 1 March The 2013 school charter was completed by the due-date and was
submitted to the Ministry of Education as required. The annual report
was not submitted by the due date because of complications created
with the centralisation of TSTB Accounts.
To submit the national standards report by the due
date.
Principal, Board of
Trustees
1 March The national standards data and report was submitted to the Ministry by
the due-date.
To ensure that the school is inclusive in its approach
to, and care of all children and personnel.
Principal, staff Term 4 The school accepts any child whose family is prepared to uphold the
special character of the school. There are no non-preference pupils
enrolled at the school. The schools does not discriminate any child, and
endeavours to support each learner with their needs.
SPECIAL CHARACTER
Strategic Goal 1
To clarify the special character of the school in such a
way that it can be explained to the school community,
The TSTB Special Character Committee spent much of its meetings in
2013 discussing what special character actually is. Although it is
enshrined in the integration agreements, the detail often includes aspects
46
and understood – what makes Hadlow, Hadlow.
of the school character that are not linked to the Anglican nature of the
school. The TSTB committee established that it is primarily to do with
the religious ethos and the association with the Church. The aspects that
make Hadlow different to other schools is not necessarily part of it.
To continue to integrate te reo Māori and tikanga
Māori into the school culture.
Staff Term 4 Te reo Māori continued to be integrated into the class and school
culture. It is firmly embedded in the RE, music and art programmes.
47
STRATEGIC PLAN 2014 - 2016 MISSION: To foster learning by educating for excellence through academic, physical, cultural, and spiritual challenges in a caring and safe environment.
VISION: A Hadlow pupil will be literate, self-managing, self-motivated, confident, respectful, and responsible.
STRATEGIC FOCUS Goal 1 To identify, preserve &
celebrate the values &
special character of the
school
Goal 2 To develop &
implement systems &
programmes to improve
pupil achievement, with emphasis on numeracy
& literacy.
Goal 3 To ensure all pupils are
provided with a variety
of opportunities to
enable them to become self-motivated & self-
managing learners.
Goal 4 To develop, implement
& review a school-wide
programme for sport
development.
Goal 5 To ensure all staff
maintain a high quality
of teaching practice and
build sound parent/teacher
relationships
2014
Review the RE, chapel programme, and
religious connections to
special character
through an inquiry into best practice in a FFTL
context
Inquire into best practice to inform our
reporting and interview
process and seek feed-
back re innovative programmes to improve
pupil engagement and
achievement.
Educating for the future to ensure learners are
self-managing & self-
motivated with a special
focus on implementing a dynamic and leading-
edge IT plan
To embed a diverse sport programme to
encourage maximum
participation by all
children.
Investigate and support collaborative
relationships to support
the learning
environment and improve the monitoring
and reporting of priority
learners
Community consultation to determine the future, strategic direction of the school
2014 – 2018: developing a future focused teaching and learning environment to prepare the children for the 21st century.
2015 Develop the school’s
special character so that
it fits within the future focus of the school
based on the outcomes
from the 2014 review.
Embed future-focused
teaching and learning
programmes across the school to facilitate
greater pupil
achievement and review and refine reporting and
interviewing processes.
A future-focused
teaching & learning
programme incorporating
flexibility, personalised
learning and opportunities for pupil
independence is the
expectation of all.
Review the school’s
sporting infrastructure
and identify resource requirements to
facilitate identified
changes.
Review collaborative
learning environments
and the monitoring and reporting process to
ensure the level of
engagement and achievement is reported
accurately.
2016 Embed the schools special character to
ensure it informs all
that happens at the school.
Future-focused teaching and learning is accepted
as the school’s
pedagogical practice.
Review and modify as informed by community
consultation.
Review and assess the sport strategy and
implement changes.
Create an open environment where
parents feel they are an
integral & significant part of the school.
48
Goal 1: To identify, preserve, and celebrate the values and special character of the school.
Focus
Relevant and engaging spiritual programmes Completed by / Comments
Target
Present Situation
Complete a review of religious programmes
(the RE and chapel programmes, and connections to the Church) through an inquiry into best practice and a set of
recommendations for implementation
The current religious programmes are disconnected from the
school curriculum programme and a future-focused teaching
Goal 2: To develop and implement systems and programmes to improve pupil engagement in a future-focused learning environment.
Focus
Best practice reporting and interview processes Completed by / Comments
Target
Present Situation
Develop a best practice reporting (to parents) and learning conference
framework that aligns to FFT&L, facilitates collaborative parent-teacher
partnerships, and leads to improved pupil engagement and achievement.
The present reporting framework is not easy for parents to translate into plain English and the learning conference needs to be reviewed for consistency to
meet the needs of parents and pupils to ensure alignment with FFT&L.
Action
collect feedback on the current reporting and learning
conference framework from key stakeholders (parents & staff)
using Survey Monkey (EOT1);
review and evaluation of the present reporting and learning
conference frameworks (EOT2);
investigate best practice delivery of reporting and learning
conferences, with special consideration given to the FFT&L
context (such as start of year meetings with parents (EOT3);
consultation with/visits to NZ schools of special character to
scope the current practice of reporting and learning conferences
(EOT3);
present findings and recommendations for implementing a best
practice reporting and learning conference framework for 2015
(EOT4).
Resources
PD Funding, Survey Monkey Budget:
50
Goal 3: To ensure all pupils are provided with a variety of opportunities to enable them to become self-managing learners.
Focus
State-of-the-art technology supporting best practice blended
learning pedagogy
Completed by / Comments
Target
Present Situation
Develop a dynamic and leading-edge IT plan to support our goal
of self-managing, self-motivated & confident pupils, and to
improve pupil engagement and achievement.
Blended learning is not fully integrated across the school, IT planning is not visionary and IT resources are not leading-edge.
Action
assemble a team of passionate & interested teachers
and investigate best practice blended learning
technology and practices (EOT3);
visit schools that demonstrate best practice blended
learning in New Zealand;
attend conferences, seminars and workshops with a
focus on blended learning and IT;
seek input and professional development from
experts and leaders of blended learning (such as
CORE Education);
identify relevant international research & practice;
develop a customised blended learning plan for
Hadlow to meet the individual needs and goals of
the school and TSTB (including vision, strategy,
expenditure plan (EOT3);
present the visionary IT plan & recommendations
(EOT4).
Resources PD Funding, TSTB IT Strategy, Core Education, U-Learn,
CEFPI Budget:
51
Goal 4: To develop, implement and review a school-wide programme for sports development.
Focus Refine and embed the school-wide sports programme that focuses on fun, variety and participation Completed by / Comments
Target
Present Situation
All children actively participating and enjoying sporting success.
A varied and participation-focused sports programme has been developing over the last four years. The policies and procedures that underpin this programme need to be aligned to FFTL and enacted throughout
the school.
Action critically review the school’s sports policy to ensure alignment with FFTL pedagogy
(EOT1) and the school’s curriculum policy, i.e., personalised, inclusive, engaging,
anywhere/anytime, assessment driven, collaborative, continuous learning for teachers
and students, partnerships (EOT1);
ratify the sport policy as the guiding document for sport development and sporting
opportunities at the school (EOT1);
work collaboratively to develop and disseminate a school sports procedure which
includes the roles and responsibilities of teachers and the Sports Co-ordinator in the
sports programme (EOT2);
review the existing fixtures, school-wide sports programmes (i.e., cross country,
athletics), and team/individual coaching and make recommendations to ensure a best
practice FFT&L sports programme (EOT3)
promote sporting and physical activities to children that aligns to the sports policy
and procedures;
investigate and trial new ways to recruit, train and retain high-quality sports coaches
and managers from our community (parents, secondary students, etc);
gather feedback and participation statistics from key stakeholders (pupils, staff
parents, coaches) regarding their satisfaction with the sports programmes (at the end
of the summer and winter season) (EOT1 and T3);
Report findings and make recommendations to the BOT twice a year (EOT1 and T3). Resources
Sport Administrator/Principal/Hub Leaders, Hadlow Active, Sport Wairarapa, Sport Wellington, Sports
Coordinators Cluster,
Sport NZ ;Good Practice Principles, Coaching Resources
Budget:
52
Goal 5: To ensure all staff maintain a high quality of teaching practice and build sound parent/teacher relationships.
Focus
Raising the achievement of priority learners Completed by / Comments
Target
Present
Situation
Accelerate the achievement of priority learners through improved
internal monitoring and reporting, and the development and implementation of Māori and Pasifika education plans.
Internal monitoring of priority learners is not regular and is
reported only at year-end. The school does not have a Māori or Pasifika education plan.
Action
identify priority learners from National Standards data
and start-of-year assessment and develop specific targets
and programmes to accelerate progress (EOT1);
establish regular hub-based reporting of priority learners’
progress via hub-leader meetings (EOT1);
report termly to the BOT on the progress of priority
learners;
consult the school community of Māori & Pasifika
parents to establish a whanau committee (EOT1);
develop a plan for Māori & Pasifika to address the
aspirations and priorities of the parents (EOT2);
research and implement the focus areas of Ka Hikitia and
the MOE Pasifika Education Plan (EOT2);
as a staff, review, develop and implement the practices
of Tātaiko as part of the education plans (EOT3);
Resources
MOE documents & plans: Tātaiko, Ka Hikitia, seminars & workshops,
professional development Budget:
53
SELF REVIEW ANNUAL PLAN 2014 TASK PERSONNEL TIME REVIEW
NAG 1 CURRICULUM REQUIREMENTS
Strategic Goal 2: Develop a best practice reporting to
parents and learning conference framework that aligns to