70
Fall 2011 Team: Wissam EL-Hachem , Naji EL-Hajj AL-Rabih Fall 2011 HALAWA Production Line Ergonomics
Fall 2011
Team: Wissam EL-Hachem , Naji EL-Hajj
AL-Rabih
Fall 2011
HALAWA Production Line Ergonomics

HALAWA Production Line Ergonomics
Department Of Industrial and Mechanical Engineering Page 2
Abstract The aim of the study is to observe and assess the HALAWA production at AL-Rabih Industry. Numerous
factors were observed and analyzed in order to be improved, in accordance to ergonomic standards as well as
acceptable productivity and efficiency. These factors can be labeled under main categories: Manual Design
(task evaluation and sustained repetitive postures of workers), Work Design (Design and repartition of all
workstations, line balancing, tools, etc.), Environmental Design (Noise, Ventilation, Temperature, Vibration,
etc.) and possibly Cognitive Design to introduce visual management to boost worker efficiency. The study
goals were associated with methods engineering. We observed the production line, spotted potential
bottlenecks, investigated the different steps by collecting data using statistical tools, then possible
improvements were discussed, hypothetically implemented and compared to previous statuses as well to each
other.

HALAWA Production Line Ergonomics
Department Of Industrial and Mechanical Engineering Page 3
Contents Abstract ............................................................................................................................................................... 2
Table of Figures and Tables ................................................................................................................................. 5
Introduction ......................................................................................................................................................... 7
I- Problem Definition ...................................................................................................................................... 8
A- Tahineh Production ................................................................................................................................. 8
B- Layout ...................................................................................................................................................... 9
C- Personnel and Task Description ............................................................................................................ 10
HALAWA weighing operator ...................................................................................................................... 10
Packing HALAWA operator ........................................................................................................................ 10
Separating can operator ............................................................................................................................ 10
Sealing Operator ........................................................................................................................................ 10
Put lid on Operator .................................................................................................................................... 10
Put sticker on Operator ............................................................................................................................. 10
Finished Box Operator ............................................................................................................................... 10
Syrup preparation Operator ...................................................................................................................... 10
Supervisor Operator .................................................................................................................................. 10
D- Pareto Chart .......................................................................................................................................... 12
E- Fish Diagram .......................................................................................................................................... 12
F- Pert Charts ............................................................................................................................................. 13
II- Data Collection .......................................................................................................................................... 14
A- Flow Diagram ......................................................................................................................................... 14
B- Productivity data ................................................................................................................................... 15
C- Gantt chart ............................................................................................................................................ 18
E- Surveys/ Checklists ................................................................................................................................ 19
F- Environment Measurements ................................................................................................................. 20
III- Analyze/Improve ................................................................................................................................... 21
A- Productivity Analysis.............................................................................................................................. 21
Observed ........................................................................................................................................... 21
Proposed Solutions ............................................................................................................................ 21
B- Environmental Analysis ......................................................................................................................... 24
1. Noise .................................................................................................................................................. 24
2. Illumination........................................................................................................................................ 25

HALAWA Production Line Ergonomics
Department Of Industrial and Mechanical Engineering Page 4
3. Heat ................................................................................................................................................... 26
4. Ventilation ......................................................................................................................................... 28
5. Vibration ............................................................................................................................................ 29
C- Task/Work Posture Analysis and Automation ....................................................................................... 30
1. Job Worksite Analysis Guide.............................................................................................................. 30
2. Two Hand Process Chart .................................................................................................................... 30
3. NIOSH ................................................................................................................................................ 33
4. CTD Risk Index ................................................................................................................................... 38
5. Line Cycle Time .................................................................................................................................. 41
D- Line Balancing ........................................................................................................................................ 42
1. Observed ........................................................................................................................................... 42
2. Improved ........................................................................................................................................... 43
E- Pollution from the Processes ................................................................................................................. 44
F- Layout .................................................................................................................................................... 45
G- Improvements on DELMIA .................................................................................................................... 45
H- Worker Productivity/Satisfaction Relationship ..................................................................................... 47
Method Implementation ................................................................................................................................... 48
Productivity Analysis ..................................................................................................................................... 48
Observed ................................................................................................................................................... 49
Proposed Solutions .................................................................................................................................... 49
Environment Analysis .................................................................................................................................... 50
1. Illumination........................................................................................................................................ 50
2. Heat ................................................................................................................................................... 50
3. Pollution from the Processes ............................................................................................................. 51
Manual Design ............................................................................................................................................... 51
Separate Cans and put Cover Paper On .................................................................................................... 51
Sugar Bags Lifting and Syrup Preparation ................................................................................................. 52
Weighing of HALAWA ................................................................................................................................ 52
Put Lid On .................................................................................................................................................. 52
Line Balancing ................................................................................................................................................ 52
1. Observed ........................................................................................................................................... 52
2. Improved ........................................................................................................................................... 52
Layout ............................................................................................................................................................ 52
HALAWA Production Line Ergonomics
Department Of Industrial and Mechanical Engineering Page 5
Overcoming Resistance to Change ................................................................................................................ 53
Conclusion ......................................................................................................................................................... 54
References ......................................................................................................................................................... 55
Appendix A: Surveys/Checklists......................................................................................................................... 56
Environment Survey ...................................................................................................................................... 57
Equipment Survey ......................................................................................................................................... 57
Operator Working Posture ............................................................................................................................ 57
General Posture and Task Evaluation checklist(Weighing of HALAWA) ....................................................... 58
General Evaluation and Task Evaluation Checklist (Sealing) ......................................................................... 59
Machine Evaluation Checklist ........................................................................................................................ 60
Therblig Analysis Checklist (HALAWA)........................................................................................................... 62
Wage Incentive Checklist............................................................................................................................... 64
Work Environment Checklist ......................................................................................................................... 65
Workstation Evaluation Checklist (Weighing of HALAWA) ........................................................................... 66
Appendix B: Input Analyzer ............................................................................................................................... 67
Adding Nuts ................................................................................................................................................... 68
Weighing ........................................................................................................................................................ 68
Place in Box .................................................................................................................................................... 69
Put Lid On ...................................................................................................................................................... 69
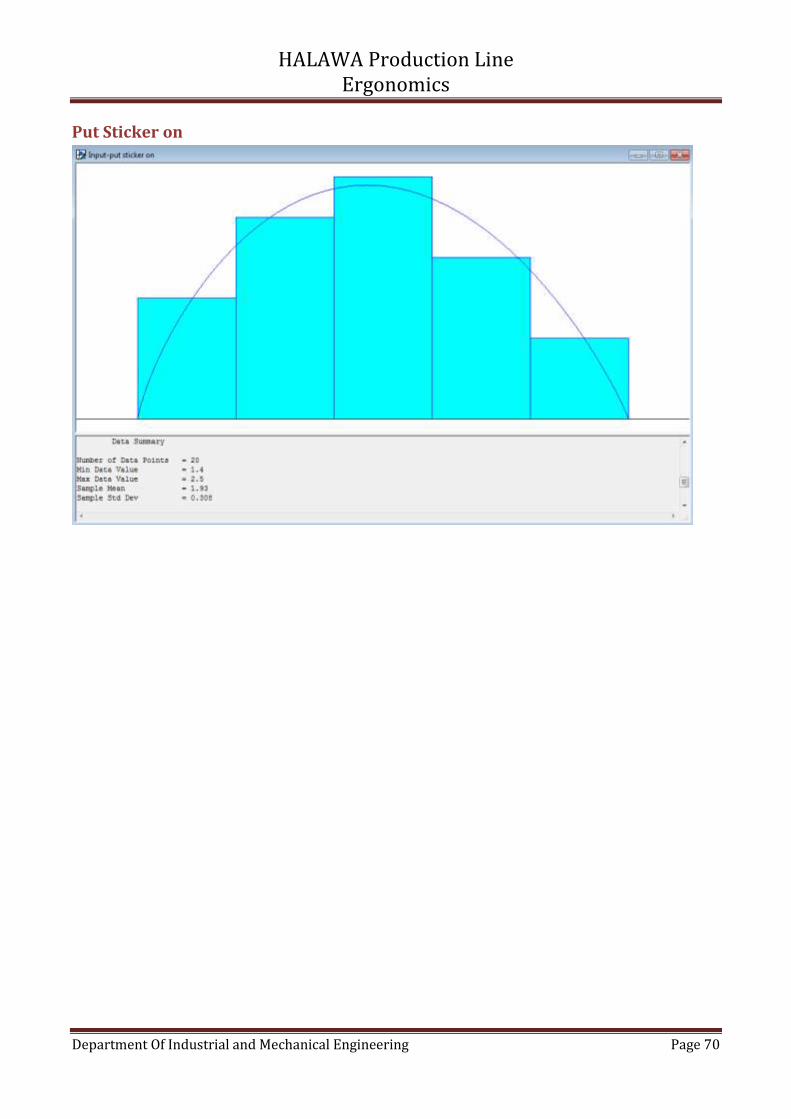
Put Sticker on................................................................................................................................................. 70
Table of Figures and Tables Figure 1: Tahineh Flow Chart ............................................................................................................................... 8
Figure 2: HALAWA Production Line Layout ......................................................................................................... 9
Figure 3: Gender Repartition ............................................................................................................................. 11
Figure 4: Workers in action ............................................................................................................................... 11
Figure 5: Factors Leading to Physical Pain ......................................................................................................... 12
Figure 6: Fish Diagram ....................................................................................................................................... 13
Figure 7: HALAWA material flow chart .............................................................................................................. 14
Figure 8: HALAWA Flow Diagram ...................................................................................................................... 15
Figure 9: Design Tools Syrup ............................................................................................................................. 17
Figure 10: Design Tools Mixer ........................................................................................................................... 18
Figure 11: Gantt Chart ....................................................................................................................................... 19
Figure 12: Mixer Solution .................................................................................................................................. 22
Figure 13: Syrup Oven Solution ......................................................................................................................... 23

HALAWA Production Line Ergonomics
Department Of Industrial and Mechanical Engineering Page 6
Figure 14: Noise Dose TWA ............................................................................................................................... 24
Figure 15: Total OSHA noise dose ..................................................................................................................... 24
Figure 16: Illumination ...................................................................................................................................... 25
Figure 17: Machining Lighting ........................................................................................................................... 25
Figure 18: Humidity and Comfort ...................................................................................................................... 26
Figure 19: Thermal Comfort Zone ..................................................................................................................... 27
Figure 20: Ceramic Fiber Blankets ..................................................................................................................... 27
Figure 21: Guideline for ventilation requirements ............................................................................................ 28
Figure 22: Acceptable Air Motion at the Worker .............................................................................................. 28
Figure 23: Fatigue-decreases proficiency .......................................................................................................... 29
Figure 24: Resonant Frequencies for Different Body Parts ............................................................................... 29
Figure 25: Job Worksite Analysis Guide (Weighing of HALAWA) ...................................................................... 30
Figure 26: Two hand Process Chart (Page 1) ..................................................................................................... 31
Figure 27: Two Hans Process Chart (Page 2) ..................................................................................................... 32
Figure 28: NIOSH (Packing of HALAWA) ............................................................................................................ 34
Figure 29: Lift/Lower Analysis Packing of HALAWA .......................................................................................... 34
Figure 30: NIOSH (Syrup Preparation) ............................................................................................................... 35
Figure 31: Lift/Lower Analysis of Syrup Preparation ......................................................................................... 35
Figure 32: RULA Analysis (Initial Posture for Syrup Preparation) ...................................................................... 36
Figure 33: RULA Analysis (Final Posture for Syrup Preparation) ....................................................................... 36
Figure 34: NIOSH (Weighing) ............................................................................................................................. 37
Figure 35: RULA Analysis Weighing ................................................................................................................... 38
Figure 36: CTD Risk Index (Sugar Lifting) ........................................................................................................... 39
Figure 37: CTD Risk Index (Weighing) ................................................................................................................ 40
Figure 38: Learning Curve for Put Lid On........................................................................................................... 41
Figure 39: Line Balancing input (Observed)....................................................................................................... 42
Figure 40: Line Balancing Results (Observed) ................................................................................................... 42
Figure 41: Line Balancing Input (Improved) ...................................................................................................... 43
Figure 42: Line Balancing Solution (Improved) .................................................................................................. 43
Figure 43: Inputs and Outputs of the production line ....................................................................................... 44
Figure 44: Activity Relationship Chart ............................................................................................................... 45
Figure 45: Improvement in Weighing, place in can and put cover paper on .................................................... 46
Figure 46: Improvement from another view ..................................................................................................... 46
Table 1: Operations cycle times…………………………………………………………………………………………………………………… 15
Table 2: Environment Measurements 1……………………………………………………………………………………………………….. 20
Table 3: Environment Measurements 2……………………………………………………………………………………………………….. 20
Table 4: Job Description………………………………………………………………………………………………………………………………. 48
Table 5: Observed Line………………………………………………………………………………………………………………………………… 49
Table 6: Mixer Solution………………………………………………………………………………………………………………………………… 49
Table 7: Syrup Oven Solution………………………………………………………………………………………………………………………. 50
Table 8: Both Solutions……………………………………………………………………………………………………………………………….. 50

HALAWA Production Line Ergonomics
Department Of Industrial and Mechanical Engineering Page 7
Introduction
Ergonomics is a relatively new science field, however old in concept. It has started almost a century
ago, with Frank and Lillian Gilbreth and Motion Study. Ergonomics is all about, putting the worker
wellbeing in forefront of every decision, while increasing productivity.
Recently, ergonomics has focused greatly on the food industry. Food industry is a major component
of the Lebanese industrial society. According to Lebanese International Business Forum, the food
and beverage industries contributed in almost 25% of the industrial output back 1999, and has since
expanded (World trade center Beirut, 2005). Hence, the industry selection was oriented to the food
and beverage industry in Lebanon.
Our study, took place at AL-RABIH factory. Established in 1975, it has grown from a small
homemade food company, to a 4 line of products manufacturing industry. Up to 118 different
products are offered, on an international level. A high quality driven company, AL-RABIH has met
international regulations and product testing procedures.
Its main focus is TAHINEH, making up 60% of the production area. However, since the TAHINEH
line is machine driven, we will focus instead on the HALAWA section, which is operator driven.
Major worker efficiency problems were instantly recognizable, as well as some room for
productivity methods enhancement.

HALAWA Production Line Ergonomics
Department Of Industrial and Mechanical Engineering Page 8
I- Problem Definition Following Methods Engineering steps, the selected project is to assess and improve the productivity
and worker conditions in the HALAWA production line at AL-Rabih industry in Gherfine, Lebanon.
But, first a brief overview of the Tahineh Production Processes.
A- Tahineh Production
AL RABIH’s Tahineh production is based on an annual forecast for the demand, divided by total
working days to get their required production rate per day. The work in the factory consists of one
8hr-shift, from 7:00 am till 3:00 pm. However, if someone is willing to commit, he/she can work up
to 16 hours a day as overtime.
Figure 1: Tahineh Flow Chart
The process goes as follows:
1. Throughout the working day, on average 75 of sesame bags are delivered manually to the
first process. The process is sieving and peeling of the sesame.
2. Using over-head conveyors, peeled and clean sesame, enters the second and main room of
treatment of sesame. In this room the following steps will occur respectively:
3. Washing the sesame using water and steam

HALAWA Production Line Ergonomics
Department Of Industrial and Mechanical Engineering Page 9
4. 3 levels of drying of the sesame: The process is like the washer’s. It uses centrifuge force to
dry the washed sesame.
5. Roasting of the sesame in 6 identical ovens having a temperature of over 110⁰c
6. Using air compressor, roasted sesame is pushed upward to the next level where it will be
crushed and made Tahineh.
A flow chart of the Tahineh Production is provided (figure 1).
B- Layout
The HALAWA line is located on the first floor of the plant. Its total area is approximately 42 . It is
one big room with several workstations and operators inside.
Here is the general layout of the room:
Figure 2: HALAWA Production Line Layout
HALAWA Production Line Ergonomics
Department Of Industrial and Mechanical Engineering Page 10
C- Personnel and Task Description
HALAWA weighing operator
One operator has the task to weigh a given quantity of HALAWA, by reaching into the Mixer
container and grabbing a hand full of the product, then weighing on an adjacent scale.
Packing HALAWA operator
One operator has the task of placing the HALAWA into a can, by reaching and grabbing the
HALAWA from the scale and emptying it into a can.
Separating can operator
One operator has the task to separate the cans of HALAWA, and then reaching and grabbing the
filled cans and place a protective cover paper on top of the HALAWA.
Sealing Operator
One operator has the task of reaching the filled cans and sealing them using a sealing machine,
then sliding the sealed cans to the next workstation.
Put lid on Operator
One operator (occasionally two), has the task of grabbing the sealed cans and tightly installing a lid,
then placing the closed cans in front of the next operator.
Put sticker on Operator
One operator has the task of reaching and grabbing the closed cans, then accurately installing
stickers in their right place.
Finished Box Operator
One operator has the task of collecting the finished HALAWA cans, placing 12 at a time into a box,
then sealing the box and stacking it on a nearby pallet for later transportation.
Syrup preparation Operator
One operator has the task of preparing the syrup batches, then mixing the syrup and Tahineh in the
mixer container. When idle, he assists the “put lid on” operator.
Supervisor Operator
One supervisor has the task of keeping an eye on the different operations, and assisting “syrup
preparation” operator with the loading and unloading of the syrup and Tahineh.

HALAWA Production Line Ergonomics
Department Of Industrial and Mechanical Engineering Page 11
Figure 3: Gender Repartition
Here is a general representation of the workers in action:
Figure 4: Workers in action
0
20
40
60
80
100
Female Male
Percentage
Percentage

HALAWA Production Line Ergonomics
Department Of Industrial and Mechanical Engineering Page 12
D- Pareto Chart
Figure 5: Factors Leading to Physical Pain
Several questionnaires were prepared to be filled during our visits to the factory (see appendix A).
However it was not possible to fill them mostly because of unwillingness of the workers to answer
our questions. Yet, some information were shared unintentionally by the workers, and after
observation, some conclusions could me made with regards to worker physical pain. (Figure 5).
E- Fish Diagram
The following fish diagram clearly identifies the main causes leading to a low efficiency production
line. The causes are split into 4 main categories: Ergonomics, Management, Equipment and Process.
0 5
10 15 20 25 30 35 40
Factors leading to physical pain
Factors leading to physical pain

HALAWA Production Line Ergonomics
Department Of Industrial and Mechanical Engineering Page 13
Figure 6: Fish Diagram
F- Pert Charts Since the personnel are stationary, there is only a material flow chart:

HALAWA Production Line Ergonomics
Department Of Industrial and Mechanical Engineering Page 14
Figure 7: HALAWA material flow chart
II- Data Collection Using the ergonomics lab equipment, a set of very useful data was collected with the intention of
pinpointing areas for improvement.
A- Flow Diagram
Material flow diagram of the HALAWA production line:

HALAWA Production Line Ergonomics
Department Of Industrial and Mechanical Engineering Page 15
Figure 8: HALAWA Flow Diagram
B- Productivity data
After careful observation and calculation (explained after the table), the following operations cycle
times were collected:
Table 1: Operations cycle times
Operations cycle times 1 can
12cans(1 box) Mean STD
Weighing 5.2 0.422 62sec
Adding nuts 5.87 0.612 64sec
Separating cans 5.79 0.585 60sec
Sealing 5.04 0.157 68sec
Put lid on 6.41 0.61 80sec
Put sticker on 1.93 0.308 67sec
Place in box 3.54 0.315 50sec
Syrup preparation N/A N/A 2 hours
Filling Mixer N/A N/A 1.5 min

HALAWA Production Line Ergonomics
Department Of Industrial and Mechanical Engineering Page 16
Mixing Tahineh and HALAWA N/A N/A 10 min
Emptying HALAWA Mixer/Packing
N/A N/A 51 min
For 1 Can:
A sample of 20 cycles were recorded, and plugged into Arena Input Analyzer and got the Sample
mean and Standard Deviation. However, recording for cycle times for 1 can is highly inaccurate
because all of the operations are in seconds, so a special interest was in cycle times for 1 Box or 12
Cans (refer to appendix B).
For 1 Box (12 Cans):
Given:
2 hours cooking for one batch of syrup, and one batch weighs approximately 120kg
1 hour shift in interval in the operating times of the two syrup preparation machines
Before regular hours, the ovens are warmed up and 1 batch is prepared
The HALAWA mix is composed of approximately 55% Tahineh and 45% Syrup
It takes 10min to mix Tahineh and Syrup in the mixer
Capacity of mixer is 160kg
Tahineh is collected through pipes from upstairs Tahineh production line
Tahineh is kept in 15Kg buckets, and Syrup is kept in 20Kg buckets. It takes on average 8s to
empty a bucket in mixer
Production demand are met and even exceeded
Cost of operating 1 syrup cooking oven per day is 65$
Cost of operating the mixer container per day is 20$
Cost of operating sealing machine per day is 30$
Operator wage is 19$/day
Syrup ovens have a 10 year cycle time( so no need to account for depreciation cost later on
in the calculation of cost/box)
So, by hand calculation accompanied with design tools, the following result:
1. Time to fill the mixer=(((0.55*160)/20)+((0.45*160)/15))*8= 80seconds= app. 1.5 min
2. Using design tools:
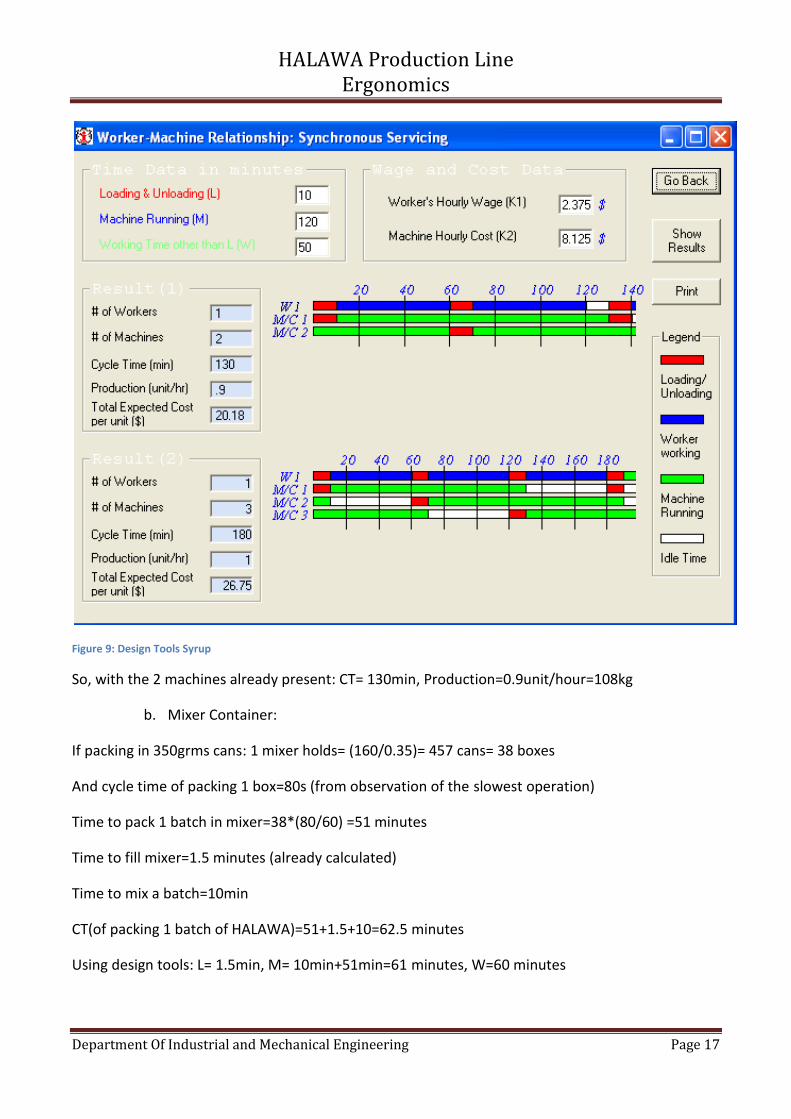
a. Syrup cooking machine:
L=10min, M=120min, W=50min
HALAWA Production Line Ergonomics
Department Of Industrial and Mechanical Engineering Page 17
Figure 9: Design Tools Syrup
So, with the 2 machines already present: CT= 130min, Production=0.9unit/hour=108kg
b. Mixer Container:
If packing in 350grms cans: 1 mixer holds= (160/0.35)= 457 cans= 38 boxes
And cycle time of packing 1 box=80s (from observation of the slowest operation)
Time to pack 1 batch in mixer=38*(80/60) =51 minutes
Time to fill mixer=1.5 minutes (already calculated)
Time to mix a batch=10min
CT(of packing 1 batch of HALAWA)=51+1.5+10=62.5 minutes
Using design tools: L= 1.5min, M= 10min+51min=61 minutes, W=60 minutes

HALAWA Production Line Ergonomics
Department Of Industrial and Mechanical Engineering Page 18
Figure 10: Design Tools Mixer
Results are consistent with hand calculation and logical.
CT= 62.5 minutes and Production=1 unit/hour=1 batch/hour
C- Gantt chart
Using the operations cycle times deduced earlier, a Gantt chart was developed in order to illustrate
the completion times of different activities with respect to one another. This Gantt chart illustrates
the activities cycle time in a 1 hour span, with the syrup preparation already started 1 hour earlier,
to be consistent with earlier data.

HALAWA Production Line Ergonomics
Department Of Industrial and Mechanical Engineering Page 19
Figure 11: Gantt Chart
The Gantt chart clearly identifies delay in the mixer container utilization, so there is need for a
change of methods.
E- Surveys/ Checklists
A set of surveys were prepared to be filled by the workers in order to gather as much information
as possible, however it was not possible because of worker lack of cooperation.(Refer to Appendix
A)
The surveys dealt with:
Environment: to rate environment conditions
Equipment: to rate equipment
Work Posture: to assess design of workstations and effect on workers postures
So, instead a series of checklists were filled to assess different parameters (refer to appendix A).
The checklists are:
General Posture and Task Evaluation
Machine Evaluation
Therblig Analysis

HALAWA Production Line Ergonomics
Department Of Industrial and Mechanical Engineering Page 20
Wage incentive
Work Environment
Workstation Evaluation
F- Environment Measurements
Using the ergonomic Lab Equipment, a collection of several environmental parameters were
gathered. Here is a table summarizing the findings:
Table 2: Environment Measurements 1
Location \ Factor CO LEVEL LIGHTING NOISE VIBRATION
Lux Fc dBA Displacement (P-P.mm) Acc. (m/s²) Velocity (cm/s)
Weighing 0 129 11.8 77 0.085 0.2 0.01
Separate cans 0 135 12 74 0.047 0.3 0.07
Sealing 0 180 16 80 0.141 0.7 0.5
Assembly 0 225 20 75 0.151 0.3 0.14
Syrup Ovens 0 220 19.5 74 0.375 0.9 0.45
Table 3: Environment Measurements 2
PSYCHROMETER VENTILATION
⁰C WB DEWPOINT (⁰C) %RH VELOCITY (m/s) FLOW (cmm)
Weighing 29 16.9 12.3 49.5
MAX of 0.95 MAX of 963.3 Separate Cans 28.5 17 12.5 49.5
Sealing 28 17.3 12.7 49.5
Assembly 27 17.34 12.8 49.5 MIN of 0.3 MIN of 786.4
Syrup Ovens 46 17.3 11.8 49.5
Heart Rate:
Because of production, we were only able to measure the heart rate for two operators.
1st operator: Separating Cans and Cover Paper
During work: 82 beats/min, after rest (approximately 2 minutes): 74 beats/min
2nd operator: Mixing HALAWA in Mixer
During work: 105 beats/min, after rest (approximately 2 minutes): 79 beats/min
So, the two have acceptable workloads. Since heart rate did not exceed 110beats/min, and after
2minutes of rest, it dropped back down to rest cycle rate.
HALAWA Production Line Ergonomics
Department Of Industrial and Mechanical Engineering Page 21
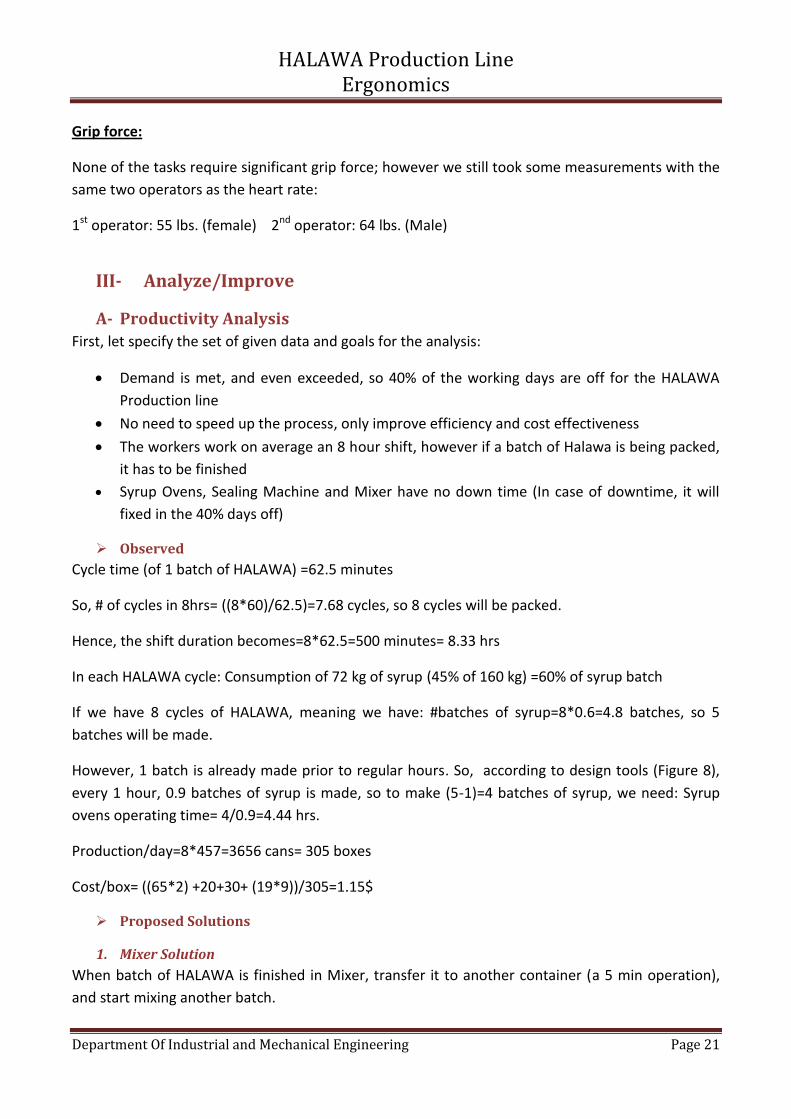
Grip force:
None of the tasks require significant grip force; however we still took some measurements with the
same two operators as the heart rate:
1st operator: 55 lbs. (female) 2nd operator: 64 lbs. (Male)
III- Analyze/Improve
A- Productivity Analysis
First, let specify the set of given data and goals for the analysis:
Demand is met, and even exceeded, so 40% of the working days are off for the HALAWA
Production line
No need to speed up the process, only improve efficiency and cost effectiveness
The workers work on average an 8 hour shift, however if a batch of Halawa is being packed,
it has to be finished
Syrup Ovens, Sealing Machine and Mixer have no down time (In case of downtime, it will
fixed in the 40% days off)
Observed
Cycle time (of 1 batch of HALAWA) =62.5 minutes
So, # of cycles in 8hrs= ((8*60)/62.5)=7.68 cycles, so 8 cycles will be packed.
Hence, the shift duration becomes=8*62.5=500 minutes= 8.33 hrs
In each HALAWA cycle: Consumption of 72 kg of syrup (45% of 160 kg) =60% of syrup batch
If we have 8 cycles of HALAWA, meaning we have: #batches of syrup=8*0.6=4.8 batches, so 5
batches will be made.
However, 1 batch is already made prior to regular hours. So, according to design tools (Figure 8),
every 1 hour, 0.9 batches of syrup is made, so to make (5-1)=4 batches of syrup, we need: Syrup
ovens operating time= 4/0.9=4.44 hrs.
Production/day=8*457=3656 cans= 305 boxes
Cost/box= ((65*2) +20+30+ (19*9))/305=1.15$
Proposed Solutions
1. Mixer Solution
When batch of HALAWA is finished in Mixer, transfer it to another container (a 5 min operation),
and start mixing another batch.
HALAWA Production Line Ergonomics
Department Of Industrial and Mechanical Engineering Page 22
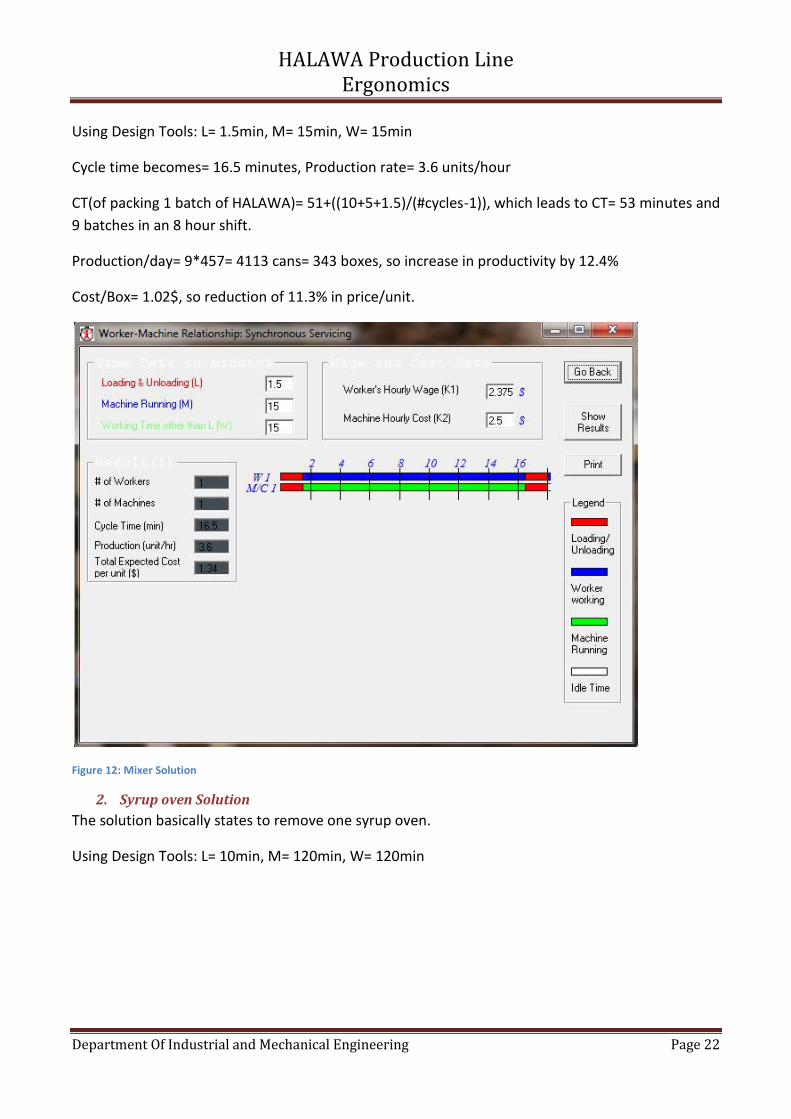
Using Design Tools: L= 1.5min, M= 15min, W= 15min
Cycle time becomes= 16.5 minutes, Production rate= 3.6 units/hour
CT(of packing 1 batch of HALAWA)= 51+((10+5+1.5)/(#cycles-1)), which leads to CT= 53 minutes and
9 batches in an 8 hour shift.
Production/day= 9*457= 4113 cans= 343 boxes, so increase in productivity by 12.4%
Cost/Box= 1.02$, so reduction of 11.3% in price/unit.
Figure 12: Mixer Solution
2. Syrup oven Solution
The solution basically states to remove one syrup oven.
Using Design Tools: L= 10min, M= 120min, W= 120min

HALAWA Production Line Ergonomics
Department Of Industrial and Mechanical Engineering Page 23
Figure 13: Syrup Oven Solution
CT= 130min, Production rate= 0.5units/hour
So,
=72/60=120%
In an 8 hour, we need an additional (8*(0.2*120*0.5)) =96Kg of syrup. We do indeed have an some
extra Kgs from the 1 batch prepared before production line kicks off.
So, Syrup Oven running hours=4/0.5=8 hours
Cost/Box= (65+20+30+ (19*9))/305=0.93$, a decrease of 19.13% in price/unit
3. Implementing Both Solution
So far, we have not utilized excess syrup from previous production days. In this case, the excess
syrup will be needed, and an assumption of 0.4 leftover batches will be made.
So:
9 cycles, each 60% of syrup batch, lead to 5.4 batches
1 batch from before, and 0.4 from excess, we still need 4 batches
Syrup oven running hours= 4/0.5= 8 hrs Production= 343 boxes Cost/Box= (60+20+30+19*9)/343= 0.819$, a reduction of 28.78% in unit/price

HALAWA Production Line Ergonomics
Department Of Industrial and Mechanical Engineering Page 24
B- Environmental Analysis
1. Noise
From the environment tables, the noise levels were plugged in design tools noise dose calculation:
Figure 14: Noise Dose TWA
The TWA is below 90 dB, so no threat from noise.
Figure 15: Total OSHA noise dose
It is below 100, so again no threat in noise dose levels.
HALAWA Production Line Ergonomics
Department Of Industrial and Mechanical Engineering Page 25
2. Illumination
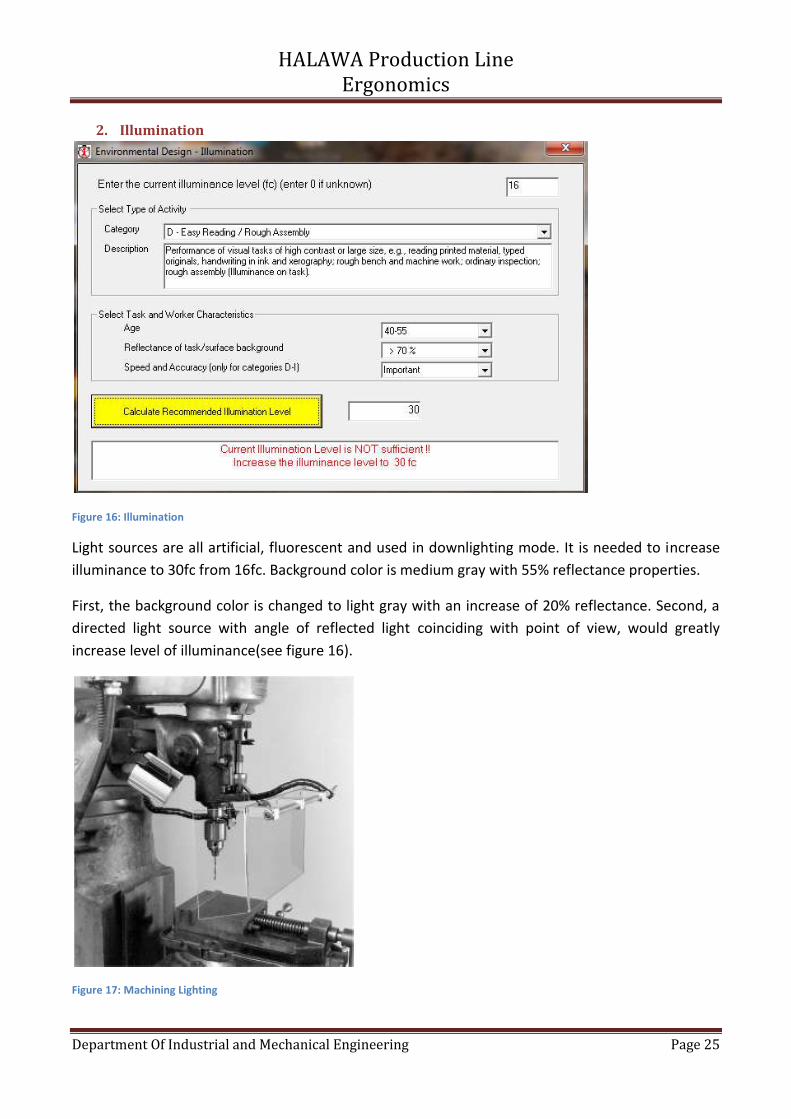
Figure 16: Illumination
Light sources are all artificial, fluorescent and used in downlighting mode. It is needed to increase
illuminance to 30fc from 16fc. Background color is medium gray with 55% reflectance properties.
First, the background color is changed to light gray with an increase of 20% reflectance. Second, a
directed light source with angle of reflected light coinciding with point of view, would greatly
increase level of illuminance(see figure 16).
Figure 17: Machining Lighting
HALAWA Production Line Ergonomics
Department Of Industrial and Mechanical Engineering Page 26
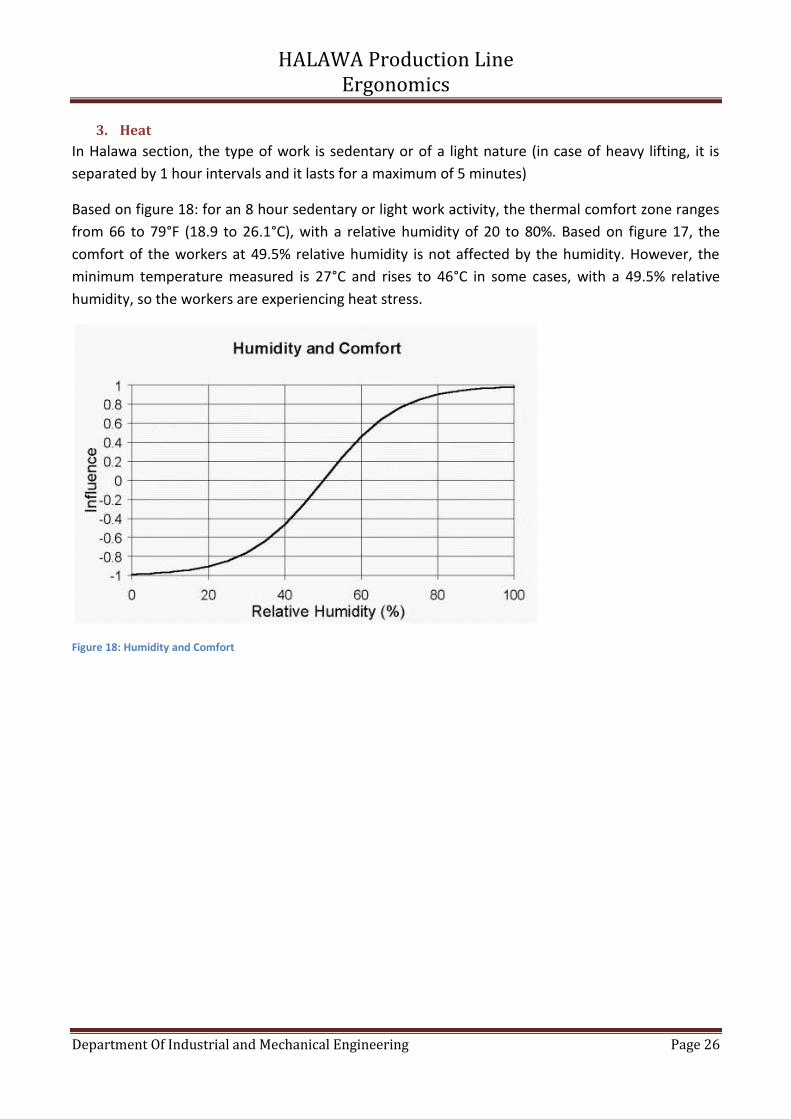
3. Heat
In Halawa section, the type of work is sedentary or of a light nature (in case of heavy lifting, it is
separated by 1 hour intervals and it lasts for a maximum of 5 minutes)
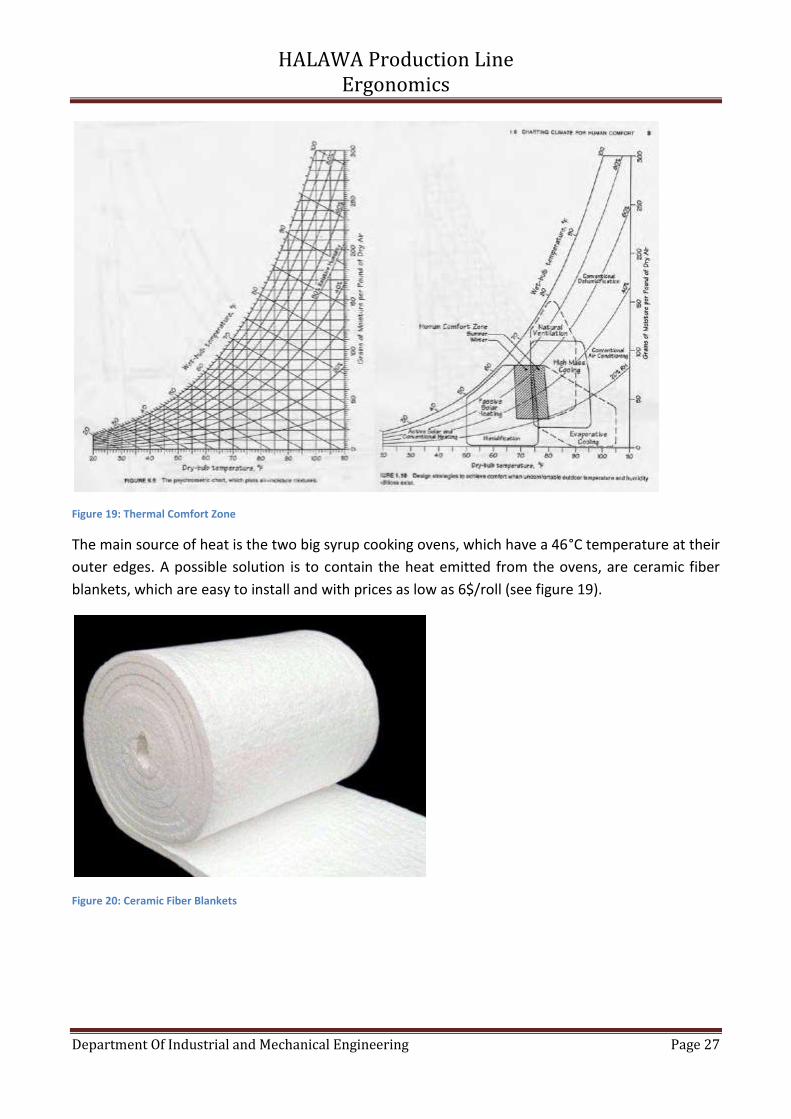
Based on figure 18: for an 8 hour sedentary or light work activity, the thermal comfort zone ranges
from 66 to 79°F (18.9 to 26.1°C), with a relative humidity of 20 to 80%. Based on figure 17, the
comfort of the workers at 49.5% relative humidity is not affected by the humidity. However, the
minimum temperature measured is 27°C and rises to 46°C in some cases, with a 49.5% relative
humidity, so the workers are experiencing heat stress.
Figure 18: Humidity and Comfort
HALAWA Production Line Ergonomics
Department Of Industrial and Mechanical Engineering Page 27
Figure 19: Thermal Comfort Zone
The main source of heat is the two big syrup cooking ovens, which have a 46°C temperature at their
outer edges. A possible solution is to contain the heat emitted from the ovens, are ceramic fiber
blankets, which are easy to install and with prices as low as 6$/roll (see figure 19).
Figure 20: Ceramic Fiber Blankets

HALAWA Production Line Ergonomics
Department Of Industrial and Mechanical Engineering Page 28
4. Ventilation
Using the anemometer, with a resolution of 0.001 to 1 CMM, the minimum air flow was 0.7864
/min=27.77 /min and the maximum (around the syrup cooking machines) was 963.3
/min=34.01 /min.
According to figure 20, intensity of odors is well below moderate even at the minimum air flow,
using the rule of thumb of 300 of fresh air per person.
Figure 21: Guideline for ventilation requirements
Now, with regards to air velocity:
Minimum recorded air velocity was 0.4m/s= 78.74ft/min and maximum velocity was of
0.95m/s=187ft/min.
According to the textbook, the best alternative in the Halawa section at AL-Rabih is a general
ventilation or spot cooling, which is the case. Using table 6.9 in the textbook:
Figure 22: Acceptable Air Motion at the Worker
We can conclude that the air velocity is well between the recommended guidelines.
HALAWA Production Line Ergonomics
Department Of Industrial and Mechanical Engineering Page 29
In the case of the maximum recorded velocity (near the heat generating syrup cooking ovens) of
187ft/min, it fits the guideline since the worker is most often standing near these ovens.
5. Vibration
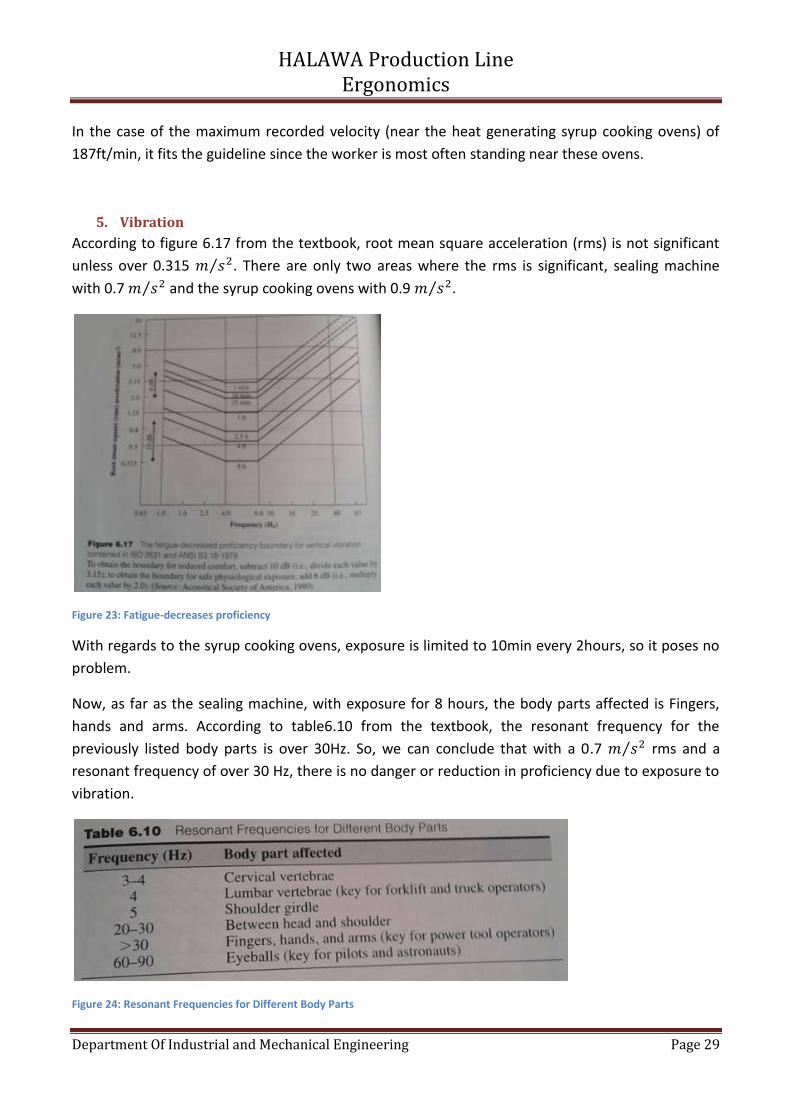
According to figure 6.17 from the textbook, root mean square acceleration (rms) is not significant
unless over 0.315 . There are only two areas where the rms is significant, sealing machine
with 0.7 and the syrup cooking ovens with 0.9 .
Figure 23: Fatigue-decreases proficiency
With regards to the syrup cooking ovens, exposure is limited to 10min every 2hours, so it poses no
problem.
Now, as far as the sealing machine, with exposure for 8 hours, the body parts affected is Fingers,
hands and arms. According to table6.10 from the textbook, the resonant frequency for the
previously listed body parts is over 30Hz. So, we can conclude that with a 0.7 rms and a
resonant frequency of over 30 Hz, there is no danger or reduction in proficiency due to exposure to
vibration.
Figure 24: Resonant Frequencies for Different Body Parts
HALAWA Production Line Ergonomics
Department Of Industrial and Mechanical Engineering Page 30
C- Task/Work Posture Analysis and Automation
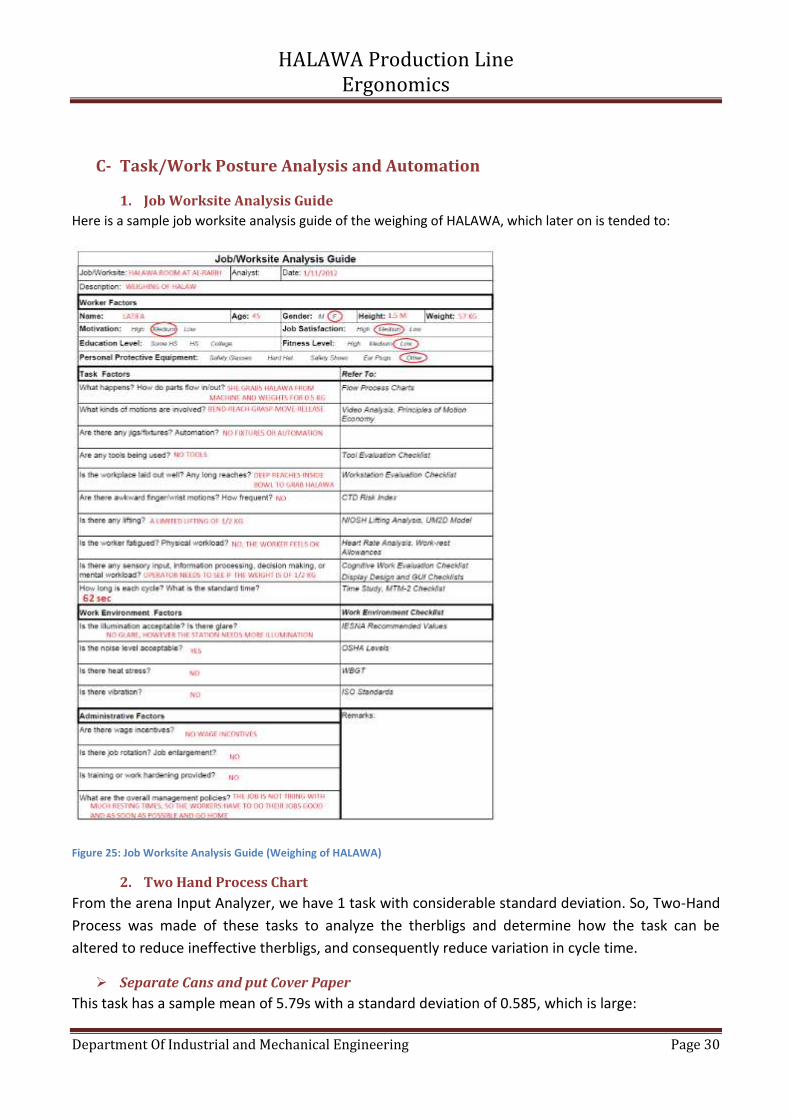
1. Job Worksite Analysis Guide
Here is a sample job worksite analysis guide of the weighing of HALAWA, which later on is tended to:
Figure 25: Job Worksite Analysis Guide (Weighing of HALAWA)
2. Two Hand Process Chart
From the arena Input Analyzer, we have 1 task with considerable standard deviation. So, Two-Hand
Process was made of these tasks to analyze the therbligs and determine how the task can be
altered to reduce ineffective therbligs, and consequently reduce variation in cycle time.
Separate Cans and put Cover Paper
This task has a sample mean of 5.79s with a standard deviation of 0.585, which is large:

HALAWA Production Line Ergonomics
Department Of Industrial and Mechanical Engineering Page 31
Figure 26: Two hand Process Chart (Page 1)

HALAWA Production Line Ergonomics
Department Of Industrial and Mechanical Engineering Page 32
Figure 27: Two Hans Process Chart (Page 2)

HALAWA Production Line Ergonomics
Department Of Industrial and Mechanical Engineering Page 33
So, with (12/55) =21.81% ineffective therbligs time, a change of manual design is a must. The main
reasons for this repetitive stretched occurrence of ineffective therbligs are:
Holding the cans with her right hand to separate them
Holding the cover paper and Pre-positioning the cans for Release of cover paper
A simple alteration in the task can have a great impact on worker efficiency and productivity.
Instead of Holding the cans to separate them, install a can retrieval device which holds
batches of cans, from which the worker can directly Reach and Grasp a can
Instead of Pre-positioning the cans, the work surface between the weighing operator and
the separating cans operator can be divided into conveniently shaped circles to position and
hold the cans (It can be a simple cast metal grid)
Same as the can retrieval device, another device for holding a large number of cover papers
can be installed to allow the worker to directly reach and grasp a cover paper to place on
top of HALAWA in the can. The device can have two parallel adjacent tubes which one holds
cans and the other cover papers, pushed down by gravity.
3. NIOSH
According to a study conducted by researchers in the university of Washington, NIOSH was found
to have a wider scope for interpreting the benefits on different parts of the lift by implementing
changes, compared to other lifting analysis tools such as ACGIH TLV, Snook, WA L&I and 3DSSPP, so
it is an excellent tool even though having more variables to input (Comparing the results of five
lifting analysis tools, 2007). Several Tasks seem to be risky in terms of NIOSH lifting guidelines.
EDGAR and Design Tools were used to analyze the different tasks.
Packing of HALAWA
The worker has to reach and pack 12 cans of HALAWA in a box, then place the box on a pallet at a
height nearly her own, with a frequency of 12/min.

HALAWA Production Line Ergonomics
Department Of Industrial and Mechanical Engineering Page 34
Figure 28: NIOSH (Packing of HALAWA)
It turned out to be perfectly safe with a 0.17 lifting index. A simple Lift/Lower analysis was performed using
CATIA, which yielded a similar result, with an 11.4 Kg as the action limit (AL):
Figure 29: Lift/Lower Analysis Packing of HALAWA
HALAWA Production Line Ergonomics
Department Of Industrial and Mechanical Engineering Page 35
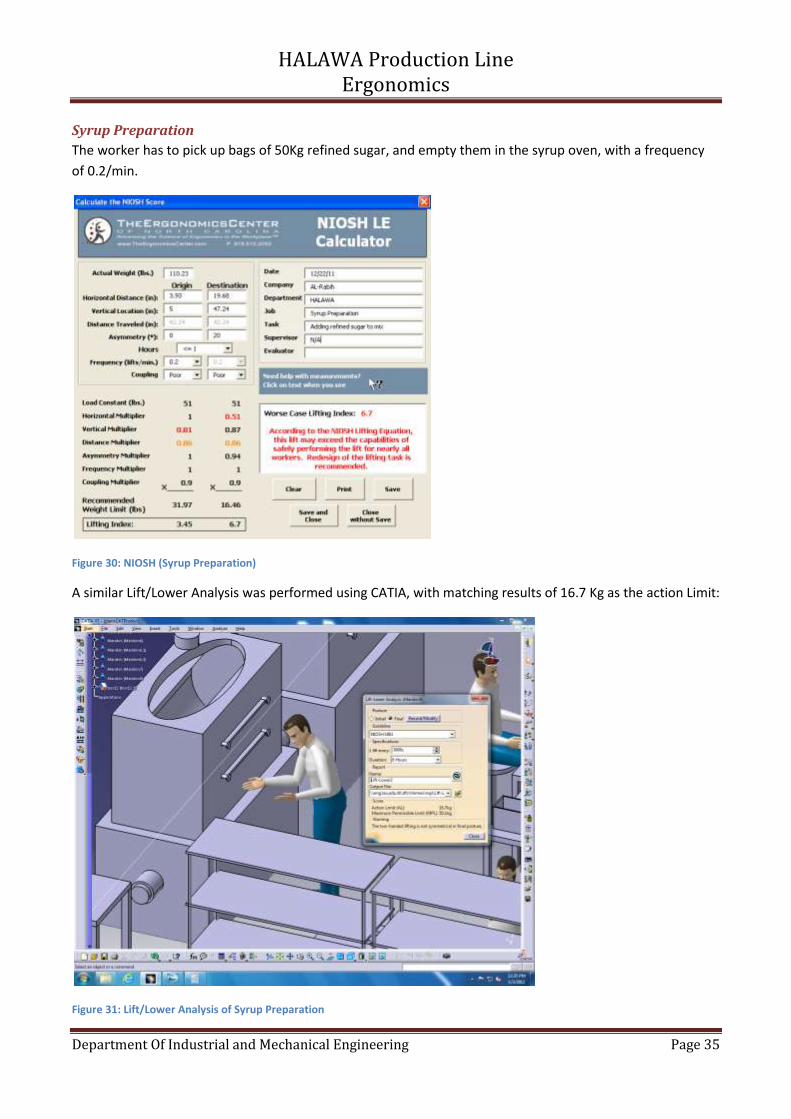
Syrup Preparation
The worker has to pick up bags of 50Kg refined sugar, and empty them in the syrup oven, with a frequency
of 0.2/min.
Figure 30: NIOSH (Syrup Preparation)
A similar Lift/Lower Analysis was performed using CATIA, with matching results of 16.7 Kg as the action Limit:
Figure 31: Lift/Lower Analysis of Syrup Preparation
HALAWA Production Line Ergonomics
Department Of Industrial and Mechanical Engineering Page 36
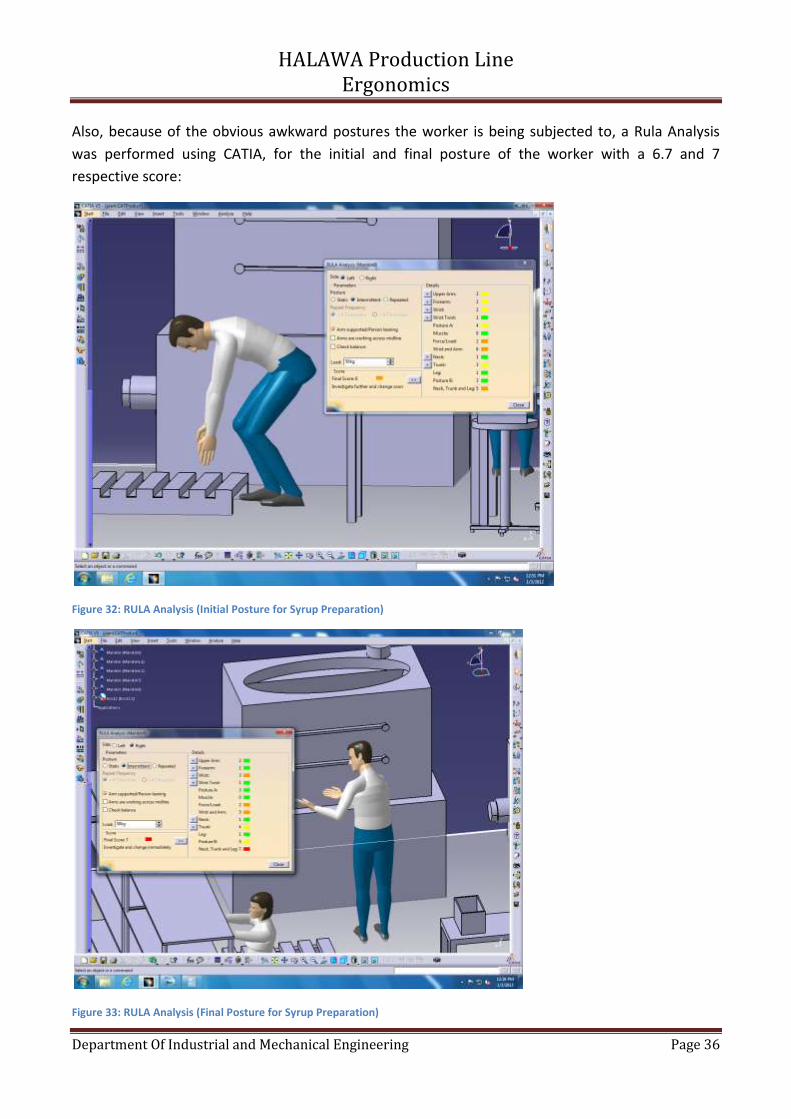
Also, because of the obvious awkward postures the worker is being subjected to, a Rula Analysis
was performed using CATIA, for the initial and final posture of the worker with a 6.7 and 7
respective score:
Figure 32: RULA Analysis (Initial Posture for Syrup Preparation)
Figure 33: RULA Analysis (Final Posture for Syrup Preparation)

HALAWA Production Line Ergonomics
Department Of Industrial and Mechanical Engineering Page 37
A gravity chute can be deployed to hold large amounts of sugar (enough for 1 day), with a well
defined and controllable output rate to substitute the worker sustained handling of the sugar bags.
However, this would mean a relatively expensive solution with modification to the ovens (insertion
of holes for the chute), yet well needed and sustainable one.
Weighing
An operator has to reach far and grasp a handful of HALAWA to place them on a nearby scale.
Figure 34: NIOSH (Weighing)
However, the posture of the worker is terrible, and need to be improved, so a RULA analysis was
performed using CATIA:

HALAWA Production Line Ergonomics
Department Of Industrial and Mechanical Engineering Page 38
Figure 35: RULA Analysis Weighing
The worker stands on a step in order to be able to reach the HALAWA in mixer. Since we cannot
lower the mixer, we can eliminate the step which is the main reason for the hunching, and insert a
small hole with an attached small tube (around 10 cm in length) on the side of the mixer with a
defined radius and an easy open/close mechanism. With the help of the mixing action, two rotating
hands, the Halawa can be forced into the tube and then collected directly onto a weighing scale.
4. CTD Risk Index
Several Tasks force the workers to suffer from awkward postures. So, CTD risk index has been
utilized to assess these tasks.
HALAWA Production Line Ergonomics
Department Of Industrial and Mechanical Engineering Page 39
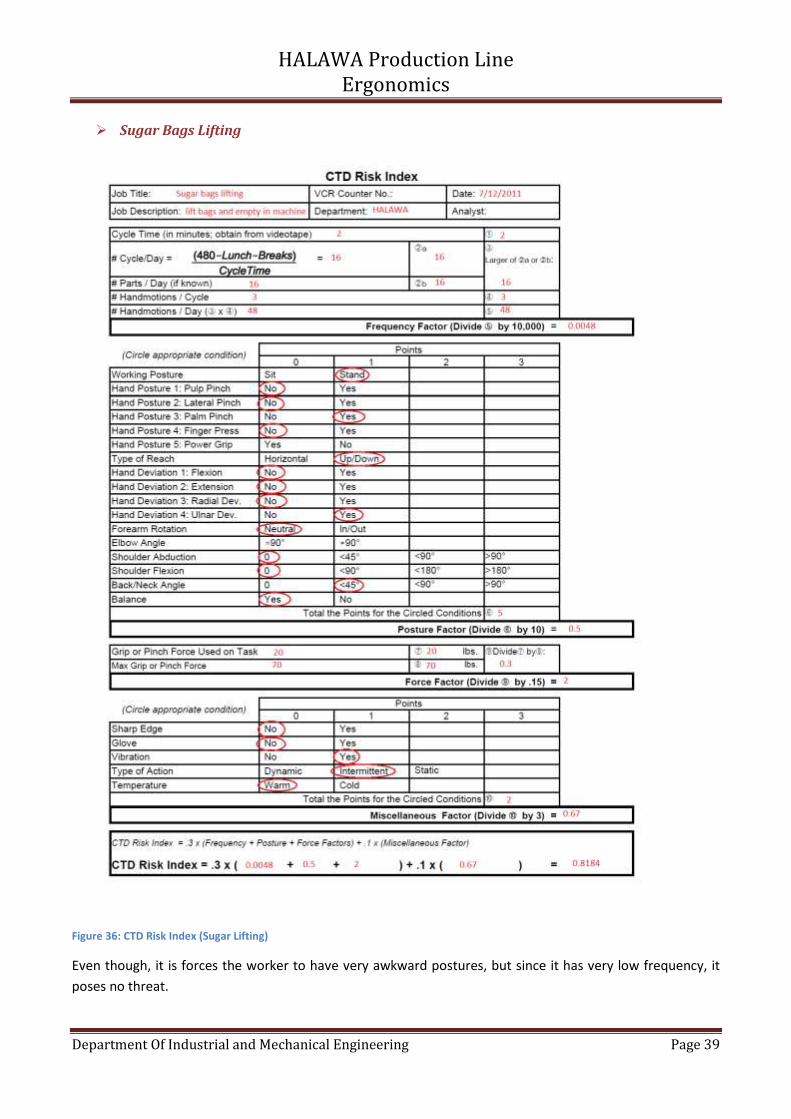
Sugar Bags Lifting
Figure 36: CTD Risk Index (Sugar Lifting)
Even though, it is forces the worker to have very awkward postures, but since it has very low frequency, it
poses no threat.

HALAWA Production Line Ergonomics
Department Of Industrial and Mechanical Engineering Page 40
Weighing of HALAWA
Figure 37: CTD Risk Index (Weighing)
It poses no problem, yet some modification into its execution need to be made, and were proposed
earlier in the previous section.

HALAWA Production Line Ergonomics
Department Of Industrial and Mechanical Engineering Page 41
5. Line Cycle Time
Put lid on cycle time is significantly larger than that of other tasks. It can be reduced by as much as 37% from
80 seconds to 50 seconds, by eliminating the ineffective therbligs of Hold and Positioning. This can be done
by the use of an automatic lid placement and tightening machine. So, the put lid on operator has to simply
slide the sealed can of HALAWA into its pre-designated place under the lid machine, and then slide it to the
next station, of put sticker on.
A learning curve of this new operation has the following data:
Original cycle time: 80 seconds
Learning ratio: 90%
Standard time: 50 seconds
Using Design Tools we get the following learning curve:
Figure 38: Learning Curve for Put Lid On
It takes the operator 18.207 hours, or 2.5 shifts to achieve the standard time, which is very good.

HALAWA Production Line Ergonomics
Department Of Industrial and Mechanical Engineering Page 42
D- Line Balancing
From the calculation earlier in the productivity analysis, there are some significant delays
throughout the production line, so a review of its different stations is in order. For that, line
balancing was done using Design Tools.
1. Observed
From the observed data, the following line balancing:
Figure 39: Line Balancing input (Observed)
Figure 40: Line Balancing Results (Observed)

HALAWA Production Line Ergonomics
Department Of Industrial and Mechanical Engineering Page 43
The observed line has an efficiency of: (62+30+64+40+68+67+80+50)/(8*80)=72%
2. Improved
If the desired cycle time is decreased by implementing the proposed the earlier proposed solutions
and by changing immediate predecessors:
Figure 41: Line Balancing Input (Improved)
Figure 42: Line Balancing Solution (Improved)

HALAWA Production Line Ergonomics
Department Of Industrial and Mechanical Engineering Page 44
The operator (Syrup preparation) is actually being needed on the last workstation, and efficiency
increase to 85%.
E- Pollution from the Processes
The Tahineh and HALAWA production has a lot of undesired outcomes as the plant manager, Mr.
Fadi Abi Nader, pointed out. Here is a chart of the different types of outputs (Confectionary
Industry, 2003):
Figure 43: Inputs and Outputs of the production line
Some of the outputs could be harnessed for later use, such as the heat from the roasting to
generate steam for the syrup preparation.

HALAWA Production Line Ergonomics
Department Of Industrial and Mechanical Engineering Page 45
F- Layout
The layout inside the room of the production line of HALAWA has no problems, with adequate
spacing and a single continuous line.
Figure 44: Activity Relationship Chart
However, since the Tahineh and HALAWA are closely related, the two productions lines should be
adjacent, and they are not. Perhaps, moving the HALAWA line to 2nd floor where the Tahineh
production, takes place, would facilitate the procurement of the Tahineh for the making of
HALAWA, as well as making it possible to harness the heat from the roasting into generating steam
for the syrup preparation ovens.
G- Improvements on DELMIA The earlier mentioned possible solutions were roughly sketched using DELMIA:

HALAWA Production Line Ergonomics
Department Of Industrial and Mechanical Engineering Page 46
Figure 45: Improvement in Weighing, place in can and put cover paper on
Figure 46: Improvement from another view

HALAWA Production Line Ergonomics
Department Of Industrial and Mechanical Engineering Page 47
As seen in the pictures above, the final layout for the proposed solutions is somehow altered form
the original layout.
The mixing machine was raised and put on a table and a pipe that can be open or shut
accordingly to the need was introduced to the lower of the mixing container.
One cups-holder was introduced to simply grab empty containers from bottom and slide till
the filling station
One papers-holder was introduced to reduce the non-efficient use of hands by the operator
A slider was introduced from the beginning till the end of the first 3 operations to limit reaching and
turning and to eliminate the inefficient use of space.
H- Worker Productivity/Satisfaction Relationship
A paper composed by researchers at the Sultan Qaboos University, defines the parameters that control the worker productivity/satisfaction relationship. Participative standards and performance feedback proved to be the main catalyst for enhancing the satisfaction and productivity of the worker, with a correlation coefficient of 0.87 and p<0.01. Wage incentives, although not having a negative impact, did not illustrate as much impact on the productivity/satisfaction relationship. Particularly, worker participation in setting their own standards proved to be quite beneficial for company strategies of boosting productivity and efficiency (The relationship between worker satisfaction and productivity in a repetitive industrial task, 2003). So, according to our observation, there is no worker participation in the decision making process, no performance feedback tools as well as no wage incentive plans. Perhaps, if a couple of alterations were implemented, a positive productivity/satisfaction relationship would assist in the company’s aspirations for growth:
Installation of automatic digital screens that show outputs from the production line and
desired target
Questionnaires prepared by the management to gain crucial worker feedback on the
different processes as well as on their demands and complaints, and actually considering
the results in the decisions made.
Preparation of wage incentive plans for the different departments and personnel, based on
quality as well as worker productivity and ethics.

HALAWA Production Line Ergonomics
Department Of Industrial and Mechanical Engineering Page 48
Method Implementation First, a brief job description table of the operators:
Table 4: Job Description
Title Task Description Cycle Time
HALAWA weighing operator
One operator has the task to weigh a given quantity of HALAWA, by reaching into the Mixer container and grabbing a hand full of the product, then weighing on an adjacent scale.
62sec
Packing HALAWA operator One operator has the task of placing the HALAWA into a can, by reaching and grabbing the HALAWA from the scale and emptying it into a can.
64sec
Separating can operator One operator has the task to separate the cans of HALAWA, and then reaching and grabbing the filled cans and place a protective cover paper on top of the HALAWA.
60sec
Sealing Operator One operator has the task of reaching the filled cans and sealing them using a sealing machine, then sliding the sealed cans to the next workstation.
68sec
Put lid on Operator One operator (occasionally two), has the task of grabbing the sealed cans and tightly installing a lid, then placing the closed cans in front of the next operator.
80sec
Put sticker on Operator One operator has the task of reaching and grabbing the closed cans, then accurately installing stickers in their right place.
67sec
Finished Box Operator One operator has the task of collecting the finished HALAWA cans, placing 12 at a time into a box, then sealing the box and stacking it on a nearby pallet for later transportation.
50sec
Syrup preparation Operator
One operator has the task of preparing the syrup batches, then mixing the syrup and Tahineh in the mixer container. When idle, he assists the “put lid on” operator.
2 hours
Supervisor Operator One supervisor has the task of keeping an eye on the different operations, and assisting “syrup preparation” operator with the loading and unloading of the syrup and Tahineh.
1.5 min
Productivity Analysis
From initial observation, there were some reservations about the methods used, which were
quickly backed up with the confirmation of the plant manager, Mr. Fadi Abi Nader that some
changes are in order.
Since, the focus was mainly on how to increase line efficiency, a Gantt chart was necessary to
compare the different activities. From the resulting chart (figure 11), there were obvious delays in

HALAWA Production Line Ergonomics
Department Of Industrial and Mechanical Engineering Page 49
the “Emptying HALAWA Mixer”, “Syrup Preparation” and “Mixing Tahineh and Syrup”. So, these
three areas were the focus of the productivity analysis.
With a set of data and goals already listed in Analyze/Improve section, a productivity analysis was
done with the following results:
Observed Table 5: Observed Line
Cycle Time(of 1 batch of HALAWA) 62.5 minutes
# of cycles in a shift 8 cycles
Shift Duration 8.33 hours
Consumption of syrup/HALAWA cycle 60% of 1 syrup batch
# Syrup Batches 5 Batches
Syrup ovens operating Time 4.44 hours
Production/day 305 boxes
Cost/box 1.15 $
Proposed Solutions
1. Mixer Solution
Since there is significant delay in the packing of 1 batch of HALAWA from mixer, a solution was
necessary. One possible solution could be to transfer a batch of HALAWA when finished from mixer
to another container (a 5 min operation), and start mixing another batch.
Table 6: Mixer Solution
Cycle time of mixing 1 batch of HALAWA 53 minutes
Production rate of HALAWA 3.6 batches/hour
CT( of packing 1 batch of HALAWA) 53 minutes
# of batches/Shift Shift duration
9 batches 8 hours
Production/day 343 boxes
Cost/Box 1.02 $
Productivity Increase of 12.4 %
Cost effectiveness Increase by 11.3%
2. Syrup oven Solution
The solution basically states to remove one syrup oven, since only 4.44 hours it is being utilized.

HALAWA Production Line Ergonomics
Department Of Industrial and Mechanical Engineering Page 50
Table 7: Syrup Oven Solution
CT (of 1 Syrup batch) 130 min
Production rate(of Syrup) 0.5 units/hour
Syrup Consumption/Syrup Production 120% (compensated by extra batch)
Syrup oven running hours 8 hours
Cost/Box 0.93 $
Cost Effectiveness Increase by 19.13%
3. Implementing Both Solution
So far, we have not utilized excess syrup from previous production days. In this case, the excess
syrup will be needed, and an assumption of 0.4 leftover batches will be made.
So:
Table 8: Both Solutions
# of batches of HALAWA 9 batches
# of batches of Syrup 5.4 batches (0.4 from leftover excess)
Syrup oven running hours 8 hours
Production/day 343 boxes
Cost/Box 0.819 $
Cost effectiveness Increase by 28.78 %
Environment Analysis
All of the measured environment conditions were in control except for slight room for
improvement in illumination and Heat.
1. Illumination
Light sources are all artificial, fluorescent and used in down lighting mode. It is needed to increase
illuminance to 30fc from 16fc. Background color is medium gray with 55% reflectance properties.
First, the background color is changed to light gray with an increase of 20% reflectance. Second, a
directed light source with angle of reflected light coinciding with point of view, would greatly
increase level of illuminance(see figure 17).
2. Heat
In Halawa section, the type of work is sedentary or of a light nature (in case of heavy lifting, it is
separated by 1 hour intervals and it lasts for a maximum of 5 minutes)

HALAWA Production Line Ergonomics
Department Of Industrial and Mechanical Engineering Page 51
Based on figure 18: for an 8 hour sedentary or light work activity, the thermal comfort zone ranges
from 66 to 79°F (18.9 to 26.1°C), with a relative humidity of 20 to 80%. Based on figure 17, the
comfort of the workers at 49.5% relative humidity is not affected by the humidity. However, the
minimum temperature measured is 27°C and rises to 46°C in some cases, with a 49.5% relative
humidity, so the workers are experiencing heat stress.
The main source of heat is the two big syrup cooking ovens, which have a 46°C temperature at their
outer edges. A possible solution is to contain the heat emitted from the ovens, are ceramic fiber
blankets, which are easy to install and with prices as low as 6$/roll (see figure 19).
3. Pollution from the Processes
The Tahineh and HALAWA production has a lot of undesired outcomes as the plant manager, Mr.
Fadi Abi Nader, pointed out. From the chart of the different types of outputs (Confectionary
Industry, 2003), we can focus on heat. The heat from the roasting can be harnessed to generate
steam for the syrup preparation ovens.
Manual Design
None of the tasks posed serious threat to the workers wellbeing; however some had very awkward
postures which could be tended to by simple alterations to their executions.
Separate Cans and put Cover Paper On
This task has a sample mean of 5.79s with a standard deviation of 0.585, which is large:
So, with (12/55) =21.81% ineffective therbligs time, a change of manual design is a must. The main
reasons for this repetitive stretched occurrence of ineffective therbligs are:
Holding the cans with her right hand to separate them
Holding the cover paper and Pre-positioning the cans for Release of cover paper
A simple alteration in the task can have a great impact on worker efficiency and productivity.
Instead of Holding the cans to separate them, install a can retrieval device which holds
batches of cans, from which the worker can directly Reach and Grasp a can
Instead of Pre-positioning the cans, the work surface between the weighing operator and
the separating cans operator can be divided into conveniently shaped circles to position and
hold the cans (It can be a simple cast metal grid)
Same as the can retrieval device, another device for holding a large number of cover papers can be
installed to allow the worker to directly reach and grasp a cover paper to place on top of HALAWA
in the can. The device can have two parallel adjacent tubes which one holds cans and the other
cover papers, pushed down by gravity.

HALAWA Production Line Ergonomics
Department Of Industrial and Mechanical Engineering Page 52
Sugar Bags Lifting and Syrup Preparation
A Rula analysis was performed using CATIA, for the initial and final posture of the worker with a 6.7
and 7 respective score:
A gravity chute can be deployed to hold large amounts of sugar (enough for 1 day), with a well-
defined and controllable output rate to substitute the worker sustained handling of the sugar bags.
However, this would mean a relatively expensive solution with modification to the ovens (insertion
of holes for the chute), yet well needed and sustainable one.
Weighing of HALAWA
The worker stands on a step in order to be able to reach the HALAWA in mixer. Since we cannot
lower the mixer, we can eliminate the step which is the main reason for the hunching, and insert a
small hole with an attached small tube (around 10 cm in length) on the side of the mixer with a
defined radius and an easy open/close mechanism. With the help of the mixing action, two rotating
hands, the Halawa can be forced into the tube and then collected directly onto a weighing scale.
(However this would mean elimination of the weighing operator)
Put Lid On
This task had a much larger cycle time, and for no justifiable reason. It can be lowered by 37% by the use of a
simple lid machine. A learning curve was calculated using Design Tools, resulting in 2.5 shifts to reach the
standard time of 50 seconds, which is reasonable.
Line Balancing
From the calculation earlier in the productivity analysis, there are some significant delays
throughout the production line, so a review of its different stations is in order. For that, line
balancing was done using Design Tools.
1. Observed
The observed line has an efficiency of: (62+30+64+40+68+67+80+50)/(8*80)=72%
Also, there is only need for 7 workers to sustain this level of production (Meaning elimination of 1
worker).
2. Improved
If the desired cycle time is decreased by implementing the proposed earlier solutions,
The operator (Syrup preparation) is actually being needed on the last workstation, and efficiency
increase to 85%.
Layout There is no major concern about the layout of the HALAWA section. However as Mr. Fadi Abi Nader pointed
out, since the Tahineh and HALAWA are closely related, the two productions lines should be
adjacent, and they are not. Perhaps, moving the HALAWA line to 2nd floor where the Tahineh

HALAWA Production Line Ergonomics
Department Of Industrial and Mechanical Engineering Page 53
production, takes place, would facilitate the procurement of the Tahineh for the making of
HALAWA, as well as making it possible to harness the heat from the roasting into generating steam
for the syrup preparation ovens.
Overcoming Resistance to Change
Participative standards and performance feedback are the main factors in the worker
Satisfaction/Productivity Analysis. Here is some possible means to boost worker satisfaction while
increasing productivity:
Installation of automatic digital screens that show outputs from the production line and
desired target
Questionnaires prepared by the management to gain crucial worker feedback on the
different processes as well as on their demands and complaints, and actually considering
the results in the decisions made.
Preparation of wage incentive plans for the different departments and personnel, based on quality
as well as worker productivity and ethics.

HALAWA Production Line Ergonomics
Department Of Industrial and Mechanical Engineering Page 54
Conclusion After considering all of the discussed topics, AL-Rabih HALAWA production Line has clearly some deficiencies in terms of environment parameters (Illumination, Temperature), manual design (uncomfortable workstations, awkward posture tasks, etc.), and department Layout (Tahineh and HALAWA production lines). As the company is considering expansion, the productivity levels could be greatly enhanced by
boosting worker efficiency as well that of the machines.

HALAWA Production Line Ergonomics
Department Of Industrial and Mechanical Engineering Page 55
References Russel, S., Winnemuller, L., Camp, J., Johnson, P. Comparing the results of five lifting analysis tools.
Applied Ergonomics, 38 (2007) 91-97.
Shikdar, A. & Das, B. The relationship between worker satisfaction and productivity in a repetitive
industrial task. Applied Ergonomics, 34(2003) 603-610.
Egyptian Ministry of State for Environmental Affairs. (2003). Self Monitoring Manual: Confectionary
Industry. Retrieved from: http://industry.eeaa.gov.eg/publications/Confectionary.pdf
Frievalds, A. (n.d.). Niebel’s Methods, Standards, and Work Design. Pennsylvania: Macgraw- Hill.
World Trade center Beirut. (2003). Food& Beverage. Retrieved December 21 , 2011, from
http://www.wtcbeirut.com/LIBF/sector_Food.asp
HALAWA Production Line Ergonomics
Department Of Industrial and Mechanical Engineering Page 56
Appendix A: Surveys/Checklists
HALAWA Production Line Ergonomics
Department Of Industrial and Mechanical Engineering Page 57
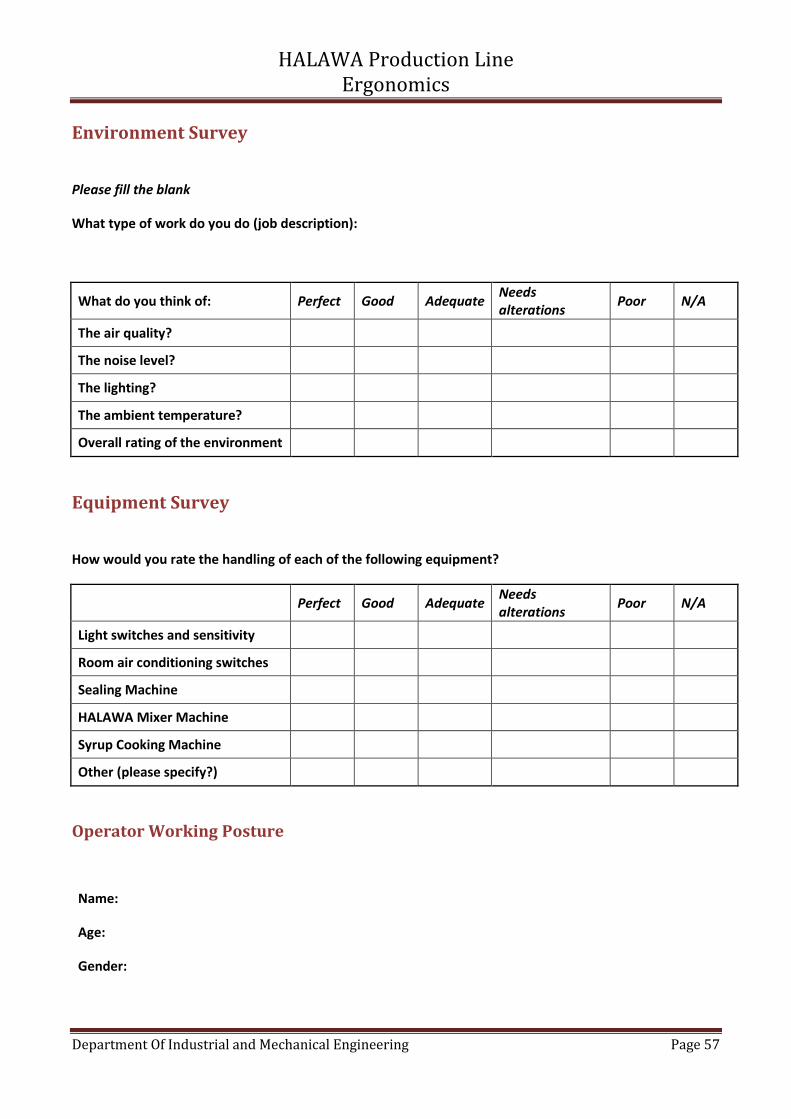
Environment Survey
Please fill the blank
What type of work do you do (job description):
What do you think of: Perfect Good Adequate Needs alterations
Poor N/A
The air quality?
The noise level?
The lighting?
The ambient temperature?
Overall rating of the environment
Equipment Survey
How would you rate the handling of each of the following equipment?
Perfect Good Adequate
Needs alterations
Poor N/A
Light switches and sensitivity
Room air conditioning switches
Sealing Machine
HALAWA Mixer Machine
Syrup Cooking Machine
Other (please specify?)
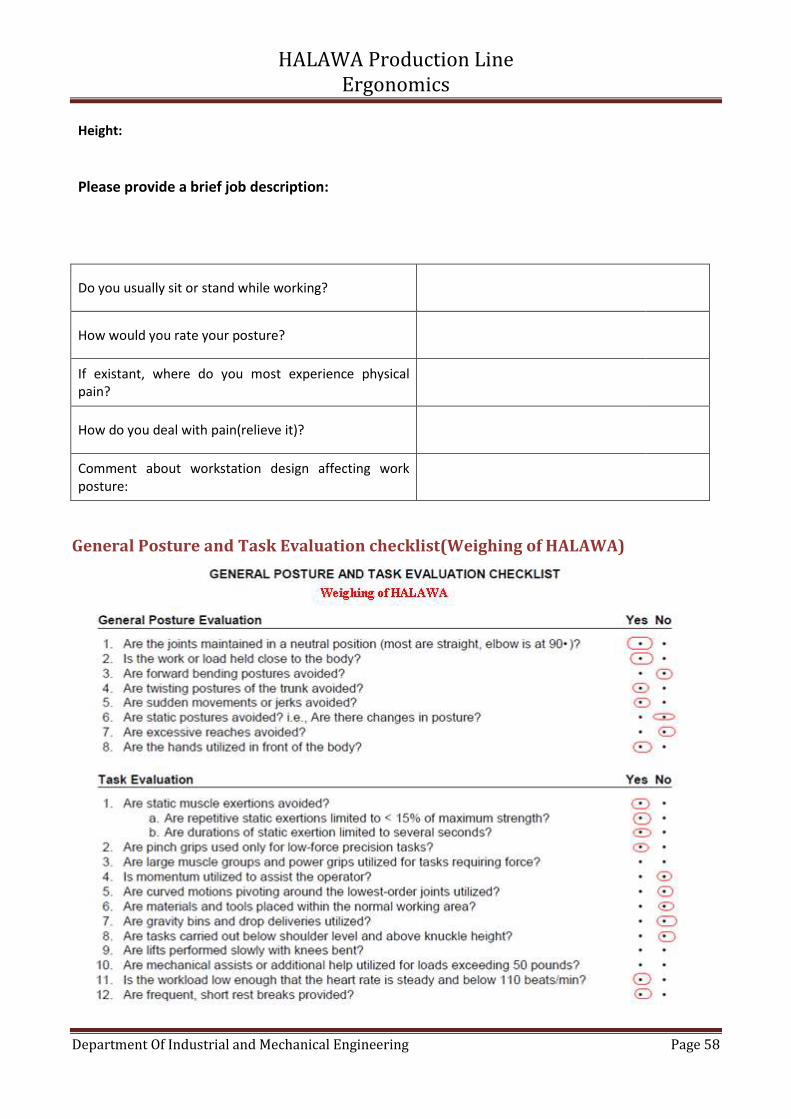
Operator Working Posture
Name:
Age:
Gender:
HALAWA Production Line Ergonomics
Department Of Industrial and Mechanical Engineering Page 58
Height:
Please provide a brief job description:
Do you usually sit or stand while working?
How would you rate your posture?
If existant, where do you most experience physical pain?
How do you deal with pain(relieve it)?
Comment about workstation design affecting work posture:
General Posture and Task Evaluation checklist(Weighing of HALAWA)
HALAWA Production Line Ergonomics
Department Of Industrial and Mechanical Engineering Page 59
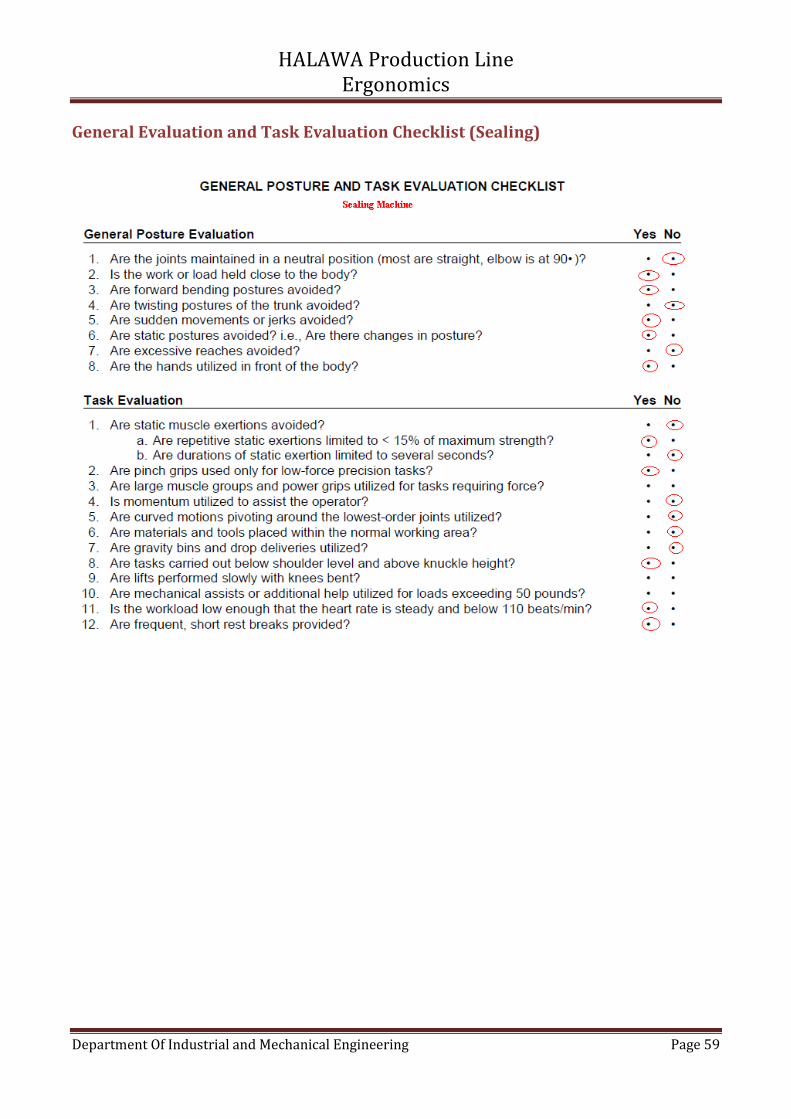
General Evaluation and Task Evaluation Checklist (Sealing)
HALAWA Production Line Ergonomics
Department Of Industrial and Mechanical Engineering Page 60
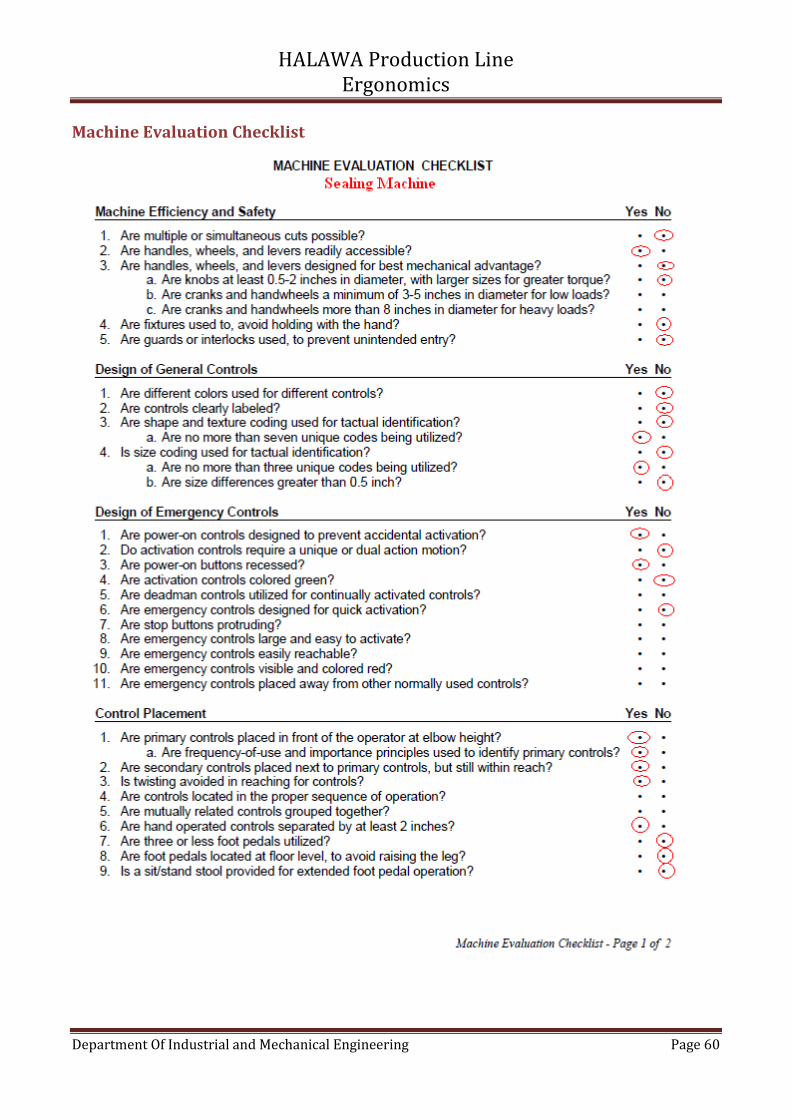
Machine Evaluation Checklist

HALAWA Production Line Ergonomics
Department Of Industrial and Mechanical Engineering Page 61

HALAWA Production Line Ergonomics
Department Of Industrial and Mechanical Engineering Page 62
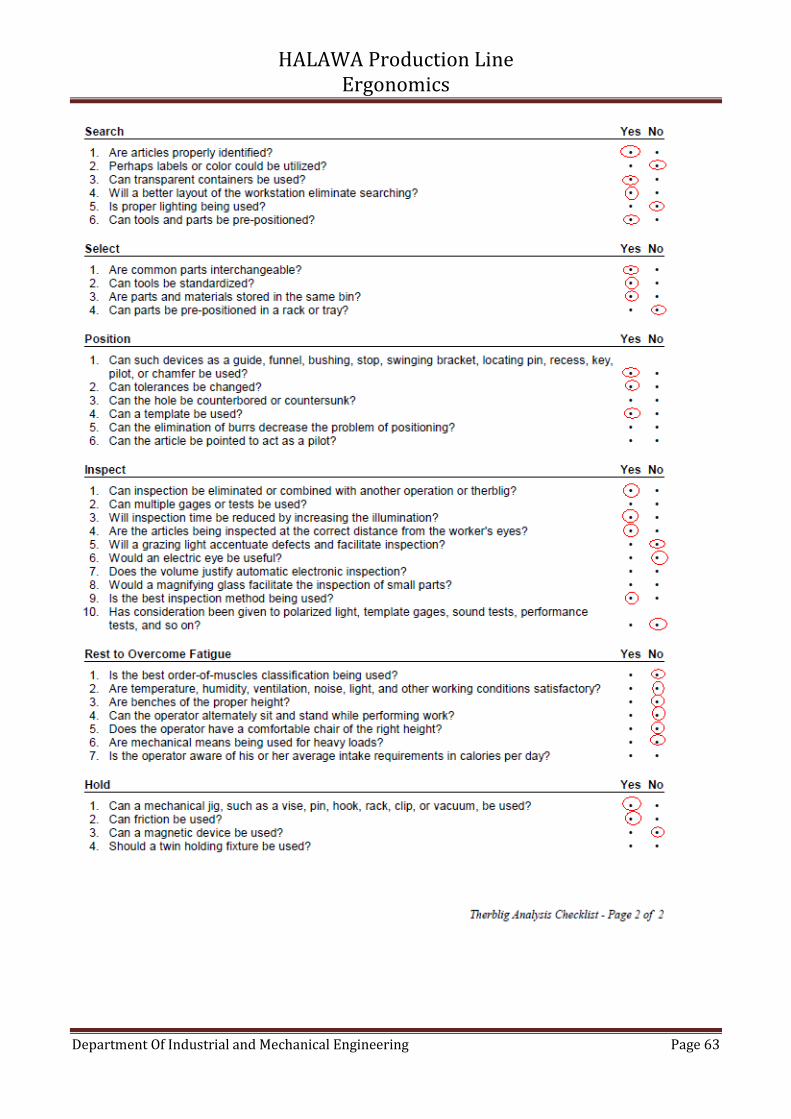
Therblig Analysis Checklist (HALAWA)
HALAWA Production Line Ergonomics
Department Of Industrial and Mechanical Engineering Page 63

HALAWA Production Line Ergonomics
Department Of Industrial and Mechanical Engineering Page 64
Wage Incentive Checklist

HALAWA Production Line Ergonomics
Department Of Industrial and Mechanical Engineering Page 65
Work Environment Checklist

HALAWA Production Line Ergonomics
Department Of Industrial and Mechanical Engineering Page 66
Workstation Evaluation Checklist (Weighing of HALAWA)

HALAWA Production Line Ergonomics
Department Of Industrial and Mechanical Engineering Page 67
Appendix B: Input Analyzer

HALAWA Production Line Ergonomics
Department Of Industrial and Mechanical Engineering Page 68
Adding Nuts
Weighing

HALAWA Production Line Ergonomics
Department Of Industrial and Mechanical Engineering Page 69
Place in Box
Put Lid On
HALAWA Production Line Ergonomics
Department Of Industrial and Mechanical Engineering Page 70
Put Sticker on


