68
HALF-YEAR FINANCIAL REPORT JUNE 30, 2017
| Date post: | 22-Jul-2018 |
| Category: |
Documents |
| Upload: | duongthien |
| View: | 214 times |
| Download: | 0 times |

HALF-YEAR FINANCIAL REPORT
JUNE 30, 2017

1
CONTENTS
I. Group businesses and results 3 1. Scope of consolidation and simplified organization chart 4
2. Revenue 9
3. Consolidated financial statements 11
4. Eurazeo SE cash and cash equivalents 13
5. NAV 14
6. Business and results of the main subsidiaries and investments 16
7. Subsequent events 28
8. Transactions with related parties 29
9. Risk management and disputes 29
II. 2017 Condensed Interim Consolidated Financial Statements 30
Consolidated Statement of Financial Position 31
Consolidated Income Statement 32
Consolidated Statement of Other Comprehensive Income 33
Consolidated Statement of Changes in Equity 34
Consolidated Statement of Cash Flows 35
Notes to the consolidated financial statements 36
III. Statutory Auditors’ reports 62
IV. Statement by the person responsible for the
half-year financial report 67

2
JUNE 30, 2017 HALF-YEAR FINANCIAL
REPORT
With a diversified portfolio of more than €6 billion in assets under management,
of which €1 billion for third parties, Eurazeo is one of the leading listed
investment companies in Europe. The Company covers most private equity
segments through its business divisions - Eurazeo Capital, Eurazeo Patrimoine,
Eurazeo PME, Eurazeo Croissance, Eurazeo Brands - and with the support of
Eurazeo Development. Its portfolio includes around 30 companies of all sizes
and from all sectors, that Eurazeo accompanies in the long term, most often as
a majority or key shareholder, working with them to accelerate their
transformation strategies. Eurazeo has developed an active presence in
Shanghai and Sao Paulo to encourage the international development of its
portfolio companies and a network of partners throughout the world. Its
investment team is now also present in New York.
Eurazeo is a shareholder in:
• AccorHotels, Asmodee, Carambar & Co, Desigual, Elis, Europcar, Fintrax,
Iberchem, Les Petits Chaperons Rouges, Moncler, Neovia, Novacap,
Sommet Education and Trader Interactive in Eurazeo Capital;
• Grape Hospitality, CIFA Fashion Business Center and Reden Solar in Eurazeo
Patrimoine;
• AssurCopro, Dessange International, Groupe Flash, In’Tech Medical, Léon
de Bruxelles, MK Direct, Orolia, Péters Surgical, Smile and Vignal Lighting
Group in Eurazeo PME;
• Farfetch, IES Synergy, l-Pulse, PeopleDoc, Vestiaire Collective and Younited
Credit in Eurazeo Croissance.
It is also a shareholder in the management platforms, iM Square, Capzanine
and Raise. These investments are assigned to the Eurazeo Development
division, which is also responsible for deal sourcing activities and fund
management for major international institutional investors.

3
I. Group businesses and results
During the first half of 2017, Eurazeo continued the brisk pace of its portfolio
rotation while strengthening its third-party management activity. At the same
time, it created a new investment division, Eurazeo Brands, and confirmed its
international expansion with the opening of an office in the United States.
Finally, Eurazeo received the support of a new reference shareholder,
underlining the appeal of its model and the quality of its teams and assets, at
a time when the company is speeding up its strategic development by
undertaking major initiatives.
Portfolio rotation
Eurazeo remained highly active in the first half of 2017, completing transactions
totaling €1,193 million, or 24% of its NAV as of December 31, 2016.
Eurazeo invested close to €702 million in 5 acquisitions: three by Eurazeo Capital
with CPK (group controlling Carambar & Co), Trader Interactive (formerly DWS,
Dominion Web Solutions) and Iberchem and two by Eurazeo PME with Smile
and In’Tech Medical.
Additionally, as a long-term investor, Eurazeo reinvested €132 million in Elis,
Europcar and Novacap, participating in their share capital increases to
finance external growth transactions. Eurazeo’s companies also completed
around twenty other transactions which did not require share capital increases
or financial support from Eurazeo.
At the same time, Eurazeo sold Colisée (Eurazeo PME) and ANF Immobilier
Hôtels and entered into exclusive negotiations for the sale of ANF Immobilier.
Steady third-party management
Following the Eurazeo Capital II fundraising in December 2016 (€500 million),
Eurazeo stepped up the development of its third-party management by raising
€250 million with Eurazeo PME III.
Creation of Eurazeo Brands
In May 2017, Eurazeo launched Eurazeo Brands, a new division to invest in U.S.
and European consumer brands with global growth potential, particularly in six
key sectors: beauty, fashion, home, travel & leisure, wellness and food.
Ramp-up of Eurazeo in the United States
With Trader Interactive, Eurazeo completed its first investment in the United
States less than one year after setting up in North America. Opened in the
summer of 2016, the New York office now has a total of 8 investment
professionals: 3 are French and 5 are American, including the CEO of Eurazeo
Brands, Jill Granoff.
Strengthened share ownership to back its strategy
On June 6, 2017, the Decaux family acquired the entire 15.4% stake in Eurazeo,
previously held by Crédit Agricole SA, for around €800 million through its
investment vehicle, JCDecaux Holding.

4
1. Scope of consolidation and simplified organization chart
1.1 Acquisitions
Eurazeo completed five acquisitions in the first half of 2017 for a total of nearly
€702 million.
Eurazeo Capital
Eurazeo Capital’s investment momentum was strong, with three acquisitions
completed in 2017 for a total of nearly €630 million.
On May 2, 2017, Eurazeo Capital announced it had completed the creation of
CPK, a new autonomous group in the confectionary and chocolate sector. Its
operating subsidiary, Carambar & Co, holds a portfolio of iconic European
brands, including Carambar, Poulain, Krema, La Pie Qui Chante and Terry's, as
well as the Pastilles Vichy, Rochers Suchard and Malabar bubble gum licenses.
This transaction brought together in this truly entrepreneurial project, the new
group’s five production sites and nearly 900 employees, including a head office
team of 160 recruited from among Mondelēz International volunteers and
external applicants.
The branded products will generate revenue of approximately €250 million, to
which will be added in the initial years, some co-manufacturing business with
Mondelēz International, the former owner of the brand portfolio.
Eurazeo owns 68% of CPK after syndication to Eurazeo Capital II, i.e. an
investment of €164 million.
On June 19, 2017, Eurazeo announced the completion of its first investment in
the United States since opening its North American office in September 2016.
Dominion Web Solutions (DWS), renamed Trader Interactive, was acquired in
partnership with West Street Capital Partners VII, a fund managed by Goldman
Sachs Merchant Banking Division (GS MBD). Trader Interactive is an integrated
market place and digital solutions platform for leisure vehicles, commercial
trucks and equipment.
Trader Interactive is the leading online classifieds marketplace and marketing
software solutions provider to commercial and recreational dealers. Bringing
buyers and sellers together remains its core business. Trader Interactive is
committed to providing innovative products to ensure that customers
generate leads, drive sales and maximize profits. Its B2C brands consist of Cycle
Trader, RV Trader, ATV Trader, PWC Trader, Snowmobile Trader, and Aero Trader
and produce over 7 million unique visitors monthly. Additionally, its industry
leading B2B brands consist of Commercial Truck Trader, Commercial Web
Services, Equipment Trader, RV Web Services and focus on supporting its
dealers and manufacturers with driving impressive results as top of mind. Trader
Interactive has 10 businesses and approximately 300 employees with its home
office located in Norfolk, Virginia.
Eurazeo acquired a 50% equity stake for $226 million.

5
In July 2017, Eurazeo announced the acquisition of Iberchem, a global
producer of fragrances and flavors addressing national and regional brands in
emerging markets, with an enterprise value of €405 million. Eurazeo invested
around €270 million, becoming the majority shareholder (approximately 70% of
share capital) alongside the management team.
Headquartered in Murcia (Spain) and selling in more than 100 countries,
Iberchem has a unique and particularly fast-to-customer business model, with
strong local sales & development teams and 11 manufacturing facilities across
the world including in Spain, China, Indonesia, Colombia and Tunisia. Iberchem
serves the Hygiene and Personal Care (“HPC”) industry through its fragrances
division and the Food and Beverages (“F&B”) industry through its flavors division,
Scentium. Thanks to a highly diversified customer base of more than 3,400
customers, mainly leading local and regional consumer brands, Iberchem
benefits from the growth of the world’s population as well as the rise of the
middle class in emerging market countries to drive its superior organic growth.
Since its creation in 1985 by Ramon Fernandez, its current CEO, Iberchem has
enjoyed solid and uninterrupted double-digit organic growth. As of May 2017,
the company generated annual sales of approximately €117 million and
EBITDA of approximately €25 million. The transaction was completed on July 24,
2017.
Eurazeo PME
Eurazeo PME completed two investments in the first half of 2017 for a total of
€66 million.
Eurazeo PME announced the acquisition of In’Tech Medical group, a specialist
in high precision orthopedic surgical instruments. The company designs and
manufactures orthopedic surgical instruments for knee, hip, shoulder and spinal
surgeries. It is the world number 1 in this market. The total investment was €68
million. After syndication of €15 million in the coming months, Eurazeo PME will
have invested €33 million. With 2016 revenue of €55 million, up more than +15%
annually over 15 years, the group generates nearly two-thirds of its sales in the
U.S. The transaction was completed on July 12, 2017.
Eurazeo PME acquired Smile, a leading integrator and outsourcer of open
source solutions, for €33 million. This provided the company with new resources
for the roll-out of its OPEN ARROW 2021 strategic plan, aimed at creating a new
European IT champion generating over €200 million in revenue.
Created over 25 years ago, Smile has become a pivotal player in its market,
thanks to a unique service range combining technical and business expertise
in the areas of digital technology, E-business, embedded systems, the Internet
of things, infrastructures, and business apps. With nearly 1,100 employees, of
which approximately 900 in France, Smile has set a 2017 revenue target of €83
million. The company has reported significant annual growth of 20% since 2007
and is expanding internationally with 15 branches in 7 countries.

6
1.2 Investment activity of Eurazeo’s companies
Reinvestments
As a long-term investor supporting the development of businesses in value
creation projects, Eurazeo participated in three capital increases to finance
major external growth transactions.
On February 9, 2017, Eurazeo contributed €46 million to the Elis €325 million
capital increase to finance the acquisitions of Indusal and Lavebras, major
players in Spain and Brazil.
In June 2017, Eurazeo invested €30 million in the Europcar €175 million share
capital increase to finance the acquisition of Goldcar. Following this
transaction, it owned 39.22% of the Europcar Group share capital.
Eurazeo contributed €56 million to finance the acquisition of PCAS by
Novacap.
Company external growth transactions
In addition to the above share capital increases, Eurazeo’s companies
performed around twenty external growth transactions. Asmodee expanded
its presence in the games publishing sector, Europcar in the low-cost segment,
Neovia in the Chinese pet food segment and Les Petits Chaperons Rouges with
a nursery network in the UK.
Company joint-ventures
Two agreements were signed by the companies during the first half of 2017 with
the support of the Eurazeo team in Shanghai.
Fintrax created a joint venture in March 2017, entering into a strategic
partnership with a Lotte Group subsidiary in Korea and became a joint
shareholder of CubeRefund, an active operator in the Korean tax-free
shopping market.
On January 12, 2017, Europcar and Shouqi Car Rental, one of the leading car
rental companies in China (Beijing Tourism Group), announced the signature
of a global business partnership to better meet their respective customers’
needs.
1.3 Disposals
During the first half of 2017, Eurazeo PME announced the sale of Colisée group,
a key player in the global health care and old-age dependency sector and
the fourth largest French operator of nursing homes, to the investment fund IK
Investment Partners. Eurazeo PME initially invested in this sector in March 2013.
The sale price for the funds managed by Eurazeo PME was €236 million, i.e. a
share of €123 million for Eurazeo. Eurazeo multiplied its investment by 2.5x,
generating an IRR of 35%.

7
In addition, Eurazeo Patrimoine sold ANF Immobilier Hôtels to ANF Immobilier for
€23 million in January.
On July 24, 2017, Eurazeo Patrimoine announced that it had entered into
exclusive negotiations with the real estate group Icade to sell its majority stake
in ANF Immobilier - 50.48% of share capital and 53.73% of voting rights. This
transaction is presented in detail in the subsequent events section (Section 1.8).

8
1.4 Organizational structure as of June 30 2017
In summary, fully-consolidated companies in the first half of 2017 comprise
Asmodee, Fintrax, Novacap and Sommet Education held by Eurazeo Capital;
Dessange International, Léon de Bruxelles, Péters Surgical,
Vignal Lighting Group, Groupe Flash, MK Direct, Orolia and Assurcopro held by
Eurazeo PME; and Grape Hospitality and CIFA held by Eurazeo Patrimoine.
Consolidated revenue, adjusted EBIT and net finance cost data corresponds
to fully-consolidated companies.
Equity-accounted companies in the first half of 2017 comprise Desigual, LPCR,
Elis, Europcar and Neovia held by Eurazeo Capital and Reden Solar held by
Eurazeo Patrimoine.
The above organizational chart also includes companies that will be fully
consolidated from the second half of 2017: CPK, Iberchem and Trader
Interactive held by Eurazeo Capital, as well as Smile and In’Tech Medical held
by Eurazeo PME.
Asmodee Fintrax Novacap Elis* AccorHotels*
Sommet Education CPK (1) Iberchem (1) Europcar* Moncler*
Trader Interactive (1) Desigual LPCR Neovia Banca Leonardo
Dessange
InternationalLéon de Bruxelles Péters Surgical
Vignal Lighting
GroupGroupe Flash
MK Direct Orolia AssurCopro In'Tech Medical (1) Smile (1)
The Flexitallic
Group
Grape Hospitality CIFA ANF Immobilier* (2) Reden Solar Colyzeo
Farfetch IES I-Pulse iM Square Capzanine
People Doc Vestiaire collective Younited Credit RaiseThird-party
fund management
Fully-consolidated companies
Equity-accounted companies
Non-consolidated companies
Acquisitions during the half-year
* Listed company
(1) Companies consolidated from the second half o f 2017
(2) Divestment signed on July 24, 2017. ANF Immobilier's assets are recorded in Assets classified as held for sale
(in accordance with IFRS 5)

9
1.5 Changes in scope
2017 revenue and results are compared with 2016 pro forma figures. 2016 pro
forma figures correspond to 2016 data restated for changes in scope at
Eurazeo Capital, Eurazeo PME and Eurazeo Patrimoine between January 1,
2016 and June 30, 2017. 2016 pro forma figures are also referred to as 2016 at
constant Eurazeo scope.
In concrete terms, restatements are 1) 2016 scope entries: Grape Hospitality
(July 2016), Les Petits Chaperons Rouges (April 2016), MK Direct (July 2016),
Novacap (July 2016), Orolia (July 2016), Sommet Education (July 2016); 2) 2016
scope exits: Foncia (July 2016), Accorhotels and Moncler (both deconsolidated
in the second half of 2016); 3) 2017 scope entries: AssurCopro (January 2017);
4) 2017 scope exits: Colisée (June 2017); 5) the change in Eurazeo’s
percentage interest in Europcar to 45.0% ; 6) Other: creation of Reden Solar
(46.8%) following the spin-off of Fonroche.
2017 revenue is also compared with 2016 figures at constant scope and
exchange rates, which, in addition, restates figures for changes in the scope of
each of the companies and foreign currency fluctuations between 2016 and
2017.
2. REVENUE
Growth in economic revenue
ECONOMIC REVENUE (In millions of euros)
At the end of June 2017, Eurazeo recorded its 14th consecutive quarter of
economic revenue growth at constant Eurazeo scope. Economic revenue
increased +13.4% to €2,410.3 million (+13.1% in the first quarter and +13.7% in
the second quarter). Eurazeo consolidated revenue for the first six months of
2017 rose +15.9% to €1,568.6 million.
The 2016 scope has been restated for acquisitions and divestments between
January 1, 2016 and June 30, 2017.

10
After restatement to reflect foreign currency fluctuations and changes in scope
in the investments, organic growth is +8.4%.
The fully-consolidated companies reported a +15.9% rise in revenue,
representing organic growth of +11.7%. Asmodee growth was driven by strong
organic growth of +27.1%, with an increase in Pokemon card sales. Fintrax’s
+28.3% revenue growth reflects favorable market trends and market share
gains. Novacap revenue increased +24.4% in the first six months, mainly thanks
to the Performance Chemicals division. Eurazeo PME grew +13.4%, driven
primarily by Colisée (+31%, deconsolidated from May 31), Vignal Lighting
Group (+25%), Groupe Flash (+20%), Orolia (+17%), AssurCopro(+4%) and Léon
de Bruxelles (+1%).
ANF Immobilier was the main contributor to the contraction in Eurazeo
Patrimoine revenue, reporting a decrease of -5.4%. Eurazeo has entered into
exclusive negotiations for the sale of this company.
Equity-accounted associates (mainly Eurazeo Capital companies) reported
revenue growth of +8.9% on a reported basis. Elis grew +15.8%, driven by the
acquisition of Lavebras and Indusal, as well as +2.5% organic growth. Europcar
reported strong growth of +8.4% thanks to acquisitions (particularly franchises
in Ireland and Denmark) and +4.6% organic growth (+5.7% in the second
quarter). LPCR’s development was attributable to organic growth of +9.4% and
the acquisition of Magic Nurseries in the United Kingdom. Neovia’s +11.1%
growth followed numerous acquisitions during the last 12 months. Finally,
Desigual reported a -9.6% decline in revenue.
% consolidation Q1 2017 Q2 2017 H1 2017
Change Change Change Change Change Change
2017 2016 2017/2016 2017/2016 2017 2016 2017/2016 2017/2016 2017 2016 2017/2016 2017/2016
Constant
Eurazeo
scope
Constant
Eurazeo
scope
Constant
scope and
exchange rates
Constant
Eurazeo
scope
Constant
Eurazeo
scope
Constant
scope and
exchange rates
Constant
Eurazeo
scope
Constant
Eurazeo
scope
Constant
scope and
exchange rates
Eurazeo Capital 402.9 328.0 + 22.8% + 21.3% 372.4 307.1 + 21.3% + 19.1% 775.2 635.0 + 22.1% + 20.2%
Asmodee 104.6 75.2 + 39.0% + 32.9% 89.8 69.3 + 29.6% + 21.0% 194.4 144.5 + 34.5% + 27.1%
Fintrax 53.0 42.9 + 23.5% + 25.8% 63.9 48.2 + 32.6% + 33.6% 117.0 91.1 + 28.3% + 29.9%
Novacap 205.7 162.5 + 26.6% + 26.3% 185.2 151.7 + 22.1% + 21.5% 390.9 314.2 + 24.4% + 24.0%
Sommet Education 39.6 47.3 - 16.3% - 18.3% 33.5 37.9 - 11.8% - 12.7% 73.0 85.2 - 14.3% - 15.8%
Eurazeo PME 322.2 281.0 + 14.7% + 7.2% 293.6 262.0 + 12.0% + 3.6% 615.8 543.0 + 13.4% + 5.4%
Eurazeo Patrimoine 64.7 65.1 - 0.5% + 0.3% 78.2 79.1 - 1.1% - 2.1% 142.9 144.1 - 0.8% - 1.0%
ANF Immobilier 12.0 12.9 - 6.6% - 2.4% 12.4 12.9 - 4.2% - 10.1% 24.4 25.8 - 5.4% - 6.4%
Grape Hospitality 48.2 47.9 + 0.6% + 0.6% 61.0 61.4 - 0.5% - 0.5% 109.2 109.2 - 0.0% - 0.0%
CIFA 4.5 4.3 + 4.6% + 4.6% 4.8 4.8 - 0.0% - 0.0% 9.3 9.1 + 2.2% + 2.2%
Eurazeo holding companies 4.5 9.3 - 52.0% - 52.0% 30.2 21.5 + 40.8% + 40.8% 34.7 30.8 + 12.7% + 12.7%
Consolidated revenue 794.3 683.3 + 16.2% + 12.4% 774.3 669.6 + 15.6% + 11.0% 1,568.6 1,352.9 + 15.9% + 11.7%
Eurazeo Capital 381.3 353.4 + 7.9% + 2.3% 451.0 406.6 + 10.9% + 3.7% 832.3 760.0 + 9.5% + 3.1%
Desigual 10.0% 21.9 24.5 - 10.4% - 10.4% 15.9 17.3 - 8.5% - 8.5% 37.8 41.8 - 9.6% - 9.6%
Elis 17.0% 68.1 59.6 + 14.3% + 2.3% 75.7 64.6 + 17.3% + 2.7% 143.8 124.2 + 15.8% + 2.5%
Europcar 45.0% 197.5 187.8 + 5.2% + 3.2% 264.6 238.4 + 11.0% + 5.7% 462.1 426.2 + 8.4% + 4.6%
LPCR 41.1% 18.7 15.9 + 17.2% + 9.7% 20.0 16.9 + 17.9% + 9.0% 38.7 32.9 + 17.6% + 9.4%
Neovia 17.3% 75.1 65.7 + 14.4% + 2.7% 74.9 69.3 + 8.1% - 0.2% 150.0 134.9 + 11.1% + 1.2%
Eurazeo Patrimoine (proportionate)* 46.8% 3.0 5.4 - 44.8% - 44.8% 6.4 7.2 - 10.9% - 10.9% 9.4 12.6 - 25.4% - 25.4%
Proportionate revenue 384.3 358.8 + 7.1% + 1.7% 457.4 413.7 + 10.6% + 3.5% 841.7 772.6 + 8.9% + 2.7%
Economic revenue 1,178.6 1,042.2 + 13.1% + 8.7% 1,231.7 1,083.4 + 13.7% + 8.1% 2,410.3 2,125.5 + 13.4% + 8.4%
Eurazeo Capital 784.2 681.4 + 15.1% + 11.3% 823.4 713.6 + 15.4% + 10.1% 1,607.6 1,395.0 + 15.2% + 10.7%
Eurazeo PME 322.2 281.0 + 14.7% + 7.2% 293.6 262.0 + 12.0% + 3.6% 615.8 543.0 + 13.4% + 5.4%
Eurazeo Patrimoine 67.7 70.5 - 3.9% - 3.2% 84.6 86.2 - 1.9% - 2.9% 152.3 156.7 - 2.8% - 3.0%
Eurazeo holdings 4.5 9.3 - 52.0% - 52.0% 30.2 21.5 + 40.8% + 40.8% 34.7 30.8 + 12.7% + 12.7%
*Reden Solar
3. Consolidated financial statements
3.1 Consolidated net income
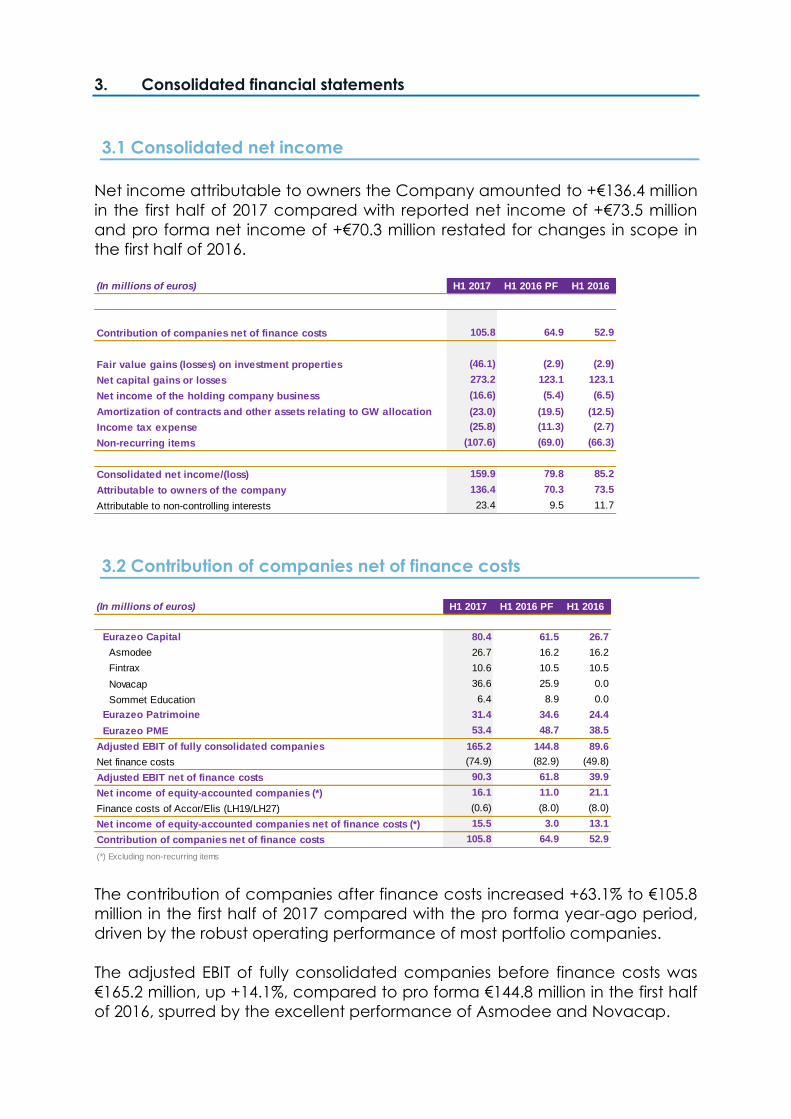
Net income attributable to owners the Company amounted to +€136.4 million
in the first half of 2017 compared with reported net income of +€73.5 million
and pro forma net income of +€70.3 million restated for changes in scope in
the first half of 2016.
3.2 Contribution of companies net of finance costs
The contribution of companies after finance costs increased +63.1% to €105.8
million in the first half of 2017 compared with the pro forma year-ago period,
driven by the robust operating performance of most portfolio companies.
The adjusted EBIT of fully consolidated companies before finance costs was
€165.2 million, up +14.1%, compared to pro forma €144.8 million in the first half
of 2016, spurred by the excellent performance of Asmodee and Novacap.
(In millions of euros) H1 2017 H1 2016 PF H1 2016
Contribution of companies net of finance costs 105.8 64.9 52.9
Fair value gains (losses) on investment properties (46.1) (2.9) (2.9)
Net capital gains or losses 273.2 123.1 123.1
Net income of the holding company business (16.6) (5.4) (6.5)
Amortization of contracts and other assets relating to GW allocation (23.0) (19.5) (12.5)
Income tax expense (25.8) (11.3) (2.7)
Non-recurring items (107.6) (69.0) (66.3)
Consolidated net income/(loss) 159.9 79.8 85.2
Attributable to owners of the company 136.4 70.3 73.5
Attributable to non-controlling interests 23.4 9.5 11.7
(In millions of euros) H1 2017 H1 2016 PF H1 2016
Eurazeo Capital 80.4 61.5 26.7
Asmodee 26.7 16.2 16.2
Fintrax 10.6 10.5 10.5
Novacap 36.6 25.9 0.0
Sommet Education 6.4 8.9 0.0
Eurazeo Patrimoine 31.4 34.6 24.4
Eurazeo PME 53.4 48.7 38.5
Adjusted EBIT of fully consolidated companies 165.2 144.8 89.6
Net finance costs (74.9) (82.9) (49.8)
Adjusted EBIT net of finance costs 90.3 61.8 39.9
Net income of equity-accounted companies (*) 16.1 11.0 21.1
Finance costs of Accor/Elis (LH19/LH27) (0.6) (8.0) (8.0)
Net income of equity-accounted companies net of finance costs (*) 15.5 3.0 13.1
Contribution of companies net of finance costs 105.8 64.9 52.9
(*) Excluding non-recurring items

12
The net finance costs of fully consolidated companies declined €8.0 million to
-€74.9 million, primarily due to lower finance costs incurred by Asmodee and
Novacap.
Net income of equity-accounted companies (excluding non-recurring items)
net of finance costs totaled €15.5 million compared to pro forma €3.0 million in
the first half of 2016. This increase was attributable to improved portfolio
company results and the repayment of acquisition debt relating to Elis securities
in 2016.
3.3 Capital gains
Net capital gains of €273.2 million presented in the above management
income statement include capital gains on disposal of €113.8 million and
changes in the fair value of AccorHotels and Moncler shares of €159.4 million,
as these two shares are now recorded at fair value through profit or loss.
Capital gains on disposals of €113.8 million mainly consist of the €73.5 million
gain realized on the sale of Colisée and a dilution gain of €28.3 million following
the Europcar share capital increase.
3.4 Non-recurring items
Non-recurring items total -€107.6 million in the first half of 2017 and mainly
include acquisition and transaction costs, as well as restructuring costs in
various portfolio companies.
3.5 Consolidated net debt
Eurazeo consolidated net debt was €1,826.0 million as of June 30, 2017, up
+€325.2 million on December 31, 2016. This increase reflects the consolidation
of the debt associated with investments and reinvestments, the
deconsolidation of companies sold and net movements in the cash and cash
equivalents of Eurazeo companies (including investment and divestment
flows). In light of the divestment agreement, ANF Immobilier debt was
deconsolidated as of June 30, 2017.

13
CONSOLIDATED NET DEBT (In millions of euros)
4. Eurazeo SE cash and cash equivalents
Eurazeo’s net cash and cash equivalents totaled €434 million as of June 30,
2017. The main changes compared to December 31, 2016 were due to: 1)
investments in CPK (€164 million), Trader Interactive (€202 million) and Smile (€33
million); 2) Eurazeo’s participation in capital increases by Elis (€46 million),
Europcar (€30 million) and Novacap (€35 million to acquire 51.8% of the share
capital), repayment of the AccorHotels debt (€150 million), Eurazeo share
buybacks totaling €105 million, dividends paid for €79 million and dividends
collected for €67 million; and 3) the sale of ANF Immobilier Hôtels (€23 million),
and Colisée (€123 million).
14
5. NAV
5.1 NAV per share in euros
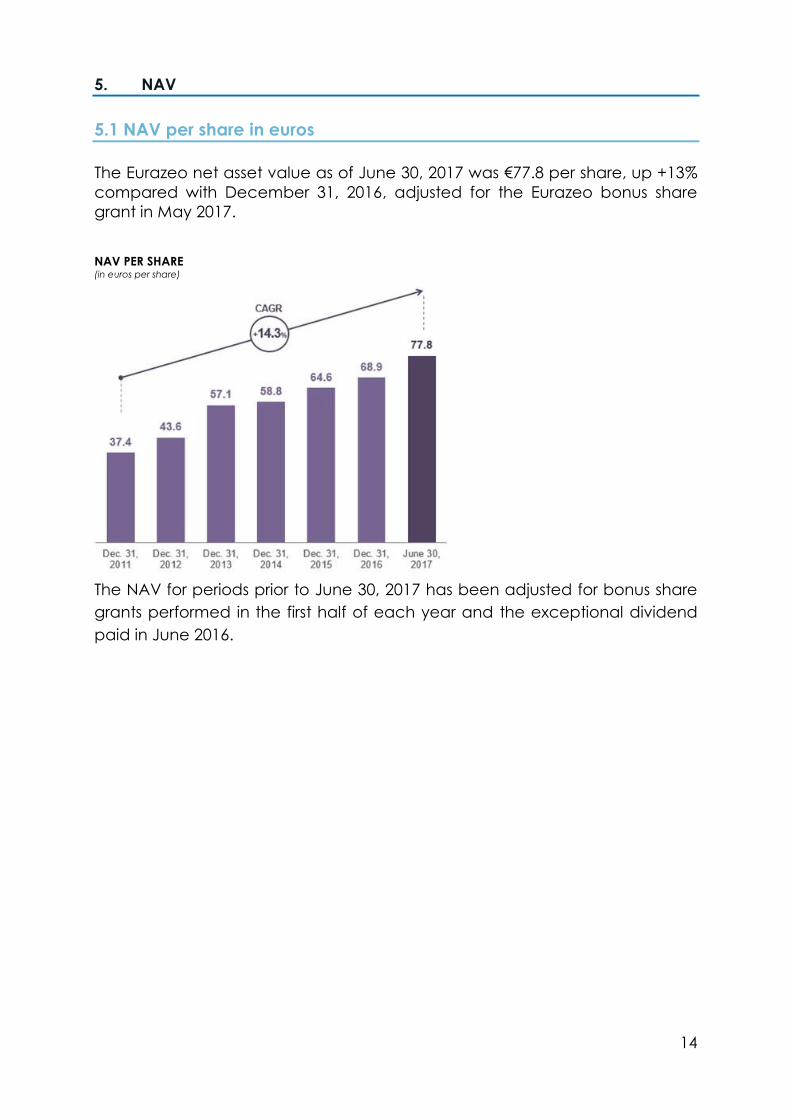
The Eurazeo net asset value as of June 30, 2017 was €77.8 per share, up +13%
compared with December 31, 2016, adjusted for the Eurazeo bonus share
grant in May 2017.
NAV PER SHARE (in euros per share)
The NAV for periods prior to June 30, 2017 has been adjusted for bonus share
grants performed in the first half of each year and the exceptional dividend
paid in June 2016.

15
5.2 NAV in millions of euros
Breakdown of NAV as of June 30, 2017
% interest (1)
Number of shares
Share price NAV as of June 30, 2017
€ In € million
Eurazeo Capital Listed 2,038.8
Europcar 39.15% 63,045,072 12.32 776.8
Elis 14.20% 19,900,956 19.37 385.5
Moncler 7.83% 19,863,814 21.08 418.7
Accor 3.63% 10,510,003 41.72 438.5
Accor net debt 19.3
Accor net* 457.8
Eurazeo Capital Unlisted 1,769.5
Eurazeo Croissance 198.3
Eurazeo PME 316.9
Eurazeo Patrimoine 503.1
ANF Immobilier (3) 50.48% 9,596,267 22.15 212.6
Eurazeo Patrimoine Unlisted 290.5
Eurazeo Development 221.6
Other securities 91.2
Eurazeo Partners(2) 34.7
Other 56.6
Cash and cash equivalents 434.4
Tax on unrealized capital gains (93.8)
Treasury shares 3.76% 2,721,904 90.0
Total value of assets after tax 5,570.1
NAV per share 77.8
Number of shares 71,577,752
* Net of allocated debt (1) The% interest is equal to Eurazeo’s direct interest, with any interest held through Eurazeo Partners now included in the Eurazeo Partners line item. (2) Eurazeo investments in Eurazeo Partners are included in the Eurazeo Partners line item. (3) ANF Immobilier valued at its sale price.
Valuation methodology
The valuation methodology complies with the recommendations of the
International Private Equity Valuation Board (IPEV). The valuation of unlisted
investments is mainly based on comparable or transaction multiples. The value
adopted for listed companies is the 20-day average of share prices weighted
for trading volumes.
Additionally, the values adopted for Eurazeo Capital and Eurazeo Croissance
unlisted investments are subject to a detailed review by an independent
professional appraiser, Sorgem Evaluation, pursuant to the signed engagement
letter. This review supports the values adopted and certifies that the valuation
methodology complies with IPEV recommendations. Eurazeo PME valuations
were reviewed by the statutory auditors of the relevant funds.

16
6. Business and results of the main subsidiaries and investments
Virtually all portfolio companies again posted improved EBITDA in the first half
of 2017 following their active transformation. The results were particularly visible
at Asmodee, Elis, Fintrax, Les Petits Chaperons Rouges, Novacap, and Eurazeo
PME’s portfolio companies.
Eurazeo Capital
ACCORHOTELS (deconsolidated as of November 15, 2016)
AccorHotels was deconsolidated from the Eurazeo scope as of November 15,
2016 based on the published June 30, 2016 accounts (as of September 30, 2016
for economic revenue), after the loss of significant influence following Colony’s
decision to sell its shares and the resulting end of the joint action.
ASMODEE (fully consolidated)
■ Further growth in the first half of 2017
In the first half of 2017, Asmodee posted revenue of €194.4 million, up +34.5%
on a reported basis year-on-year, and solid organic growth of +27.1% at
constant scope and exchange rates.
This growth was driven by European results, in particular the success of
Pokémon cards in France, the UK and Northern Europe. At mid-year,
international activities generated more than 77% of Group sales.
Group EBITDA was €30.1 million, representing a 15.5% margin. EBITDA increased
by +65.5% on a reported basis and +14.1% at constant scope and exchange
rates. Net debt at June 30, 2017 is €232.1 million, i.e. a leverage lower than 3x.
Asmodee’s current strategy focuses on reinforcing and enhancing its editorial
content, internationalization and digital technology. It therefore acquired the
dice game Story Cube in the first-half year, which is enjoying success in Europe
and the U.S. In addition, Asmodee Digital announced the July launch of its first
Free-to-play game, Spot-it! Duel.
DESIGUAL (equity-accounted)
■ 2017 first-half performance hampered by a decrease in multi-brand
distribution network and company-owned store sales

17
Desigual reported revenue of €377.9 million in the first half of 2017, down -9.6%
on the year-ago period, including -8.5% in the second quarter of 2017. The first-
half decline stems primarily from i) a decrease in wholesale orders in the multi-
brand distribution network for the Spring-Summer collection, following poor
sales of previous collections; and ii) a drop in company-owned store revenue,
mainly due to the ongoing rationalization plan. Winter-Fall 2017 collection
trends are expected to track the Spring-Summer collection. At the same time,
the company reported healthy performance in the digital segment, with
double-digit sales growth. The digital segment currently accounts for 11% of
revenue.
In the first half of 2017, EBITDA amounted to €54.6 million, down -23.6% on last
year. This decline mainly reflects a slowdown in activity, despite the positive
impacts of the management strategic plan, which should continue in coming
periods.
Net cash and cash equivalents amounted to €418.3 million as of June 30, 2017,
up €37.6 million compared with December 31, 2016 (€380.7 million).
ELIS (equity-accounted)
■ Sharp revenue growth of +15.8% and an EBITDA margin in line with annual
objectives
Elis posted revenue of €845.8 million in the first half of 2017, up +15.8%, together
with organic growth1 of +2.5%, a contribution from acquisitions up +11.6% and
a positive currency impact of +1.7%.
Group EBITDA rose by +12.9% to €244.1 million. The EBITDA margin fell by 73bp
due to a negative mix impact: Europe and Latin America, where margins are
lower than in France even though they are improving, posted higher revenue
growth than France. Margin stability in France is encouraging and reflects the
first positive effects of the initiatives set up to optimize the pricing strategy.
Group adjusted net financial debt as of June 30, 2017 totaled €1,800.9 million,
or 3.3x LTM EBITDA, pro forma of acquisitions.
The Group has been able to pinpoint its 2017 annual objectives based on its
2017 first-half results2: for the current Elis scope, revenue exceeding €1.75 billion
and an improved EBITDA margin in all geographical areas.
EUROPCAR (equity-accounted)
■ Significant 2017 first-half revenue growth – Confirmed 2017 and mid-term
objectives
Europcar recorded revenue of €1,028 million, up +10.1% at constant exchange
rates on the year-ago period. At constant scope and exchange rates, revenue
rose by +4.6% (excluding the fuel impact), including +5.7% in the second
quarter.
1 Growth at constant scope and exchange rates. 2 Excluding Berendsen but including Lavebras from June 1, 2017.
18
Rental days totaled 30.0 million in the first half of 2017, i.e. a +12.2% increase
compared with same period in 2016. Rental day decreased by -2.0%, mainly
due to a -4.1% decline in the Business Vans & Trucks activity, due to a strategic
focus on extending utilization and rental duration and the rapid growth of the
InterRent segment.
Adjusted Corporate EBITDA3 rose by +2.7% at constant exchange rates to
€56.4 million, compared with €54.7 million at constant exchange rates in the first
half of 2016.
Corporate net debt continued to decrease to reach €104 million as of June 30,
2017 (compared with €220 million as of June 30, 2016) as a result of the Group’s
strong free cash flow generation and its recent capital increase.
Europcar has confirmed that 2017 will be a year of substantial growth and has
reiterated the following four financial objectives: i) organic revenue growth of
more than +3%; ii) an adjusted corporate EBITDA margin (excluding New
Mobility Solutions) of more than 11.8%; iii) a Corporate Operating Free Cash
Flow conversion rate of more than 50%; and iv) a dividend payout ratio
exceeding 30%.
The two 2020 targets announced in October 2016 were confirmed: i) revenue
exceeding €3 billion; ii) an adjusted corporate EBITDA margin (excluding New
Mobility Solutions) of more than 14%.
FINTRAX (fully consolidated)
■ Substantial growth in Europe in the first half of 2017
In the first half of 2017, Fintrax benefited from favorable market trends, driven
by an increase in tourist spending in most European countries. Company
performance has been solid since the start of the year, reflecting a substantial
increase in its market share, both in Tax Free Shopping and Dynamic Currency
Conversion. It also continues to invest heavily in new market opportunities.
Fintrax posted revenue of €117 million in the first half of 2017, up +28.3% on a
reported basis and +29.9% at constant scope and exchange rates compared
with the first half of 2016.
In the Tax Free Shopping market, refunded voucher volumes rose +29%, thanks
to strong growth in tourist flows, particularly in the UK, Italy and Spain, and the
positive impact of new contracts signed in Europe. Sales to tourists from Asia
and the U.S. rose substantially, while sales to Russian and Brazilian tourists posted
a solid recovery.
The Dynamic Currency Conversion segment continued to report positive results
in the first half of 2017, mainly driven by strong tourist flows in the UK and new
customer positioning in Latin America and Europe.
Group EBITDA for the first six months of 2017 amounted to €15.8 million, up
+11.8% on the year-ago period, and +22.4% at constant scope and exchange
rates. Net debt amounted to €271 million as of June 30, 2017.
Fintrax continues to support its key strategic pillars, including digital
development, sales dynamism and international expansion, as illustrated by
3 Adjusted Corporate EBITDA is defined as current operating income before depreciation and amortization not related to the fleet, and after deduction
of the interest expense on certain liabilities related to rental fleet financing.

19
the announcement in March of a strategic partnership with a subsidiary of the
Lotte Group to become a joint shareholder of CubeRefund, a tax free operator
in the Korean market.
LES PETITS CHAPERONS ROUGES (equity-accounted as of April 1, 2016)
■ Steady organic and external growth
Les Petits Chaperons Rouges revenue is €94 million in the first half of 2017, up
+17.6% on a reported basis compared to the year-ago period, and +9.4% at
constant scope and exchange rates.
The group’s development in France continues to be driven by the brisk rate of
new nursery openings, with the number of certified places up by nearly +12%.
In terms of early learning, the group has increased the number of multi-sensory
play areas in its nurseries. In view of the benefits of early learning for children
and the enthusiasm of both parents and professionals, Les Petits Chaperons
Rouges has already equipped 40 nurseries and is planning to equip the same
number again by the end of 2017. Nearly one third of all nurseries will be
equipped by the end of the year.
Some one hundred nurseries are being certified by SGS with respect to the
standards of Crèch’Expert, which validates the welcome and service quality.
Les Petits Chaperons Rouges pioneered this quality approach initiative in
France.
The group also continues to consolidate the French market, through selective
acquisitions of smaller groups throughout France, and in particular the
acquisition of 16 micro-nurseries from the Campacrèches group in the second
quarter of 2017.
Internationally, development of the Infanterix network in Germany and Magic
Nurseries in the UK is on track.
MONCLER (deconsolidated as of October 14, 2016)
Moncler was deconsolidated from the Eurazeo scope as of October 14, 2016
based on the published June 30, 2016 accounts (as of September 30, 2016 for
economic revenue) after the loss of significant influence following the sale of a
share block in September 2016 and the repercussions on the company’s
governance.
NEOVIA (equity-accounted)
■ Growth driven by Mexico and Additives and Ingredients
Neovia reported revenue of €867 million in the first half of 2017 (calendar year),
up +11.1% on a reported basis compared to the year-ago period, and +1.2%
at constant scope and exchange rates.
EBITDA rose by +21.8% on a reported basis to €56 million over the period. The
EBITDA margin stood at 6.5%, up 57 basis points compared to the first half of
20
2016. At constant scope and exchange rates, EBITDA rose +4.6%, due to the
excellent performance of (i) the group’s business in Mexico, (ii) its main
subsidiary in the global Additives & Ingredients market, and (iii) the EMEA zone,
thanks to solid performances by Exports, Belgium (larval feed aquaculture),
Spain and Portugal (Premix). Unfavorable market conditions in France continue
to hamper earnings. Brazil returned to historical sales levels in the last months of
the period, despite the effects of the local economic and political crisis. Asia
also posted positive results, despite difficulties in the porcine market in Vietnam.
In addition to 2017 first-quarter acquisitions, Neovia continues to play its part in
the ramp-up of French innovation with the launch of its “Farm of the Future”
project and its contribution to the creation of the Applifarm platform. This
platform will use various data sources (management, feed, dairy operations,
livestock advice, breeding, performance monitoring, sanitary advice, etc.) to
help companies in the ruminant sector create new services for livestock
breeders and farmers.
Neovia’s net debt stood at €173.2 million as of June 30, 2017, compared to
€176.8 million as of December 31, 2016. Operating cash flow generated over
the half-year financed external growth cash flows, and investments to improve
production tools, particularly facilities. As of June 30, 2017, pro forma of the
acquisitions, debt leverage stood at 1.6x.
NOVACAP (fully consolidated as of June 30, 2016)
■ Transformational acquisitions and robust organic growth
The second quarter of 2017 was marked by a sustained external growth policy.
On June 20, 2017, the company announced the transformational acquisition
of a 51.8% share block in the French listed company PCAS, specializing in the
development and production of complex molecules for Life Sciences and
Specialty Chemicals Markets. Novacap then filed a tender offer for the
remaining capital. Following this tender offer, Novacap holds 76% of PCAS. This
deal was financed by an equity injection of €131 million from all shareholders
(€56 million for Eurazeo) and debt. PCAS generated net sales of €192 million
and EBITDA of €27 million in 2016. It employs close to 1,000 people.
Novacap also announced the signing of the acquisition of Chemoxy, a
manufacturer of specialty chemicals and environmentally-friendly solvents,
based in the UK, the acquisition of ID Bio, a producer of natural ingredients for
cosmetics, and the acquisition of H2B, a manufacturer of fractionated blood
products for in vitro diagnosis, which joined the Novacap group in May 2017.
These combinations fit in perfectly with Novacap’s strategy to create a global
leader in the pharmaceutical synthesis and fine specialty chemicals industry,
with an international footprint, a large products portfolio and an extensive
range of technologies.
As of June 30, 2017, Novacap posted revenue of €390.9 million, up +24.4% on a
reported basis and +24.0% at constant scope and exchange rates compared
to the first half of 2016. Group growth benefits from the excellent showing of the
Performance Chemicals division, which enjoys strong demand for specialty

21
solvents. Group EBITDA in the first half of 2017 was €55.8 million, up +21.9% on a
reported basis, and +18.2% at constant scope and exchange rates.
Neovia’s net debt stood at €542 million as of June 30, 2017, compared to
€427 million as of December 31, 2016, following the numerous external growth
transactions carried out during the period. Pro forma of the acquisitions, debt
leverage stood at 4.1x LTM EBITDA compared to 4.7x as of December 31, 2016.
SOMMET EDUCATION (fully consolidated as of July 1, 2016)
■ Sommet Education successfully transitions to independence
Sommet Education, a group created following the 2016 acquisition of two Swiss
hospitality and luxury schools, is poised to complete its transition towards full
independence and will benefit from all the resources necessary to its smooth
operation.
Over the first six months of the year, Sommet Education finalized the make-up
of its Management team, recruiting the CEO, COO, VP Marketing-Enrollment,
VP Strategic Planning and CIO, among other positions. In addition, the
Financial Shared Service Center, created in January and close to the Marbella
campus in Spain, came online a few months ago. The Group completed its IT
transition in April and now has its own systems, which run independently of the
network operated by the Laureate Group, the schools’ previous owner.
Sommet Education continues to be impacted by the declining number of new
students in recent years due to under-investment in marketing and
communication. The new management team will strive to revitalize the group’s
business by improving its student recruitment and admission processes. A major
milestone was reached with the creation of a London marketing division and
the hiring of a new VP Marketing & Enrollment.
In the first half of 2017, Sommet Education posted restated revenue of 78.6
million Swiss francs, down -10.2% compared to the same period in 2016. The
group reported restated EBITDA of 12.5 million Swiss francs, a -22.1% decline
compared to 2016 (16.0 million Swiss francs).
Sommet Education net debt amounted to 131.4 million Swiss francs as of June
30, 2017, i.e. a leverage of 6.1x restated EBITDA.

22
Eurazeo PME
In the first half of 2017, Eurazeo PME successfully closed its fundraising for
Eurazeo PME, as well as one divestment (Colisée) and two acquisitions (Smile
and In’Tech Medical). Eurazeo PME also continued to support its companies
with their external growth transactions. Finally, Eurazeo PME companies
reported further robust growth in the half-year.
■ Successful €658 million Eurazeo PME III fundraising
Eurazeo PME successfully closed its third fundraising at €658 million. The Eurazeo
PME III fund significantly increases Eurazeo’s investment capacity following the
success of the Eurazeo PME II fund launched in March 2015 (€520 million,
including €156 million from third-party investors). This third fund comprises
Eurazeo’s equity contribution of €408 million plus €250 million raised from third-
party investors, who had already invested in Eurazeo PME II, and new leading
investors. This transaction forms part of the Eurazeo group strategy to boost
third-party management activity.
The Eurazeo PME III fund has already completed 2 acquisitions, Smile and
In’Tech Medical, for €100 million.
■ Revenue growth of +13% at constant Eurazeo scope for the companies
Eurazeo PME consolidated revenue was €616 million for the half-year ended
June 30, 2017, up +50% on a reported basis, +13% at constant Eurazeo scope
(restated for changes relating to the acquisition of Orolia, MK Direct and
AssurCopro and the divestment of Colisée), and +5% adjusted for external
growth transactions carried out by the companies in 2016 and 2017 and foreign
exchange impacts.
The Colisée group continued to expand (+31% to May 31, 2017, the date of its
exit from the Eurazeo scope). This growth was partly due to the acquisition of
Nouvel Horizon Services and Bien à la Maison. The group acquired a group of
12 facilities in March 2017, and one facility in April 2017. It now has a total of 90
facilities, with 83 in France, 6 in Italy and 1 in Spain.
The Péters Surgical group consolidated the integration of Vectec, acquired in
December 2016, a French manufacturer of disposable medical equipment for
laparoscopic surgery. 2017 first-half revenue for the Péters Surgical group
declined, primarily due to lagging export sales.
Vignal Lighting Group reported a revenue surge, both in Europe and the U.S.,
with growth of +25% in the first half of 2017, and +16% on a constant scope basis
adjusted for the CEA acquisition. The group is pursuing its transformation with
the ramp-up of its new industrial center in Corbas (productivity gains, R&D), the
current opening of a plant in China and the signing of several local contracts.

23
Flash Europe revenue rose +20% in the first half of 2017 on a constant scope
basis. The group’s core business, Premium Freight, has developed substantially
both in France and internationally. Following the July 2016 sale of its non-core
subsidiary Biologistic and the January 2017 acquisition of EF Express, a player in
the same segment mainly active in Germany, Flash Europe pursued its
development with the March 2017 acquisition of Upela, an e-shipping specialist
in France and internationally. At the same time, Flash Europe is boosting its
investments in the digital platform currently being rolled out and is studying the
possibility of further build-ups.
MK Direct group, the cross-channel leader in home linen in France with the
Linvosges and Françoise Saget brands, posted steady revenue in the first half
of 2017. Linvosges will open in Germany this year in the wake of the 2015 launch
of Françoise Saget. Several external growth transactions are also being
considered.
The Orolia group, global leader in reliable positioning, timing and navigation
products and solutions, posted a solid performance in the first half of 2017, with
growth of +17%. The group continued its roll-out with the April 18, 2017 purchase
of Netwave, leader in the Voyage Data Recorder sector for the maritime
market.
The AssurCopro group, the French leader in joint ownership insurance
brokerage, is consolidated by Eurazeo PME since January 1, 2017. The group
has carried out three external growth acquisitions since Eurazeo PME’s
investment: InterAssurances group, a French specialist in rent guarantee
insurance and landlord home insurance, in December 2016, the Jacques
Boulard brokerage firm in March 2017 and a Parisian brokerage firm in June
2017. For the period ended June 30, 2017, AssurCopro revenue rose +4% at
constant Eurazeo scope, and +7.4% on an historical scope basis.
Dessange International recorded steady revenue over the period. The group
continues to develop, with the purchase of a master franchise in the U.S. at the
start of the year.
Léon de Bruxelles revenue grew +1% compared to June 30, 2016, clearly
outperforming the market, particularly in the French regions and Greater Paris.
Finally, the Smile group, in which Eurazeo PME invested on May 30, 2017, will be
consolidated from July 1, 2017.

24
Eurazeo Croissance
■ 2017 first-half results
Farfetch again posted very steady growth in the first half of 2017 and now has
500 stores and 200 brands partnering its platform. It has announced a strategic
partnership with JD.com, the e-commerce leader in China behind Alibaba. The
partnership will draw on JD.com’s logistics and technological expertise and its
services on social networks to develop Farfetch’s reputation in China and
create the first luxury goods e-commerce platform in China. JD.com has also
invested $397 million in Farfetch to support its expansion.
In the first half of 2017, PeopleDoc stepped up its development, particularly in
the United States with a sharp increase in orders on last year. Growth was driven
by the signing of major contracts in the U.S. and Europe.
Vestiaire Collective pursued its international expansion and intensified its
marketing efforts, boosted by the €58 million fundraising completed in early
2017. The company has also announced the opening of a second logistics
center in France to absorb its business growth. After Paris, the new center will
be based in Tourcoing.
Younited Credit more than doubled its revenue in the first half of 2017, due to
excellent performance in France and contributions from Italy (opened in 2016)
and Spain (launched in March 2017). The group is currently getting ready to
launch new products in new regions over the next 12 months.
For IES Synergy, the first half of 2017 was marked by new growth opportunities,
particularly in the electric bus market and in North America.

25
Eurazeo Patrimoine
ANF IMMOBILIER (fully consolidated)
■ 2017 first-half results hampered by asset rotation at the end of 2016
In the first half of 2017, ANF Immobilier posted gross rental revenue of €24.4
million in accordance with IFRS. This represents a -5% decrease, mainly
attributable to high asset rotation in 2016 (mature low-yield assets sold for €91
million) and a difficult context in Marseille. On a constant scope basis, revenue
declined -6% to €22.2 million.
Recurring EBITDA stood at €16.1 million, down -8% primarily due to the decline
in rental income. Adjusted EPRA4 Earnings amounted to €8.2 million or €0.45 per
share, i.e. a +4% increase compared to the first half of 2016 due to a reduction
in finance costs.
The asset value as of June 30, 2017 is €1,015 million, illustrating the impact of fair
value remeasurement and investments of €39 million over the period.
As of June 30, 2017, the triple Net Asset Value stood at €20.95 per share,
according to the EPRA method, reflecting the fair value net loss of -€91.5 million
stemming from the Marseille assets included in the scope of the Primonial REIM
offering.
The Icade takeover bid at €22.15 per share generates a +5.7% premium
compared to the triple Net Asset Value as of June 30, 2017.
CIFA FASHION BUSINESS CENTER (fully consolidated)
■ Results in line with expectations, despite a difficult market environment
Thanks to a tailored marketing strategy and ongoing asset management,
CIFA’s 2017 first-half performance was steady and in line with Eurazeo
Patrimoine’s expectations. Its 2017 second-half results are forecast to decline
slightly due to the departure of certain CIFA 3 tenants that was confirmed at
the end of first half-year.
2017 first-half revenue totaled €9.3 million, up +2.2% compared to the first half
of 2016, and rental income decreased slightly by -1.6% to €7.5 million. The cash
flows generated during the half-year helped to reduce the net debt by
€5.7 million.
The asset value in the Eurazeo financial statements as of June 30, 2017 was
stable compared to December 31, 2016, taking account of ongoing risks
regarding the rental situation in a difficult market context.
4 EPRA (European Public Real Estate Association): calculates Net Recurring Income excluding fair value changes, the impact of divestments and
other non-recurring items.

26
GRAPE HOSPITALITY (fully consolidated as of June 30, 2016)
■ Higher growth and profitability. The work program continues.
Grape Hospitality’s 2017 first-half revenue totaled €109.2 million, unchanged on
the year-ago period. In an environment that is showing signs of improvement,
the new momentum generated by Management across the group since its
creation on June 30, 2016 helped to compensate for the absence in 2017 of
the Euro football tournament organized in France in June 2016, and the impact
of the work carried out in a first group of hotels since the end of 2016.
The refurbishment program, which involved around twenty priority hotels mainly
located in France in the first half of 2017, was rolled out in line with schedule
and budget. The first refurbished hotels were delivered at the end of the first
half year and deliveries will continue until the year-end. At the same time, the
second phase of the refurbishment program involving around thirty hotels will
begin in the second half of 2017.
The Group’s gross operating income (operating revenues - charges), excluding
overheads, rose by +3% compared to the first half of 2016, and by around +4.4%
excluding exceptional items driven by productivity gains and the group’s
effective management.
REDEN SOLAR (formerly Fonroche Solaire, equity accounted as of January 1,
2017)
■ Revenue growth on a constant scope basis and steady development of
new projects
The first half of 2017 was Reden Solar’s first period of business as an independent
group, following its creation by the spin-off of Fonroche’s photovoltaic division
from its other activities in February 2017. Reden Solar is now a pure player in the
photovoltaic energy industry, where it will retain all the projects developed
using an electricity producer-developer model.
The commissioning of the initial phase of the Humacao plant in Puerto Rico, the
first CRE3 plants in France and the construction of the first CRE4 plants
generated a +22.5% million increase in the group’s 2017 first-half operating
income on the year-ago period to €65.1 million.
This business growth reflected 1) increased capitalized production relating to
inter-company construction services for owned capacity and 2) a decline in
revenue to €20 million for the period ended June 30, 2017 due to scope
reductions (exit of biogas and geothermal businesses, sale of Indian and
Kazakh plants). Nevertheless, the recurring portion of this revenue generated
by electricity production increased significantly compared to the first half of
2016, due to the higher yield from plants and the commissioning of new units in
France.
EBITDA rose by more than +3% over the half-year, thanks to the performance
of French plants and the commissioning of new plants (CRE3 in France, phase
1 of the Humacao plant in Puerto Rico), more than absorbing the impacts of
the changes in scope.

27
Eurazeo Development (4% of NAV as of June 30, 2017)
Eurazeo Development encompasses the new initiatives undertaken by Eurazeo
to expand and enhance its assets and boost its growth. These initiatives include
coordinating the search for new investment opportunities in Europe and the
United States, setting up and managing platform investments in new business
segments, and managing funds for major international institutional investors.
Finally, the division holds Eurazeo’s commitment in Raise, also synonymous with
societal commitments in line with the group’s values.
■ Substantial growth in third party management revenue with €750 million in
funds raised over the last twelve months
At the end of July, Eurazeo PME reached its €658 million hard cap on its third
fund with the backing of Eurazeo Development. This includes €250 million on
behalf of third parties.
The Eurazeo Capital and Eurazeo PME fundraising will provide recurring annual
revenue flows estimated at €14 million, pro forma of this transaction and
excluding performance fees. Management fees of €5 million were collected
over the first half of 2017.
Overall, Eurazeo’s various entities now manage third-party private equity funds
with €1 billion in assets under management.
■ Steady international diversification of the deal flow
In the first half of 2017, Eurazeo continued to pursue its European and North
American origination strategy. It identified 397 new targets for Eurazeo Capital,
28% of which are North American, and 72% of which are European, thereby
continuing to diversify deal origination for the group.
■ iM Square, growth vector for asset managers
Founded in 2015 with Amundi and La Maison, iM Square is a leading investment
and development platform dedicated to asset management. IM Square’s
partners have continued to develop the group of assets under management,
bringing the total to €20 billion at the end of May 2017 (+17% compared to June
30, 2016).
■ Capzanine continues to expand
Since the successful closing of the Capzanine 4 fund, completed in October
2016 after reaching its €350 million hard-cap, the Capzanine team has
continued to pursue its strategy focused on supporting business leaders and
MBO funds, and investing in fast-growing businesses with proven sales and
emerging profitability.
During the first half of 2017, Capzanine boosted assets under management by
50% on December 31, 2016 (estimate) to €2.1 billion and invested in five new
investments and two build-ups, including its first investments via the Capzanine
4 fund.

28
7. Subsequent events
■ Eurazeo Capital: signature of an agreement to invest in Iberchem
On July 24, 2017, Eurazeo acquired Iberchem, a global producer of fragrances
and flavors addressing national and regional brands in emerging markets, for
an enterprise value of €405 million. Eurazeo has invested approximately €270
million to become the majority shareholder (nearly 70% of capital) alongside
the existing management team.
■ Acquisition of In’Tech Medical by Eurazeo PME
On July 12, 2017, Eurazeo PME acquired the In’Tech Medical group, a specialist
in high precision orthopedic surgical instruments. The company designs and
manufactures orthopedic surgical instruments for knee, hip, shoulder and spinal
surgeries. It is the world number 1 in this market. The investment totaled
€68 million, €15 million of which will be syndicated to co-investors in the coming
months. With 2016 revenue of €55 million, up more than +15% annually over 15
years, the group generates nearly two thirds of its sales in the U.S.
■ Exclusive negotiations with Icade to sell the stake in ANF Immobilier
On July 24, 2017, Eurazeo announced that it had entered into exclusive
negotiations with the real estate group Icade to sell its majority stake in ANF
Immobilier - 50.48% of share capital and 53.73% of voting rights. This sale will be
followed by an Icade takeover bid for the remaining capital. The proposed
takeover price is €22.15 per share, i.e. a premium of 10.2% on the average price
over the past three months.
In an intrinsically linked process, ANF Immobilier also entered into exclusive
negotiations with Primonial REIM, a leading French real estate investment
manager, for the sale of ANF Immobilier’s historic housing and commercial
portfolio, mainly located in Marseille, and a building in Lyon, for €400 million.
Linking ANF Immobilier with a tertiary real estate specialist such as Icade will
accelerate ANF Immobilier’s strategy centered on tertiary real estate in
regional municipalities, as sector consolidation advances.
Eurazeo would realize a disposal gain of €213 million on this sale, an investment
multiple of 2.3x and an IRR of 13%.
The employee representative bodies and the decision-making bodies
concerned will be consulted regarding these transactions. Given the time
required for these consultations and decisions, the parties believe the
transactions could be finalized in the fourth quarter of 2017. The takeover bid
for the remaining ANF capital would be filed subsequent to the sale of the
controlling stake.

29
8. Transactions with related parties
The remuneration set for members of the Executive Board for 2017 and share
transactions covered by Article L. 621-18-2 of the Financial and Monetary Code
performed by these individuals are presented in the section, “Compensation
and Other Benefits received by Corporate Officers” of the Executive Board’s
report, in the 2016 Registration Document filed with the AMF on April 6, 2017.
9. Risk management and disputes
The Group’s businesses are exposed to a number of macro-economic, sector,
operational, market, industrial, environmental and legal risks. The main risk
factors facing the Group are detailed in the section “Risk Management – Risk
factors and insurance” of the Executive Board’s Report, in the 2016 Registration
Document filed with the AMF on April 6, 2017. There were no material changes
in these risks during the first six months of 2017.
30
II. 2017 Condensed Interim Consolidated Financial Statements
CONDENSED INTERIM CONSOLIDATED FINANCIAL STATEMENTS
HALF-YEAR ENDED JUNE 30, 2017
Consolidated Statement of Financial Position .......................... 31 Consolidated Income Statement .. 32
Consolidated Statement of Other Comprehensive Income ................ 33
Consolidated Statement of Changes in Equity ......................... 34
Consolidated Statement of Cash Flows ............................................... 35 Notes to the Consolidated Financial Statements ..................... 36
31
Consolidated Statement of Financial Position
06/30/2017 06/30/2016 12/31/2016
net net net
ASSETS
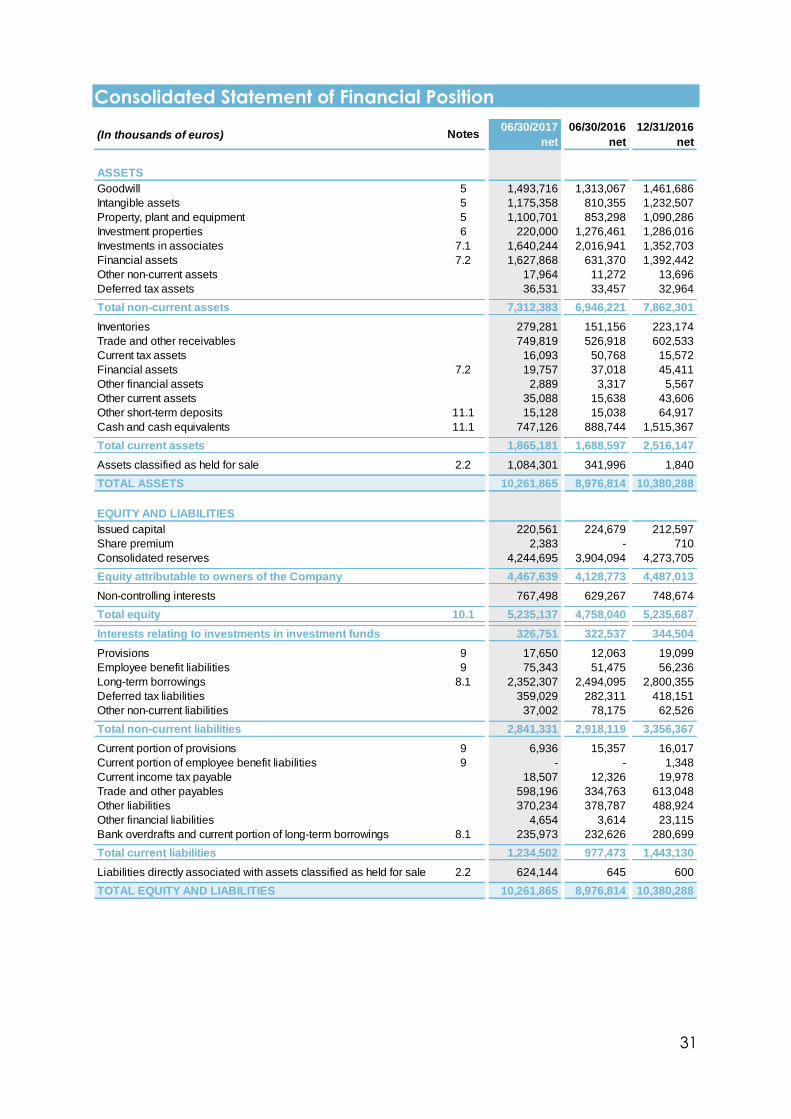
Goodwill 5 1,493,716 1,313,067 1,461,686
Intangible assets 5 1,175,358 810,355 1,232,507
Property, plant and equipment 5 1,100,701 853,298 1,090,286
Investment properties 6 220,000 1,276,461 1,286,016
Investments in associates 7.1 1,640,244 2,016,941 1,352,703
Financial assets 7.2 1,627,868 631,370 1,392,442
Other non-current assets 17,964 11,272 13,696
Deferred tax assets 36,531 33,457 32,964
Total non-current assets 7,312,383 6,946,221 7,862,301
Inventories 279,281 151,156 223,174
Trade and other receivables 749,819 526,918 602,533
Current tax assets 16,093 50,768 15,572
Financial assets 7.2 19,757 37,018 45,411
Other financial assets 2,889 3,317 5,567
Other current assets 35,088 15,638 43,606
Other short-term deposits 11.1 15,128 15,038 64,917
Cash and cash equivalents 11.1 747,126 888,744 1,515,367
Total current assets 1,865,181 1,688,597 2,516,147
Assets classified as held for sale 2.2 1,084,301 341,996 1,840
TOTAL ASSETS 10,261,865 8,976,814 10,380,288
EQUITY AND LIABILITIES
Issued capital 220,561 224,679 212,597
Share premium 2,383 - 710
Consolidated reserves 4,244,695 3,904,094 4,273,705
Equity attributable to owners of the Company 4,467,639 4,128,773 4,487,013
Non-controlling interests 767,498 629,267 748,674
Total equity 10.1 5,235,137 4,758,040 5,235,687
Interests relating to investments in investment funds 326,751 322,537 344,504
Provisions 9 17,650 12,063 19,099
Employee benefit liabilities 9 75,343 51,475 56,236
Long-term borrowings 8.1 2,352,307 2,494,095 2,800,355
Deferred tax liabilities 359,029 282,311 418,151
Other non-current liabilities 37,002 78,175 62,526- - -
Total non-current liabilities 2,841,331 2,918,119 3,356,367
Current portion of provisions 9 6,936 15,357 16,017
Current portion of employee benefit liabilities 9 - - 1,348
Current income tax payable 18,507 12,326 19,978
Trade and other payables 598,196 334,763 613,048
Other liabilities 370,234 378,787 488,924
Other financial liabilities 4,654 3,614 23,115
Bank overdrafts and current portion of long-term borrowings 8.1 235,973 232,626 280,699
Total current liabilities 1,234,502 977,473 1,443,130
Liabilities directly associated with assets classified as held for sale 2.2 624,144 645 600
TOTAL EQUITY AND LIABILITIES 10,261,865 8,976,814 10,380,288
Notes(In thousands of euros)

32
Consolidated Income Statement
06/30/2017 06/30/2016 2016
(6 months) (6 months) (12 months)
Revenue 4.1 1,568,619 716,064 2,180,958
Other income 4.2 220,609 129,874 842,961
Cost of sales (651,605) (285,550) (879,273)
Taxes other than income tax (30,661) (15,614) (32,974)
Employee benefits expense (366,203) (180,542) (517,998)
Administrative expenses (318,140) (137,643) (459,268)
Depreciation and amortization (excluding intangible assets
relating to acquisitions)(56,142) (16,350) (69,547)
Additions to/(reversals of) provisions 2,325 3,618 3,397
Other operating income and expenses (11,838) (891) (34,070)
Operating income before other income and expenses 356,964 212,966 1,034,186
Amortization of intangible assets relating to acquisitions (22,962) (12,469) (34,462)
Impairment of goodwill/investments in associates - - (180,342)
Other income and expenses 4.3 (60,456) (50,423) (80,908)
Operating income 273,546 150,074 738,474
Income and expenses on cash and cash equivalents and
other financial instrument
8.2(957) (2,144) 7,492
Finance costs, gross 8.2 (78,042) (57,611) (133,106)
Finance costs, net (78,999) (59,755) (125,614)
Other financial income and expenses 9.4 (1,789) (16,947) (22,510)
Share of income of associates 7.1 (6,014) 15,446 90,417
Income tax expense (25,837) (2,661) (32,162)
NET INCOME (LOSS) before net income (loss) from
discontinued operations160,908 86,157 648,604
Net income (loss) from discontinued operations (1,024) (926) (5,596)
NET INCOME (LOSS) 159,884 85,231 643,008
Net income (loss) attributable to non-controlling interests 23,442 11,731 123,261
NET INCOME (LOSS) ATTRIBUTABLE TO OWNERS OF
THE COMPANY136,442 73,500 519,747
Earnings per share 12.2 2.03 1.04 7.28
Diluted earnings per share 12.2 2.03 1.04 7.28
(In thousands of euros) Notes

33
Consolidated Statement of Other Comprehensive Income
Pursuant to IAS 1 revised, Eurazeo is required to present total income and
expenses recognized indirectly (that is through net income (loss) for the period)
and directly in equity:
The change in the fair value reserve
reflects changes in the fair value of
non-consolidated assets.
The change in hedging reserves
reflects fair value gains and losses on
derivatives qualifying for hedge
accounting.
Actuarial gains and losses arising on
the measurement of employee
benefits correspond to the impact
of changes in assumptions
(obligation discount rate, pay
increase rate, pension increase rate
and expected return on plan assets)
used to value defined benefit plan
obligations.
06/30/2017 06/30/2016 2016(In thousands of euros) (6 months) (6 months) (12 months)
Net income for the period 159,884 85,231 643,008
Fair value gains (losses) on available-for-sale financial assets 35,425 (723) 2,038
Fair value reserves reclassified to profit or loss - - -
Total change in fair value reserves 35,425 (723) 2,038
Tax impact - - -
Fair value reserve, net (potentially reclassifiable) 35,425 (723) 2,038
Gains (losses) arising on the fair value measurement of hedging instruments 9,814 (20,657) (11,089)
Hedging reserves reclassified to profit or loss 8.2 2,868 408 8,431
Total change in hedging reserves 12,682 (20,249) (2,658)
Tax impact (1,453) 3,383 725
Hedging reserves, net (potentially reclassifiable) 11,229 (16,866) (1,933)
Recognition of actuarial gains and losses in equity (4,162) (10,736) 6,950
Tax impact (860) 243 2,618
Actuarial gains and losses, net (not reclassifiable) (5,022) (10,493) 9,568
Gains (losses) arising on foreign currency translation (29,720) (13,146) 1,863
Foreign currency translation reserves reclassified to profit or loss - 7,960 895
Foreign currency translation reserves (potentially reclassifiable) (29,720) (5,186) 2,758
TOTAL INCOME AND EXPENSES RECOGNIZED DIRECTLY IN EQUITY 11,912 (33,268) 12,431
TOTAL RECOGNIZED INCOME AND EXPENSES 171,796 51,963 655,439
Attributable to:
- Eurazeo shareholders 153,543 46,477 530,608
- Non-controlling interests 18,253 5,486 124,831
Notes

34
Consolidated Statement of Changes in Equity
(In thousands of euros) Issued capital
Share
premium
Fair value
reserves
Hedging
reserves
Foreign
currency
translation
reserves
Share-based
payment
reserves
Treasury
shares
Actuarial gains
and losses Deferred tax
Retained
earnings
Total equity
attributable to
owners of the
Company
Non-
controlling
interests Total equity
As of January 1, 2016 213,980 - 89,517 (19,949) 7,591 109,091 (86,965) (130,795) 13,434 4,121,772 4,317,676 429,712 4,747,388
Net income for the period - - - - - - - - - 73,500 73,500 11,731 85,231
Gains (losses) recognized directly
in equity- - (714) (15,182) (4,483) - - (9,672) 3,028 - (27,023) (6,245) (33,268)
Total recognized income and
expenses- - (714) (15,182) (4,483) - - (9,672) 3,028 73,500 46,477 5,486 51,963
Capital increase 10,699 - - - - - - - - (10,699) - - -
Treasury shares - - - - - - 8,452 - - (83,063) (74,611) - (74,611)
Dividends paid to shareholders - - - - - - - - - (159,305) (159,305) (13,154) (172,459)
Transactions with non-controlling
interests- - - - - - - - - (7,764) (7,764) 210,779 203,015
Other changes - - - - - 3,620 - - (938) 3,618 6,300 (3,556) 2,744
As of June 30, 2016 224,679 - 88,803 (35,131) 3,108 112,711 (78,513) (140,467) 15,524 3,938,059 4,128,773 629,267 4,758,040
Net income for the period - - - - - - - - - 446,248 446,248 111,530 557,777
Gains (losses) recognized directly
in equity- - 2,761 13,356 4,867 - - 17,352 (453) - 37,883 7,816 45,699
Total recognized income and
expenses- - 2,761 13,356 4,867 - - 17,352 (453) 446,248 484,131 119,346 603,477
Capital increase (10,699) - - - - - - - - 10,699 - - -
Treasury shares (1,383) 710 - - - - 2,165 - - (124,950) (123,457) - (123,457)
Dividends paid to shareholders - - - - - - - - - - - (3,486) (3,486)
Transactions with non-controlling
interests- - - - - - - - - (5,042) (5,042) 89,646 84,604
Other changes - - - - - 2,633 - - (985) 960 2,609 (86,099) (83,490)
As of December 31, 2016 212,597 710 91,564 (21,775) 7,975 115,344 (76,348) (123,115) 14,086 4,265,973 4,487,013 748,674 5,235,687
Net income for the period - - - - - - - - - 136,442 136,442 23,442 159,884
Gains (losses) recognized directly
in equity- - 35,425 8,984 (20,867) - - (4,557) (1,884) - 17,101 (5,189) 11,912
Total recognized income and
expenses- - 35,425 8,984 (20,867) - - (4,557) (1,884) 136,442 153,543 18,253 171,796
Capital increase 10,680 1,673 - - - - - - - (12,352) - - -
Treasury shares (2,716) - - - - - (24,183) - - (74,095) (100,994) - (100,994)
Dividends paid to shareholders - - - - - - - - - (78,707) (78,707) (23,247) (101,954)
Transactions with non-controlling
interests- - - - - - - - - 3,081 3,081 36,366 39,447
Other changes - - - - - 6,643 - - - (2,940) 3,703 (12,548) (8,845)
As of June 30, 2017 220,561 2,383 126,989 (12,791) (12,892) 121,987 (100,531) (127,672) 12,202 4,237,403 4,467,639 767,497 5,235,137
4,244,696
35
Consolidated Statement of Cash Flows
(In thousands of euros) Notes 06/30/2017 06/30/2016 12/31/2016
(6 months) (6 months) (12 months)
NET CASH FLOWS FROM OPERATING ACTIVITIES
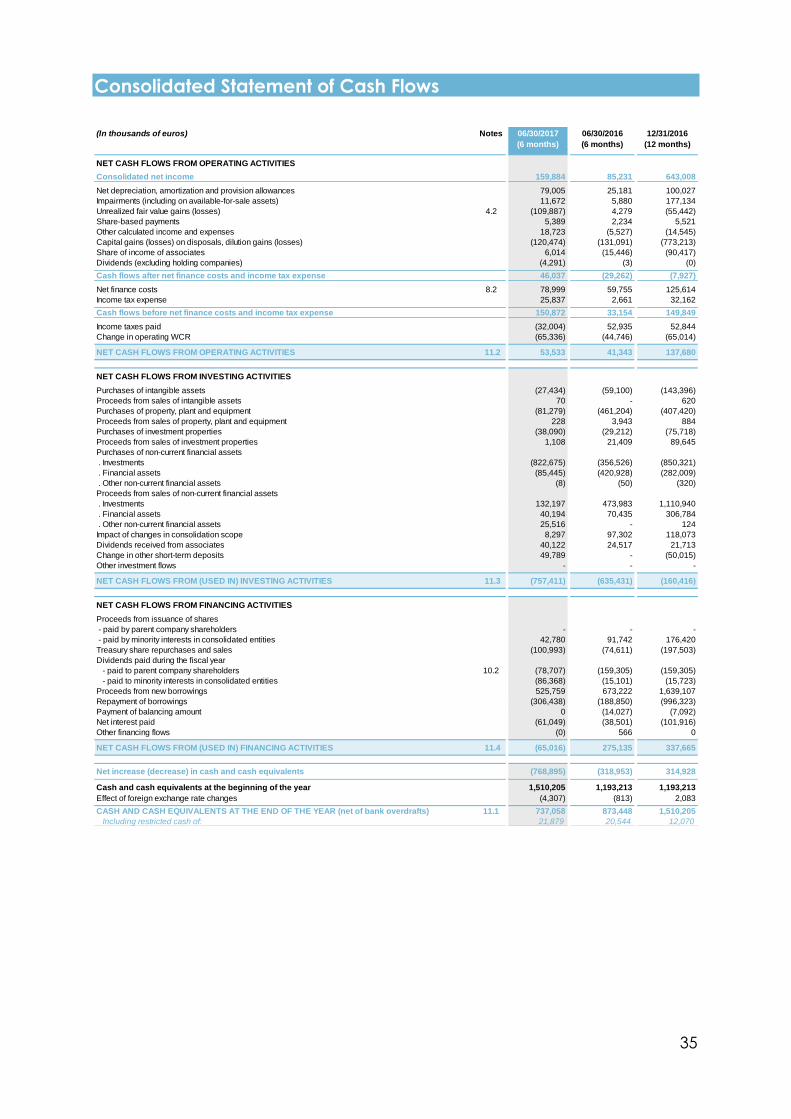
Consolidated net income 159,884 85,231 643,008
Net depreciation, amortization and provision allowances 79,005 25,181 100,027
Impairments (including on available-for-sale assets) 11,672 5,880 177,134
Unrealized fair value gains (losses) 4.2 (109,887) 4,279 (55,442)
Share-based payments 5,389 2,234 5,521
Other calculated income and expenses 18,723 (5,527) (14,545)
Capital gains (losses) on disposals, dilution gains (losses) (120,474) (131,091) (773,213)
Share of income of associates 6,014 (15,446) (90,417)
Dividends (excluding holding companies) (4,291) (3) (0)
Cash flows after net finance costs and income tax expense 46,037 (29,262) (7,927)
Net finance costs 8.2 78,999 59,755 125,614
Income tax expense 25,837 2,661 32,162
Cash flows before net finance costs and income tax expense 150,872 33,154 149,849
Income taxes paid (32,004) 52,935 52,844
Change in operating WCR (65,336) (44,746) (65,014)
NET CASH FLOWS FROM OPERATING ACTIVITIES 11.2 53,533 41,343 137,680
NET CASH FLOWS FROM INVESTING ACTIVITIES
Purchases of intangible assets (27,434) (59,100) (143,396)
Proceeds from sales of intangible assets 70 - 620
Purchases of property, plant and equipment (81,279) (461,204) (407,420)
Proceeds from sales of property, plant and equipment 228 3,943 884
Purchases of investment properties (38,090) (29,212) (75,718)
Proceeds from sales of investment properties 1,108 21,409 89,645
Purchases of non-current financial assets
. Investments (822,675) (356,526) (850,321)
. Financial assets (85,445) (420,928) (282,009)
. Other non-current financial assets (8) (50) (320)
Proceeds from sales of non-current financial assets
. Investments 132,197 473,983 1,110,940
. Financial assets 40,194 70,435 306,784
. Other non-current financial assets 25,516 - 124
Impact of changes in consolidation scope 8,297 97,302 118,073
Dividends received from associates 40,122 24,517 21,713
Change in other short-term deposits 49,789 - (50,015)
Other investment flows - - -
NET CASH FLOWS FROM (USED IN) INVESTING ACTIVITIES 11.3 (757,411) (635,431) (160,416)
NET CASH FLOWS FROM FINANCING ACTIVITIES
Proceeds from issuance of shares
- paid by parent company shareholders - - -
- paid by minority interests in consolidated entities 42,780 91,742 176,420
Treasury share repurchases and sales (100,993) (74,611) (197,503)
Dividends paid during the fiscal year
- paid to parent company shareholders 10.2 (78,707) (159,305) (159,305)
- paid to minority interests in consolidated entities (86,368) (15,101) (15,723)
Proceeds from new borrowings 525,759 673,222 1,639,107
Repayment of borrowings (306,438) (188,850) (996,323)
Payment of balancing amount 0 (14,027) (7,092)
Net interest paid (61,049) (38,501) (101,916)
Other financing flows (0) 566 0
NET CASH FLOWS FROM (USED IN) FINANCING ACTIVITIES 11.4 (65,016) 275,135 337,665
Net increase (decrease) in cash and cash equivalents (768,895) (318,953) 314,928
Cash and cash equivalents at the beginning of the year 1,510,205 1,193,213 1,193,213
Effect of foreign exchange rate changes (4,307) (813) 2,083
CASH AND CASH EQUIVALENTS AT THE END OF THE YEAR (net of bank overdrafts) 11.1 737,058 873,448 1,510,205
Including restricted cash of: 21,879 20,544 12,070

36
Notes to the Consolidated Financial Statements
NOTE 1 General principles .............................. 37 1.1. Basis of preparation of the
consolidated financial statements ...... 37 1.2. Critical accounting estimates and
judgments ................................................ 39 NOTE 2 CONSOLIDATION SCOPE .................. 40
2.1. Changes in consolidation scope ......... 40 2.2. IFRS 5 reclassification - group of
assets classified as held for sale ........... 41 NOTE 3 Segment reporting ............................. 43
3.1. Segment reporting as of June 30,
2017 ........................................................... 44 3.2. Segment reporting as of June 30,
2016 ........................................................... 44 3.3. Segment reporting as of December
31, 2016 ..................................................... 45 NOTE 4 Operating data .................................... 46
4.1. Revenue ................................................... 46 4.2. Other income .......................................... 46 4.3. Operating income and other
income and expenses ........................... 47 NOTE 5 Intangible assets and Property, plant and equipment ........................................... 47
5.1. Goodwill, intangible assets and
property, plant and equipment ........... 47 5.2. Impairment losses on fixed assets ......... 48
NOTE 6 Investment properties ........................ 49
6.1. Real estate appraisals ........................... 49 NOTE 7 Associates and financial assets ........ 50
7.1. Investments in associates ...................... 50 7.2. Financial assets ....................................... 51
NOTE 8 Financing and financial instruments ......................................................... 52
8.1. Net debt ................................................... 52 8.2. Net financial expense ............................ 54
NOTE 9 Provisions .......................................... 54 NOTE 10 Equity and earnings per share .......... 55
10.1. Equity ........................................................ 55 10.2. Earnings per share .................................. 56
NOTE 11 Breakdown of cash flows .................. 57 11.1. Cash assets .............................................. 57 11.2. Net cash flows from operating
activities ................................................... 57 11.3. Net cash flows from investing
activities ................................................... 57 11.4. Net cash flows from financing
activities ................................................... 58 NOTE 12 Other information ............................... 58
12.1. Post-balance sheet events ................... 58 12.2. Off-balance sheet commitments ........ 58

37
NOTE 1 GENERAL PRINCIPLES
The Eurazeo condensed interim consolidated financial statements for the half-
year ended June 30, 2017 were drawn up in accordance with IAS 34, Interim
Financial Reporting. Since these financial statements are condensed, they do
not include all the information required under IFRS and should therefore be
read alongside Eurazeo's consolidated financial statements for the year ended
December 31, 2016, drawn up in accordance with IFRS as adopted by the
European Union.
The consolidated financial statements were authorized for publication by the
Eurazeo Executive Board on July 25, 2017. They were reviewed by the Audit
Committee on July 25, 2017 and by the Supervisory Board on July 27, 2017.
Specific characteristics of interim financial statements
At interim period-ends, the income tax expense (current and deferred) is
calculated by applying the estimated annual average effective tax rate for
the current year to taxable income for the period.
Revenue, operating income and all operating performance indicators
(including working capital requirements) are subject to a certain degree of
seasonality, which varies across Group business sectors.
As such, the interim results for the half-year ended June 30, 2017 are not
necessarily indicative of the results which may be expected for fiscal year 2017.
1.1. Basis of preparation of the consolidated financial statements
The accounting principles used to prepare the consolidated financial
statements are compliant with IFRS standards and interpretations as adopted
by the European Union on June 30, 2017, and available on the website:
http://ec.europa.eu/finance/company-reporting/standards-
interpretations/index_en.htm.
The interim consolidated financial statements are prepared on an historical
cost basis, except for investment properties, derivative financial instruments
and available-for-sale financial assets which are measured at fair value. The
financial statements are presented in euros, with thousands omitted.

38
The accounting policies adopted are identical to those used to prepare the
annual consolidated financial statements for the year ended December 31,
2016, as described in the notes to the consolidated financial statements for the
year ended December 31, 2016.
The policies adopted do not differ from the IFRS as published by the IASB. In
addition, the Group did not opt for early application of the following standards
and interpretations not of mandatory application in 2017:
- the amendments to IFRS 10 and IAS 28: Sales or contributions of assets
between an investor and its associate/joint venture, applicable to fiscal
years beginning on or after January 1, 2016 (postponed by the European
Union to an undefined date);
- IFRS 14, Regulatory Deferral Accounts, applicable to fiscal years beginning
on or after January 1, 2016 (not adopted by the European Union);
- the amendment to IAS 7, Disclosure initiatives, applicable to fiscal years
beginning on or after January 1, 2017 (not adopted by the European
Union);
- the amendment to IAS 12, Recognition of Deferred Tax Assets for
Unrealized Losses, applicable to fiscal years beginning on or after January
1, 2017 (not adopted by the European Union);
- IFRS annual improvements (2014-2016 cycle), applicable to fiscal years
beginning on or after January 1, 2017 (for IFRS 12) and on or after January
1, 2018 (for IFRS 1 and IAS 28) (not adopted by the European Union);
- IFRS 15, Revenue from Contracts with Customers, applicable to fiscal years
beginning on or after January 1, 2018;
- IFRS 15 clarification applicable to fiscal years beginning on or after
January 1, 2018 (not adopted by the European Union);
- IFRS 9, Financial Instruments, applicable to fiscal years beginning on or
after January 1, 2018;
- the amendment to IFRS 2, Classification and measurement of share-based
payment transactions, applicable to fiscal years beginning on or after
January 1, 2018 (not adopted by the European Union);
- the amendment to IFRS 4, Applying IFRS 9, Financial Instruments with IFRS
4, Insurance Contracts, applicable to fiscal years beginning on or after
January 1, 2018 (not adopted by the European Union);
- the amendment to IAS 40, Transfers of investment property, applicable to
fiscal years beginning on or after January 1, 2018 (not adopted by the
European Union);
- IFRIC 22, Foreign Currency Transactions and Advance Consideration,
applicable to fiscal years beginning on or after January 1, 2018 (not
adopted by the European Union);
- IFRS 16, Leases, applicable to fiscal years beginning on or after January 1,
2019 (not adopted by the European Union).
- IFRIC 23, Uncertainty over income tax treatment, applicable to fiscal years
beginning on or after January 1, 2019 (not adopted by the European
Union);
- IFRS 17, Insurance contracts, applicable to fiscal years beginning on or
after January 1, 2021 (not adopted by the European Union).
39
Eurazeo is currently determining the potential impacts of these new standards
and standard amendments on the Group's consolidated financial statements.
1.2. Critical accounting estimates and judgments
When preparing its interim consolidated financial statements, Eurazeo must
make estimates and assumptions that affect the carrying amount of certain
assets, liabilities, revenue and expenses and can have an impact on the
information contained in the Notes to the consolidated financial statements.
Eurazeo regularly reviews these estimates and judgments, taking into
consideration past experience and other factors deemed relevant in light of
economic conditions.
Depending on changes in those assumptions or if conditions vary from those
anticipated, amounts in future financial statements could differ from the
current estimates.
1.2.1. Critical accounting estimates and assumptions
The estimates and assumptions adopted for the preparation of the financial
statements for the year ended June 30, 2017 concern:
- the recoverable amount of goodwill and intangible assets with an
indefinite useful life (see Note 5);
- the fair value of investment properties (see Note 6);
- the recoverable amount of investments in associates (see Note 7).
1.2.2. Critical judgments in applying accounting policies
When preparing the financial statements in accordance with Group
accounting policies, Eurazeo makes assumptions, in addition to those involving
the use of estimates, which can have a material impact on amounts
recognized in the financial statements.
These assumptions are identical to those adopted in the consolidated financial
statements for the year ended December 31, 2016 and concern:
- determining the material or prolonged nature of a loss in value of
available-for-sale (AFS) financial assets;
- the recognition of interests held by co-investors in the Eurazeo Partners
and Eurazeo Capital II funds.
40
NOTE 2 CONSOLIDATION SCOPE
Non-consolidated entities are not material compared with the consolidated
financial statements of the companies included in the scope of consolidation.
2.1. Changes in consolidation scope
The main changes in the scope of consolidation in the half-year ended June
30, 2017 are as follows:
EURAZEO PATRIMOINE:
• ANF Immobilier
Eurazeo has entered into exclusive negotiations with the Icade group for the
sale of its majority share in ANF Immobilier. This sale will be followed by an Icade
takeover bid for the remaining capital at a price of € 22.15 per share.
ANF Immobilier’s contribution was transferred to assets and liabilities held for
sale as of June 30, 2017. The investment was valued at a price of €22.15 and
an additional €36.5 million reduction in fair value was recorded in the Eurazeo
consolidated financial statements (see Note 2.2).
• Fonroche / Reden Solar
On February 2, 2017, Fonroche spun-off its businesses into two separate groups:
geothermal and biogas activities (retained by the company’s founders) and
solar activities. Eurazeo (47%) and InfraVia (53%) took over the solar activities,
renaming them Reden Solar.
The new group is equity-accounted, as was the Fonroche group.
EURAZEO PME
On June 20, 2017, Eurazeo PME group sold Colisée for a price of €236 million.
On May 30, 2017, Eurazeo PME also acquired the Smile group, the European
leading integrator and outsourcer of open source solutions. This €47 million
investment provides Eurazeo PME with a majority stake in this group alongside
the CEO and management. As the group’s contribution to the interim financial
statements is not material with respect to Eurazeo’s balance sheet and net
income, it will be fully consolidated from July 1, 2017.
In addition, the AssurCopro group, acquired at the end of September 2016, is
fully consolidated from January 1, 2017.

41
EURAZEO CAPITAL
• Carambar Poulain Kréma
On April 28, 2017, Eurazeo completed its investment in the new group,
Carambar Poulain Kréma (CPK). Eurazeo retained a 68% stake in CPK after
syndication, for an investment of €164 million. Given the operating challenges
associated with this transaction, the group’s entry into the consolidation scope
was pushed back to July 1, 2017, when it will be fully consolidated.
The CPK group’s contribution to the interim financial statements was not
considered material with respect to Eurazeo’s balance sheet and income
statement.
• Trader Interactive (formerly Dominion Web Solutions)
On June 15, 2017, Eurazeo completed the acquisition of the Trader Interactive
group (formerly Dominion Web Solutions), partnering equally with Goldman
Sachs Merchant Banking Division. Eurazeo invested USD 226 million for a 50%
stake.
Given the proximity of the transaction closing date to the period end, the group
will be equity-accounted from July 1, 2017. The shares purchased were
transferred to investments in associates.
2.2. IFRS 5 reclassification - group of assets classified as held for sale
Assets and liabilities classified as held for sale as of June 30, 2017 consist of the
ANF Immobilier group and certain Dessange group assets and liabilities
(Eurazeo PME).
Following the launch of exclusive negotiations for the sale of its stake in ANF
Immobilier, this group’s contribution was transferred to assets and liabilities held
for sale as of June 30, 2017. The ANF Immobilier group assets and liabilities were
measured at the lower of net carrying amount and fair value less costs to sell in
accordance with IFRS 5.
The valuation was based on a price of €22.15 per share, resulting in an
additional reduction in fair value of €36.5 million. Accordingly, the valuation of
investment properties in the first-half of 2017 incorporates a reduction in the fair
value of €46.1 million (€9.6 million based on independent expert appraisals and
an additional €36.5 million based on the overall valuation of the ANF Immobilier
group in accordance with IFRS 5) – see Note 4.2.
Assets and liabilities classified as held for sale as of December 31, 2016 consisted
of investment properties (ANF Immobilier) and certain assets and liabilities of
the Vignal Lighting Group and Dessange (Eurazeo PME).

42
Assets and liabilities classified as held for sale as of June 30, 2016 consisted of
investment properties classified as held for sale (ANF Immobilier), Foncia
securities and bonds and Eurazeo PME group discontinued operations.
The assets and directly associated liabilities reclassified as of June 30, 2017
pursuant to IFRS 5, Non-current Assets held for Sale and Discontinued
Operations, are as follows:
(In thousands of euros) Note 30/06/17 30/06/16 12/31/2016
Non-current assets
Intangible assets 206 - -
Property, plant and equipment 6,175 69 900
Investment properties held for sale 6 1,058,283 29,841 792
Investments in associates 438 102,508 -
Financial assets 565 209,518 -
Other non-current assets - - 148
Current assets
Inventories 13,674 12 -
Trade and other receivables - 36 -
Financial assets 1,327 - -
Other current assets 3,083 - -
Cash and cash equivalents 550 11 -
ASSETS CLASSIFIED AS HELD FOR SALE 1,084,301 341,996 1,840
(In thousands of euros) Note 30/06/17 30/06/16 12/31/2016
Non-current liabilities
Employee benefit liabilities 57 - -
Long-term borrowings 526,928 - -
Deferred tax liabilities 342 - -
Other non-current liabilities 1,170 - --
Current liabilities
Current portion of provisions 752 - -
Current income tax payable (318) - -
Trade and other payables 12,034 645 600
Other liabilities 32,763 - -
Bank overdrafts and current portion of long-term borrowings 50,416 - -
624,144 645 600LIABILITIES DIRECTLY ASSOCIATED WITH ASSETS

43
NOTE 3 SEGMENT REPORTING
Pursuant to IFRS 8, Operating Segments, segment reporting is presented in line
with internal reporting and information presented to the chief operating
decision maker (Eurazeo's Executive Board) for the purposes of allocating
resources to the segment and assessing its performance.
Eurazeo group operating segments can be allocated to the following six
divisions:
- Holding companies: investment in non-consolidated investments and the
co-investment fund business.
Each company contributes to the “holding companies” segment.
- Eurazeo Capital: this division invests in companies with an enterprise value
of over €200 million.
Each investment represents an operating segment.
- Eurazeo PME: this division invests in high-performing and ambitious small
and medium-sized enterprises with an enterprise value of between €50
million and €200 million that are market leaders with significant capacity
to maximize growth transactions.
The Eurazeo PME division represents a single operating segment.
- Eurazeo Patrimoine: this division specializes in management and
investment activities for real estate and physical assets.
Each investment represents an operating segment.
- Eurazeo Croissance: this division is dedicated to investing in young, high-
growth companies, destined to be the international leaders of tomorrow.
This division solely comprises non-consolidated companies.
- Eurazeo Brands: this division specializes in European and U.S. consumer
brands with global growth potential.
It does not currently hold any investments (launched in May 2017).
Depending on the operating segment, the main performance indicators are
as follows:
- adjusted EBIT (earnings before interest and taxes);
- adjusted EBITDA (earnings before interest, taxes, depreciation and
amortization);
- adjusted net debt (before or after financing costs).
Adjustments between operating income before other income and expenses
and the various income statement performance indicators mainly concern:
- adjustments for non-recurring items: restructuring costs, acquisition costs,
amortization of assets recognized on the allocation of the purchase price;
- fair value gains and losses on investment properties (Eurazeo Patrimoine).
The main adjustment to net debt corresponds to the restatement of financing
costs.

44
These adjustments were calculated directly based on the IFRS contributions of
each operating segment and can be reconciled directly with the published
consolidated financial statements.
3.1. Segment reporting as of June 30, 2017
SEGMENT INCOME STATEMENT
SEGMENT NET DEBT
Detailed information on debt maturities and the nature of covenants is
presented in Note 8.1.
3.2. Segment reporting as of June 30, 2016
SEGMENT INCOME STATEMENT
2017 Eurazeo
(6 months) Asmodee Fintrax Novacap
Sommet
Education Other Total PME (1)
ANF
Immobilier CIFA Grape Other Total
Revenue 1,568.6 21.9 194.4 117.0 390.9 73.0 12.8 788.1 615.8 24.4 9.3 109.2 0.0 142.9
Operating income before other income & expenses 357.0 65.8 26.1 7.0 25.1 2.5 81.3 142.0 127.6 4.7 7.3 9.6 0.0 21.6
Fair value gains (losses) on buildings (2)- - - - - 9.6 - -
Capital gain on disposal (73.5)
Other non-recurring items 0.6 4.0 - - - - - -
Other - (0.4) 11.5 3.9 (0.7) - - 0.2
Adjusted EBIT 165.2 26.7 10.6 36.6 6.4 53.4 14.4 7.3 9.8
% Adjusted EBIT margin
Charges to/reversals of deprec, amort & provisions 3.4 5.2 19.2 3.8 14.5 1.8 - 8.8
Adjusted EBITDA 30.1 15.8 55.8 10.2 67.9 16.1 7.3 18.5
% Adjusted EBITDA margin 15.5% 13.5% 14.3% 14.0% 11.0% 66.1% 78.3% 17.0%
(1) Total EBIT of majority-owned investments is €61.4 million and total EBITDA of majority-owned investments is €75.9 million.
(2) Fair value gains (losses) on buildings, before impact of IFRS 5 (see Note 2.2)
Holding
companies
Eurazeo Capital Eurazeo Patrimoine
(In millions of euros)
06/30/2017
Holding
companiesEurazeo
(In millions of euros) Total Asmodee Fintrax
Sommet
Education Novacap Other TotalPME (1)
CIFA
Grape
Hospitality Other Total
Borrowings 2,588.3 205.1 244.4 294.7 150.9 640.3 - 1,330.4 563.3 162.8 326.7 - 489.5
Cash assets (762.3) (456.3) (34.4) (25.5) (26.0) (74.1) (1.2) (161.2) (75.9) (7.7) (50.9) (10.3) (69.0)
IFRS net debt 1,826.0 (251.2) 210.0 269.3 125.0 566.2 (1.2) 1,169.2 487.4 155.1 275.8 (10.3) 420.5
Inter-company eliminations - - - - - - -
Other adjustments 17.5 (7.0) - (38.7) (1.6) 3.5 -
Adjusted IFRS net debt 227.5 262.3 125.0 527.5 485.9 158.6 275.8
Financing costs 4.6 8.5 5.1 14.8 1.6
Adjusted IFRS net debt excl. financing costs 232.1 270.7 130.1 542.3 160.1
(1) Excluding the holding company.
Eurazeo Capital Eurazeo Patrimoine
2016 Eurazeo
(6 months) Asmodee Fintrax Other Total PME (2)
ANF
Immobilier CIFA Colyzeo (1) Total
Revenue 715.8 30.5 144.5 94.5 - 239.0 411.4 25.8 9.1 - 34.9
Operating income before other income & expenses 213.0 131.4 12.7 9.3 (0.0) 21.9 38.5 (0.4) 21.7 (0.2) 21.1
Fair value gains (losses) on buildings 17.4 (14.4)
Other non-recurring items 3.5 1.5
Other (0.1) (0.3) 0.2
Adjusted EBIT 89.6 16.2 10.5 38.5 17.1 7.3
% Adjusted EBIT margin 79.8%
Charges to/reversals of deprec, amort & provisions 2.1 4.0 8.9 0.5
Adjusted EBITDA/Adjusted Corporate EBITDA 18.2 14.5 47.4 17.6
% Adjusted EBITDA margin 12.6% 15.4% 11.5% 68.2%
(1) Company carrying the investments in Colyzeo and Colyzeo II.
(2) Total EBIT of majority-owned investments is €44.3 million and total EBITDA of majority-owned investments is €53.2 million.
Holding
companies
Eurazeo Capital Eurazeo Patrimoine
(In millions of euros)

45
SEGMENT NET DEBT
3.3. Segment reporting as of December 31, 2016
SEGMENT INCOME STATEMENT
SEGMENT NET DEBT
06/30/2016
Holding
companiesEurazeo
(In millions of euros) Total Asmodee Fintrax Novacap LH 19 (1) LH 27 (2)Total
PME (3)ANF
Immobilier CIFA Grape Other Total
Borrowings 2,726.7 5.3 174.3 261.0 432.8 149.4 151.5 1,169.1 519.9 550.2 170.8 311.4 - 1,032.4
Cash assets (903.8) (667.1) (25.9) (32.5) (36.8) (0.1) (0.1) (95.3) (106.1) (9.2) (5.9) (18.2) (2.0) (35.2)
IFRS net debt 1,823.0 (661.7) 148.4 228.6 396.0 149.3 151.4 1,073.7 413.8 541.0 164.9 293.2 (2.0) 997.2
Inter-company eliminations - 18.7
Other adjustments 1.1 2.0 (3.2) (68.1)
Adjusted IFRS net debt 148.4 229.6 398.0 410.6 491.6
Financing costs 5.2 9.7 12.6
Adjusted IFRS net debt excl. financing costs 153.6 239.3 410.6
(1) Debt relating to AccorHotels shares.
(2) Debt relating to Elis shares.
(3) Excluding the holding company.
Eurazeo Capital Eurazeo Patrimoine
2016 Eurazeo
Asmodee Fintrax Sommet Novacap Other Total PME (1)
ANF
Immobilier CIFA
Grape
Hospitality Other Total
Revenue 2,181.0 43.4 377.2 223.4 70.6 323.6 0.1 994.8 965.3 51.2 18.1 108.0 - 177.4
Operating income before other income & expenses 1,034.2 632.2 57.4 28.0 (8.6) (5.1) 168.0 239.7 98.5 32.6 21.7 9.6 (0.1) 63.8
Fair value gains (losses) on buildings - - - - - 4.0 (7.3) -
Capital gain on disposals - - - - (2.6) - - -
Share of management fees - - - - - 0.5 - -
Other non-recurring items 3.3 6.3 7.8 33.3 (2.0) 0.8 - 0.9
Adjusted EBIT 279.0 60.6 34.3 (0.8) 28.2 93.8 38.0 14.4 10.5
% Adjusted EBIT margin 16.1%
Charges to/reversals of deprec, amort & provisions 4.6 8.3 3.9 18.0 23.5 0.9 0.0 9.3
Adjusted EBITDA 65.2 42.6 3.1 46.2 117.4 38.8 14.4 19.8
% Adjusted EBITDA margin 17.3% 19.1% 4.4% 14.3% 12.2% 75.8% 79.3% 18.3%
(1) Total EBIT of majority-owned investments is €103.3 million and total EBITDA of majority-owned investments is €126.9 million.
Holding
companies(In millions of euros)
Eurazeo Capital Eurazeo Patrimoine
12/31/2016 Eurazeo
(In millions of euros) Asmodee Fintrax Sommet Novacap LH19 (1) Other TotalPME (2)
ANF
Immobilier CIFA
Grape
Hospitality Other Total
Borrowings 3,081.1 104.4 255.9 273.1 153.4 453.3 149.5 - 1,285.1 670.8 526.2 166.9 327.7 - 1,020.8
Cash assets (1,580.3) (1,147.9) (62.6) (37.3) (47.4) (41.4) (0.0) (1.9) (190.6) (154.6) (23.5) (6.2) (55.7) (1.9) (87.3)
IFRS net debt 1,500.7 (1,043.5) 193.3 235.7 106.0 411.9 149.4 (1.9) 1,094.5 516.2 502.7 160.7 272.0 (1.9) 933.6
Inter-company eliminations - - - - - - 18.9 - -
Other adjustments 25.1 (6.8) (0.6) 2.4 - (5.0) (73.9) - 0.0
Adjusted IFRS net debt 218.4 228.9 105.4 414.2 149.4 511.2 447.7 160.7 272.1
Financing costs 5.2 8.9 5.6 13.0 4.4 1.6
Adjusted IFRS net debt excl. financing costs 223.6 237.8 111.0 427.2 452.1 162.3
(1) Debt relating to AccorHotels shares.
(2) Excluding the holding company.
Eurazeo Capital Eurazeo PatrimoineHolding
companies

46
NOTE 4 OPERATING DATA
4.1. Revenue
Eurazeo group revenue is €1,569 million for the first-half of 2017, compared with
€716 million for the first-half of 2016.
The revenue increase is mainly due to changes in consolidation scope
(inclusion of half-year revenue for the Grape Hospitality, Novacap, Sommet
Education, MK Direct, Orolia and AssurCopro groups not included in the
consolidation scope in the first-half of 2016).
4.2. Other income
Other income for the half-years ended June 30, 2016 and 2017 breaks down as
follows:
4.2.1. Capital gains (losses) on the securities portfolio
Capital gains on the securities portfolio in the first-half of 2017 primarily concern
the sale of Colisée (Eurazeo PME group, €73.5 million), as well as the dilution
gain on Europcar (€28.3 million), the gain on the spin-off of the Fonroche group
/ Reden Solar (€7.8 million, net of costs) and the partial sale of Moncler shares
(€4.4 million).
Capital gains on the securities portfolio in the first-half of 2016 primarily
concerned the sale of Elis shares (€137.9 million, before the release of reserves
to profit or loss and the early repayment compensation paid in July 2016 on the
early repayment of the debt carried by Legendre Holding 27).
The net gain on disposal (i.e. after the early repayment compensation and
foreign currency translation and hedging reserves released to profit or loss) was
€122.7 million.
(In thousands of euros) Notes 06/30/2017 06/30/2016 2016
(6 months) (6 months) (12 months)
Capital gains (losses) on the securities portfolio 113,773 138,248 786,837
Other capital gains (losses) 10 (1) (494)
Impairment losses on available-for-sale financial assets (11,739) (6,259) (12,838)
Fair value gains (losses) on investment properties 2.2 / 6 (46,074) (2,948) 3,258
Fair value gains (losses) on financial assets 159,405 - 54,360
Fair value gains (losses) on other non-current assets (3,444) (1,331) (2,176)
Other income and expenses 8,678 2,165 14,014
OTHER INCOME 220,609 129,874 842,961

47
4.2.2. Impairment losses on available-for-sale financial asset
Impairment losses recognized in the first-half of 2017 primarily concern Banca
Leonardo shares, following an adjustment to their value in the amount of
dividends received (recognized in revenue).
4.2.3. Fair value gains (losses) on financial assets at fair value through
profit or loss
Fair value gains and losses on financial assets concern AccorHotels and
Moncler shares (see Note 7.2).
4.3. Operating income and other income and expenses
Operating income totaled €274 million in the first-half of 2017, compared with
€150 million in the first-half of 2016.
Other income and expenses break down as follows:
Investment costs in the first-half of 2017 primarily concern the Novacap and
Eurazeo PME groups.
NOTE 5 INTANGIBLE ASSETS AND PROPERTY, PLANT AND EQUIPMENT
5.1. Goodwill, intangible assets and property, plant and equipment
Goodwill totals €1,494 million as of June 30, 2017, in line with December 31, 2016
(slight increase of €32 million).
Other intangible assets and property, plant and equipment total €2,276 million
as of June 30, 2017, down €46 million on December 31, 2016.
(In thousands of euros) 06/30/2017 06/30/2016 2016
(6 months) (6 months) (12 months)
Restructuring/relocation/reorganization (2,704) (1,583) (5,756)
Acquisition costs (35,145) (48,619) (66,483)
Strategic review and other income and expenses (22,607) (221) (8,669)
OTHER INCOME AND EXPENSES (60,456) (50,423) (80,908)

48
5.2. Impairment losses on fixed assets
5.2.1. Impairment tests
Pursuant to IAS 36, Eurazeo looked for indicators of impairment, using both
internal and external information sources.
External information sources primarily consist of the Group’s general assessment
of the economic situation in a specific country or market. Internal information
sources include the main types of reporting: a significant drop in
revenue/profitability or failure to meet the budget are indicators of impairment.
TEST METHODOLOGY
The test methodology adopted as of June 30, 2017 is unchanged on the
methodology described in the consolidated financial statements for the year
ended December 31, 2016.
In particular, Eurazeo used the same WACC calculation parameters but
updated the market data at the period-end.
5.2.2. Impairment tests
ON GOODWILL
Impairment tests may be performed for all Group CGUs, that is, the Eurazeo
PME, Asmodée, Fintrax, Grape Hospitality, Novacap and Sommet Education
CGUs. The business plans were reviewed, where appropriate.
The review of impairment indicators led to the performance of two impairment
tests. No impairment losses were recognized following these tests.
ON INTANGIBLE ASSETS WITH AN INDEFINITE LIFE
No impairment indicators were identified during the first-half of 2017 in respect
of intangible assets with an indefinite life.

49
NOTE 6 INVESTMENT PROPERTIES
Group investment properties consist of real estate holdings held by Eurazeo
Patrimoine, measured as of June 30, 2017 at fair value based on their appraisal
value.
All ANF Immobilier real estate assets (€1,058 million) were transferred to assets
held for sale (see Note 2).
The fair value of investment properties fell €46.1 million in the first-half of 2017,
due entirely to the decrease in the fair value of ANF Immobilier investment
properties (see Note 2.2).
6.1. Real estate appraisals
CIFA Fashion Business Center buildings were valued by the firm, CBRE Valuation
at fair value, equal to market value net of registration fees and notarial
charges.
(In thousands of euros) 06/30/2017 12/31/2016
ANF Immobilier investment properties
Lyons - 325,500
Marseilles - 581,152
Bordeaux - 76,665
B&B hotels - 83,491
Toulouse - -
Other investment properties
CIFA Fashion Business Center 220,000 220,000
TOTAL INVESTMENT PROPERTIES 220,000 1,286,808
Investment properties 220,000 1,286,016
Investment properties classified as held for sale - 792

50
NOTE 7 ASSOCIATES AND FINANCIAL ASSETS
7.1. Investments in associates
The decrease in investments in associates is mainly due to the changes in the
consolidation scope disclosed in Note 2.
The Trader Interactive group (formerly Dominion Web Solutions) is valued at the
investment amount, as the shares were merely transferred to Investments in
associates. The group will be equity-accounted from July 1, 2017.
7.1.1. Impairment tests on investments in associates
Eurazeo did not test any investments in associates for impairment as no
impairment indicators were identified.
The stock market price of equity-accounted companies as of June 30, 2017
was as follows:
7.1.2. Summary financial information on material associates
Information on the listed associates (Elis and Europcar) is available in the
financial statements of these companies on their websites.
(In thousands of euros) 06/30/2017 12/31/2016
Europcar 724,474 695,815
Elis 276,093 239,287
Trader Interactive 202,337 -
Desigual 151,524 152,142
Neovia 129,275 125,969
Other 156,541 139,490
INVESTMENTS IN ASSOCIATES 1,640,244 1,352,703
(In thousands of euros)
Number of
shares held
Stock market
price as of
06/30/2017 Total
Elis (shares held by Eurazeo, Legendre holding 27 and Ecip Elis) 23,825,204 20.06 477,934
Europcar (shares held by Eurazeo and Ecip Europcar) 72,081,541 12.81 923,365

51
7.2. Financial assets
The fair value of financial assets breaks down as follows:
The Group reviewed its entire financial asset portfolio in order to identify any
indicators of impairment. An impairment loss of €10.1 million was recognized on
Banca Leonardo shares (see Note 4.2.2).
06/30/2017 12/31/2016
Net carrying
amount
Through
profit or loss
Fair value
reserve Impairment
Net carrying
amount
Fair value by direct reference to published prices in an active market
(Level 1)
AccorHotels 500,207 406,684 93,523 - - 431,725
Moncler 469,503 349,261 120,242 - - 394,019
Listed securities 969,710 755,945 213,765 - - 825,744
Fair value according to valuation techniques based on observable data
(Level 2)
Colyzeo and Colyzeo II 27,883 37,969 - 2,630 (12,716) 49,195
Fair value according to valuation techniques based on non-observable data
(Level 3)
Gruppo Banca Leonardo 16,806 80,950 - - (64,144) 26,909
Other unlisted assets 633,226 1,469,322 - 47,894 (883,990) 536,005
Unlisted securities 677,915 1,588,241 - 50,524 (960,850) 612,109
AVAILABLE-FOR-SALE FINANCIAL ASSETS 1,647,625 2,344,186 213,765 50,524 (960,850) 1,437,853
Available-for-sale financial assets - non-current 1,627,868 1,392,442
Available-for-sale financial assets – current 19,757 45,411
(In thousands of euros)
Acquisition
cost
Change in fair value (cumulative)
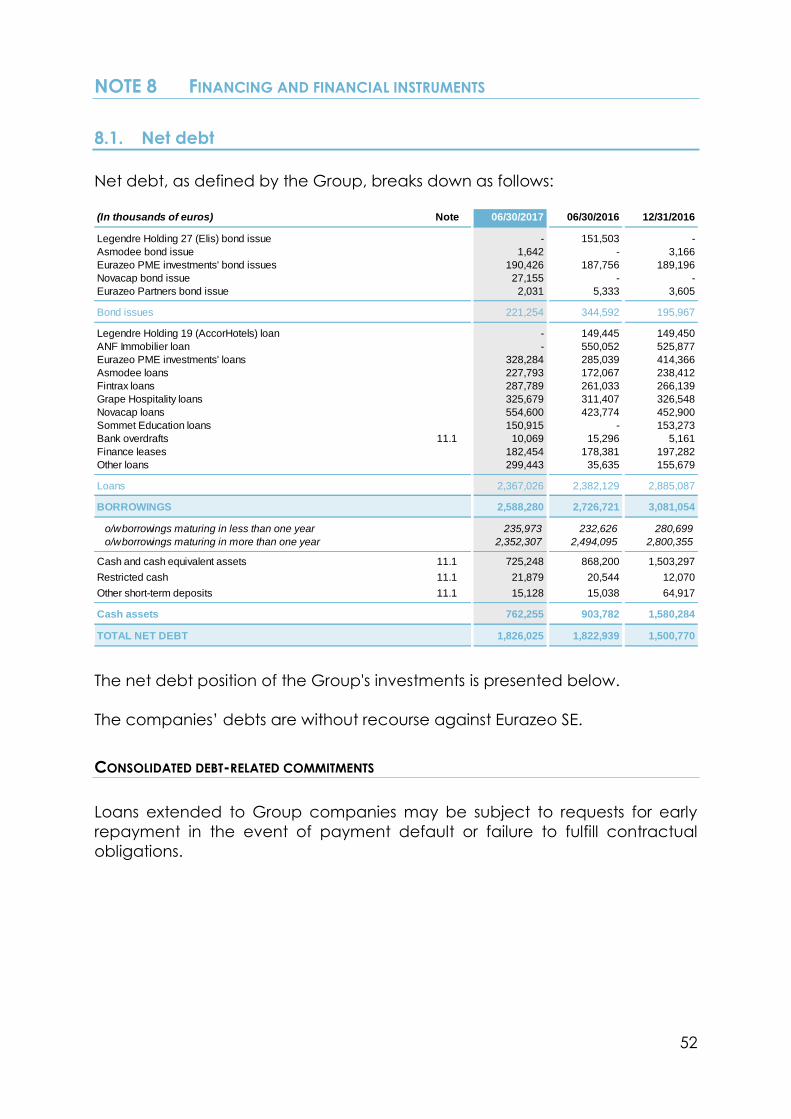
52
NOTE 8 FINANCING AND FINANCIAL INSTRUMENTS
8.1. Net debt
Net debt, as defined by the Group, breaks down as follows:
The net debt position of the Group's investments is presented below.
The companies’ debts are without recourse against Eurazeo SE.
CONSOLIDATED DEBT-RELATED COMMITMENTS
Loans extended to Group companies may be subject to requests for early
repayment in the event of payment default or failure to fulfill contractual
obligations.
(In thousands of euros) Note 06/30/2017 06/30/2016 12/31/2016
Legendre Holding 27 (Elis) bond issue - 151,503 -
Asmodee bond issue 1,642 - 3,166
Eurazeo PME investments' bond issues 190,426 187,756 189,196
Novacap bond issue 27,155 - -
Eurazeo Partners bond issue 2,031 5,333 3,605
Bond issues 221,254 344,592 195,967
Legendre Holding 19 (AccorHotels) loan - 149,445 149,450
ANF Immobilier loan - 550,052 525,877
Eurazeo PME investments' loans 328,284 285,039 414,366
Asmodee loans 227,793 172,067 238,412
Fintrax loans 287,789 261,033 266,139
Grape Hospitality loans 325,679 311,407 326,548
Novacap loans 554,600 423,774 452,900
Sommet Education loans 150,915 - 153,273
Bank overdrafts 11.1 10,069 15,296 5,161
Finance leases 182,454 178,381 197,282
Other loans 299,443 35,635 155,679
Loans 2,367,026 2,382,129 2,885,087
BORROWINGS 2,588,280 2,726,721 3,081,054
o/w borrowings maturing in less than one year 235,973 232,626 280,699
o/w borrowings maturing in more than one year 2,352,307 2,494,095 2,800,355
Cash and cash equivalent assets 11.1 725,248 868,200 1,503,297
Restricted cash 11.1 21,879 20,544 12,070
Other short-term deposits 11.1 15,128 15,038 64,917
Cash assets 762,255 903,782 1,580,284
TOTAL NET DEBT 1,826,025 1,822,939 1,500,770

53
The table below provides details of the amounts (including accrued interest),
the maturity dates and the nature of the covenants of the financing held by
the Group’s various investments.
(In thousands of euros) Gross debt Cash assets Net debt Comments/Nature of main covenants
Asmodee 244,400 (34,390) 210,010 - Maturities: 2021 (bond issue and credit facility), 2017-2023 (other borrowings)
- Covenants:
~ Debt service coverage ratio
~ Net debt / EBITDA (1)
~ EBITDA (1) / net interest expense
~ Capex and capitalized expenditure (3)
~ Minimum cash amount
Fintrax 294,720 (25,467) 269,253 - Maturities: 2017 (credit facility), 2019-2022 (other borrowings)
- Covenants:
~ Net debt / EBITDA (1)
Novacap 640,348 (74,132) 566,216 - Maturities: 2022 (credit facility), 2017-2023 (other borrowings)
-Cov-Lite financing
Sommet Education 150,936 (25,957) 124,979 - Maturities: 2023
- Covenants:
~ Net debt / EBITDA (1)
~ Capex (3)
~ Minimum cash amount
Other companies - (1,245) (1,245)
Total "Eurazeo Capital" net debt 1,330,404 (161,191) 1,169,213
Eurazeo PME 563,300 (75,853) 487,447 - Maturity: 2017 to 2031
- Covenants:
~ Debt service coverage ratio
~ Net debt / EBITDA (1)
~ EBITDA (1) / net interest expense
~ Capex (3)
Total "Eurazeo PME" net debt 563,300 (75,853) 487,447
Eurazeo Croissance - (481) (481)
Total "Eurazeo Croissance" net debt - (481) (481)
Grape Hospitality 326,660 (50,863) 275,797 - Maturity: 2021 (finance leases), 2023 (acquisition debt and capex)
- Covenants:
~ LTV (4)
~ Debt service coverage ratio
~ Net debt / EBITDAR (2)
~ Capex (3)
~ Hedging
CIFA Assets 162,807 (7,717) 155,090 - Maturity: 2027 (finance lease)
Other companies - (10,340) (10,340)
Total "Eurazeo Patrimoine" net debt 489,467 (68,920) 420,547
Eurazeo 100,079 (435,165) (335,086)
Other companies 105,030 (20,645) 84,385
Total "Holding company" net debt 205,109 (455,810) (250,701)
TOTAL NET DEBT 2,588,280 (762,255) 1,826,025
(3) Capex: Capital Expenditure.(4) LTV: Loan To Value.(5) ICR: Interest Coverage Ratio.
(2) EBITDAR: Earnings before interest, taxes, depreciation, amortization and rent; adjusted where applicable in accordance with bank documents.
06/30/2017
(1) EBITDA: Earnings before interest, taxes, depreciation and amortization; adjusted where applicable in accordance with bank documents.

54
8.2. Net financial expense
The increase in interest on borrowings is mainly due to changes in consolidation
scope (inclusion of half-year interest for the Grape Hospitality, Novacap,
Sommet Education, MK Direct, Orolia and AssurCopro groups not included in
the consolidation scope in the first-half of 2016).
NOTE 9 PROVISIONS
Provisions break down as follows:
The increase in employee benefit liabilities is partly due to actuarial gains and
losses, charges for the period and changes in consolidation scope (particularly
the acquisition of PCAS by Novacap and the sale of Colisée by Eurazeo PME).
9.1.1. Employee benefit liabilities
The nature of employee benefits is similar to that described in the Notes to the
consolidated financial statements for the year ended December 31, 2016.
(In thousands of euros) Note 06/30/17 06/30/16 2016
(6 months) (6 months) (12 months)
Interest on borrowings (78,042) (57,610) (133,106)
Total finance costs gross (78,042) (57,610) (133,106)
Income and expenses on changes in derivatives 1,517 (1,990) 12,721
Hedging reserve reclassified to profit or loss (2,868) (408) (6,666)
Fair value gains losses on financial assets held for trading - 65 -
Other financial income and expenses 394 188 1,437
Total income and expenses on cash, cash equivalents and other financial
instruments(957) (2,145) 7,492
Total finance costs net (78,999) (59,755) (125,614)
Foreign exchange losses (4,928) (11,827) (18,239)
Foreign exchange gains 2,357 2,141 8,293
Interest expense relating to the employee benefits obligation (423) 597 (573)
Reclassification of the hedging reserve – impact of share disposals - - (1,072)
Reclassification of the foreign currency translation reserve – impact of share disposals - - (895)
Other 1,206 (7,858) (10,023)
Total other financial income and expenses (1,789) (16,947) (22,510)
NET FINANCIAL EXPENSE (80,787) (76,702) (148,124)
(In thousands of euros)
Employee
benefit
liabilities Disputes Other Total
As of 12/31/2016 57,584 5,165 29,951 92,700
As of 06/30/2017 75,343 4,770 19,816 99,929
Due in less than one year - 559 6,377 6,936
Due in more than one year 75,343 4,211 13,439 92,993

55
9.1.2. Provisions for litigation and other provisions
Provisions for litigation and other provisions primarily concern litigation,
restructuring, provisions for tax risks and miscellaneous provisions.
NOTE 10 EQUITY AND EARNINGS PER SHARE
10.1. Equity
Equity attributable to owners of the Company is €4,468 million, or €64.88 per
share, as of June 30, 2017.
10.1.1. Share capital
As of June 30, 2017, the share capital was €220,561 thousand, comprising
72,315,130 fully paid-up shares of two classes: 72,290,622 ordinary shares and
24,508 preference shares. Eurazeo holds 3,459,282 of its own shares as of June
30, 2017.
10.1.2. Dividends paid
The Shareholders’ Meeting of May 11, 2017 approved the distribution of a
dividend of €1.20 per share. The total distribution to shareholders was therefore
€78,707 thousand.
In addition, a bonus share issue of one free share for 20 shares held was
performed.
(In euros) 2017 2016
Total dividend distribution 78,707,124.00 159,304,584.00
Dividend paid in cash 78,707,124.00 159,304,584.00
Dividend paid in shares 0.00 0.00
Dividend per share paid in cash 1.20 2.40
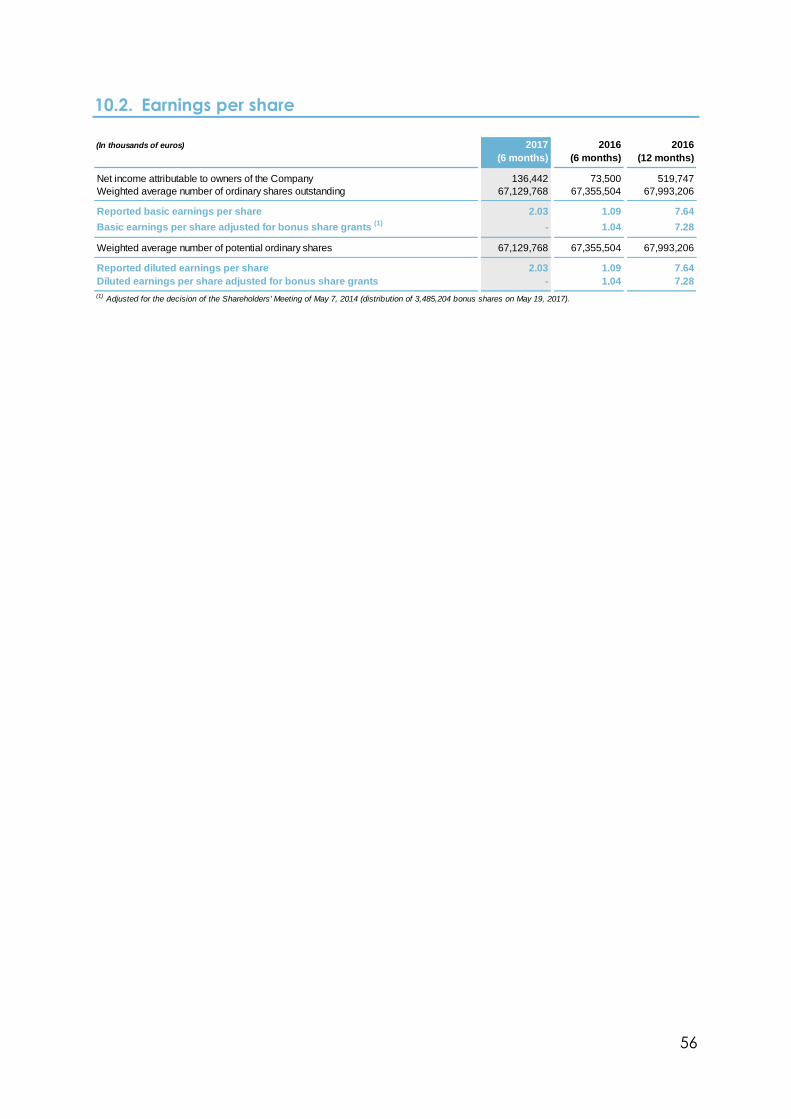
56
10.2. Earnings per share
(In thousands of euros) 2017 2016 2016
(6 months) (6 months) (12 months)
Net income attributable to owners of the Company 136,442 73,500 519,747
Weighted average number of ordinary shares outstanding 67,129,768 67,355,504 67,993,206
Reported basic earnings per share 2.03 1.09 7.64
Basic earnings per share adjusted for bonus share grants (1)
- 1.04 7.28
Weighted average number of potential ordinary shares 67,129,768 67,355,504 67,993,206
Reported diluted earnings per share 2.03 1.09 7.64
Diluted earnings per share adjusted for bonus share grants - 1.04 7.28
(1) Adjusted for the decision of the Shareholders' Meeting of May 7, 2014 (distribution of 3,485,204 bonus shares on May 19, 2017).

57
NOTE 11 BREAKDOWN OF CASH FLOWS
11.1. Cash assets
The cash flow statement analyzes changes in cash presented net of bank
overdrafts and including restricted cash.
As of June 30, 2017, restricted cash mainly consists of cash allocated to the
Eurazeo liquidity contract and the restricted cash of the Sommet Education,
Novacap and Eurazeo PME groups.
11.2. Net cash flows from operating activities
Cash flows from operating activities totaled €53.5 million (compared with €41.3
million in the first-half of 2016).
11.3. Net cash flows from investing activities
Purchases of investment properties by ANF Immobilier totaled €38.1 million in
the first-half of 2017. ANF Immobilier continued its investments, notably in Lyons
and Bordeaux and purchased a real estate complex in Toulouse.
Purchases of investments and available-for-sale assets mainly reflect the
acquisition of CPK by Eurazeo (€222.7 million), of Trader Interactive (formerly
Dominion Web Solutions) by Eurazeo (€202.3 million) and of PCAS by Novacap
(€140.3 million), as well as the subscription by LH 27, Eurazeo and Ecip Elis of the
Elis share capital increase (€55.4 million) and build-ups and investments by
Eurazeo PME companies (Dessange, Orolia, Colisée, AssurCopro, Smile)
totaling €165.3 million.
Proceeds from sales of investments mainly reflect the sale of Colisée by Eurazeo
PME (€123 million).
(In thousands of euros) Note 06/30/2017 06/30/2016 12/31/2016
Demand deposits 371,774 801,984 1,087,500
Term deposits and marketable securities 353,474 66,216 415,797
Cash and cash equivalent assets 8.1 725,247 868,200 1,503,297
Restricted cash 8.1 21,879 20,544 12,070
Bank overdrafts (10,069) (15,296) (5,161)
Cash and cash equivalent liabilities 8.1 (10,069) (15,296) (5,161)
NET CASH AND CASH EQUIVALENTS 737,057 873,448 1,510,205
Other short-term deposits 8.1 15,128 15,038 64,917
TOTAL GROSS CASH ASSETS 762,255 903,782 1,580,284

58
The impact of changes in consolidated scope mainly concern the Novacap
(acquisition of PCAS) and Eurazeo PME (acquisition of Assurcopro and sale of
Colisée) group.
Finally, dividends received from associates were primarily distributed by the
Europcar (€24.7 million), Elis (€8.7 million), Moncler (€4.3 million) and Fonroche
(€1.6 million) groups.
11.4. Net cash flows from financing activities
Net cash flows from financing activities mainly include the various acquisition
financing flows (particularly in the Eurazeo PME, Fintrax and Novacap groups),
as well as LH 19 repayment flows on the loan allocated to the AccorHotels
shares.
The €78.7 million dividend distribution by Eurazeo is also reflected in net cash
flows from financing activities. Other dividends paid during the half-year
primarily concern amounts paid by ANF Immobilier to minority interests and
contribution repayments to Eurazeo Partners co-investors.
NOTE 12 OTHER INFORMATION
12.1. Post-balance sheet events
Post-balance sheet events are presented in Section I.7 of the Half-Year
Financial Report.
12.2. Off-balance sheet commitments
TotalHolding
companies
Eurazeo
Capital
Eurazeo
PME
Eurazeo
Croissance
Eurazeo
Patrimoine
Commitments given (1,005.4) (70.6) (415.5) (64.0) (7.2) (448.2) (2,422.5)
Assigned receivables not due (Dailly forms, etc.) (1.0) - (1.0) - - - (2.9)
Pledges, mortgages and collateral
- AccorHotel shares (closing price) - - - - - - (427.3)
- Other pledges, mortgages and collateral (509.3) - (61.2) - - (448.2) (1,269.3)
Sureties, deposits and guarantees given (12.4) - (0.2) (12.2) - - (73.2)
Operating leases
-Minimum lease payments under non-cancellable operating leases (< 1 year) (34.7) (2.9) (27.7) (4.1) - - (30.6)
-Minimum lease payments under non-cancellable operating leases (1 to 5 years) (133.0) (11.6) (93.4) (27.9) - - (127.0)
-Minimum lease payments under non-cancellable operating leases (< 5 years) (225.2) (7.1) (217.6) (0.4) - - (150.1)
Vendor warranties (21.3) (15.5) (0.3) (5.5) - - (21.3)
Other commitments given
- IM Square (7.2) - - - (7.2) - (7.2)
- Purchase or investment commitments (33.5) (33.5) - - - - (257.5)
- Sales commitments - - - - - - (0.8)
- Key employee (8.0) - - (8.0) - - (8.0)
- Other (19.9) - (14.1) (5.8) - - (47.5)
Commitments received 1,450.3 1,312.1 44.0 94.3 - - 1,855.1
Eurazeo Capital II limited partners subscription commitment 412.1 412.1 - - - - 428.7
Sureties, deposits and guarantees received 7.6 - 4.8 2.8 - - 67.5
Vendor warranties 5.1 - - 5.1 - - 14.1
Available syndicated credit facility / credit lines 939.2 900.0 39.2 - - - 1,000.0
Other commitments received 86.5 - - 86.5 - - 345.0
(in millions of euros)
06/30/201712/31/2016
59
* ANF Immobilier group off-balance sheet commitments are not included in amounts presented as of
June 30, 2017, as the company’s assets and liabilities have been transferred to assets and liabilities held
for sale. Commitments given total €540 million as of June 30, 2017 (including pledges, mortgages and
collateral of €459 million). They totaled €588 million as of December 31, 2016.
The main changes in off-balance sheet commitments since December 31, 2016
are detailed below:
NEW EURAZEO COMMITMENTS
In connection with the acquisition of the U.S. company, Dominion Web
Solutions, Eurazeo undertook to ensure, and guaranteed, in both cases in the
amount of 50%, that the buyer, a 50% subsidiary of Eurazeo, has the necessary
and sufficient resources to finance the acquisition and fulfil its obligations under
the acquisition contract.
As part of the planned acquisition of Iberchem Corporation Essence of Nature,
S.L., Eurazeo provided an undertaking to the vendors that the buyer, currently
Legendre Holding 38, wholly-owned by Eurazeo, but which will be replaced
before the deal closing by a Spanish special-purpose vehicle in which Eurazeo
holds a majority stake, will have the necessary resources of €272,190,172.28
maximum to complete the acquisition.
Following the share capital increase by Europcar on June 21, 2017, Eurazeo
undertook not to transfer Europcar shares or other securities during a 90-day
period expiring September 19, 2017, by any means, or to contract options or
commitments for such a transfer. This ban does not apply to transfers to an
Eurazeo associate or pledges or other collateral granted over Europcar shares
by Eurazeo during the normal course of business in connection with a financial
transaction.
NEW LH NOVACAP COMMITMENTS
Pursuant to the acquisition of PCAS by the Novacap group, LH Novacap
undertook to invest €115.6 million in the Novacap group to finance the
acquisition of a share block in excess of 50% and the subsequent takeover bid.
Eurazeo fulfilled its purchase commitment on June 20, 2017 when it acquired
the share block. As part of the subsequent simplified takeover bid, Eurazeo also
gave an undertaking to the sponsoring bank to invest approximately €33.5
million in the Novacap group.
NEW LH CPK AND CPK GROUP COMMITMENTS
COMMITMENTS GIVEN
Pursuant to the acquisition of a portfolio of assets in the confectionery and
chocolate sector held by Mondelez group on April 28, 2017, CPK Bidco granted
standard vendor warranties covering its existence and capacity as well as
specific warranties covering (i) the allocation of the purchase price between
60
the different assets sold, (ii) the liabilities transferred and (iii) the production lines
excluded from the scope of the transaction. CPK Bidco also granted employee
commitments covering both transferred employees and employees of the
acquired plants.
In addition, CPK Bidco gave a commitment that its subsidiary, Carambar & Co,
would repay VAT credits to the Mondelez group, as and when they are
recovered by CPK Switzerland. These VAT credits are obtained by CPK
Switzerland in various countries following the purchase from Mondelez Europe
GmbH of certain finished products and raw materials.
CPK Bidco also undertook that in the event of the sale of the Wattignies asset
by CPK Production France to a third-party outside the Mondelez group, CPK
Production France would pay the disposal proceeds it receives to Mondelez
Toulouse Confectionery Production SAS (up to a maximum of €187,000).
The group has an undrawn credit facility of €8 million. In addition, as of June 30,
2017, Carambar & Co, to secure its prices and supplies, undertook to hedge
the majority of its cocoa and sugar requirements to the end of 2018.
In connection with the entry of certain managers into the share capital of CPK,
LH CPK, a subsidiary of Eurazeo SE, granted them standard share purchase
commitments applicable in the event of death or permanent disability.
COMMITMENTS RECEIVED
Pursuant to the agreement with the Mondelez group for the acquisition of a
portfolio of assets in the confectionery and chocolate sector, CPK Bidco
received a general warranty covering standard statements concerning assets
sold and specific warranties covering (i) reorganization operations to be
performed prior to the transaction, (ii) assets excluded from the scope of the
transaction, (iii) employees transferred and (iv) production lines transferred.
In addition to the price adjustment mechanisms set-out in the aforementioned
acquisition agreement, CPK Bidco is entitled to a potential €3 million price
reduction if Terry’s Chocolate Orange production is launched in Strasbourg
before July 31, 2019.
Finally, following the entry of certain managers into the share capital of CPK,
LH CPK holds share sales commitments from them.
NEW EREL 1 AND GRAPE HOSPITALITY COMMITMENTS
COMMITMENTS GIVEN
Pursuant to the financing of the acquisition of a hotel portfolio, Grape
Hospitality granted banks standard warranties for this type of transaction, such
as lender’s liens and mortgages, pledges over business assets, securities and
receivables and assignment of receivables (Dailly) on lease payments
Under the terms of the shareholders’ agreement between EREL 1 and
AccorLux, EREL 1 and AccorLux gave financing commitments covering the

61
hotel refurbishment program in the event self-financing by the Grape
Hospitality group is inadequate.
In connection with the entry of certain managers into the share capital of
Grape Hospitality, EREL 1 granted them standard share purchase commitments
applicable in the event of death or permanent disability.
COMMITMENTS RECEIVED
Following the entry of certain managers into the share capital of Grape
Hospitality, EREL 1 holds share sales commitments from them.
LEGENDRE HOLDING 25 COMMITMENTS
COMMITMENTS GIVEN
Pursuant to an agreement signed on December 1, 2016, Legendre Holding 25
undertook to take various actions leading to the distribution of geothermic and
biogas activities to the founding partners and the entry into Fonroche Energie’s
share capital of funds managed by Infravia III Invest SA. The transaction was
completed in February 2017.
Pursuant to this transaction and the acquisition by Reden Solar (formerly Stone
Holdco) from La Compagnie des Châteaux of all Fonroche Energie shares held
by it, Reden Solar granted earn-outs to La Compagnie des Châteaux in respect
of (i) the Humacao project and (ii) an ongoing dispute with EDRF.
In addition, Legendre Holding 25 undertook to hold its Reden Solar (formerly
Stone Holdco) shares for at least three years.
COMMITMENTS RECEIVED
Pursuant to this acquisition, La Compagnie des Châteaux granted Reden Solar
standard warranties for this type of acquisition project, expiring April 30, 2017.

62
III. Statutory Auditors’ Reports
1. Statement by the Statutory Auditors regarding Eurazeo’s net asset value as
of June 30, 2017
Statement by the Statutory Auditors regarding Eurazeo’s net asset value as of
June 30, 2017
EURAZEO
1, rue Georges Berger. 75017 PARIS
This is a free translation into English of the Statutory Auditors’ statement issued in French
and is provided solely for the convenience of English-speaking readers. This statement
should be read in conjunction with, and construed in accordance with, French law
and professional auditing standards applicable in France
To the Chief Executive Officer
In our capacity as Statutory Auditors of Eurazeo and pursuant to your request,
we have verified the financial information relating to Eurazeo’s Net Asset Value
as of June 30, 2017 (hereinafter the “Information”) given in the Half-Year
Financial Report for the half-year ended June 30, 2017 (hereinafter the “Half-
Year Financial Report”) and prepared in accordance with the International
Private Equity Valuation Guidelines.
The Net Asset Value has been prepared under the responsibility of Eurazeo’s
Executive Board based on the accounting records of Eurazeo and of the fully
consolidated subsidiaries, as well as on available market data as of June 30,
2017. The method of calculating the Net Asset Value and the assumptions
adopted are described in Section 1.5 of the Half-Year Financial Report.
Our role is to comment as to whether:
• the Information used to calculate the Net Asset Value is consistent with the
accounting records; and
• the preparation of the Information complies in all material respects with the
methodology described in Section 1.5 of the Half-Year Financial Report.
We are not however required to call into question the methodology, the
assumptions used and the judgments made by Eurazeo’s management to
determine the fair values of its investments in unlisted companies. Nor are we
required to comment on the compliance of this methodology with a set of
standards or best practices, or to comment on the values thus determined for
each investment within the context of the Net Asset Value.
In our capacity as Statutory Auditors, we conducted a limited review of
Eurazeo’s condensed interim consolidated financial statements for the period
January 1, 2017 to June 30, 2017.

63
The purpose of our limited review, conducted in accordance with professional
standards applicable in France, was to ensure that Eurazeo’s condensed
interim consolidated financial statements, taken as a whole, were prepared, in
all material aspects, in accordance with IAS 34, Interim Financial Reporting, as
adopted by the European Union. The objective of this review was not to express
an opinion on specific items in these financial statements used to calculate the
Net Asset Value. Consequently, we did not conduct our limited review with this
aim and we do not express any opinion on these items taken separately.
Our procedures, which constitute neither an audit nor a limited review, were
performed in accordance with professional guidelines of the French National
Institute of Statutory Auditors (Compagnie Nationale des Commissaires aux
Comptes) applicable to this engagement. For the purposes of this report, our
work consisted in:
• familiarizing ourselves with the procedures set up by your Company to
produce the Information relating to the Net Asset Value;
• comparing the methods applied to calculate the Net Asset Value with
those described in Section 1.5 of the Half-Year Financial Report;
• verifying the consistency of the accounting net assets taken from the
separate financial statements of Eurazeo and its subsidiaries holding the
investments used to calculate the Net Asset Value with Eurazeo’s
consolidated financial statements for the period January 1 to June 30, 2017;
• verifying the consistency of the accounting information used to calculate
the Net Asset Value with the items used as a basis for preparing Eurazeo’s
condensed interim consolidated financial statements for the half-year
ended June 30, 2017, notably:
o in situations where the fair value has been determined by applying
multiples to aggregates taken from the accounting records or
provisional accounts of investments, verifying the consistency of these
aggregates with the accounting records or the provisional accounts of
investments,
o in situations where the fair value has been determined by applying
multiples to aggregates taken from the accounting records and
adjusted for non-recurring items, verifying the consistency of these
aggregates with the accounting records before these adjustments are
taken into account,
o in situations where fair value has been determined by applying multiples
to aggregates taken from forecast accounts of investments, reconciling
these forecast aggregates with items used by Eurazeo for impairments
tests in preparing the consolidated financial statements,
o in situations where debt items have been used to calculate the fair
value of unlisted investments, verifying the consistency of the debt items

64
with the accounting records, except when prospective items have
been used;
• verifying the consistency of the share price used to calculate the fair value
of listed investments with observable data;
• verifying the arithmetical accuracy of the calculations after application of
rounding rules, if necessary.
Based on our work, we have no matters to report on the consistency of the
accounting information used to calculate Eurazeo’s Net Asset Value with the
accounting records and on the compliance of their calculation with the
methodology described in Section 1.5 of the Half-Year Financial Report.
This statement has been prepared for your attention in the context described
above and must not be used, distributed or referred to for any other purpose.
The work performed in the framework of this statement is not designed to
replace the inquiries and other procedures that third parties with knowledge of
this statement may need to perform and we express no opinion as to the
adequacy of our work for the purposes of such third parties.
Neuilly-sur-Seine and Courbevoie, July 27, 2017
The Statutory Auditors
PricewaterhouseCoopers Audit Mazars
Pierre Clavié Emilie Loréal

65
2. Statutory Auditors’ review report on the half-year financial information
PricewaterhouseCoopers Audit
63 rue de Villiers
92208 Neuilly-sur-Seine
Mazars
Tour Exaltis - 61 rue Henri Regnault
92400 Courbevoie
EURAZEO
1 rue Georges Berger
75017 Paris
STATUTORY AUDITORS’ REVIEW REPORT ON THE HALF-YEAR FINANCIAL
INFORMATION
(January 1, 2017 to June 30, 2017)
This is a free translation into English of the Statutory Auditors’ review report issued in
French and is provided solely for the convenience of English speaking readers. This
report should be read in conjunction with, and construed in accordance with, French
law and professional auditing standards applicable in France
To the Shareholders,
In compliance with the assignment entrusted to us by your Shareholders’
Meetings and in accordance with the requirements of Article L.451-1-2 III of the
French Monetary and Financial Code (Code monétaire et financier), we
hereby report to you on:
- the limited review of the accompanying condensed interim consolidated
financial statements of Eurazeo, for the period January 1, 2017 to June 30,
2017;
- the verification of the information contained in the half-year management
report.
These condensed interim consolidated financial statements are the
responsibility of the Executive Board. Our role is to express a conclusion on these
financial statements based on our limited review.
I. Conclusion on the financial statements
We conducted our limited review in accordance with professional standards
applicable in France. A limited review of half-year financial information consists
of making inquiries, primarily of persons responsible for financial and

66
accounting matters, and applying analytical and other review procedures. A
limited review is substantially less in scope than an audit conducted in
accordance with professional standards applicable in France and
consequently does not enable us to obtain assurance that we would become
aware of all significant matters that might be identified in an audit.
Accordingly, we do not express an audit opinion.
Based on our limited review, nothing has come to our attention that causes us
to believe that the accompanying condensed interim consolidated financial
statements have not been prepared, in all material respects, in accordance
with IAS 34, Interim Financial Reporting, as adopted by the European Union.
II. Specific verification
We have also verified the information given in the half-year management
report on the condensed interim consolidated financial statements subject to
our limited review.
We have no matters to report as to its fair presentation and consistency with
the condensed interim consolidated financial statements.
Neuilly-sur-Seine and Courbevoie, July 27, 2017
The Statutory Auditors
PricewaterhouseCoopers Audit Mazars
Pierre Clavié Emilie Loréal

67
IV. Statement by the person responsible for the half-year financial
report
I hereby certify that, to the best of my knowledge, the condensed interim
consolidated financial statements have been prepared in accordance with
applicable accounting standards and give a true and fair view of the assets,
liabilities, financial position and results of the Company and all consolidated
companies, and that the appended Half-Year Financial Report provides a fair
review of the major events that occurred during the first six months of the fiscal
year, their impact on the financial statements, the main transactions between
related parties, as well as a description of the main risks and uncertainties
concerning the remaining six months of the fiscal year.
Patrick Sayer
Chairman of the Executive Board


