18
QUAYSIDE HOLDINGS LIMITED AND SUBSIDIARY COMPANIES HALF YEAR REPORT For 31 DECEMBER 2017

QUAYSIDE HOLDINGS LIMITED AND SUBSIDIARY COMPANIES
HALF YEAR REPORT
For
31 DECEMBER 2017

QUAYSIDE HOLDINGS LIMITED AND SUBSIDIARY COMPANIES FOR THE SIX MONTHS ENDED 31 DECEMBER 2017
CONTENTS PAGE Directors’ Report 1 Income Statement 2 Statement of Comprehensive Income 3 Statement of Movements in Equity 4 Statement of Financial Position 5 Statement of Cashflows 7 Notes to the Financial Statements 8 Directory 16


2
QUAYSIDE HOLDINGS LIMITED AND SUBSIDIARY COMPANIES
CONSOLIDATED INCOME STATEMENT
For the six months ended 31 December 2017
Unaudited Unaudited Audited
Six months Six months Full year
Dec 2017 Dec 2016 June 2017
Note $'000 $'000 $'000
Trading revenue 142,503 125,933 260,098
Other income 16,786 9,896 23,275
Operating income 159,289 135,829 283,373
Employee benefit expenses (18,936) (16,401) (34,591)
Trading and other expenses (47,302) (46,103) (93,412)
Operating expenses (66,238) (62,504) (128,003)
Results from operating activities 93,051 73,325 155,370
Depreciation and amortisation (13,256) (12,387) (24,956)
Operating profit before finance costs and taxation 79,795 60,938 130,414
Finance income 631 477 1,072
Finance expenses 6 (10,201) (9,301) (19,024)
Net finance costs (9,570) (8,824) (17,952)
Share of profit from Equity Accounted Investees 7,926 7,241 13,282
PROFIT BEFORE INCOME TAX 78,151 59,355 125,744
Income tax expense (15,819) (13,990) (28,146)
PROFIT FOR THE PERIOD 62,332 45,365 97,598
Attributable to:
Equity holders of the parent 41,047 26,505 60,002
Non-controlling interest 21,285 18,860 37,596
PROFIT FOR THE PERIOD 62,332 45,365 97,598
The accompanying notes form part of these financial statements.

3
QUAYSIDE HOLDINGS LIMITED AND SUBSIDIARY COMPANIES
CONSOLIDATED STATEMENT OF COMPREHENSIVE INCOME
For the six months ended 31 December 2017
Unaudited Unaudited Audited
Six months Six months Full year
Dec 2017 Dec 2016 June 2017
$'000 $'000 $'000
Net profit after tax 62,332 45,365 97,598
Other comprehensive income
Items that will be reclassified to profit or loss when specific conditions are met:
Cash flow hedge - changes in fair value
(1,638) 4,761 2,956
Cash flow hedge - reclassified to profit or loss
1,079 1,142 2,538
Changes in cash flow hedges transferred to property, plant and equipment, net of tax
- 708 708
Share of net change in cash flow hedge reserves of Equity Accounted Investees
(46) 243 182
(605) 6,854 6,384
Items that will never be reclassified to profit or loss:
Bearer plant revaluation, net of tax - - 775
Kiwifruit licence revaluation, net of tax
- - 473
Asset revaluation, net of tax
- 751 63,267
Share of net change in revaluation reserves of Equity Accounted Investees
551 621 745
551 1,372 65,260
Total other comprehensive income for the period (54) 8,226 71,644
Total comprehensive income for the period 62,278 53,591 169,242
Attributable to:
Equity holders of the parent 41,018 31,363 99,983
Non-controlling interest 21,260 22,228 69,259
62,278 53,591 169,242
The accompanying notes form part of these financial statements.

4
Share
capital
Hedging
Reserve
Revaluation
Reserve
Retained
Earnings
Non-
controlling
interest
Total
Equity
$'000 $'000 $'000 $'000 $'000 $'000
Balance at 1 July 2016 200,011 (7,824) 368,136 39,145 399,270 998,738
Profit after tax - - - 26,505 18,860 45,365
Cash flow hedges - changes in fair value - 2,616 - - 2,145 4,761
Cash flow hedge - reclassified to profit or loss - 627 - - 515 1,142
Changes in cash flow hedges transferred to property,
plant and equipment, net of tax- 389 - - 319 708
Share of net change in cash flow hedge reserves of
equity accounted investees- 134 - - 109 243
Share of net change in revaluation reserves of Equity
Accounted Investees- - 341 - 280 621
Asset revaluation, net of tax - - 751 - - 751
Total comprehensive income - 3,766 1,092 26,505 22,228 53,591
Non-controlling interest adjustments - - - (6) 6 -
Increase in share capital - - - - 12 12
Equity settled share based payment accrual - - - - 937 937
Dividends paid to shareholders (Note 7) - - - (17,134) (34,336) (51,470)
Total transactions with owners - - - (17,140) (33,381) (50,521)
Balance at 31 December 2016 200,011 4,058- 369,228 48,510 388,117 1,001,808
Profit after tax 33,497 18,736 52,233
Cash flow hedges - changes in fair value - (992) - - (813) (1,805)
Cash flow hedge - reclassified to profit or loss - 767 - - 629 1,396
Net change in share of Equity Accounted Investees'
cash flow hedge reserves- (34) - - (27) (61)
Share of net change in revaluation reserves of Equity
Accounted Investees- - 124 - - 124
Asset revaluation, net of tax - - 34,010 - 28,506 62,516
Bearer plant revaluation, net of tax - - 775 - - 775
Kiwifruit licence revaluation - - 473 - - 473
Total comprehensive income - (259) 35,382 33,497 47,031 115,651
Non-controlling interest adjustments - - - 1 (1) -
Increase/(decrease) in share capital - - - - 2 2
Revaluation surplus transferred to retained earnings
on asset disposal- - (463) 463 - -
Equity settled share based payment accrual - - - - 488 488
Dividends paid to shareholders - - - (11,572) (15,607) (27,179)
Total transactions with owners - - (463) (11,108) (15,118) (26,689)
Balance at 30 June 2017 200,011 (4,317) 404,147 70,899 420,030 1,090,770
Profit after tax - - - 41,047 21,285 62,332
Cash flow hedges - changes in fair value - (898) - - (740) (1,638)
Cash flow hedge - reclassified to profit or loss - 592 - - 487 1,079
Share of net change in cash flow hedge reserves of
equity accounted investees- (25) - - (21) (46)
Share of net change in revaluation reserves of equity
accounted Investees- - 302 - 249 551
Total comprehensive income - (331) 302 41,047 21,260 62,278
Non-controlling interest adjustments - - - 1 (1) -
Increase in share capital - - - 81 66 147
Equity settled share based payment accrual - - - - 700 700
Adjustment for vesting of equity settled share based
payment- - - 709 (709) -
Dividends paid to shareholders (Note 7) - - - (20,110) (34,960) (55,070)
Total transactions with owners - - - (19,319) (34,904) (54,223)
Balance at 31 December 2017 200,011 (4,648) 404,449 92,627 406,386 1,098,825
QUAYSIDE HOLDINGS LIMITED AND SUBSIDIARY COMPANIES
CONSOLIDATED STATEMENT OF MOVEMENTS IN EQUITY
For the six months ended 31 December 2017
The accompanying notes form part of these financial statements.

5
QUAYSIDE HOLDINGS LIMITED AND SUBSIDIARY COMPANIES
CONSOLIDATED STATEMENT OF FINANCIAL POSITION
As at 31 December 2017
Unaudited Unaudited Audited
Six months Six months Full year
Dec 2017 Dec 2016 June 2017
Note $'000 $'000 $'000
ASSETS Current assets Cash & cash equivalents 51,645 44,430 43,634
Trade and other receivables 48,127 46,253 47,423
Inventories 355 58 137
Total current assets 100,127 90,741 91,194
Non-current assets Intangible assets 20,828 19,553 21,144
Advances and receivables 30 46 36
Property, plant and equipment 8 1,232,778 1,170,803 1,235,637
Biological assets 9 675 921 -
Investments in equity accounted investees 10 147,315 134,311 138,014
Other financial assets 153,634 126,436 137,103
Investment property 19,051 12,079 17,405
Total non-current assets 1,574,311 1,464,149 1,549,339
Total assets 1,674,438 1,554,890 1,640,533
LIABILITIES Current liabilities Trade and other payables 31,766 32,550 32,687
Revenue received in advance 244 - 316
Loans and borrowings 11 341,795 245,000 255,140
Provisions 2,197 1,250 2,334
Derivative financial instruments 227 381 1,013
Current taxation 5,708 3,736 8,403
Total current liabilities 381,937 282,917 299,893
Non-current liabilities Trade and other payables -
Loans and borrowings 11 125,000 201,786 181,733
Provisions 2,165 1,718 1,888
Derivative financial instruments 10,488 8,955 8,887
Deferred tax liability 56,023 57,706 57,362
Total non-current liabilities 193,676 270,165 249,870
Total liabilities 575,613 553,082 549,763
NET ASSETS 1,098,825 1,001,808 1,090,770
The accompanying notes form part of these financial statements.

6
QUAYSIDE HOLDINGS LIMITED AND SUBSIDIARY COMPANIES
CONSOLIDATED STATEMENT OF FINANCIAL POSITION
As at 31 December 2017
Unaudited Unaudited Audited
Six months Six months Full year
Dec 2017 Dec 2016 June 2017
$'000 $'000 $'000
EQUITY Paid up capital 200,011 200,011 200,011
Reserves 399,801 365,170 399,830
Retained Earnings 92,627 48,510 70,899
Total equity attributable to equity holders of the Parent
692,439
613,691
670,740
Non controlling interest 406,386 388,117 420,030
TOTAL EQUITY 1,098,825 1,001,808 1,090,770
The accompanying notes form part of these financial statements.

7
QUAYSIDE HOLDINGS LIMITED AND SUBSIDIARY COMPANIES
CONDENSED CONSOLIDATED STATEMENT OF CASHFLOWS
For the six months ended 31 December 2017
Unaudited Unaudited Audited
Six months Six months Full year
Dec 2017 Dec 2016 June 2017
$'000 $'000 $'000
Cash flows from operating activities
Cash inflows 149,017 129,118 271,731
Cash outflows (100,111) (84,047) (170,750)
Net cash flows from operating activities 48,906 45,071 100,981
Cash flows from investing activities
Cash inflows 18,522 12,860 33,315
Cash outflows (34,612) (57,787) (97,735)
Net cash flows from investing activities (16,090) (44,927) (64,420)
Cash flows from financing activities
Cash inflows 40,086 78,722 63,699
Cash outflows (65,070) (56,752) (78,832)
Net cash flows from financing activities (24,984) 21,970 (15,133)
Effect of exchange rate changes on cash and cash equivalents
179 140 30
Net increase in cash and cash equivalents 8,011 22,254 21,458
Cash and cash equivalents at the beginning of the period
43,634 22,176 22,176
Cash and cash equivalents at the end of the period 51,645 44,430 43,634
RECONCILIATION OF PROFIT FOR THE PERIOD TO CASHFLOWS FROM OPERATING ACTIVITIES
Profit for the period 62,332 45,365 97,598
Add/(subtract) non-cash and non-operating items (9,539) 1,656 396
Add/(subtract) movements in working capital (3,887) (1,950) 2,987
Net cash flows from operating activities 48,906 45,071 100,981
The accompanying notes form part of these financial statements.

QUAYSIDE HOLDINGS LIMITED AND SUBSIDIARY COMPANIES NOTES TO THE FINANCIAL STATEMENTS (unaudited) for the six months ended 31 December 2017
8
1 REPORTING ENTITY Quayside Holdings Limited (the “Parent”) is a company domiciled in New Zealand and registered under the Companies Act 1993. The Parent is wholly owned by Bay of Plenty Regional Council (“Council”). The Parent is a holding company for the investment activity of Council. Through appropriate subsidiaries, the Parent is the majority shareholder in Port of Tauranga Limited, the owner of a diversified investment portfolio, property and commercial ventures. The Parent is a Financial Markets Conduct (FMC) reporting entity for the purposes of the Financial Markets Conduct Act 2013. The financial statements comply with this Act. The Parent is also listed on the New Zealand Stock Exchange (NZX). The Parent is a council-controlled organisation as defined under Section 6 of the Local Government Act 2002, by virtue of the Council’s right to appoint the Board. The unaudited interim financial statements for Quayside Holdings Limited comprise Quayside Holdings Limited, its subsidiaries and the Group’s interests in Equity Accounted Investees (together referred to as the “Group”). There are two subsets of the Group being the Quayside Group and the Port of Tauranga Group:

QUAYSIDE HOLDINGS LIMITED AND SUBSIDIARY COMPANIES NOTES TO THE FINANCIAL STATEMENTS (unaudited) for the six months ended 31 December 2017
9
2 BASIS OF PREPARATION These financial statements have been prepared in accordance with the requirements of the Local Government Act 2002 and the Financial Markets Conduct Act 2013, which includes the requirement to comply with generally accepted accounting practice in New Zealand (“NZ GAAP”). These interim financial statements have been prepared in accordance with New Zealand International Accounting Standard (“NZ IAS”) 34 Interim Financial Reporting. They do not include all of the information required for full annual financial statements and should be read in conjunction with the annual financial statements and related notes included in Quayside Holdings Limited’s Annual Report for the year ended 30 June 2017. 3 SIGNIFICANT ACCOUNTING POLICIES No new standards have been adopted during the period. All accounting policies adopted are consistent with those followed in the preparation of the Group’s annual financial statements for the year ended 30 June 2017. The following new standards are not yet effective in preparing these financial statements: NZ IFRS 9 Financial Instruments This standard becomes mandatory for the Group’s 2019 consolidated financial statements. The main changes under NZ IFRS 9 are:
• new financial assets classification requirements for determining whether an
asset is measured at fair value or amortised cost;
• a new impairment model for financial assets based on expected losses, which may result in the earlier recognition of impairment losses; and
• revised hedge accounting requirements to better reflect the management of
risks.
Management is currently in the process of evaluating the potential effect of the adoption of NZ IFRS 9, however it is expected that the impact will not be material. NZ IFRS 16 Leases
This standard becomes mandatory for the Group’s 2020 consolidated financial statements. NZ IFRS 16 requires a lessee to recognise a lease liability reflecting future lease payments and a “right-of-use asset” for virtually all lease contracts. Included is an optional exemption for certain short-term leases and leases of low value assets, however this exemption can only be applied by lessees. Management is currently in the process of evaluating the potential effect of the adoption of NZ IFRS 16, however it is expected that the impact will not be material.

QUAYSIDE HOLDINGS LIMITED AND SUBSIDIARY COMPANIES NOTES TO THE FINANCIAL STATEMENTS (unaudited) for the six months ended 31 December 2017
10
4 ACCOUNTING ESTIMATES AND JUDGEMENTS The preparation of the financial statements in conformity with NZ IAS 34 requires management to make judgements, estimates and assumptions that affect the application of accounting policies and the reported amounts of assets, liabilities, income and expenses. Actual results may differ from these estimates. In preparing these financial statements, the significant judgements made by management in applying the Group’s accounting policies and the key sources of estimation and uncertainty, were the same as those applied to the Group’s consolidated financial statements for the year ended 30 June 2017. 5 SEGMENT INFORMATION At 31 December 2017 the Group comprises two main business segments: The first being the business of facilitating export and import activities (Port), and the second being the business of investment (Investing). Both business segments operate in one geographic segment, being New Zealand. Although the Port of Tauranga Group reports three main reportable segments, at the Quayside Group level, information provided by the Port of Tauranga Group is presented to the Chief Operating Decision Maker as one business segment. The unaudited segment results for the six months ended 31 December 2017 are as follows:
Port Investing Total
$'000 $'000 $'000
31 December 2017 Revenue (from external customers) 141,431 1,072 142,503
Other income - 58,051 58,051
Inter-segment revenue - (41,265) (41,265)
141,431 17,858 159,289
Share of profit of Equity Accounted Investees 7,908 18 7,926
Finance income 194 437 631
Finance costs (9,330) (871) (10,201)
Depreciation and amortisation (12,940) (316) (13,256)
Other expenditure (64,310) (1,928) (66,238)
Income tax expense (15,840) 21 (15,819)
Profit after income tax 47,113 15,219 62,332
QUAYSIDE HOLDINGS LIMITED AND SUBSIDIARY COMPANIES NOTES TO THE FINANCIAL STATEMENTS (unaudited) for the six months ended 31 December 2017
11
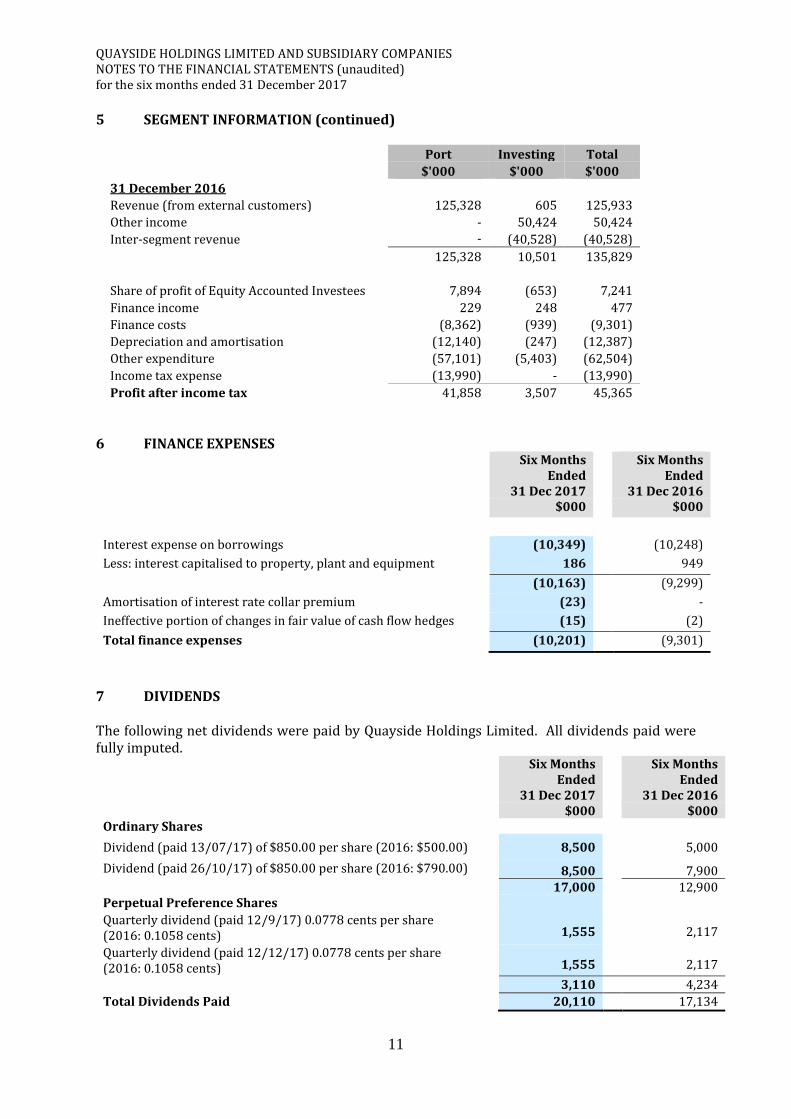
5 SEGMENT INFORMATION (continued)
Port Investing Total
$'000 $'000 $'000
31 December 2016 Revenue (from external customers) 125,328 605 125,933
Other income - 50,424 50,424
Inter-segment revenue - (40,528) (40,528)
125,328 10,501 135,829
Share of profit of Equity Accounted Investees 7,894 (653) 7,241
Finance income 229 248 477
Finance costs (8,362) (939) (9,301)
Depreciation and amortisation (12,140) (247) (12,387)
Other expenditure (57,101) (5,403) (62,504)
Income tax expense (13,990) - (13,990)
Profit after income tax 41,858 3,507 45,365
6 FINANCE EXPENSES
Six Months Ended
31 Dec 2017
Six Months Ended
31 Dec 2016 $000 $000
Interest expense on borrowings (10,349) (10,248)
Less: interest capitalised to property, plant and equipment 186 949
(10,163) (9,299)
Amortisation of interest rate collar premium (23) -
Ineffective portion of changes in fair value of cash flow hedges (15) (2)
Total finance expenses (10,201) (9,301)
7 DIVIDENDS The following net dividends were paid by Quayside Holdings Limited. All dividends paid were fully imputed.
Six Months Ended
31 Dec 2017
Six Months Ended
31 Dec 2016 $000 $000 Ordinary Shares
Dividend (paid 13/07/17) of $850.00 per share (2016: $500.00) 8,500 5,000
Dividend (paid 26/10/17) of $850.00 per share (2016: $790.00) 8,500 7,900 17,000 12,900 Perpetual Preference Shares
Quarterly dividend (paid 12/9/17) 0.0778 cents per share (2016: 0.1058 cents) 1,555 2,117
Quarterly dividend (paid 12/12/17) 0.0778 cents per share (2016: 0.1058 cents) 1,555 2,117
3,110
4,234
Total Dividends Paid 20,110
17,134

QUAYSIDE HOLDINGS LIMITED AND SUBSIDIARY COMPANIES NOTES TO THE FINANCIAL STATEMENTS (unaudited) for the six months ended 31 December 2017
12
7 DIVIDENDS (continued) The dividend cents per share, for the Perpetual Preference Shares, includes resident with-holding tax of 5% paid by the Quayside Group on behalf of shareholders. The Perpetual Preference Shares are subject to a fixed dividend rate which is reset every three years. The latest reset occurred on 13 March 2017, where the rate for the following three year period was set at 4.32%. The next dividend reset date will be 12 March 2020. 8 PROPERTY, PLANT AND EQUIPMENT
Acquisitions and Disposals During the six months ended 31 December 2017, the Port of Tauranga Group acquired assets with a cost of $9,740,000 (2016: $44,021,000). During the six months ended 31 December 2017, the Port of Tauranga Group disposed of assets with a carrying value of nil (2016: $144,000). During the six months ended 31 December 2017, the Quayside Group acquired assets with a cost of $62,847 (2016: $1,793) and wrote off assets with a carrying value of $791 (2016: $2,766). 9 BIOLOGICAL ASSETS Biological assets comprise kiwifruit crops on bearer plants owned by Quayside Properties Limited. Harvesting of the crop takes place in April to June each year. At 31 December each year the crop is measured at fair value. The fair value is deemed to be cost as insufficient biological transformation has occurred. 10 INVESTMENTS IN EQUITY ACCOUNTED INVESTEES During the period, Quayside Holdings Limited entered in to a joint venture, Huakiwi Developments Limited Partnership, with Maori Trustee, Te Tumu Paeroa. The joint venture is for the development of kiwifruit orchards on Maori land across the Bay of Plenty and Gisborne. Quayside’s current investment in the partnership is $6m.

QUAYSIDE HOLDINGS LIMITED AND SUBSIDIARY COMPANIES NOTES TO THE FINANCIAL STATEMENTS (unaudited) for the six months ended 31 December 2017
13
11 LOANS AND BORROWINGS
31 Dec 2017 Carrying
Value Group
31 Dec 2016 Carrying
Value Group $000 $000
Westpac 46,510 56,510
Commercial papers 245,000 245,000
Standby revolving cash advance facility 50,000 20,000
Fixed rate bonds 125,000 125,000
Advances from employees 285 276
Total loans and borrowings 466,795 446,786
Current 341,795 245,000
Non current 125,000 201,786
Total 466,795 446,786
Commercial Papers At 31 December 2017 the Port of Tauranga Group had $245 million of commercial paper debt that is classified within current liabilities (2016: $245 million). Due to this classification, the Port of Tauranga Group’s current liabilities exceed the Port of Tauranga Group’s current assets. Despite this fact, the Port of Tauranga Group does not have any liquidity or working capital concerns as a result of the commercial paper debt being interchangeable with direct borrowings within the standby revolving cash advance facility which is a term facility. Standby Revolving Cash Advance Facility Agreement The Port of Tauranga Limited has a $380 million (2016: $280 million) financing arrangement with ANZ Bank New Zealand Limited, Bank of New Zealand Limited and the Commonwealth Bank of Australia, New Zealand branch and The Bank of Tokyo-Mitsubishi UFJ Limited, Auckland branch. The facility, which is secured, provides for both direct borrowings and support for issuance of commercial papers. Fixed Rate Bonds The Port of Tauranga Limited has issued two six-year fixed rate bonds, a $50 million fixed rate bond with a final maturity on 29 October 2019 and a $75 million fixed rate bond with final maturity on 29 January 2021. Westpac Banking Corporation Quayside Holdings Limited has a $70 million (2016: $70 million) financing arrangement with Westpac Banking Corporation. This facility is secured by a mortgage over shares held in the Port of Tauranga Limited, and provides direct borrowings for the Quayside Group. The facility is for a term of 3 years expiring on 20 October 2018. Management is currently reviewing renewal options for the facility. At 31 December 2017 the balance outstanding was $46.5 million (2016: $56.5 million).

QUAYSIDE HOLDINGS LIMITED AND SUBSIDIARY COMPANIES NOTES TO THE FINANCIAL STATEMENTS (unaudited) for the six months ended 31 December 2017
14
12 RELATED PARTY TRANSACTIONS
Controlling entity The parent entity in the Group is Quayside Holdings Limited, which is 100% owned by the Bay of Plenty Regional Council. Other related parties include subsidiaries and equity accounted investees – refer Note 1. Transactions with related parties: During the six months ended 31 December 2017, the related party transactions and balances with subsidiaries and equity accounted investees were as follows:
Six Months
Ended 31 Dec 2017
Six Months Ended
31 Dec 2016 $000 $000
Transactions with Related Parties
Bay of Plenty Regional Council
Dividends paid by Quayside Holdings Limited 17,000 12,900
Services provided to Quayside Holdings Limited - 30
Accounts payable by Quayside Holdings Limited - 5
Services provided to Quayside Properties Limited 2 3
No related party debts have been written off or forgiven during the period. During the six months ended 31 December 2017, the Group entered into transactions with companies in which Group Directors held directorships. These directorships have not resulted in the Group having significant influence over the operations, policies or key decisions of these companies. Transactions with Key Management Personnel The Group does not provide any non-cash benefits to Directors and executive officers in addition to their Directors’ fees or salaries.
Six Months Ended
31 Dec 2017
Six Months Ended
31 Dec 2016 $000 $000
Short term employee benefits
Directors fees 534 511
Executive salaries 2,276 1,797
Executive salaries at 31 December 2017 includes back dated holiday pay for Port of Tauranga Ltd.

QUAYSIDE HOLDINGS LIMITED AND SUBSIDIARY COMPANIES NOTES TO THE FINANCIAL STATEMENTS (unaudited) for the six months ended 31 December 2017
15
13 COMMITMENTS Six Months
Ended 31 Dec 2017
Six Months Ended
31 Dec 2016 $000 $000
Capital commitments
Estimated capital commitments contracted for at balance date but not provided for:
5,700
9,127
Capital commitments at 31 December 2017 relate to settlement funds due in December 2018 for the purchase of an investment property within the Quayside Group. Quayside Holdings Limited has future uncalled capital commitments for investment in to WNT Ventures Management Limited and Oriens Capital Limited. 14 FINANCIAL INSTRUMENTS The fair value of financial instruments traded in active markets is based on quoted market prices at the reporting date.
The fair value of financial instruments that are not traded in active markets (for example over-the-counter derivatives) are determined by using market accepted valuation techniques incorporating observable market data about conditions existing at each reporting date.
The fair value of interest rate swaps is calculated as the present value of the estimated future cash flows. The fair value of forward exchange contracts is determined using quoted forward exchange rates at the reporting date.
Derivative financial instruments are categorised as Level 2 in the fair value measurement hierarchy. The carrying value of all financial assets and liabilities represent a reasonable approximation of their fair value. 15 SUBSEQUENT EVENTS Refinancing of Standby Revolving Cash Advance Facility
On 1 January 2018, the Port of Tauranga Limited partially refinanced its $380 million financing arrangement with ANZ Bank New Zealand Limited, Bank of New Zealand Limited, Commonwealth Bank of Australia New Zealand branch and The Bank of Tokyo-Mitsubishi UFJ Limited, Auckland branch.
The Parent Company decreased the size of its tranche 1 facility, which was maturing on 31 March 2018, from $100 million to $50 million and extended the maturity date of this tranche to 30 June 2019. The Port of Tauranga Limited also added a new $50 million tranche to the Standby Revolving Cash Advance Facility, tranche 6, maturing 30 June 2019.

QUAYSIDE HOLDINGS LIMITED AND SUBSIDIARY COMPANIES NOTES TO THE FINANCIAL STATEMENTS (unaudited) for the six months ended 31 December 2017
16
QUAYSIDE HOLDINGS LIMITED AND SUBSIDIARY COMPANIES
DIRECTORY as at 31 December 2017
Directors holding office at 31 December 2017 were: Quayside Group R A McLeod (Chair) B Hewlett (Appointed 1 November 2017)
M MacLeod J M Nees W J Parker R B Tait P J Thompson Port of Tauranga Group D A Pilkington (Chair) K R Ellis J C Hoare A R Lawrence D W Leeder R A McLeod (Appointed 31 October 2017) Loans There were no loans made by Group companies or any of its subsidiaries to Directors. Indemnification and insurance of directors and officers The Group has arranged policies of Directors’ and Officers’ Liability Insurance and separate Directors’ and Officers’ defence costs insurance. Chief Executive A S Hamilton Solicitor Cooney Lees Morgan PO Box 143 Tauranga 3110 Registered Office 53 Spring Street Tauranga 3110 Ph: 07 579 5925


