25
Half-year results 23 February 2015

Half-year results
23 February 2015

Overview & Results Highlights
Tom Gorman, CEO
2

Key 1H15 result messages
On track to deliver FY15 guidance
Underlying Profit expected to be US$1,055-1,085M (30 June 2014 FX)
Improved Pallets result, with leverage to bottom line
Strong profit performance in Europe: supply-chain efficiencies and improved sales mixDirect cost challenges in North America: asset management impacts, transport inflation
Strong positive sales and profit momentum in RPCs worldwide
Containers result reflects diverse portfolio
Encouraging sales and profit momentum in IBCs and AerospaceFerguson contribution in line with Brambles’ expectationsAutomotive sector impacted by ongoing industry challenges
Increased interim dividend of AU14.0¢ per share
Continued improvement in Group safety performance
Solid result with full-year guidance maintained
3

Group safety performance
0
5
10
15
20
25
FY10 FY11 FY12 FY13 FY14 1H15
BIFR: continuing businesses BIFR: reported
Improving overall but one fatality in 1H15
4
Note: BIFR stands for Brambles Injury Frequency Rate, recorded per per million man hours; see slide 26 for full definition.1 Operations owned continuously throughout FY10 to 1H15, excluding businesses acquired or divested during that period.2 Includes restatements in FY12 to incorporate acquired operations and, in FY13 and FY14, the demerged Recall business.
1 2
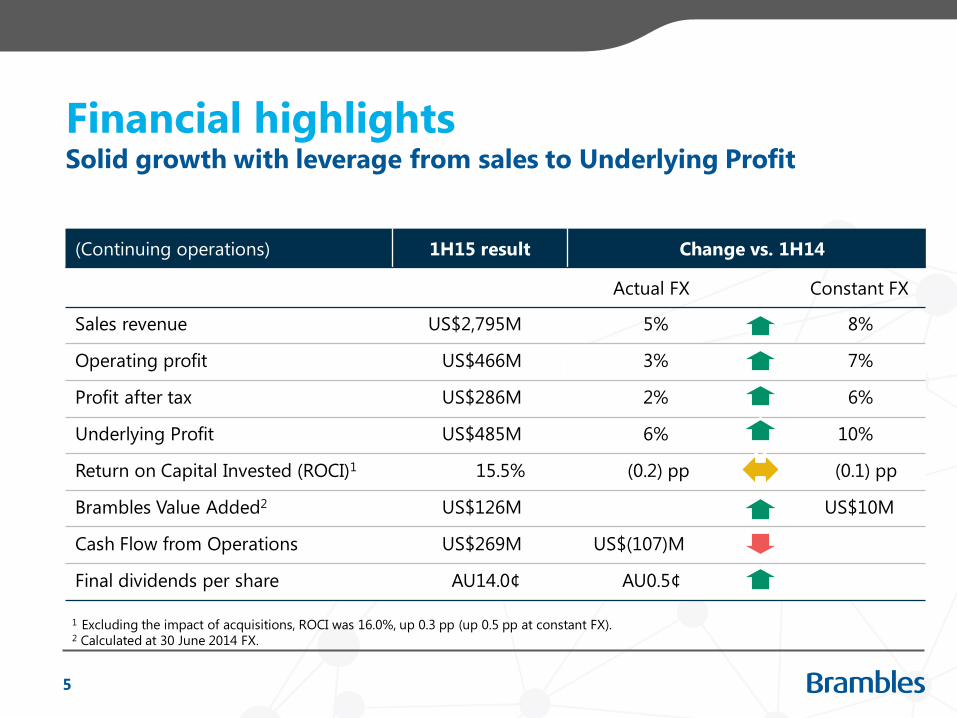
Financial highlightsSolid growth with leverage from sales to Underlying Profit
5
(Continuing operations) 1H15 result Change vs. 1H14
Actual FX Constant FX
Sales revenue US$2,795M 5% 8%
Operating profit US$466M 3% 7%
Profit after tax US$286M 2% 6%
Underlying Profit US$485M 6% 10%
Return on Capital Invested (ROCI)1 15.5% (0.2) pp (0.1) pp
Brambles Value Added2 US$126M US$10M
Cash Flow from Operations US$269M US$(107)M
Final dividends per share AU14.0¢ AU0.5¢
1 Excluding the impact of acquisitions, ROCI was 16.0%, up 0.3 pp (up 0.5 pp at constant FX).2 Calculated at 30 June 2014 FX.

Delivery scorecard
FY15 Guidance 1H15 Progress
Constant FX sales revenue growth of 8-9% On track
Delivery of Global Supply Chain efficienciesUS$12M delivered in 1H15
US$22M to deliver in 2H15
Underlying Profit: US$1,055-1,085M (30 June 2014 FX –
reflecting growth of 9-12%)On track
Improvement in Group ROCI prior to acquisition impacts On track
Positive underlying1 Free Cash Flow after dividendsUS$(44)M result for 1H15
Improvement anticipated in 2H15
On track for FY15 guidance and FY19 targets
6
High “single digit”
(i.e. 7-9%) constant FX
sales revenue growth
Average Capital Invested
compound annual
growth rate of 5%
Consistent improvement
in Group ROCI to at
least 20% by FY19
FY19 Targets
(excluding
acquisitions)
1 Excluding Significant Items and discontinued operations.

Continued momentum
2,669
2,8762,795
41
61
51 450
(81)
1H14 Pallets:
net new
business
Pallets:
organic
volume,
price, mix
RPCs Containers
(excluding
acquisitions)
Acquisitions FY14
(constant
FX)
FX 1H15
Sales revenue: constant FX growth of 8% in 1H15 (US$M)
7
Strong contribution
worldwide led by Europe
Solid, resilient performance
despite economic and
competitive pressures and
below-trend contribution
from emerging markets
Ferguson, Transpac and
Airworld contributions
USD appreciation vs.
other major operating
currencies

Pallets segment result summarySolid sales growth with bottom-line leverage
1H15 Change vs. 1H14
(US$M)Actual
FX
Constant
FX
Americas 1,181 3% 5%
EMEA 729 1% 5%
Asia-Pacific 181 - 3%
Sales revenue 2,091 2% 5%
Operating profit 403 2% 6%
Underlying Profit 410 4% 7%
ROCI 20.5% 0.4 pp 0.6 pp
Solid contribution to sales growth
from net new business wins, pricing
and organic volume growth
Global Supply Chain efficiencies and
modest pricing/mix benefits offset
North America direct cost impacts
Continued ROCI improvement
reflects profit growth and asset
management benefits
8

RPCs segment results summaryStrong sales growth and improved profitability
1H15 Change vs. 1H14
(US$M)Actual
FX
Constant
FX
Europe 305 6% 11%
North America 94 11% 11%
ANZ & South Africa 60 6% 10%
South America 12 14% 36%
Sales revenue 471 7% 11%
Operating profit 67 16% 19%
Underlying Profit 67 16% 19%
ROCI 8.6% 1.1 pp 1.1 pp
All regions contribute strongly to
sales growth, led by Europe, as
adoption of RPCs continues
Modest costs growth compared with
1H14 reflecting scale efficiency as
business grows
Solid improvement in ROCI
commensurate with profit
improvement
9

Containers segment result summaryResult reflects diverse portfolio of businesses
1H15 Change vs. 1H14
(US$M) Actual FX Constant FX
Including
acquisitions
Excluding
acquisitions
Automotive 74 (6)% (3)% (3)%
IBCs 66 22% 26% 11%
Oil & Gas 53 153% 160% (9)%
Aerospace 40 23% 26% 5%
Sales
revenue233 25% 29% 2%
Operating
profit30 70% 75% 14%
Underlying
Profit31 70% 76% 10%
ROCI 8.0% (0.6) pp (0.6) pp 0.7 pp
Sales growth primarily driven by
acquisitions of Ferguson,
Transpac and Airworld
Subdued ex-acquisitions growth
reflecting:
Industry decline in European and
Australian automotive
Customer activity in CCC related to
timing of refinery maintenance
Positive momentum with profit
margins and ROCI, excluding
acquisition impacts
10
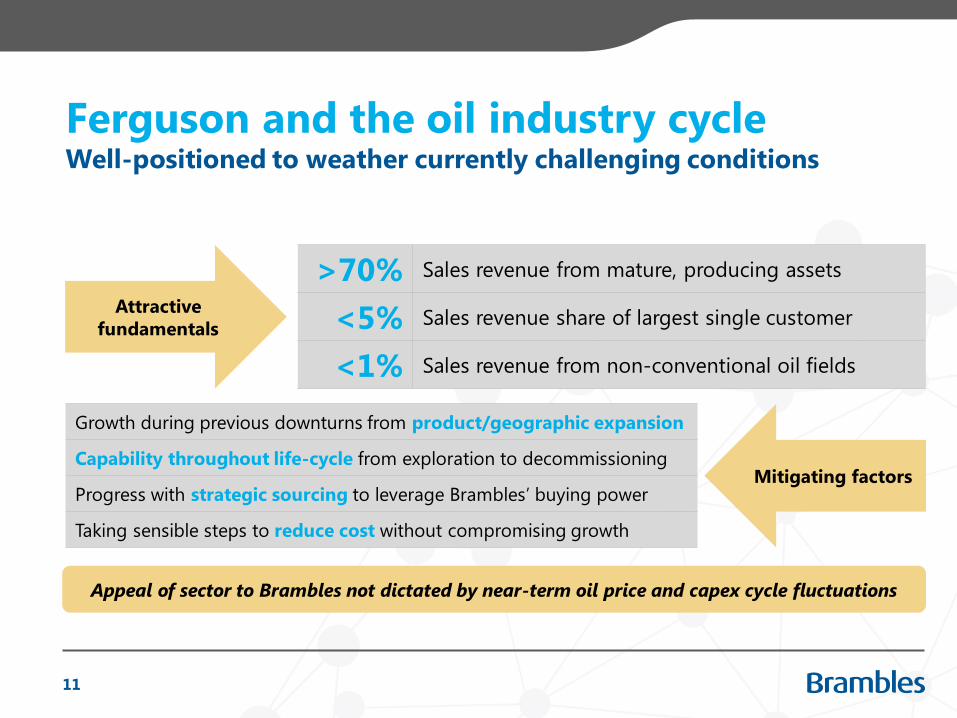
Ferguson and the oil industry cycle
>70% Sales revenue from mature, producing assets
<5% Sales revenue share of largest single customer
<1% Sales revenue from non-conventional oil fields
Well-positioned to weather currently challenging conditions
11
Appeal of sector to Brambles not dictated by near-term oil price and capex cycle fluctuations
Attractive
fundamentals
Mitigating factors
Growth during previous downturns from product/geographic expansion
Capability throughout life-cycle from exploration to decommissioning
Progress with strategic sourcing to leverage Brambles’ buying power
Taking sensible steps to reduce cost without compromising growth
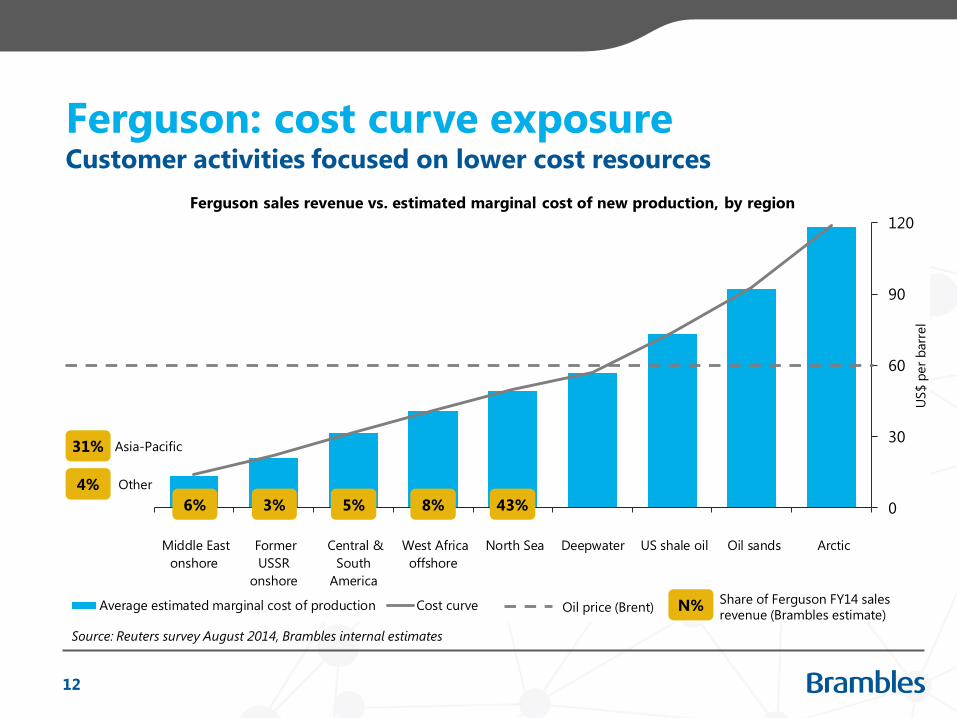
Ferguson: cost curve exposureCustomer activities focused on lower cost resources
12
0
30
60
90
120
Arctic Oil sands US shale oil Deepwater North Sea West Africa
offshore
Central &
South
America
Former
USSR
onshore
Middle East
onshore
US$ p
er
barr
el
Ferguson sales revenue vs. estimated marginal cost of new production, by region
Average estimated marginal cost of production Cost curve
Source: Reuters survey August 2014, Brambles internal estimates
Oil price (Brent)Share of Ferguson FY14 sales
revenue (Brambles estimate)
43%8%5%3%6%
Other 4%
Asia-Pacific 31%
N%

Financial Analysis
Zlatko Todorcevski, CFO
13

Operating profit analysis (US$M)Continued growth offsets cost challenges and enables investment
14
458
506485
466
75
1212
(44) (7) (21)
(19)
1H14
Underlying
Profit
Volume,
price,
mix
Acqui-
sitions
Global
Supply
Chain
Direct
costs
Other 1H15
Underlying
Profit
(constant
FX)
FX 1H15
Underlying
Profit
Significant
Items
1H15
operating
profit
North America
transport costs and
damage rate from
increased recoveries
and utilisation
Positive pricing and sales mix
benefits throughout Pallets,
growth in RPCs
Includes US$10M
corporate cost
allocated to Recall
in 1H14
North America
freight rate inflation
from tight trucking
industry capacity

Pallets cost trends and outlookOutlook improving but headwinds remain
15
Plant costs
Transport
costs
DIN
Overheads
1H15 performance and drivers
Asset utilisation impacts in US
Global Supply Chain efficiencies
Sharp inflation in US freight rates
Europe sales mix benefits
Reduced IPEP expense
Cost savings in North America
Small reduction in overheads/sales ratio
globally
Finalize plan for durability improvement
Final Global Supply Chain efficiencies
Continued US inflation headwinds
Reduced sales mix benefits in Europe
Continued trend for lower DIN/sales
revenue ratio
Modest benefits from early stages of
One Better program
2H15 considerations

Profit reconciliationModest increases in non-operating expenses
16
(US$M, continuing operations) 1H15 1H14 Change
Actual FX Constant FX
Underlying Profit 485 458 6% 10%
Significant Items (19) (5)
Operating profit 466 453 3% 7%
Net finance costs (59) (57)
Tax expense (121) (116)
Profit after tax 286 280 2% 6%
Weighted average number of shares 1,564M 1,558M
Basic earnings per share (US¢) 18.3 18.0 2% 6%
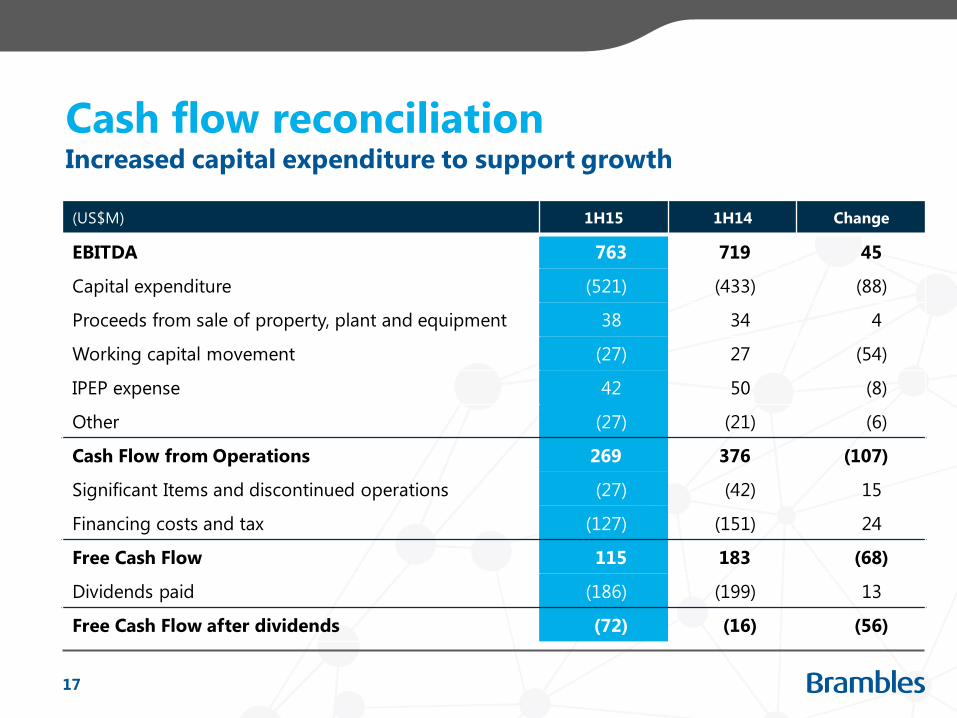
Cash flow reconciliation
(US$M) 1H15 1H14 Change
EBITDA 763 719 45
Capital expenditure (521) (433) (88)
Proceeds from sale of property, plant and equipment 38 34 4
Working capital movement (27) 27 (54)
IPEP expense 42 50 (8)
Other (27) (21) (6)
Cash Flow from Operations 269 376 (107)
Significant Items and discontinued operations (27) (42) 15
Financing costs and tax (127) (151) 24
Free Cash Flow 115 183 (68)
Dividends paid (186) (199) 13
Free Cash Flow after dividends (72) (16) (56)
Increased capital expenditure to support growth
17
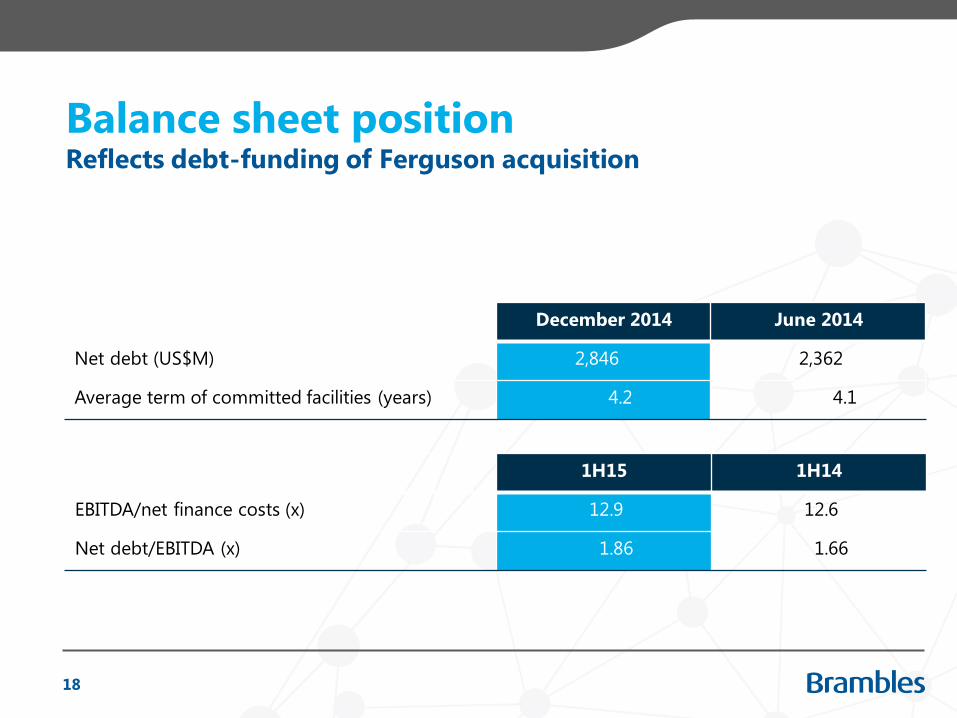
Balance sheet position
December 2014 June 2014
Net debt (US$M) 2,846 2,362
Average term of committed facilities (years) 4.2 4.1
Reflects debt-funding of Ferguson acquisition
1H15 1H14
EBITDA/net finance costs (x) 12.9 12.6
Net debt/EBITDA (x) 1.86 1.66
18

Summary & Outlook
Tom Gorman, CEO
19

Key 2H15 focus areasShort-term priorities to drive long-term value
20
Cost – mitigate transport inflation; deploy pallet durability actions in
CHEP USA
Brand – refresh brand in CHEP Pallets; roll-out of new customer solution
strategy to begin in USA
Innovation – deploy new technologies/leverage data to build customer
relationships and further strengthen asset management
Growth strategy – expand in under-penetrated verticals and segments
and new geographies
3
2
4
1
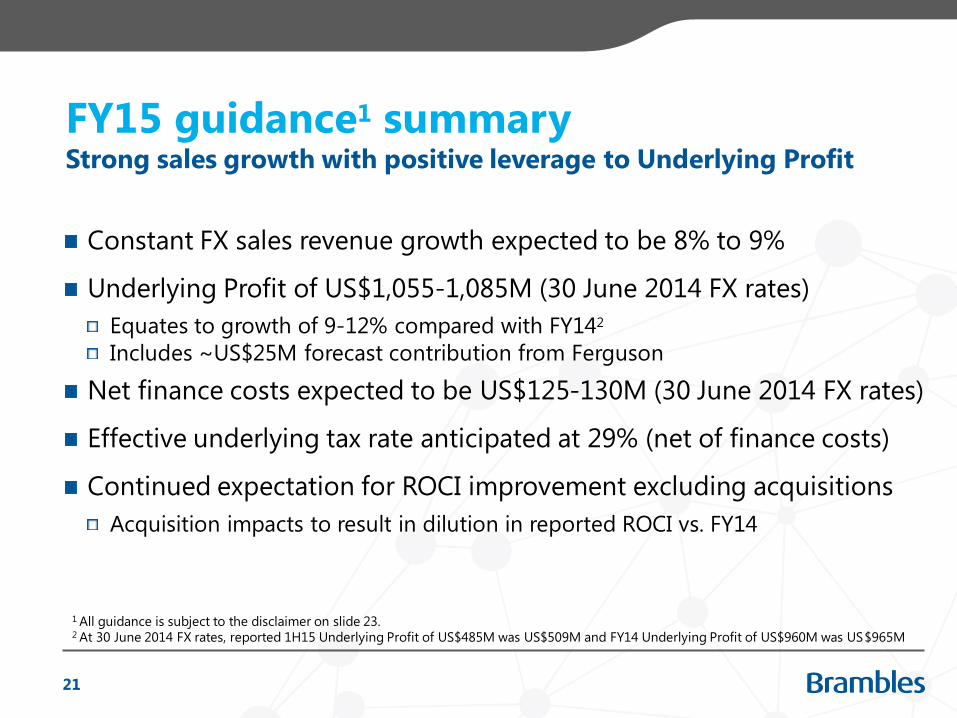
FY15 guidance1 summary
Constant FX sales revenue growth expected to be 8% to 9%
Underlying Profit of US$1,055-1,085M (30 June 2014 FX rates)
Equates to growth of 9-12% compared with FY142
Includes ~US$25M forecast contribution from Ferguson
Net finance costs expected to be US$125-130M (30 June 2014 FX rates)
Effective underlying tax rate anticipated at 29% (net of finance costs)
Continued expectation for ROCI improvement excluding acquisitions
Acquisition impacts to result in dilution in reported ROCI vs. FY14
Strong sales growth with positive leverage to Underlying Profit
21
1 All guidance is subject to the disclaimer on slide 23.2 At 30 June 2014 FX rates, reported 1H15 Underlying Profit of US$485M was US$509M and FY14 Underlying Profit of US$960M was US$965M

Q&A
Disclaimer
The release, publication or distribution of this presentation in certain jurisdictions may be restricted by law and therefore persons in such
jurisdictions into which this presentation is released, published or distributed should inform themselves about and observe such
restrictions.
This presentation does not constitute, or form part of, an offer to sell or the solicitation of an offer to subscribe for or buy any securities,
nor the solicitation of any vote or approval in any jurisdiction, nor shall there be any sale, issue or transfer of the securities referred to in
this presentation in any jurisdiction in contravention of applicable law.
Persons needing advice should consult their stockbroker, bank manager, solicitor, accountant or other independent financial advisor.
Certain statements made in this presentation are forward-looking statements.
These forward-looking statements are not historical facts but rather are based on Brambles’ current expectations, estimates and
projections about the industry in which Brambles operates, and beliefs and assumptions. Words such as "anticipates," "expects,"
"intends," "plans," "believes," "seeks,” "estimates," and similar expressions are intended to identify forward-looking statements.
These statements are not guarantees of future performance and are subject to known and unknown risks, uncertainties and other factors,
some of which are beyond the control of Brambles, are difficult to predict and could cause actual results to differ materially from those
expressed or forecasted in the forward-looking statements. Brambles cautions shareholders and prospective shareholders not to place
undue reliance on these forward-looking statements, which reflect the view of Brambles only as of the date of this presentation.
The forward-looking statements made in this presentation relate only to events as of the date on which the statements are made.
Brambles will not undertake any obligation to release publicly any revisions or updates to these forward-looking statements to reflect
events, circumstances or unanticipated events occurring after the date of this presentation except as required by law or by any
appropriate regulatory authority.
23

Investor Relations contacts
James HallVice President, Investor Relations & Corporate [email protected]+61 2 9256 5262+61 401 524 645
Raluca ChiriacescuManager, Investor [email protected]+61 2 9256 5211+61 427 791 189
24

Half-year results
www.brambles.com


