32
Condensed Interim Financial Information For The Half Yearly Ended December 31, 2015 Half Yearly Report

Condensed Interim Financial InformationFor The Half Yearly Ended December 31, 2015
Half Yearly Report

Company InformationBOARD OF DIRECTORS MOHOMED BASHIR - Chairman
ZAIN BASHIR - Vice Chairman/ Executive DirectorMOHAMMED ZAKI BASHIR - Chief Executive OfficerZIAD BASHIR - Non ExecutiveS.M. NADIM SHAFIQULLAH - IndependentDR. AMJAD WAHEED - IndependentADNAN AFRIDI - Independent
CHIEF FINANCIAL OFFICER MOHAMMED SALEEM SATTAR
COMPANY SECRETARY MOHAMMED SALIM GHAFFAR
AUDIT COMMITTEE S.M. NADIM SHAFIQULLAH - Chairman & MemberMOHOMED BASHIR - MemberADNAN AFRIDI - MemberMOHAMMED SALIM GHAFFAR - Secretary
HUMAN RESOURCE AND MOHOMED BASHIR - Chairman & MemberREMUNERATION ZAIN BASHIR - MemberCOMMITTEE S.M. NADIM SHAFIQULLAH - Member
MOHAMMED SALIM GHAFFAR - Secretary
BANKERS ALLIED BANK LIMITEDBANK AL HABIB LIMITEDASKARI BANK LIMITEDAL BARAKA BANK (PAKISTAN) LIMITEDBANK ALFALAH LIMITEDBANKISLAMI PAKISTAN LIMITEDBURJ BANK LIMITEDTHE BANK OF PUNJABDUBAI ISLAMIC BANK PAKISTAN LIMITEDFAYSAL BANK LIMITEDHABIB BANK LIMITEDHABIB METROPOLITAN BANK LIMITEDMCB BANK LIMITEDMEEZAN BANK LIMITEDNATIONAL BANK OF PAKISTANNIB BANK LIMITEDSAMBA BANK LIMITEDSILKBANK LIMITEDSONERI BANK LIMITEDSTANDARD CHARTERED BANK (PAKISTAN) LIMITEDUNITED BANK LIMITED
AUDITORS KRESTON HYDER BHIMJI & CO.Chartered Accountants
INTERNAL AUDITORS GRANT THORNTON ANJUM RAHMANChartered Accountants
LEGAL ADVISORS A.K. BROHI & COADVOCATES
REGISTERED OFFICE PLOT NO.82,MAIN NATIONAL HIGHWAY,LANDHI, KARACHI-75120
SHARE REGISTRAR FAMCO ASSOCIATES (PRIVATE) LIMITED8-F, NEXT TO HOTEL FARAN, NURSERY, BLOCK 6,P.E.C.H.S., SHAHRAH-E-FAISAL, KARACHI.PHONE NO. (+92-021) 34380101-5FAX NO. (+92-021) 34380106
MILLS LANDHI INDUSTRIAL AREA,KARACHI-75120
E-MAIL [email protected]
URL www.gulahmed.com
Half Yearly Report {1}
Directors’ ReviewDirectors of Gul Ahmed Textile Mills Limited are pleased to present review of the affairs of the Company for half year ended December 31, 2015.
Economic and Industrial overviewContinuous decline of oil and commodity prices in international market have affected average CPI inflation, which has declined to 2.1% during July to December 2015. The balance of payment position in Pakistan has also improved in the first half of this fiscal year (FY) due to persistent decline in international oil prices and steady growth in workers’ remittances.
Large-scale manufacturing (LSM) grew by 4.4% during July to November 2016 as compared to 3.1% in the corresponding period. LSM mainly benefited from monetary easing, falling international prices of key inputs, increased domestic demand and expansion of construction activities. Finding major macroeconomic indicators continuously demonstrating improvement during first half of FY 2016, State Bank of Pakistan also decided to keep the policy rate unchanged at 6%.
Overall, exports of the country in first half of current FY declined by 11% over the corresponding period. Following the trend, textile exports of the country also witnessed a decline of 4.6%. The textileindustry of Pakistan was able to earn USD 6.5 billion during first half of FY2016 as compared to USD 6.8 billion in the corresponding period. Cotton yarn, cotton cloth and home textile sectors posted decline in exports by 16%, 9% and 2%, respectively in July to December 2015 as compared to the corresponding period. Only the readymade garments sector could post 5% growth in the first half of current FY.
Decline in exports is due to challenging business environment for the industry including loss of competitiveness due to higher input cost and unfavorable PKR/USD parity, slowdown in purchasing byimporters. These are further alienated by governmental policies to increasingly burden the business class with taxes for meeting the deficits of the country, and shortages of energy.
Company’s PerformanceThe overall sales volume has reduced due to volume of order and change in buyers/ product mix,though the local sales have increased by 4% over the corresponding period. The management strategically reduced export sales volume which helped improve the margin of profit. The gross profit has grown up from 17% to 23% over the corresponding period which exhibits the success of approach change by management. The drive to reduce imbalances, inefficiencies in processes and rationalizationof cost also resulted in reduction in the cost of production without compromising the quality. Resultantly, the Company was able to earn profit before tax amounting to Rs. 448 million and profit after tax amounting to Rs. 423 million as compared to Rs. 321 million and Rs. 252 million, respectively in the corresponding period. The performance of your Company has not only improved when compared with corresponding six months of 2014 but the gross profit also improved to 24.90% from 21.07% and profit before tax to 6.42% from (0.89%) when compared with first quarter of the current year. The Earnings per Share (EPS) has also increased to Rs. 1.85 in the first half of current FY and Rs. 2.25 in the second quarter of current FY as compared to Rs. 1.10 and Rs. 1.88 in the corresponding periods, respectively.
Half Yearly Report {2}

The important financial statistics for the current and corresponding period are as under:
Future ProspectsWe are optimistic that the growth in business performance will be achieved in the remaining two quarters of FY2016. The leverage in economic activity appears to continue beyond FY2016 on the back of energy and infrastructure projects under CPEC. Expected increase in FDI from China may help further increase in foreign exchange reserves. Monetary easing and better economic environment will further encourage firms for long term investments or expansion plans which will result in improvementof LSM.
However, exports performance is dependent on policy implementation, reversal of decision of artificially holding the exchange rate by the Government and increase in external demand. Further, easing of domestic constraints with the completion of ongoing energy projects will also help in improving export competitiveness. However, Government has to seriously consider the Rupee Dollar parity and the rebates allowed to textile currently which in no way match rebates offered by neighboring country. The ignorance may result in further reduction in export volume which will in turn reduce the foreign exchange inflow in the country.
We expect that the performance in terms of profitability will be encouraging in the remaining two quarters ofFY2016 mainly on account of management initiatives as mentioned above. We will continue to strive penetrating the export and domestic market, catering the customers demand in terms of style, innovation, place and price to further enhance both the rate and volume of gross and net margins.
AcknowledgementDirectors acknowledge and appreciate the efforts of employees and valuable support of various Government Departments, Financial Institutions and our customers.
For and on behalf of the Board
Mohammed Zaki BashirKarachi Chief Executive OfficerFebruary25, 2016
Description Units Jul-15 to Dec-15 Jul-14 to Dec-14Export Sales Rs. in millions 8,685 11,377Local Sales Rs. in millions 5,071 4,883Total Sales Rs. in millions 13,757 16,260Gross Profit Rs. in millions 3,198 2,740Profit before tax (PBT) Rs. in millions 448 321Profit after tax (PAT) Rs. in millions 423 252EBITDA Rs. in millions 1,439 1,507EPS Rupees 1.85 1.10Debt to equity Time 0.45 0.34Current ratio Time 1.04 1.05Break-up-value per share Rupees 31.72 29.89
Half Yearly Report {3}


Condensed Interim Un-consolidated Balance SheetAs at December 31, 2015
Un-Audited AuditedDecember June
Note 2015 2015
EQUITY AND LIABILITIES
SHARE CAPITAL AND RESERVES Authorised share capital 400,000,000 (2014: 400,000,000) ordinary shares of Rs.10 each 4,000,000 4,000,000
Issued, subscribed and paid-up share capital 2,285,228 2,285,228 228,522,772 (2014: 228,522,772) ordinary shares of Rs. 10 each Revenue reserves 4,480,000 4,230,000
Unappropriated profit 484,060 654,244 7,249,288 7,169,472
NON-CURRENT LIABILITIES Long term financing - Secured 3,271,901 2,407,732 Deferred liabilities
Deferred taxation - net 289,921 350,339 Staff retirement benefits 39,053 43,951
328,974 394,290
CURRENT LIABILITIES Trade and other payables 4 4,567,034 5,213,190 Accrued mark-up/profit 165,205 206,481 Short term borrowings 11,894,418 8,838,174 Current maturity of long term financing 469,970 714,008
17,096,627 14,971,853
CONTINGENCIES AND COMMITMENTS 5
27,946,790 24,943,347
ASSETS
NON-CURRENT ASSETSProperty, plant and equipment 6 9,994,803 9,038,685 Intangible assets 7 14,968 11,481 Long term investment 58,450 58,450 Long term loans and advances 15,011 12,859 Long term deposits 105,666 93,572
10,188,898 9,215,047
CURRENT ASSETSStores, spare parts and loose tools 814,772 699,062 Stock-in-trade 12,548,521 11,283,818 Trade debts 2,191,087 1,913,872 Loans and advances 860,780 354,124 Short term prepayments 113,928 96,798 Other receivables 354,449 331,399 Tax refunds due from Government 510,330 750,196 Income tax refundable-payments less provision 243,840 181,730 Cash and bank balances 120,185 117,301
17,757,892 15,728,300
27,946,790 24,943,347
MOHOMED BASHIR MOHAMMED ZAKI BASHIRChairman Chief Executive Officer
Rupees in thousand
The annexed notes form an integral part of these condensed interim un-consolidated financial information.
Half Yearly Report {5}

Condensed Interim Un-ConsolidatedProfit And Loss AccountFor the half year ended December 31, 2015
NoteJuly to July to October to October to
December December December December2015 2014 2015 2014
Sales 13,756,912 16,259,935 7,815,479 9,585,104
Cost of sales Opening stock of finished goods 8,970,687 8,658,343 9,582,009 9,291,714 Cost of goods manufactured 9,589,094 11,110,882 5,207,531 5,797,822 Purchases and processing charges 2,573,322 2,840,596 1,654,241 1,705,249 Closing stock of finished goods (10,574,636) (9,089,752) (10,574,636) (9,089,752)
10,558,467 13,520,069 5,869,145 7,705,033 Gross profit 3,198,445 2,739,866 1,946,334 1,880,071
Distribution cost 1,402,794 1,019,509 756,034 563,278 Administrative expenses 851,087 736,138 432,336 366,617 Other operating expenses 64,845 24,208 38,830 24,199
2,318,726 1,779,855 1,227,200 954,094 879,719 960,011 719,134 925,977
Other income 47,398 91,275 (16,807) (28,178)
Operating profit 927,117 1,051,286 702,327 897,799
Finance cost 478,641 730,416 200,884 450,793
Profit before taxation 448,476 320,870 501,443 447,006
Provision for taxation- Current 9 86,293 90,693 48,253 39,736 - Deferred (60,418) (22,028) (60,418) (22,028)
25,875 68,665 (12,165) 17,708 Profit after taxation 422,601 252,205 513,608 429,298
Earnings per share - basic and diluted (Rs.) 1.85 1.10 2.25 1.88
MOHOMED BASHIR MOHAMMED ZAKI BASHIRChairman Chief Executive Officer
Un-AuditedHalf year ended Quarter ended
Rupees in thousand
The annexed notes form an integral part of these condensed interim un-consolidated financial information.
Half Yearly Report {6}

Condensed Interim Un-ConsolidatedStatement of Comprehensive IncomeFor the half year ended December 31, 2015
July to July to October to October toDecember December December December
2015 2014 2015 2014
Profit after taxation 422,601 252,205 513,608 429,298
Other comprehensive income - - - -
Total comprehensive income 422,601 252,205 513,608 429,298
MOHOMED BASHIR MOHAMMED ZAKI BASHIRChairman Chief Executive Officer
Un-AuditedHalf year ended Quarter ended
Rupees in thousand
The annexed notes form an integral part of these condensed interim un-consolidated financial information.
Half Yearly Report {7}

Condensed Interim Un-ConsolidatedCash Flow StatementFor the half year ended December 31, 2015
Un-AuditedDecember December
2015 2014
CASH FLOWS FROM OPERATING ACTIVITIES
Profit before taxation 448,476 320,870
Adjustments for:Depreciation 508,998 450,157 Amortisation 2,524 5,605 Provision for gratuity 19,078 18,552 Finance cost 478,641 730,416 Provision for slow moving/obsolete items 5,322 7,005 Provision for doubtful debts 8,842 15,413
Loss on sale of property, plant and equipment 31,606 427 Gain on sale of property, plant and equipment (4,859) (6,672)
1,050,152 1,220,903 Cash flows from operating activities before adjustments of
working capital 1,498,628 1,541,773
Changes in working capital: (Increase)/decrease in current assets
Stores, spare parts and loose tools (121,032) (22,453) Stock-in-trade (1,264,703) (543,518) Trade debts (286,057) (1,606,648) Loans and advances (506,656) (193,029) Short term prepayments (17,130) (203,672) Other receivables (23,050) (135,759) Tax refunds due from Government 421,596 132,787
(1,797,032) (2,572,292) (Decrease) in current liabilities
Trade and other payables (650,536) (1,537,432) (2,447,568) (4,109,724)
Cash used in operations (948,940) (2,567,951)
Gratuity paid (23,976) (15,739) Finance cost paid (519,917) (634,746) Income tax paid (330,133) (166,441) Net increase in long term loans and advances (2,152) (606) Net increase in long term deposits (12,094) (2,707)
(888,272) (820,239) Net cash used in operating activities (1,837,212) (3,388,190)
CASH FLOWS FROM INVESTING ACTIVITIES
Addition to property, plant and equipment (1,520,976) (994,485) Addition to intangible assets (6,011) - Proceeds from sale of property, plant and equipment 29,113 15,878 Net cash used in investing activities (1,497,874) (978,607)
Rupees in thousand
Half Yearly Report {8}

Condensed Interim Un-ConsolidatedCash Flow StatementFor the half year ended December 31, 2015
Note Un-AuditedDecember December
2015 2014
CASH FLOWS FROM FINANCING ACTIVITIES
Proceeds from long term financing 1,722,298 824,064 Repayments of long term financing (1,102,167) (338,958) Dividend paid (338,405) (80,959)
Net cash generated from financing activities 281,726 404,147
Net decrease in cash and cash equivalents (3,053,360) (3,962,650)
Cash and cash equivalents - at the beginning of the period (8,720,873) (7,714,816)
Cash and cash equivalents - at the end of the period 8 (11,774,233) (11,677,466)
MOHOMED BASHIR MOHAMMED ZAKI BASHIRChairman Chief Executive Officer
Rupees in thousand
The annexed notes form an integral part of these condensed interim un-consolidated financial information.
Half Yearly Report {9}

Condensed Interim Un-ConsolidatedStatement of Changes in EquityFor the half year ended December 31, 2015
Share Capital Revenue reserve
Unappropriated profit Total
Balance as at June 30, 2014 (Audited) 1,828,182 3,580,000 1,251,721 6,659,903
Transfer to revenue reserve - 650,000 (650,000) -
Transaction with owners
457,046 - (457,046) -
(80,959) (80,959)
Total comprehensive income
Profit after taxation - - 252,205 252,205
Other comprehensive income - - - -
- - 252,205 252,205
Balance as at December 31, 2014 (Un-audted) 2,285,228 4,230,000 315,921 6,831,149
Total comprehensive income
Profit after taxation - - 352,738 352,738
Other comprehensive income - - (14,415) (14,415)
- - 338,323 338,323
Balance as at June 30, 2015 (Audited) 2,285,228 4,230,000 654,244 7,169,472
Transfer to revenue reserve - 250,000 (250,000) -
Transaction with owners(342,785) (342,785)
Total comprehensive income
Profit after taxation - - 422,601 422,601
Other comprehensive income - - - -
- - 422,601 422,601
Balance as at December 31, 2015 (Un-audited) 2,285,228 4,480,000 484,060 7,249,288
MOHOMED BASHIR MOHAMMED ZAKI BASHIRChairman Chief Executive Officer
Final dividend for the year ended June 30, 2015
for the half year ended December 2015 (un-audited)
The annexed notes form an integral part of these condensed interim un-consolidated financial information.
Rupees in thousand
Issue of bonus shares for the year ended June 30, 2014
Final dividend for the year ended June 30, 2014 to minor shareholders
for the half year ended December 2014 (un-audited)
for the period January 01, 2015 to June 30, 2015
Half Yearly Report {10}
Notes to the Condensed Interim Un-consolidated Financial Information (Un-audited)For the half year ended December 31, 2015
1 LEGAL STATUS AND ITS OPERATIONS
The Company’s registered office is situated at Plot No. 82, Main National Highway, Landhi, Karachi.
The Company is a subsidiary of Gul Ahmed Holdings (Private) Limited.
Details of SubsidiariesCountry of
Date of Incorporation % Holding Incorporation Gul Ahmed International Limited November 27, 2002 100% U.A.EGTM (Europe) Limited - Indirect subsidiary April 17, 2003 100% U.KGTM USA Corp.- Indirect Subsidiary March 19, 2012 100% U.S.A
2 BASIS OF PREPERATION
Adoption of Standards, Amendments and Interpretations to Approved Accounting Standards
Standard or Interpretation Effective DateIFRS 10 - Consolidated Financial Statements January 1, 2015IFRS 11 - Joint Arrangements January 1, 2015IFRS 12 - Disclosure of Interests in other Entities January 1, 2015IFRS 13 - Fair Value Measurement January 1, 2015IAS 27 - Separate Financial Statements January 1, 2015
Gul Ahmed Textile Mills Limited (The Company) was incorporated on April 01, 1953 in Pakistan as a private limitedcompany, subsequently converted into public limited company on January 07, 1955 and is listed in Pakistan StockExchange. The Company is a composite textile mill and is engaged in the manufacture and sale of textile products.
These condensed interim un-consolidated financial information of the Company for the half year ended December 31,2015 have been prepared in accordance with the requirements of the International Accounting Standards 34 - InterimFinancial Reporting and provisions of and directives issued under the Companies Ordinance, 1984. In case whererequirements differ, the provisions of or directives issued under the Companies Ordinance, 1984 have been followed.
These condensed interim un-consolidated financial information comprise of the condensed interim un-consolidatedbalance sheet as at December 31, 2015 and the condensed interim un-consolidated profit and loss account,condensed interim un-consolidated statement of comprehensive income, condensed interim un-consolidated cash flowstatement and condensed interim un-consolidated statement of changes in equity together with the notes forming partthereof, for the half year ended December 31, 2015.
The comparatives balance sheet, presented in these condensed interim un-consolidated financial Information, as atJune 30, 2015 has been extracted from the audited un-consolidated financial statements of the Company for the yearended June 30, 2015, whereas the comparative condensed interim un-consolidated profit and loss account,condensed interim un-consolidated statement of comprehensive income, condensed interim un-consolidated cash flowstatement and condensed interim un-consolidated statement of changes in equity for the half year ended December31, 2015 have been extracted from the condensed interim un-consolidated financial information of the Company forthe half year ended December 31, 2014.
These condensed interim unconsolidated financial information do not include all the information required in annualfinancial statements prepared in accordance with approved accounting standards as applicable in Pakistan, andshould be read in conjunction with the un-consolidated financial statements for the year ended June 30, 2015.
The following new standards, amendments to published standards and interpretations of IFRSs became effectiveduring the current year; however, they are either irrelevant or does not have any significant impact on Company'scondensed interim un-consolidated financial information.
Half Yearly Report {11}

3 ACCOUNTING POLICIES
4 TRADE AND OTHER PAYABLES
5 CONTINGENCIES AND COMMITMENTS
Contingencies
Guarantees
(a)
(b)
(c) Bills discounted Rs. 2,101 million (June-2015: Rs. 1,818 million).
(d)
Commitments
(a) Company is committed for certain expenditures which are stated as follows:
Un-Audited AuditedDecember June
2015 2015
- Capital expenditure 756,962 1,334,531 - Non capital expenditure items under letters of credits 1,775,740 1,999,976
2,532,702 3,334,507
(b)
Not more than one year 457,065 408,079 More than one year but not more than five years 1,594,860 1,486,287 More than five years 996,708 939,586
3,048,633 2,833,952
Corporate guarantee of Rs. 96.105 million (June-2015: Rs. 96.873 million) has been issued to a bank in favor ofsubsidiary company.
Same accounting policies and methods of computation are adopted for the preparation of these condensed interim un-consolidated financial information as those applied in the preparation of un-consolidated financial statements for theyear ended June 30, 2015.
Trade and other payables include provisions of Rs. 34.463 Million and 34.350 million in respect of increase in gas tariffrate and charging captive power tariff instead of Industry tariff rate to the company, respectively. The Company alongwith several other companies has filed a suit in the Honorable Sindh High Court challenging the notifications and theCourt has already passed interim orders to suspend the operation of the notifications and payments of bills on regularbasis at the tariff prevailing prior to the issuance of the impugned notifications and restrained from taking any coerciveaction against the Company. However the Company as a matter of prudence accounted for these in the condensedinterim unconsolidated financial information.
The status of contingencies, as reported in the annual financial statements for the year ended June 30, 2015 except asstated below, remained unchanged during the current period.
The guarantees issued by banks on behalf of company as at period end for Rs. 676 million (2015: Rs. 656million) were outstanding. These guarantees includes guarantees issued by related party amounting to Rs. 608million (June 2015: Rs. 588 million).
Post dated cheques Rs. 956 million (June-2015: Rs. 462 million) issued to various Government Agencies.
Rupees in thousand
The Company is committed to minimum rental payments for each of the following period as follows:
Half Yearly Report {12}

Un-Audited AuditedNote December June
2015 2015
6 PROPERTY, PLANT AND EQUIPMENT
Operating assets - net book value 6.1 & 6.2 9,175,489 8,701,473 Capital work in progress - at cost 6.4 819,314 337,212
9,994,803 9,038,685
Un-Auditedfor the half year for the half year
December December6.1 Additions during the period 2015 2014
Buildings and structures on leasehold land 238,076 340,727 Plant and machinery 631,006 719,192 Furniture and fixtures 656 631 Office equipment 49,454 27,650 Vehicles 119,681 52,961
1,038,873 1,141,161
6.1.1
Un-Auditedfor the half year for the half year
December December2015 2014
6.2 Disposals - operating fixed assets (at net book value)
Plant and machinery 52,186 268 Furniture and fixtures 1 - Office equipment 332 - Vehicles 3,341 9,867
55,860 10,135
6.2.1 Disposals include assets scrapped during the period of Rs. Nil (June-15: Rs. 1,510 million).
Un-AuditedDecember December
2015 2014
6.3 Depreciation charge during the period 508,998 450,157
6.4 Additions - capital work in progress (at cost)
Machinery 887,572 585,678 Building 353,100 247,537 Others 11,279 6,155
1,251,951 839,370
Additions to building and structure on leasehold land, plant and machinery and others include transfers fromcapital work-in-progress amounting to Rs. 191.732 million, Rs. 564.262 million and Rs. 13.854 (June-2015: Rs.518.654 million, Rs. 984.818 million and Rs. 8.861 million) respectively.
Rupees in thousand
Rupees in thousand
Rupees in thousand
Half Yearly Report {13}

Note Un-Audited AuditedDecember June
7 INTANGIBLE ASSETS 2015 2015
Intangible - net book value 6.1 & 6.2 14,968 11,481
Un-Auditedfor the half year for the half year
December December2015 2014
(Rs. 000s)7.1 Additions - intangibles (at cost)
Computer Software 6,011 -
7.2 Amortization charge during the period 2,524 5,605
Un-AuditedDecember December
2015 20148 CASH AND CASH EQUIVALENTS
Cash and cash equivalents comprises of:
Cash and bank balances 120,185 122,495Short term borrowings (11,894,418) (11,799,961)
(11,774,233) (11,677,466)
9 TAXATIONProvision for current taxation has been made on the basis of normal tax liability, final taxation, tax credit andseparate block income under the Income Tax Ordinance, 2001.
Rupees in thousand
Rupees in thousand
Half Yearly Report {14}

10 SEGMENT INFORMATION
The Company has the following two reportable business segments:
a) Spinning : Production of different qualities of yarn using both natural and artificial fibers.
b) Other Than Spinning:
Transactions among the business segments are recorded at cost.
10.1 Segmental profitability
Dec - 2015 Dec - 2014 Dec - 2015 Dec - 2014 Dec - 2015 Dec - 2014 Dec - 2015 Dec - 2014
Sales 3,197,762 4,718,007 12,904,088 14,291,667 (2,344,938) (2,749,739) 13,756,912 16,259,935Cost of Sales 3,040,964 4,487,219 9,862,441 11,782,589 (2,344,938) (2,749,739) 10,558,467 13,520,069
Gross Profit 156,798 230,788 3,041,647 2,509,078 - - 3,198,445 2,739,866
Distribution and Administrative expenses 101,375 99,630 2,152,506 1,656,017 - - 2,253,881 1,755,647
Profit before tax and before charging following 55,423 131,158 889,141 853,061 - - 944,564 984,219
Financial charges 478,641 730,416 Other operating expenses 64,845 24,208 Other income (47,398) (91,275)
496,088 663,349
Profit Before Tax 448,476 320,870
Taxation 25,875 68,665
Profit after tax 422,601 252,205
10.2 Segment assets and liabilities
Un-Audited Audited Un-Audited Audited Un-Audited Audited Un-Audited Audited Dec-2015 June -2015 Dec-2015 June -2015 Dec-2015 June -2015 Dec-2015 June -2015
Assets 4,738,889 4,654,991 21,805,291 17,507,671 1,402,610 2,780,685 27,946,790 24,943,347
Liabilities 1,312,910 1,900,111 5,474,740 5,988,192 13,909,852 9,885,572 20,697,502 17,773,875
10.3 Unallocated items represent those assets, liabilities, income and expenses which are common to all segments and investment in subsidiaries.
10.4 Information about major customersRevenue from major customer whose revenue exceeds 10% of gross sales is Rs.3,500 million (Dec-2015: Rs. 5,663 million).
Rupees in thousand
Production of greige fabric, its processing into various types of fabrics for sale as well as manufacture and sale of made-up and home textile products.
Spinning Other Than Spinning Elimination Of Inter Segment Transaction Total
-------------------------------------------Six month period ended December 31, 2015 (Un-audited)------------------------------------
Rupees in thousand
Spinning Other Than Spinning Unallocated Total
Half Yearly Report {15}

10.5 Information by geographical area
Un-Audited Audited
Dec - 2015 Dec - 2014 Dec - 2015 Jun - 2015
Pakistan 5,423,128 5,068,005 10,130,448 9,156,597 Germany 2,229,757 3,135,995 - - United Kingdom 956,559 1,000,909 - - United States 1,266,984 1,656,037 - - China 272,184 962,311 - - Netherland 625,081 1,052,125 - - France 699,708 972,632 - - Brazil 30,093 85,128 - United Arab Emirates 55,705 39,740 58,450 58,450 Other Countries 2,197,713 2,287,053 - -
13,756,912 16,259,935 10,188,898 9,215,047
11 TRANSACTIONS AND BALANCES WITH RELATED PARTIES
Un-AuditedRelationship with Nature of transactions Dec - 2015 Dec - 2014the Company
Subsidiaries Sale of goods 368,544 94,723 Commission paid 79,536 67,438
Associated Companies Purchase of goods 26,059 25,436 and other related parties Sale of goods 911 2,156
Rent paid 8,100 3,900 Fees paid 1,500 1,500 Donation paid - 3,000 Commission / Rebate Received 847 3,814 Bills discounted 1,749,203 1,133,906 Commission / Bank charges paid 14,499 16,040 Mark up / Interest charged 39,372 40,047 Provident fund contribution 50,751 42,767 Dividend paid 10,452 147
Relationship with Nature of outstanding balances Un-Audited Auditedthe Company Dec - 2015 Jun- 2015
Subsidiaries and Corporate guarantee issued in favorindirect subsidiaries of subsidiary company 96,105 96,873
Long term investment 58,450 58,450 Trade debts 284,334 245,485 Advances to suppliers 8,806 10,074
Associated companies Deposit with banks 15,964 18,486 and others related parties Borrowings from Banks 617,923 1,149,965
Bank guarantee 607,583 587,583 Trade & other payable 7,153 11,793 Trade debts 2,366 1,427 Accrued mark-up 5,899 23,116 Loans to key management personnel
& executive 24,372 20,725 Payable to employee's provident fund 10,575 2,158
Rupees in thousand
Revenue Non-current assetsFor the half year ended
(Un-audited)
Rupees in thousand
The related parties comprise subsidiaries, associated companies, companies where directors also holddirectorship, directors of the company and key management personnel. The Company in the normal course ofbusiness carried out transaction with various related parties.
Rupees in thousand
Half Yearly Report {16}

12 EVENT AFTER BALANCE SHEET DATE
Subsequent Effects
The Board of Directors of the Company in its meeting held on February 25, 2016 has declared the following:
a) Dividend
b) Right Shares
13 DATE OF AUTHORISATION
14 GENERAL
Figures have been rounded off to the nearest thousand rupees, unless otherwise specified.
MOHOMED BASHIR MOHAMMED ZAKI BASHIRChairman Chief Executive Officer
There are no transactions with directors of the Company and key management personnel other thanthose under the terms of employment for the period ending Dec-2015 amounting to Rs. 495 million (Dec-2014:Rs. 306 million) on account of remuneration.
These condensed interim un-consolidated financial statements were authorised for issue on February 25, 2016by the Board of Directors of the Company.
Allocations for the workers' profit participation fund, workers' welfare fund and taxation are provisional and finalliability including liability for deferred taxation will be determined on the basis of annual results.
Your directors have decided to pay interim cash dividend @ Re. 1.00 per share i.e. 10% for the half year endedDecember 31, 2015.
Your directors have also decided to issue 30% Right Shares at a premium of Rs.7.50 per share (Total Rs.17.50/- per share) in proportion of 30 (Thirty) Right Shares for every 100 (Hundred) shares.
Half Yearly Report {17}

T e x t i l e M i l l s L i m i t e d
Consolidated AccountsConsolidated Condensed Interim Financial Information
For The Half Year Ended December 31, 2015

Condensed Interim Consolidated Balance SheetAs at December 31, 2015
Un-Audited AuditedDecember June
Note 2015 2015Rupees in thousand
EQUITY AND LIABILITIES
SHARE CAPITAL AND RESERVES Authorised share capital
400,000,000 (2014: 400,000,000) ordinary shares of Rs.10 each 4,000,000 4,000,000
Issued, subscribed and paid-up share capital 2,285,228 2,285,228 228,522,772 (2014: 228,522,772) ordinary shares of Rs. 10 eachRevenue reserves 4,612,161 4,350,852 Unappropriated profit 613,972 746,279
7,511,361 7,382,359
NON-CURRENT LIABILITIES Long term financing - Secured 3,271,901 2,407,732 Deferred liabilities
Deferred taxation - net 296,012 356,354 Staff retirement benefits 44,458 48,833
340,470 405,187
CURRENT LIABILITIES Trade and other payables 4 4,718,640 5,393,287 Accrued mark-up/profit 165,205 206,481 Short term borrowings 11,894,418 8,838,174 Current maturity of long term financing 469,970 714,008
17,248,233 15,151,950
CONTINGENCIES AND COMMITMENTS 5
28,371,965 25,347,228
ASSETS
NON-CURRENT ASSETSProperty, plant and equipment 6 10,006,514 9,049,142 Intangible assets 7 22,434 15,834 Long term loans and advances 15,011 12,859Long term deposits 105,666 93,572
10,149,625 9,171,407
CURRENT ASSETSStores, spare parts and loose tools 814,772 699,062 Stock-in-trade 12,736,759 11,461,198 Trade debts 2,422,029 2,152,073 Loans and advances 866,246 349,247 Short term prepayments 135,872 114,964 Other receivables 345,643 331,399 Tax refunds due from Government 511,791 750,196 Income tax refundable-payments less provision 243,840 181,730 Cash and bank balances 145,388 135,952
18,222,340 16,175,821
28,371,965 25,347,228
MOHOMED BASHIR MOHAMMED ZAKI BASHIRChairman Chief Executive Officer
The annexed notes form an integral part of these condensed interim consolidated financial information.
Half Yearly Report {18}

Condensed Interim Consolidated Profit And Loss AccountFor the half year ended December 31, 2015
NoteJuly to July to October to October to
December December December December2015 2014 2015 2014
Sales 14,217,036 16,719,186 8,052,079 9,793,889
Cost of sales Opening stock of finished goods 9,148,067 8,873,680 9,765,812 9,472,142 Cost of goods manufactured 9,589,094 11,110,882 5,207,531 5,797,822 Purchases and processing charges 2,859,620 3,074,085 1,795,049 1,812,311 Closing stock of finished goods (10,760,115) (9,241,257) (10,760,115) (9,241,257)
10,836,666 13,817,390 6,008,277 7,841,018 Gross profit 3,380,370 2,901,796 2,043,802 1,952,871
Distribution cost 1,411,702 1,042,947 758,545 572,823 Administrative expenses 976,570 876,112 497,440 437,125 Other operating expenses 64,845 24,208 38,830 24,199
2,453,117 1,943,267 1,294,815 1,034,147927,253 958,529 748,987 918,724
Other income 47,398 91,275 (16,807) (28,178)
Operating profit 974,651 1,049,804 732,180 890,546
Finance cost 487,843 748,107 209,117 455,462
Profit before taxation 486,808 301,697 523,063 435,084
Provision for taxation- Current 8 86,748 90,803 48,258 39,736 - Deferred (60,418) (22,028) (60,418) (22,028)
26,330 68,775 (12,160) 17,708
Profit after taxation 460,478 232,922 535,223 417,376
Earning per share - basic and diluted (Rs.) 2.02 1.02 2.34 1.83
MOHOMED BASHIR MOHAMMED ZAKI BASHIRChairman Chief Executive Officer
Un-AuditedHalf year ended Quarter ended
Rupees in thousand
The annexed notes form an integral part of these condensed interim consolidated financial information.
Half Yearly Report {19}

Condensed Interim Consolidated Statement of Comprehensive IncomeFor the half year ended December 31, 2015
July to July to October to October toDecember December December December
2015 2014 2015 2014
Profit after taxation 460,478 232,922 535,223 417,376
Other comprehensive income - - - -
Foreign currency translation differences - Foreign operations 11,309 10,914 370 (2,379)
Total comprehensive income 471,787 243,836 535,594 414,997
MOHOMED BASHIR MOHAMMED ZAKI BASHIRChairman Chief Executive Officer
Un-AuditedHalf year ended Quarter ended
Rupees in thousand
The annexed notes form an integral part of these condensed interim consolidated financial information.
Half Yearly Report {20}
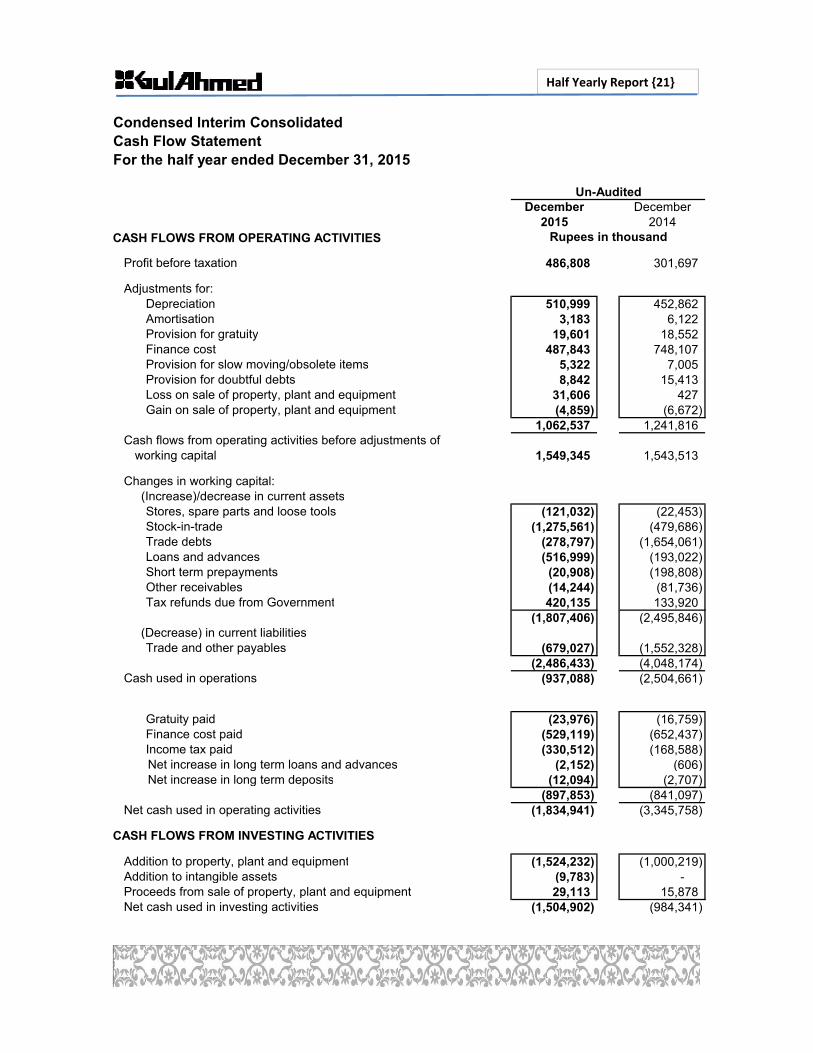
Condensed Interim Consolidated Cash Flow StatementFor the half year ended December 31, 2015
Un-AuditedDecember December
2015 2014CASH FLOWS FROM OPERATING ACTIVITIES
Profit before taxation 486,808 301,697
Adjustments for:Depreciation 510,999 452,862 Amortisation 3,183 6,122 Provision for gratuity 19,601 18,552 Finance cost 487,843 748,107 Provision for slow moving/obsolete items 5,322 7,005 Provision for doubtful debts 8,842 15,413 Loss on sale of property, plant and equipment 31,606 427 Gain on sale of property, plant and equipment (4,859) (6,672)
1,062,537 1,241,816Cash flows from operating activities before adjustments of
working capital 1,549,345 1,543,513
Changes in working capital: (Increase)/decrease in current assets
Stores, spare parts and loose tools (121,032) (22,453) Stock-in-trade (1,275,561) (479,686) Trade debts (278,797) (1,654,061) Loans and advances (516,999) (193,022) Short term prepayments (20,908) (198,808) Other receivables (14,244) (81,736) Tax refunds due from Government 420,135 133,920
(1,807,406) (2,495,846) (Decrease) in current liabilities
Trade and other payables (679,027) (1,552,328) (2,486,433) (4,048,174)
Cash used in operations (937,088) (2,504,661)
Gratuity paid (23,976) (16,759) Finance cost paid (529,119) (652,437) Income tax paid (330,512) (168,588)
Net increase in long term loans and advances (2,152) (606) Net increase in long term deposits (12,094) (2,707)
(897,853) (841,097)Net cash used in operating activities (1,834,941) (3,345,758)
CASH FLOWS FROM INVESTING ACTIVITIES
Addition to property, plant and equipment (1,524,232) (1,000,219) Addition to intangible assets (9,783) - Proceeds from sale of property, plant and equipment 29,113 15,878 Net cash used in investing activities (1,504,902) (984,341)
Rupees in thousand
Half Yearly Report {21}

Condensed Interim Consolidated Cash Flow StatementFor the half year ended December 31, 2015
Note Un-AuditedDecember December
2015 2014
CASH FLOWS FROM FINANCING ACTIVITIES
Proceeds from long term financing 1,722,298 824,064 Repayments of long term financing (1,102,167) (338,958) Dividend paid (338,405) (80,959)
Net cash generated from financing activities 281,726 404,147 Exchange difference on translation of foreign activities 11,309 10,914
Net decrease in cash and cash equivalents (3,046,808) (3,915,038)
Cash and cash equivalents - at the beginning of the period (8,702,222) (7,705,557)
Cash and cash equivalents - at the end of the period 8 (11,749,030) (11,620,595)
MOHOMED BASHIR MOHAMMED ZAKI BASHIRChairman Chief Executive Officer
Rupees in thousand
The annexed notes form an integral part of these condensed interim consolidated financial information.
Half Yearly Report {22}

Condensed Interim Consolidated Statement of Changes in EquityFor the half year ended December 31, 2015
Share capital Revenue reserve
Exchange difference on translation of
foreign subsidiaries
Statutory reserve
Un appropriated
profit Total
Balance as at June 30, 2014 (Audited) 1,828,182 3,580,000 96,902 11,901 1,336,209 6,853,194
Transfer to revenue reserve - 650,000 - - (650,000) -
Transaction with owners457,046 - - - (457,046) -
Final dividend for the year ended - - - - (80,959) (80,959) June 30, 2014 to minor shareholders
Total comprehensive income
Profit after taxation - - - - 232,922 232,922
Other comprehensive income - - 10,914 - - 10,914 - - 10,914 - 232,922 243,836
Balance as at December 31, 2014 (Un-audted) 2,285,228 4,230,000 107,816 11,901 381,126 7,016,071
Transfer to statutory reserve - - - 1,779 (1,779) -
Total comprehensive income
Profit after taxation - - - - 381,347 381,347
Other comprehensive income - - (644) - (14,415) (15,059) - - (644) - 366,932 366,288
Balance as at June 30, 2015 (Audited) 2,285,228 4,230,000 107,172 13,680 746,279 7,382,359
Transfer to revenue reserve 250,000 (250,000) -
Transaction with owners(342,785) (342,785)
- Total comprehensive income
-
Profit after taxation 460,478 460,478
Other comprehensive income 11,309 - 11,309 - - 11,309 - 460,478 471,787
Balance as at December 31, 2015 (Un-audited) 2,285,228 4,480,000 118,481 13,680 613,972 7,511,361
The annexed notes form an integral part of these condensed interim consolidated financial information.
MOHOMED BASHIRChairman
Final dividend for the year ended June 30, 2015
for the half year ended December 2015 (un-audited)
MOHAMMED ZAKI BASHIRChief Executive Officer
Rupees in thousand
Issue of bonus shares for the year ended June 30, 2014
for the half year ended December 2014 (un-audited)
for the period January 01, 2015 to June 30, 2015
Half Yearly Report {23}

Notes to the Condensed Interim Consolidated Financial Information (Un-audited)For the half year ended December 31, 2015
1 LEGAL STATUS AND ITS OPERATIONS
1.1 Gul Ahmed Group ( "the Group") comprises the following:
- Gul Ahmed Textile Mills Limited- Gul Ahmed International Limited (FZC) - UAE- GTM (Europe) Limited - UK- GTM USA Corp. - USA
All three subsidiaries are engaged in trading of textile related products.
1.2 Basis of consolidation
2 BASIS OF PREPARATION
Subsidiary companies are consolidated from the date on which more than 50% voting rights are transferred to the HoldingCompany or power to govern the financial and operating policies over the subsidiary and is excluded from consolidation fromthe date of disposal or cessation of control.
Gul Ahmed Textile Mills Limited (The Holding Company) was incorporated on 1st April 1953 in Pakistan as a private limitedcompany, subsequently converted into public limited company on 7th January 1955 and is listed in Pakistan Stock Exchange.The Holding Company is a composite textile mill and is engaged in the manufacture and sale of textile products.
The Holding Company's registered office is situated at Plot No. 82, Main National Highway, Landhi, Karachi.
Gul Ahmed International Limited (FZC) -UAE is a wholly owned subsidiary of Gul Ahmed Textile Mills Limited, GTM (Europe)Limited is a wholly owned subsidiary of Gul Ahmed International Limited (FZC) - UAE and GTM USA Corp. is a wholly ownedsubsidiary of GTM (Europe) Limited.
The Holding Company is a subsidiary of Gul Ahmed Holdings (Private) Limited which owns 66.78% shares of the Holding Company.
The financial information include the financial information of the Group.
The financial information of the subsidiaries are prepared for the same reporting period as the Holding Company, usingconsistent accounting policies.
The assets and liabilities of the subsidiary company have been consolidated on a line-by-line basis and the carrying value ofinvestment held by the Holding Company is eliminated against the subsidiary's share capital. All intra-group balances andtransactions are eliminated.
The condensed interim consolidated financial information comprise the condensed interim consolidated balance sheet of GulAhmed Textile Mills Limited, its wholly owned subsidiary company Gul Ahmed International Limited (FZC), GTM (Europe)Limited which is the wholly owned subsidiary of Gul Ahmed International Limited (FZC) and GTM USA Corporation which is thewholly owned subsidiary of GTM (Europe) Limited, as at December 31, 2015 and the related condensed interim consolidatedprofit and loss account, condensed interim consolidated cash flow statement and condensed interim consolidated statement ofchanges in equity together with the notes forming part thereof for the period then ended. The financial information of thesubsidiary companies have been consolidated on a line by line basis.
These condensed interim consolidated financial information of the Group for the half year ended December 31, 2015 havebeen prepared in accordance with the requirements of the International Accounting Standards 34 - Interim Financial Reportingand provisions of and directives issued under the Companies Ordinance, 1984. In case where requirements differ, theprovisions of or directives issued under the Companies Ordinance, 1984 have been followed.
The comparatives balance sheet, presented in these condensed interim consolidated financial information, as at June 30, 2015has been extracted from the audited financial statements of the Group for the year ended June 30, 2015 whereas thecomparative condensed interim consolidated profit and loss account, condensed interim consolidated statement ofcomprehensive income, condensed interim consolidated cash flow statement and condensed interim consolidated statement ofchanges in equity for the half year ended December 31, 2015 have been extracted from the condensed interim consolidatedfinancial information of the Group for the half year ended December 31, 2014.
Half Yearly Report {24}

Adoption of Standards, Amendments and Interpretations to Approved Accounting Standards
Standard or Interpretation Effective DateIFRS 10 - Consolidated Financial Statements January 1, 2015IFRS 11 - Joint Arrangements January 1, 2015IFRS 12 - Disclosure of Interests in other Entities January 1, 2015IFRS 13 - Fair Value Measurement January 1, 2015IAS 27 - Separate Financial Statements January 1, 2015
3 ACCOUNTING POLICIES
4 TRADE AND OTHER PAYABLES
5 CONTINGENCIES AND COMMITMENTS
Contingencies
Guarantees
(a)
(b)
(c) Bills discounted Rs. 2,140 million (June-2015: Rs. 1,858 million).
(d) Corporate guarantee of Rs. 96.105 million (June-2015: Rs. 96.873 million ) has been issued to a bank in favor of subsidiarycompany.
Post dated cheques Rs. 956 million (June-2015: Rs.462 million) issued to various Government Agencies.
Trade and other payables include provisions of Rs. 34.463 Million and 34.350 million in respect of increase in gas tariff rate andcharging captive power tariff instead of Industry tariff rate to the Holding Company, respectively. The Holding Company alongwith several other companies has filed a suit in the Honorable Sindh High Court challenging the notifications and the Court hasalready passed interim orders to suspend the operation of the notifications and payments of bills on regular basis at the tariffprevailing prior to the issuance of the impugned notifications and restrained from taking any coercive action against the HoldingCompany. However, the Group as a matter of prudence accounted for these in the condensed interim consolidated financial
The status of contingencies, as reported in the annual financial statements for the year ended June 30, 2015 except as statedbelow, remained unchanged during the current period.
Guarantees issued by Bank on behalf of the Group as at period end for Rs. 676 million (June-2015: Rs. 656 million) wereoutstanding. These guarantees includes guarantees issued by related party amounting to Rs. 608 million (June-2015: Rs. 588million).
The following new standards, amendments to published standards and interpretations of IFRSs became effective during the current year; however, they are either irrelevant or does not have any significant impact on Holding Company's condensed interim consolidated financial information.
Accounting policies and method of computations adopted for the preparation of these condensed interim consolidated financialinformation are the same as those applied in the preparation of the consolidated financial statements for the year ended June30, 2015.
These condensed interim consolidated financial information do not include all the information required in annual financial statements prepared in accordance with approved accounting standards as applicable in Pakistan, and should be read in conjunction with the consolidated financial statements for the year ended June 30, 2015.
Half Yearly Report {25}

Commitments
(a) Group is committed for certain expenditures which are stated as follows:
Un-Audited AuditedDecember June
2015 2015
- Capital expenditure 756,962 8,711,930 - Non capital expenditure items under letters of credits 1,775,740 337,212
2,532,702 9,049,142
(b) The Group is committed for minimum rental payments for each of following period as follows:
Not more than one year 457,065 408,079 More than one year but not more than five years 1,594,860 1,486,287 More than five years 996,708 939,586
3,048,633 2,833,952
6 PROPERTY, PLANT AND EQUIPMENT
Operating assets - net book value 6.1 & 6.2 9,187,200 8,711,930 Capital work in progress - at cost 6.4 819,314 337,212
10,006,514 9,049,142
Un-Auditedfor the half year for the half year
December December2015 2014
6.1 Additions during the period
Buildings and structures on leasehold land 238,076 340,727 Plant and machinery 631,006 719,192 Furniture and fixtures 2,202 27,821 Office equipment 50,030 6,194 Vehicles 120,814 52,961
1,042,128 1,146,895
6.1.1
Un-Auditedfor the half year for the half year
December December2015 2014
6.2 Disposals - operating fixed assets (at net book value)
Plant and machinery 52,186 268 Furniture and fixtures 1 Office equipment 332 - Vehicles 3,341 9,867
55,860 10,135
6.2.1
Rupees in thousand
Rupees in thousand
Additions to building and structure on leasehold land, plant and machinery and others include transfers from capital work-in-progress amounting to Rs. 191.732 million, Rs. 564.262 million and Rs. 13.854 (June-2015: Rs. 518.654 million, Rs. 984.818 million and Rs. 8.861 million) respectively.
Rupees in thousand
Disposals include assets scrapped during the period of Rs. Nil (June-15: Rs. 1,510 million).
Half Yearly Report {26}

Un-AuditedDecember December
2015 2014
6.3 Depreciation charge during the period 510,999 452,862
6.4 Additions - capital work in progress (at cost)
Machinery 887,572 585,678 Building 353,100 247,537 Others 11,279 6,155
1,251,951 839,370
Note Un-Audited AuditedDecember June
2015 2015
7 INTANGIBLE ASSETS
Intangible - net book value 6.1 & 6.2 22,434 15,834
Un-Auditedfor the half year for the half year
December December2015 2014
(Rs. 000s)7.1 Additions - intangibles (at cost)
Computer Software 9,783 -
7.2 Amortisation charge during the period 3,183 6,122
Un-AuditedDecember December
2015 20148 CASH AND CASH EQUIVALENTS
Cash and cash equivalents comprises of:
Cash and bank balances 145,388 179,366Short term borrowings (11,894,418) (11,799,961)
(11,749,030) (11,620,595)
9 TAXATIONProvision for current taxation has been made on the basis of normal tax liability, final taxation, tax credit and separate blockincome under the Income Tax Ordinance, 2001.
Rupees in thousand
Rupees in thousand
Rupees in thousand
Half Yearly Report {27}

10 SEGMENT INFORMATION
The Group has the following three reportable business segments:
a) Spinning: Production of different qualities of yarn using both natural and artificial fibersb) Other Than Spinning: Production of greige fabric, its processing into various types of fabrics for sale as well as manufacture and sale of madeups and home textile products.
c) Overseas subsidiaries: These subsidiaries are also in the textile business reselling product to the ultimate customers, imported from Parent Company
Transactions among the business segments are recorded at cost.
10.1 Segmental Profitability
Dec - 2015 Dec - 2014 Dec - 2015 Dec - 2014 Dec - 2015 Dec - 2014 Dec - 2015 Dec - 2014 Dec - 2015 Dec - 2014 Dec - 2015 Dec - 2014 Dec - 2015 Dec - 2014
Sales 3,197,762 4,718,007 12,904,088 14,291,667 413,166 371,934 189,579 41,966 225,994 133,394 (2,713,553) (2,837,782) 14,217,036 16,719,186 Cost of Sales 3,040,964 4,487,219 9,862,440 11,782,589 322,840 288,457 143,203 834 176,944 106,094 (2,709,725) (2,847,803) 10,836,666 13,817,390
Gross Profit 156,798 230,788 3,041,648 2,509,078 90,326 83,477 46,376 41,132 49,050 27,300 (3,828) (10,021) 3,380,370 2,901,796 Distribution and Administrative
expenses 101,375 99,630 2,152,506 1,656,017 63,056 66,830 36,279 51,463 35,056 45,118 - 1 2,388,272 1,919,059
Profit before tax and before charging following 55,423 131,158 889,142 853,061 27,270 16,647 10,097 (10,331) 13,994 (17,818) (3,828) (10,022) 992,098 982,737
Financial charges 487,843 748,107 Other operating expenses 64,845 24,208 Other income (47,398) (91,275)
505,290 681,040
Profit Before Tax 486,808 301,697
Taxation 26,330 68,775
Profit after tax 460,478 232,922
10.2 Segment assets and liabilities
Un-Audited Audited Un-Audited Audited Un-Audited Audited Un-Audited Audited Un-Audited Audited Un-Audited Audited Un-Audited Audited Dec - 2015 Jun- 2015 Dec - 2015 Jun- 2015 Dec - 2015 Jun- 2015 Dec - 2015 Jun- 2015 Dec - 2015 Jun- 2015 Dec - 2015 Jun- 2015 Dec - 2015 Jun- 2015
Assets 4,738,889 4,654,991 21,475,282 17,191,540 455,503 470,873 136,595 210,041 163,087 39,098 1,402,609 2,780,685 28,371,965 25,347,228
Liabilities 1,312,910 1,900,111 5,460,082 5,974,840 175,358 201,306 1,937 2,186 465 854 13,909,852 9,885,572 20,860,604 17,964,869
10.3 Unallocated items represent those assets, liabilities income and expenses which are common to all segments and investment in subsidiaries.
10.4 Information about major customers
Revenue from major customer whose revenue exceeds 10% of gross sales is Rs.3,500 million (Dec-2015: Rs. 5,663 million).
Other Than Spinning Gul Ahmed International Limited FZC- UAE GTM (Europe) Limited UK GTM USA Corp. ELIMINATION OF INTER
SEGMENT TRANSACTION
(Rs 000s)
TOTAL
-----------------------------------------------------------Six month period ended December 31, 2015 (Un-audited)----------------------------------------------------------------------------------------
Rupees in thousand
Spinning Other Than Spinning Gul Ahmed International Limited FZC- UAE GTM (Europe) Limited UK GTM USA Corp. Unallocated Total
SPINNING
Half Yearly Report {28}

10.5 Information by geographical area
Dec - 2015 Dec - 2014 Dec - 2015 Jun - 2015
Pakistan 5,423,128 5,135,443 10,130,448 9,156,597 Germany 2,229,757 3,135,995 - - United Kingdom 1,002,927 1,002,300 2,188 2,106 United States 1,316,281 962,311 - - China 272,184 1,695,805 3,941 4,418 Netherland 625,081 1,052,125 - - France 699,708 972,632 - - Brazil 30,093 85,128 - - United Arab Emirates 420,164 390,394 13,048 8,286 Other Countries 2,197,713 2,287,053 - - Total 14,217,036 16,719,186 10,149,625 9,171,407
11 TRANSACTIONS AND BALANCES WITH RELATED PARTIES
Un-AuditedDec - 2015 Dec - 2014
Relationship with Nature of transactionsthe Company
Associated Companies Purchase of goods 26,059 25,436 and other related parties Sale of goods 911 2,156
Rent paid 8,100 3,900 Fees paid 1,500 1,500 Commission / rebate - 3,814 Donation paid 847 3,000 Bills discounted 1,749,203 1,133,906 Commission / bank charges paid 14,499 16,040 Mark up / Interest charged 39,372 40,047 Provident fund contribution 50,751 42,767 Dividend paid 10,452 147
Relationship with Nature of outstanding balances Un-Audited Auditedthe Company Dec - 2015 Jun- 2015
Associated companies Deposit with bank 15,964 18,486 and others related parties Borrowing from bank 617,923 1,149,965
Bank guarantee 607,583 587,583 Trade & other payable 7,153 11,793 Trade & other receivable 2,366 1,427 Accrued Mark up 5,899 23,116 Loans to key management personnel & executives 24,372 20,725 Payable to employees' provident fund 10,575 2,158
Rupees in thousand
Revenue Non-current assetsFor the half year ended
(Un-audited) Un-Audited Audited
The related parties comprise subsidiaries, associated companies, companies where directors also holddirectorship, directors of the Group and key management personnel. The Group in the normal course of businesscarried out transaction with various related parties.
Rupees in thousand
Rupees in thousand
There are no transactions with directors of the Group and key management personnel other than thoseunder the terms of employment for the period ending Dec-2015 amounting to Rs. 545 million (Dec-2014: Rs.316 million) on account of remuneration.
Half Yearly Report {29}

12 EVENT AFTER BALANCE SHEET DATE
Subsequent Effects
a) Dividend
b) Right Shares
13 DATE OF AUTHORISATION
14 GENERAL
Figures have been rounded off to the nearest thousand rupees, unless otherwise specified
MOHOMED BASHIRChairman
MOHAMMED ZAKI BASHIRChief Executive Officer
These condensed interim consolidated financial statements were authorised for issue on February 25, 2016 by theBoard of Directors of the Group.
Allocations for the workers' profit participation fund, workers' welfare fund and taxation are provisional and finalliability including liability for deferred taxation will be determined on the basis of annual results.
The Board of Directors of the Holding Company in its meeting held on February 25, 2016 has declared thefollowing:
Your directors have decided to pay interim cash dividend @ Re. 1.00 per share i.e. 10% for the half year endedDecember 31, 2015.
Your directors have also decided to issue 30% Right Shares at a premium of Rs.7.50 per share (Total Rs.17.50/-per share) in proportion of 30 (Thirty) Right Shares for every 100 (Hundred) shares.
Half Yearly Report {30}


