Page 1
MARKET ANALYSIS OF SHALE OIL CO-PRODUCTS*
V. A. Kuuskraa,E. C. Hammershaimb,J. S. Broz**
Lew in and Associates
1090 Vermont Avenue
Washington, D.C. 20005
E. G. Higgins
2400 Fountain View Drive
Houston, Texas 77087
A. ABSTRACT BACKGROUND
This paper estimates that the projected
markets for soda ash and alumina could poten
tially support a shale oil industry of 500,000
barrels per day by the year 2000. Thus, co-pro
duct minerals could make an important economic
contribution to a shale oil industry by impro
ving the economics of the total project. This
could potentially extend the oil shale resource
that is economically recoverable and lower the
minimum economic plant size.
B. INTRODUCTION
This paper discusses the potential for
separating, upgrading and marketing sodium
minerals that occur with oil shale in the Pice
ance Creek Basin. The co-products investigated
are soda ash and alumina which are derived from
the minerals nahcolite and dawsonite.
This paper will :
Present an upgrading process for
dawsonite that is integrated with
the oil shale production facility,
Recently, an increasing amount of at
tention has been directed toward the large shale
oil resource in the Green River Formation of the
Piceance Creek Basin in Northwestern Colorado,
Figure 1. The northern half of this Basin also
contains vast deposits of nahcolite (NaHC0.J
and dawsonite (NaAl (0H)2C0.J ,that are
co-deposited with the shale in the Saline Zone
at a depth of about 2,000 feet. Nahcolite is a
natural sodium bicarbonate and dawsonite is a
chemical composition of sodium and aluminum.
Thus, dawsonite can be upgraded to yield alu
mina, the precursor of aluminum, with soda ash
as a by-product.
Since these minerals are interspersed
with oil shale, the shale and the minerals would
be jointly mined. Should it be economically
feasible to upgrade and market these mineral
co-products, the overall economics could be sub
stantially improved, and valuable strategic
minerals would be produced domestically. A
study of this question was undertaken in 1980,
sponsored by the office of Shale Resource Devel
opment, the Department of Energy.
Identify and analyze the areas for
improved economics, and
Discuss the potential markets for
alumina, soda ash and nahcolite.
*Th i s study was funded by the U.S. Department of
Energy under contract DE-AC0I-79RA 34014.
**Previously with Energy Development Consul
tants, Inc., Golden, CO.
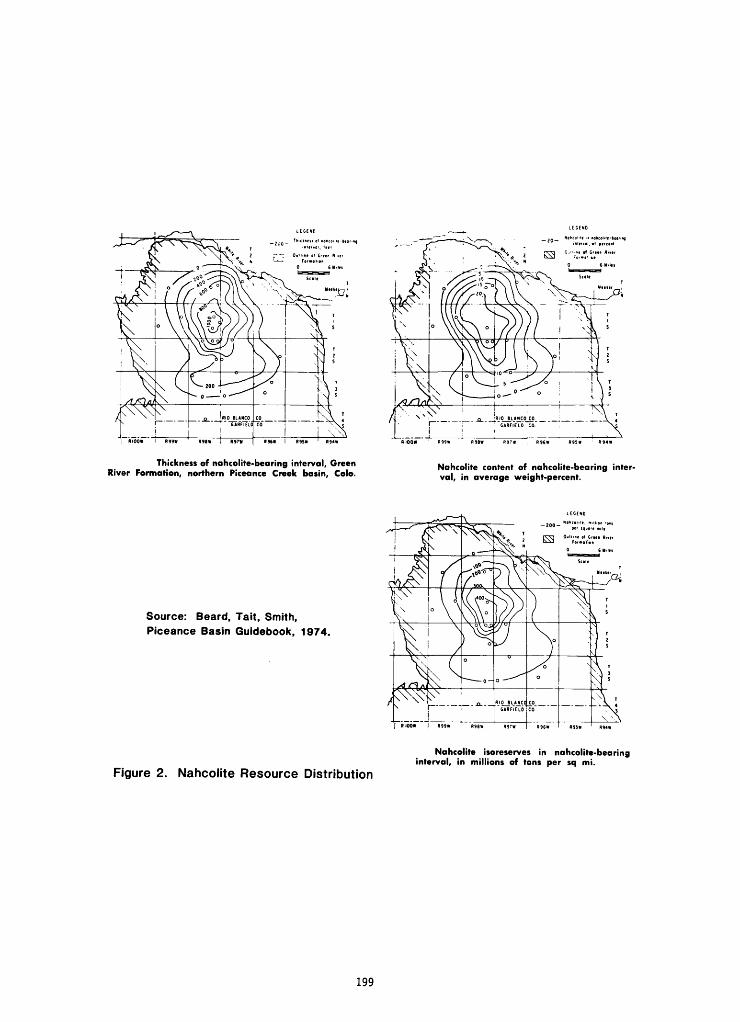
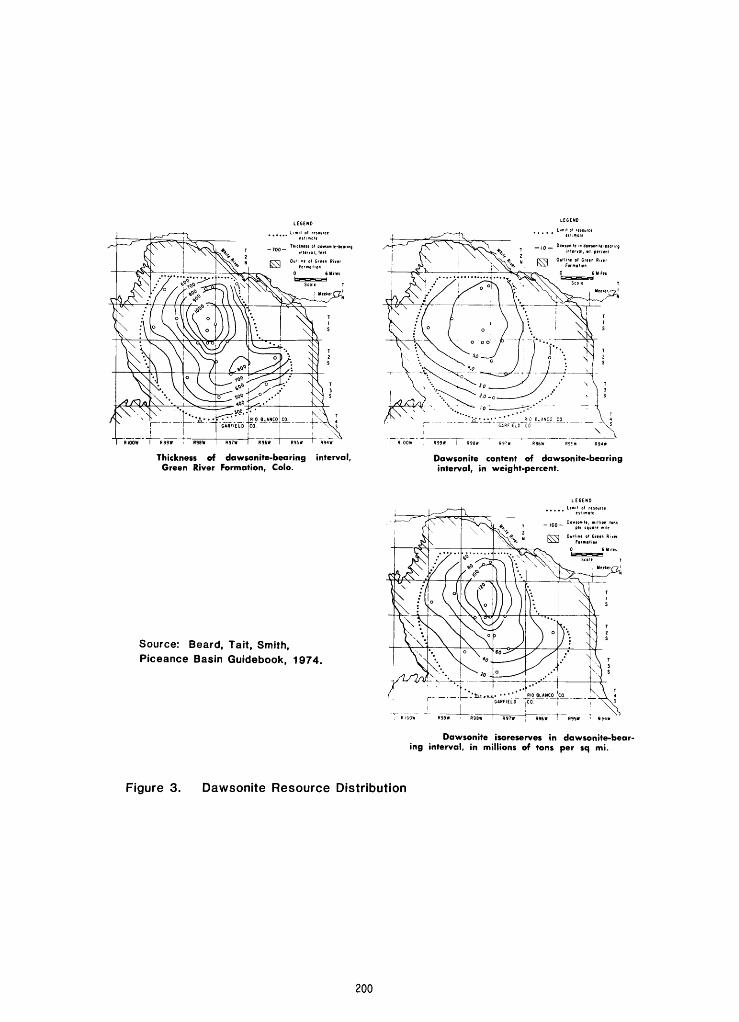
The northern area of the Piceance Creek
Basin coincides with the occurence of the two
minerals, with the dawsonite deposits extending
furthest east. The center and thickest deposits
of both minerals occur in Township 1 South,
Range 98 West. The in-place nahcolite resource
is estimated to be about 30 billion tons; the
dawsonite resource is estimated to represent 6
to 7 billion tons of alumina. The location,
stratigraphy, and estimates of the nahcolite and
dawsonite resources are shown on Figures 2 and
3, respectively.
197
Page 2
The core data indicates that the areas
with the largest mineral content (T1S, R98W)
contain ore with about 20% nahcolite and 12%
dawsonite by weight. Along the edge of the
basin the dawsonite content drops to 2% by
weight and nahcolite is no longer present.
D. METHODOLOGY
Five cases, shown on Figure 4, were
selected to reflect the variance in mineral and
shale oil content in the identified resource.
The nahcolite content was varied from 0 to 20
weight percent and the dawsonite content was
Source: Beard, Tait, Smith, Piceance Basin Guidebook, 1974.
Figure 1. Map of Piceance Creek Basin
198
Page 3
SIOO* 99 mew R96 95 1194a
Thickness of nahcolite-bearing interval, GreenRiver Formation, northern Piceance Creek basin, Colo.
Nahcolite content of nahcolite-bearing inter
val, in average weight-percent.
Source: Beard, Tait, Smith,
Piceance Basin Guidebook, 1974.
Figure 2. Nahcolite Resource Distribution
Nahcolite isoreserves in nahcolite-bearing
interval, in millions of tons per sq mi.
199
Page 4
I-
'rioow ~~f
Thickness of dawsonite-bearing interval,
Green River Formation, Colo.
Dawsonite content of dawsonite-bearing
interval, in weight-percent.
Source: Beard, Tait, Smith,
Piceance Basin Guidebook, 1974.
Dawsonite isoreserves in dawsonite-bear
ing interval, in millions of tons per sq mi.
Figure 3. Dawsonite Resource Distribution
200
Page 5
Raw Material Case 1 Case 2
Lean Minerals Shale: 21,053 TPD Shale: 84,212 TPD
Rich Shale Oil: 13,571 BPD Oil: 54,284 BPD
(0% Nahcolite) Nahcolite: -- Nahcolite: --
(2% Dawsonite) Alumina: 75 TPD Alumina: 300 TPD
(30 gallons per ton) Soda ash: 78 TPD Soda ash: 312 TPD
(1 retort module) (4 retort modules)
Case 3 Case 4
Rich Minerals Shale: 25,316 TPD Shale: 75,948 TPD
Rich Shale Oil: 15,639 BPD Oil: 46,917 BPD
(20% Nahcolite) Nahcolite: 4,050 TPD Nahcolite: 12,150 TPD
(12% Dawsonite) Alumina: 523 TPD Alumina: 1,569 TPD
(30 gallons per ton) Soda ash: 991 TPD Soda ash: 2,973 TPD
(1 retort module) (3 retort modules)
Case 5
Rich Minerals Not analyzed Shale: 126,582 TPD
Lean Shale Oil: 52,132 BPD
(20% Nahcolite) Nahcolite: 20,253 TPD
(12% Dawsonite) Alumina: 2,616 TPD
(20 gal Ions per ton) Soda ash: 4,956 TPD
(5 retort modules)
Figure 4. Product Slates for the Five Cases
201
Page 6
varied from 2 to 12 weight percent, and oil con
tent of the shale was assumed to be 20 or 30
gallons per ton. Two sizes of facilities were
analyzed for each resource to determine econo
mies of scale between a 15,000 barrel per day
demonstration unit and a 50,000 barrel per day
full sized plant.
Three separate analyses were conducted:
t Engineering assessment of manufac
turing costs for shale oil and
co-products. Detailed process flow
diagrams and energy and mass balan
ces were developed for each of the
key mining and manufacturing steps
from data in the public literature;
these formed the basis for engi
neering estimates of capital and
operating costs.
t Projection of potential world mar
kets for alumina, soda ash and nah
colite. Future market demand and
prices for alumina, soda ash and
nahcolite were projected by major
geographical areas and major end
uses for each of the co-products, as
well as for the competing sources of
supply.
Determination of economic viability
and market potential for shale
co-products. Finally, the cost
analysis was integrated with the
market study to determine the loca
tions, conditions, prices, and mag
nitude of co-product markets.
The product slates for each of the five
cases are shown on Figure 4. Cases 1 and 2,
representing the "leanminerals"
resource, have
a low dawsonite content and no nahcolite, and
consequently the production of alumina and soda
ash is small. In Case 4, the Full Scale Plant,
"richminerals"
case, the soda ash produced to
gether with alumina is 1,000,000 tons per year,
equivalent to a world-scale soda ash plant. The
annual alumina production in Case 4 is 570,000
tons, which would be about 6% of total 1980 U.S.
consumption. In Case 5, where the oil content
of the shale is lower (at 20 gallons per ton),
five retorts are required to produce about
50,000 barrels of oil per day. The resulting
annual production of 1.8 million tons of soda
ash would be a major addition to world capa
city. The alumina production of nearly 1 mil
lion tons per year would be about 10% of U.S.
consumption.
E. MINING, SEPARATION AND UPGRADING
The mining, separation, and upgrading
processes for the shale oil and co-products were
analyzed through the following steps for each of
the five cases:
Preliminary conceptual engineeringdesign of mineral co-product facili
ties,
Full cost-engineering and economic
analysis of the shale oil plant, and;
Marginal (capital and operating)
cost analysis for co-product facili
ties.
One above-surface commercial venture
has been proposed for mineral recovery in combi
nation with the processing of shale for oil pro
duction, but inadequate details were available
to construct the required process diagrams, cal
culate mass and energy flows, and determine cap
ital and operating costs. A detailed conceptual
analysis of the processes by which the minerals
would be separated or upgraded was therefore
developed.
1. Process Flow
The process flow is shown diagrammati
cal ly on Figure 5, where the mass flow for Case
3 is also indicated.
a. Mine Design. The following assumptions were
made for a hypothetical mine in the Saline Zone:
202
Page 7
The basic design consists of a
single level, room and pillar mine.
The mine is developed in panels
approximately o,000 feet )ong and
1,100 feet wide.
The ore body consists of a uniform,
flat-lying bed of oil shale with
dawsonite and inter-bedded nahcolite
nodules having a mineable thickness
of 60 feet.
The support pillars are 120 feet
square and mining is limited to an
overall extraction of 45 percent.
This pillar size is based on extra
polation of previous experience,
taking into account the presumed
competency of the formation.
Gassy mine conditions are assumed;
thus, a seven panel entry design
with five main entries is employed,
with permissible mining equipment
for use in gassy environments.
Access to the mine is through paral
lel inclines of about 12,000 feet in
comb i red length.
Hydraulic backfilling is assumed.
This may create a disposal problem
since the finest particles must be
removed on the surface so that the
fill can stabilize.
After mining, the shale is crushed on
the surface and nahcolite is separated. Addi
tional nahcolite is separated through further
crushing and photosorting, and the nahcoli-
tic-lean shale is then charged to the retort.
b. Retort Process Flow. The retort process
flow is based on published data for commer
cial-scale circular grate retorts. Each of the
retorts can process 20,000 tons per day and pro
duces shale oil, offgas and spent shale.
c. ALSAR Plant. After retorting, the dawsonite
in the spent shale is upgraded to alumina and
soda ash and the unrecovered nahcolite is con
verted to soda ash in the Alumina Soda Ash Reco
very (ALSAR) unit. The basic design for the
recovery process were derived from public and
patent literature, and integrate a combination
of key processing concepts for alumina reco-
2 3very.
'
The process design of these facili
ties is shown conceptually on Figure 6 and is
discussed below. Also shown on Figure 6 are the
mass flows for Case 3.
t The retorted shale is initiallycrushed to 150 mesh to provide suf
ficient contact surface area for
leaching.
The next step is"cold"
leaching
(25C) of retorted shale with
caustic concentrations of NaOH less
than or equal to 20 g/l, and
Na2C0^ less than or equal to
150 g/l for control of silica disso
lution.
t Then, solubilized alumina is reco
vered from leach liquor by"hot"
precipitation (65C) using recy
cled trihydrate seeding (5:1 ratio).
Cell-grade alumina is produced (less
than or equal to 0.03% weight of
Si02) from the precipitated
A1(0H)3 after washing, filtration,
and calcination.
t The process is self-sufficient in
caustic (NaOH), and the pH of the
overflow from precipitation is con
trolled by Na2C03 crystalliza
tion and a caustic purge in the
retorted shale leaching recycle
step. Caustic concentrations are
carefully regulated for control of
si lica solubility.
Finally, soda ash (dense) is pro
duced by evaporation of the overflow
leach liquor and dehydration of the
monohydrate product.
The retorted shale must be finely
crushed prior to leaching, since solubilization
of the aluminum compounds is strongly dependent
on surface-area contact.
A potential cost-savings of the assumed
production process relative to other proposed
designs is the obviation of a de-silication cir
cuit in the ALSAR unit. Also, no lime-sinter
processing is required for silica control and
leach water clean-up.
2. Energy Balance
In addition to mass balance calcula
tions, energy balances for the shale oil and
mineral co-product facilities were determined,
since the ALSAR process uses a substantial quan-
203
Page 8
Mine
25,316
TPD
Primary
Crushing
Nahcolite
Recovery
Unit
Nahcolite *
Product A
5.063 TPD^
20.000
TPD
Shale
Fines (-1")
253 TPD
Retort
Hydraulic
Shale
Disposal
_to_/0k
Offgas
"^Q9 (14.5 x 10⁸BTU/day)
->-<QOil (16.639 BPD)
15,639
TPD w
Retorted
Shale
Retorted
Shale
21,567
. TPD
ALSAR
Plant
M
I
d>
ALSAR - Alumina Soda Ash Recovery
Figure 5. Process Flow Diagram for Case 3
HjjO
Retorted Shale
16,636
Retorted
Shale
Crushing
(150 Mesh)
12,986
Leaching
(attrition
scrubbing)
25C
-HgO.
21,587
Alumina
Trlhydrate
Precipitation
(seeding)65*C
JSP-
16,951^
6.721
5.987
T_a
AK0H)3
WashingFiltration
Na2C03Crystallization
(4-effect)
12,230
10,954
Tailings to Backfill Caustic Solution
Monohydrate
Filtration
NajCOsMaO
Dehydration
(10% Free
HjO)
HzO
Calcination
(10 Free
H2O)
1.100-
1.200'C
623Alumina
*fe3
,28BQ
SodaAsh
991
Figure 6. Aluminum and Soda Ash Recovery Facilities (Tons Per Day)
204
Page 9
tity of process heat in the form of high and
low-pressure stean,. The purpose was to evaluate
the potential of using the low BTU offgas from
the retort as a co-product for alumina calcina
tion and soda ash crystallization. Based on
analogies with the aluminum and trona indus
tries, these processes require:
Process Step
Alumina Precipitation
Soda Ash Crystallization
Energy Requirements
6.7 MMBtu/ton
7.2 MMBtu/ton
Analysis of the low temperature heating
requirements for all five cases indicated that
the retort offgas will be sufficient to meet the
process energy requirements of the upgrading
facilities. This is an important finding
because it allows offgas to be"purchased"
from
the shale oil facility for the co-product
upgrading.
In addition, the plant will require the
use of diesel in the mining operations and elec
tricity which must be purchased.
3. Costing
For each of the five cases analyzed,
the major plant sections were characterized by:
(1) process-flow, mass and energy balances (as
discussed above), and; (2) equipment capacity
and performance, labor, and material quantity
calculations.
Based on the material balances and
equipment capacity calculations, the equipment
for each major plant section was determined.
These equipment irventories enabled cost esti
mates to be prepared from detailed capacity-cost
relationships available in the literature. Fur
ther, a large number of vendor quotes were
secured for the major pieces of equipment and
checked against independent data sources for
accuracy.
Case 3 was selected as the fundamental
engineering design case from which the plant
costs and power requirements of the remaining
four cases were scaled. For this, major plant
sections were further factored into major equip
ment components. The equipment size, capacity,
and performance ratios were calculated, and
using the capacity-cost relationships discussed
above, the installed-plant equipment capital and
material operating costs were determined. Total
operating costs for the plant sections were
determined by the power and process fuel
requirements and operating and maintenance labor
costs.
The Case 3 costing data was extrapo
lated to the remaining cases by an exponential
scaling method. This procedure accounts for
major economies of scale and non-linear effects
in the cost scaling analysis. A weighted aver
age scaling exponent is derived for each plant
section by obtaining a standard scaling exponent
from the literature for the principal pieces of
equipment in each section, and weight-averaging
these exponents against the total section capi
tal cost. Thus, an overall scaling exponent for
each plant section was derived and used in the
capital cost analysis for the remaining four
cases.
Similarly, operating and maintenance
cost components were developed for Case 3 using
a separately derived sequence of engineering
scaling exponents, as shown on Table 1. Opera
ting and maintenance labor schedules were then
defined for the remaining cases and the opera
ting cost componer ts for each plant section
determined.
F. ECONOMIC ANALYSIS
The results of the economic analyses
for shale oil, alumina, and soda ash are shown
in Table 2 for a 15% discount rate.
Two major assumptions distinguish this
stuay from other recent studies. The shale oil
is assumed to be raw, i.e., not hydrotreated or
otherwise upgraded. Assuming a current crude
205
Page 10
TABLE 1
CASE 3 Burdened Costs
1980 Dollars, in Millions)
FACILITY
Basic Plant
Mining/Primary CrushingNahcolite Recovery Unit
Retort/Oil and Gas HandlingProcess and Plant H2O Facilities
Slurry Disposal
General Plant Facilities
Total
ALSAR Plant
Retorted Shale
Crushing & LeachingA1(0H)3 Precipitation and WashingAl (0H)3 Calcination
Na2C03 Crystallization and Filtration
Na2C03 Dehydration
Total
Capital Operating C.osts
Costs Material Labor Power Process Gas Diesel
(MW) (109 BTU/day) (109gal/yr)
38.0 0.2 21.6 8.2 __ 1.3
42.3 2.9 4.0 2.4 1.3 --
143.3 17.6 6.1 7.5 0.2 --
5.0 0.5 2.8 1.4 -- --
2.1 1.1 4.9 3.6 -- --
13.1 1.7 2.9 1.3 0.7 --
243.8 24.0 42.3 24.4 2.2 TT3
33.4 3.3 6.7 13.5
5.7 0.4 1.2 1.2 --
20.4 1.9 3.5 1.7 3.2 --
15.6 1.6 3.0 1.7 6.2 --
4.9 0.9 1.1 0.8 0.8 --
80.0 15.5 18.9 10.1
Does not include recycle gas to retort.
TABLE 2
SHALE CO-PRODUCT STUDY
ECONOMIC RESULTS
Rich Shale,Lean Minerals
Rich Shale,Rich Minerals
Case
Shale Oil ($/Bbl)
Escalating Price
+2% per year
w offgascredits*
Escalating Price
w/o offgas credits
Constant Price
w/o offgas credits
Alumina ($/Ton)
with offgas costs
w/o offgas costs
Lean Shale,Rich Minerals
26.1 19.8 26.3 19.5
27.1 22.4 29.2 20.2
33.5 25.4 33.6 25.0
1028 887 257 229
990 849 222 194
26.3
30.7
33.4
205
170
Soda Ash ($/Ton)
with offgas costs
w/o offgas costs
339 116 77 74 71
151 58 37 34 31
1Offgas credits are $5 per MMBTU
206
Page 11
oil cost of $35 per barrel and a discount of
about $10 per barrel for upgrading, shale oil in
this study must cost less than $25 per barrel to
be competitive. In addition, energy costs, and
therefore the price of shale oil, were assumed
to increase 2% per year in real terms. This has
a major effect on economics, as shown on Table
2. When energy costs are not escalated, the
cost of crude oil increases about $5 per barrel
in Cases 2 and 3, while it increases about $7
per barrel in the other cases.
The costs of shale oil are competitive
in Cases 1 and 2, out the costs of alumina and
soda ash are not because of the low mineral con
tent of the mined shale. Case 5 has the shale
with lowest oil content and, in general, the
shale oil economics are the worst, but not sig
nificantly so because of the credits available
from the mineral co-products which are mined in
large quantities.
Upgrading the soda ash and alumina will
require large amounts of energy in the form of
heat which would have to be purchased. However,
the retort produces sufficient volumes of low
BTU gas to meet these requirements and it was
therefore assumed that it would be purchased at
the cost of alternate energy, assumed to be the
current decontrolled price of energy, or $5 per
million BTU. The sale of offgas improves the
economics of shale, oil production by $0.40 to
$1.00 per barrel in Cases 1 and 2 (the "low
minerals"
cases ) and $2.90 to $4.40 per barrel
in Cases 3, 4 and 5 (the "highminerals"
cases).
1990 Estimated Market Price, 1980 $/Ton
Co-products Competitive Products
Case 3
Alumina
Soda Ash
257
77
230-270
82-1421
The estimated international price after
deducting $68 per ton in transportation differ
ential .
The co-product alumina and soda ash
costs include a 2% per year escalation in energy
costs and will remain constant in real terms
over the life of the shale oil plant, while the
cost of competitive products will escalate with
energy costs.
The economic analysis shows that the
cost of alumina and soda ash can be broken down
as follows for Case 3:
Dollars per Ton
Alumina Soda Ash
Direct Operating Costs 131 22
Offgas Costs 35 40
Other
Total 257 77
Thus, offgas purchased from the shale
oil facility constitutes a significant part of
the co-product alumina and soda ash costs.
Thus, the"sale"
of low BTU gas to the
co-product facilities can improve the economics
of shale oil significantly.
The Case 3 co-product alumina and soda
ash recovery costs are competitive at prices
estimated for 1990 and later years, as shown
below:
G. MARKET POTENTIAL
The four end-products -- shale oil,
alumina, soda ash and nahcolite -- produced by
the shale oil co-proauct plant share many of the
same facilities, particularly in the ore
mining. In addition, they can take major advan
tage of otherwise waste energy, such as the
excess process heat and low BTU offgas produced.
207
Page 12
The underlying condition for economi
cally feasible recovery of alumina, soda ash,
and nahcolite from spent oil shale is that the
marginal costs of production will be signifi
cantly less than the competitive market values
for these products. A commercial facility for
recovery of soda ash and alumina from retorted
shale thus requires the following conditions:
The product quality must be compa
tible with the prospective end uses
and the supply must be reliable.
The products must be manufactured
and delivered to markets at compe
titive prices.
There must be adequate markets to
absorb the production without significant effect on the product
price.
A market study of minerals is especial
ly dependent upon the assumptions used in the
analysis. Market constraints and preferences
are inherently subjective and a function of the
analyst's definition of the market. In the case
of shale co-products, the two most important
assumptions used are that the markets are inter
national and that the products with the most
favorable economics will ultimately penetrate
the market.
The demand for alumina, soda ash and
nahcolite differs substantially. Alumina has
essentially only one end use as a raw material
for primary aluminum manufacturing by electroly
tic reduction. Soda ash, while heavily depen
dent upon glass as a major market, has a wide
range of other applications and can be a direct
substitute for caistic soda (sodium hydroxide)
in many end uses, or can be indirectly substi
tuted by simple causticization with calcium
hydroxide.
The major competitors of oil shale
based alumina are the processors of imported
bauxite (principally from Jamaica) and imports
of alumina (principally from Australia).
Current tax levies imposed by these exporting
countries greatly influence the costs of the
competing products.
Oil shale based soda ash is faced with
an analogous competitive product, caustic soda,
whose supply depends on the demand for chlo
rine. Since chlorine markets are quite dissimi
lar from those of caustic soda and are growing
at a lower rate, sizeable imbalances in the
demand and supply of chlorine based caustic
could occur in the future. Because chlorine
demand has not increased substantially recently
and could decrease in the future, shortfalls in
the supply of chlorine-based caustic could
result in a rising demand for sources based on
soda ash.
The major competitor to nahcolite is
not another chemical product, but rather compe
ting air control technologies that coal burning
utilities will be able to choose from.
Because the source of co-products is
landlocked and in a new supply area, transpor
tation costs to markets play an influential role
in the economics of oil shale minerals reco
very. For alumina, the transportation costs
could provide some market advantage to the
large, low-energy cost aluminum smelters of the
Northwest. For soda ash, transportation would
add about 75% to production costs for overseas
markets. Transportation would be the major cost
item for nahcolite.
Finally, the market potential for the
oil shale mineral derivatives --
alumina, soda
ash and nahcolite -- is very much dependent upon
governments.
The U.S. Government needs to deter
mine the national security value of
having a substantial domestic
source of alumina and aluminum,
vital defense and transportation
commodities. In addition, if the
U.S. is to have any influence over
future tax and pricing decisions of
the International Bauxite Associa
tion, a cartel of bauxite producingnations, and thus maintain a compe
titive domestic aluminum industry,
208
Page 13
it will need a substantial domestic
source of alumina.
Foreign governments, particularly
those of Western Europe, will need
to provide access to U.S. exports
of soda ash and chlorinated pro
ducts. In addition, they will need
to reexamine their bilateral trade
policies with COMECON countries
that may lock them into future high
cost sources of soda ash.
Alumina Markets
Delivered costs of alumina are highly
dependent on transportation costs and the major
ity of alumina and aluminum plants are located
near water to use this cheaper transportation
mode. A shale oil co-product facility would
need to use rail freight and would, moreover,
have to build a railroad spur to the plant.
Transportation costs are therefore difficult to
determine, particularly since railroad rates are
being decontrolleo. Because of its geographic
location, a shale oil plant might have competi
tive transportation economics with the movement
of alumina from the Gulf Coast to the Northwest
smelters, but this study assumes that shale
co-product alumina has no transportation advan
tages or disadvantages relative to other sources
of alumina.
The market analyses conclude that by
the year 1990 the potential co-product alumina
market in the U.S. and Canada is 3 to 5 million
tons per year. The costs for alumina from com
petitive processes include about $50 per ton
Jamaican taxes and they escalate with energy
costs, so that by the year 2000 the market price
will range from $240 to $280 per ton. The mar
ket for co-product alumina and the market price
based on cost of competitive production is sum
marized below:
Million Tons/Year $/Ton, 1980 $
1990 3-5 $230 - $270
2000 6-11 $240 - $280
2010 9-16 $250 - $290
Co-product alumina thus appears suffi
ciently economic to capture the total potential
market (particularly if offgas is provided from
the shale oil plant at favorable rates) with a
15% Return on Investment and to assist the shale
oil economics by"purchasing"
offgas from the
retort. The shale oil capacity that these
alumina markets would support are:
Year
1990
2000
2010
MBPD
230 - 400
450 - 850
700 - 1,250
Moreover, the direct operating costs of
co-product alumina are lower than those of com
peting processes. Even if Jamaica amended its
tax structure and U.S. tariffs were not reim-
posed, already constructed co-product facilities
would remain economic.
2. Soda Ash Markets
Transportation costs are more important
for soda ash markets than for alumina, since
they constitute a larger percentage of total
costs. Currently, rail transportation charges
from the Green River Basin to the U.S. Gulf
Coast or West Coast are about $42 per ton.
Ocean freight to Western Europe or Asia would
add another $20 per ton to transportation
costs. Assuming transportation costs increase
1% per year, the landed costs of co-product soda
ash are projected to be:
Soda Ash, CIF
Year $/Ton
1980 139
1990 145
2000 152
2010 160
The market potential for co-product
soda ash and the international market price
based on costs of competing processes are esti
mated as follows:
209
Page 14
Year Mi 11 ion Tons/Year Market Price, $/Ton
1990 4-5 150-210
2000 9-12 170-230
2010 14-18 200-260
The low range of this potential market
assumes that co-product soda ash will displace
existing West European Solvay plants by 2010 and
capture 50% of West European and Asian growth
markets. The high side assumes that additional
ly some sales to Western Europe of East Euro
pean Solvay ash will be displaced, that some
U.S. growth markets will be covered by co-pro
duct soda ash, that soda ash will replace some
caustic soda, and that new markets will develop.
The 1990 delivered costs of co-product
soda ash are below the range of the estimated
competitive market price. About 60% of the
costs for Solvay soda ash consist of energy
costs. Thus, the inherent cost structure is
such that Solvay ash will become increasingly
more costly while co-product soda ash will only
escalate with transportation costs assuming
no protective tariffs are imposed. Thus, it
appears that the full market potential of 4 to 5
million tons could be achieved by 1990.
The potential soda ash markets corres
pond to the following shale oil production:
Srtale Oi 1 Production,Year MBPD
1990 170 - 220
2000 400 - 500
2010 600 - 800
NahcoVite Markets
regulations, and rapid developments in scrubbing
technology, any market projections are uncertain.
Overall, the market for nahcolite in
1990 could be up to one million tons per year.
This is equivalent to the output of a single
15,000 barrel per day demonstration unit. It
therefore appears likely that the bulk of the
nahcolite recovered as part of shale oil mining
will be backfilled in the mine.
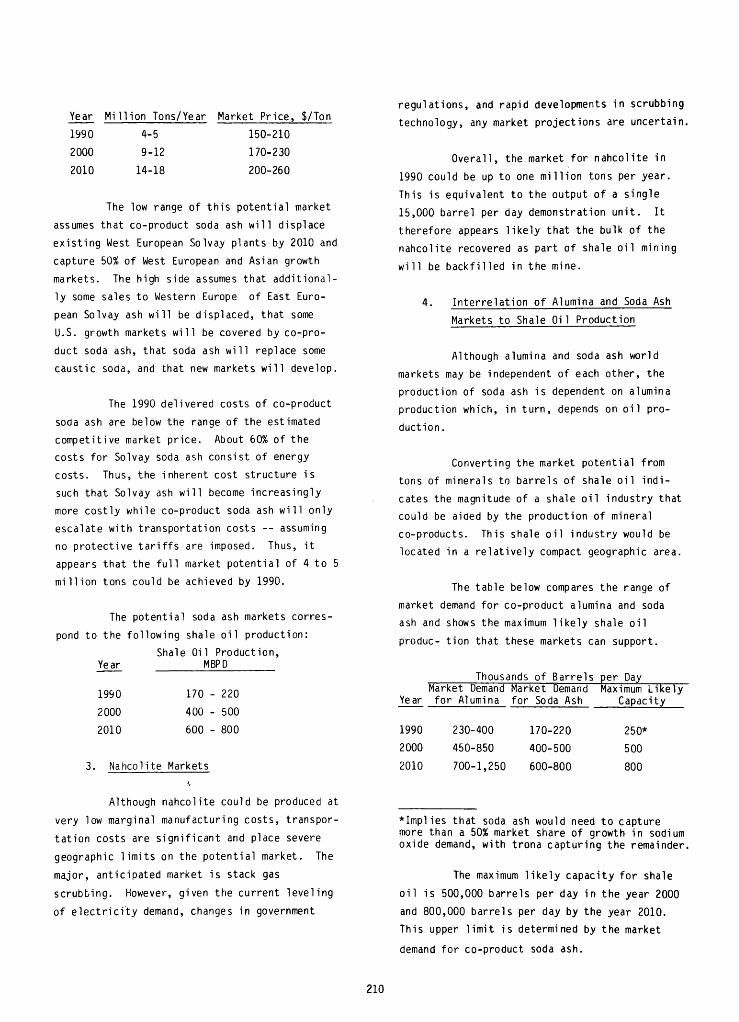
4. Interrelation of Alumina and Soda Ash
Markets to Shale Oil Production
Although alumina and soda ash world
markets may be independent of each other, the
production of soda ash is dependent on alumina
production which, in turn, depends on oil pro
duction.
Converting the market potential from
tons of minerals to barrels of shale oil indi
cates the magnitude of a shale oil industry that
could be aided by the production of mineral
co-products. This shale oil industry would be
located in a relatively compact geographic area.
The table below compares the range of
market demand for co-product alumina and soda
ash and shows the maximum likely shale oil
produc- tion that these markets can support.
Thousands of Barrels per DayMarket Demand Market Demand Maximum Likely
Year for Alumina for Soda Ash Capacity
1990 230-400 170-220
2000 450-850 400-500
2010 700-1,250 600-800
250"
500
800
Although nahcolite could be produced at
very low marginal manufacturing costs, transpor
tation costs are significant and place severe
geographic limits on the potential market. The
major, anticipated market is stack gas
scrubbing. However, given the current leveling
of electricity demand, changes in government
?Implies that soda ash would need to capture
more than a 50% market share of growth in sodium
oxide demand, with trona capturing the remainder.
The maximum likely capacity for shale
oil is 500,000 barrels per day in the year 2000
and 800,000 barrels per day by the year 2010.
This upper limit is determined by the market
demand for co-product soda ash.
210
Page 15
REFERENCES
1. Beard, T.N., Tait, D.B., and Smith, J.W.,
1974, "Nahcolita and Dawsonite Resources in
the Green River Formation, Piceance Creek
Basin,Colorado,"
Rocky Mountain Association
of Geologists - Yearbook 1974.
2. Hall, R.N., Hass, F.C., 1970, U.S. Patent No.
3,510,255, Patented May 5, 1970. Recovery of
Sodium Aluminate from Dawsonite.
3. Hass, F.C., and Atwood, M.T., 1975, Recovery
of Alumina from Dawsonite Oil Shales: Quar
terly of the Colorado School of Mines (3),
pp. 95-107.
211