Hand-grasping and finger tapping induced similar functional near- infrared spectroscopy cortical responses Nasser H. Kashou Brenna M. Giacherio Ramzi W. Nahhas Sudarshan R. Jadcherla Nasser H. Kashou, Brenna M. Giacherio, Ramzi W. Nahhas, Sudarshan R. Jadcherla, “Hand-grasping and finger tapping induced similar functional near-infrared spectroscopy cortical responses, ” Neurophoton. 3(2), 025006 (2016), doi: 10.1117/1.NPh.3.2.025006. Downloaded From: https://www.spiedigitallibrary.org/journals/Neurophotonics on 01 Aug 2019 Terms of Use: https://www.spiedigitallibrary.org/terms-of-use
Transcript
Hand-grasping and finger tappinginduced similar functional near-infrared spectroscopy corticalresponses
Nasser H. KashouBrenna M. GiacherioRamzi W. NahhasSudarshan R. Jadcherla
Nasser H. Kashou, Brenna M. Giacherio, Ramzi W. Nahhas, Sudarshan R. Jadcherla, “Hand-grasping andfinger tapping induced similar functional near-infrared spectroscopy cortical responses,”Neurophoton. 3(2), 025006 (2016), doi: 10.1117/1.NPh.3.2.025006.
Downloaded From: https://www.spiedigitallibrary.org/journals/Neurophotonics on 01 Aug 2019Terms of Use: https://www.spiedigitallibrary.org/terms-of-use
Hand-grasping and finger tapping induced similarfunctional near-infrared spectroscopy corticalresponses
Nasser H. Kashou,a,* Brenna M. Giacherio,a Ramzi W. Nahhas,b,c and Sudarshan R. Jadcherlad,e
aWright State University, Biomedical, Industrial and Human Factors Engineering, 3640 Colonel Glenn Highway, Dayton, Ohio 45435, United StatesbWright State University, Department of Community Health, 3123 Research Boulevard, Kettering, Ohio 45420, United StatescWright State University, Department of Psychiatry, 3123 Research Boulevard, Kettering, Ohio 45420, United StatesdThe Research Institute at Nationwide Children’s Hospital, Innovative Research Program in Neonatal and Infant Feeding Disorders,700 Children's Drive, Columbus, Ohio 43205, United StateseThe Ohio State University College of Medicine, Division of Neonatology, Department of Pediatrics, 370 W 9th Avenue, Columbus, Ohio 43210,United States
Keywords: functional near-infrared spectroscopy; near-infrared spectroscopy; motor cortex; motor stimulation; finger tapping; handgrasping.
Paper 15046SSR received Oct. 15, 2015; accepted for publication Dec. 8, 2015; published online Jun. 15, 2016.
1 IntroductionNear-infrared spectroscopy (NIRS) is a noninvasive imagingmodality. As its name suggests, NIRS is based in the infraredportion of the electromagnetic spectrum that overlaps the visiblerange. The term spectroscopy refers to the fact that multiplewavelengths are used to determine a composition. NIRS oper-ates using a combination of sources that emit light between∼650 and 950 nm and photon detectors that measure light inten-sity at a given distance from the sources. Changes in the con-centration of the oxygen-transport molecule and hemoglobin,can be determined for biological tissues between each near-infrared (NIR) source and detector. These changes in hemoglo-bin concentration are related to neuronal activation, or consump-tion, within the region-of-interest (ROI) of the motor cortex;thus, NIRS can be used for monitoring the cortical function.When a stimulus is used to trigger activation in a region ofthe brain, this modality is known as functional near-infraredspectroscopy (fNIRS). Within this particular range of wave-lengths, the amount of light that biological tissue absorbs isquite low. On the other hand, the same biological tissue willhighly scatter these low-energy photons. Thus, unlike x-rays,NIR photons are not directly transmitted through tissue.
Obrig1 considers NIRS to be a promising tool for the assess-ment of neurological fields so as to develop indications foruse beyond feasibility. There is a potential for using NIRS to
monitor and assist a rehabilitation from motor dysfunction ina physical therapy clinic. Additionally, NIRS’ portability andcompact size make the system feasible and user-friendly thatother larger equipment such as magnetic resonance imaging(MRI) cannot offer. This allows increased privacy, convenienceand requires no preparation for the patient. Time-to-diagnosis atthe point-of-care can be decreased, thus reducing resourceutilization.
Imaging research with stroke rehabilitation and the neuro-logical changes occurring when blood supply is blocked canbe descriptive but does not characterize changes in function.Most often, blockages in the middle cerebral artery can leadto loss of sensation and motor control over the contralateralside of the body,2 and loss of sensory motor function in theupper limbs results from ∼80% of strokes.3
Kato et al.4 compared fNIRS and fMRI for detection andmonitoring of cortical motor organization following hemipare-sis. They found that movement of the affected hand activatedmotor cortex bilaterally rather than in just the contralateral hemi-sphere. Miyai et al.5 utilized NIRS to study hemiparetic gait ofpoststroke patients using a treadmill before and after 2 monthsof rehabilitation and confirmed improvement in hemisphericasymmetry that correlated with improved gait.
Applications of fNIRS in stroke rehabilitation permits mon-itoring of neural activity during various experimental therapies.6
This allows personalizing the rehabilitation to each patient. In a
Downloaded From: https://www.spiedigitallibrary.org/journals/Neurophotonics on 01 Aug 2019Terms of Use: https://www.spiedigitallibrary.org/terms-of-use
similar vein, it has been suggested to employ real-time imagingeither during or immediately before and after the therapy.7
In fact, Mihara et al.8 found greater cortical activation andfunctional gain in the hands for poststroke patients that wereprovided direct feedback of their fNIRS signals.
Another application for NIRS is with brain–computer inter-face (BCI). It has been proposed that cortical activation duringimaginary movement (motor imagery) can be utilized in an opti-cal BCI, which can then be used to control a robotic splint ora virtual environment to give the patient positive feedback.3
Sagara et al.9 based upon the methods of Haida et al.10 devel-oped a portable NIRS-based BCI to control television program-ming or propel a toy robot. Furthermore, fNIRS data can becombined with other physiological signals—heart and respira-tion rate, blood pressure (BP), and skin conductance—as a steptoward developing a real-time BCI for controlling a virtual real-ity robot.
As with all imaging modalities, fNIRS offers strengths andopportunities for research. Much work is needed to developclinical standards for both collecting and analyzing fNIRSdata. Our study is aimed at assessing the hemodynamic concen-tration changes at the primary and premotor motor cortices inadults during whole-hand grasping and sequential finger-opposition (tapping) tasks. We investigated the: (1) sensitivityof fNIRS for detecting changes in hemoglobin (cortical activa-tion) levels from various stimulus types: tapping versus graspingand (2) reproducibility of these measurements with repetition.
2 Materials and Methods
2.1 Instrumentation
A continuous wave, single phase, compact NIRScout imagingsystem (NIRx Medical Technologies LLC)—with eight 760-and 850-nm wavelength light-emitting diode sources (power:>5 mW∕wavelength) and 12 Si photodiode detectors (sensitiv-ity and dynamic range: <1 pW, 90 dB)—was used to measurechanges in oxy-hemoglobin (HbO) and deoxy-hemoglobin(HbD) at a sampling rate of 6.25 Hz. Changes in concentrationof both HbO and HbD were defined as the differences betweenan average baseline and a stimulus-induced peak. Event markers
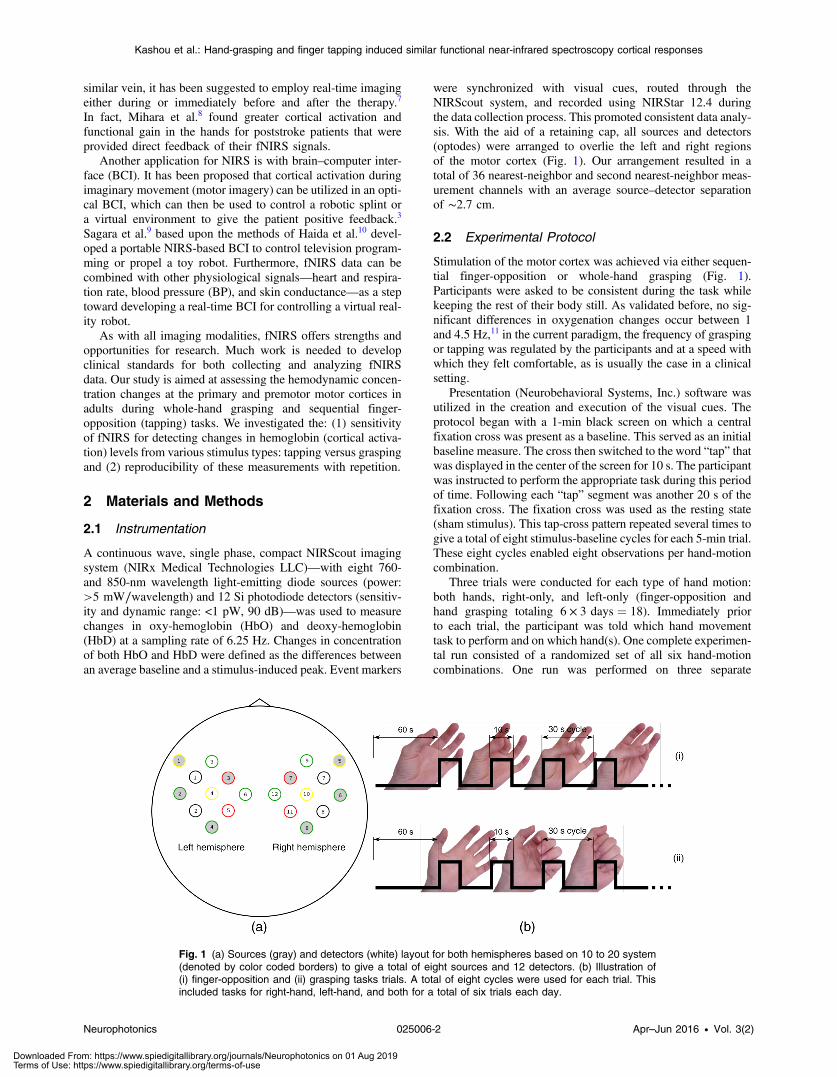
were synchronized with visual cues, routed through theNIRScout system, and recorded using NIRStar 12.4 duringthe data collection process. This promoted consistent data analy-sis. With the aid of a retaining cap, all sources and detectors(optodes) were arranged to overlie the left and right regionsof the motor cortex (Fig. 1). Our arrangement resulted in atotal of 36 nearest-neighbor and second nearest-neighbor meas-urement channels with an average source–detector separationof ∼2.7 cm.
2.2 Experimental Protocol
Stimulation of the motor cortex was achieved via either sequen-tial finger-opposition or whole-hand grasping (Fig. 1).Participants were asked to be consistent during the task whilekeeping the rest of their body still. As validated before, no sig-nificant differences in oxygenation changes occur between 1and 4.5 Hz,11 in the current paradigm, the frequency of graspingor tapping was regulated by the participants and at a speed withwhich they felt comfortable, as is usually the case in a clinicalsetting.
Presentation (Neurobehavioral Systems, Inc.) software wasutilized in the creation and execution of the visual cues. Theprotocol began with a 1-min black screen on which a centralfixation cross was present as a baseline. This served as an initialbaseline measure. The cross then switched to the word “tap” thatwas displayed in the center of the screen for 10 s. The participantwas instructed to perform the appropriate task during this periodof time. Following each “tap” segment was another 20 s of thefixation cross. The fixation cross was used as the resting state(sham stimulus). This tap-cross pattern repeated several times togive a total of eight stimulus-baseline cycles for each 5-min trial.These eight cycles enabled eight observations per hand-motioncombination.
Three trials were conducted for each type of hand motion:both hands, right-only, and left-only (finger-opposition andhand grasping totaling 6 × 3 days ¼ 18). Immediately priorto each trial, the participant was told which hand movementtask to perform and on which hand(s). One complete experimen-tal run consisted of a randomized set of all six hand-motioncombinations. One run was performed on three separate
Fig. 1 (a) Sources (gray) and detectors (white) layout for both hemispheres based on 10 to 20 system(denoted by color coded borders) to give a total of eight sources and 12 detectors. (b) Illustration of(i) finger-opposition and (ii) grasping tasks trials. A total of eight cycles were used for each trial. Thisincluded tasks for right-hand, left-hand, and both for a total of six trials each day.
Neurophotonics 025006-2 Apr–Jun 2016 • Vol. 3(2)
Kashou et al.: Hand-grasping and finger tapping induced similar functional near-infrared spectroscopy cortical responses
Downloaded From: https://www.spiedigitallibrary.org/journals/Neurophotonics on 01 Aug 2019Terms of Use: https://www.spiedigitallibrary.org/terms-of-use
days/sessions in order to give a total of 18 trials and 144 stimu-lus events per subject. NIRS signals fluctuate, even duringa resting state, which is the reason that a long initial baselinewas chosen.12,13
2.3 Participant and Preparation
A total of 10 participants (23.8� 4.8 years, mean� std) wererecruited at Wright State University. Half were female(23.1� 3.6 years) and the other half were male (24.4�6.1 years), and all were right-hand dominant. Participantswith a variety of hair types were included in this study. Theexperimental protocol was approved by the Internal ReviewBoard at Wright State University and informed consent wasobtained from each participant prior to involvement in thestudy.
Subjects were seated in front of a computer monitor and theirheads were supported by a chin rest. After an optode retainingcap was placed on the subject’s head and centered, clear salineelectrode gel was applied in order to enhance the signal qualityby keeping the hair aside and improving optode contact with theskin. The gel application process allows hair to be pushed andkept aside before inserting optodes into the cap. Measurementswere taken in a quiet and darkened room. A large, fleece cap wasplaced over the subject’s head to further reduce any outside lightthat could possibly strike the detectors. Each participant wasasked to focus on a cross at the center of a computer monitorduring data collection while remaining silent and as still as pos-sible, aside from the hand movement tasks.
2.4 Data Analysis
Raw data were processed using the functions of Homer214,15—MATLAB-based (The Mathworks, Inc.) analysis tool and usedto extract relevant values such as peak and baseline concentra-tions. First, a wavelet filter with tuning parameter α ¼ 0.1016–18
was applied to the data. Wavelet filtering was chosen due to itsreported stability, consistency, and effectiveness for reduction ofmotion artifacts and low-frequency oscillations. Followingapplication of the wavelet filter to each dataset, a simple 0.01to 0.5 Hz bandpass filter was also used. This allowed elimina-tion of low-frequency system drift and physiological noisesuch as heart rate without removing artifacts that may be stimu-lus-induced. Filtered signals were translated to changes ofhemoglobin concentration using the modified Beer–Lambertlaw. Differential pathlength factor values for this region anda mean age of 23.8 years were estimated to be 6.14 and 5.09for wavelengths of 760 and 850 nm, respectively, based uponcalculations from previous studies.19,20
2.5 Statistical Analysis
Quantitative statistical analysis of hemoglobin concentrationchanges between baseline and peak was performed on themost consistent optode channel for each participant from theleft and (equivalent) right hemisphere. This was largely doneto seek out data that are artifact free and are consistent.Subject heterogeneity and head sizes vary and therefore record-ings may not always come from the same specific ROI. As ouraims were to detect grasp and finger movement related fNIRSchanges over a consistent 3-day period, this methodology wasthought to be appropriate for comparison. Here, baseline isdefined as the average concentration during the 10-s period
before each visual cue; peak is defined as the extremum reachedbetween 5 and 15 s after the cue. The signal for single hand taskswas measured in the opposite hemisphere. The signal for tasksperformed with both hands was the average signal over bothhemispheres. Mixed effects linear regression was used with arandom subject intercept to estimate the signal pooled overdays and by day. Grasping versus tapping tasks were compared,adjusted for day, if the day × task interaction was not sta-tistically significant. This was performed on both the individualand group levels. All tests were two-sided and performed at theα ¼ 0.05 level. PROC MIXED in SAS 9.3 (SAS Institute Inc.,2010. SAS Version 9.3. SAS Institute Inc., Cary, NorthCarolina) was used to fit all models.
3 Results
3.1 Hemodynamic Response
An example of the elicited hemodynamic responses for one par-ticipant is shown in Fig. 2. The largest number of events andchannels in which a hemodynamic response was observedoccurred for subjects 1 and 2. Both subject 6 and subject 7also had more than 40 events in which a response was observed.Subjects 5 and 8 had the fewest number of events showing acti-vation. The fewest total active channels were seen with subjects8 and 10, which were followed closely by subjects 4 and 5. Fora visual comparison, these data are shown in Fig. 3, in whichthey are also broken down by session.
3.2 Motor Stimuli Statistics
3.2.1 Individual level
Figures 4 and 5 show the signal magnitudes for tapping andgrasping and across days/sessions, respectively, at the individuallevel. A significant difference (α ¼ 0.05) was not foundbetween the levels of hemodynamic responses for whole-handgrasping and sequential finger-opposition (tapping). Significantdifferences in response levels occurred between data collectionsessions in two participants.
3.2.2 Group level
Statistical results for the group are summarized in Table 1. Therewas no overall significant difference in hemodynamic responselevels between motor tasks (Fig. 6). Signals were consistentacross days/sessions for the group (Fig. 7). One exceptionwas the difference in grasping and tapping HbO signals forthe right hand. There was significant task × day interaction(p < 0.05), with mean grasping and tapping signals significantlydifferent on days 2 and 3, but not on day 1.
4 DiscussionThe present study aimed to assess the fNIRS signal activation atthe primary and premotor motor cortices in adults during whole-hand grasping and sequential finger-opposition (tapping) tasks.Specifically, we investigated sensitivity and repeatability foreach task to further assess the possibility of using fNIRS inphysical rehabilitation tasks longitudinally. While the data forhand-grasping were noisier than the finger-opposition datathey both were reliable for the best optode channel. Hand-grasp-ing usually produces more bodily motion due to the fact that it isa more forceful movement. Finger-opposition, on the otherhand, is a finer, more delicate movement. Additionally, it has
Neurophotonics 025006-3 Apr–Jun 2016 • Vol. 3(2)
Kashou et al.: Hand-grasping and finger tapping induced similar functional near-infrared spectroscopy cortical responses
Downloaded From: https://www.spiedigitallibrary.org/journals/Neurophotonics on 01 Aug 2019Terms of Use: https://www.spiedigitallibrary.org/terms-of-use
been noted that these motor stimuli tend to slightly increaseheart rate and, in turn, blood flow and oxygenation.21,22 Thiscould contribute somewhat to the pronounced hemodynamicresponse that is observed for both types of motor stimuli, regard-less of increased motion noise.
It is common in functional studies of the motor cortex, espe-cially those stimulated over a 20-s period, to see not one buttwo peaks in the HbO response curve.23–26 This phenomenonwas indeed present in the results of six subjects for stimuli withonly half that duration. However, it was observed that not allstimulus events exhibited a double peak in the HbO response;
some only showed one. For the vast majority, the double peakremained after block averaging even when not present forevery event. Some studies have also discovered evidencethat the HbO response can begin a couple seconds prior tothe stimulus itself, which has been attributed to mental simu-lation in preparation for the movement task.23,24 This prestimu-lation increase in HbO is not present in every event or evenevery subject, but does remain after block averaging for 6out of 10 participants. It tends to appear as a small shoulderof the large peak observed at the actual onset of the stimulus.Further, Steinbrink et al.,27 Wolf et al.,23 and Jasdzewski et al.28
Fig. 3 Summary of qualitative statistics for motor cortex trials. A total of 48 motor cortex stimulationevents were analyzed for each of 10 participants. Each event possessed a total of 36 possible datachannels to give a total of 1726 channels for each participant that were analyzed for the presence ofan observable hemodynamic response. The number of (a) events and (b) channels in which a responsewas observed are illustrated. Note that the largest number of events and channels were obtained forthe first two participants.
Fig. 2 Typical hemodynamic responses for three trials of the finger-opposition task—one from each datacollection session. All eight stimulus events from each trial are overlaid on a single graph for a repre-sentative channel. HbO curves range from red (first event) to yellow (eighth event) and HbD curves rangefrom blue to green. The shaded region indicates the duration of the stimulus.
Neurophotonics 025006-4 Apr–Jun 2016 • Vol. 3(2)
Kashou et al.: Hand-grasping and finger tapping induced similar functional near-infrared spectroscopy cortical responses
Downloaded From: https://www.spiedigitallibrary.org/journals/Neurophotonics on 01 Aug 2019Terms of Use: https://www.spiedigitallibrary.org/terms-of-use
have noted that the HbD response began about 1.7 to 2 s afterthat of HbO within the motor cortex. Our results also confirmthis finding.
For the motor cortex, there is an evidence that hair thicknessaffects the hemodynamic response results. Subjects withcoarse hair produced significantly different results than eitherthose with fine hair (HbO) or with medium hair (HbD).A p-value of 0.2750 was not enough evidence to concludethat hair color alone was a factor. However, the participantswho had the darkest hair also had the coarsest. As such,there may be an underlying interaction between the two effects,but it cannot be investigated using the data from this series.Future studies could be specifically designed to investigatethe possibility.
fNIRS studies focusing on the motor cortex are quite preva-lent. Subudhi et al.,29 e.g., compared oxygenation changes inthree cortical regions—prefrontal, premotor, and motor—duringmaximal exercise. Ikegami and Taga30 observed that the amountof cortical activation was positively correlated with the level ofkinetic movement. They also discovered a decrease in the sen-sorimotor cortex activation (ΔHbO) as subjects learned themultijoint upper limb motor task, which was attributed tochanges in motor commands. Hatakenaka et al.31 found thatactivation shifted posteriorly (from the presupplementary motorarea to the supplementary motor area) with task repetition.These claims were further supported by the findings ofMorihiro et al.32 They noted a decreasing tendency in the mag-nitude of HbO changes within the primary motor cortex, which
Fig. 4 Summary of quantitative results obtained for task types using the most consistent motor cortexchannel in each of the 10 participants. Associated error bars for the HbO (red) and HbD (blue) responsesare given in black. Differences in response magnitudes did not reach significance (p < 0.05) for anyparticipant.
Fig. 5 Summary of quantitative results obtained across the three data collection sessions for the mostconsistent motor cortex channel in each of the 10 participants. Associated error bars for the HbO (red)and HbD (blue) responses are given in black. Differences in responsemagnitudes for both HbO and HbDonly reached significance (p < 0.05) for 2 out of 10 participants.
Neurophotonics 025006-5 Apr–Jun 2016 • Vol. 3(2)
Kashou et al.: Hand-grasping and finger tapping induced similar functional near-infrared spectroscopy cortical responses
Downloaded From: https://www.spiedigitallibrary.org/journals/Neurophotonics on 01 Aug 2019Terms of Use: https://www.spiedigitallibrary.org/terms-of-use
suggested that the specific active areas of the brain change overthe course of learning a motor task.
Many motor cortex studies have also compared multiplemodalities. Rather than utilizing fMRI as a tool to locate or con-firm regions of high activation on individual subjects for fNIRSstudies, one group actually used transcranial magnetic stimula-tion (TMS). During a hand-grasping task, Akiyama et al.33 uti-lized TMS to determine the specific area which had the highestactivity prior to application of NIRS sources and detectors. Also,the use of fMRI in combination with fNIRS is quite common.
Huppert et al.34 utilized NIRS simultaneously with each of twoseparate fMRI protocols: arterial spin labeling (ASL) and bloodoxygen level-dependent (BOLD). High correlation was foundbetween NIRS HbO and total hemoglobin measures and thecerebral blood flow measured via ASL fMRI. Similarly, highcorrelation was found between NIRS HbD response and theBOLD fMRI signal.
Gagnon et al.35 investigated cortical versus superficial oxy-genation changes elucidated from a finger tapping task duringsimultaneous fNIRS and BOLD fMRI. In addition, yet another
Table 1 Analysis of HbD and HbO concentration changes by signal, task, and hand across days/sessions.
Signal Task HandΔConcentration
(nmol∕L) 95% lower CB 95% upper CB pa Vary by day?bG ¼ T?
(adjusted for day)
HbD Grasping Left −20.56 −24.86 −16.25 <0.0001 0.0254 0.4265
Tapping −19.10 −24.38 −13.82 <0.0001 0.0086 —
Grasping Right −30.90 −47.50 −14.30 0.0020 0.0003 0.1517
Tapping −26.98 −40.15 −13.81 0.0010 0.0431 —
Grasping Both −27.42 −39.05 −15.78 0.0004 0.0395 0.5477
Tapping −28.78 −43.45 −14.11 0.0014 0.0447 —
HbO Grasping Left 76.22 55.05 97.39 <0.0001 0.5099 0.4729
Tapping 70.36 49.94 90.77 <0.0001 0.8216 —
Grasping Right 81.68 62.49 100.86 <0.0001 <0.0001 c
Tapping 81.27 58.26 104.27 <0.0001 0.6093 —
Grasping Both 92.60 63.38 121.82 <0.0001 0.1784 0.5989
Tapping 88.86 63.61 114.10 <0.0001 0.1400 —
Note: CB means confidence bound.aThe task × day interaction term was significant for Hb0 right. The G versus T comparison p-values by day are: day 1: 0.1980, day 2: 0.0001, andday 3: 0.0135.
bH0: mean Δ concentration = 0 versus H1: mean Δ concentration ≠ 0.cH0: mean Δ concentration same on all days versus H1: mean Δ concentration not the same on all days.
Fig. 6 Distributions of HbD and HbO concentration changes by task (G ¼ grasping and T ¼ tapping) andhand (L ¼ left, R ¼ right, and B ¼ both). For each task × hand combination, there were 10 subjects × 8cycles × 3 days (240 measurements per boxplot).
Neurophotonics 025006-6 Apr–Jun 2016 • Vol. 3(2)
Kashou et al.: Hand-grasping and finger tapping induced similar functional near-infrared spectroscopy cortical responses
Downloaded From: https://www.spiedigitallibrary.org/journals/Neurophotonics on 01 Aug 2019Terms of Use: https://www.spiedigitallibrary.org/terms-of-use
group looked at cortical activation during apple peeling usingfNIRS and fMRI. Real apple peeling was performed whilefNIRS measurements were recorded; mock apple peeling wasperformed during concurrent fNIRS and fMRI recording. Itwas found that while the motor cortex showed activation inboth cases, the prefrontal cortex only showed activation duringthe real case. This illustrates that fNIRS alone—as an alternativeto fMRI—is promising for the study of cortical activation duringeveryday tasks.
4.1 Overall Sensitivity
No significant differences were found in hemodynamic responselevels between the two motor tasks for any study participant,which seems to indicate that using either task would be suffi-cient to study dysfunction in motor pathways. Choice of taskcould then be the decision of the study administrator with con-sideration given to each patient/subject; the sequential finger-opposition task is more complex, but the grasping task tendsto create more bodily motion.
4.2 Regulation and Quality Control
Procedures and the reasoning behind them were given both ver-bally as well as briefly within the written consent form which
each participant read and signed. Efforts were made by theexperimenter, particularly during the first session, to provideall necessary explanations and prompt the participant to askquestions. However, some information may have been lost intranslation or simply forgotten due to the sheer quantityreceived. Participants did remain quiet and, for the most part,still during data collection. A couple instances were notedwhen a participant shifted in the chair, although these instanceswere during rest periods of trials and the participant’s head didremain fixed on the chin rest.
4.3 Data Variability
4.3.1 Oscillations
It has been demonstrated that mean BP is significantly greater insitting and standing positions than it is while a person is lyingdown (supine). Although no significant change was seen in themean baseline values of HbO, the magnitude of 0.1 Hz oscilla-tions have been proven to be posture-dependent. These oscilla-tions are greatest when standing and least when lying down, as aperson would be during an MRI.36 For this study, subjects are ina seated position. This is a compromise between the magnitudesof spontaneous, regulatory BP oscillations—or Mayer waves.As such, care must be taken during analysis and when
Fig. 7 Distributions of HbD (top) and HbO (bottom) concentration changes across days/sessions by task(G ¼ grasping and T ¼ tapping) and hand (L ¼ left, R ¼ right, and B ¼ both). For each day × task × handcombination, there were 10 subjects × 8 cycles (80 measurements per boxplot).
Neurophotonics 025006-7 Apr–Jun 2016 • Vol. 3(2)
Kashou et al.: Hand-grasping and finger tapping induced similar functional near-infrared spectroscopy cortical responses
Downloaded From: https://www.spiedigitallibrary.org/journals/Neurophotonics on 01 Aug 2019Terms of Use: https://www.spiedigitallibrary.org/terms-of-use
comparing results between studies and modalities that utilizeanother posture.
In a clinical environment, a seated position is the most prac-tical. Standing may allow greater alertness (i.e., focus on thestimulus), but is not necessarily comfortable for the patient dur-ing an exam. Standing also introduces a greater risk of motionartifacts. A supine position, which is used in MRI, would requiremore space and equipment in the clinic to ensure patient com-fort. The increased comfort and motion artifact reduction thatmay result from a supine position could lead to significantlydecreased alertness—especially in a quiet, darkened examina-tion room. Some participants had a difficult enough timeremaining alert when seated for the trials. Lying down wouldonly make matters worse from this standpoint. Sitting in achair allows a compromise between these factors (as well asthe spontaneous, Mayer wave oscillations previously men-tioned) and facilitates optode placement.
As it has been noted in previous studies, low-frequency oscil-lations are common in NIRS data. Not only do these oscillationsappear in the overall time series, but they can survive averagingover many stimulus events.21 Thus, care must be taken whenfiltering and processing fNIRS signals. Unfortunately, noteveryone reports details on data processing steps.
4.3.2 Motion artifacts and noise
It is rare to see a signal reported from a single stimulus responsein scholarly articles. Instead, reported responses are generallyaveraged over a number of stimuli events, sessions, or evenacross subjects. While doing so reduces SNR, it does notallow one to see the true variability in the data. Individualresponses are generally much noisier than data presented inscholarly articles. Looking at individual stimulus events,then, presents a challenge when trying to comment upon therepeatability of fNIRS measurements. This challenge can becompounded if a person moves during data collection. Motorcortex stimulation, e.g., requires some form of movement onthe part of the subject (finger tapping, swallowing, etc.)which could introduce motion artifacts or other noise into thedata. This was seen in the whole-hand grasping motion versusthe sequential finger-opposition tasks for this project.
Additionally, despite possession of various sizes of commer-cially available optode retaining caps, there were still difficultiesin achieving a good fit. Even with a variety of cap sizes, there arebound to be adults who have a large quantity of hair or whosehead shape does not correctly fit the caps. These subjects mayrequire special modifications in order to obtain a snug fit. Attimes, the sheer quantity of hair significantly increased theamount of space between the cap and scalp. Further, therewas one participant in this project whose head was rather flatnear the crown. For this participant, extra straps were securedaround the cap once the optodes were in place. Otherwise,many optodes would not have achieved contact with the scalp.
Alternative to such modifications, a new optode holder couldbe designed that only covers the motor cortex region, but isadjustable to different head shapes and circumferences. Sucha new design could also allow denser optode configurations.The design and production of such equipment could take agood deal of time to perfect—both in terms of creation anddetermining an ideal optode configuration. For this project,we chose the option of multiple cap sizes due to time constraints.Investigation of a new design, however, is currently underway.
5 ConclusionWe have shown that: (1) we can attain reproducible signals and(2) there is no significant difference between tapping and grasp-ing tasks. This lack of difference in response levels between thetwo stimuli suggest that the same procedure could be usedacross a population, regardless of fine motor function. Thiscontributes to fNIRS being a promising tool as a standaloneprescreening and diagnosis within the clinical realm. However,a difference in measured activation levels across sessions indi-cates that there is room for improvement in terms of robustness.
In order for fNIRS to be implemented within the realm ofphysical therapy, further optimization is needed before accept-able levels of repeatability can be reached. Since data processingmethods have been well explored, this optimization would mostlikely include improvements in the hardware and experimentalsetup. An updated optode holder design, specific to the motorcortex, could possibly improve results as well.
References1. H. Obrig, “NIRS in clinical neurology—a ‘promising’ tool?”
Neuroimage 85, 535–546 (2014).2. F. Martini and J. L. Nath, Anatomy and Physiology, 2nd ed., Benjamin
Cummings, San Francisco (2010).3. C. Dormer, T. Ward, and S. McLoone, “Towards enhanced biofeedback
mechanisms for upper limb rehabilitation in stroke,” in 6th EuropeanSymp. Biomedical Engineering, Crete, Greece (2008).
4. H. Kato et al., “Near-infrared spectroscopic topography as a tool tomonitor motor reorganization after hemiparetic stroke: a comparisonwith functional MRI,” Stroke 33, 2032–2036 (2002).
5. I. Miyai et al., “Longitudinal optical imaging study for locomotor recov-ery after stroke,” Stroke 34, 2866–2870 (2003).
6. J. D. Schaechter, “Motor rehabilitation and brain plasticity after hemi-paretic stroke,” Prog. Neurobiol. 73(1), 61–72 (2004).
7. P.-Y. Lin et al., “Review: applications of near-infrared spectroscopy andimaging for motor rehabilitation in stroke patients,” J. Med. Biol. Eng.29, 210–211 (2009).
8. M. Mihara et al., “Near-infrared spectroscopy-mediated neurofeedbackenhances efficacy of motor imagery-based training in poststroke vic-tims: a pilot study,” Stroke 44, 1091–1098 (2013).
9. K. Sagara, K. Kido, and K. Ozawa, “Portable single-channel NRS-based BMI system for motor disabilities’ communication tools,” inAnnual Int. Conf. of the IEEE on Engineering in Medicine andBiology Society (EMBC 2009), pp. 602–605 (2009).
10. M. Haida et al., “Brain function of an ALS patient in complete locked-instate by using optical topography,” in The Frontier of Mind-BrainScience and its Practical Applications II, H. Koizumi, Ed., pp. 95–97,Hitachi Ltd., Tokyo (2000).
11. N. Kuboyama et al., “Relationship between cerebral activity and move-ment frequency of maximal finger tapping,” J. Physiol. Anthropol. Appl.Hum. Sci. 24, 201–208 (2005).
12. Y. Hoshi et al., “Relationship between fluctuations in the cerebral hemo-globin oxygenation state and neuronal activity under resting conditionsin man,” Neurosci. Lett. 245, 147–150 (1998).
13. V. Toronov et al., “Near-infrared study of fluctuations in cerebral hemo-dynamics during rest and motor stimulation: temporal analysis andspatial mapping,” Med. Phys. 27, 801–815 (2000).
14. T. J. Huppert et al., “Homer: a review of time-series analysis methodsfor near-infrared spectroscopy of the brain,” Appl. Opt. 48, D280–D298(2009).
15. T. J. Huppert, “HomER: a review of time-series analysis methods fornear-infrared spectroscopy of the brain,” Appl. Opt. 48(10), D280–D298 (2009).
16. S. Brigadoi et al., “Motion artifacts in functional near-infrared spectros-copy: a comparison of motion correction techniques applied to realcognitive data,” Neuroimage 85, 181–191 (2014).
17. B. Molavi and G. A. Dumont, “Wavelet-based motion artifact removalfor functional near-infrared spectroscopy,” Physiol. Meas. 33, 259–270(2012).
Neurophotonics 025006-8 Apr–Jun 2016 • Vol. 3(2)
Kashou et al.: Hand-grasping and finger tapping induced similar functional near-infrared spectroscopy cortical responses
Downloaded From: https://www.spiedigitallibrary.org/journals/Neurophotonics on 01 Aug 2019Terms of Use: https://www.spiedigitallibrary.org/terms-of-use
18. R. J. Cooper et al., “A systematic comparison of motion artifactcorrection techniques for functional near-infrared spectroscopy,”Front. Neurosci. 6, 147 (2012).
19. A. Duncan et al., “Optical pathlength measurements on adult head,calf and forearm and the head of the newborn infant usingphase resolved optical spectroscopy,” Phys. Med. Biol. 40, 295–304(1995).
20. H. Zhao et al., “Maps of optical differential pathlength factor of humanadult forehead, somatosensory motor and occipital regions at multi-wavelengths in NIR,” Phys. Med. Biol. 47(12), 2075 (2002).
21. P. Wobst et al., “Linear aspects of changes in deoxygenated hemoglobinconcentration and cytochrome oxidase oxidation during brain activa-tion,” NeuroImage 13, 520–530 (2001).
22. M. A. Franceschini et al., “On-line optical imaging of the human brainwith 160-ms temporal resolution,” Opt. Express 6, 49–57 (2000).
23. M. Wolf et al., “Comparison of three methods to measure absolutecerebral hemoglobin concentration in neonates by near-infrared spectro-photometry,” J. Biomed. Opt. 7, 221–227 (2002).
24. W. N. Colier et al., “Human motor-cortex oxygenation changes inducedby cyclic coupled movements of hand and foot,” Exp. Brain Res. 129,457–461 (1999).
25. C. Hirth et al., “Towards brain mapping combining near-infraredspectroscopy and high resolution 3D MRI,” Adv. Exp. Med. Biol.413, 139–147 (1997).
26. H. Obrig and A. Villringer, “Near-infrared spectroscopy in functionalactivation studies. Can NIRS demonstrate cortical activation?” Adv.Exp. Med. Biol. 413, 113–127 (1997).
27. J. Steinbrink et al., “Illuminating the BOLD signal: combined fMRI-fNIRS studies,” Magn. Reson. Imaging 24, 495–505 (2006).
28. G. Jasdzewski et al., “Differences in the hemodynamic response toevent-related motor and visual paradigms as measured by near-infraredspectroscopy,” NeuroImage 20, 479–488 (2003).
29. A. W. Subudhi et al., “Frontal and motor cortex oxygenation duringmaximal exercise in normoxia and hypoxia,” J. Appl. Physiol. 106,1153–1158 (2009).
30. T. Ikegami and G. Taga, “Decrease in cortical activation during learningof a multi-joint discrete motor task,” Exp. Brain Res. 191, 221–236(2008).
31. M. Hatakenaka et al., “Frontal regions involved in learning of motorskill-a functional NIRS study,” NeuroImage 34, 109–116 (2007).
32. M. Morihiro, T. Tsubone, and Y. Wada, “Relation between NIRS signaland motor capability,” in Annual Int. Conf. of the IEEE on Engineeringin Medicine and Biology Society (EMBC 2009), pp. 3991–3994, IEEE(2009).
33. T. Akiyama et al., “TMS orientation for NIRS-functional motor map-ping,” Brain Topogr. 19, 1–9 (2006).
34. T. J. Huppert et al., “A temporal comparison of BOLD, ASL, andNIRS hemodynamic responses to motor stimuli in adult humans,”NeuroImage 29, 368–382 (2006).
35. L. Gagnon et al., “Short separation channel location impacts the perfor-mance of short channel regression in NIRS,” NeuroImage 59, 2518–2528 (2012).
36. I. Tachtsidis et al., “Investigation of cerebral haemodynamics by near-infrared spectroscopy in young healthy volunteers reveals posture-dependent spontaneous oscillations,” Phys. Meas. 25, 437–445 (2004).
Nasser H. Kashou is an assistant professor at the Wright StateUniversity and IEEE Senior Member. He attained his PhD in 2008from The Ohio State University's Biomedical EngineeringDepartment. His education also includes Master's of Science in elec-trical engineering, 2004. He is currently running the Image AnalysisLab (IAL) at Wright State University (WSU). He has also establishedand runs the fNIRS Lab.
Brenna M. Giacherio received her Master of Arts degree in physicsfrom Western Michigan University (WMU) in 2010 and a Master ofScience in biomedical engineering from WSU in 2014. She workedas a research associate and senior member of the IAL and fNIRSLab. Her expertise includes biomedical signal processing, medical im-aging, image processing, probability and statistics, and experimentaldesign and analysis.
Ramzi W. Nahhas is highly active in collaborative projects, utilizingmodern statistical methods to analyze data from a wide range of bio-medical research areas. These disciplines include childhood growthand development, obesity, cardiometabolic risk across the lifespan,illicit drug use, and psychiatry. His primary methodological area ofexpertise is the analysis of longitudinal data, in particular, linearand nonlinear mixed models.
Sudarshan R. Jadcherla is a professor of pediatrics at the Ohio StateUniversity College of Medicine and Public Health. He is also the prin-cipal investigator and director of the Neonatal and Infant FeedingDisorders Research Program at the Nationwide Children’s HospitalResearch Institute. He is well published in the field of developmentalGI motility, dysphagia, and aero-digestive health in infants and hascontributed to the development of innovative feeding strategies inhigh-risk infants.
Neurophotonics 025006-9 Apr–Jun 2016 • Vol. 3(2)
Kashou et al.: Hand-grasping and finger tapping induced similar functional near-infrared spectroscopy cortical responses
Downloaded From: https://www.spiedigitallibrary.org/journals/Neurophotonics on 01 Aug 2019Terms of Use: https://www.spiedigitallibrary.org/terms-of-use