Handbook (part 1) - 1 - Industrial Power, Application Engineering Edition 6, February 2012 Copyright – All Rights Reserved Handbook for Stationary Lead-Acid Batteries Part 1: Basics, Design, Operation Modes and Applications
Transcript
Handbook (part 1) - 1 - Industrial Power, Application Engineering Edition 6, February 2012 Copyright – All Rights Reserved
Handbook for Stationary Lead-Acid Batteries
Part 1: Basics, Design, Operation Modes and Applications
Handbook (part 1) - 2 - Industrial Power, Application Engineering Edition 6, February 2012 Copyright – All Rights Reserved
Content 1. Function of Lead-Acid Batteries.............................................................. 5
1.1 Chemical Reactions ........................................................................... 5 1.2 Nominal Voltage UN............................................................................ 6 1.3 Active Materials.................................................................................. 6
1.3.1 Lead Oxide Production ................................................................. 6 1.3.2 Positive Active Material (PbO2)..................................................... 6 1.3.3 Negative Active Material (Pb) ....................................................... 7 1.3.4 Formation ..................................................................................... 7 1.3.5 Characteristics of Positive and Negative Active Material .............. 8
1.4 Forming of Lead Sulfate................................................................... 11 1.4.1 Lead Sulfate in Discharged Condition......................................... 11 1.4.2 Forming of Lead Sulfate Dendrites ............................................. 11
1.5 Gassing and Recombination ............................................................ 13 1.5.1 Gassing of Vented Batteries ....................................................... 13 1.5.2 Gas Levelling Volume of Vented Batteries.................................. 14 1.5.3 Recombination of Valve Regulated Batteries.............................. 14
2. Design and Materials............................................................................ 27 2.1 General Definitions........................................................................... 27 2.2 Plate Design and Alloys ................................................................... 28
2.2.1 Positive Plates............................................................................ 28 2.2.2 End of Service Life by Corrosion ................................................ 31 2.2.3 Negative Plates .......................................................................... 33
Handbook (part 1) - 3 - Industrial Power, Application Engineering Edition 6, February 2012 Copyright – All Rights Reserved
2.4.3 Fixed (Starved) Electrolyte ......................................................... 37 2.5 Cell and Block Housings (Container and Lid) ................................... 38
2.5.1 Cell and Block Housings of Vented Batteries.............................. 38 2.5.2 Cell and Block Housings of Valve Regulated Batteries ............... 39
2.6 Post Design and Sealing.................................................................. 42 2.6.1 GroE, OCSM, OPzS-Block, A600-Block (OPzV-Block), Energy Bloc ..................................................................................................... 42
2.6.2 OPzS (≤ 3000 Ah), OGi, A700 (≤ 42 Ah), A600 (OPzV).............. 43 2.6.3 Marathon, Sprinter, A700 (≥ 63 Ah) ............................................ 44 2.6.4 A400 and A500........................................................................... 46 2.6.5 Number of Post Pairs ................................................................. 47
2.7 Vent Caps and Valves...................................................................... 47 2.7.1 Vent Caps for Vented Batteries .................................................. 47 2.7.2 Valves for Valve Regulated Batteries.......................................... 50
2.8 Connectors and Connectings ........................................................... 54 2.8.1 Flexible Connectors.................................................................... 54 2.8.2 Rigid Connectors ........................................................................ 54 2.8.3 Voltage Drop by Connectors....................................................... 54 2.8.4 Current Limit of Battery Connectors............................................ 55 2.8.5 Connector Cross Sections .......................................................... 56 2.8.6 Temperature Increase During Discharge and Charging.............. 56 2.8.7 Inherently Short-Circuit-Proof Installation ................................... 57 2.8.8 Voltage Endurance of Cables ..................................................... 58
6.1.1 Fixed Network Communication ................................................... 82 6.1.2 Mobile Telephony Network Communication................................ 82
6.2 Uninterruptible Power Supply (UPS) ................................................ 83 6.3 Energy Generation and Distribution ................................................. 87
6.3.1 Energy Generation ..................................................................... 87 6.3.2 Energy Distribution ..................................................................... 87
6.4 Safety Systems ................................................................................ 87 6.4.1 Alarm and Fire Alarm Systems ................................................... 87 6.4.2 Safety Lightning.......................................................................... 88
6.5 Railway Systems.............................................................................. 92 6.5.1 Signal Towers and Signal Installations ....................................... 92 6.5.2 Rail Crossings ............................................................................ 92 6.5.3 Rail Communication (GSM-R) .................................................... 92 6.5.4 Trains ......................................................................................... 93
6.6 Photovoltaic (Solar).......................................................................... 93 6.7 Medical Application .......................................................................... 94
Handbook (part 1) - 5 - Industrial Power, Application Engineering Edition 6, February 2012 Copyright – All Rights Reserved
1. Function of Lead-Acid Batteries 1.1 Chemical Reactions The compounds involved in the reactions are:
• Positive plate: PbO2 (lead dioxide)
• Negative plate: Pb (lead)
• Electrolyte: H2SO4 (diluted sulfuric acid) The following chemical equation shows the total chemical reaction for the discharging and the charging by mentioning the amount of mass per Ampere hour (Ah): (1) Pb + PbO2 + 2 H2SO4 2 PbSO4 + 2 H2O 3.865 g 4.462 g 3.659 g 11.315 g 0.672 g During the discharge (reaction from left to the right) lead (Pb) as the active material of the negative electrode and lead dioxide (PbO2) as active material of the positive electrode is transformed to lead sulfate (PbSO4). The sulfuric acid (H2SO4) is participating in the reaction and is necessary as negative sulfate ions (SO4
2-) and positive charged hydrogen ions (2 H+) to create the lead sulfate and water. During charging (reaction from the right to the left) these processes are running in vice versa direction. The fact, that the electrolyte of the lead accumulator is involved in this reaction, shows a specialty of the accumulator type. At all other electro-chemical storage elements the electrolyte plays a passive role, which means it leads the ions, which are necessary for the chemical reaction, but is not involved in the reactions of the electrodes. As above mentioned equatation (1) shows both electrodes in discharged conditions are mainly consisting of the lead sulfate. The fact that, from the chemical point of view, both plates contain the same material (PbSO4) is a specialty of this type of accumulator.
Handbook (part 1) - 6 - Industrial Power, Application Engineering Edition 6, February 2012 Copyright – All Rights Reserved
1.2 Nominal Voltage UN The nominal voltage of a cell is a suitable, approached value of the voltage to name or identify an electro-chemical system of a cell or of a battery [1]. The voltage per cell is defined as: • 2.0 V for the lead-acid accumulator • 1.2 V for the nickel-cadmium-accumulator The nominal voltage of a battery is the product of the number of the cells connected in series and the nominal voltage of a cell. 1.3 Active Materials 1.3.1 Lead Oxide Production The production of lead oxide is carried out in general in two different processes. For both processes pure lead with a lead content of > 99.9 % is used. In the so called milling process either small die-cast lead pellets, lead ingots cut in slices or complete lead ingots are ground in mills to lead oxide. The lead surface is oxidized in an air flow and refreshed by friction of lead particles against each other. In the so called Barton-Process the pure lead is melted and sprayed in an air flow, so that fine particles with a lead oxide layer are originated. 1.3.2 Positive Active Material (PbO2) These are produced with the exception of Planté-plates from lead oxide. 1.3.2.1 Positive Active Material for Planté Plates The active material is formed by conversion of the pure lead surface in a perchlorate electrolyte to negative active material in a first step (grey formations). Afterwards the active material is converted reverse in a so called “brown formation” to positive active material PbO2 (see 2.1.1.1).
Handbook (part 1) - 7 - Industrial Power, Application Engineering Edition 6, February 2012 Copyright – All Rights Reserved
1.3.2.2 Positive Active Material for Grid Plates The positive active material for grid plates is produced by using lead oxide, sulfuric acid, water and other additives, so that a mixture of a lead sulfate paste is formed. This paste is then being pasted into the positive grids (see 2.1.1.3). 1.3.2.3 Positive Active Material for Tubular Plates
Here either the lead oxide (PbO + Pb) is directly mixed with red lead (Pb3O4) or under addition of sulfuric acid a lead sulfate slurry paste is created.
At the so-called dry filling process the lead oxide is filled by vibration into the tubes of the positive plate (see 2.1.1.2). For the wet filling process a lead sulfate slurry or paste is produced by using lead oxide and sulfuric acid which is filled in the tubes of the positive plate. Finally the tubes are sealed with a plastic bottom bar. 1.3.3 Negative Active Material (Pb) The production of active material for negative grid plates is similar to the production of active material for positive grid plates (see 1.3.2.2). Basis is also lead oxide (see 1.3.1). Expanders and other additives are added to the negative material. The expanders, e.g. wood powder (Lignin), provide the porous structure in the application. Additives are e.g. lampblack, which improves the conductivity of the negative active material during discharge. 1.3.4 Formation The pasted grid plates and the filled tubular plates need to be formed (charged). This is achieved either in large acid filled formation tanks, in which the positive plates are fitted together with the negative plates, electrically connected and charged – the so-called tank formation. Or, the positive unformed plates will be fitted together with the negative plates in the cell or block containers, filled with sulfuric acid and charged – the so called container formation.
Handbook (part 1) - 8 - Industrial Power, Application Engineering Edition 6, February 2012 Copyright – All Rights Reserved
1.3.5 Characteristics of Positive and Negative Active Material
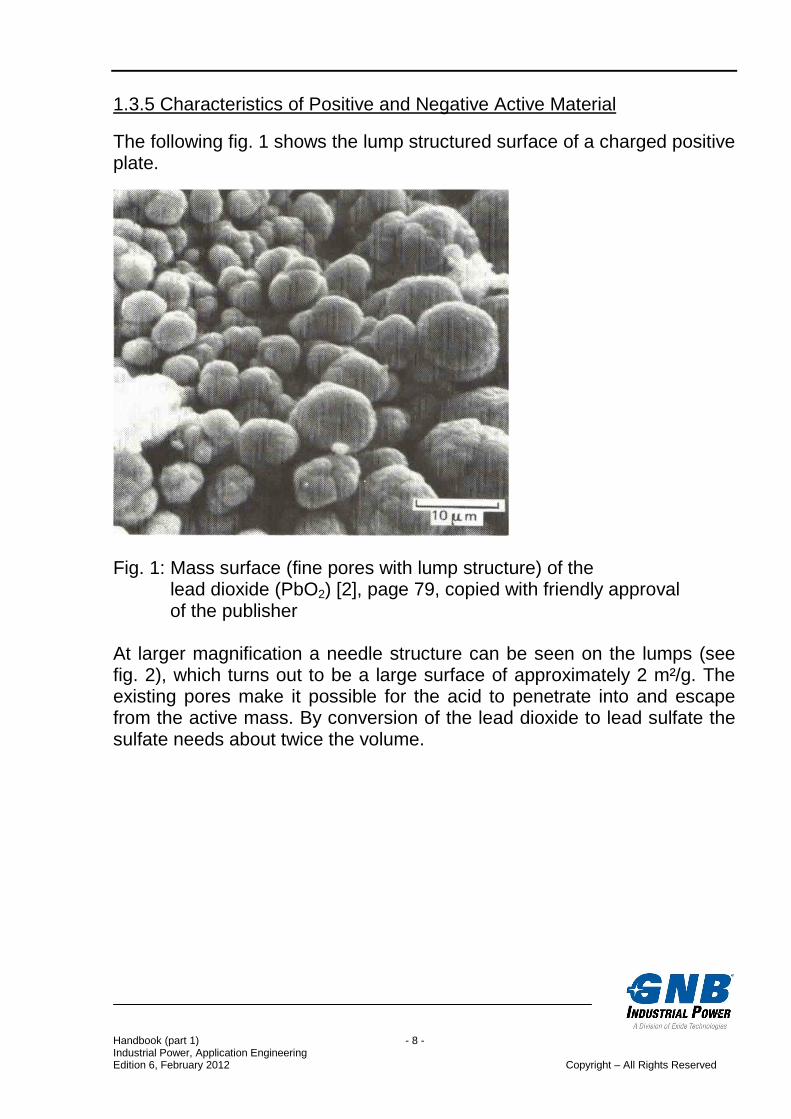
The following fig. 1 shows the lump structured surface of a charged positive plate.
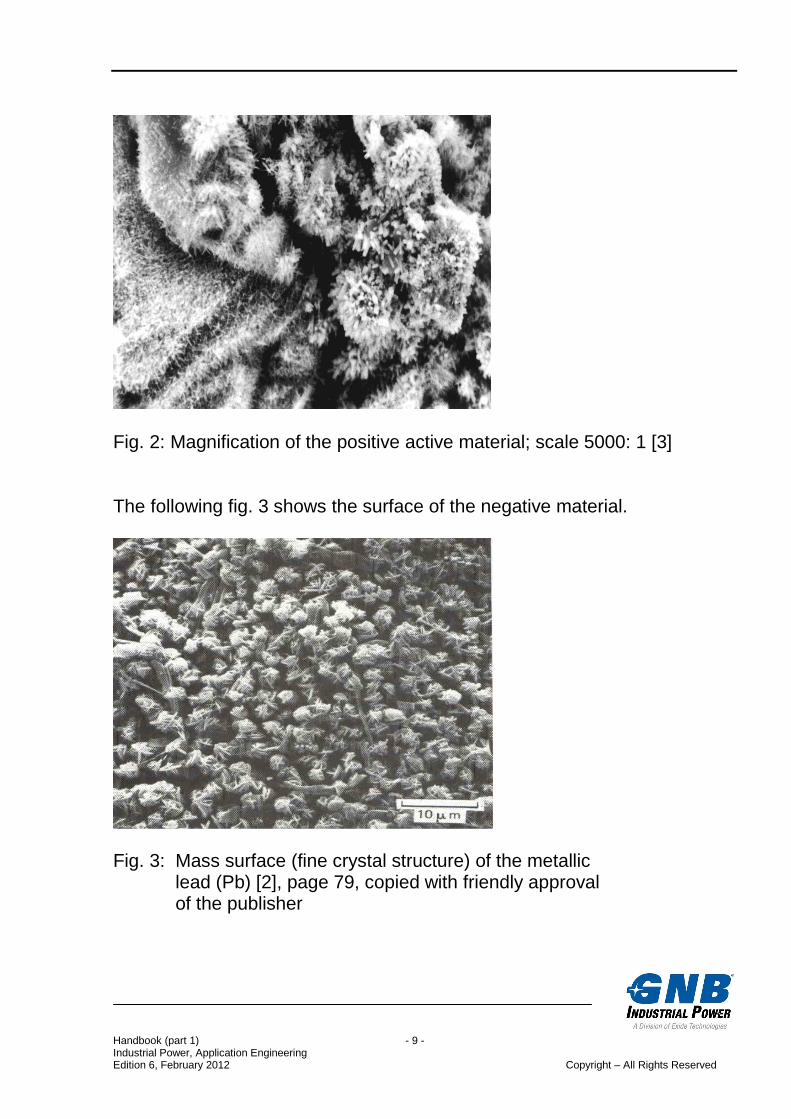
Fig. 1: Mass surface (fine pores with lump structure) of the lead dioxide (PbO2) [2], page 79, copied with friendly approval of the publisher At larger magnification a needle structure can be seen on the lumps (see fig. 2), which turns out to be a large surface of approximately 2 m²/g. The existing pores make it possible for the acid to penetrate into and escape from the active mass. By conversion of the lead dioxide to lead sulfate the sulfate needs about twice the volume.
Handbook (part 1) - 9 - Industrial Power, Application Engineering Edition 6, February 2012 Copyright – All Rights Reserved
Fig. 2: Magnification of the positive active material; scale 5000: 1 [3] The following fig. 3 shows the surface of the negative material.
Fig. 3: Mass surface (fine crystal structure) of the metallic lead (Pb) [2], page 79, copied with friendly approval of the publisher
Handbook (part 1) - 10 - Industrial Power, Application Engineering Edition 6, February 2012 Copyright – All Rights Reserved
In fig. 4 it can be seen the fine ramification of the negative mass, which turns out to be a large surface with approximately 0.5 m²/g. The spaces between them ease the acid transport and are needed especially at the 2.7-times volume change from lead to lead sulfate.
Fig. 4: Fresh negative active material, magnification 2000: 1 [3]
Handbook (part 1) - 11 - Industrial Power, Application Engineering Edition 6, February 2012 Copyright – All Rights Reserved
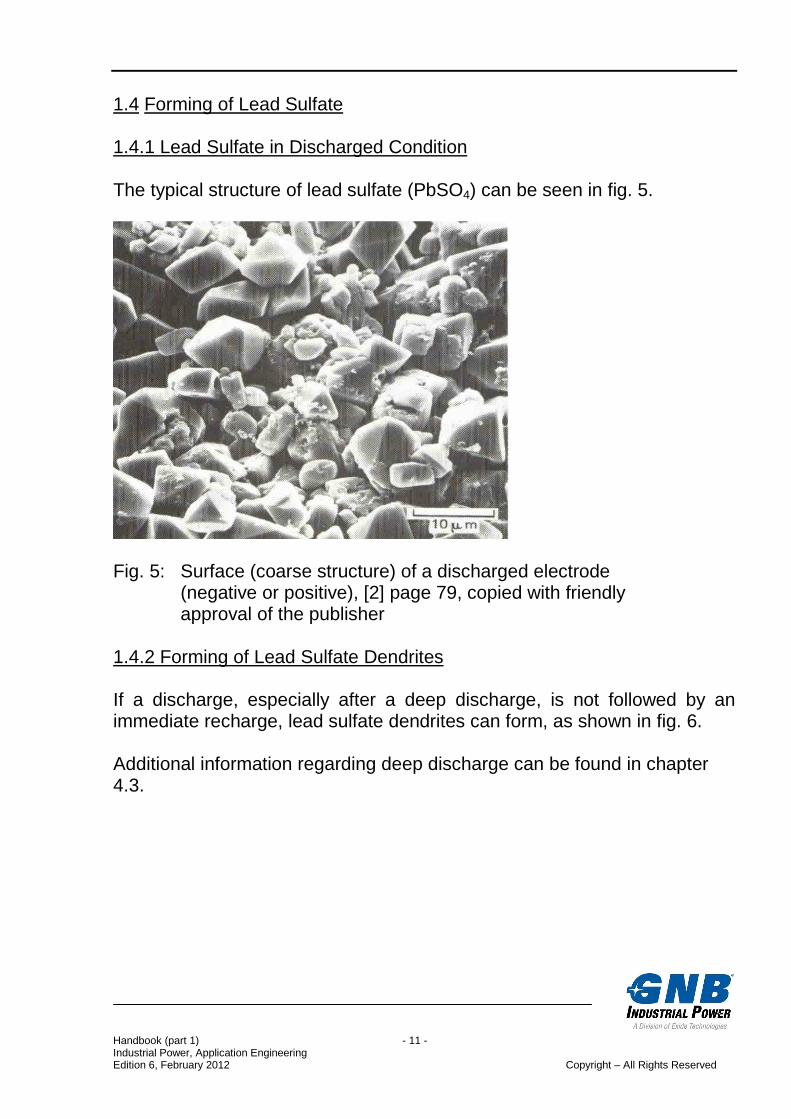
1.4 Forming of Lead Sulfate 1.4.1 Lead Sulfate in Discharged Condition The typical structure of lead sulfate (PbSO4) can be seen in fig. 5.
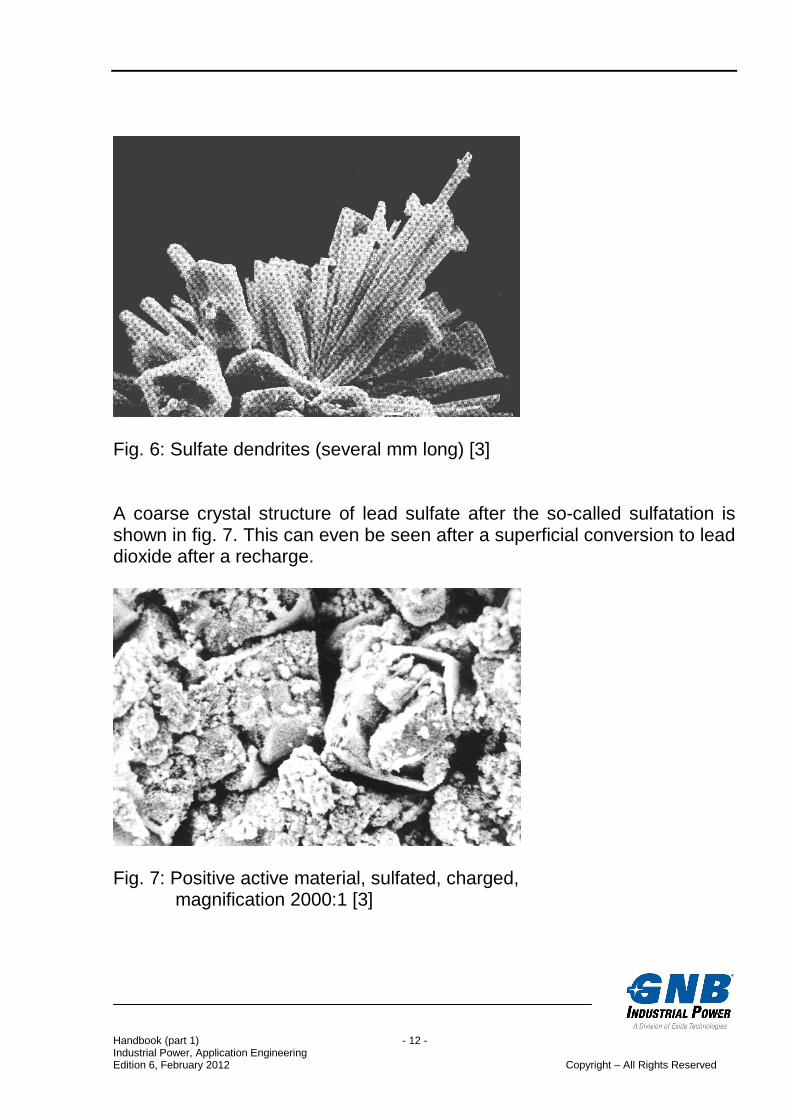
Fig. 5: Surface (coarse structure) of a discharged electrode (negative or positive), [2] page 79, copied with friendly approval of the publisher 1.4.2 Forming of Lead Sulfate Dendrites If a discharge, especially after a deep discharge, is not followed by an immediate recharge, lead sulfate dendrites can form, as shown in fig. 6. Additional information regarding deep discharge can be found in chapter 4.3.
Handbook (part 1) - 12 - Industrial Power, Application Engineering Edition 6, February 2012 Copyright – All Rights Reserved
Fig. 6: Sulfate dendrites (several mm long) [3] A coarse crystal structure of lead sulfate after the so-called sulfatation is shown in fig. 7. This can even be seen after a superficial conversion to lead dioxide after a recharge.
Fig. 7: Positive active material, sulfated, charged, magnification 2000:1 [3]
Handbook (part 1) - 13 - Industrial Power, Application Engineering Edition 6, February 2012 Copyright – All Rights Reserved
1.5 Gassing and Recombination 1.5.1 Gassing of Vented Batteries A feature of vented lead-acid batteries is the water loss. By electrolysis, oxygen O2 is formed at the positive electrode and hydrogen H2 on the negative electrode in a stoichiometrical relation of 1 : 2. Both, oxygen and hydrogen, escape as gas bubbles through the degassing vents because of the low solubility of both gases in the electrolyte. In addition to chapter 1.1 the single plate reactions ((2) and (4)) are mentioned below, as well as the necessary parasitical reactions ((3), (5) and (6)) of the water decomposition are shown. The equations of the electrode reactions: Positive Electrode: (2) PbO2 +H2SO4 +2 H+ + 2e- PbSO4 + 2 H2O (3) H2O ½ O2 + 2 H+ + 2 e- Negative Electrode: (4) Pb + H2SO4 PbSO4 + 2H+ + 2e- (5) 2H+ + 2e- H2 This means, in total, water is being decomposed by the reaction (6) 2 H2O O2 + 2 H2 This water loss is compensated by refilling of water in vented batteries. The water loss because of water decomposition depends on the charging mode, the design of cells, the used grid alloy and the purity of materials, especially these of pure lead and electrolyte.
By use of alloys with low antimony content (< 3%) the topping-up intervals of vented stationary batteries are nowadays in the range of 3 to 5 years, depending on the electrolyte reserve between minimum and maximum marking.
Handbook (part 1) - 14 - Industrial Power, Application Engineering Edition 6, February 2012 Copyright – All Rights Reserved
1.5.2 Gas Levelling Volume of Vented Batteries The gassing volume of vented batteries results from the residual charge current (see 5.4) which flows through the battery. 1 Ah charged current volume decomposes 0.336 g water (H2O) into 0.45 l hydrogen (H2) and 0.22 l oxygen (O2). Both result in an oxyhydrogen gas mixture of 0.67 liter at 20° C and 1013 hPa. 1.5.3 Recombination of Valve Regulated Batteries A special feature of valve regulated lead-acid (VRLA) batteries is the recombination of oxygen during charging. During charging the continuous running circulation starts at the positive electrode: (7) H2O ½ O2 + 2H+ + 2 e- Water (H2O) is decomposed and gaseous oxygen (O2) is formed. The hydrogen ions (H+) remain solved in the electrolyte and will not be released as gas. The electrons (2 e-) flow via the exterior electrical circuit to the negative electrode. In opposite to a vented system the oxygen does not escape from a cell in a valve regulated system. The cells are closed by a valve. The oxygen diffuses to the negative plate, where it is converted by lead to lead oxide (PbO): (8) Pb + ½ O2 PbO The oxygen transfer in VRLA-batteries takes place through a solid porous medium by cracks, the gel (see 2.4.3.1) or free pores of the fleece material (see 2.4.3.2). In vented lead-acid batteries with “free” (liquid) electrolyte, which means not starved electrolyte, it is nearly impossible that the oxygen migrates to the negative electrode because of the low solubility. It rises
Handbook (part 1) - 15 - Industrial Power, Application Engineering Edition 6, February 2012 Copyright – All Rights Reserved
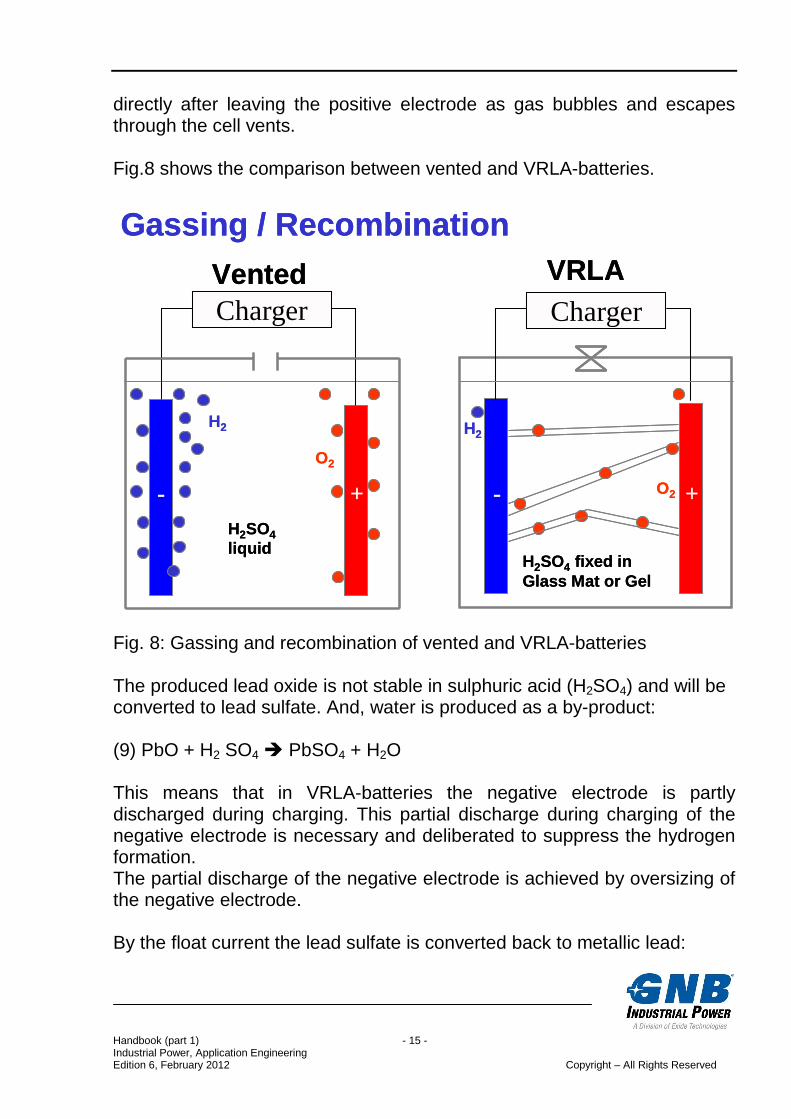
directly after leaving the positive electrode as gas bubbles and escapes through the cell vents. Fig.8 shows the comparison between vented and VRLA-batteries.
- +
Charger
H2
H2SO4liquid
O2
H2SO4 fixed inGlass Mat or Gel
H2
O2
Gassing / Recombination
+-
Vented VRLACharger
- +
Charger
H2
H2SO4liquid
O2
H2SO4 fixed inGlass Mat or Gel
H2
O2
Gassing / Recombination
+-
Vented VRLACharger
Fig. 8: Gassing and recombination of vented and VRLA-batteries The produced lead oxide is not stable in sulphuric acid (H2SO4) and will be converted to lead sulfate. And, water is produced as a by-product: (9) PbO + H2 SO4 PbSO4 + H2O This means that in VRLA-batteries the negative electrode is partly discharged during charging. This partial discharge during charging of the negative electrode is necessary and deliberated to suppress the hydrogen formation. The partial discharge of the negative electrode is achieved by oversizing of the negative electrode. By the float current the lead sulfate is converted back to metallic lead:
Handbook (part 1) - 16 - Industrial Power, Application Engineering Edition 6, February 2012 Copyright – All Rights Reserved
(10) PbSO4 + 2 H+ + 2 e- Pb + H2SO4 From energetic point of view the reactions of the equations (7) till (10) are preferred, compared to the formation of hydrogen at the negative electrode, so that by recombination the formation of the hydrogen is suppressed. The process of recombination is exothermic, so that VRLA-batteries hold a certain risk of „Thermal Runaway“ (see 1.7). The effectiveness of recombination of VRLA-batteries is typically 98% for Gel-batteries and 99% for AGM-batteries. The remaining 1 – 2 % oxygen can lead to the formation of hydrogen at the negative plate. If a defined opening pressure (see 2.6.2) is reached, the valve opens for a short time and the collected gas can escape. By the use of antimony-free alloys for VRLA-batteries the water loss can be decreased by 75% in comparison to vented batteries. By the recombination the water loss can be decreased to 98 till 99%, so that less than 2% of water loss can be achieved by a valve regulated system. This is the reason why water refilling is not necessary during the complete service life of a VRLA-battery. This enables a “sealed” (in fact, valve regulated) design for lead-acid batteries.
Handbook (part 1) - 17 - Industrial Power, Application Engineering Edition 6, February 2012 Copyright – All Rights Reserved
1.6 Heat Effects 1.6.1 General The chapter “heat effects” was arised from repeated inquiries by battery users. It shall demonstrate the difficulty to transfer results of theoretically based calculations to the practice. Thus, because one cannot take into consideration all influences, in particular, the heat removal (heat exchange to the environment). There is also the complicating fact of battery design diversity. Experience shows that taking into consideration of heat effects from a critical point of view is not necessary as long as the usage of the battery is ensured in accordance with the regulations. This is concerning the installation and operating instructions and common safety norms, in particular, the EN 50272-2 [6]. During the operation of batteries (discharging as well as charging) a not negligible heat transformation takes place beside the electrical energy transposition and the mass transformation of the chemical reaction. Following the heat effects as energy in Watt per cell: - Heating by the Joule-Thomson effect (ohmic losses) QJoule - Heat transformation of the chemical reversible reactions Qchem
- Heat transformation by water decomposition QGassing - Heating by recombination (oxygen circulation) QRecom The total amount of heat Qtotal depends on: - Battery type (for example OPzS, OPzV, OGi, OGiV), - Technology, i.e. VRLA (Gel, AGM) or vented, - Amount of current and current density during charging respectively discharging, - Charging method. This can lead to a considerable heating-up and in special cases as well as to a cooling down of the battery.
Handbook (part 1) - 18 - Industrial Power, Application Engineering Edition 6, February 2012 Copyright – All Rights Reserved
1.6.2 Heat Capacity To calculate the temperature increase during discharging or charging of batteries it is necessary to know the heating capacity (CP) of the batteries (cells/blocks). Unfortunately, there are few measurements of heat capacities of lead-acid batteries and few bibliographical references available only. The heat capacity of Gel-batteries (12V 100 Ah) was determined. Basing on this measurement the specific heat capacities for vented and VRLA-batteries (VRLA = Valve Regulated Lead-Acid) were calculated. This resulted in following values for the three technologies:
Vented: CP = 1.1 Ws/ (g • K) = 0.3 Wh / (kg • K) VRLA-Gel: CP = 0.9 Ws/ (g • K) = 0.25 Wh / (kg • K) VRLA-AGM: CP = 0.8 Ws/ (g • K) = 0.22 Wh / (kg • K) 1.6.3 Temperature Increase The temperature increase per unit (cell/block) is calculated in principle by the mass, the heat amount and the specific heat capacity by equation (11). (11) T = Qtotal / (m • CP) with
T = Temperature increase in K Qtotal = Total heat amount in Wh from (12), (13), (14) (see 1.6.4, 1.6.5) m = Mass of battery in kg CP = Specific heat capacity of the cell (or block) in Wh / (kg • K) 1.6.4 Heat Effects During Discharging The total heat amount during discharging consists of the Joule-Thomson effect QJoule and the reversible heat Qrev : (12) Qtotal = QJoule + Qrev Valid is: Joule-Thomson effect exothermic depending on current and time Reversible heat endothermicdepending on discharged capacity
Handbook (part 1) - 19 - Industrial Power, Application Engineering Edition 6, February 2012 Copyright – All Rights Reserved
During long discharges the endothermic effect of the chemical reaction (reversible heat) is larger than the exothermic Joule-Thomson effect, so that a negative heat balance occurs, which means the battery cools down. During short discharges the exothermic Joule-Thomson effect is dominating. This results in the following specific total heat amount (in Wh per cell) and for a 100 Ah-discharge for vented and VRLA-types [7]: Discharge Vented VRLA Specific total heat amount
20 h -1.5 -4 Wh/(cell • 100 Ah) 10 h 1.5 -1 Wh/(cell • 100 Ah) 5 h 4 1 Wh/(cell • 100 Ah) 1 h 10 5 Wh/(cell • 100 Ah)
30 min. 13 7 Wh/(cell • 100 Ah) 10 min. 18 Not available Wh/(cell • 100 Ah) 7 min. Not available 9 Wh/(cell • 100 Ah)
Table 1: Specific total heat amount in dependence of discharge time and
technology. Negative values indicate endothermic, i.e. heat loss.
This means a heating-up takes place for vented batteries at a discharge times smaller than 12 h and for VRLA-batteries at discharge times smaller than 6 h. The resulting total heat amount can be calculated according to the following equation (13): (13) Qtotal = Specific total heat amount • discharged capacity / 100 Example: VRLA-cell: 1 cell 7 OPzV 490, weight 42 kg. Discharge: 1 h to 1.85 V → 247 Ah. According to table 1: Specific total heat amount: 5 Wh/(cell • 100 Ah). According to equation 13: Qtotal = 5 • 1(cell) • 247 / 100 (Ah) = 12.35 Wh. Heat power: 12.35 W. According to 1.6.2: Heat capacity CP = 0.25 Wh / (kg •K). According to equation 11: Maximum temperature increase (without heat removal, see 1.6.7) T = Qtotal / (m • CP) = 12.35 Wh / (42 kg • 0.25 Wh/(kg • K)) ≈≈≈≈ 1.2 K
Handbook (part 1) - 20 - Industrial Power, Application Engineering Edition 6, February 2012 Copyright – All Rights Reserved
1.6.5 Heat Effects During Recharging In addition to the heat amount by the Joule-Thomson effect and the reversible heat amount (chemical reaction), for the calculation of the total heat amount following has to be taken in consideration:
- in vented batteries the heat by water decomposition, - in VRLA-batteries the heat occurring by recombination and in minor
degrees the heat of the water decomposition.
QJoule depends on charge current and charge voltage and is in the range of 10 to 20 Wh per 100 Ah discharge and during charging in the range of 2.25 to 2.4 Vpc. Qchem is approximately 3.5 % of the charging energy up to a charge coefficient (charge factor) 1.0, i.e. 5.3 Wh per 100 Ah discharge. QGassing is approximately 18 Wh per 100 Ah discharge at charging of vented batteries and at a charge coefficient of 1.2. QRecom is in the range of 11 to 48 Wh per 100 Ah discharge at a charging coefficient of 1.05 respect. 1.2 during charging of VRLA-batteries with a constant voltage of 2.25 to 2.40 Vpc. This results in exemplary specific total heat amounts per 100 Ah discharge in accordance with table 2.
VRLA Vented
Typical for Float Gel Float AGM
Boost Gel, AGM Float Boost
Charge voltage 2.25, 2.27 2.27 2.4 2.23 2.4 Vpc
Charge coefficient 1.05 1.1 1.2 1.05 1.2
Specific total heat amount
27 41 73 19 44 Wh per 100 Ah
discharge
Table 2: Exemplary specific total heat amounts during charging (Float = float charge, Boost = boost charge)
Handbook (part 1) - 21 - Industrial Power, Application Engineering Edition 6, February 2012 Copyright – All Rights Reserved
Notes regarding the above mentioned charge coefficients:
- VRLA: Don’t take into account the necessary Ah in float charge mode for mixing the electrolyte (only gassing = internal recombination) but in boost charge mode indeed.
- Vented: Gassing is negligible in float charge mode. Mixing the electrolyte is taken into account in boost charge mode.
The average heat power P is calculated as follows:
(14) P = Qtotal / charge time in h As the the following 2 examples show, the calculations can end in strongly different results, - in moderate temperature increases of about 13 K and extreme values of 44 K. Here, it shows the missing influence of heat removal not taken into consideration in all the calculations but decisively in the practice. Because, of course, the battery temperature doesn’t increase by 44 K during re-charging in the practice, but by a fraction only, if the usage of the battery is ensured in accordance with the regulations. Also the 13 K from example 1 would be reduced drastically by taking into account the heat removal. Example 1: Vented cell: 1 cell 6 OPzS 600, weight approx. 44 kg. Charging after discharge of 400 Ah. Charging with 2.4 Vpc, charge coefficient 1.2. According to table 2: Specific total heat amount: 44 Wh/100 Ah. According to equation 13: Qtotal = 44 Wh • 400 Ah/100 Ah = 176 Wh. According to equation 14: Average heat power P (without heat removal, see 1.6.7) during an 8-hour charge: 176 Wh/8 h = 22 W. Equation 11: Maximum heating-up (without heat removal, see 1.6.7): T = Qtotal / (m • CP) = 176 Wh / (44 kg • 0.3 Wh/(kg • K)) ≈≈≈≈ 13 K. Example 2: VRLA-block battery: 1 block A512/6.5S, weight approx. 2.6 kg (re-calculated to 1 cell: 0.43 kg). Charging after discharge of the nominal capacity C20 = 6.5 Ah. Charging with 2.4 Vpc, charge coefficient 1.2. According to table 2: Specific total heat amount: 73 Wh/100 Ah per cell. According to equation 13: Qtotal = 73 Wh • 6.5 Ah/100 Ah = 4.745 Wh per cell.
Handbook (part 1) - 22 - Industrial Power, Application Engineering Edition 6, February 2012 Copyright – All Rights Reserved
According to equation 14: Average heat power P (without heat removal, see 1.6.7) during an 24-hour charge: 4.745 Wh/24 h = 0.2 W. Equation 11: Maximum heating-up (without heat removal, see 1.6.7): T = Qtotal / (m • CP) = 4.745 Wh / (0.43 kg • 0.25 Wh/(kg • K)) ≈≈≈≈ 44 K. 1.6.6 Heat Effects During Float Charge Operation
The heat amounts and the related heat powers are so low during float-charge operation at room temperature that no considerable temperature increase occurs. In case of vented batteries, not the total float charge voltage will be taken into consideration. To be deducted from the float voltage:
- the part of the equilibrium cell voltage 1.23 Vpc which is due to the pursuance of the water electrolysis, and
- the part of the reaction heat, which is about 20% of the equlilibrium cell voltage, i.e. about 0.25 Vpc.
This results in 1.48 Vpc. Example 1: Vented battery. Float voltage 2.23 Vpc. Float current 60 mA per 100 Ah nominal capacity. Heat power: (2.23 – 1.48) V • 0.05 A = 0.04 W per 100 Ah nominal capacity and per cell. In case of VRLA-batteries, the calculation is much easier because taking into account of equilibrium cell voltage and reaction heat is not necessary. Therefore, the heat power is equal the product of float voltage and residual charge current directly.
Example 2: VRLA-battery. Optimal recombination. Float voltage 2.27 Vpc Residual charge current 100 mA per 100 Ah nominal capacity Heat power: 0.1 A • 2.27 V = 0.227 W per 100 Ah nominal capacity
and per cell.
Handbook (part 1) - 23 - Industrial Power, Application Engineering Edition 6, February 2012 Copyright – All Rights Reserved
These heat powers are clearly below the heat removal by convection (see 1.6.7), so that the heating-up of the battery is less than 1K. 1.6.7 Battery Temperature The battery temperature will be increased by energy input in accordance with its heat capacity. At the same time the heat will be transferred to the colder environment because of the temperature difference. The heat removal depends on the temperature difference, the battery surface and the kind of heat removal dQ /dt [7]: - irradiation maximum: 5 to 6 W m-2 • K-1 - strong convection: 3 to 4 W m-2 • K-1
- low convection: 2 to 3 W m-2 • K-1
The heat removal by connectors is not taken into consideration. Heat effects by connectors depend on the following parameters:
These effects are in principle lower than the before mentioned values dQ/dt. At heat power below this values dQ/dt no considerable heating-up or cooling down takes place as for example during float charging (see 1.6.6). At larger heat transformations the maximum temperature increase must be calculated in combination with the heat removal dQ/dt = 0 (see examples 1.6.5). The effective temperature increase can be calculated with the above mentioned values dQ/dt and the arising heat amount respectively heat power (from 1.6.4 and 1.6.5), if the design and the weight of the battery as well as the heat removal are known. But such calculations show a very elaborate way. It is pointed out again summary, that especially the temperature increases calculated in chapter 1.6.5 do not correlate with the practice. The actual heating-up of the battery will be only a fraction of the calculated values because no heat removal is taken into consideration.
Handbook (part 1) - 24 - Industrial Power, Application Engineering Edition 6, February 2012 Copyright – All Rights Reserved
1.7 Thermal Runaway Thermal Runaway: A critical condition arising during constant charging when the rate of heat production in a battery exceeds its heat dissipation capability causing a continuous temperature increase which can lead to the destruction of the battery [1]. The standard IEC 60896-21 [5] subscribes a test for this. Vented lead batteries are not affected from thermal runaways practically because of the high electrolyte volume and therefore the very good heat transfer. Similar is valid for Gel-batteries in comparison to AGM-batteries because of the fact, that Gel-batteries do have nearly the same volume of electrolyte as vented batteries, but AGM-batteries have significant less electrolyte compared to both other technologies. Compared to vented and Gel-batteries, in AGM-batteries much more heat is produced because of the very high recombination rates due to the large free volume in the separator (fleece). In addition, the heat can be derivated not so easily because of the smaller electrolyte volume as well as the lower wetting of the internal walls with electrolyte. Therefore, AGM-batteries, operated under harsh conditions (e.g. high environmental temperatures, missing or insufficient air conditioning, missing or wrong temperature compensation of the charging voltage), tend more easy to thermal runaways. In general, it can be said, that heat effects do not lead to critical situations if the installation as well as ventilation requirements are in accordance with EN 50272-2 [6]. Concerning installation of VRLA-batteries, especially the distances between cells respectively blocks of minimum 5 mm (recommended 10 mm) need to be mentioned. The operating instructions content further more the hint, that the batteries have to be installed in a manner, that between the single cells respectively blocks no environment-induced temperature differences of more than 3 K can occur.
Handbook (part 1) - 25 - Industrial Power, Application Engineering Edition 6, February 2012 Copyright – All Rights Reserved
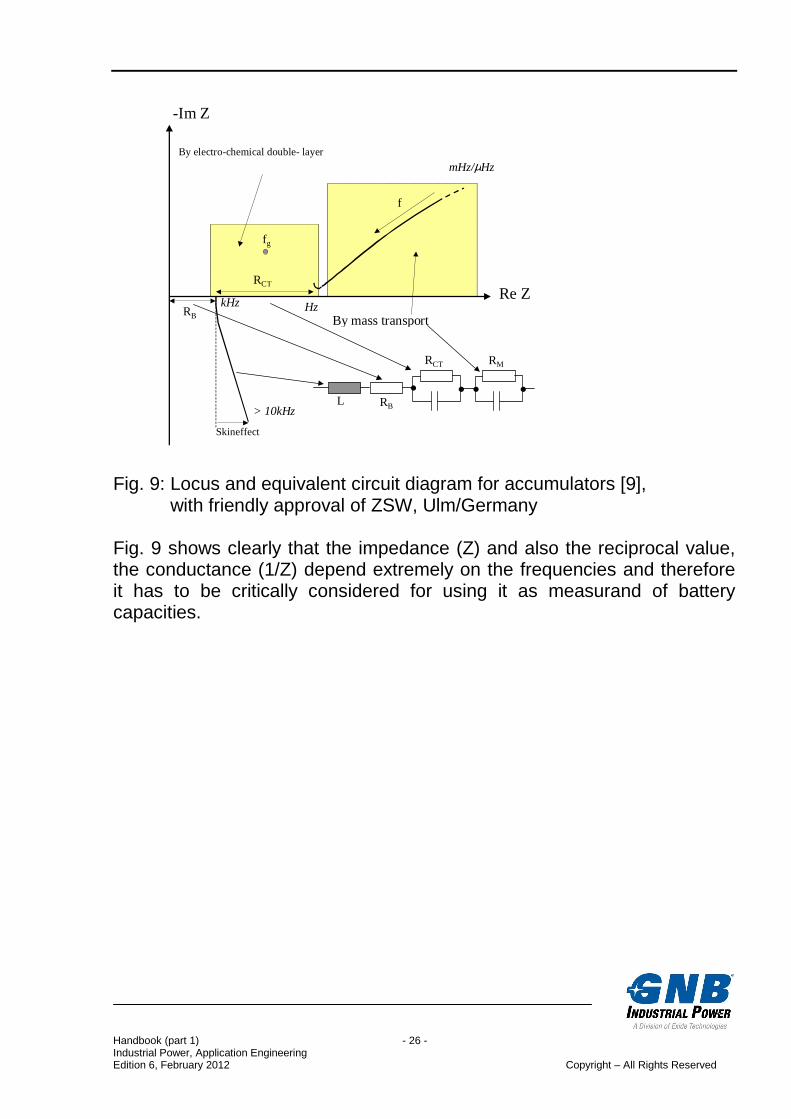
Important for the operation conditions is the compliance of the specified charging voltage including the temperature compensation. Detailed description to the subject installation, operation conditions and ventilation are included in the parts 2 of the handbooks for „Classic“-, Gel- and AGM-batteries. 1.8 Equivalent Circuit Diagram and Impedance (Conductance) Graph The following fig. 9 shows the equivalent circuit diagram of an electro-chemical energy storage and the necessary locus over a wide frequency range from µHz/mHz-range up to a frequency of > 10 kHz. This schematically appearing course of the locus is principally valid for all electro-chemical storages. In the range of µHz/mHz up to the Hz-range, electro-chemical processes are settled having relatively large time constant factors, which are reflected in the equivalent circuit diagram with the electro-chemical capacity (discharging and charging) and the leakage resistance as RM . In the range of Hz up to kHz, the double layer capacity can be found with the leakage resistance as RCT. This means that energy is provided in this range from the double layer capacitor and not from the actual charging/discharging reactions. The next range is the purely ohmic range RB, which results from the electrical conducting components of the battery. Finally the range > 10 kHz has to be mentioned which is based on the inductance (L) of the conducting components only.
Handbook (part 1) - 26 - Industrial Power, Application Engineering Edition 6, February 2012 Copyright – All Rights Reserved
RB
RCT
By electro-chemical double- layer
By mass transport
Skineffect
fg
f
mHz/µHz
> 10kHz
HzkHzRe Z
-Im Z
RB
RCT
L
RM
Fig. 9: Locus and equivalent circuit diagram for accumulators [9], with friendly approval of ZSW, Ulm/Germany Fig. 9 shows clearly that the impedance (Z) and also the reciprocal value, the conductance (1/Z) depend extremely on the frequencies and therefore it has to be critically considered for using it as measurand of battery capacities.
Handbook (part 1) - 27 - Industrial Power, Application Engineering Edition 6, February 2012 Copyright – All Rights Reserved
*): based on C10-capacity and 20 °C **): based on 20 °C and occasional discharges
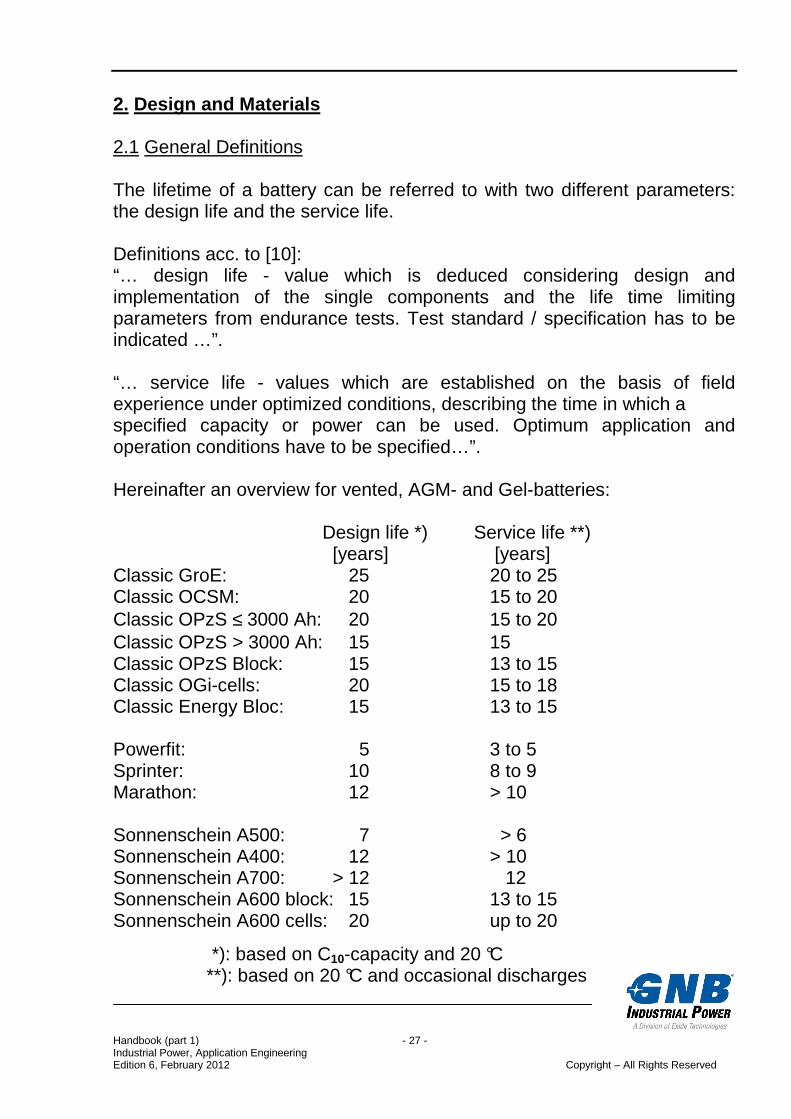
2. Design and Materials 2.1 General Definitions The lifetime of a battery can be referred to with two different parameters: the design life and the service life. Definitions acc. to [10]: “… design life - value which is deduced considering design and implementation of the single components and the life time limiting parameters from endurance tests. Test standard / specification has to be indicated …”. “… service life - values which are established on the basis of field experience under optimized conditions, describing the time in which a specified capacity or power can be used. Optimum application and operation conditions have to be specified…”. Hereinafter an overview for vented, AGM- and Gel-batteries: Design life *) Service life **) [years] [years] Classic GroE: 25 20 to 25 Classic OCSM: 20 15 to 20 Classic OPzS ≤ 3000 Ah: 20 15 to 20 Classic OPzS > 3000 Ah: 15 15 Classic OPzS Block: 15 13 to 15 Classic OGi-cells: 20 15 to 18 Classic Energy Bloc: 15 13 to 15 Powerfit: 5 3 to 5 Sprinter: 10 8 to 9 Marathon: 12 > 10 Sonnenschein A500: 7 > 6 Sonnenschein A400: 12 > 10 Sonnenschein A700: > 12 12 Sonnenschein A600 block: 15 13 to 15 Sonnenschein A600 cells: 20 up to 20
Handbook (part 1) - 28 - Industrial Power, Application Engineering Edition 6, February 2012 Copyright – All Rights Reserved
2.2 Plate Design and Alloys 2.2.1 Positive Plates 2.2.1.1 Planté Plates The positive plate of the Planté type (also GroE: abbreviation for the German description “Großoberflächenplatte Engeinbau”) is a lamellar shaped plate made of 99.995% pure lead (Pb). The pure lead provides a high corrosion resistance and an extremely long service life.
Fig. 10: Formed positive Planté plate
Handbook (part 1) - 29 - Industrial Power, Application Engineering Edition 6, February 2012 Copyright – All Rights Reserved
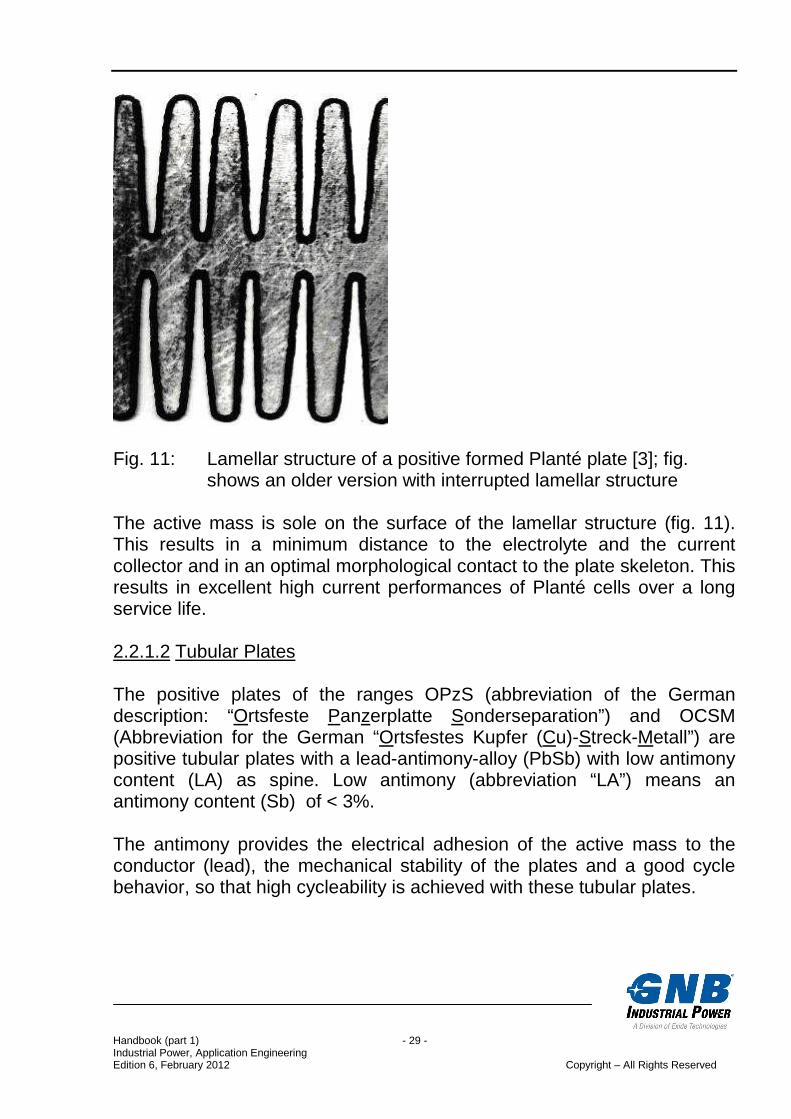
Fig. 11: Lamellar structure of a positive formed Planté plate [3]; fig.
shows an older version with interrupted lamellar structure The active mass is sole on the surface of the lamellar structure (fig. 11). This results in a minimum distance to the electrolyte and the current collector and in an optimal morphological contact to the plate skeleton. This results in excellent high current performances of Planté cells over a long service life. 2.2.1.2 Tubular Plates The positive plates of the ranges OPzS (abbreviation of the German description: “Ortsfeste Panzerplatte Sonderseparation”) and OCSM (Abbreviation for the German “Ortsfestes Kupfer (Cu)-Streck-Metall”) are positive tubular plates with a lead-antimony-alloy (PbSb) with low antimony content (LA) as spine. Low antimony (abbreviation “LA”) means an antimony content (Sb) of < 3%. The antimony provides the electrical adhesion of the active mass to the conductor (lead), the mechanical stability of the plates and a good cycle behavior, so that high cycleability is achieved with these tubular plates.
Handbook (part 1) - 30 - Industrial Power, Application Engineering Edition 6, February 2012 Copyright – All Rights Reserved
In the tubular plates of the ranges OPzV (Abbreviation of the German description “Ortsfeste Panzerplatte Verschlossen”) no antimony is used. A lead-tin-calcium-alloy (PbSnCa) is used for OPzV. Antimony would lead to an extreme water loss and would foil the concept of valve regulated lead-acid (VRLA) batteries. In this case tin (Sn) takes over the function of antimony in regard of mass adhesion and cycleability. Calcium gives stability for the grids. The addition of tin makes it possible to use Gel-batteries in cyclic applications as well. The addition of phosphoric acid (H3PO4) in “Sonnenschein Solar”-Batteries makes it possible to achieve similar numbers of cycles as vented battery ranges. The pressure die-casting of the positive grids furthermore grants for all tubular plate types a fine crystalline structure of the grid spines and therefore a good corrosion resistance. The active material is retained (armed) within the tube by the tubular plates, hence the German designation “Panzerplatte” which could be interpreted as “armour plate”. The tubular gauntlets today consist of synthetic fiber fabrics.
Fig. 12: OPzS, OCSM and OPzV; construction of a tubular plate
(Tube partly cut open for demonstration purposes, without active material)
Handbook (part 1) - 31 - Industrial Power, Application Engineering Edition 6, February 2012 Copyright – All Rights Reserved
2.2.1.3 Grid Plates Positive grid plates are produced in gravity casting process, pasted lead grids with various alloys for vented and valve regulated lead-acid (VRLA) batteries:
- Vented batteries: Lead-antimony (PbSb) with low antimony content (Sb <3%). A typical representative is the positive plate of the OGi-range (abbreviation for the German description “Ortsfeste Gitterplatte”).
- Valve regulated batteries:
Lead-tin-calcium (PbSnCa) for Gel- as well as for AGM-batteries. Typical representative is here the positive plate of the battery range OGiV (abbreviation for the German description: “Ortsfeste Gitterplatte Verschlossen”).
See 2.2.1.2 for the effect of the elements antimony, tin and calcium.
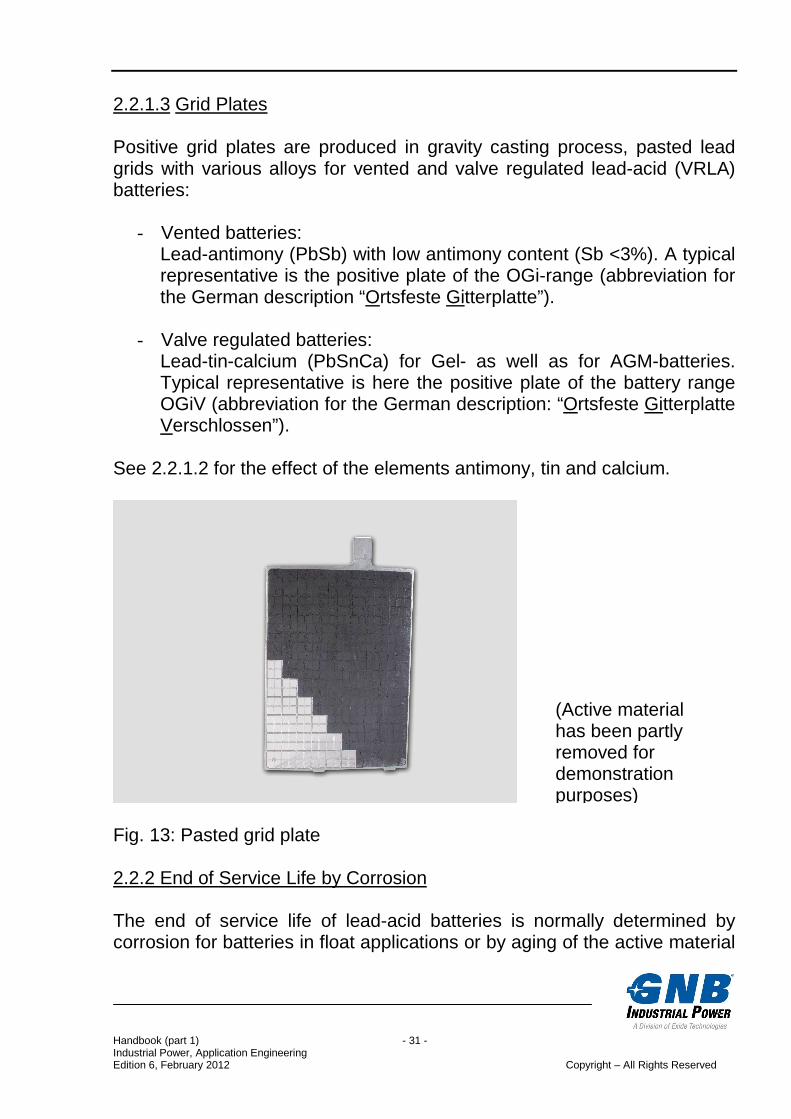
Fig. 13: Pasted grid plate 2.2.2 End of Service Life by Corrosion The end of service life of lead-acid batteries is normally determined by corrosion for batteries in float applications or by aging of the active material
(Active material has been partly removed for demonstration purposes)
Handbook (part 1) - 32 - Industrial Power, Application Engineering Edition 6, February 2012 Copyright – All Rights Reserved
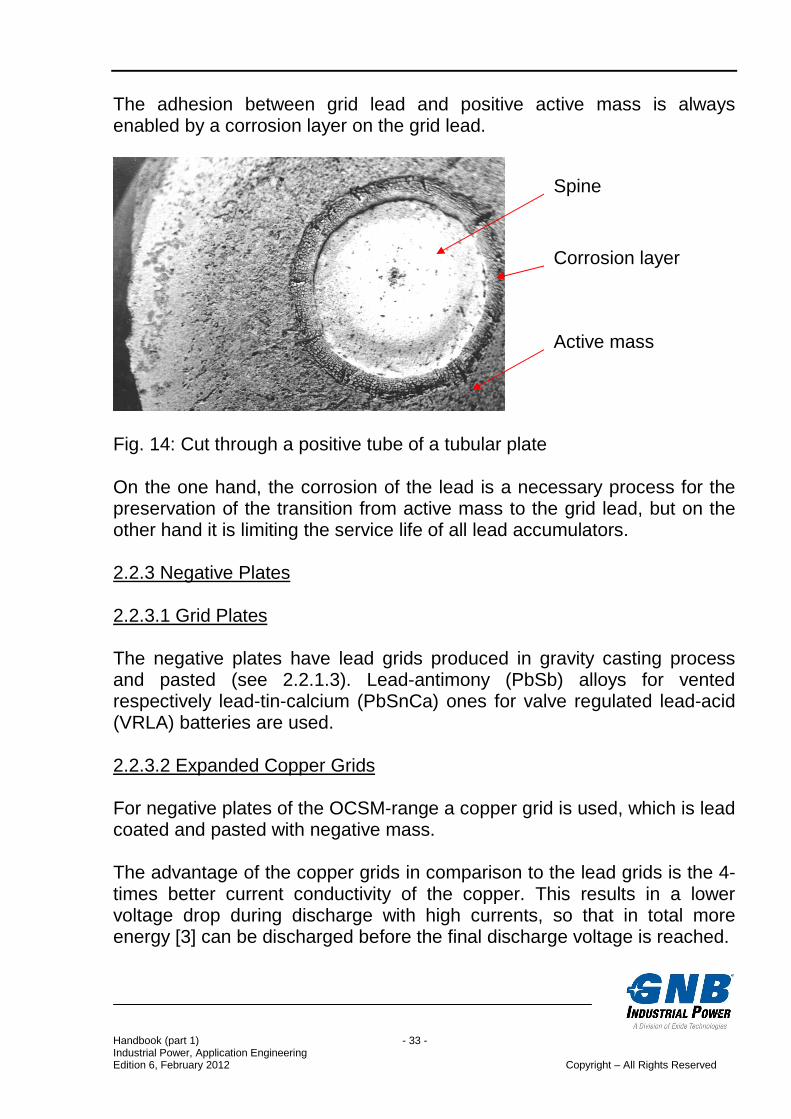
during cycling operation (see 3.4). Corrosion is the slow conversion of lead to lead dioxide. This leads at the end of the service life to the situation that the current conductor (lead) is almost no longer available. It has to be distinguish between the even layer-wise shaped corrosion and the so- called intergranular corrosion which penetrates deep at the grain boundaries into the lead. As counter-reaction to the corrosion of the positive electrode, which consumes oxygen, an equivalent amount of hydrogen is developed at the negative electrode. 2.2.2.1 Intergranular Corrosion At the intergranular corrosion a conversion from lead to lead dioxide along all grain boundaries happens, which means also to the ones directed to the inside. This corrosion leads to the growth of the positive plates because of the increase of the volume. This predictable plate growth can be compensated by the cell design of the positive tubular plates and the Planté plates. The mounting of the Planté plates on lateral shoulder in the cell container allows a growth of the plates downwards. Positive grid plates are normally destroyed so thoroughly by growth that no further destructions are possible because the grid wires do not have the mechanical force due to the degree of corrosion. The intergranular corrosion is influenced by alloy, casting procedure and design. 2.2.2.2 Layer-wise Corrosion The layer-wise corrosion is a conversion of lead to lead dioxide in the positive alloys, which takes place mainly at the outer grain boundaries of the alloy. It is not as critical as the intergranular corrosion, because it proceeds uniformly. 2.2.2.3 Mass Adhesion by Corrosion The following Fig. 14 shows a cut through a positive tube of a tubular plate (see 2.2.1.2), which shows the lead spine and the active mass with the interjacent corrosion layer, necessary for the mass adhesion.
Handbook (part 1) - 33 - Industrial Power, Application Engineering Edition 6, February 2012 Copyright – All Rights Reserved
The adhesion between grid lead and positive active mass is always enabled by a corrosion layer on the grid lead.
Fig. 14: Cut through a positive tube of a tubular plate On the one hand, the corrosion of the lead is a necessary process for the preservation of the transition from active mass to the grid lead, but on the other hand it is limiting the service life of all lead accumulators. 2.2.3 Negative Plates
2.2.3.1 Grid Plates The negative plates have lead grids produced in gravity casting process and pasted (see 2.2.1.3). Lead-antimony (PbSb) alloys for vented respectively lead-tin-calcium (PbSnCa) ones for valve regulated lead-acid (VRLA) batteries are used. 2.2.3.2 Expanded Copper Grids For negative plates of the OCSM-range a copper grid is used, which is lead coated and pasted with negative mass. The advantage of the copper grids in comparison to the lead grids is the 4-times better current conductivity of the copper. This results in a lower voltage drop during discharge with high currents, so that in total more energy [3] can be discharged before the final discharge voltage is reached.
Spine
Corrosion layer
Active mass
Handbook (part 1) - 34 - Industrial Power, Application Engineering Edition 6, February 2012 Copyright – All Rights Reserved
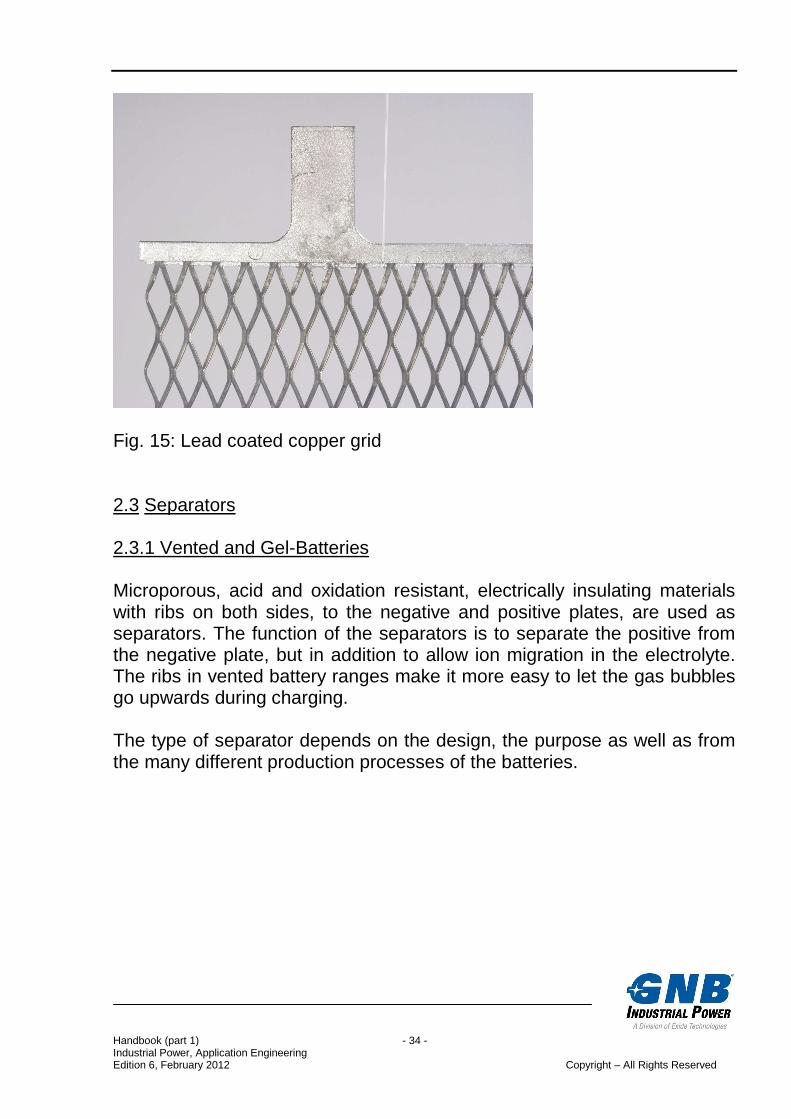
Fig. 15: Lead coated copper grid 2.3 Separators 2.3.1 Vented and Gel-Batteries Microporous, acid and oxidation resistant, electrically insulating materials with ribs on both sides, to the negative and positive plates, are used as separators. The function of the separators is to separate the positive from the negative plate, but in addition to allow ion migration in the electrolyte. The ribs in vented battery ranges make it more easy to let the gas bubbles go upwards during charging. The type of separator depends on the design, the purpose as well as from the many different production processes of the batteries.
Handbook (part 1) - 35 - Industrial Power, Application Engineering Edition 6, February 2012 Copyright – All Rights Reserved
Fig. 16: Magnification of a separator, scale 500: 1 [3]
Fig.17: Magnification of a separator, scale 2500: 1 [3] Separators can consist of • PE (Polyethylene) • Phenolic resin • PVC (Polyvinylchloride) 2.3.2 AGM-Batteries The used fleece separator works as insulator as well as electrolyte reservoir (see 2.4.3.2). Fig. 18 shows a fleece separator enlarged. It
Handbook (part 1) - 36 - Industrial Power, Application Engineering Edition 6, February 2012 Copyright – All Rights Reserved
consists of glass fibers in different thicknesses and lengths, which can be reinforced by plastic fibers.
Fib. 18: Fleece separator consisting of fibers in different thicknesses and lengths 2.4 Electrolyte 2.4.1 General The electrolyte used in lead-acid batteries is diluted sulfuric acid H2SO4. In contrary to other electro-chemical systems electrolyte of lead-acid accumulators takes part at the chemical reaction and will be more diluted during discharge because of water formation (see 1.1). This means, the electrolyte density is substantially lower in a discharged lead-acid accumulator than in a charged one. This characteristic considerably distinguishes lead-acid accumulators from other electro-chemical energy storage and it can be problematic at temperatures below - 5°C because the electrolyte might freeze. Because of this, the active mass and the containers could be damaged due to an increase of the volume.
Handbook (part 1) - 37 - Industrial Power, Application Engineering Edition 6, February 2012 Copyright – All Rights Reserved
The electrolyte exists in vented lead-acid accumulators in a liquid form (see 2.4.2). In valve regulated lead-acid (VRLA) batteries the electrolyte is either fixed in a Gel (see 2.4.3.1) or in a glass fiber fleece (AGM, see 2.4.3.2). 2.4.2 Free Electrolyte The liquid electrolyte is called free electrolyte in vented batteries. The concentration of sulfuric acid, depending on the density, is between 30 and 40 weight percentages. 2.4.3 Fixed (Starved) Electrolyte 2.4.3.1 Fixation in Gel At first diluted sulfuric acid is mixed with a powder of amorphous SiO2. By intensive stirring the solid SiO2 and the liquid sulfuric acid form a stable jelly-like phase. This viscous substance will be filled into the cells by use of a special equipment. After a rest time of several hours the mixture solidifies to a milky-cloudy substance – the Gel. This behaviour is called thixotropic behaviour (analogue to ketchup): It is mentioned as fixation of the electrolyte in a thixotropic Gel. Hydrogen bonds and the “Van der Waalssche” force cause the solidification of the electrolyte to a stable three-dimensional network. The Gel fills out, beside the top area, the complete cell respectively block container. The for the internal gas recombination necessary oxygen transport from the positive to the negative electrodes takes place along the cracks in the Gel. 2.4.3.2 Fixation in AGM AGM stands for Absorbent Glass Mat. The mat is consisting of micro glass fiber materials. The mat fulfills two functions as electrolyte reservoir and as separator (see 2.3.2). The separator is macroporous one in opposite to the microporous ones used in Gel-batteries. The electrolyte is completely absorbed by the glass fleece. Therefore, no free electrolyte is available in the batteries.
Handbook (part 1) - 38 - Industrial Power, Application Engineering Edition 6, February 2012 Copyright – All Rights Reserved
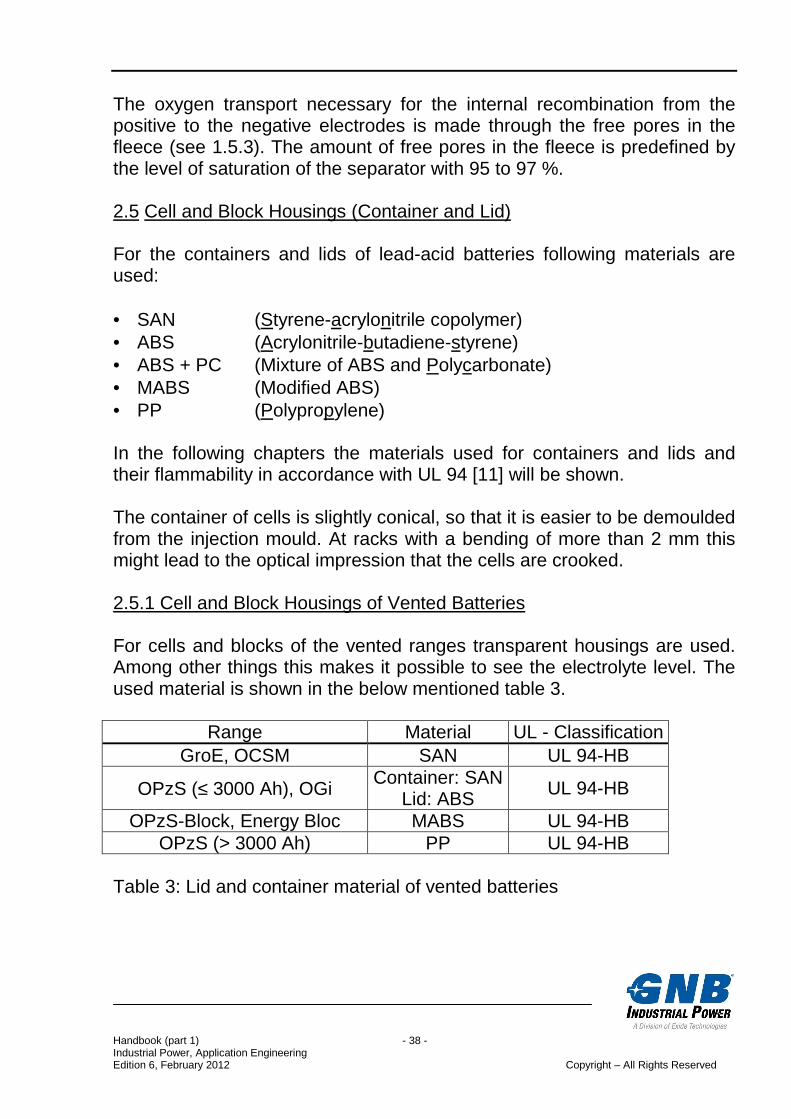
The oxygen transport necessary for the internal recombination from the positive to the negative electrodes is made through the free pores in the fleece (see 1.5.3). The amount of free pores in the fleece is predefined by the level of saturation of the separator with 95 to 97 %. 2.5 Cell and Block Housings (Container and Lid) For the containers and lids of lead-acid batteries following materials are used: • SAN (Styrene-acrylonitrile copolymer) • ABS (Acrylonitrile-butadiene-styrene) • ABS + PC (Mixture of ABS and Polycarbonate) • MABS (Modified ABS) • PP (Polypropylene) In the following chapters the materials used for containers and lids and their flammability in accordance with UL 94 [11] will be shown. The container of cells is slightly conical, so that it is easier to be demoulded from the injection mould. At racks with a bending of more than 2 mm this might lead to the optical impression that the cells are crooked. 2.5.1 Cell and Block Housings of Vented Batteries For cells and blocks of the vented ranges transparent housings are used. Among other things this makes it possible to see the electrolyte level. The used material is shown in the below mentioned table 3.
Range Material UL - Classification GroE, OCSM SAN UL 94-HB
OPzS (≤ 3000 Ah), OGi Container: SAN
Lid: ABS UL 94-HB
OPzS-Block, Energy Bloc MABS UL 94-HB OPzS (> 3000 Ah) PP UL 94-HB
Table 3: Lid and container material of vented batteries
Handbook (part 1) - 39 - Industrial Power, Application Engineering Edition 6, February 2012 Copyright – All Rights Reserved
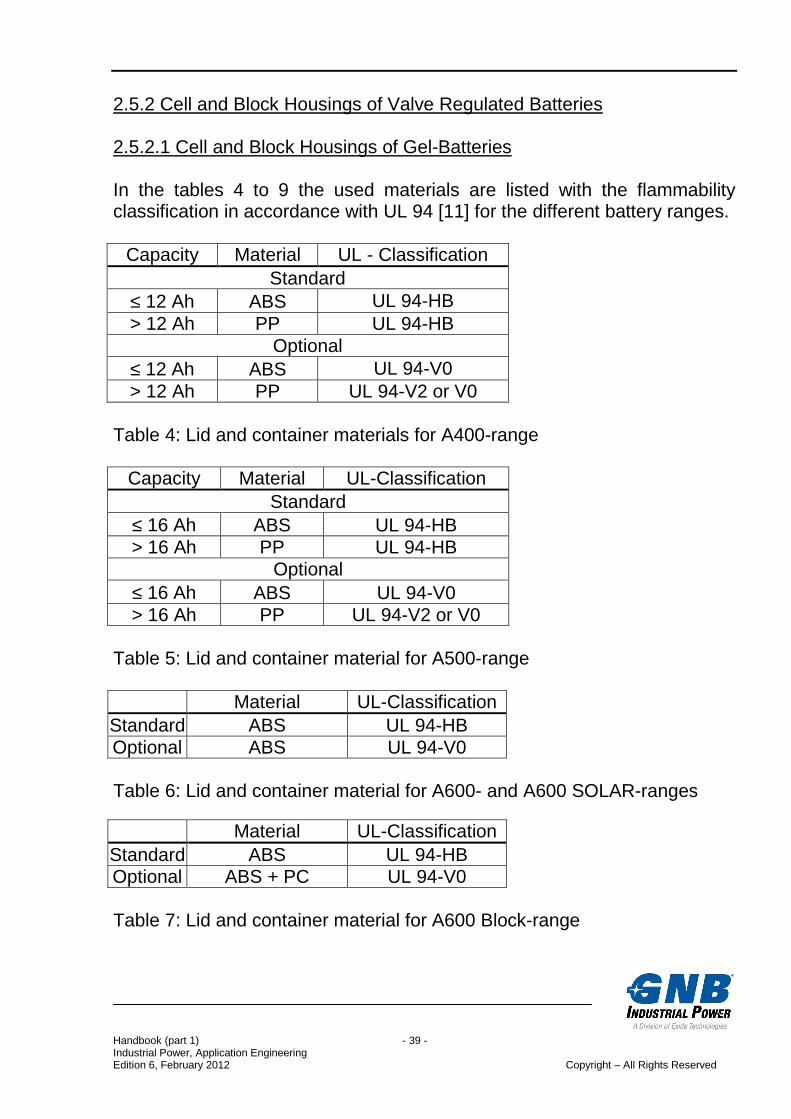
2.5.2 Cell and Block Housings of Valve Regulated Batteries 2.5.2.1 Cell and Block Housings of Gel-Batteries In the tables 4 to 9 the used materials are listed with the flammability classification in accordance with UL 94 [11] for the different battery ranges.
Capacity Material UL - Classification Standard
≤ 12 Ah ABS UL 94-HB > 12 Ah PP UL 94-HB
Optional ≤ 12 Ah ABS UL 94-V0 > 12 Ah PP UL 94-V2 or V0
Table 4: Lid and container materials for A400-range
Capacity Material UL-Classification Standard
≤ 16 Ah ABS UL 94-HB > 16 Ah PP UL 94-HB
Optional ≤ 16 Ah ABS UL 94-V0 > 16 Ah PP UL 94-V2 or V0
Table 5: Lid and container material for A500-range
Material UL-Classification Standard ABS UL 94-HB Optional ABS UL 94-V0 Table 6: Lid and container material for A600- and A600 SOLAR-ranges
Material UL-Classification Standard ABS UL 94-HB Optional ABS + PC UL 94-V0 Table 7: Lid and container material for A600 Block-range
Handbook (part 1) - 40 - Industrial Power, Application Engineering Edition 6, February 2012 Copyright – All Rights Reserved
Material UL-Classification PP UL 94-HB
Table 8: Lid and container material for A700-range
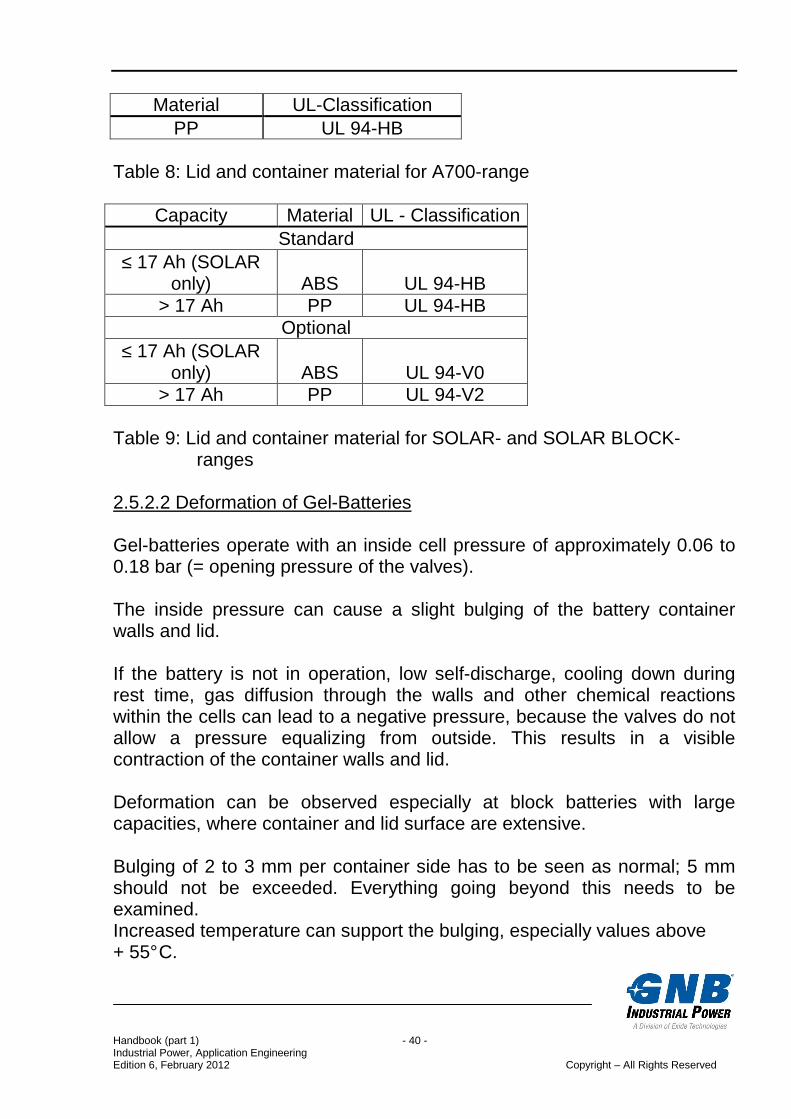
Capacity Material UL - Classification Standard
≤ 17 Ah (SOLAR only) ABS UL 94-HB
> 17 Ah PP UL 94-HB Optional
≤ 17 Ah (SOLAR only) ABS UL 94-V0
> 17 Ah PP UL 94-V2 Table 9: Lid and container material for SOLAR- and SOLAR BLOCK- ranges 2.5.2.2 Deformation of Gel-Batteries Gel-batteries operate with an inside cell pressure of approximately 0.06 to 0.18 bar (= opening pressure of the valves). The inside pressure can cause a slight bulging of the battery container walls and lid. If the battery is not in operation, low self-discharge, cooling down during rest time, gas diffusion through the walls and other chemical reactions within the cells can lead to a negative pressure, because the valves do not allow a pressure equalizing from outside. This results in a visible contraction of the container walls and lid. Deformation can be observed especially at block batteries with large capacities, where container and lid surface are extensive. Bulging of 2 to 3 mm per container side has to be seen as normal; 5 mm should not be exceeded. Everything going beyond this needs to be examined. Increased temperature can support the bulging, especially values above + 55° C.
Handbook (part 1) - 41 - Industrial Power, Application Engineering Edition 6, February 2012 Copyright – All Rights Reserved
Bulging shows a normal function of the battery. Contraction can signal a deep discharged condition of the battery. 2.5.2.3 Cell and Block Housings of AGM-Batteries In the tables 10 to 14 the used materials with the flammability classification in accordance with UL 94 [11] for the different battery ranges are listed.
Capacity Material UL - Classification Standard
All PP UL 94-HB Optional
All PP UL 94-V0 Table 10: Lid and container material for Marathon L/XL and Sprinter P/XP
Capacity Material UL-Classification All except
M12V180FT PP UL 94-HB or V0 M12V180FT PP UL 94-V0
Table 11: Lid and container material for Marathon M/M-FT
Capacity Material UL-Classification Standard
All PP UL 94-HB Optional
All PP UL 94-V2 Table 12: Lid- and container material for Sprinter S
Capacity Material UL-Classification All ABS UL 94-HB
Table 13: Lid and container material for Powerfit S 200
Handbook (part 1) - 42 - Industrial Power, Application Engineering Edition 6, February 2012 Copyright – All Rights Reserved
Capacity Material UL-Classification All ABS UL 94-V2
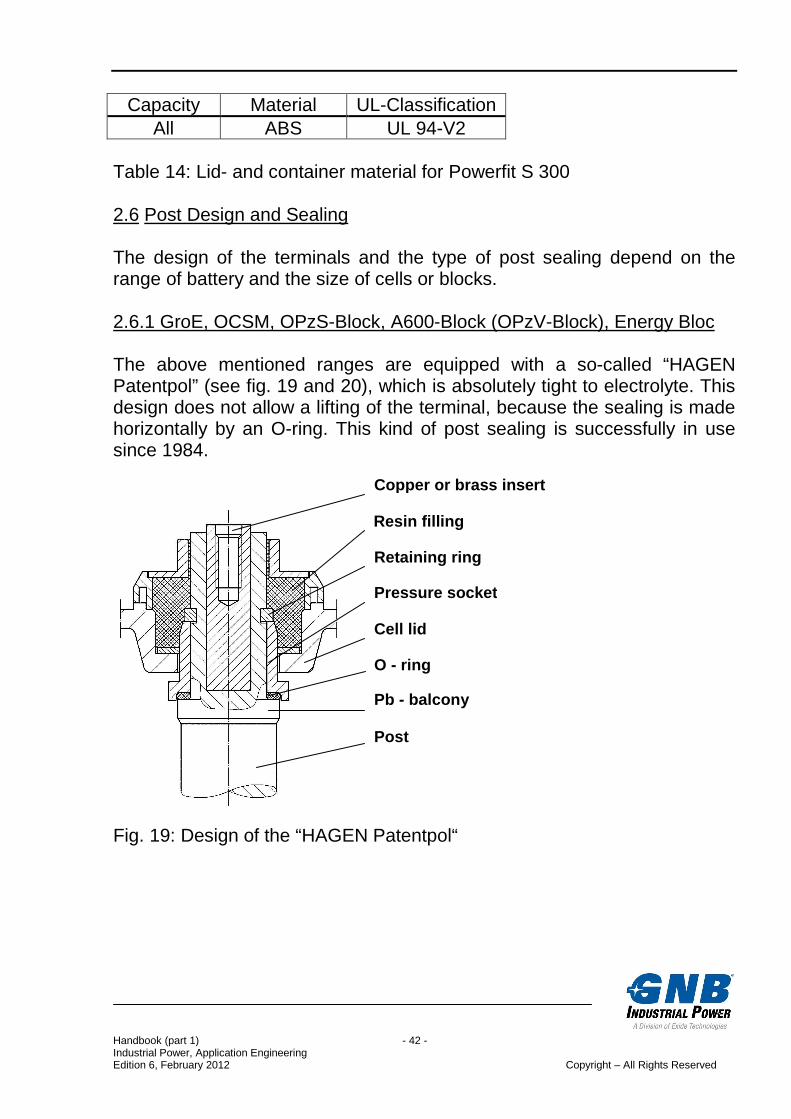
Table 14: Lid- and container material for Powerfit S 300 2.6 Post Design and Sealing The design of the terminals and the type of post sealing depend on the range of battery and the size of cells or blocks. 2.6.1 GroE, OCSM, OPzS-Block, A600-Block (OPzV-Block), Energy Bloc The above mentioned ranges are equipped with a so-called “HAGEN Patentpol” (see fig. 19 and 20), which is absolutely tight to electrolyte. This design does not allow a lifting of the terminal, because the sealing is made horizontally by an O-ring. This kind of post sealing is successfully in use since 1984. Fig. 19: Design of the “HAGEN Patentpol“
Copper or brass insert
Resin filling
Cell lid
Retaining ring
Pressure socket
O - ring
Pb - balcony
Post
Handbook (part 1) - 43 - Industrial Power, Application Engineering Edition 6, February 2012 Copyright – All Rights Reserved
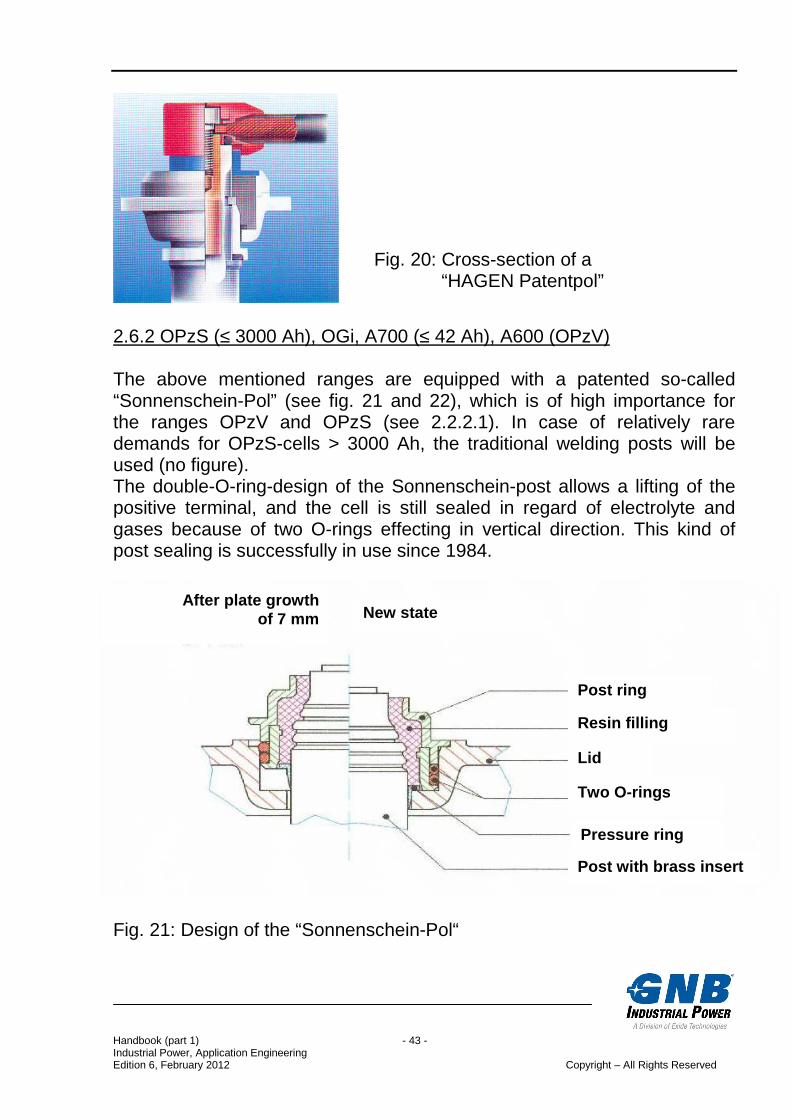
2.6.2 OPzS (≤ 3000 Ah), OGi, A700 (≤ 42 Ah), A600 (OPzV) The above mentioned ranges are equipped with a patented so-called “Sonnenschein-Pol” (see fig. 21 and 22), which is of high importance for the ranges OPzV and OPzS (see 2.2.2.1). In case of relatively rare demands for OPzS-cells > 3000 Ah, the traditional welding posts will be used (no figure). The double-O-ring-design of the Sonnenschein-post allows a lifting of the positive terminal, and the cell is still sealed in regard of electrolyte and gases because of two O-rings effecting in vertical direction. This kind of post sealing is successfully in use since 1984. Fig. 21: Design of the “Sonnenschein-Pol“
After plate growth of 7 mm New state
Post ring
Resin filling
Lid
Two O-rings
Pressure ring
Post with brass insert
Fig. 20: Cross-section of a “HAGEN Patentpol”
Handbook (part 1) - 44 - Industrial Power, Application Engineering Edition 6, February 2012 Copyright – All Rights Reserved
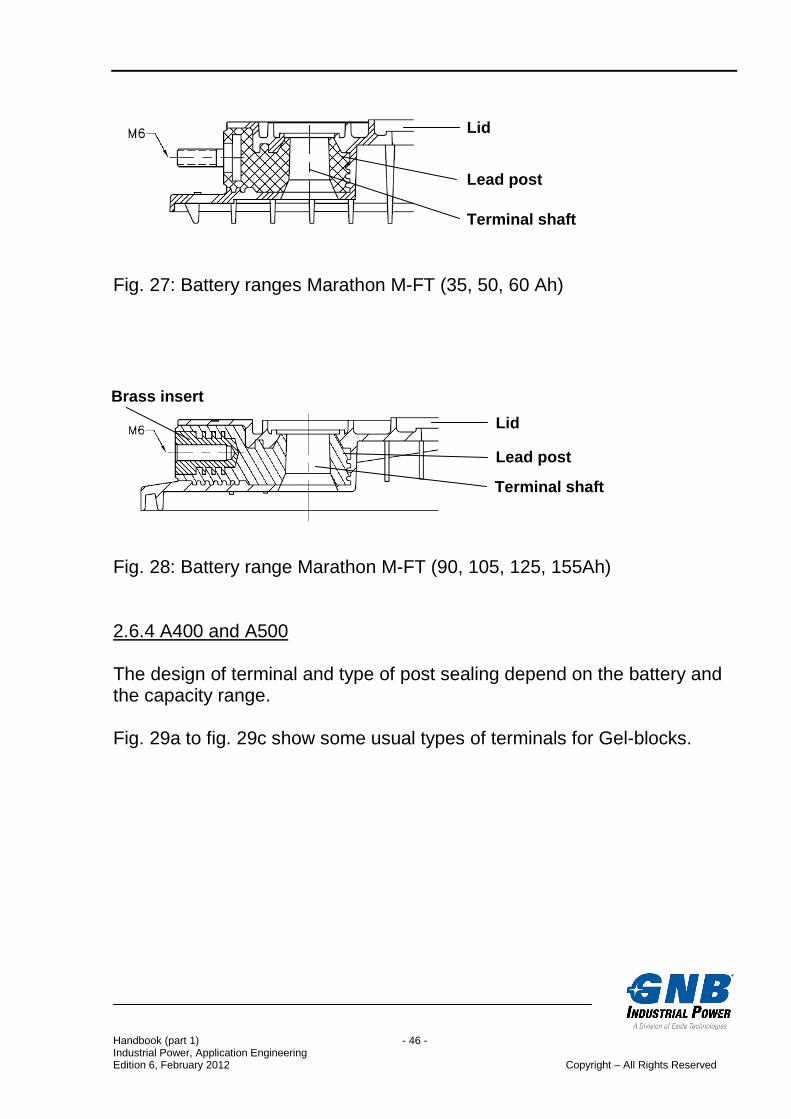
2.6.3 Marathon, Sprinter, A700 (≥ 63 Ah) The design of the terminals and the type of the post sealing varies in the different battery ranges. The following fig. 23 to 28 show the respective version. Fig. 23: Battery ranges Marathon L, Sprinter P (original post design)
Terminal
Rubber seal ring
Lid
Fig. 22: Cross section of a „Sonnenschein-Pol”
Handbook (part 1) - 45 - Industrial Power, Application Engineering Edition 6, February 2012 Copyright – All Rights Reserved
Fig. 24: Battery ranges Marathon L, Sprinter P (modified post design)
Fig. 28: Battery range Marathon M-FT (90, 105, 125, 155Ah) 2.6.4 A400 and A500 The design of terminal and type of post sealing depend on the battery and the capacity range. Fig. 29a to fig. 29c show some usual types of terminals for Gel-blocks.
Lead post
Lid
Terminal shaft
Lead post
Lid
Terminal shaft
Brass insert
Handbook (part 1) - 47 - Industrial Power, Application Engineering Edition 6, February 2012 Copyright – All Rights Reserved
2.6.5 Number of Post Pairs High capacities require multiple post pairs (up to 4) because of the high discharge currents. Thereby the discharge current is distributed to different post pairs and standard connectors. 2.7 Vent Caps and Valves 2.7.1 Vent Caps for Vented Batteries 2.7.1.1 Vent Plugs A labyrinth is located in the vent plugs (see example in fig. 30), where the acid drops, which are stuck to the gas bubbles, precipitate and flow back into the cells.
Handbook (part 1) - 48 - Industrial Power, Application Engineering Edition 6, February 2012 Copyright – All Rights Reserved
Fig. 30: Example for a vent plug 2.7.1.2 Ceramic Vent Plugs The ceramic vent plug (fig. 31) makes it possible for the gas to escape through a ceramic body from the cell and avoids thereby ignition from the outside into the cell (function see fig. 33).
Fig. 31: Ceramic vent plug
Handbook (part 1) - 49 - Industrial Power, Application Engineering Edition 6, February 2012 Copyright – All Rights Reserved
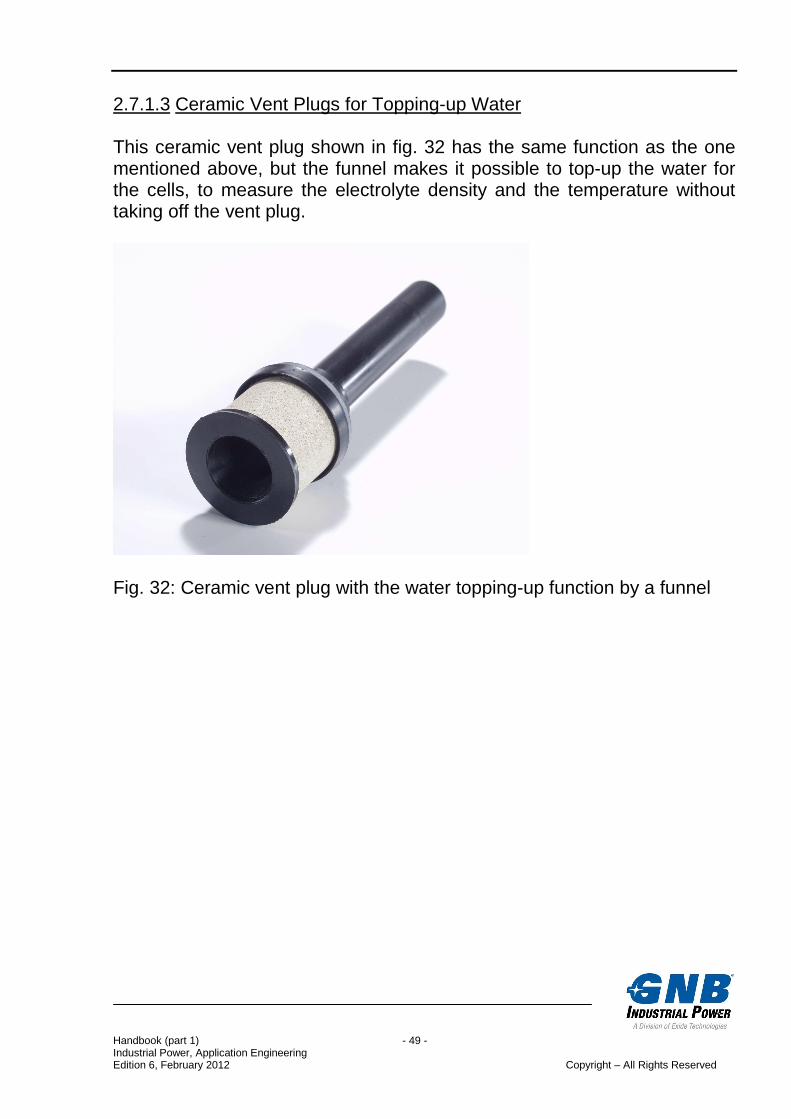
2.7.1.3 Ceramic Vent Plugs for Topping-up Water This ceramic vent plug shown in fig. 32 has the same function as the one mentioned above, but the funnel makes it possible to top-up the water for the cells, to measure the electrolyte density and the temperature without taking off the vent plug.
Fig. 32: Ceramic vent plug with the water topping-up function by a funnel
Handbook (part 1) - 50 - Industrial Power, Application Engineering Edition 6, February 2012 Copyright – All Rights Reserved
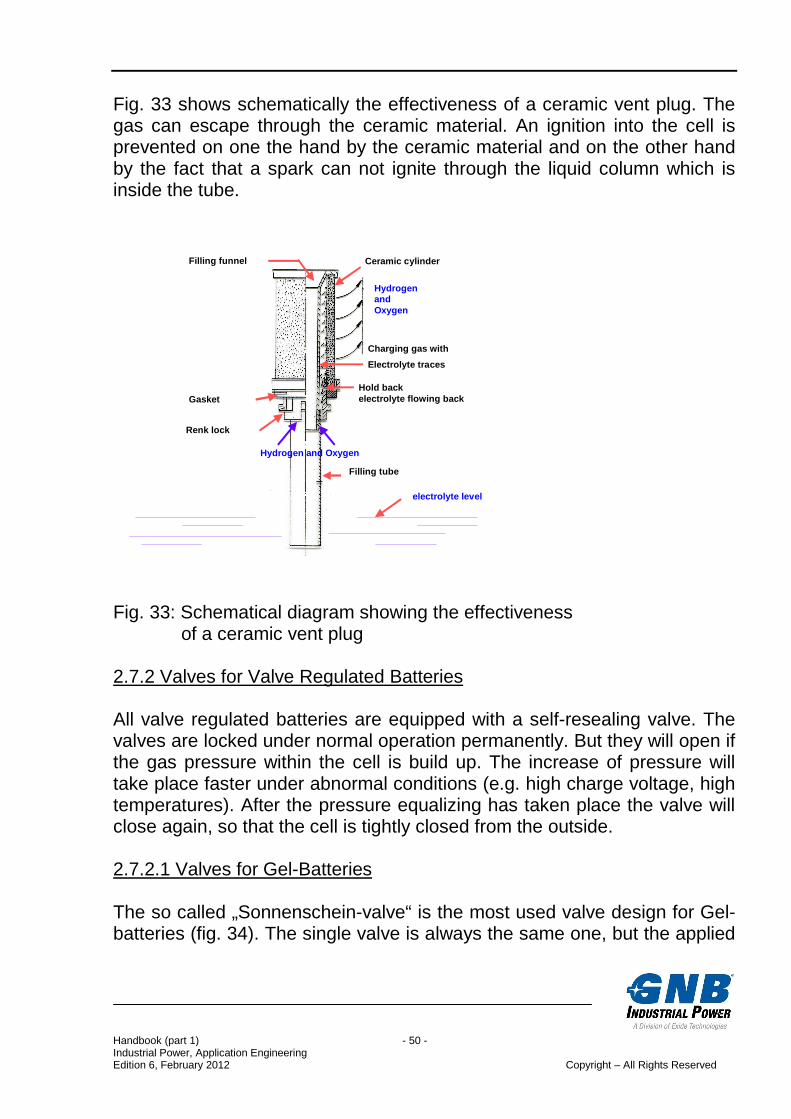
Fig. 33 shows schematically the effectiveness of a ceramic vent plug. The gas can escape through the ceramic material. An ignition into the cell is prevented on one the hand by the ceramic material and on the other hand by the fact that a spark can not ignite through the liquid column which is inside the tube.
Filling tube
Hold backelectrolyte flowing back
Ceramic cylinder
HydrogenandOxygen
Filling funnel
Charging gas with
Electrolyte traces
Renk lock
Gasket
Hydrogen and Oxygen
electrolyte level
Fig. 33: Schematical diagram showing the effectiveness
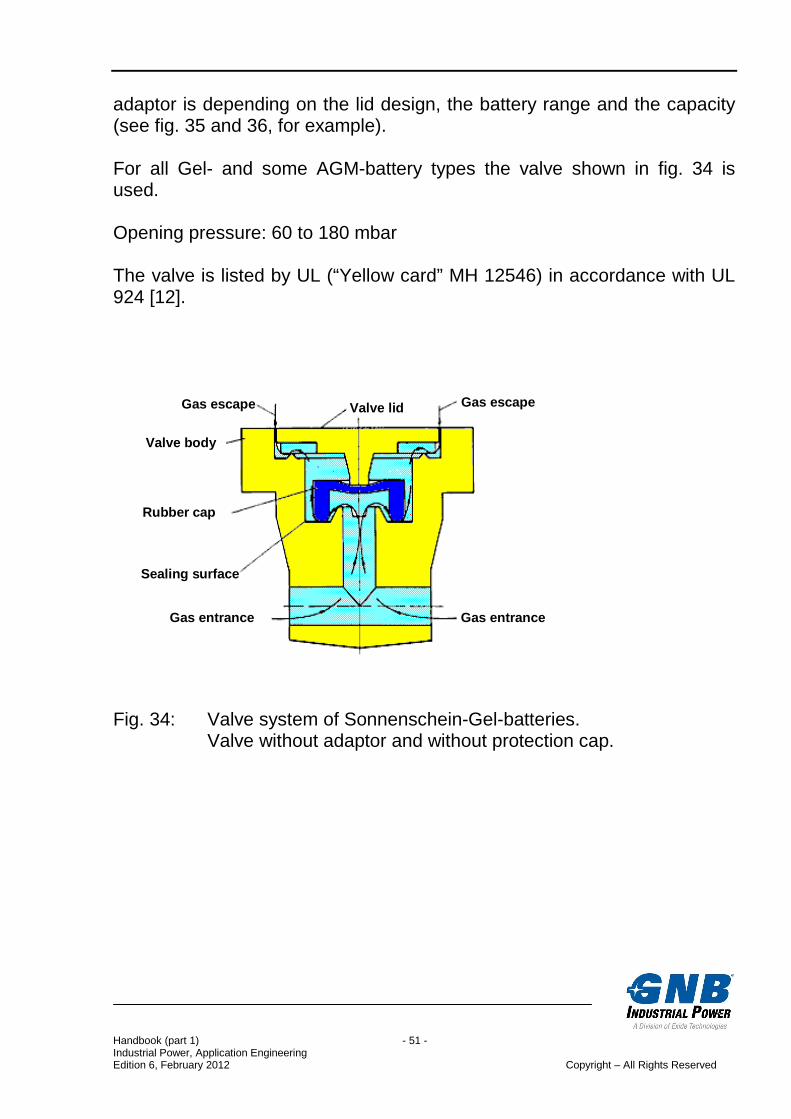
of a ceramic vent plug 2.7.2 Valves for Valve Regulated Batteries All valve regulated batteries are equipped with a self-resealing valve. The valves are locked under normal operation permanently. But they will open if the gas pressure within the cell is build up. The increase of pressure will take place faster under abnormal conditions (e.g. high charge voltage, high temperatures). After the pressure equalizing has taken place the valve will close again, so that the cell is tightly closed from the outside. 2.7.2.1 Valves for Gel-Batteries The so called „Sonnenschein-valve“ is the most used valve design for Gel-batteries (fig. 34). The single valve is always the same one, but the applied
Handbook (part 1) - 51 - Industrial Power, Application Engineering Edition 6, February 2012 Copyright – All Rights Reserved
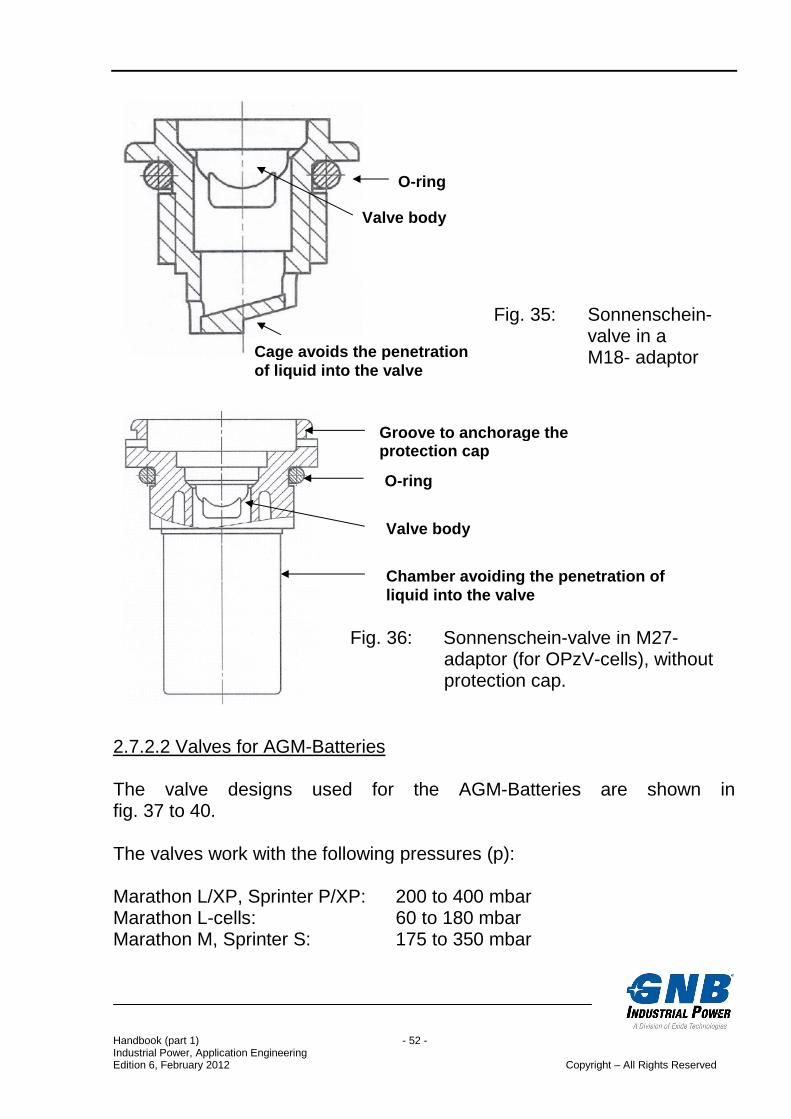
adaptor is depending on the lid design, the battery range and the capacity (see fig. 35 and 36, for example). For all Gel- and some AGM-battery types the valve shown in fig. 34 is used. Opening pressure: 60 to 180 mbar The valve is listed by UL (“Yellow card” MH 12546) in accordance with UL 924 [12].
Gas escapeValve lidGas escape
Valve body
Rubber cap
Sealing surface
Gas entranceGas entrance
Fig. 34: Valve system of Sonnenschein-Gel-batteries. Valve without adaptor and without protection cap.
Handbook (part 1) - 52 - Industrial Power, Application Engineering Edition 6, February 2012 Copyright – All Rights Reserved
2.7.2.2 Valves for AGM-Batteries The valve designs used for the AGM-Batteries are shown in fig. 37 to 40. The valves work with the following pressures (p): Marathon L/XP, Sprinter P/XP: 200 to 400 mbar Marathon L-cells: 60 to 180 mbar Marathon M, Sprinter S: 175 to 350 mbar
Fig. 35: Sonnenschein-valve in a M18- adaptor Cage avoids the penetration
of liquid into the valve
O-ring
Valve body
Fig. 36: Sonnenschein-valve in M27- adaptor (for OPzV-cells), without protection cap.
Chamber avoiding the penetration of liquid into the valve
Valve body
Groove to anchorage the protection cap O-ring
Handbook (part 1) - 53 - Industrial Power, Application Engineering Edition 6, February 2012 Copyright – All Rights Reserved
Fig. 37: Valve design for Marathon L-blocks, Sprinter P
Fig. 39: Valve design for Marathon M and Sprinter S
Rubber valve
Lid
Cover
Rubber valve
Lid
Valve lid
Fig. 38: Valve design for Marathon L 2V-cells (compare with fig. 35)
Fig. 40: Valve design for Marathon XL and Sprinter XP
Flame arrestor
O ring Rubber valve
Handbook (part 1) - 54 - Industrial Power, Application Engineering Edition 6, February 2012 Copyright – All Rights Reserved
2.8 Connectors and Connectings 2.8.1 Flexible Connectors The highly flexible cell and block connectors normally used by GNB Industrial Power made of welding cable material have the advantage of enabling higher current flows compared to normal cables respectively to have a lower voltage drop at the same current flow. In addition, the flexible connectors do not stress the post sealing mechanically when cells with slightly different heights are assembled (e.g. at bending of rack crossheads and rack boards). Expansions caused by temperature are also compensated. Inter-row and inter-tier connectors are mostly flexible. 2.8.2 Rigid Connectors Rigid connectors do have a cost advantage in comparison to flexible connectors. As these connectors are normally made of copper bars, it is more easy feasible to produce not standardized connector cross sections. 2.8.3 Voltage Drop by Connectors All connectors used by GNB Industrial Power are dimensioned to minimize a voltage drop. The voltage drop by connectors can be calculated by the following formula:
L • l ∆ U = --------- with κ • A ∆ U: Voltage drop in V L: Connector length in m I: Discharge current in A A: Connector cross section in mm² m κ: Conductivity of Cu κ = 56 ------------- Ω • mm²
Handbook (part 1) - 55 - Industrial Power, Application Engineering Edition 6, February 2012 Copyright – All Rights Reserved
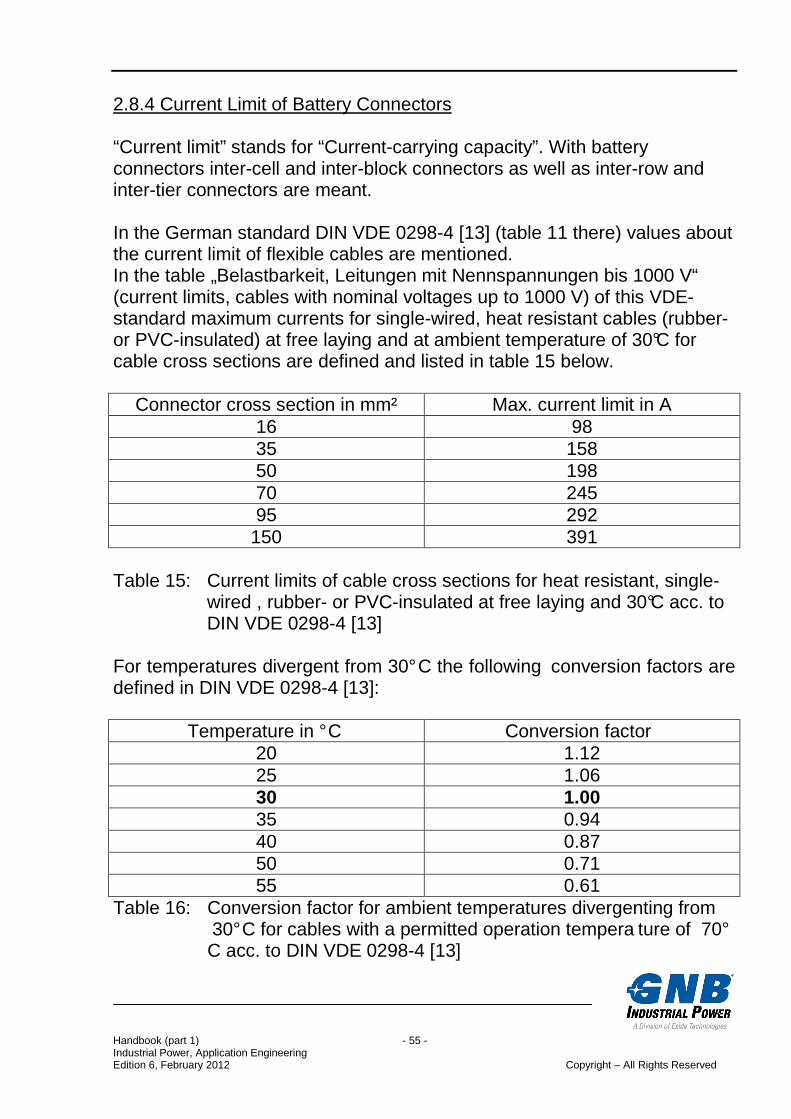
2.8.4 Current Limit of Battery Connectors “Current limit” stands for “Current-carrying capacity”. With battery connectors inter-cell and inter-block connectors as well as inter-row and inter-tier connectors are meant. In the German standard DIN VDE 0298-4 [13] (table 11 there) values about the current limit of flexible cables are mentioned. In the table „Belastbarkeit, Leitungen mit Nennspannungen bis 1000 V“ (current limits, cables with nominal voltages up to 1000 V) of this VDE-standard maximum currents for single-wired, heat resistant cables (rubber- or PVC-insulated) at free laying and at ambient temperature of 30°C for cable cross sections are defined and listed in table 15 below.
Connector cross section in mm² Max. current limit in A 16 98 35 158 50 198 70 245 95 292
150 391 Table 15: Current limits of cable cross sections for heat resistant, single-
wired , rubber- or PVC-insulated at free laying and 30°C acc. to DIN VDE 0298-4 [13]
For temperatures divergent from 30° C the following conversion factors are defined in DIN VDE 0298-4 [13]:
Temperature in ° C Conversion factor 20 1.12 25 1.06 30 1.00 35 0.94 40 0.87 50 0.71 55 0.61
Table 16: Conversion factor for ambient temperatures divergenting from 30° C for cables with a permitted operation tempera ture of 70° C acc. to DIN VDE 0298-4 [13]
Handbook (part 1) - 56 - Industrial Power, Application Engineering Edition 6, February 2012 Copyright – All Rights Reserved
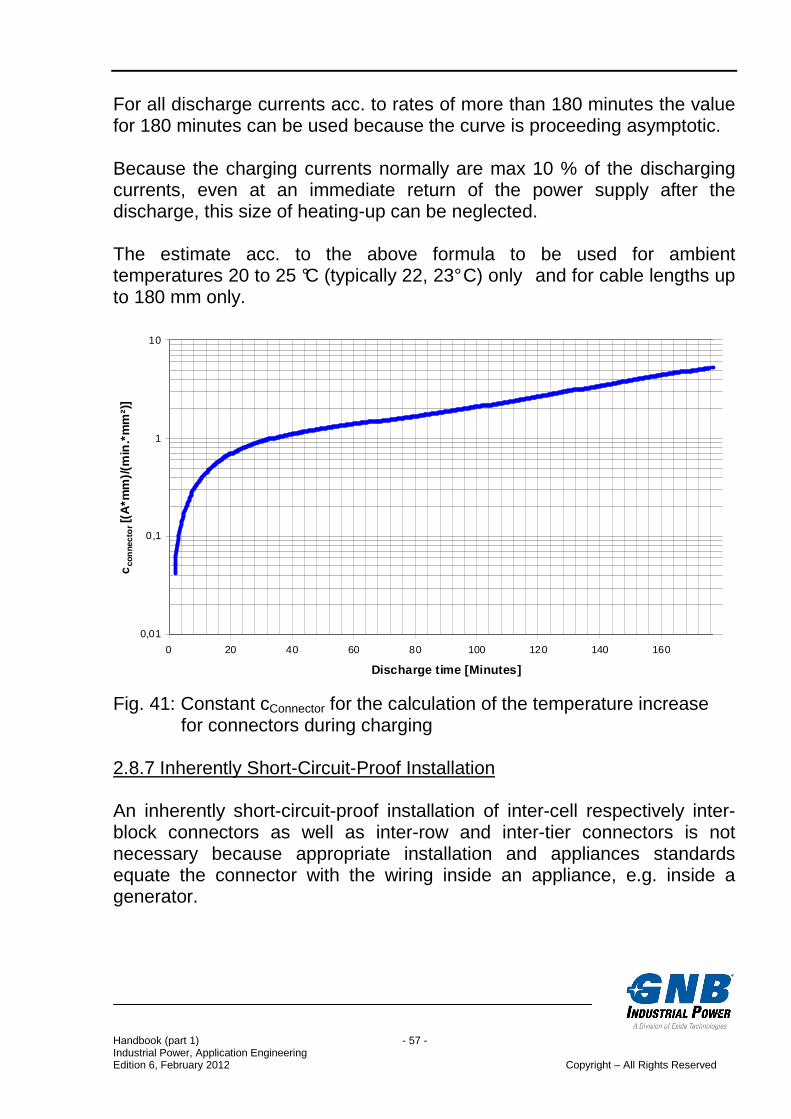
The connector cross sections and the maximum current limit mentioned in this DIN VDE-standard are defined for a durability of 30 years at a constant load. In accordance with a long conversation held with Mr. Wilhelm Rudolph, VDE Frankfurt and author of the book „Einführung in die DIN VDE 0100„ [14] (introduction in DIN VDE 0100), in 2004, connectors can be loaded with considerably higher currents, if the load occurs not frequently or rarely. Because in most applications for stationary battery discharges of max. 400 to 1200 times during a service life of the battery of 10 to 20 years occur (then the cycle life limits the service life ) it is definitely possible to have discharges with currents acc. to rates < 1 hour with a load of 4 to 5-times higher than the above mentioned values. 2.8.5 Connector Cross Sections The connector cross sections per cell / block battery used by GNB Industrial Power are in principle designed in a manner that the connectors will heat up to max. + 70°C at discharges between 3 minutes and several hours. If other cross sections are required because of lower desired voltage drops by the connectors, this can be taken into consideration by GNB Industrial Power for the delivery of the battery installation. 2.8.6 Temperature Increase During Discharge and Charging The maximum heating-up of the connector for the discharge can be calculated roughly by the following equation: LConnector • IDischarge ∆Tmax = cConnector • ------------------------- AConnector • tDischarge where as: ∆Tmax = Max. temperature increase in K or ° C cConnector = Constant from fig. 40 LConnector = Connector length in mm IDischarge = Discharge current in A AConnector = Connector cross section in mm² tDischarge = Discharge time in minutes The values mentioned on the following page in fig. 41 for the constant cConnector were determined empirically by GNB Industrial Power.
Handbook (part 1) - 57 - Industrial Power, Application Engineering Edition 6, February 2012 Copyright – All Rights Reserved
0,01
0,1
1
10
0 20 40 60 80 100 120 140 160
Discharge time [Minutes]
cco
nne
cto
r [(
A*m
m)/
(min
.*m
m²)
]
For all discharge currents acc. to rates of more than 180 minutes the value for 180 minutes can be used because the curve is proceeding asymptotic. Because the charging currents normally are max 10 % of the discharging currents, even at an immediate return of the power supply after the discharge, this size of heating-up can be neglected. The estimate acc. to the above formula to be used for ambient temperatures 20 to 25 °C (typically 22, 23° C) only and for cable lengths up to 180 mm only. Fig. 41: Constant cConnector for the calculation of the temperature increase for connectors during charging 2.8.7 Inherently Short-Circuit-Proof Installation An inherently short-circuit-proof installation of inter-cell respectively inter-block connectors as well as inter-row and inter-tier connectors is not necessary because appropriate installation and appliances standards equate the connector with the wiring inside an appliance, e.g. inside a generator.
Handbook (part 1) - 58 - Industrial Power, Application Engineering Edition 6, February 2012 Copyright – All Rights Reserved
But, all end connectors of batteries which connect batteries among each other, with the load, the disconnector or fuses, must be installed inherently short-circuit-proof. The following exemplary mentioned kinds of installations are true of inherently short-circuit-proof and inherently earth-fault-proof and are suitable for the use in battery systems:
- rubber-insulated single-core cables H07RN-F acc. to HD 22.4 [15], - layouts of single-core non-sheathed cables NSGAFÖU acc. to the
German standard DIN VDE 0250, part 602 [16]. Layouts: See with it HD 384.5.52 [17]. For comparison, the standard EN 50272-2 [6] is recommended. 2.8.8 Voltage Endurance of Cables The following explanations can be reviewed in detail in the German norm DIN VDE 0298-3 (VDE 0298 part 3) [18] and in HD 516 [19], respectively. The voltage endurance is related to the nominal voltage of the cables. The nominal voltage is specified as the alternating voltage (AC). Hereby, two values are mentioned: U0/U in Volt. U0 is the r.m.s. value of the voltage between external line and earth (metal covering of the conductor or surrounding medium), U is the r.m.s. value of the voltage between two external lines of a multi-core line or a system of single-core lines. It is allowed that the operating voltage exceeds the nominal voltage by 10% permanently, even by 20% in case of cables with ≥ 600/1000 V AC-nominal voltage. The permissible DC-voltage values can be obtained by multiplying with 1.5, i.e. V DC = 1.5 • V AC.
Handbook (part 1) - 59 - Industrial Power, Application Engineering Edition 6, February 2012 Copyright – All Rights Reserved
Example: Cable type H07RN-F with Nominal voltage U0/U = 450/750 V AC correspond to 675/1125 V DC. Inclusive + 10% on AC results in
742/1237 V DC. Lines of nominal voltage U0/U = 450/750 V AC cover even applications with extremely high numbers of cells per battery string. There are UPS-systems consisting of 46 pcs. respectively 40 pcs. 12 V-block batteries, which correspond to 276 respectively 240 cells. On the assumption of maximum 2.40 Vpc boost charge, this corresponds to 662.4 V respectively 576 V DC and will be covered this cable type.
Handbook (part 1) - 60 - Industrial Power, Application Engineering Edition 6, February 2012 Copyright – All Rights Reserved
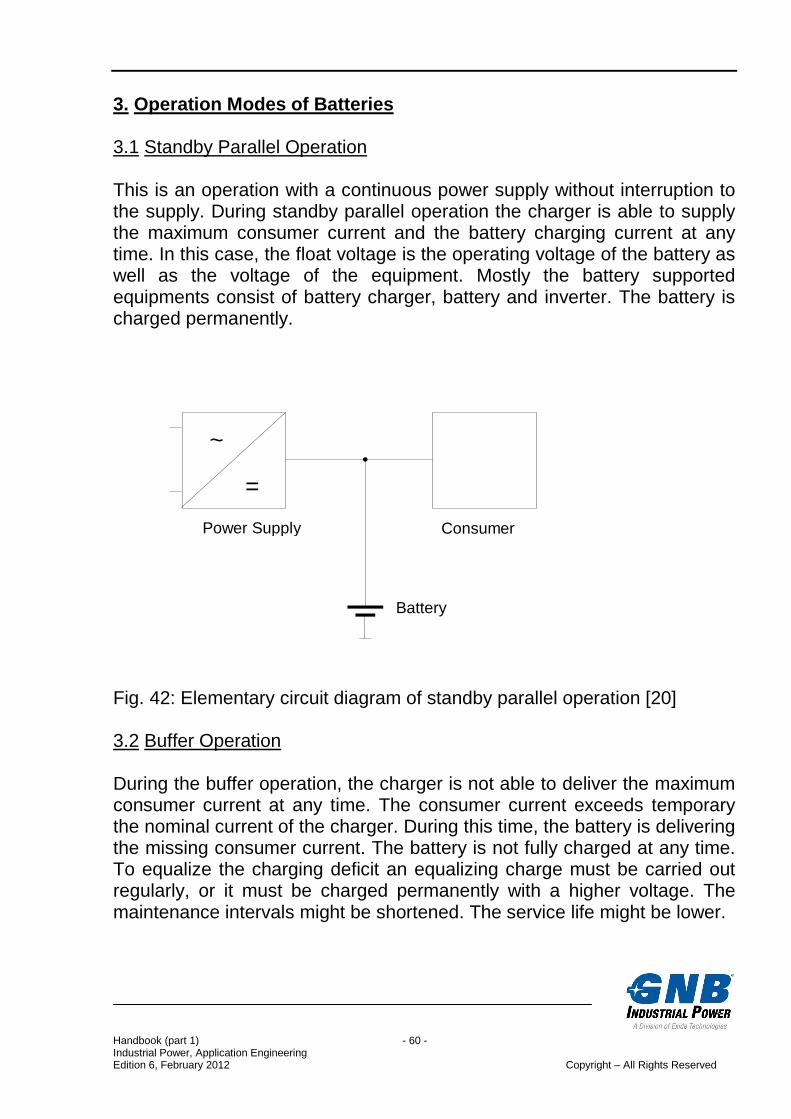
3. Operation Modes of Batteries 3.1 Standby Parallel Operation This is an operation with a continuous power supply without interruption to the supply. During standby parallel operation the charger is able to supply the maximum consumer current and the battery charging current at any time. In this case, the float voltage is the operating voltage of the battery as well as the voltage of the equipment. Mostly the battery supported equipments consist of battery charger, battery and inverter. The battery is charged permanently.
Power Supply
Battery
~
=
Consumer
Fig. 42: Elementary circuit diagram of standby parallel operation [20] 3.2 Buffer Operation During the buffer operation, the charger is not able to deliver the maximum consumer current at any time. The consumer current exceeds temporary the nominal current of the charger. During this time, the battery is delivering the missing consumer current. The battery is not fully charged at any time. To equalize the charging deficit an equalizing charge must be carried out regularly, or it must be charged permanently with a higher voltage. The maintenance intervals might be shortened. The service life might be lower.
Handbook (part 1) - 61 - Industrial Power, Application Engineering Edition 6, February 2012 Copyright – All Rights Reserved
The elementary circuit diagram of the buffer operation is corresponding with the standby parallel operation (see fig. 42). 3.3 Switch-Over Operation During the switch-over operation, the battery is disconnected from the consumer and is charged by a separate charger. The consumers are directly supplied by a power supply unit. At power failure only the rectifier switches to the battery. This kind of operation is common in the range of safety lightning (see 6.4.2) because here short switch-over times do not cause any problems.
Power Supply
ChargerBattery
~
=
~
=
Consumer
Fig. 43: Elementary circuit diagram of a switch-over operation [20] 3.4 Charge / Discharge Operation (Cycling Operation) During charge/discharge operation the consumer is completely fed by the battery. If the battery is discharged, it will be disconnected from the consumer for re-charging and connected to a suitable charger. The charging voltage for the charge/discharge operation is higher than for the float charging, because normally the battery shall be fully charged as soon as possible.
Handbook (part 1) - 62 - Industrial Power, Application Engineering Edition 6, February 2012 Copyright – All Rights Reserved
Power Supply
Battery
~
=
Consumer
Charging Discharging
Fig. 44: The elementary circuit diagram of a charge/discharge operation [20] For this class of operation the service life is mentioned as durability in cycles. 3.5 Solar Operation (Special Charge/Discharge Operation) The solar operation is a special mode of charge/discharge operation, during which the battery is not switched there and back between load and charging equipment, but a charge regulator controls the charge respectively discharge operations. The operation of lead-acid batteries in solar equipment is one of the demanding ones at all. Because of the variety of the operating conditions the state of charge of the battery is mostly not defined. Over months the battery is used in partly discharged state. This depends strongly on the correct selection and configuration of the battery, which should be selected by competent technicians only corresponding to the local condition. The battery manufacturer can give recommendations only.
Handbook (part 1) - 63 - Industrial Power, Application Engineering Edition 6, February 2012 Copyright – All Rights Reserved
Influence factors among others are: • Weather conditions, especially the course of solar radiation during the
complete year, • Stress of the battery, e.g. daily discharges, discharges at the weekend
only or seasonal ( summer, winter), • The correct selection of the components and the tuning among each
other (e.g. performance of the solar modules, simple or intelligent charge regulators, deep discharge protection, cycle resistant lead-acid batteries),
• Available or not available possibilities for maintenance, • The correct respectively optimal adjustment of the charging parameters
depending on the concrete application (voltage, charging duration, step- wise tuning).
The used battery types are vented batteries and Gel-batteries mainly because of the required durability in cycles. For the conventional application (e.g. mobile homes, smaller stationary equipments for private use, parking ticket machines) batteries with positive grid plates are useful: Vented types: EnerSol VRLA-types: SOLAR and SOLAR BLOCK For higher requirements, i.e. higher number of cycles and in stand alone solar systems, cells with positive tubular plates should be used: Vented types: OPzS, Enersol T and OPzS SOLAR VRLA-types: A600 and A600 SOLAR
Handbook (part 1) - 64 - Industrial Power, Application Engineering Edition 6, February 2012 Copyright – All Rights Reserved
4. Discharging of Lead-Acid Batteries 4.1 Nominal Capacity CN The nominal capacity CN is the capacity of a cell or battery and used as identification. This is, depending on the battery range, the 10-hours, 20-hours, 100-hours or 120-hours capacity. The values are expressed in Ampere-hour (Ah). 4.2 Rated Capacity Crt The rated capacity Crt is the available capacity which a cell or battery can deliver under set terms from a fully charged state. This is e.g. the 0.25-, 1-, 3- or 5-hour capacity up to the permissible final discharge voltage. The value of the capacity is mentioned in Ampere-hour (Ah). 4.3 Deep Discharge A discharge below the final discharge voltage fixed for the respective load is a deep discharge. Deep discharges with a discharge of more than the nominal capacity or the highest for this range specified capacity („Classic OPzS Solar“ and „Classic EnerSol T“: 240 hours capacity) are very critical. This is also valid for discharges with small currents, which e.g. can occur with reverse currents of switched-off chargers, as well as of monitoring equipments in switched-off battery installations. In this case the plates will get sulfated combined with the transformation of fine crystalline to coarse crystalline lead sulfate. During a deep discharge the following scenario takes place:
• The concentration of sulfuric acid decreases strongly because of the formation to lead sulfate
⇒ Water is formed ⇒ The acid density comes with progressing discharge close to the density of water
• The solubility of lead sulfate increases at low acid density ⇒ soluble in water
⇒ solved lead ions in electrolyte
Handbook (part 1) - 65 - Industrial Power, Application Engineering Edition 6, February 2012 Copyright – All Rights Reserved
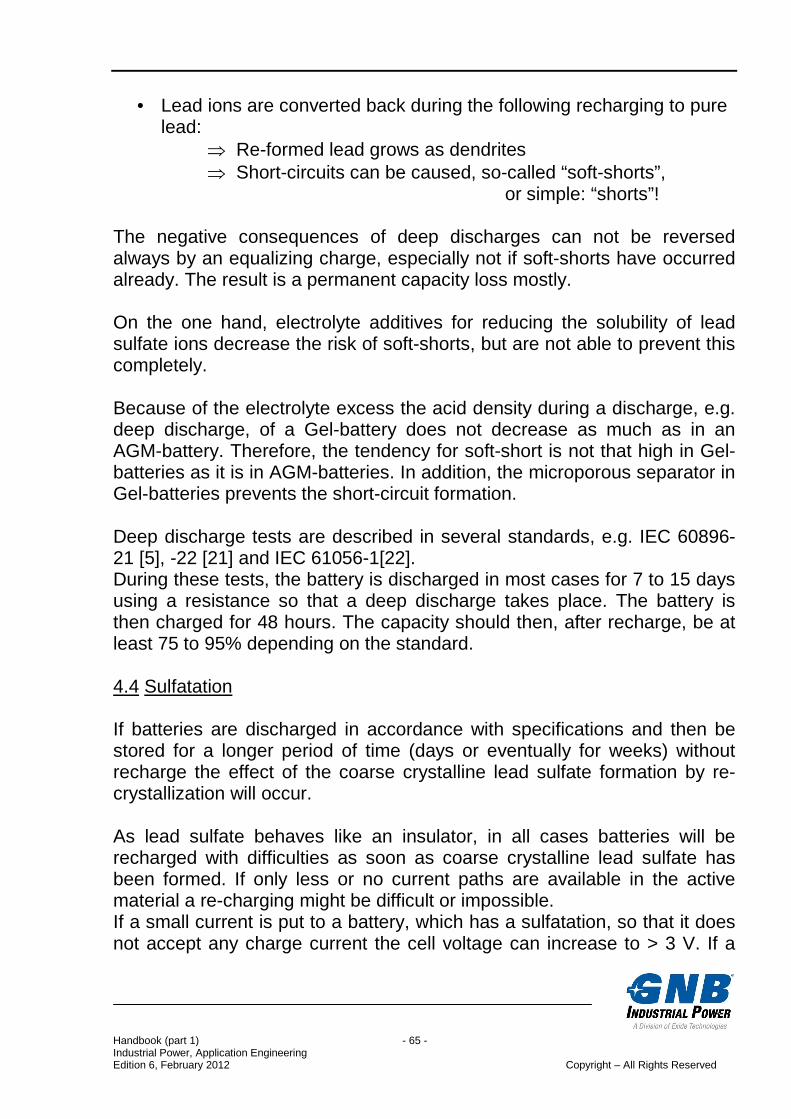
• Lead ions are converted back during the following recharging to pure lead:
⇒ Re-formed lead grows as dendrites ⇒ Short-circuits can be caused, so-called “soft-shorts”, or simple: “shorts”!
The negative consequences of deep discharges can not be reversed always by an equalizing charge, especially not if soft-shorts have occurred already. The result is a permanent capacity loss mostly. On the one hand, electrolyte additives for reducing the solubility of lead sulfate ions decrease the risk of soft-shorts, but are not able to prevent this completely. Because of the electrolyte excess the acid density during a discharge, e.g. deep discharge, of a Gel-battery does not decrease as much as in an AGM-battery. Therefore, the tendency for soft-short is not that high in Gel-batteries as it is in AGM-batteries. In addition, the microporous separator in Gel-batteries prevents the short-circuit formation. Deep discharge tests are described in several standards, e.g. IEC 60896-21 [5], -22 [21] and IEC 61056-1[22]. During these tests, the battery is discharged in most cases for 7 to 15 days using a resistance so that a deep discharge takes place. The battery is then charged for 48 hours. The capacity should then, after recharge, be at least 75 to 95% depending on the standard. 4.4 Sulfatation If batteries are discharged in accordance with specifications and then be stored for a longer period of time (days or eventually for weeks) without recharge the effect of the coarse crystalline lead sulfate formation by re-crystallization will occur. As lead sulfate behaves like an insulator, in all cases batteries will be recharged with difficulties as soon as coarse crystalline lead sulfate has been formed. If only less or no current paths are available in the active material a re-charging might be difficult or impossible. If a small current is put to a battery, which has a sulfatation, so that it does not accept any charge current the cell voltage can increase to > 3 V. If a
Handbook (part 1) - 66 - Industrial Power, Application Engineering Edition 6, February 2012 Copyright – All Rights Reserved
breakthrough of the lead sulfate is achieved, a charge current is flowing again and the charge voltage will decrease suddenly to values < 2.7 V per cell [23]. 4.5 Voltage Curve During Discharge (incl. „Coup de Fouet“) The definition „Coup de Fouet“ is French language and has the meaning “lash of a whip”, describing the shape of the curve at the beginning of the discharge (see fig. 45).
1,50
1,55
1,60
1,65
1,70
1,75
1,80
1,85
1,90
1,95
2,00
2,05
2,10
2,15
0,0 10,0 20,0 30,0 40,0 50,0
Time [Minutes]
Vol
tage
[V] p
er c
ell
U0, min.
Ui
Delta U1 = I * Ri + 0.04 V
Delta U2 = "Coup de Fouet" = "voltage sack"
Fig. 45: Discharge curve voltage vs. time of an 8 OCSM 920-
cell out of the rest voltage with a discharge current of 736 A
The discharge of stationary lead-acid batteries mostly starts out of the float charge (disruptive incident in the stand-by parallel operations) or out of the rest voltage (capacity test). A voltage level Ui (i = initial) occurs, which is described as start of discharge. In opposite to the curve shown in fig. 45 a discharge out of the float charge operation has in addition the pass through of the voltage difference
Handbook (part 1) - 67 - Industrial Power, Application Engineering Edition 6, February 2012 Copyright – All Rights Reserved
between compensation charge voltage and the rest voltage. For the following estimations this difference can be neglected. It is started out from the assumption of the rest voltage (equilibrium voltage), because this constitutes the electromotive power of a cell. The deepest dot of the voltage curve results from ∆U1 + ∆U2 as reference value according to fig. 45. ∆U1 = I • Ri + 0.04 Vpc with I = Discharge current [A] and Ri = Internal resistance [Ω] of the cell At fully charged lead-acid batteries the so called “voltage sack” ∆U2 has to be taken into consideration. The voltage sack is depending on the battery range. The values practically are: • 20 to 30 mV per cell for vented and AGM-batteries and • 0 to 30 mV per cell for Gel-batteries. Remarks:
- Regarding the voltage sack, it is recommended to use 40 mV per cell for calculations.
- Changes due to ageing must be taken into account especially concerning Ri.
- “0.04 Vpc” is a pure safety constant with optional use. But, it is recommended für estimating the maximum possible current in ranges up to 1 minute respectively the lowest voltage.
The voltage sack results from the delayed formation of lead sulfate crystals. It is also mentioned as crystallization overvoltage. Additional energy is necessary for forming the first crystals. At predefined constant discharge parameters, current respectively power, the respective energy loss per cell can result in an additional voltage drop only. The formation of sulfate does not have to start at zero if lead sulfate exists already in respectively on the plates (residual sulfate or interrupted
Handbook (part 1) - 68 - Industrial Power, Application Engineering Edition 6, February 2012 Copyright – All Rights Reserved
discharge operations). On those cases, the voltage sack will not occur or will be much lower. The Gel-structure of the Gel-batteries effectuates from time to time the non-appearance of the voltage sack by offering seed crystal formation. The depth of the voltage sack is not depending on the current but its duration. It can be started out from the assumption, that the voltage sack has been passed through after approximately 10% of the discharge time correlated to the current. Different curves of the voltage at the beginning of the discharge shows the following fig. 46. The curve after the voltage sack leads at first to the initial discharge voltage Ui before it comes to a decrease of the voltage after it has been passed through a plateau. The length of this plateau depends on the current. High currents cause the formation of sulfate in short times, especially on the surface of the electrodes. The pores of the active material will be sealed superficially; thereby the further diffusion of additional electrolyte into the plates is inhibited. The voltage will drop very fast and the discharged Ampere-hours are a fraction of C10 only. At very high currents it can not be talked about a voltage plateau. Considerably smaller currents however allow the use of deeper located mass amounts by slower formation of lead sulfate crystals, because the electrolyte can flow. This is the reason that for e.g. the nominal capacity C100 (for solar operation) is approximately 20% higher than the C10.
Handbook (part 1) - 69 - Industrial Power, Application Engineering Edition 6, February 2012 Copyright – All Rights Reserved
Fig. 46: Time factor of the voltage drop including the voltage pocket of a cell with grid plates [24], page 38, copied with friendly approval of the publisher (“V/Zelle” = V per cell, “Spannung” = voltage, “Entladezeit” = discharge time, „min“ = minutes,
„...std.“ = ... hour rate, „10std. ...1/6std.“ = currents acc. to the discharged capacity, e.g. “1std” = current acc. to the C1-capacity)
Handbook (part 1) - 70 - Industrial Power, Application Engineering Edition 6, February 2012 Copyright – All Rights Reserved
4.6 Self-Discharge The self-discharge is defined [1] in relation to the charge retention: “self-discharge - phenomenon by which a cell or battery loses energy in other ways than by discharge into an external circuit.
NOTE: See also charge retention.” “charge retention - ability of a cell or battery to retain capacity on open circuit under specified conditions.
NOTE: See also self-discharge.” The lower the self-discharge, the longer the time period in which the battery is able to keep its electrical charge. Every battery has a self-discharge because of electro-chemical reasons. The rate of self-discharge is depending on the battery range, the state of charge and the temperature. It increases with increasing temperature and drops with declining state of charge. During the open circuit state the battery is discharging because of the potential differences of the positive and the negative electrode by gassing or corrosion. These discharges mean a progressive loss of capacity. If the battery is stored it is necessary to recharge the battery regularly depending on the rate of self-discharge of the battery range and the temperature.
Handbook (part 1) - 71 - Industrial Power, Application Engineering Edition 6, February 2012 Copyright – All Rights Reserved
5. Charging of Lead-Acid Batteries 5.1 General Following some definitions from the German standard DIN 40729 [25] and the international electrotechnical dictionary, part 482 [1], with remarks of GNB Industrial Power. The charging parameters voltage, initial charging current and eventually maximum durations should be taken from the respective operating instructions. • Charging is the conversion of electrical energy in chemical energy [25]. • Charging is a defined, finished charging process [25]. • Full charge is a charge with complete conversion of the active material
[25]. • Partial charge is a charge with a not complete conversion of active
materials [25]. • Float charging is a timely not limited charging with constant voltage, to
keep the state of fully charge [25].
Remark: It corresponds with the charging acc. to an IU- charge regime e.g. during parallel standby-operation.
• Boost charge is an accelerated charge applied at higher than normal
currents or of voltages for a short period of time [1]. • Equalization charge is a defined charging to ensure that the active
material has been completely converted in all cells [25].
Handbook (part 1) - 72 - Industrial Power, Application Engineering Edition 6, February 2012 Copyright – All Rights Reserved
5.2 Charging Regimes 5.2.1 Abbreviations of Charging Regimes in Acc. with DIN 41772 Below mentioned diagrams show the abbreviations of charging regimes as well as the course of voltage versus current. This charge regime graphs might seem unusual. Therefore it is recommended to compare it with the regimes shown in 5.2.2 to 5.2.5, where the courses of current and voltage versus time are shown. Fig. 47: Charging regime graph and abbreviations of the charging
regimes in accordance with the German standard DIN 41772 [26] The used abbreviations are:
• W - unregulated resistance regime (dropping regime ) • U - voltage regulated (constant voltage) • I - current regulated (constant current) • 0 - switch-over point • a - automatic switch-off
W-charging regime
U a
I
IU0U-charging regime
IUIa-charging regime
U
I
U
I I-charging regime
U
I
constant voltage
constant current
constant current
constant current
constant current
constant voltage
0
Handbook (part 1) - 73 - Industrial Power, Application Engineering Edition 6, February 2012 Copyright – All Rights Reserved
2
2,05
2,1
2,15
2,2
2,25
2,3
2,35
2,4
2,45
2,5
0 2 4 6 8 10 12 14
Time
Vol
tage
[V] p
er c
ell
0
2
4
6
8
10
12
Cur
rent
[A] p
er 1
00 A
h
2
2,1
2,2
2,3
2,4
2,5
2,6
2,7
0 2 4 6 8 10 12
Time
Vol
tage
[V] p
er c
ell
0
2
4
6
8
10
12
Cur
rent
[A] p
er 1
00 A
h
5.2.2 Constant Current / Constant Voltage Regime (IU, IU0U) Fig. 48: Course of current and voltage versus time of the IU-charging
regime without boost charge step (IU). Current and voltage values are examples only.
Fig. 49: Course of current and voltage versus time of the IU-charging
regime with boost charge step (IU0U). Current and voltage values are examples only.
Handbook (part 1) - 74 - Industrial Power, Application Engineering Edition 6, February 2012 Copyright – All Rights Reserved
2
2,1
2,2
2,3
2,4
2,5
2,6
2,7
0 2 4 6 8 10 12 14Time
Vol
tage
[V] p
er c
ell
0
1
2
3
4
5
6
Cur
rent
[A] p
er 1
00A
h
2
2,1
2,2
2,3
2,4
2,5
2,6
2,7
0 2 4 6 8 10 12 14 16
Time
Vol
tage
[V] p
er c
ell
0
2
4
6
8
10
12
14
16
18
Cur
rent
[A] p
er 1
00 A
h
5.2.3 Resistance Regulated Regime (W) Fig. 50: Course of current and voltage versus time of the W-charging
regime. Current and voltage values are examples only. 5.2.4 Constant Current Regime (I) Fig. 51: Course of current and voltage versus time of a IUIa-charging
regime. Current and voltage values are examples only.
Handbook (part 1) - 75 - Industrial Power, Application Engineering Edition 6, February 2012 Copyright – All Rights Reserved
2
2,1
2,2
2,3
2,4
2,5
2,6
2,7
0 2 4 6 8 10 12 14 16
Time
Vol
tage
[V] p
er c
ell
0
2
4
6
8
10
12
14
16
18
Cur
rent
[A] p
er 1
00 A
h
5.2.5 Constant Current / Constant Voltage / Constant Current Regime (IUI) Fig. 52: Course of current and voltage versus time of the IUIa-charging
regime. Current and voltage values are examples only. 5.3 Charge Coefficient and Electrolyte Stratification The charge coefficient (also called “charge factor”) is the coefficient with which the discharged electrical charge has to be multiplied at charging to determine the necessary amount of charge volume to achieve the original state of charge of the battery. The charge coefficient is the reciprocal value of the Ah-effectiveness of the charging: η = 1/charge coefficient η = effectiveness of charging It must be 3 to 4% Ampere-hours more charged than discharged to get a reconversion of the total active material. This is to be explained by the different charging behaviour of the positive and negative electrodes. The charging coefficient includes, if necessary, as in the case of vented batteries, the mixing of the electrolyte.
Handbook (part 1) - 76 - Industrial Power, Application Engineering Edition 6, February 2012 Copyright – All Rights Reserved
The definition “electrolyte stratification” describes a vertical inhomogenity of the sulfuric acid concentration within a cell. Electrolyte stratification occurs primarily at cyclic applications and affects the service life of the battery negatively. Concentrated sulfuric acid is produced during all recharging processes. The specific weight of concentrated sulfuric acid is higher compared to diluted sulfuric acid. After the sulfuric acid has left the pores of the active material, it will try to deposit in the lower areas of the cell container, due to the gravitation. In extreme cases 1.10 kg/l can be measured in the upper parts of the cell, where as the acid concentration values in the lower parts can achieve 1.35 kg/l. Electrolyte stratification in valve regulated lead-acid (VRLA) batteries can be prevented by strong absorption of the produced sulfuric acid immediately after it has left the pores of the active material. Consequently Gel-batteries do not show any electrolyte stratification. Because the absorption by AGM, compared to gel, is lower, a small electrolyte stratification can be noticed. In the case of vented batteries (free liquid electrolyte) the electrolyte stratification is inevitable and has to be compensated at the end of a charging by gas evolution. The gas bubbles are mixing the electrolyte. The same effect can be achieved by blowing air in the cells from the outside (electrolyte circulation). Below mentioned charge coefficients have to be seen as reference values after several hours of discharge with following recharging: • 1.05 to 1.20, typical 1.05, for Gel-batteries, • 1.05 to 1.20, typical 1.08, for AGM-batteries and • 1.20 to 1.30, typical 1.20, for vented batteries. Because of already mentioned reasons clear differences between vented, AGM- and Gel-batteries are recognizable in regards of the charge coefficients. In Gel-batteries the electrolyte stratifications is nearly zero. Fig. 53 shows the differences between the lead-acid battery systems in regards of electrolyte stratification.
Handbook (part 1) - 77 - Industrial Power, Application Engineering Edition 6, February 2012 Copyright – All Rights Reserved
1,1
1,13
1,16
1,19
1,22
1,25
1,28
0 1 2 3 4 5 6 7 8 9 10
Number of cycles
Aci
d de
nsity
[kg/
l]vented type
vented type
AGM
AGM
Gel
Gel
Fig. 53: Electrolyte stratification in lead-acid battery systems measured at
a PzS 350-cell. Charging with 2.4 Volt per cell. 5.4 Residual Charge Current (Float Charge Current) The residual charge current is the current which flows in a fully charge battery at float charge. Generally it is divided in the following partial currents: • Current for the compensation of the self-discharge • Current for the corrosion of the positive electrodes • Current for the recombination (for VRLA-batteries only) • Current for the water decomposition • Current for the compensation of fine short-cricuits (“soft-shorts”)
As the distribution of currents is difficult to measure the partitioning of currents can be determined approximately only by the self-discharge rate of the battery and the estimated size of the currents for the recombination. The residual charge current is depending on: • the battery range (vented or VRLA) • the alloy (especially the positive plates)
bottom
top
Handbook (part 1) - 78 - Industrial Power, Application Engineering Edition 6, February 2012 Copyright – All Rights Reserved
• the difference between the rest voltage, given by the electrolyte density and the float voltage (= polarization)
• the float voltage • the temperature • the purity of the used materials • the age and the prehistory of the battery Typical values of some battery ranges in a new state are: • Vented batteries:
The following is valid for the temperature and voltage behaviour of the residual charge current of vented batteries: • Rough formula for the temperature: Per 10 degrees temperature
increase doubling of the current („Arrhenius“) • Rough formula for the voltage : Per 0.1 Vpc voltage increase triplication
of the current For VRLA-batteries following statement can be given: • No general rough formula for the temperature:
Dependence is from time to time stronger than in accordance with „Arrhenius“ (e.g. triplication per 10 degrees).
• No general rough formula for the voltage: Per 0.1 Vpc voltage increase e.g. increases sevenfold to tenfold of the current (reason: oxygen recombination, depending on battery range).
Handbook (part 1) - 79 - Industrial Power, Application Engineering Edition 6, February 2012 Copyright – All Rights Reserved
5.5 Insufficient Charging If a battery gets or is never fully charged this is called an insufficient charging. This happens on the one hand in cycling operations, if the charging time is not sufficient, or on the other hand the charging voltage is too low or both can be applied. In this case the batteries undergoes a slow sulfatation, which means parts of the active material will not be converted to lead or lead dioxide during charging. At this application fault the capacity will become lower and lower from cycle to cycle. If such a battery is recharged adequately, the capacity will increase usually from cycle to cycle. Though certain damage will remain. In the standby parallel operation an insufficient charging might occur if the charging voltage is permanently too low. This happens mostly if specifications for the temperature compensation of the charging voltage are not kept. In this case the polarization, especially of the negative electrode, is not sufficient, which leads to a decrease of the available capacity. If the insufficient charging is noticed during the specified six months check of the charging voltage the damage can be eventually reversed, so that, after correction of the charging voltage, after several weeks the nominal capacity might be available again. VRLA-batteries react much more sensitive than vented ones to too low charging voltages, because the negative electrodes are lower polarized anyway (see fig. 55).
Handbook (part 1) - 80 - Industrial Power, Application Engineering Edition 6, February 2012 Copyright – All Rights Reserved
Fig. 54: Principle course of the Tafel lines for the polarization of
the negative and positive electrode of vented (without recombination) and VRLA-batteries (with recombination) by change of the cell voltage (simplified and modified graph acc. to D.Berndt [7]). The comparison is based on the assumption that the vented design is converted to valve-regulated design taking into account the same nominal electrolyte density which is not the case in practice.
Polarization/DepolarizationVented vs. Valve-Regulated
Polarization [mV]
0 + 50 + 1000- 50- 100
Influence of oxygen recombination on positive & neg ative polarization
Current [mA/100 Ah]
+ 150
10
1
100
OCV = 2.07 V
(1.22 kg/l)
Vented 2.23 Vpc
VRLA 2.23 Vpc, depolarization of negative electrode s
VRLA 2.23 Vpc, slight polarization of neg. electrodes
Handbook (part 1) - 81 - Industrial Power, Application Engineering Edition 6, February 2012 Copyright – All Rights Reserved
5.6 Overcharge The international electro-technical dictionary [1] defines the overcharge as follows: … continued charging of a fully charged secondary cell or battery. NOTE: Overcharge is also the act of charging beyond a certain limit specified by the manufacturer. In practice, this is an unintentional continuation of charging over the already fully state of charge mostly. In the case of float charge within the limits specified by the manufacturer the overcharge is not only allowed, but also wanted. Inadmissible overcharging means:
• Increase of water loss (see 1.5.1),
• Increase of corrosion (see 2.2.2),
• Risk of „Thermal Runaway“ (see 1.7) for VRLA-batteries.
Handbook (part 1) - 82 - Industrial Power, Application Engineering Edition 6, February 2012 Copyright – All Rights Reserved
6. Applications 6.1 Telecommunication The system voltage in telecom applications is typically 48 V, corresponding to 24 cells. The loads (constant current, constant performance) are in the low to medium level. Contrary to the earlier experiences the required bridging times sweep over a very wide range. This depends on the local respectively the country specific stability of the mains power supply. If in central European areas bridging times of 30 minutes to one hour are sufficient, in countries with instable mains power supply bridging times of several hours can be required, e.g. 8 hours. Thus makes the requirements of the efficiency of the batteries very different in regard of the performance. If in the area of central Europe the standby parallel operation is typical, in countries with instable mains power supply a cyclic operation has to be assumed, but at least a combination of both modes of operations have to be taken into consideration. For the battery types the world wide trend is continued to use valve-regulated lead-acid (VRLA-) batteries with a service life of 10 to 12 years or more. The reason for this is the continued requirement for compact installation in racks respectively in cabinets with e.g. 19-inch-units primarily in the mobile telecommunication area. Vented lead-acid batteries are used in the main stations of the telecommunication, where sufficient space is available. 6.1.1 Fixed Network Communication In the fixed network communication the telephone line to the end user („Last Mile“) is supported by batteries in the main stations. The system voltage for older equipment is mostly 60 V and 48 V for modern equipment. 6.1.2 Mobile Telephony Network Communication For the Europe wide installation of the UMTS-Net of the third mobile telephone generation, which is able to transfer voice and data at the same time, full-coverage antenna system stations need to be installed. This so-
Handbook (part 1) - 83 - Industrial Power, Application Engineering Edition 6, February 2012 Copyright – All Rights Reserved
called basis stations (Base Transceiver Station –BTS) are placed at the stand of the stationary transmitter and convert the received digital signals into analogical radio signals. The stationary mobile telephone antenna supplies one “cell”. They are receiving and sending high frequency from mobile appliances. Several antennas are installed mostly on the high radio masts which are visible over a long distance. To ensure the uninterruptible power supply all these stations are equipped with batteries and charging equipment. The nominal voltage of the system is 48 V. Front terminal batteries of 50 Ah up to 200 Ah are installed depending on the power spectrum of the antenna and the required autonomy time in case of mains failure. 6.2 Uninterruptible Power Supply (UPS) Nowadays, uninterruptible power supply systems are available in many areas; as e.g. industry, hospitals, ships, trains, IT-infra structure, air traffic. In every public mains power supply interruptions are happening. In central Europe interruptions of several minutes are single cases only. In countries with instable mains power supply frequent and longer interruptions have to be expected. These interruptions lead to abnormal crashes and data losses at every microprocessor controlled system. Gaps in the sine of the alternating current, high-energy voltage peak by switching processes or the trigger of fuses can lead to data losses or property damages. UPS-equipments are avoiding damages like this. The standards IEC 62040-1-1 [27] respectively IEC 62040-3 [28] show the main operation functions of UPS. The basic function of a UPS is to support a connected load uninterruptible. This can be achieved with different circuit architectures and the corresponding operating modes. Because of the arrangement in the complete system and in accordance with the classification following UPS can be distinguished:
Handbook (part 1) - 84 - Industrial Power, Application Engineering Edition 6, February 2012 Copyright – All Rights Reserved
• VFD-classification (Voltage and Frequency Dependent)
This UPS-class ensures a passive „Standby-Operation(Offline)“
VFD – Classification (Offline Technology)
Netz
Netz
Fig. 55: Mode of operation at VFD-classification [29], with friendly approval of MGE (original German text translated by GNB Industrial Power)
consumer
consumer
Mains supply
Mains supply
Main Voltage available
Main Voltage failed
battery
battery
Recti-fier
inverter The consumers are supplied via the filter from mains supply directly. No voltage and frequency regulation !
The consumers are supplied from the battery via the inverter after a switchover time of < 10ms.
Handbook (part 1) - 85 - Industrial Power, Application Engineering Edition 6, February 2012 Copyright – All Rights Reserved
• VI-Classification (Voltage Independent) This UPS-classification ensures a „Line-Interactive-Operation“.
VI – Classification (Line-Interactive Technology)
Netz
Netz
Fig. 56: Mode of operation at a VI-classification [29], with friendly approval of MGE (original German text translated by GNB Industrial Power)
Main Voltage failed
consumer
consumer
Main Voltage available Mains supply
Mains supply
The consumers are supplied via filter directly from mains supply directly. Voltage regulation is possible.
The consumers are supplied from the battery via the inverter after a switchover time of < 10ms.
Handbook (part 1) - 86 - Industrial Power, Application Engineering Edition 6, February 2012 Copyright – All Rights Reserved
• VFI-classification (Voltage and Frequency Independent ) This UPS-classification ensures a „Double-Conversion-Operation (Online)“.
VFI – Classification („Real“ Online – UPS System)
Netz
Netz
Fig. 57: Mode of operation at a VFI-Classification [29], with friendly approval of MGE (original German text translated by GNB Industrial Power) The VFI-class only is able to control all appearing supply net interruptions. The bridging times are in the range of 1 to 30 minutes predominantly. These times are sufficient either to start an alternative power aggregate, which will take over the load immediately after the synchronization of the voltage signal has been made, or the consumers will be closed controlled. The “state-of-art” of UPS-equipment is e.g. deep-discharge protection and battery monitoring. For UPS-equipment mostly VRLA-batteries are used today.
consumer
consumer
Main Voltage available
Main Voltage failed
Mains supply
Mains supply
The consume rs are supplied via the chain rectifier and inverter with accurate voltage and frequency. The battery is charged simultaneously.
The consumers are supplied from the battery via the rectifier. No switchover time. Inverse of energy direction only.
Handbook (part 1) - 87 - Industrial Power, Application Engineering Edition 6, February 2012 Copyright – All Rights Reserved
6.3 Energy Generation and Distribution 6.3.1 Energy Generation In conventional and nuclear power plants predominantly vented batteries are used. At interruption of the own power consumption batteries take over the safe operation. This are mainly the measurement, the control and the regulation equipment, the emergency lube-oil pumps of the generators, the protection equipment as well as the cooling of the power station until the load is taken over by a network replacement equipment, which will then fill the own power consumption. In nuclear power stations batteries are installed in earthquake and shock proofed racks. The batteries are designed for an autonomy of minimum 30 minutes. The commission of safety of the reactor (German abbreviation: RFK) recommends a bridging time of 2 to 3 hours. 6.3.2 Energy Distribution The energy distribution is carried out by the power supplying companies. In the leading main stations the batteries are taking over the controlling and monitoring of the transformer station and switchgear in case of a break down of the mains power supply. The function of the load regulation switches and load regulation breakers, which are necessary for the distribution of the energy, is also taken over uninterruptible by the batteries. 6.4 Safety Systems 6.4.1 Alarm and Fire Alarm Systems Alarm and fire alarm equipment is equipped with batteries which give power in case of burglaries if a mains failure or an interruption of the mains power happens. For both applications in more than 95% of all cases batteries with VdS-approvals are used (VdS = abbreviation for association of German property insurance). The bridging times in fire alarm systems are 72 hours, in the alarm equipment systems 60, 30 or 12 hours – depending on the object to be guarded.
Handbook (part 1) - 88 - Industrial Power, Application Engineering Edition 6, February 2012 Copyright – All Rights Reserved
The use of batteries with VdS-approval is required either from the insurance company or by the customer, because they regard this approval as a quality certification nowadays. GNB Industrial Power offers VRLA-batteries in Gel- as well as in AGM-technology with VdS-approval. 6.4.2 Safety Lightning 6.4.2.1 General In rooms, in which a personnel or economical damage might occur in case of failure of the light system, the legislator requires safety lightning in accordance with the standard EN 50171 [30]. The former German standard DIN VDE 0108, part 1 [31], is expired. Safety lightning is the lightning of rooms and rescue ways which will be also illuminated during the operational times if the mains supply net has a break down. The bridging times at mains failure must be 1 hour, 3 hours or 8 hours in accordance with official regulation. The standard EN 50171 [30] mentions the following to the batteries to be used: 6.12 Batteries 6.12.1 Batteries must correspond to one of the below mentioned announcement: EN 60285 Gas tight cylindrical rechargeable nickel-cadmium-single
cells EN 60622 Gas tight prismatic rechargeable nickel-cadmium-
single cells - Part 1: General requirements and test procedures
EN 60623 Vented nickel-cadmium-cells EN 60896-1 Stationary lead-acid batteries – General requirements and
test procedures – Part 1: Vented batteries (continued next page)
Handbook (part 1) - 89 - Industrial Power, Application Engineering Edition 6, February 2012 Copyright – All Rights Reserved
EN 60896-2 Stationary lead-acid batteries – General requirements and
test procedures – Part 2: Maintenance free valve-regulated lead-acid batteries
NOTE Other batteries can be taken under the prerequisite that they are in accordance with the applicable valid safety und performance standards. 6.12.2 Batteries for central power supply systems (CPS) must indicate a service life expectation of minimum 10 years at an ambient temperature of 20°C. Batteries for central power supply systems with power limitation (LPS) must indicate a service life expectation of minimum 5 years at an ambient temperature of 20°C. NOTE To achieve the required system performance at the end of the service life of the battery, the battery capacity should be dimensioned in accordance with the instructions of the manufacturer. 6.12.3 SLI (starter) batteries are not allowed to be used. The above quoted standards EN 60896-1 (IEC 896-1) respect. –2 are in the meantime replaced by IEC 60896-11 respect. –21 (see [32] respect. [5]). For the applicable stationary lead-acid batteries to be used the above mentioned statement means a larger latitude. 6.4.2.2 Application of the EN 50171 The standard EN 50171 [30] requires in regard of battery capacity: 6.12.4 The battery and the system must be configurated in that way, that they are in the position to fulfil the required system performance at the beginning, during and at the end of the indicated service life. NOTE 1: Normally batteries are calculated, that the indicated service life and the system performance are achieved at 20°C. For the correct dimensioning a capacity increase of 25% is taken into consideration for a new state of the battery to compensate the capacity
Handbook (part 1) - 90 - Industrial Power, Application Engineering Edition 6, February 2012 Copyright – All Rights Reserved
loss by natural ageing. This follows because of the fact that the end of the service life of a battery is defined with 80% of the nominal capacity. 6.4.2.3 Battery Manufacturer Instructions to the Calculated Operating Time The standard EN 50171 [30] requires: 6.11 Automated Test Equipment If persons are always present in a building and if during a test these persons are endangered or because the battery is discharges, a procedure should be applied with reduced risk. Examples are mentioned in 6.11.1 to 6.11.3. 6.11.1 The system must be equipped with two parallel batteries, to make it possible for the system to be tested in two halves in which every battery can support the lightning, while the other one is discharged. NOTE: This system makes it also possible to operate some lamps, while the battery is maintained or replaced. 6.11.2 The start of manual testing is possible under the prerequisite that a visible warning message is activated, if the testing has not been carried out during a 12 months period. 6.11.3 The test must be carried out over a duration of two third (2/3) of the calculated operation time. The system has to be checked automatically, that it was not discharged to a too low voltage, as calculated for two third (2/3) of the operational capacity, as by the battery manufacturer. The following table 17 shows the permissible voltage after 2 third of the calculated operation duration basing on 1h, 3h, 8h.
Handbook (part 1) - 91 - Industrial Power, Application Engineering Edition 6, February 2012 Copyright – All Rights Reserved
Calculated Operation Duration 1 h 3 h 8 h
Battery- Range U [Vpc] after 40 min U [Vpc] after 2h U [Vpc] after 5.3h
Table 17: Voltage criterion; end of discharge voltage 1.80 Vpc each time. 6.4.2.4 Recharging Conditions – Necessary Charging Currents Standard EN 50171 [30] requires: 6.2.3 Battery chargers must be able to recharge discharged batteries automatically in that way, that the batteries can provide minimum 80% of the defined operation duration after 12 h charging. At standby parallel operation, where the consumer is fed by the charger, the nominal output current of the charger must be minimum 110% of the sum of the calculated current given to the consumer and the current which is supplied to the battery. Test: Test to be carried out in accordance with 6.2.5. At a recharging voltage of 2.40 Vpc the charging currents mentioned in table 18 for vented and VRLA-battery ranges are necessary to fulfil the requirements of the standard.
Calculated Operation Duration 1 h
3 h 8 h
5 A/100 Ah
6 A/100 Ah 7 A/100 Ah
Table 18: Recharging currents for different calculated operation durations
Handbook (part 1) - 92 - Industrial Power, Application Engineering Edition 6, February 2012 Copyright – All Rights Reserved
6.4.2.5 Additional Safety Power Supply in Hospitals For the power supply in hospitals the relevant German standard DIN VDE 0107 [33] has been replaced. In chapter „710.562 power sources“ of the IEC 60364-7-710 [34] just the hint is given with the reference to EN 50272-2 [6], that primary galvanic cells as safety current sources are not allowed. A more detailed specification to battery ranges is not made. The German standard DIN VDE 0558-507 [35] demands vented or valve-regulated batteries with a substantiated service life of at least 12 years at 20 °C. Car starter batteries and gas-tight NiCd sin gle cells are not allowed. According to „710.562.5 Capacity and supply duration of security power supply„ of IEC 60364-7-710 [34] a supply of minimum 24 hours must be granted. Under certain conditions the supply duration can be cut-rated to 3 hours. 6.5 Railway Systems 6.5.1 Signal Towers and Signal Installations The operation of signal towers and signal installations is ensured at break downs of the public or own mains power supply by battery supported UPS-equipment (see 6.2) and emergency power engines. 6.5.2 Rail Crossings Batteries for rail crossings are operating in buffering operation (see 3.2). Mostly a small rectifier is used, which is able to cover the loads of the railway gate movements and the lighting. The peak load is carried out by the battery, and the battery is charged during down times. 6.5.3 Rail Communication (GSM-R) With GSM-R (Global System for Mobile Communications Rail) a uniform, standardized and European wide working system platform arises, which will function in the future for the speach and radio data transmission of the rail.
Handbook (part 1) - 93 - Industrial Power, Application Engineering Edition 6, February 2012 Copyright – All Rights Reserved
It has to be specially remarked, that this is not a railway specific development, but a proven technique, which is based on the specification of the ETSI (European Standardization Committee for Telecommunication), which is also the basis for the world wide used GSM-Standard. This means a multitude of BTS (Base Transceiver Station), BSC (Base Station Controller) and Repeater-Stations along of approximately 36 000 km railway line (see 6.1.2). The used batteries are the valve –regulated lead-acid (VRLA) front terminal batteries (AGM and GeL), OPzV-cells and also Gel-block batteries, which are connected together as 48V-units. 6.5.4 Trains In passenger coaches and in all public means of transport the lightning, air conditioning and all electrical safety systems are fed by batteries in case of mains power loss. In this application mostly traction batteries are used, as this applications is determined by the classical cycling application, because during every uncoupling of the locomotive the train light is supplied by the battery. In modern trains the battery is supplying in case of service everything, the light, the air conditioning up to the electrical door opener. 6.6 Photovoltaic (Solar) Solar energy is converted via solar moduls (Panels) in electrical energy. The immediate use is during the day possible only depending on the intensity of the sun and the performance of the modules. Lead-acid batteries are used, if the produced electrical energy shall be stored, to use it during any other time, e.g. during the evening or during the nights. During the days the batteries are recharged. It is a typical cycling operation. If necessary, the batteries have to deliver current for several days. Therefore the nominal capacities are related to 100 respectively internationally soon to 120 hours (C100, C120). The achievable number of cycles is depending on the battery type. With grid plate types already several hundreds of cycles in accordance with IEC
Handbook (part 1) - 94 - Industrial Power, Application Engineering Edition 6, February 2012 Copyright – All Rights Reserved
60896-11 [32] respectively IEC 896-2 [4] are possible (60% depth of discharge, 20° C), and with tubular plate types mor e than 1000 cycles can be achieved. An additional criterion is the capacity, which in connection with the number of cells determines the efficiency of the equipment. The field of application is therefore graded as follows: • Simple, small photovoltaic equipment, e.g. in weekend respectively
holiday cottages, for parking bill machines or emergency telephones. • Equipment for the medium power area, e.g. for small industrial
photovoltaic equipment, sea buoys and measuring stations. • Equipments with high power and a strong cycling stress, e.g. for island
systems without own mains power supply and high consumption, photovoltaic and wind power stations.
6.7 Medical Application In principle three different applications have to be seen: • Pure standby parallel operation (see 3.1) • Semi-cycling operation • Pure cycling operation (see 3.4) Critical appliances as for example automatic respiration appliances have batteries, which ensure for a certain time the patient care as very last safety. Appliances like infusion and diet pumps, as well as hospital beds have to be seen as semi-cycling applications, because the feeding is carried out either by the mains power supply or in mobile operation by batteries. The function of infusion and diet pumps is ensured by the battery during the transport of the bed and if the patient is at the ward by the mains power supply. The last application class is a pure cyclic use of the appliance. The discharge takes place always without mains power supply. Recharging takes place only if the appliance is not used. These are, for example, operating tables and electrical wheel chairs.
Handbook (part 1) - 95 - Industrial Power, Application Engineering Edition 6, February 2012 Copyright – All Rights Reserved
7. References
[1] IEC 60050-482, „International electro-technical dictionary, part 482”, April 2004
[3] H. Kirchner, „Bleibatterien, Kapitel: Wirkungsweise“, Draft, Soest, March 2004
[4] IEC 896-2, „Stationary lead-acid batteries – General requirements and methods of test - Part 2”, November 1995
[5] IEC 60896-21, „Stationary lead-acid batteries – Part 21: Valve regulated types – Methods of test”, December 2004
[6] EN 50272-2, “Safety requirements fo secondary batteries and battery installations – Part 2: Stationary batteries”, June 2001
[7] D. Berndt, „Maintenance –Free Batteries”, Second Edition, Research Studies Press Ltd., Taunton, Somerset, England, 1997
[8] D. Berndt et al, „Verschlossene stationäre Bleibatterien von VARTA“, VARTA spezial report 3/1990, p. 1949 - 1987
[9] A. Jossen, „Ladeverfahren II und Batteriemanagement“, OTTI-forum, Ulm, May 2005
[10] ZVEI information leaflet “Definition of different life time terms for batteries”, November 2010
[11] UL 94, “Tests for Flammability of Plastic Materials for Parts in Devices and Appliances”, December 2003
[12] UL 924, “Emergency Lighting and Power Equipment”, January 2004
[13] German standard DIN VDE 0298 – 4, „Application of cables and cords in power installations – Part 4: Recommended current-carrying capacity for sheathed and nonsheathed cables for fixing wirings in and around
Handbook (part 1) - 96 - Industrial Power, Application Engineering Edition 6, February 2012 Copyright – All Rights Reserved
buildings and for flexible cables and cords“, August 2003, available in German language only
[14] W. Rudolph †, „Einführung in die DIN VDE 0100“, VDE-Verlag, 1999
[15] HD 22.4 S4:2004, “Cables of rated voltages up to and including 450/750 V and having crosslinked insulation – Part 4: Cords and flexible cables”, 2004
[16] German standard DIN VDE 0250, part 602 „Cables, wires and flexible cords for power installation; special rubber-insulated single-core cables“, March 1985, available in German language only
[17] HD 384.5.52 S1:1995 + A1:1998 (IEC 60364-5-52:1993, modified), „Erection of low voltage installations; Part 5: Selection and erection of electrical equipment; Chapter 52: Wiring systems”, 1993 and 1998
[18] German standard DIN VDE 0298-3 (VDE 0298 part 3), „Application of cables and cords in power installations – Part 3: Guide to use of non-harmonized cables“, June 2006, available in German language only
[19] HD 516 S2:1997 + A1:2003, “Application of cables and cords in power installations – Part 300: Guide to use of low voltage harmonized cables”, 1997 and 2003
[20] H. A. Kiehne, „Batterien“, edition 4, Expert-Verlag, Renningen, 2000
[21] IEC 60896-22, “Stationary lead-acid batteries – Part 22: Valve regulated types – Requirements”, February 2004
[22] IEC 61056-1, “General purpose lead-acid batteries (valve-regulated types) – Part 1: General requirements, functional characteristics – Methods of test”, October 2002
[23] General Electric, „The Sealed Lead Battery Handbook“, Gainesville FL, USA, 1979
Handbook (part 1) - 97 - Industrial Power, Application Engineering Edition 6, February 2012 Copyright – All Rights Reserved
[25] German standard DIN 40729, „Accumulators – Galvanic secondary cells – General terms and definitions“, May 1985, available in German language only
[26] German standard DIN 41772, „Static power converters – Semiconductor rectifier equipment – Shapes and letter symbols of characteristic curves”, February 1979, available in German language only
[27] IEC 62040-1-1:2002 + corrigendum 2002, „Uninterruptible power systems (UPS) – Part 1-1: General and safety requirements for UPS used in operator access areas” 2002
[28] IEC 62040-3:1999, modified, „Uninterruptible power systems (UPS) – Part 3: Method of specifying the performance and test requirements“, 1999
[29] Merlin Gerin (MGE), Presentation „Sicherheit und Verfügbarkeit von sensiblen Anwendungen“, July 2003
[30] EN 50171:2001 + Corrigendum 2001-08, „Central power sypply systems“, 2001
[31] German standard DIN VDE 0108 part 1, „Power installation and safety power supply in communal facilities - General“, October 1989, available in German language only
[32] IEC 60896-11, „Stationary lead-acid batteries – Part 11: Vented types – General requirements and methods of test”, December 2002
[33] German standard DIN VDE 0107, „Electrical installations in hospitals and locations for medical use outside hospitals“, October 1994, available in German language only
[34] IEC 60364-7-710:2002, modified, „Erection of low voltage installations – Requirements for special installations or locations – Part 710: medical locations“, 2002
[35] German standard DIN VDE 0558-507, “Battery based central safety power supply systems for medical electrical equipment”, December 2008
Handbook (part 1) - 98 - Industrial Power, Application Engineering Edition 6, February 2012 Copyright – All Rights Reserved
Important Notice: The manufacturer of batteries “GNB Industrial Power” does not take over responsibility for any loyalties resulting from this paper or resulting from changes in the mentioned standards, neither for any different national standards which may exist and has to be followed by the installer, planner or architect. EXIDE Technologies GmbH Im Thiergarten 63654 Büdingen-Germany Tel.: + 49 (0) 60 42 - 81 544 Fax: + 49 (0) 60 42 - 81 398 www.gnb.com