607
Handbook of Biomaterial Properties

Handbook of Biomaterial Properties

Handbook of Biomaterial Properties
Edited by
Jonathan Black Professor Emeritus of Bioengineering
Clemson University USA
and
Garth Hastings Professor and Director of the Biomaterials Programme
Institute of Materials Research and Engineering National University of Singapore
[U!11 SPRINGER-SCIENCE+BUSINESS MEDIA, B.V.

First edition 1998
© 1998 Springer Science+Business Media Dordrecht Originally published by Chapman & Hall in 1998 Softcover reprint of the hardcover 1st edition 1998
Thomson Science is a division of International Thomson Publishing
Typeset in 10/12 pt Times by Florencetype Ltd, Stoodleigh, Devon
ISBN 978-0-412-60330-3 ISBN 978-1-4615-5801-9 (eBook) DOI 10.1007/978-1-4615-5801-9
All rights reserved. No part of this publication may be reproduced, stored in a retrieval system or transmitted in any form or by any means, electronic, mechanical, photocopying, recording or otherwise, without the prior written permission of the publishers. Applications for permission should be addresed to the rights manager at the London address of the publisher.
The publisher makes no representation, express or implied, with regard to the accuracy of the information contained in this book and cannot accept any legal responsibility or liability for any errors or omissions that may be made.
A catalogue record for this book is available from the British Library

Contents
Foreword xiii Introduction xv Contributors xviii
PART I
A1 Cortical bone 3 f Currey ALl Composition 3 A1.2 Physical properties 4 A1.3 Mechanical properties 5 Additional reading 12 References 12
A2 Cancellous bone 15 TM. Keaveney A2.1 Structure 16 A2.2 Composition 16 A2.3 Mechanical properties 16 Additional reading 21 References 21
A3 Dentin and enamel 24 K.E. Healy A3.1 Introduction 24 A3.2 Composition 25 A3.3 Final comments 35 Additional reading 36 References 37
B1 Cartilage 40 f.R. Parsons B1.1 Introduction 40 B1.2 Composition 41 B 1.3 Mechanical properties of articular cartilage 41

vi I I CONTENTS
B1.4 Fibrocartilage mechanical properties 45 B 1.5 Elastic cartilage mechanical properties 45 Additional reading 45 References 46
B2 Fibrocartilage 48 V.M. Gharpuray B2.1 Introduction 48 B2.2 Structure and composition 48 B2.3 Hydraulic permeability and drag coefficients 51 B2.4 Elastic properties 51 B2.5 Viscoelastic behaviour 53 B2.6 Discussion 54 Additional reading 55 References 56
B3 Ligament, tendon and fascia 59 S.L.-Y. Woo and R.E. Levine B3.1 Introduction 59 B3.2 Discussion 62 Additional reading 62 References 63
B4 Skin and muscle 66 A.F.T. Mak and M. Zhang B4.1 Introduction 66 B4.2 In vivo mechanical properties 66 Additional reading 68 References 69
B5 Brain tissues 70 S.S. Margulies and D.F. Meaney B5.1 Introduction 70 B5.2 Composition 71 B5.3 Mechanical properties 72 B5.4 Electrical properties (no primate data available) 77 B5.5 Thermal properties 77 B5.6 Diffusion properties 77 B5.7 Comments 78 Additional reading 78 References 79
B6 Arteries, veins and lymphatic vessels 81 X. Deng and R. Guidoin B6.1 Introduction 81 B6.2 Morphometry of the arterial tree and venous system 82 B6.3 Constituents of the arterial wall 82 B6.4 Constituents of the venous wall 88 B6.5 Mechanical properties of arteries 88
CONTENTS I I vii
B6.6 Mechanical properties of veins 96 B6.7 Mechanical characteristics of lymphatic vessels 98 B6.8 Transport properties of blood vessels 98 B6.9 Effect of age, hypertension and atherosclerosis
on blood vessels 99 B6.10 Final comments 100 Acknowledgement 101 Additional reading 101 References 102
B7 The intraocular lens 106 T. V. Chirila B7.1 Introduction 106 B7.2 Chemical composition 107 B7.3 Dimensions and optical properties 109 Additional reading 112 References 112
Cl Blood and related Ooids 114 V. Turitto and S.M. Slack C1.1 Introduction 114 Additional reading 123 References 123
C2 The vitreous humour U5 T. V. Chirila and Y. Hong C2.1 Introduction 125 C2.2 General properties 126 C2.3 Mechanical properties 129 Additional reading 129 References 130
PARTD
1 Metallic biomaterials 135 J. Breme and V. Biehl 1.1 Introduction 135 1.2 General discussion 137 References 143
la Stainless steels 145 1a.1 Composition 145 1a.2 Physical properties 150 1a.3 Processing of stainless steels 151 1a.4 Mechanical properties 157 1a.5 Fatigue 161 1a.6 Corrosion and wear 163 1a.7 Biological properties 165 References 165

Vlll I I'-----___________ C_O_N_T_E_N_T_S ___________ -----'
1b CoCr-based alloys 167 1b.1 Composition 167 1b.2 Physical properties 169 1b.3 Processing of CoCr-alloys 169 1bA Mechanical properties 173 1b.5 Fatigue 174 1b.6 Corrosion and wear 175 1 b.7 Biological properties 177 References 178
1e Titanium and titanium alloys 179 1c.1 Composition 179 1c.2 Physical properties 180 1c.3 Processing of cp-Ti and Ti alloys 181 1cA Mechanical properties 186 1c.5 Fatigue 189 1c.6 Corrosion and wear 194 1c.7 Biological properties 197 1c.8 TiNi-shape memory 198 References 198
1d Dental restoration materials 201 1d.1 Amalgams 201 1d.2 Noble metals 204 1d.3 CoCr-alloys 212 1dA NiCr-alloys 212 References 213
2 Composite materials 214 L. Ambrosio, G. Carotenuto and L. Nicolais 2.1 Types of composites and component materials 214 2.2 Fibre types and properties 214 2.3 Matrix materials 219 204 Thermoplastic matrix 219 2.5 Thermosets matrix 220 2.6 Vinyl ester resins 221 2.7 Epoxide resins 221 2.8 Diluents 222 2.9 Curing agents for epoxide resins 222 2.10 Polyester resins 224 2.11 Laminate properties 225 2.12 Composite fabrication 229 2.13 Mechanical properties 240 2.14 Antioxidants and effect of environmental exposure 254 2.15 The radiation stability of commercial materials 256 2.16 Polymers aging 259 2.17 Composite materials in medicine 260

CONTENTS I I ix
2.18 Metal matrix composites 262 2.19 Ceramic matrix composites 266 References 269
3 Thermoplastic polymers in biomedical applications: structures, properties and processing 270 S.H. Teoh, Z.C. Tang and C. W. Hastings 3.1 Introduction 270 3.2 Polyethylene 272 3.3 Polypropylene 273 3.4 Polyurethane 274 3.5 Polytetraftuoroethylene 275 3.6 Polyvinylchloride 276 3.7 Polyamides 277 3.8 Polyacrylates 278 3.9 Polyacetal 279 3.10 Polycarbonate 280 3.11 Polyethylene terephthalate 281 3.12 Polyetheretherketone 282 3.13 Polysulfone 283 References 300
4 Biomedical elastomers 302 ]. W. Boretos and ].Boretos 4.1 Introduction 302 4.2 Types of elastomers 303 4.3 Establishing equivalence 334 4.4 Sterilization of elastomers 338 4.5 Relevant ASTM Standards 338 4.6 Biocompatibility 338 4.7 Sources 338
5 Oxide bioceramics: inert ceramic materials in medicine and dentistry 340 ]. Li and C. W. Hastings 5.1 Introduction 340 5.2 Short history 340 5.3 Material properties and processing 342 5.4 Biocompatibility of oxide bioceramics 348 5.5 Applications 351 5.6 Manufacturers and their implant products 352 5.7 Problems and future prospects 352 References 352
6 Properties of bioactive glasses and glass-ceramics 355 L.L. Hench and T. Kokubo 6.1 Bioactive bonding 355 6.2 Bioactive compositions 357

x I I CONTENTS
6.3 Physical properties 358 References 362
7 Wear 364 M. LaBerge 7.1 Introduction 364 7.2 In vitro wear testing 369 7.3 Clinical wear 393 7.4 Combined wear and fatigue 393 7.5 Solving the wear problem 394 7.6 Conclusion 395 Acknowledgements 399 Additional reading 399 References 400
8 Degradation/resorption in bioactive ceramics in orthopaedics 406 H. Oonishi and H. Oomamiuda 8.1 Introduction 406 8.2 In vitro physico-chemical dissolution processes 407 8.3 In vivo/in vitro biological degradation processes 410 8.4 Summary 417 References 417
9 Corrosion of metallic implants 420 M.A. Barbosa 9.1 General aspects 420 9.2 Aspects related to the metal composition 423 9.3 Aspects related to the physiological environment 429 9.4 Aspects related to the oxide and other surface layers 436 References 458
10 Carbons 464 A.D. Haubold, R.B. More and J.e. Bokros 10.1 Introduction 464 10.2 Historical overview - in vivo applications 472 10.3 New directions/future trends 474 References 475
PART 01
1 General concepts of biocompatibility 481 D.F. Williams 1.1 Introduction 481 1.2 The definition of biocompatibility 482 1.3 Components of biocompatibility 484 1.4 Conclusions 488 Additional reading 488 References 489

CONTENTS I I xi
2 Soft tissue response 490 1.M. Anderson 2.1 Introduction 490 2.2 Types of response 490 2.3 Inflammation 492 2.4 Wound healing and fibrosis 494 2.5 Repair of implant sites 495 2.6 Summary 496 Additional reading 497 References 498
3 Hard tissue response 500 T. Albrektsson 3.1 Introduction 500 3.2 Fixation by cementation 500 3.3 Fixation by ingrowth (cement-free implants in bone) 503 3.4 Osseointegration 504 3.5 How bone-biomaterial interfaces fail 507 3.6 Conclusions 508 Additional reading 510 References 510
4 Immune response 513 K. Merritt 4.1 Introduction 513 4.2 Overview of the specific immune response 513 4.3 Detection of antibody 515 4.4 Detection of cell mediated responses (Type IV) 517 4.5 Detection of immune responses to haptens 521 4.6 Human immune response to materials 521 4.7 Consequences of an immune response 523 4.8 Conclusions 524 Additional reading 525
5 Cancer 529 M. Rock 5.1 Introduction 529 5.2 Release and distribution of degradation products 530 5.3 Neoplasia 531 5.4 Evidence for carcinogenicity of implanted
materials 532 5.5 Case reports of implant related tumors 533 5.6 Critical analysis of tumors 536 5.7 Significance of clinical reports 538 5.8 Summary 539 Additional reading 540 References 541

xii I I CONTENTS
6 Blood-material interactions 545 S.R. Hanson 6.1 Introduction 545 6.2 Experimental difficulties 545 6.3 Conventional polymers 548 6.4 Hydrophylic polymers 548 6.5 Metals 549 6.6 Carbons 550 6.7 Ultra-thin film coatings 550 6.8 Membranes 550 6.9 Biological surfaces 551 6.10 Surface texture 551 6.11 Conclusion 552 Additional reading 552 References 553
7 Soft tissue response to silicones 556 S. E. Gabriel 7.1 Silicones used in medicine 556 7.2 Local immunologic reactions to silicone 556 7.3 Systemic immunologic reactions to silicone 557 7.4 Evidence for causation 559 7.5 Controlled studies examining the relationship between
breast implants and connective tissue disease 563 References 567
Index 573

Foreword
Progress in the development of surgical implant materials has been hindered by the lack of basic information on the nature of the tissues, organs and systems being repaired or replaced. Materials' properties of living systems, whose study has been conducted largely under the rubric of tissue mechanics, has tended to be more descriptive than quantitative. In the early days of the modern surgical implant era, this deficiency was not critical. However, as implants continue to improve and both longer service life and higher reliability are sought, the inability to predict the behavior of implanted manufactured materials has revealed the relative lack of knowledge of the materials properties of the supporting or host system, either in health or disease. Such a situation is unacceptable in more conventional engineering practice: the success of new designs for aeronautical and marine applications depends exquisitely upon a detailed, disciplined and quantitative knowledge of service environments, including the properties of materials which will be encountered and interacted with. Thus the knowledge of the myriad physical properties of ocean ice makes possible the design and development of icebreakers without the need for trial and error. In contrast, the development period for a new surgical implant, incorporating new materials, may well exceed a decade and even then only short term performance predictions can be made.
Is it possible to construct an adequate data base of materials properties of both manufactured materials and biological tissues and fluids such that in vitro simulations can be used to validate future implant designs before in vivo service? While there are no apparent intellectual barriers to attaining such a goal, it clearly lies in the distant future, given the complexity of possible interactions between manufactured materials and living systems.
However, a great body of data has accumulated concerning the materials aspects of both implantable materials and natural tissues and fluids. Unfortunately, these data are broadly distributed in many forms of publication and have been gained from experimental observations of varying degrees of accuracy and precision. This is a situation very similar to that

xiv I LI ___________ F_O_RE_W_O_RD ___________ ---'
in general engineering in the early phases of the Industrial Revolution. The response then was the publication of engineering handbooks, drawing together, first in general publications and later in specialty versions, the known and accepted data of the time. In this spirit, we offer this Handbook of Biomaterial Properties.
Biomaterials, as manufactured for use in implants, do not exist usefully out of context with their applications. Thus, a material satisfactory in one application can be wholly unsuccessful in another. In this spirit, the Editors have given direction to the experts responsible for each part of this Handbook to consider not merely the intrinsic and interactive properties of biomaterials but also their appropriate (and in some cases inappropriate) applications as well as their historical context. It is hoped that the results will prove valuable, although in different ways, to the student, the researcher, the engineer and the practicing physician who uses implants.
A handbook like this necessarily becomes incomplete immediately upon publication, since it will be seen to contain errors of both omission and commission. Such has been the case with previous engineering handbooks: the problem can only be dealt with by providing new, revised editions. The Editors would appreciate any contributions and/or criticisms which the users of this handbook may make and promise to take account of them in future revisions.

Introduction
It is a feature of any developing science and its accompanying technology that information relating to different aspects is scattered throughout the relevant, and sometimes not so relevant literature. As the subject becomes more mature, a body of information can be categorized and brought together for the use of practitioners. In providing this Handbook of Biomaterial Properties the Editors believe that the latter stage has been reached in several parts of the vast field of biomaterials science and engineering.
Many of the properties of the synthetic materials have been available for some time, for example those of the various metallic alloys used in clinical practice have been specified in various International, European and National Standards and can be found by searching. In the case of polymeric materials, while the information is in commercial product literature and various proprietary handbooks, it is diverse by the nature of the wide range of materials commercially available and the search for it can be time consuming. The situation is much the same for ceramic and composite materials: there the challenge is finding the appropriate properties for the specific compositions and grades in use as biomaterials.
However, when information is sought for on materials properties of human tissues, the problem is more acute as such data are even more scattered and the methods for determination are not always stated or clearly defined. For the established worker this presents a major task. For the new researcher it may make establishing a project area a needlessly time consuming activity. The biomaterials bulletin boards (on the Internet) frequently display requests for help in finding characterization methods and/or reliable properties of natural materials, and sometimes the information is actually not available. Even when it is available, the original source of it is not always generally known.
In approaching their task, the Editors have tried to bring together into one source book the information that is available. To do this they have asked for the help of many colleagues worldwide to be contributors to the Handbook. It has not been possible to cover all the areas the Editors

xvi I LI ____________________ I_N_T_R_O_D __ U_CT __ I_O_N ____________________ ~
had hoped. Some topics could not be covered, or the information was judged to be too fragmentary or unreliable to make it worth including. This is inevitably the sort of project that will continue to be incomplete; however, new information will be provided as more experiments are done and as methods for measurement and analysis improve. The aim has been to make this Handbook a ready reference which will be consulted regularly by every technician, engineer and research worker in the fields of biomaterials and medical devices.
We have tried, not always successfully, to keep the textual content to a minimum, and emphasize tabular presentation of data. However, in some cases it has been decided to include more text in order to establish the background of materials properties and use and to point to critical features in processing or production which would guide the worker looking for new applications or new materials. For example, in polymer processing, the need to dry materials thoroughly before fabrication may not be understood by those less well versed in production techniques.
It is hoped that the Handbook will be used and useful, not perfect but a valuable contribution to a field that we believe has matured sufficiently to merit such a pUblication. The Handbook is divided into synthetic and natural materials and the treatment is different in each part. More background was felt to be needed for the synthetic materials since processing and structural variations have a profound effect on properties and performance. Biological performance of these materials depends on a range of chemical, physical and engineering properties and the physical form can also influence in vivo behavior. We have not attempted to deal with issues of biological performance, or biocompatibility, but have dealt with those other features of the materials which were felt to be relevant to them as potential biomaterials. Only materials having apparent clinical applications have been included.
The biological materials have more dynamic properties since, in vivo, they respond to physiological stimuli and may develop modified properties accordingly. The treatment of their properties has been limited to those determined by well characterized methods for human tissues, with a few exceptions where data on other species is deemed to be applicable and reliable. These properties determined almost totally in vitro may not be directly predictive of the performance of the living materials in vivo, but are a guide to the medical device designer who wishes to determine a device design specification. Such a designer often finds it hard to realize the complexity of the task of dealing with a non-engineering system. What really are the parameters needed in order to design an effectively functioning joint endoprosthesis or a heart valve? Do tissue properties measured post explantation assist? Is individual patient lifestyle an important factor? There is immediately a degree of uncertainty in such design processes, and total reliability in performance cannot be given a

'--__________ I_N_T_R_O_D_U_Cf_IO_N __________ -'1 I XVll
prospective guarantee. However, the more we learn about the materials and systems of the human body and their interaction with synthetic biomaterials, the closer we may perhaps become to the ideal 'menotic' or forgotten implant which remains in 'menosis' - close and settled union from the Greek J..LEVW - with the tissues in which it has been placed.
Three final comments: Although the Editors and contributors frequently refer to synthetic and,
in some cases, processed natural materials as 'biomaterials,' nothing herein should be taken as either an implied or explicit warrantee of the usefulness, safety or efficacy of any material or any grade or variation of any material in any medical device or surgical implant. Such determinations are an intrinsic part of the design, development, manufacture and clinical evaluation process for any device. Rather, the materials listed here should be considered, on the basis of their intrinsic properties and, in many cases, prior use, to be candidates to serve as biomaterials: possibly to become parts of successful devices to evaluate, direct, supplement, or replace the functions of living tissues.
The Editors earlier refer to absences of topics and of data for particular synthetic or natural materials. While this may be viewed, perhaps by reviewers and users alike, as a shortcoming of the Handbook, we view it as a virtue for two reasons:
• Where reliable data are available but were overlooked in this edition, we hope that potential contributors will come forward to volunteer their help for hoped for subsequent editions.
• Where reliable data are not available, we hope that their absence will prove both a guide and a stimulus for future investigators in biomaterials science and engineering.
The Editors, of course, welcome any comments and constructive criticism.
Professor Garth W. Hastings Institute of Materials Research & Engineering - IMRE, Block S7, Level 3, Room 17B, National University of Singapore, 10 Kent Ridge Crescent, Singapore 119260. Tel: +65 771 5249 Fax: +65 872 5373
Professor Emeritus Jonathan Black Principal: IMN Biomaterials 409 Dorothy Drive King of Prussia, PA 19406-2004, USA TelfFax: +1 610 265 6536
JB GWH

Contributors
COMMISSIONED BY J. BLACK:
T.O. Albrektsson University of Gothenburg Handicap Research, Institute for Surgical Sciences Medicinaregatan 8 Gothenburg S-413 90, Sweden
J .M. Anderson University Hospitals of Cleveland Department of Pathology Case Western Reserve University 2074 Abington Road Cleveland, OH 44106-2622, USA
T.V. Chirila Lions Eye Institute 2 Verdun Street, Block A, 2nd Floor Nedlands, W. Australia 6009
Professor J.D. Currey Department of Biology York University York YOl 5DD, United Kingdom
X. Deng Laboratorie de Chirugie Exp Agriculture Services Room 1701 Services Building Universite Laval Quebec G 1K 7P4, Canada

'---_________ C_O_N_T_R_IB_V_T_O_R_S _________ --'I I xix
S.E. Gabriel Division of Rheumatology Mayo Clinic 200 First Street Southwest Rochester, MN 55905, USA
V.M. Gharpuray Department of Bioengineering 401 Rhodes Eng. Res. Ctr. Clemson University Clemson, SC 29634-0905, USA
R. Guidoin Laboratorie de Chirugie Exp Agriculture Services Room 1701 Services Building Universite Laval Quebec G1K 7P4, Canada
S.R. Hanson Division of Hematology/Oncology PO Box AJ Emory University Atlanta, GA 30322, USA
K.E. Healy Department of Biological Materials Northwestern University 311 E. Chicago Ave. Chicago, IL 60611-3008, USA
Y. Hong Lions Eye Institute 2 Verdun Street, Block A, 2nd Floor Nedlands, W. Australia 6009
T.M. Keaveny Department of Mechanical Engineering Etcheverry Hall University of California at Berkeley Berkeley, CA 94720, USA

~ I ~I ___________________ C_O __ NT __ R_IB_U __ T_O_R_S __________________ ~
R.E. Levine Musculoskeletal Research Centre University of Pittsburgh 1011 Liliane S. Kaufmann Building 3741 Fifth Avenue Pittsburgh PA 15213, USA
Arthur K.T. Mak Rehabilitation Engineering Centre Hong Kong Polytechnic Hunghom, Kowloon, Hong Kong
S.S. Margules Department of Bioengineering 105D Hayden Hall University of Pennsylvania Philadelphia, PA 19104-6392, USA
D.F. Meaney Department of Bioengineering 105E Hayden Hall University of Pennsylvania Philadelphia, PA 19104-6392, USA
K. Merritt 17704 Stoneridge Dr. Gaithersburg, MD 20878, USA
Professor J.R. Parsons Orthopaedics-UMDNJ 185 South Orange A venue University Heights Newark, NJ 07103-2714, USA
M.G. Rock Department of Orthopaedics Mayo Clinic 200 First Street Southwest Rochester, MN 55905, USA
S.M. Slack Department of Biomedical Engineering University of Memphis, Campus Box 526582, Memphis, TN 38152-6502, USA

~ ___________________ C_O_N_T __ R_IB_U __ T_O_R_S __________________ ~I I xxi
v. Turitto Department of Biomedical Engineering University of Memphis Memphis, TN 38152, USA
Professor D.F. Williams Department of Clinical Engineering Royal Liverpool University Hospital PO Box 147 Liverpool L69 3BX, United Kingdom
S.L.-Y. Woo Musculoskeletal Research Center University of Pittsburgh 1011 Liliane S. Kaufmann Building 3741 Fifth Avenue Pittsburgh, PA 15213, USA
M. Zhang Rehabilitation Engineering Centre Hong Kong Polytechnic Hungham, Kowloon, Hong Kong
COMMISSIONED BY G.W. HASTINGS:
L. Ambrosio Department of Materials and Production Engineering University of Naples Federico II Institute of Composite Materials Technology CNR Piazzale Techio, 80 80125 Naples, Italy
M.A. Barbosa INEB-Ma Rua do Campo Alegre 823 4150 Porto, Portugal
V. Biehl Lehrstuhl fOr Metallische Werkstoff Universitat des Saarlandes Saarbriicken, Germany

xxii I LI ____________________ C_O __ N_T_R_IB __ U_T_O_R_S ____________________ ~
J.e. Bokros Medical Carbon Research Institute 8200 Cameron Road Suite A-196 Austin TX 78754-8323, USA
J.W. and S.J. Boretos Consultants for Biomaterials 6 Drake Court Rockville Maryland 20853, USA
H. Breme Lehrstuhl fUr Metallische Werkstoffe Universitat des Saarlandes Saarbriicken, Germany
G. Carotenuto Department of Materials and Production Engineering University of Naples Federico II Institute of Composite Materials Technology CNR Piazzale Technio, 80 80125 Naples, Italy
A.D. Haubold Medical Carbon Research Institute 8200 Cameron Road Suite A-196 Austin TX 78754-8323, USA
L. Hench Imperial College Department of Materials Prince Consort Road London SW7 2BP, United Kingdom
T. Kookubo Division of Material Chemistry Faculty of Engineering Kyoto University, Sakyo-ku, Kyoto 606-01, Japan

'----__________ C_O_N_T_R_IB_V_T_O_R_S __________ --'I I xxiii
M. LaBerge Associate Professor School of Chemical and Materials Engineering 401 Rhodes Research Center Clemson University, Clemson, SC 29634-0905, USA
P.J. Li Centre for Oral Biology Karolinska Institute Huddinge S 141-4, Sweden
R.B. More Medical Carbon Research Institute 8200 Cameron Road Suite A-196 Austin TX 78754-8323, USA
L. Nicolais Department of Materials and Production Engineering University of Naples Federico II Institute of Composite Materials Technology CNR Piazzale Technio, 80 80125 Naples, Italy
H. Oomamiuda Department of Orthapaedic Surgery Artificial Joint Section and Biomaterial Research Laboratory Osaka-Minami National Hospital 677-2 Kido-Cho, Kawachinagano-shi, Osaja, Japan
H.Oonishi Department of Orthopaedic Surgery Artificial Joint Section and Biomaterial Research Laboratory Osaka-Minami National Hospital 677-2 Kido-Cho, Kawachinagano-shi, Osaka, Japan
Z.G. Tang BIOMAT Centre National University of Singapore Singapore 119260

xxiv I I'--__________ C_O_N_T_R_IB_U_T_O_R_S _________ ----'
S.H. Teoh Institute of Materials Research & Engineering - IMRE Block S7, Level 3, Room 17B National University of Singapore 10 Kent Ridge Crescent Singapore 119260

PART I

~ _____ c_o_r_tl_·c_a_l_b_on_e ______ ~1 IAII 1. Currey
Al.l COMPOSITION
Al.l.l Overall
The main constituents are the mineral hydroxyapatite, the fibrous protein collagen, and water. There is some non-collagenous organic material.
Highly mineralized bone (petrosal bones of some non-human mammals) has little organic material (8% in the horse petrosal to 3% in the tympanic bulla) [3]. (Almost certainly human ear bones will be somewhere near or in this region, though they seem not to have been studied.)
Al.l.2 Organic
The main organic component is collagen. Most is Type I, but there are small amounts of Type III and Type VI, found in restricted locations [4]. Slowly heated collagen shrinks at a particular temperature, giving an indication of the stability of the molecules. Bone collagen in men has a shrinkage temperature of about 61.5°-63.5°C up to the age of about 60, but about 60°C over that age. Bone from women showed much greater variability [5]. About 10% of the bone organic material is non-collagenous, mainly non-collagenous protein, NCP. The main ones are listed below. They have supposed functions that change rapidly.
• Osteocalcin (oq, or bone Gla protein (BGP) • Osteonectin (ON), or SPARC • Osteopontin (OPN) or secreted phosphoprotein I (SPPI) • Bone sialoprotein (BSP)
Handbook of Biomaterial Properties. Edited by J. Black and G. Hastings. Published in 1998 by Chapman & Hall, London. ISBN 0 412 60330 6.
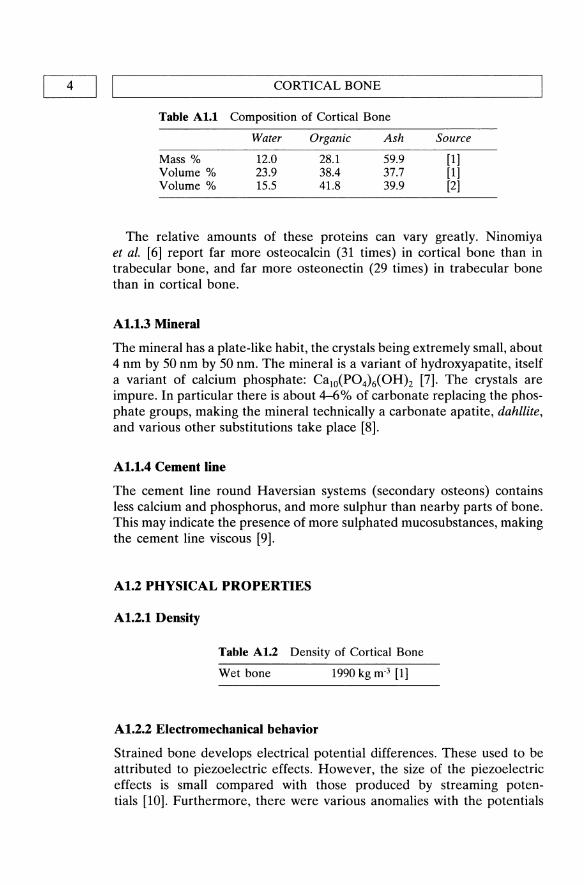
4 I I CORTICAL BONE
Table AI.I Composition of Cortical Bone
Water Organic Ash Source
Mass % 12.0 28.1 59.9 [1] Volume % 23.9 38.4 37.7 [1] Volume % 15.5 41.8 39.9 [2]
The relative amounts of these proteins can vary greatly. Ninomiya et al. [6] report far more osteocalcin (31 times) in cortical bone than in trabecular bone, and far more osteonectin (29 times) in trabecular bone than in cortical bone.
AI.I.3 Mineral
The mineral has a plate-like habit, the crystals being extremely small, about 4 nm by 50 nm by 50 nm. The mineral is a variant of hydroxyapatite, itself a variant of calcium phosphate: Ca lO(P04MOH}z [7]. The crystals are impure. In particular there is about 4-6% of carbonate replacing the phosphate groups, making the mineral technically a carbonate apatite, dahllite, and various other substitutions take place [8].
AI.I.4 Cement line
The cement line round Haversian systems (secondary osteons) contains less calcium and phosphorus, and more sulphur than nearby parts of bone. This may indicate the presence of more sulphated mucosubstances, making the cement line viscous [9].
AI.2 PHYSICAL PROPERTIES
AI.2.1 Density
Table AI.2 Density of Cortical Bone
Wet bone 1990 kg m·3 [1]
AI.2.2 Electromechanical behavior
Strained bone develops electrical potential differences. These used to be attributed to piezoelectric effects. However, the size of the piezoelectric effects is small compared with those produced by streaming potentials [10]. Furthermore, there were various anomalies with the potentials

L-______________ M_E_C_H __ A_N_I_C_A_L_P_R_O_P_E_R_T_I_E_S ______________ ~I ~I __ 5 __ ~
generated, which did not always accord with theory. The consensus now is that 'SGPs' (stress-generated potentials) are overwhelmingly caused by streaming potentials [10, 11]. Scott and Korostoff [12] determined, amongst other things, the relaxation time constants of the stress generated potentials, which varied greatly as a function of the conductivity and viscosity of the permeating fluid. As an example of their findings: a step-imposed loading moment which produced a peak strain of 4 x 10⁴
induced an SGP of 1.8 mY, yielding a value of the SGP/strain ratio of 4500 mY. The SGP decayed rapidly at constant strain, reaching zero within about one second. For more detail, the complex original paper must be consulted.
AI.2.3 Other Physical Properties
Behari [10] gives a useful general review of many 'solid state' properties of bone, both human and non-human, many of which are not dealt with here. These properties include the Hall effect, photo-electric effects, electron paramagnetic resonance effects and so on.
AI.3 MECHANICAL PROPERTIES
AI.3.I General
There is a great range for values III the literature for many reasons. Amongst these are:
(a) Different treatment of specimens
Drying bone and then re-wetting it produces some small differences [13], as does formalin fixation [14]. Testing bone dry produces results quite different from those in wet bone; dry bone is stiffer, stronger, and considerably more brittle. Very small samples produce values for stiffness and strength less than those from larger samples [15, 16]. High strain rates generally produce a higher modulus of elasticity, a higher strength [17], and a greater strain to failure than specimens tested at low strain rate.
(b) Different age and health of donors
Age may affect intrinsic properties. Osteoporotic bone may differ from 'normal' bone in ways other than the fact that it is more porous; there is evidence that the collagen is different from that in similaraged non-osteoporotic subjects [18]. Bone from osteogenesis imperfect a patients has a higher proportion of Type III and Type V collagen compared with Type I collagen, than bone from normal subjects [19].

6 I ~I _______________ C_O_R_T_IC_A_L_B_O_N_E ______________ ~
Bone collagen from osteopetrotic subjects is in general older than that from normal subjects, and has correspondingly different properties [5].
(c) Differences between bones, and sites in the bones
The ear bones (ossicles) and portions of the temporal bones (petrosa Is ) are highly mineralized, and will undoubtedly be stiffer and more brittle than others (though they seem not to have been investigated in humans). Long bones differ along their length and around their circumference. The distal femur is less highly mineralized and weaker in tensile and compressive static loading, and at any level the posterior part is similarly less mineralized and weaker [20].
The values reported below should be considered paradigmatic, that is, to be valid for a well-performed test on bone obtained from a middle aged person with no disease. Other values are reported in such a way as to make it clear how some property is a function of other features of the specimen.
Al.3.2 Stiffness
(a) General
There are two ways of testing bone: mechanically by relating stresses to strains; ultrasonically, by subjecting the bone to ultrasound and measuring the velocity of the sound. From a knowledge of the density one can then obtain a stiffness matrix. If this is inverted it becomes a compliance matrix, the reciprocal of the individual terms of which are equivalent to the socalled technical moduli derived by mechanical testing [21]. Reilly and Burstein [22] give mechanical values, and Ashman et al. [23] give ultrasonic measurements. Reilly and Burstein [22] assumed transverse isotropy (that is, symmetry around the longitudinal axis of the bone), while Ashman et al. [23] assumed orthotropy (that is, that the values for stiffness could be different in the longitudinal, radial and tangential directions).
Reilly and Burstein [22] give values for Young's modulus at a number of intermediate angular orientations, but they do not form a very uniform set.
(b) Tensile modulus versus compressive modulus
Reilly et al. [24] tested femoral specimens specifically to determine whether the value for Young's modulus was different in tension and compression. A paired Student's 't' test showed no significant difference between the compressive and tensile moduli at the 95% confidence level. Calculations on their data show the the 95% confidence interval ranged

~ ______________ M_E_C_H_A_N_I_C_A_L_P_R_O_P_E_R_T_I_E_S ______________ ~I I 7
Table Al.3 Mechanical Properties
Femur Tension [23J Femur Tension [22J Femur Compression [22J
Elastic moduli (GPa): E1 12.0 E2 13A E3 20.0 Shear moduli* (GPa): G 12 4.5 G13 5.6 G23 6.2 Poisson's ratios: V 12 0.38 V13 0.22 v 23 0.24 V21 OA2 V31 0.37 v32 0.35
12.8 12.8 17.7
3.3 3.3
0.53
0.53 0.41 0.41
11.7 11.7 18.2
0.63
0.63 0.38 0.38
Subscript 1: radial direction relative to the long axis of the bone, 2: tangential direction, 3: longitudinal direction. * Shear values are included under tension for convenience.
from compression modulus 1.72 GPa higher to tension modulus 0.27 GPa higher. The load-deformation traces showed no change of slope going from compression into tension and vice versa.
(c) Very small specimens
The bending modulus of very small specimens was 6.62 GPa [5].
(d) Locational variations: Metaphysis versus diaphysis
Young's modulus has been determined in three-point bending for extremely small plates (7 mm by 5 mm by (about) 0.3 mm) from the femoral metaphyseal shell and from the diaphysis of the same bones [16].
The differences between these values and those reported by Reilly and Burstein [22] are probably attributable not to the difference in testing mode, since bending and tension tests from the same bone generally give similar values for Young's modulus, but to the very small size of the specimen, and to the rather low density of the specimens.
Table Al.4 Locational Variations in Modulus
Location
Metaphysis Diaphysis
Longitudinal (GPa)
9.6 12.5
Transverse (GPa)
5.5 6.0
Source
[16] [16]

8 I LI __________________ C_O_R_T_I_C_A_L_B __ O_N_E ________________ ~
(e) Compression; effect of mineral
The compressive behavior of cubes, relating the properties to the density of the specimens gives, using Pa (fat-free mass divided by anatomical volume, g cm-3) as the explanatory variable:
Young's modulus (GPa) = 3.3p/A for compact bone [25]. The higher values of Pa were of the order of 1.8 g cm-3( =1800 kg m-3);
this equation [25] predicts a value of 13.5 GPa for such a specimen. Multiple regression analysis showed that the dependence of Young's modulus on density was caused by the effect of porosity on density, and that, in these specimens, the effect of mineral content was insignificant.
(f) Single secondary osteons
Ascenzi and co-workers [26-29] distinguish two types of secondary osteon: 'longitudinal' osteons, whose collagen fibres have a basically longitudinal orientation, and 'alternate' osteons, whose fibres have markedly different courses in neighboring lamellae. (This difference is a contentious issue.)
N.B.: These studies of Ascenzi and co-workers [26-29] are widely quoted, so beware of some apparent anomalies (apart from changes in nomenclature between papers). The bending modulus is remarkably low compared with the tension and compression moduli. The torsional (shear) modulus is remarkably high, compared both with the shear modulus values obtained by others (above), and with the tension and compression values. Torsional moduli are expected, on theoretical grounds, to be less than the tension and compression moduli. Furthermore, the large differences between the tension and compression moduli have not been reported elsewhere.]
(g) Strain rate effects
Calculations [30], incorporating data from non-human as well as human material, predict that Young's modulus is very modestly dependent upon strain rate:
E = 21402 (strain rate (S-I»0.050 MPa
Table At.S Moduli of Osteons
Modulus (GPa)
Tension Compression Bending Torsional*
Longitudinal Osteons
11.7 6.3 2.3
22.7
* Values for an 80-year-old man excluded.
'Alternate' Osteons
5.5 7.4 2.6 16.8
Source
[26] [27] [28] [29]

~ ______________ M_E_C __ H_A_N_I_C_A_L_P_R_O_P_E_R_T_I_E_S ______________ ~I 1~_9 __ ~ [N.B. statements about strain rate effects in bone are suspect unless it is clear that the workers have taken machine compliance into account!]
(h) Viscoelastic-damage properties
Viscoelastic time constant (the value T (s) in the equation):
E{t) = 131 exp[{to - t)h] + 132'
where the betas are parameters, t is time (s), to is time at which the specimen is held at a constant stress below the creep threshold: 6.1 s [31]. For reference, its value in bovine bone: 3.6 s.
Al.3.3 Strength
(a) Overall
Table AI.6 Strength of Cortical Bone [22]
Breaking Yield Ultimate Mode Orientation Strength (MPa) Stress (MPa) Strain
Tension Longitudinal 133 114 0.031 Tangential 52 0.007
Compression Longitudinal 205 Tangential 130
Shear 67
(b) Combined loading
Cezayirlioglu et al. [32] tested human bone under combined axial and torsional loading. The results are too complex to tabulate, but should be consulted by readers interested in complex loading phenomena.
(c) Metaphysis versus diaphysis
Same specimens as reported for modulus above (Table AlA) [16]. 'Tensile' strength calculated from the bending moment, using a 'rupture factor' to take account of the non-uniform distribution of strain in the specimen.
Table AI.7 Locational Variations in Strength
Location
Metaphysis Diaphysis
Longitudinal (MPa)
101 129
Transverse (MPa)
50 47
Source
[16] [16]

10 I LI __________________ C_O __ R_T_IC_A_L __ B_O_N_E __________________ ~
(d) Effect of mineral
Keller [25], using the same specimens as above, provides the following relationship:
Strength = 43.9p.z·o (MPa)
[N.B.: The effect of mineralization, as opposed to density, is possibly of importance here; the original paper must be consulted.]
(e) Single secondary osteons
The same nomenclature applies as for moduli of osteons (Table A1.5).
Table At.S Strength of Osteons
Strength (MPa) Longitudinal Osteons 'Alternate' Osteons Source
Tension Compression Bending Torsional *
120 110 390 202
* Values for an 80 year old man excluded.
102 134 348 167
[26] [27] [28] [29]
[N.B. The bending strengths and torsional strengths seem very high, even bearing in mind that no allowance has been made in bending for non-elastic effects.]
(f) Strain rate effects
Bone will bear a higher stress if it is loaded at a higher strain (or stress) rate. Carter and Caler [17] found an empirical relationship that failure stress (crf (MPa» was a function of either stress rate (0-) or strain rate (e.):
CT f = 87 0-°.053
CT f = 87 e.0.055
N.B. These relationships imply an increase of 44 % in the failure stress if the stress rate is increased one thousandfold. This relationship has been found to be roughly the same in other, non-human, mammals.
(g) Creep
Creep threshold (the stress below which no creep occurs): 73 MPa [31]. The equivalent value for bovine bone is 117 MPa [31]. Specimens in tension or compression were held at particular stresses [33]. The

L-______________ M_E_C_H_A_N_I_C_A_L_P_R_O_P_E_R_T_I_E_S ______________ ~I I 11
time (seconds) to failure is given as a function of normalized stress (stressNoung's modulus (MPa/MPa»:
Tension: Time to failure = 1.45 x 10-36 (normalized stress)-15.8
Compression:Time to failure = 4.07 x 10-37 (normalized stress)-17.8
(h) Fatigue
Some workers report the log of the number of cycles as a function of the applied stress levels, some report the log cycle number as a function of log stress levels, and some report log stress levels as a function of log cycle number. [The last seems wrong, since the applied stress can hardly be a function of the number of cycles the specimen is going to bear, but it is frequently used in fatigue studies. It is not possible simply to reverse the dependent and independent axes because the equations are derived from regressions with associated uncertainty.] The variation between the results for different testing modes is considerable.
Carter et al. [34] report on the effect of Young's modulus of elasticity and porosity in their specimens. They find that Young's modulus is positively associated with fatigue life, and porosity is negatively associated:
log Nf = -2.05 log Ll(Jo
log Nf = -4.82 log Ll(Jo + 0.186 E
log Nf = -2.63 log Ll(Jo -0.061 P
log Nf = -4.73 log Ll(Jo +0.160 E -0.029 P
(S.E. 0.599)
(S.E. 0.387)
(S.E. 0.513)
(S.E. 0.363)
where Nf: number of cycles to failure; Ll(Jo: initial stress range (these experiments were carried out under strain control, so stress range decreased as damage spread and the specimens became more compliant); E: Young's modulus (GPa); P: porosity (%). Incorporating Young's modulus into the equation has a marked effect in reducing the standard error; porosity has a much less strong effect.
[N.B. Many workers normalize their data in an effort to reduce the effect that variations in Young's modulus have in increasing the scatter of the results.]
Choi and Goldstein [15] provide alternate, somewhat higher values.
(i) Effect of remodeling
Vincentelli and Grigorov [35] examined the effect of Haversian remodelling on the tibia. The specimens they reported were almost entirely primary or Haversian, with few specimens having a scattering of secondary osteons. [Unfortunately they probably (it is not clear) allowed their

12 I LI __________________ C_O __ R_T_IC_A_L __ B_O_N_E __________________ ~
specimens to dry out, so it is not sure that bone in vivo would show the same behavior. However, their results are similar to those found in nonhuman specimens.]
Table Al.9 Effect of Remodeling [35]
Property
Tensile Strength (MPa) Ultimate Strain Young's modulus (GPa)
Primary Osteons
162 0.026 19.7
ADDITIONAL READING
Haversian Osteons
133 0.022 18.0
Cowin, S.c. (ed.)(1989) Bone Mechanics Boca Raton: CRC Press. A more rigorous, less chatty and less biologically, oriented approach than the
following books by Currey and by Martin and Burr. The chapters on mechanics (2, 6 and 7), written by Cowin himself, are particularly authoritative.
Currey, J.D. (1984) The Mechanical Adaptation of Bones Princeton: University Press.
Out of print, new edition in preparation. Tries to deal with all aspects of mechanical properties of bone as a material and of whole bones. Not overly technical. Written from a general biological perspective, thus, does not concentrate on human material.
Martin, RB. and Burr, D.B. (1989) Structure, Function and Adaptation of Compact Bone New York: Raven Press.
There are not many values of mechanical properties here, but the treatment of the biology of bone, and of fatigue of bone tissue, is excellent and the discussion of remodeling, although now somewhat out of date, is a very good introduction to this intellectually taxing topic.
Nigg, B.M. and Herzog, W. (eds)(1994) Biomechanics of the Musculoskeletal System John Wiley: Chichester.
Deals with many aspects of biomechanics, including locomotion, with an emphasis on human material. There is a full treatment of the measurement of many biomechanical properties.
REFERENCES
1. Gong, J.K., Arnold, J.S. and Cohn, S.H. (1964) Composition of trabecular and cortical bone. Anat. Rec., 149,325-331.
2. Biltz, RM. and Pellegrino, E.D. (1969) The chemical anatomy of bone I. A comparative study of bone composition in sixteen vertebrates. J. Bone Joint Surg., 51A, 456-466.
REFERENCES I I 13 L-____________________________________________________ ~
3. Lees, S. and Escoubes, M. (1987) Vapor pressure isotherms, composition and density of hyperdense bones of horse, whale and porpoise. Can. Tiss. Res., 16, 305-322.
4. Keene, D.R., Sakai, L.Y. and Burgeson, R.E. (1991) Human bone contains type III collagen, type VI collagen, and fibrillin: Type III collagen is present on specific fibers that may mediate attachment of tendons, ligaments, and periosteum to calcified bone cortex. J. Histochem. Cytochem., 39, 59-69.
5. Danielsen, C.C., Mosekilde, Li., Bollerslev, J. et al. (1994) Thermal stability of cortical bone collagen in relation to age in normal individuals and in individuals with osteopetrosis. Bone, 15,91-96.
6. Ninomiya, J.T., Tracy, R.P., Calore, J.D., et al. (1990) Heterogeneity of human bone. J. Bone Min. Res., 5, 933-938.
7. Lowenstam, H.A and Weiner, S. (1989) On Biomineralization, Oxford University Press, New York.
8. McConnell, D. (1962) The crystal structure of bone. Clin. Orthop. Rei. Res., 23,253-68.
9. Burr, D.B., SchafHer, M.B. and Frederickson, R.G. (1988) Composition of the cement line and its possible mechanical role as a local interface in human compact bone. J. Biomech., 21, 939-945.
10. Behari, J. (1991) Solid state bone behavior. Prog. Biophys. Mol. Bioi., 56,1-41. 11. Martin, R.B. and Burr, D.B. (1989) Structure, Function, and Adaptation of
Compact Bone, Raven Press, New York. 12. Scott, G.e. and Korostoff, E. (1990) Oscillatory and step response electro
mechanical phenomena in human and bovine bone. J. Biomech., 23, 127-143. 13. Currey, J.D. (1988) The effects of drying and re-wetting on some mechanical
properties of cortical bone. J. Biomech., 21, 439-441. 14. Sedlin, E.D. (1967) A rheological model for cortical bone. Acta Orthop. Scand.,
(Suppl. 83), 1-78. 15. Choi, K. and Goldstein, S.A (1992) A comparison of the fatigue behavior of
human trabecular and cortical bone tissue. J. Biomech., 25, 1371-1381. 16. Lotz, J.e., Gerhart, T.N. and Hayes, W.c. (1991) Mechanical properties of
metaphyseal bone in the proximal femur. J. Biomech., 24, 317-329. 17. Carter, D.R. and Caler, W.E. (1985) A cumulative damage model for bone
fracture. J. Orthop. Res., 3, 84-90. 18. Bailey, AJ., Wotton, S.F., Sims, T.1. et al. (1993) Biochemical changes in the
collagen of human osteoporotic bone matrix. Con. Tiss. Res., 29, 119-132. 19. Bateman, J.F., Chan, D., Mascara, T. et al. (1986) Collagen defects in lethal
perinatal osteogenesis imperfecta. Biochem. J., 240, 699-708. 20. Saito, S. (1983) (Distribution of the X-ray density, compressive and tensile
breaking strength in the human femoral shaft) Die Verteilung von Dichte, Druck und Festigkeit im menslichen Femurschaft. Anat. Anzeiger Jena, 154, 365-376.
21. Cowin, S.c. (1989) Bone Mechanics, CRC Press, Boca Raton. 22. Reilly, D.T. and Burstein, A.H. (1975) The elastic and ultimate properties of
compact bone tissue. J. Biomech., 8, 393-405. 23. Ashman, R.B., Cowin, S.e., Van Buskirk, W.e. et al. (1984) A continuous
wave technique for the measurement of the elastic properties of cortical bone. J. Biomech., 17, 349-361.

14 I IL __________________ C_O_R_T_I_C_A_L_B __ O_N_E ________________ ~ 24. Reilly, D.T. and Burstein, AH. (1974) The mechanical properties of cortical
bone. J. Bone Joint Surg., 56A, 1001-1022 25. Keller, T.S. (1994) Predicting the compressive mechanical behavior of bone.
J. Biomech., 27, 1159-1168. 26. Ascenzi, A and Bonucci, E. (1967) The tensile properties of single osteons.
Anat. Rec., 158,375-386. 27. Ascenzi, A and Bonucci, E. (1968) The compressive properties of single
osteons. Anat. Rec., 161, 377-391. 28. Ascenzi, A, Baschieri, P., and Benvenuti, A (1990) The bending properties
of single osteons. J. Biomech., 23, 763-771. 29. Ascenzi, A, Baschieri, P., and Benvenuti, A (1994) The torsional properties
of single selected osteons. J. Biomech., 27, 875-884. 30. Carter, D.R. and Caler, W.E. (1983) Cycle-dependent and time-dependent
bone fracture with repeated loading. J. Biomech. Eng., 105, 166-170. 31. Fondrk, M., Bahniuk, E., Davy, D.T. et al. (1988) Some viscoplastic charac
teristics of bovine and human cortical bone. J. Biomech., 21, 623-630. 32. Cezayirlioglu, H., Bahniuk, E., Davy, D.T. et al. (1985) Anisotropic yield
behavior of bone under combined axial force and torque. J. Biomech., 18, 61-69.
33. Caler, W.E. and Carter, D.R. (1989) Bone creep-fatigue damage accumulation J. Biomech., 22, 625-635.
34. Carter, D.R., Caler, W.E., Spengler, D.M. et at. (1981) Uniaxial fatigue of human bone. The influence of tissue physical characteristics. J. Biomech., 14, 461-70.
35. Vincentelli, R., and Grigorov, M. (1985) The effect of haversian remodeling on the tensile properties of human cortical bone. J. Biomech., 18,201-207.

~ ____ c_a_n_c_e_II_0U_S __ b_o_n_e ____ ~1 IA21 T.M. Keaveny
A2.1 STRUCTURE
Trabecular bone consists primarily of lamellar bone, arranged in packets that make up an interconnected irregular array of plates and rods, called trabeculae. These trabeculae, on average, have thicknesses in the range of 100-200 microns, dependent upon both anatomic site and donor age [1]. The space between trabeculae is filled with bone marrow, and the precise architectural arrangement of the trabecular plates and rods also depends on anatomic site, making trabecular bone (at the continuum level) a highly heterogeneous material. Most mechanical properties of trabecular bone depend to a large degree on the apparent density, defined as the product of the density of the individual trabeculae (the 'tissue density') and the volume fraction of bone present in the bulk specimen. Volume fraction typically ranges from 0.60 for dense trabecular bone to 0.05 for porous trabecular bone [2,3]. The (wet) tissue density for human trabecular bone is fairly constant and is in the approximate range 1.6-2.0 g/cm3 [4,5]. By contrast, the (wet) apparent density varies substantially and is typically in the range 0.05-1.0 g/cm3 (Table A2.1). Compared to cortical bone, trabecular bone has a similar surface area-to-volume ratio (SVR, excluding lacunae and canaliculi), but SVR increases non-linearly with increasing volume fraction (VF) of bone [10]:
SVR = 8.4 (VF)0705
Handbook of Biomaterial Properties. Edited by J. Black and G. Hastings. Published in 1998 by Chapman & Hall, London. ISBN 0412 60330 6.

16 I IL _________ C_A_N_C_E_L_L_O_U_S_B_O_N_E ________ -----'
A2.2 COMPOSITION
Individual trabeculae have relatively uniform compositions that are similar to cortical bone tissue (chapter AI), but are slightly less mineralized and slightly more hydrated than cortical tissue.
The percent volume of water, inorganic, and organic components for hydrated trabeculae have been reported at 27%, 38%, and 35%, respectively [11], although the precise values depend on anatomic site, age, and health. Based on reported wet, dry, and ash apparent densities for specimens of defatted human lumbar spine trabecular bone [4], the percentage weights of the inorganic, organic, and water components for this tissue can be calculated at approximately 54%, 26%, and 20%, respectively.
A2.3 MECHANICAL PROPERTIES
A2.3.1 Modulus and strength
Trabecular bone is essentially linearly elastic until yielding at strains of approximately 1-2%. After yielding, it can sustain large deformations (up to 50% strain) while still maintaining its load-carrying capacity. Thus, trabecular bone can absorb substantial energy upon mechanical failure. Being a heterogeneous open cell porous solid, trabecular bone has anisotropic mechanical properties that depend on the porosity of the specimen as well as the architectural arrangement of the individual trabeculae. In order to specify its mechanical properties, one must therefore specify factors such as the anatomic site, loading direction with respect to the principal orientation of the trabeculae, and age and health of the donor. Young's modulus can vary 100-fold within a single epiphysis (12] and can vary on average by a factor of three depending on loading direction [13-16]. Pathologies such as osteoporosis, osteoarthritis, and bone cancer are known to affect mechanical properties [17,18]. Typically, the modulus of human trabecular bone is in the range 0.010--2 GPa depending on the above factors. Strength, which is linearly and strongly correlated with modulus [12,15], is typically in the range 0.1-30 MPa.
A2.3.2 Relationships between modulus and strength and density
The relationships between the static mechanical properties of trabecular bone and apparent density vary for the different types of trabecular bone because of the anatomic site-, age-, and disease-related variations in trabecular architecture. Both linear and power-law relationships can be used to describe the dependence of modulus and compressive strength on apparent density (Tables A2.2, A2.3), with typical coefficients of determination (r2 values) in the range 0.5-0.9. Differences in the predictive

Tab
le A
2.1
Typ
ical
wet
app
aren
t de
nsit
ies,
mod
uli,
and
com
pres
sive
str
engt
hs f
or h
uman
tra
becu
lar
bone
Cad
aver
s Sp
ecim
ens
Wet
App
aren
t D
ensi
ty (
g/cm
3)
Mod
ulus
(G
Pa)
U
ltim
ate
Stre
ngth
(M
Pa)
Tiss
ue S
ourc
e N
umbe
r A
ges
Num
ber
Mea
n (S
D)
Ran
ge
Mea
n (S
D)
Ran
ge
Mea
n (S
D)
Ran
ge
Sour
ce
Pro
xim
al T
ibia
**
9 59
-S2
121
0.29
(0.
10)
0.09
-0.6
6 0.
445
(0.2
57)
0.06
1-1.
174
5.33
(2.
93)
0.6S
-14.
1 F
emur
t **
10
5S-S
3 29
9:1:
0.
50 (
0.16
) 0.
14-1
.00
0.3S
9 (0
.270
) 0.
044-
1.53
1 7.
36 (
4.00
) 0.
56-2
2.9
Lum
bar
Spin
e*
42
15-S
7 40
0.
24 (
0.07
) 0.
1l-D
.47
0.06
7 (0
.044
) 0.
01O
-D.IS
0 2.
45 (
1.52
) 1.
00-7
.00
Lum
bar
Spin
e**
3 71
-S4
231
0.19
(O
.OS)
0.
06-D
.40
0.02
3 (0
.015
) 0.
001-
D.l
l0
1.55
(1.
11)
0.05
-S.0
0
All
mec
hani
cal
data
fro
m t
ests
with
spe
cim
ens
orie
nted
in
the
infe
rior
-sup
erio
r di
rect
ion,
unl
ess
note
d.
* The
ash
den
siti
es t
hat
wer
e or
igin
ally
rep
orte
d ha
ve b
een
conv
erte
d to
wet
den
siti
es u
sing
Y =
1.86
X,
base
d on
dat
a fr
om T
able
1 [
4].
** T
he d
ry d
ensi
ties
tha
t w
ere
orig
inal
ly r
epor
ted
have
bee
n co
nver
ted
to w
et d
ensi
ties
usi
ng Y
= 1
.25
X,
base
d on
dat
a fr
om T
able
1 [
4].
t P
roxi
mal
and
dis
tal
fem
ur p
oole
d; p
roxi
mal
spe
cim
ens
orie
nted
app
roxi
mat
ely
alon
g th
e fe
mor
al n
eck
axis
. * E
last
ic m
odul
us d
ata
for
only
122
spe
cim
ens.
[6]
[7]
[S]
[9]

CANCELLOUS BONE
power between the various linear and power laws are usually negligible since the range of apparent density exhibited by trabecular bone is less than one order of magnitude. Poisson's ratio is difficult to measure experimentally for a heterogeneous, cellular solid such as trabecular bone. Mean values of Poisson's ratio have been reported from close to zero to just less than one [23-26], with little known about the causes of this large range. The failure (yield and ultimate) strains of human trabecular bone have only a weak dependence, if any, on apparent density and modulus [8,9,19,27,28]. Mean (± SD) values of ultimate compressive strain for proximal tibial bone have been reported at approximately 2.0±0.4% [6]. Additional experiments are currently required to investigate potential effects of anisotropy, age and anatomic site on failure strains. On average, the tensile and compressive strengths appear to be equal [29], although the relationship between the tensile and compressive failure properties is not well understood. Elastic properties are the same in tension and compression. No reliable data exist for multiaxial failure behavior although it is unlikely that a von Mises-type criterion applies to this heterogeneous cellular solid.
A2.3.3. Viscoelastic properties
Trabecular bone is only slightly viscoelastic when tested in vitro, with both compressive strength and modulus being related to strain rate raised to a power of 0.06 [30,31]. The stiffening effect of marrow is negligible except at very high strain rates (10 strain/sec), although there is emerging evidence that the constraining effects of an intact cortical shell may allow hydraulic stiffening of whole bones in vivo under dynamic loads [32]. Minor stress relaxation has been shown to occur [33] and depends on the applied strain level [34], indicating that human trabecular bone is nonlinearly viscoelastic. The rate of change of the stress relaxation function (i.e. the ratio of stress to constant strain during relaxation) versus time for human femoral bone (tissue) varies from approximately 6.8 MPa/s to 18 MPa/s as a function of strain level [34]. Little else is known about its time dependent properties, including creep and fatigue. As a result, most finite element analyses are based on the assumption that the mechanical behavior of cancellous bone has no time dependence.
A2.3.4. Experimental problems
It should be noted that the in vitro mechanical test methods most often used to date suffer from 'end artifacts' [35-37], errors due to platenspecimen friction and machining-related damage of the specimen ends, which compromise the accuracy of most of the data. Modulus values are underestimated by at least 20% [36-38], with the error possibly depending

Tab
le A
2.2
Lin
ear
and
pow
er-l
aw r
egre
ssio
ns b
etw
een
mod
ulus
(E
in
GP
a) a
nd w
et a
ppar
ent
dens
ity
(p i
n g/
cm3)
#
Cad
aver
s Sp
ecim
ens
E=
ap
+b
E
= a
ph
Tiss
ue S
ourc
e N
umbe
r A
ge
Num
ber
a b
f2 a
b f2
Sour
ce
Pro
xim
al T
ibia
* 9
59-8
2 12
1 1.
207
-0.0
797
0.60
1.
401
1.43
0.
66
[19]
P
roxi
mal
Tib
iat
3 52
-67
75
4.36
0 -0
.041
2 0.
86
4.60
6 1.
07
0.86
[2
0]
Pro
xim
al F
emu
rtt
4 25
-82
49
1.31
0 1.
40
0.91
[2
1]
Lum
bar
Spin
e**
3 70
-84
199
0.16
0 -0
.007
0.
54
0.47
9 1.
94
0.70
[2
2]
* C
ompr
essi
ve l
oadi
ng o
f hu
man
tra
becu
lar
bone
spe
cim
ens
load
ed a
t 'lo
w'
stra
in r
ates
(::;
1.0
/sec
) an
d ta
ken
from
a r
ange
of
anat
omic
site
s.
** O
rigi
nall
y re
port
ed d
ry d
ensi
ties
hav
e be
en c
onve
rted
to
wet
den
sitie
s.
t U
ltra
soun
d w
as u
sed
to m
easu
re t
he e
last
ic p
rope
rtie
s.
tt S
peci
men
s or
ient
ed a
long
fem
oral
nec
k ax
is.

Tab
le A
2.3
Lin
ear
and
pow
er-l
aw r
egre
ssio
ns b
etw
een
ulti
mat
e st
reng
th (
a i
n M
Pa)
and
wet
app
aren
t de
nsit
y (p
in
g/cm
3)#
Cad
aver
s Sp
ecim
ens
a =
ap
+ b
a
= a
ph
Tiss
ue S
ourc
e N
umbe
r A
ge
Num
ber
a b
r2 a
b r2
Sour
ce
Pro
xim
al T
ibia
* 10
60
-83
94
19.2
-1
.60
0.78
25
.6
1.60
0.
82
[19]
P
roxi
mal
Fem
urt
4
25-8
2 49
25
.0
1.80
0.
93
[21]
L
umba
r S
pine
**
3 70
-84
199
13.4
-0
.97
0.55
56
.9
2.30
0.
60
[22]
* F
or c
ompr
essi
ve l
oadi
ng o
f hu
man
tra
becu
lar
bone
spe
cim
ens
load
ed a
t 'lo
w'
stra
in r
ates
(:::;
1.0
/sec
) an
d ta
ken
from
a r
ange
of
anat
omic
site
s.
** O
rigi
nall
y re
port
ed d
ry d
ensi
ties
hav
e be
en c
onve
rted
to
wet
den
siti
es u
sing
y =
1.8
6x
t U
ltra
soun
d w
as u
sed
to m
easu
re t
he e
last
ic p
rope
rtie
s.
(Not
e: A
das
h re
pres
ents
tha
t no
dat
a w
ere
repo
rted
.)
REFERENCES I I 21 L-______________________________________________________ ~
on anatomic site from which the specimens are obtained. Similarly, strength values can also be in error [39], and failure strain data are also suspect [40] because of the confounding effect of the artifactual 'toe' [41] in the initial portion of the stress-strain curve. Thus, in vivo values of most of the above mechanical properties must be extrapolated carefully from the available in vitro data. Furthermore, inter-study comparisons of the in vitro data should address the confounding effects of these testing artifacts.
ADDmONAL READING
Cowin S.C. (1989) Bone Mechanics, CRC Press, Boca Raton. Presents an excellent treatment (p. 129ff) of the structure-function relationships
for trabecular bone using the principles of continuum mechanics and quantitative stereology.
Gibson L.J. (1985) The mechanical behavior of cancellous bone. J. Biomech., 18, 317-328.
Contains a theoretical analysis of some possible underlying deformation and failure mechanisms of individual trabeculae, based upon analogies to cellular solids.
Goldstein S.A. (1987) The mechanical properties of trabecular bone: Dependence on anatomic location and function. J. Biomech., 20, 1055-1061.
Keaveny T.M. and Hayes W.C. (1993) A 20-year perspective on the mechanical properties of trabecular bone. J. Biomech. Eng, 15, 534-542.
These comprehensive articles provide a more general survey of properties than presented above and include results derived from animal bone, as well as data on the mechanical behavior of individual trabeculae. In the absence of human data, data from animal studies can be used, although extrapolation of behavior from differing anatomic sites must be done with caution.
REFERENCES
1. Mosekilde, L. (1988) Age-related changes in vertebral trabecular bone architecture - Assessed by a new model. Bone, 9, 247-250.
2. Mosekilde, L., Bentzen, S.M., Ortoft, G. et al. (1989) The predictive value of quantitative computed tomography for vertebral body compressive strength and ash density. Bone, 10, 465-470.
3. Kuhn, J.L., Goldstein, S.A., Feldkamp, L.A. et al. (1990) Evaluation of a microcomputed tomography system to study trabecular bone structure. J. Orthop. Res., 8, 833-842.
4. Galante, J., Rostoker, W. and Ray, R.D. (1970) Physical properties of trabecular bone. Caldf. Tissue Res., 5, 236-246.
5. Ashman, R.B. and Rho, J.Y. (1988) Elastic modulus of trabecular bone material. J. Biomech., 21,177-181.
6. Linde, F., Hvid, I. and Pongsoipetch, B. (1989) Energy absorptive properties of human trabecular bone specimens during axial compression. J. Orthop. Res., 7,432-439

22 I LI _________________ C_A_N_C_E_L_L_O_U __ S_B_O_N_E ________________ ~ 7. Rohlmann, A, Zilch, H., Bergman, G. et al. (1980) Material properties of
femoral cancellous bone in axial loading. Part I: Time independent properties. Arch Orthop. Trauma Surg., 97, 95-102.
8 Mosekilde, L., Mosekilde, L. and Danielsen, e.e. (1987) Biomechanical competence of vertebral trabecular bone in relation to ash density and age in normal individuals. Bone, 8, 79-85.
9. Hansson, T.H., Keller, T.S. and Panjabi, M.M. (1987) A study of the compressive properties of lumbar vertebral trabeculae: effects of tissue characteristics. Spine, U, 56-62.
10. Fyhrie, D.P., Fazalari, N.L., Goulet, R et al. (1993) Direct calculation of the surface-to-volume ratio for human cancellous bone. J. Biomech., 26, 955-967.
11. Gong, 1.K., Arnold, 1.S. and Cohn, S.H. (1964) Composition of trabecular and cortical bone. Anat. Rec., 149, 325-332.
12. Goldstein, S.A, Wilson, D.L., Sonstegard, D.A et al. (1983) The mechanical properties of human tibial trabecular bone as a function of metaphyseal location. J. Biomech., 16, 965-969.
13. Townsend, P.R, Raux, P. and Rose, RM. (1975) The distribution and anisotropy of the stiffness of cancellous bone in the human patella. J. Biomech., 8, 363-367.
14. Linde, F., Pongsoipetch, B., Frich, L.H. et al. (1990) Three-axial strain controlled testing applied to bone specimens from the proximal tibial epiphysis. J. Biomech., 23, 1167-1172.
15. Ciarelli, M.J., Goldstein, S.A, Kuhn, 1.L. et al. (1991) Evaluation of orthogonal mechanical properties and density of human trabecular bone from the major metaphyseal regions with materials testing and computed tomography. J. Orthop. Res., 9, 674-682.
16. Goulet, RW., Goldstein, S.A, Ciarelli, M.J. et al. (1994) The relationship between the structural and orthogonal compressive properties of trabecular bone. J. Biomech., 27, 375-389.
17. Pugh, 1.W., Radin, E.L. and Rose, RM. (1974) Quantitative studies of human subchondral cancellous bone. Its relationship to the state of its overlying cartilage. J. Bone Joint Surg., 56A, 313-321.
18. Hipp, 1.A, Rosenberg, AE. and Hayes, W.e. (1992) Mechanical properties of trabecular bone within and adjacent to osseous metastases. J. Bone Miner. Res., 7,1165-1171.
19. Hvid, I., Bentzen, S.M., Linde, F. et al. (1989) X-ray quantitative computed tomography: The relations to physical properties of proximal tibial trabecular bone specimens. J. Biomech., 22, 837-844.
20. Ashman, RB., Rho, 1.Y. and Turner, e.H. (1989) Anatomical variation of orthotropic elastic moduli of the proximal human tibia. J. Biomech., 22, 895-900.
21. Lotz, l.e., Gerhart, T.N. and Hayes, W.e. (1990) Mechanical properties of trabecular bone from the proximal femur: A quantitative CT study. J. Comput. Assist. Tomogr., 14, 107-114.
22. Keller, T.S. (1994) Predicting the compressive mechanical behavior of bone. J. Biomech., 27, 1159-1168.
23. McElhaney, 1., Fogle, 1., Melvin, 1. et al. (1970) Mechanical properties of cranial bone. J. Biomech., 3, 495-511.
REFERENCES I I 23 ~----------------------------------------------------------~
24. Gilbert, J.A., Maxwell, G.M., McElhaney, J.H. et al. (1984) A system to measure the forces and moments at the knee and hip during level walking. J. Orthop. Res., 2, 281-288.
25. Klever, F., Klumpert, R., Horenberg, J. et at. (1985) Global mechanical properties of trabecular bone: experimental determination and prediction from a structural model. In Biomechanics: Current Interdisciplinary Research, 167-172, Ed. Perren S.M. and Schneider E.; Martinus Nijhoff, Dordrecht.
26. Snyder, B. (1991) Anisotropic Structure-Property Relations for Trabecular Bone. Ph.D. Dissertation, University of Pennsylvania, Philadelphia, PA.
27. Hvid, l., Jensen, N.C., Bunger, C et al. (1985) Bone mineral assay: its relation to the mechanical strength of cancellous bone. Eng. Med., 14, 79-83.
28. Rohl, L., Larsen, E., Linde, F. et al. (1991) Tensile and compressive properties of cancellous bone. J. Biomech., 24, 1143-1149.
29. Carter, D.R., Schwab, G.H. and Spengler, D.M. (1980) Tensile fracture of cancellous bone. Acta Orthop. Scand., 51, 733-741.
30. Carter, D.R. and Hayes, W.C (1977) The compressive behavior of bone as a two-phase porous structure. J. Bone Joint Surg., 59A, 954-962.
31. Linde, F., Norgaard, P., Hvid, l. et al. (1991) Mechanical properties of trabecular bone. Dependency on strain rate. J. Biomech., 24, 803-809.
32. Ochoa, J.A., Sanders, A.P., Heck, D.A. et al. (1991) Stiffening of the femoral head due to inter-trabecular fluid and intraosseous pressure. J. Biomech. Eng., 113, 259-262.
33. Zilch, H., Rohlmann, A., Bergmann, G. et al. (1980) Material properties of femoral cancellous bone in axial loading. Part II: Time dependent properties. Arch. Orthop. Trauma. Surg., 97, 257-262.
34. Deligianni, D.D., Maris, A. and Missirlis, Y.F. (1994) Stress relaxation behaviour of trabecular bone specimens. J. Biomech., 27, 1469-1476.
35. Linde, F., Hvid, l. and Madsen, F. (1992) The effect of specimen geometry on the mechanical behaviour of trabecular bone specimens. J. Biomech., 25, 359-368. 439.
36. Keaveny, T.M., Borchers, R.E., Gibson, L.J. et al. (1993) Theoretical analysis of the experimental artifact in trabecular bone compressive modulus. J. Biomech., 26, 599-607.
37. Zhu, M., Keller, T.S. and Spengler, D.M. (1994) Effects of specimen loadbearing and free surface layers on the compressive mechanical properties of cellular materials. J. Biomech., 27, 57-66.
38. Odgaard, A. and Linde, F. (1991) The underestimation of Young's modulus in compressive testing of cancellous bone specimens. 1. Biomech., 24, 691-698.
39. Keaveny, T.M., Borchers, R.E., Gibson, L.J. et al. (1993) Trabecular bone modulus and strength can depend on specimen geometry. J. Biomech., 26, 991-1000.
40. Turner, C.H. (1989) Yield behavior of bovine cancellous bone. J. Biomech. Eng., 111, 256-260.
41. Keaveny, T.M., Guo, X.E., Wachtel, E.F. et al. (1994) Trabecular bone exhibits fully linear elastic behavior and yields at low strains. J. Biomech., 27, 1127-1136.
I A31 L...-1 __ D_eD_t_i_Da_D_d_eD_a_m_e_I_----I
K.E. Healy
A3.1 INTRODUCTION
A3.1.1 Structure of human dentition:
The permanent adult human dentition normally consists of 32 teeth, of which 16 are located in the mandible and 16 in the maxilla. There are 4 incisors, 2 canines, 4 premolars and 6 molars for the upper and lower dentition. The incisors are used for cutting food, the canines for tearing, the premolars for grasping, and the molars for grinding (i.e., masticating). There is a generic heterogeneous structure for these teeth, where enamel forms an exterior layer over the underlying dentin. From the cervix to the apex of the root, the exterior of the dentin is covered by cementum to which the periodontal ligament attaches the tooth to alveolar bone. Dental enamel is dense, highly mineralized, hard, and brittle. It contains prism-like structures that span from the enamel surface to the junction of enamel and dentin, the dentino-enamel junction (DEl). The prisms are comprised of hydroxyapatite crystallites and contain very little organic matrix. These properties make dental enamel an excellent material for cutting and masticating food (i.e., processes that involve friction and wear). In contrast, dentin is not as hard as enamel, but it is tougher. Dentin is a heterogeneous material and can be thought of as a composite structure containing four major components: dentin matrix; dentinal tubules; mineral (i.e., carbonate containing hydroxyapatite); and, dentinal fluid. The dentinal tubules (-45 000 per mm2) are formed during development of the dentin matrix and are distributed throughout the dentin matrix in a somewhat uniform manner. The dentin matrix mineralizes in an anisotropic fashion, where a highly mineralized tissue, peri tubular dentin,
Handbook of Biomaterial Properties. Edited by J. Black and G. Hastings. Published in 1998 by Chapman & Hall, London. ISBN 0412603306.

COMPOSITION I I 25 J L-____________________________________________________ ~
surrounds the dentinal tubules. The mineralized tissue between the dentinal tubules and peri tubular dentin is referred to as intertubular dentin. Histological examination has revealed that intertubular dentin is less mineralized than peritubular dentin. Furthermore, the matrix and mineral content of root dentin is different from coronal dentin. A good review of the structure of teeth can be found in Waters [1].
A3.2 COMPOSITION
Table A3.1 Basic Constituents of Human Dentin and Enamel*
Enamel Dentin
Weight % Volume % Weight % Volume %
Mineral (density, 3000 kg m'}) Organic (density, 1400 kg m-3)
Water (density, 1000 kg m-3)
* Adapted from [1-3].
96 1 3
90 2 8
70 20 10
50 30 20
Table A3.2 Major Elemental Composition of Surface and Bulk Dental Enamel
Enamel Dentin Mean wt% (range or Mean wt% (range or standard deviation, ±) standard deviation, ±)
Ca 37.4 ± 1.0 37.1 ± 0.2 (26.7-47.9) 26.9 ± 0.2 (21.8-31.3) 36.3 ± 0.1 (27.7-42.0) 27.6 ± 0.1 (24.7-31.5)
P 17.8 ± 0.2 13.5 ± 0.1 17.68 ± 0.2
Na 0.72 ± 0.008 (0.42-1.03) 0.72 ± 0.008 (0.26-0.87) 0.72 ± 0.008 (0.49--0.88) 0.64 ± 0.001 (0.55--0.75)
Cl 0.28 ± 0.01 0.05 ± 0.004 0.32 ± 0.01 0.072 ± 0.022
K 0.026 ± 0.001 0.02 ± 0.001
Mg 0.39 ± 0.02 (0.13--0.77) 0.74 ± 0.02 (0.25--0.94) 0.32 ± 0.004 (0.24--0.48) 0.76 ± 0.004 (0.58--0.89)
C03 3.2 (2.4-4.2) 4.6 (4-5)
# Neutron activated gamma-ray spectrometric analysis. :j: Atomic absorption spectrophotometry . • Colorimetic assay. t Average compiled from the literature.
Source, Comments
[4]# [5]# [5]t
[5]., age >25yrs [6]0
[5]# [5]* [5]#, age >25yrs [7]#
[5]t age <25yrs
[5]# [5]t
[2,3]t
* Neutron activated gamma-ray spectrometric analysis (Na, Cl, AI, Mn, Ca, and P), atomic absorption spectrophotometry (K, Mg, Zn, Cu, and Fe), or a fluoride-specific electrode (F). o Atomic absorption spectrophotometry (Ca), and colorimetric method (P).

26 I I DENTIN AND ENAMEL
Table A3.3 Trace Elemental Composition of Surface and Bulk Dental Enamel
Surface Enamel Whole Enamel
At.# Mean (range) Median Mean (range) Median Source, JLg/g JLg/g JLg/g JLg/g comments
S 16 281 (530-130) 270 [8]t,[9]:j: F 9 752 (1948-25) 666 293 (730-95) 200 [8]t,[9]:j:
123.8 ± 7.9 [10]0 Zn 30 893 (5400-61) 576 199 (400-91) 190 [8]t,[9]:j:
276 ± 106 [4]# 263.42 ± 14.8 [10]0
Mg 12 745 (3600-115) 576 1,670 (3,000-470) 1,550 [8]t,[9]:j: AI 13 343 (2304-16) 202 12.5 (70-1.5) 5.6 [8]t,[9]:j: Sr 38 204 (7632-9) 36 81 (280-26) 56 [8]t,[9]:j:
93.5 ± 21.9 [4]# 111.19 ± 9.86 [10]0
Fe 26 138 (1404-18) 68 4.4 (21-0.8) 2.6 [8]t,[9]:j: 2.77 [7]*
Si 14 70 (504-1.3) 40 [8]t,[9]:j: Mn 25 59 (468-2.6) 33 0.28 (0.64-0.08) 0.26 [8]t,[9]:j:
0.54 ± 0.08 [4]# 0.59 ± 0.04 [10]0
Ag 47 32 (396-0.2) 2 0.35 (1.3-0.03) 0.16 [8]t,[9]:j: 0.56 ± 0.29 [10]0
Pb 82 24 (79-1.2) 18 3.6 (6.5-1.3) 3.6 [8]t,[9]:j: Ni 28 23 (270-0.4) 9 [8]t,[9]:j: Ba 56 22 (432-0.8) 7 4.2 (13-0.8) 3.4 [8]t,[9]:j: Se 34 18 (72-2.9) 16 0.27 (0.5-0.12) 0.22 [8]t,[9]:j: Li 3 14 (58-0.3) 10 1.13 (3.4-0.23) 0.93 [8]t,[9]:j: Sb 51 8 (90-0) 3 0.13 (0.34-0.02) 0.11 [8]t,[9]:j: Ga 31 6 (32-0) 5 [8]t,[9]:j: Sn 50 9.3 (72-0.9) 5.8 0.21 (0.92-0.03) 0.14 [8]t,[9]:j: Ge 32 7.6 (39.6-0.5) 4.0 [8]t,[9]:j: B 5 5.3 (13.0-0.8) 3.6 5.0 (39-0.5) 2.4 [8]t,[9]:j: Cu 29 4.20 (81-0.1) 0.45 [8]t,[9]:j:
0.26 ± 0.11 [4]# 1.38 [7]*
Br 35 3.1 (14.0-0.4) 4.1 1.12 (2.6-0.32) 0.93 [8]t,[9]:j: 4.6 ± 1.1 [4]#
Cd 48 2.7 (7.6-0.6) 1.8 0.51 (2.4-0.03) 0.22 [8]t,[9]:j: Y 39 1.8 (9.3-0) 0.9 0.007 (0.17-<0.01) <0.01 [8]t,[9]:j: Ti 22 1.6 (24.5-0.1) 0.6 0.19 (4.4-<0.1) <0.1 [8]t,[9]:j: V 23 1.4 (14.4-0.1) 0.5 0.017 (0.03-0.01) 0.02 [8]t,[9]:j: La 57 1.4 (7.2-0) 0.8 [8]t,[9]:j: Be 4 1.3 (6.1-0) 1.2 [8]t,[9]:j: Cr 24 1.1 (4.7-0.2) 0.7 3.2 (18-0.1) 1.5 [8]t,[9]:j:
1.02 ± 0.51 [10]0

L-_________________ C_O __ M_P_O_S_IT_IO_N __________________ ~I I 27
Table A3.3 Continued
Surface Enamel
At.# Mean (range) Median J-Lg/g J-Lg/g
Rb 37 0.6 (4.0-0.1) 0.4 Zr 40 0.6 (1.9-0) 0.3 Ce 58 0.6 (6.1-0) 0 W 74 Co 27 0.2 (2.7-0) 0.1
Pr 59 0.2 (4.7-0) 0 Cs 55 0.1 (1.9-0) 0 Mo 42 0.1 (0.5-0.04) 0.04 I 53 0.05 (4.7-0) 0.05 Bi 83 0.001 (0.04-0) 0 Nd 60 0.045 (0.09-<0.02) 0.05 Nb 41 Au 79
Whole Enamel
Mean (range) J-Lg/g
0.39 (0.87-0.17) 0.1 (0.57-<0.02) 0.07 (1.9-0.02) 0.24 ± 0.12
0.13 ± 0.13 0.027 (0.07-<0.01) 0.04 (0.1-<0.02) 7.2 (39-0.7) 0.036 (0.07-0.01) 0.006 (0.07-<0.02)
0.28 (0.76-<0.1) 0.02 ± 0.01
Median Source, J-Lg/g comments
0.32 [8]t , [9]:j: 0.07 [8]t ,[9]:j: 0.07 [8]t ,[9]:j:
[8]t,[9]:j: [8]t,[9]:j: [10]0
0.03 [8]t ,[9]:j: 0.04 [8]t , [9]:j: 6.3 [8]t ,[9]:j: 0.03 [8]t ,[9]:j: 0.02 [8]t,[9]:j:
[8]t,[9]:j: 0.24 [8]t ,[9]:j:
[4]#
* Whole enamel from premolars of young patients (age<20 yrs), determined by spark source mass spectroscopy. t Surface enamel (depth of analysis 42 ± 8.5 jlm) from premolars of young patients (age<20 yrs), determined by spark source mass spectroscopy. # Bulk enamel from premolars of 14-16 yrs male and female patients, selected population of Stockholm Sweden, determined by neutron activated gamma-ray spectrometric analysis. Standard deviation, ±. o Neutron activated gamma-ray spectrometric analysis. * Neutron activated gamma-ray spectrometric analysis (Na, Cl, AI, Mn, Ca, and P), atomic absorption spectrophotometry (K, Mg, Zn, Cu, and Fe), or a fluoride-specific electrode (F).
Table A3.4 Significant Differences in Trace Element Composition of Whole Human Enamel for High and Low Caries Populationst
F Sr Mn Zr Cu
At.#
9 38 25 40 26
High Caries (Mean ± SE), J-Lg/g
82.1 ± 7.99 104.1 ± 9.14 1.57 ± 0.24 0.27 ± 0.1 0.71 ± 0.2
Low Caries (Mean ± SE), fLg/g
125.7 ± 11.23 184.0 ± 14.68 0.87 ± 0.15 0.16 ± 0.09 0.17 ± 0.04
t Determined by spark source mass spectroscopy
Source
[11] [11] [12] [11] [12]

DENTIN AND ENAMEL 28 I I ~----------------------------------------------------------~
Table A3.5 CalP Molar Ratio of Human Enamel and Dentin
Enamel Ca/P molar ratio
1.58 1.61 1.58 1.65 1.64
Dentin Ca/P molar ratio
1.54 1.58
1.61
# Neutron activated gamma-ray spectrometric analysis.
[4]#
Source, comments
[5]t, ., age >25 yrs [5]*, ., age >25 yrs [13]** [6]0 [14]**
t Ca determined by neutron activated gamma-ray spectrometric analysis * Ca determined by atomic absorption spectrophotometry • P determined by colorimetic assay. ** Determined by energy dispersive X-ray analysis. o Determined by atomic absorption spectrophotometry (Ca), and by the colorimetric method (P).
Table A3.6 Crystallite Size and Lattice Parameters of the Apatite in Human Enamel and Dentin*
a-axis c-axis Width Thickness Source, (nm) (nm) (nm) (nm) Comments
Enamel 0.9445 0.6885 [2]# 0.9440 0.6872 [15]t 0.9441 0.6880 68.4 ± 3.4 26.3 ± 2.2 [6]t,. ± S.D. 0.9446 0.6886 [16]t
68.3 ± 13.4 26.3 ± 2.19 [17]:1:,. ± S.E. Dentin
0.9434 ± 0.6868 ± [18]:1: 0.0007 0.0009 29.6 ± 3.7 3.2 ± 0.5 [19]., intertubular
dentin 36.55 ± 1.45 10.33 ± 7.91 [20]., mixed carious
and sound dentin
* Asymmetric hexagonal crystal with the thickness of the crystal less than the width. t X-ray diffraction method of determination . • High resolution transmission electron microscopy. # Data from [2], average compiled from the literature.

L-__________________ C_O_M __ P_O_SI_T_IO __ N __________________ ~I I 29
Table A3.7 Elastic Moduli and Viscoelastic Properties of Human Dentin and Enamel
Incisors Canine Pre-molars Molars Source, Comments
E: Dentin
E: Enamel
Er( 00): Dentin
13 (4) 9.7 (2)
14 (6) 12 (3)
48 (6) 33 (2)
14 (0.7) 9.0 (2)
11.0 (5.8) 12 (2) 7.6 (3) 10.16 10.87 9.49
84.3 (8.9) 77.9 (4.8)
46 (5) 32 (4) 9.7 (3) 12 (3)
[21]t,t,:j: [22]Crown, c,t [22]Root, c,t [23]b,11 [23] b,dehyd., II [23] b, re-hyd, II
[24]Cusp, c, II [24]Side, c, II [22]Cusp, c,:j: [22]Axial (side), c, , [22]Axial (side), c, II [22]Occlusal, c, II
12 [25]c, constant strain, hydrated,-,:j:
0.38 (0.136)
[25] c, constant strain, hydrated,-,:j:
E: modulus of elasticity (GPa); E, (<X»: relaxed modulus (GPa); Hl(t): distribution of relaxation times (GPa); c: compression; t: tension; b: three-point bending. II Applied load approximately parallel to either the long axis of the enamel rods or dentinal tubules. -Applied load approximately perpendicular to either the long axis of the enamel rods or dentinal tubules. t Applied load with respect to either the long axis of the enamel rods or dentinal tubules was variable. t Type of tooth unknown or various teeth used for measurement; data are tabulated under molar. Note: standard deviations are given in parentheses.

30 I I DENTIN AND ENAMEL
Table A3.8 Mechanical Properties of Human Enamel
Incisors Canine Pre-molars Molars Source, comments
Stress at 353 (83) [24]Cusp, c, II Proportional 336 (61) [24]Axial(side), c, II Limit (MPa) 194 (19) 224 (26) [22]Cusp, c,t
183 (12) 186.2 (17) [22]Axial (side), c, A
70.3 (22) [22]Axial (side), c, II 98.6 (26) [22]Occlusal, c, II
91.0 (10) [22]Incisal edge, c,t Tensile Strength 10 (2.6) [26]t (MPa) Compressive 384 (92) [24]Cusp, c, II Strength (MPa) 372 (56) [24]Axial (side), c, II
288 (48) 261 (41) [22]Cusp, c,t 253(35) 239 (30) [22]Axial (side), c, A
94.5 (32) [22]Axial (side), c, II 127 (30) [22]Occlusal, c, II
220 (13) [22]Incisal edge, c,t
c: compression; hyd: hydrated; dehyd: dehydrated; re-hyd: re-hydrated. II Fracture or applied load approximately parallel to the long axis of the enamel rods . • Fracture or applied load approximately perpendicular to the long axis of the enamel rods. t Applied load with respect to either the long axis of the enamel rods or dentinal tubules was variable. * Type of tooth unknown or various teeth used for measurement; data are tabulated under molar. Note: standard deviations are given in parentheses.
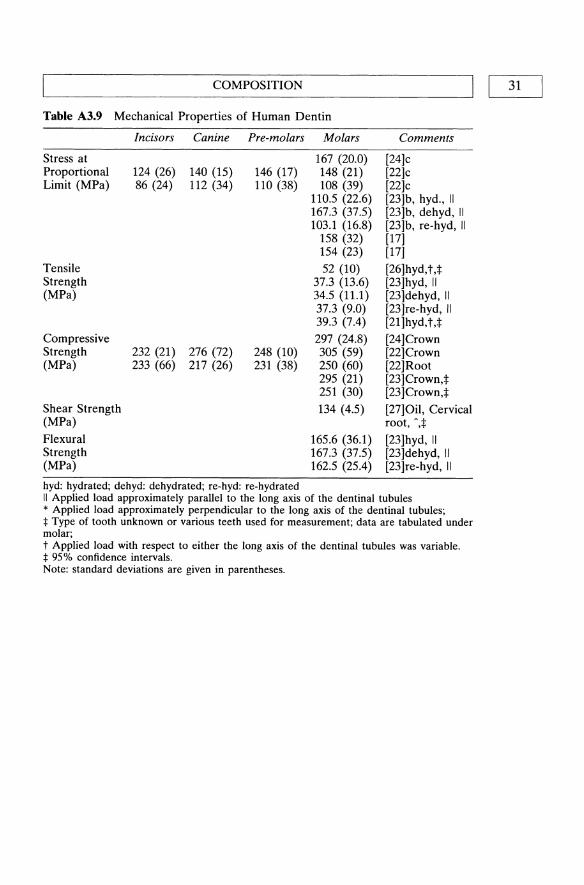
COMPOSITION I Table A3.9 Mechanical Properties of Human Dentin
Incisors Canine Pre-molars Molars Comments
Stress at 167 (20.0) [24]c Proportional 124 (26) 140 (15) 146 (17) 148 (21) [22]c Limit (MPa) 86 (24) 112 (34) 110 (38) 108 (39) [22]c
110.5 (22.6) [23]b, hyd., II 167.3 (37.5) [23]b, dehyd, II 103.1 (16.8) [23]b, re-hyd, II
158 (32) [17] 154 (23) [17]
Tensile 52 (10) [26]hyd, t,t Strength 37.3 (13.6) [23]hyd, II (MPa) 34.5 (11.1) [23]dehyd, II
37.3 (9.0) [23]re-hyd, II 39.3 (7.4) [21]hyd,tJ
Compressive 297 (24.8) [24]Crown Strength 232 (21) 276 (72) 248 (10) 305 (59) [22] Crown (MPa) 233 (66) 217 (26) 231 (38) 250 (60) [22]Root
295 (21) [23]Crown,t 251 (30) [23]Crown,:j:
Shear Strength 134 (4.5) [27]Oil, Cervical (MPa) root, ",t
Flexural 165.6 (36.1) [23]hyd, II Strength 167.3 (37.5) [23]dehyd, II (MPa) 162.5 (25.4) [23]re-hyd, II
hyd: hydrated; dehyd: dehydrated; re-hyd: re-hydrated II Applied load approximately parallel to the long axis of the dentinal tubules * Applied load approximately perpendicular to the long axis of the dentinal tubules; :j: Type of tooth unknown or various teeth used for measurement; data are tabulated under molar; t Applied load with respect to either the long axis of the dentinal tubules was variable. :j: 95% confidence intervals. Note: standard deviations are given in parentheses.
[ 31

32 I LI _________________ D_E_N_T_I_N_A __ N_D_E_N __ A_M_E_L ________________ ~
Table A3.10 Toughness, Fracture Toughness, and Work of Fracture of Human Dentin and Enamel
Fracture Toughness, Kc (MNm-312 )
Enamel
Toughness (MJm-3)
Dentin
Work of Fracture (1()2 Jm·2)
Dentine
Enamel
Incisors Canine
0.97(0.09) 1.00(0.23)
1.27(0.09)
Pre-molars
2.7 (1.6) 5.5 (1.7)
1.9(0.56) 0.13(.065)
Molars
0.7(0.08)
62.7 (6.2)t
2.4 (Ll)
Source, comments
[28]*
Maxillary, cervical,t Mandibular, cervical,t
[27] Root, shear, oil storage, ',:I: [17]Tension, crown, hydr., II
[29] , [29] II [29] , [29] II
II Applied load approximately parallel to either the long axis of the enamel rods or dentinal tubules. , Applied load approximately perpendicular to either the long axis of the enamel rods or dentinal tubules. t Applied load with respect to either the long axis of the enamel rods or dentinal tubules was variable. :1= Type of tooth unknown or various teeth used for measurement; data are tabulated under molar. * Microindentation method used. Load was 500 g with a Vickers' indenter. Note: standard deviations are given in parentheses.

COMPOSITION I I 33 L-____________________________________________________ ~
Table A3.11 Hardness of Fracture of Human Dentin and Enamel (see notes for units)
Incisor Pre-molar Molar Source, comments
Enamel 365 (35) [30] >90% incisors,®,t 393 (50) [30]:1:, molars and premolars,®,t 385 (5.8) [31]®,t.+
367 (17) [32] II,®, incisors, premolars 327 (34) [321',®, incisors, premolars
Dentin 25-81.7 [33].:1, II, [34]a
97.8 [33]a, calculated for zero tubule density
44.5-80.9 [14]0, II, [34]" 100 [14]a, calculated for zero tubule
density 75 (0.8) [31]®,t,t
a Inverse correlation between hardness and dentinal tubule density. II Applied load approximately parallel to either the long axis of the enamel rods or dentinal tubules. , Applied load approximately perpendicular to either the long axis of the enamel rods or dentinal tubules. t Applied load with respect to either the long axis of the enamel rods or dentinal tubules was variable. * Type of tooth unknown or various teeth used for measurement; data are tabulated under molar. * Microindentation method used. Load was 500 g with a Vickers' indenter. ® Knoop hardness test using 500 g load. ® Knoop microhardness test using 50 g load. ~ Knoop microhardness test using 100 g load. o Micromdentation method used. Load was 50 g with a Vickers' indenter.
Table A3.12 Permeability' of Human Dentin
Source, comments
36.4 (nIH 14.3 (7.0)t [33], unerupted third molars,
a Fluid filtration rate. * Sound human dentin, average of 4 samples, 4 readings per sample. t Sound human dentin, average of 4 samples, 1 reading per sample.

L-_______________ D_E_N_T_I_N_A __ N_D_E_N_A_M __ E_L ________________ ~I I 34
Table A3.13 Wetability of Human Enamel
Liquid
Polar Water
Glycerol
Formamide
Thiodiglycol
Non-polar Methylene iodide
S-Tetrabromoethane
1-Bromonaphthalene
0-Dibromobenzene Propylene carbonate 1-Methyl-naphthalene Dicyclohexyl
n-Hexadecane
Surface Tension, -yL V
(dynes/cm)
72.4 [35] 72.8 72.6 63.7 [35] 63.4 63.4 58.5 [35] 58.2 58.2 53.5 [34] 54.0 54.0
51.7 [35] 50.8 50.8 49.8 [35] 47.5 44.6 44.6 42.0 41.8 [35] 38.7 32.7 [35] 33.0 27.6 [35] 27.7
Contact Angle, 6 (deg)
In situ enamel
25.4 [36]t 36
44.7 [36]t 55
28.0 [35]t 24
30.8 [36]t 43
48.6 [36]t 50
38.3 [36]t 40 34
22 31.8 [36]t 20 12.2-spread 7 spreading spreading
Ground enamel
40.0 (0.1)
45.6 (0.2)
37.6 (0.1)
27.6 (0.2)
38.1 (0.1)
16.1 (0.1)
Source Comments
[37] [38]* n=330
[37] [38]* n=50
[36] [37]* n=50
[37] [38]* n=60
[37] [38] n=50
[38] [38]*, n=50
[37]
[36] [37] [36]t [37] [36]t
* Plane ground enamel surfaces, measurements from 46 erupted and unerupted teeth, mixed location (molars, premolars, incisors). Parentheses: standard error t: in situ contact angle measurements on human enamel, average of mean values for 4 teeth (maxillary or mandibular incisors).

COMPOSITION I I 35 ~----------------------------------------------------------~
Table A3.14 Wet ability of Human Dentin [38]
Surface Tension, Ground Dentin Liquid "YLV (dynes/cm) Contact Angle, e (deg) Comments
Polar Water 72.6 45.3 (0.2) *, n=l00 Glycerol 63.4 44.6 (0.1) *, n=50 Formamide 58.2 37.6 (0.2) *, n=50 Thiodiglycol 54.0 33.6 (0.3) *, n=50 Non-polar Methylene iodide 50.8 36.7 (0.3) *, n=50 1-bromo-naphthalene 49.8 16.8 (0.2) *, n=50
* Plane ground dentin surfaces, measurements from 46 erupted and unerupted teeth, mixed location (molars, premolars, incisors). Parentheses: standard error.
Table A3.15 Critical Surface Tensions (-ye) of Human Enamel and Dentin
Enamel Ground surface
In situ enamel, "'fl
In situ enamel, "'fed
In situ enamel, "'fed
Dentin
Critical Surface Tension, "Yc (dynes em·})
46.1 (40.0 - 55.6)"
45.3 ± 70.2b
32.9 ± 4.7
32
45.1 (40.7 - 51.1)"
• Range of values from different test liquids. b Standard deviation.
Source, Comments
[38]*, calculated from polar and non-polar liquids [39]d, calculated from polar liquids, [38]d, calculated from non-polar liquids [37]t, calculated from non-polar liquids
[38]*, calculated from polar and non-polar liquids
* Plane ground dentin surfaces, measurements from 46 erupted and unerupted teeth, mixed location (molars, premolars, incisors). Parentheses: standard error. A In situ measurements from 76 test subjects: 29 female and 47 male. Measurements made on teeth with intact pellicle (i.e., biofilm). "Y/ only calculated from glycerol and thiodiglycol. t Average of 4 teeth from 2 subjects. "Y/ calculated from non-polar liquids.
A3.3 FINAL COMMENTS
The quality of data presented can be inferred from the standard deviations or standard error associated with the mean values. In some cases the error can be attributed to either small sample populations or specimen preparation. Where possible, either the number of specimens used or the number of replications of a measurement was reported. The reader

36 I I'----________ D_E_N_T_I_N_A_N_D_E_N_A_M_E_L ________ -----l
should use this information as a guideline of the quality of data. When data are reported for small sample populations, then these data were usually the only source for a given physical property. In review of the literature, specimen preparation appears to have had the most influence on the precision and accuracy of data. Sample collection and storage conditions (e.g., dehydration, crosslinking agents, exogenous contamination) need to be taken into consideration when utilizing the information tabulated. Additional sources of error are dependent on the analytical technique or test method used to make the measurement. It is more difficult to discern the influence of the instrumentation on the reliability of the measurements. However, confidence of the accuracy was judged based on the use of adequate control samples with known physical properties (e.g., correction of mechanical data). In light of these comments, data in the literature were deemed most accurate and appropriate for this handbook when the following conditions were met: the sample population was large; non-destructive specimen preparation and storage conditions were used; and, multiple replications of measurements on a single sample were performed.
There are significant omissions in the data available in the literature. Most notable, is the lack of quantitative analysis of the organic phase of dentin and enamel, and determination of the viscoelastic properties of dentin. The lack of data is attributed to the technical difficulty required to make such measurements and the heterogeneous nature of the dentin, which imparts large variations in these data depending on anatomicallocation. Other significance absences are the lack of electrical and thermal properties. Finally, vacancies in the tables provided demonstrate omissions in available data.
ADDITIONAL READING
Carter, J.M., Sorensen, S.E., Johnson, RR., Teitelbaum, RL. and Levine, M.S. (1983) Punch Shear Testing of Extracted Vital and Endodontically Treated Teeth. 1. Biomechanics 16(10), 841-848.
Utilized a miniature punch shear apparatus to determine shear strength and toughness perpendicular to the direction of dentinal tubules. Dentin harvested from the cemento-enamel junction to one-third the distance to the root apex. Strengths: novel measurements, precise measurements, defined specimen location, defined orientation of testing. Limitations: tooth type not defined for 'constrained' tests, teeth stored in mineral oil prior to testing.
Driessens, F.C.M., and Verbeeck, RM.H. (1990a) The Mineral in Tooth Enamel and Dental Carries. In Biominerals, F.C.M and Verbeeck, RM.H. (eds), CRC Press, Boca Raton, Florida, pp. 105-161.
Driessens, F.C.M., and Verbeeck, RM.H. (1990b) Dentin, Its Mineral and Caries, In Biominerals, F.C.M and Verbeeck, RM.H. (eds), CRC Press, Boca Raton, Florida, pp. 163-178.

L-___________________ R_E_F_E_R_E_N_C_E_S __________________ ~I I 37
An authoritative text on biominerals with an excellent review of the properties of enamel and dentin. An excellent supplement to this handbook.
Glantz, P-O. (1969) On Wetability and Adhesiveness. Odontologisk Revy, 20 supp. 17, 1-132.
Comprehensive assessment of the wetability of human enamel and dentin. Strengths include using multiple probe liquids on numerous teeth.
Korostoff, E., Pollack, S.R, and Duncanson, M.G. (1975) Viscoelastic Properties of Human Dentin. 1. Biomedical Materials Res., 9, 661-674.
Measured some viscoelastic properties of human radicular dentin under constant strain. Linear viscoelastic theory applied. Strengths: unique examination of viscoelastic properties, defined orientation of dentinal tubules, storage conditions and testing environment well controlled. Limitations: large scatter in H\(t), mixed data for different teeth.
Marshall, G.W. (1993) Dentin: Microstructure and Characterization. Quintessence International, 24(9), 606-616.
A Review of the microstructure and characterization of dentin. Waters, N.E. (1980) Some Mechanical and Physical Properties of Teeth. Symposia
of the Society for Experimental Biology, 34, 99-135. Concise review of mechanical and physical properties of teeth. Good paper for
anatomy of enamel and dentin.
REFERENCES
1. Waters, N.E. (1980) Some mechanical and physical properties of teeth. Symp. Soc. Exp. BioI., 34, 99-135.
2. Driessens, F.CM. and Verbeeck, RM.H. (1990) The mineral in tooth enamel and dental caries. In: Biominerals, F.CM. and Verbeeck, RM.H. (eds), CRC Press, Boca Raton, Florida, pp. 105-161.
3. Driessens, F.CM. and Verbeeck, RM.H. (1990) Dentin, its mineral and caries, In: Biominerals, Driessens, F.C.M. and Verbeeck, RM.H. (eds), CRC Press, Boca Raton, Florida, pp. 163-178.
4. Soremark, Rand Samsahl, K. (1961) Gamma-ray spectrometric analysis of elements in normal human enamel. Arch. Oral. Bio., Special Suppl., 6, 275-283.
5. Derise, N.L., Ritchey, S.J. and Furr, A.K. (1974) Mineral composition of normal human enamel and dentin and the relation of composition to dental caries: I Macrominerals and comparison of methods of analyses. 1. Dental Res., 53(4), 847-852.
6. LeGeros, RZ., Silverstone, L.M., Daculsi, G. et al. (1983) In vitro caries-like lesion formation in F-containing tooth enamel. 1. Dental Res., 62(2), 138-144.
7. Lakomaa, E-L. and Rytomaa, I. (1977) Mineral composition of enamel and dentin of primary and permanent teeth in Finland. Scand. 1. Dent. Res., 85, 89-95.
8. Cutress, T.W. (1979) A preliminary study of the microelement composition of the outer layer of dental enamel. Caries Res., 13,73-79.
9. Losee, F.L., Cutress, T.W. and Brown, R (1974) Natural elements of the periodic table in human dental enamel. Caries Res., 8, 123-134.

38 I LI _________________ D_E_N_T_I_N_A __ N_D_E_N __ A_M_E_L ________________ ~ 10. Retief, D.H., Cleaton-Jones, P.E., Turkstra, J. et al. (1971) The quantitative
analysis of sixteen elements in normal human enamel and dentine by neutron activation analysis and high-resolution gamma-spectrometry. Arch. Oral Bio., 16, 1257-1267.
11. Curzon, M.E.J. and Losee, F.L. (1977) Dental caries and trace element composition of whole human enamel: Eastern United States. I. Amer. Dental Assoc., 94, 1146-1150.
12. Curzon, M.E.J. and Losee, F.L. (1978) Dental caries and trace element composition of whole human enamel: Western United States. I. Amer. Dental Assoc., 96, 819-822.
13. Kodaka, T., Debari, K., Yamada, M. et al. (1992) Correlation between microhardness and mineral content in sound human enamel. Caries Res., 26,139-141.
14. Panighi, M. and G'Sell, e. (1992) Influence of calcium concentration on the dentin wetability of an adhesive. I. Biomed. Mater. Res., 26, 1081-1089.
15. Holcomb, D.W. and Young, RA. (1980) Thermal decomposition of human tooth enamel. Calcif Tiss. Intern., 31, 189-201
16. Sakae, T. (1988) X-Ray diffraction and thermal studies of crystals from the outer and inner layers of human dental enamel. Archs. Oral Bio., 33(10), 707-713.
17. Huang, T.-J.G., Schilder, H. and Nathanson, D. (1992) Effects of moisture content and endodontic treatment on some mechanical properties of human dentin. 1. Endodontics, 18(5), 209-215
17. Kerebel, B, Daculsi, G. and Kerebel, L.M. (1979) Ultrastructure studies of enamel crystallites. I. Dental Res., 58(8), 844-851.
18. Jervl"le, P. and Madsen, H.E.L. (1974) Calcium phosphates with apatite structure. 1. Precipitation at different temperatures. Acta Chem. Scand., A28, 477-481.
19. Daculsi, G., Kerebel, B. and Verbaere, A (1978). (Methode de mesure des cristaux d'apatite de la dentine humanie en microscopie electronique en transmission de Haute Resolution)(Fr.)(Method of measurement of apatite crystals in human dentin by high resolution transmission electron microscopy), Comptes Rendu Acad. Sci. Paris, Ser. D., 286, 1439.
20. Voegel, J.e. and Frank, R.M. (1977) Ultrastructural study of apatite crystal dissolution in human dentine and bone. lour. Bioi. Buccale, 5, 181-194.
21. Lehman, M.L. (1963) Tensile strength of human dentin. I. Dent. Res., 46(1), 197-201.
22. Stanford, J.W., Weigel, K.V., Paffenbarger, G.e. et al. (1960) Compressive properties of hard tooth tissues and some restorative materials. 1. American Dental Assoc., 60, 746-756.
23. Jameson, M.W., Hood, J.A.A. and Tidmarsh, B.G. (1993) The effects of dehydration and rehydration on some mechanical properties of human dentine. I. Biomech., 26(9), 1055-1065.
24. Craig, RG., Peyton, F.A. and Johnson, D.W. (1961) Compressive properties of enamel, dental cements, and gold. I. Dent. Res., 40(5), 936-945.
25. Korostoff, E., Pollack, S.R and Duncanson, M.G. (1975) Viscoelastic properties of human dentin. 1. Biomed. Mater. Res., 9, 661-674.
26. Bowen, RL. and Rodriguez, M.S. (1962) Tensile strength and modulus of elasticity of Tooth Structure and Several Restorative Materials. 1. American Dental Assoc., 64, 378-387.
L-___________________ R_E_F_E_R __ E_N_C_E_S __________________ ~I I 39
27. Carter, J.M., Sorensen, S.E., Johnson, RR, et al. (1983) Punch shear testing of extracted vital and endodontically treated teeth. 1. Biomech., 16(10), 841-848.
28. Hassan, R, Caputo, A.A. and Bunshah, RF. (1981) Fracture toughness of human enamel. 1. Dent. Res., 60(4), 820-827.
29. Rasmussen, S.T., Patchin, RE., Scott, D.B. et al. (1976) Fracture properties of human enamel and dentin. 1. Dent. Res., 55(1), 154-164.
30. Caldwell, RC., Muntz, M.L., Gilmore, RW. et al. (1957) Microhardness studies of intact surface enamel. 1. Dent. Res., 36(5), 732-738.
31. Remizov, S.M., Prujansky, L.Y. and Matveevsky, RM. (1991) Wear resistance and microhardness of human teeth. Proc. Inst. Mech. Eng., Part H: 1. Eng. in Med., 205(3), 201-202.
32. Davidson, c.L., Hoekstra, I.S. and Arends, J. (1974) Microhardness of sound, decalcified and etched tooth enamel related to the calcium content. Caries Res., 8, 135-144.
33. Pashley, D.H., Andringa, H.J., Derkson, G.D. et al. (1987) Regional variability in the permeability of human dentin. Arch. Oral Biol., 32(7), 519-523.
34. Pashley, D.H., Okabe, A. and Parham, P. (1985) The Relationship between dentin microhardness and tubule density. Endod. Dent. Traumato!., 1, 176--179.
35. Baier, RE. and Zisman, W.A. (1975) Wetting properties of collagen and gelatin surfaces, in 'Applied Chemistry at Protein Interfaces', vol. 145, Advances in Chemistry series (ed. RF. Gould), American Chemical Society, Washington DC, pp. 155-174.
36. Jendresen, M.D., Baier, RE. and Glantz, P-O. (1984) Contact angles in a biological setting: Measurements in the human oral cavity. 1. Coli. Interface Sci., 100(1), 233-238.
37. Baier, RE. (1973) Occurrence, nature, and extent of cohesive and adhesive forces in dental integuments. in: Surface Chemistry and Dental Integument's. Lasslo, A. and Quintana, RP. (eds), Thomas, Springfield, IL pp. 337-391.
38. Glantz, P-O. (1969) On wetability and adhesiveness. Odontologisk Revy, 20 supp. 17, 1-132.
39. Jendresen, M.D. and Glantz, P-O. (1980) Clinical adhesiveness of the tooth surface. Acta Odontol. Scand., 38, 379-383.

IBtl1 ~ _______ C __ ar_tI_·la_g_e ______ ~ J.R. Parsons
B1.1 INTRODUCTION
B1.1.1 Articular cartilage
Articular or hyaline cartilage forms the bearing surfaces of the movable joints of the body. Hyaline cartilage also exists in tissues of the larynx, tracheal tube rings, rib and costral cartilage, nasal septum and in the growth plates of long bones. As a bearing surface, this tough, resilient tissue displays exceptional mechanical and tribologic properties due exclusively to the unique interaction of the constituents of the tissue extracellular matrix. Usually, the phenotypic cells (chondrocytes) of cartilage make up less than 10% of the total volume of the tissue and have not been considered to contribute to the mechanical properties of the tissue. The extracellular matrix consists of a tight collagen fiber network which contains and constrains a highly hydrophilic gel of aggregated proteoglycan macromolecules. Collagen accounts for approximately 50% of the dry weight of the tissue, the remainder being proteoglycans and cellular material. In the fully hydrated state, water contributes 60% to 80% of the wet weight of the tissue. Mechanically, intact normal articular cartilage behaves as a linear viscoelastic solid. This behavior is the result of viscous drag of fluid through the tissue in concert with the intrinsic properties of the extracellular matrix. Further, fluid exudation across the cartilage surface in response to physiologic loading is thought to play a significant role in the lubrication of joints. The importance of articular cartilage as a bearing surface has led to extensive mechanical and tribologic studies of this tissue.
Handbook of Biomaterial Properties. Edited by J. Black and G. Hastings. Published in 1998 by Chapman & Hall, London. ISBN 0 412 60330 6.

L--__ M_E_C_H_A_N_IC_A_L_PR_O_P_E_R_T_IE_S_O_F_A_R_T_IC_U_LA_R_C_A_R_T_I_L_A_G_E_-------'I I 41
Bl.l.2 Fibrocartilage
Fibrocartilage contains a higher dry weight percentage of collagen and less proteoglycan than does articular cartilage. Consequently, in the hydrated state, fibrocartilage contains less water. Fibrocartilage is generally considered to be tougher and somewhat less resilient than articular cartilage. In humans, fibrocartilage is found in the meniscus of the knee joint, the annulus fibrosus of the intervertebral disc and in the temperomandibular joint. The mechanical behavior of fibrocartilage has not been studied to the extent of articular cartilage; however, it is not as satisfactory a load bearing material.
Bl.l.3 Elastic cartilage
Elastic cartilage is more elastic and resilient in nature than is either hyaline or fibrocartilage. This is the result of lower collagen content coupled with the presence of elastin fibers. Elastic cartilage is found in the human epiglottis, external ear structures and eustachian tube. As elastic cartilage is not a major structural component of the musculoskeletal system, the mechanical properties of this tissue have been largely ignored.
Bl.2 COMPOSITION
Table B1.1 Cartilage Composition
Water (wt%)
Organic Source (wt%)
Articular Cartilage 60-80 20-40 Type II Collagen 15-20 Other collagen <2 Proteoglycan 10
Fibrocartilage 74 26 Type I Collagen 20 Other collagen <1 Proteoglycan <1
Bl.3 MECHANICAL PROPERTIES OF ARTICULAR CARTILAGE
Bl.3.1 Compression (Table Bl.2)
[1]
[2]
Compressive cartilage properties have often been examined using creep indentation, confined compression or free/unconfined compression methods. Indentation techniques permit in situ testing without the necessity of

42 I ~I ____________________ C_A_R_T_I_L_A_G_E ____________________ ~
Table Bl.2 Compressive Properties of Articular Cartilage
Location Value (MPa) Source
Un relaxed (initial): Creep modulus (indentation):
Femoral head 1.9-14.4 [7] Young's modulus (indentation):
Patella 2.25 [8] Young's Modulus (confined compression):
Tibial plateau 5.1-7.9* [9] 11.6* [6]
Bulk Modulus (confined compression): Tibial plateau 31-56 [9]
25* [6] Young's Modulus (unconfined compression):
Various 8.4-15.3 [7] Relaxed (equilibrium):
Aggregate modulus (Indentation): Patella 0.3-0.6 [4]
0.3-1.5 [10] Femoral condyle 0.4-1.0 [10]
0.5-0.7 [11] Carpo-metacarpal joint 0.4-0.8 [12]
Young's modulus (confined compression): Patella 0.7 [8] Tibial plateau 0.7* [6]
Bulk modulus (confined compression): Tibial plateau 9.1* [6]
* Calculated from other measurements.
special specimen preparation as with tensile testing. However, the extraction of intrinsic mechanical parameters from creep indentation data is analytically complex [3, 4]. Confined compression or unconfined compression tests require preparation of cylindrical cored specimens of tissue and underlying bone. With unconfined compression, the free draining tissue edges and low aspect ratio, layered nature of the test specimen may introduce error. Compression of a laterally confined specimen by a porous plunger produces uniaxial deformation and fluid flow. Confined compression creep data has been analyzed to yield an aggregate eqUilibrium compressive modulus and permeability coefficient [5] and uniaxial creep compliance [6].
Bl.3.2 Tensile (Table Bl.3)
Tensile properties for human articular have been determined by cutting standard tensile specimens from the cartilage surface and performing constant strain rate, creep or stress relaxation tensile tests. Test results are strongly influenced by collagen volume fraction and orientation and

MECHANICAL PROPERTIES OF ARTICULAR CARTILAGE I I 43 L-______________________________________________________ ~
Table 81.3 Tensile Properties of Articular Cartilage
Location Value (MPa)* Source
Relaxed (equilibrium): Young's modulus: [13]
Femoral condyle, Surface zone 10.5 Subsurface zone 5.5 Middle zone 3.7
Un relaxed (lOO%/min): Young's modulus: [7]
Femoral condyle, Surface zone 200-400 Middle zone 40-175
Strength: [7] Femoral condyle,
Surface zone 20-35 Middle zone 11-25
* All measurements parallel to collagen direction.
are largely insensitive to proteoglycan content [7] Collagen volume fraction and orientation is highest in the cartilage surface layer. Collagen content and orientation diminishes in subsequent lower layers.
81.3.3 Shear (Table 81.4)
Shear properties for articular cartilage have been determined through torsional creep, stress relaxation and torsional dynamic tests of excised cartilage disks. Creep and dynamic shearing of rectangular cartilage specimens between plates has been conducted on animal tissue (usually bovine) but not human tissue. When torsional shear strains remain small, the observed shear properties are flow independent. That is, under small strain conditions, fluid flow is negligible and viscoelastic behavior can be attributed strictly to the collagenJproteoglycan extracellular matrix.
Table 81.4 Shear Properties of Articular Cartilage
Location
Patella, Middle zone
Tibial plateau
Tibial plateau
Value (MPa)
Relaxed (equilibrium): Shear modulus:
0.25 2.6
Unrelaxed (initial): Shear modulus:
4.1 5.1-7.9
Source
[14] [6]
[6] [9]

44 I ~I ________________ C_A_R_T_IL_A_G_E ______________ ~
Bl.3.4 Poisson's ratio
Poisson's ratio has been calculated directly from tensile tests (v = 0.37-0.50) [10] and indirectly from torsional shear and confined compression creep data (v = 0.37-0.47) [6, 9]. More recently, the relationship between Poisson's ratio, n, aggregate modulus, Ha, and permeability, k, have been established for cartilage indentation testing based on biphasic (fluid and porous solid) constitutive theory [15]. Using a complex numerical solution and curve fitting scheme, Poisson's ratio can be extracted from indentation data, resulting in values of v = 0.00-0.30 [11, 12, 16]. However, care must be exercised in interpreting such indirect measures of Poisson's ratio as unexpected results can arise; e.g. v = 0.0.
Bl.3.5 Permeability
The porous solid matrix of articular cartilage permits the movement of interstitial water in response to a pressure gradient. Flow of water through and across the tissue is largely responsible for the viscoelastic character of cartilage. Flow is related to tissue permeability through the hydraulic permeability coefficient, k, as defined by Darcy's law. The permeability coefficient has been measured in flow chambers where a known pressure gradient produces flow across a cartilage layer of known thickness and area (k = 4.0 - 17.0 X 10.16 m4/Ns)[7]. However, such experiments have demonstrated significant decreases in permeability coefficient with increasing pressure gradient, increasing compressive tissue strain and with increasing proteoglycan content. Evoking biphasic constitutive theory with numerical solutions and/or curve fitting routines permits an indirect determination of the permeability coefficient from confined compression creep data and creep indentation data (k = 5.2 - 21.7 x 10· 16 m4/Ns)[11,12].
Bl.3.6 Articular cartilage tribologic properties
Healthy articular cartilage has remarkable tribologic properties. Under high load conditions the tissue displays extremely low frictional coefficients and virtually undetectable wear. The dynamic coefficient of friction, j.1d' has been measured in whole joints using Stanton pendulum or other pendulum techniques where the joint forms the pendulum pivot (j.1d = 0.015-0.04)[17-19]. The coefficients of friction of cartilage plugs bearing on other materials has been determined for human and animal tissue but these sorts of experiments have little relevance for actual in situ cartilage behavior and are not reported here.
The lubrication of articular cartilage remains a subject of continuing debate and no one lubrication mechanism can be clearly identified. Both

ADDITIONAL READING I I 45 L-______________________________________________________ ~
fluid film and boundary lubrication are thought to play primary roles in joint lubrication and the dominance of one or the other probably depends on loading and velocity conditions. Further as cartilage is a relatively soft viscoelastic material, elastohydrodynamics may discourage fluid film breakdown and thus promote hydrodynamic lubrication. Exudation of fluid across the cartilage surface in response to an advancing load has also been suggested to aid lubrication.
No reliable wear tests have been performed on human articular cartilage bearing surfaces under physiologic conditions.
Bl.4 FIBROCARTILAGE MECHANICAL PROPERTIES
Human fibrocartilage tensile mechanical properties have been determined by cutting standard tensile specimens either from the knee meniscus or from single or multiple lamella from the annulus fibrosus and performing constant strain rate tensile tests. Test results are strongly influenced by collagen volume fraction and orientation and are largely insensitive to proteoglycan content. Annulus fibrosus has also been tested in confined compression, permitting derivation of an aggregate compressive modulus and permeability. Data are reported in Section B2.
Bl.S ELASTIC CARTILAGE MECHANICAL PROPERTIES
No reliable data are available for human tissue.
ADDITIONAL READING
Freeman, MAR (ed.) (1979) Adult Articular Cartilage, 2nd ed., Pitman Medical Publishing Co, Kent, UK.
Although now somewhat out of date, this classic text forms the basis for current thinking on cartilage biochemistry, physiochemistry, biomechanics and tribology. The volume of original data, found nowhere else, is truly impressive.
Mow V.c., Holmes, M.H. and Lai, W.M. (1984): Fluid transport and mechanical properties of articular cartilage. A review. J. Biomech., 17:377-394.
This survey article provides an historical perspective of cartilage mechanics research and leads the reader through the modern biphasic theory of cartilage mechanics at the material level. References provided are particularly useful in developing a bibliography of the important classic studies in this field.
Mow, V.c. and Ratcliffe, A (eds)(1993): Structure and Function of Articular Cartilage, CRC Press, Boca Raton.
This up-to-date monograph is perhaps the best current work on the subject. Details from many of the references in this section (below) can be found in the section on cartilage biomechanics.

CARTILAGE 46 I [ L-__________________________________________________________ ~
REFERENCES
1. Maroudas, A. (1979) Physiochemical properties of articular cartilage. in Adult Articular Cartilage, 2nd ed., M.A.R. Freeman (ed.), Pitman Medical Publishing Co, Kent, UK, pp. 215-290.
2. Fithian, D.C., Kelly, M.A. and Mow, V.C. (1990) Material properties and structure-function relationships in the menisci. Clin. Orthop. ReI. Res., 252, 19-31.
3. Mak, A., Lai, W.M. and Mow, V.c. (1987) Biphasic indentation of articular cartilage: Part I, Theoretical analysis. l. Biomech., 20, 703-714.
4. Mow, V., Gibbs, M.C. and Lai, W.M., et al. (1989) Biphasic indentation of articular cartilage: Part II, A numerical algorithm and experimental study. l. Biomech., 22, 853-861.
5. Mow, V., Kuei, S.c. and Lai, W.M. (1980) Biphasic creep and stress relaxation of articular cartilage in compression: Theory and experiments. l. Biomech, Eng., 102, 73-84.
6. Hayes, W. and Mockros, L.F. (1971) Viscoelastic properties of human articular cartilage. l. Appl. Physiol., 31, 562-568.
7. Kempson, G. (1979) Mechanical properties of articular cartilage. In Adult Articular Cartilage, 2nd ed., Freeman M.A.R., Editor, Pitman Medical Publishing Co. Ltd., Kent, England, pp. 333-414.
8. Sokoloff, L. (1966) Elasticity of aging cartilage. Fed. Proc., 25, 1089-1095. 9. Hori, R. and Mockros, L.F. (1976) Indentation tests of human articular carti
lage. l. Biomech., 9, 259-268. 10. Armstrong, C. and Mow, V.c. (1982) Variations in the intrinsic mechanical
properties of human articular cartilage with age, degeneration and water content. l. Bone Joint Surg., 64A, 88-94.
11. Athanasiou, K., Rosenwasser, M.P., and Buckwalter, 1.A., et al. (1991) Interspecies comparison of in situ intrinsic mechanical properties of distal femoral cartilage. l. Orthop. Res., 9, 330-340.
12. Ateshian, G., Gardner, 1.R., Saed-Nejad, F. et al. (1993) Material properties and biochemical composition of thumb carpometacarpal joint cartilage. Trans. Orthop. Res. Soc., 18,323.
13. Akizuki, S., Mow, V.c. and Muller, F., et al. (1986) Tensile properties of human knee joint cartilage: Part I, Influence of ionic concentrations, weight bearing and fibrillation on the tensile modulus. l. Orthop. Res., 4, 379-392.
14. Zhu, W., Lai, W.M. and Mow, V.C. (1986) Intrinsic quasi linear viscoelastic behavior of the extracellular matrix of cartilage. Trans. Orthop. Res. Soc., 11, 407.
15. Mak, A. (1986) The apparent viscoelastic behavior of articular cartilage - The contributions from the intrinsic matrix viscoelasticity and interstitial fluid flows. l. Biomech. Eng., 108, 123-130.
16. Akizuki, S., Mow, V.c., Lai, W.M., et al. (1986) Topographical variation of the biphasic indentation properties of human tibial plateau cartilage. Trans. Orthop. Res. Soc., 11,406.
17. Charnley, 1. (1960) The lubrication of animal joints in relation to surgical reconstructions by arthroplasty. Ann. Rheum. Dis., 19, 10-19.

L-___________________ R_E_F_E_R_E_N_C_E_S __________________ ~I I 47
18. Little, J., Freeman, M.A.R., and Swanson, S.V. (1969) Experience on friction in the human joint. In Lubrication and Wear in Joints, Wright V., Editor, Sector Publishing, London, UK., pp. 110-114.
19. Unsworth, A., Dawson, D. and Wright, V. (1975) Some new evidence on human joint lubrication. Ann. Rheum. Dis., 34, 277-285.

IB211 ~ ______ F_ib_r_o_c_a_rt_i1_a_g_e ____ ~ V.M. Gharpuray
B2.1 INTRODUCTION
The human menisci and intervertebral discs perform several important mechanical functions in the human body. The ability to perform these functions and consequently their intrinsic biomechanical properties are dependent on the interaction of the constituents of these structures. Both the menisci and intervertebral discs have a fibrocartilaginous structure that consists of two distinct phases: a fluid phase consisting of mainly water and dissolved electrolytes, and a solid phase composed of highly oriented collagen fibers, cells, proteoglycans and other proteins. As with all other biological materials, both menisci and discs exhibit non-linear viscoelastic and anisotropic properties. The non-linear stiffness or elasticity of the structure is imparted by the collagen fibers and to a lesser extent by osmotic pressures within the tissue which are generated by the degree of hydration [1, 2]. The viscoelastic or energy dissipation properties are a result of fluid flow within and through the structures and also of molecular relaxation effects from the motion of long chains of collagen and proteoglycans [3]. Anisotropy is a consequence of the orientation and concentration of collagen fibers within the proteoglycan gel.
B2.2 STRUCTURE AND COMPOSITION
A normal adult human knee contains two menisci - the lateral and the medial, whose average lengths are 38 and 45 mm, and average volumes are 2.9 and 3.45 cm3 respectively [4]. At the femoral articulating surface
Handbook of Biomaterial Properties. Edited by J. Black and G. Hastings. Published in 1998 by Chapman & Hall, London. ISBN 0 412 60330 6.

L-____________ ST_R_U __ CT_U __ R_E_A_N_D __ C_O_M_P_O_S_I_T_IO_N ____________ ~I I 49
of each meniscus, for a depth of approximately 100 J..Lm, fine collagen fibrils (mainly Type II) are randomly oriented to form a woven mesh [5, 6]. Beneath this surface layer, larger rope-like bundles (approximately 100 J..Lm in diameter) of Type I collagen are arranged predominantly in the circumferential direction. In the posterior half of the medial meniscus however, the fibers are not as highly oriented [6, 7]. A few radial fibers may also be seen interspersed within the circumferential fibers [6-8]. At the tibial surface is another articulating layer, in which the principal orientation of the fibers is radial.
Collagen and other proteins make up the organic content of the meniscus, while dissolved electrolytes make up the inorganic content (which is negligibly small). The collagen is primarily Type I (98%) with small amounts of Type II, III and Type V [9], and comprises up to 25% of the wet weight and 90% of the dry weight in human material (Table B2.1). 10% of the dry weight and up to 2% of the wet weight are due to non-collagenous proteins, which consist predominantly of proteoglycans, and smaller amounts of structural glycoproteins, cell membrane bound receptors and intercalated membrane glycoproteins. These proportions do not appear to vary with location in the menisci [10].
There are 23, approximately cylindrical, intervertebral discs in the human spine that account for 20-30% of its overall length [13]. The cross sectional shape varies with level: roughly elliptical, rounded triangular and kidney shaped in the cervical, thoracic and lumbar regions respectively [14]. The cross sectional shape is sometimes quantified by a shape index (S) defined by S = 41TA/CZ where A = cross sectional area, and C = circumference of the cross section (Table B2.2). Most discs are wedge-shaped in sagittal section with the anterior height greater that the posterior height. The cross sectional area increases with level such that lumbar discs are larger than cervical discs.
The intervertebral disc contains two distinct regions, the nucleus pulposus and the annulus fibrosus. The nucleus occupies about 50% of the volume of the disc, and contains mostly water and small amounts of randomly oriented collagen fibers, cells and non-collagenous proteins [19]. The annulus is a tough ring-like structure that surrounds the nucleus. Highly oriented collagen fibers (primarily Types I and II) form a laminate structure in the annulus, with approximately 20-25 laminae oriented alternately at
Table B2.1 Composition of the menisci
Water 60-70%"
Wet weight
Collagen 15-25%"
NCP* 1-2%"
Dry weight
Collagen 70-90%",b
NCP 8-20%b,ct
* NCP = non-collagenous proteins; :j: 21.9% in neonates decreasing to 8.1 % between 30--70 years. a: [8];b: [ll];c: [12].

150 I I FIBROCARTILAGE
Table 82.2 Shape and size of the adult intervertebral disc
Disc Shape Index Posteriori Anterior Cross Sectional Height Level (sa) Height" Area (mm2) (mm)
L5-S1 0.885 0.35 L4-L5 0.897 0.51 1714b 11-12b•c
L3-L4 0.866 0.55 1662b lO.4b
L2-L3 0.866 0.61 1859b 9.75b
Ll-U 0.825 0.68 1640b 8.83b
TI2-Ll 0.844 0.75 Tll-T12 0.856 0.80 TlO-Tl1 0.885 1.11 T9-TlO 0.879 0.74 T8-T9 0.919 0.88 4-6c
TI-T8 0.878 0.81 T6-TI 0.898 0.84 T5-T6 0.935 1.07 T4-T5 0.868 0.97 T3-T4 0.836 0.72 TI-T3 0.870 0.74 Tl-TI 0.815 0.76 C7-Tl 0.785 0.62 1292* 6.00d
C6-C7 0.708 0.82 1152* 5.67d
C5-C6 0.828 0.44 949* 5.50d
C4-C5 0.825 0.47 892* 5.25d
C3-C4 0.870 0.50 827* 5.00d
C2-C3 0.893 0.56 732* 4.75d
* Computed from data in [18]. a: [13];b: [15,16];c: [17];d: [18].
approximately +(60-70)° and -(60-70)° to the spinal axis [14,20,21]). Type IX collagen is believed to cross link the Types I and II fibers, and provide some resistance to circumferential tears. Collagen content and fiber orientation is highest in the outermost layers, and both decrease as the nucleus is approached from the periphery of the disc (Table B2.3) The water content in the disc varies with position in the disc: it is highest in the nucleus and lowest in the outermost layers of the annulus [22,23]. It has also been shown that the water content varies with circumferential position [4], and is higher in the posterior of the disc. The nucleus loses water and becomes more fibrous and desiccated with age, causing the boundary between the annulus and the nucleus to become less clear [19,23].
Table 82.3 Composition of the intervertebral disc in young adults
Tissue
Nucleus Pulposus Annulus Fibrosus
a: [23]; b: [24].
Water Content %
85-95" 85 (innermost layer) 65 (outermost layer)
Collagen Content %
2-5b
5 (innermost layer) 21 (outermost layer)

STRUCTURE AND COMPOSITION I I 51 ~----------------------------------------------------~
B2.3 HYDRAULIC PERMEABILITY AND DRAG COEFFICIENTS
Experimental data suggest that water is capable of flowing through both meniscal and discal tissues, and is dependent on a material property of the tissue called hydraulic permeability [25], which may be modeled by Darcy's Law as:
Q=k AtlP h
(B2.1)
where k = hydraulic permeability coefficient of the tissue; Q = volume rate of fluid flow; A = area across which fluid flow occurs; h = thickness of the tissue; and tlP = pressure gradient across the thickness h that causes fluid flow.
The diffusive drag coefficient K is related to the permeability coefficient by
(<1>')2 K=--
k (B2.2)
where 4>1 is the porosity of the tissue and is defined as the ratio of interstitial fluid volume to total tissue volume.
For human meniscal (annulus) tissue, k, the permeability is 2.5 x 10⁻¹⁶
m4/Ns [22], about one third of that reported for bovine tissue: 8.1 x 10⁻¹⁶ m4/Ns [26]. There is no significant variation in the permeability coefficient with location of the specimen. The porosity (4).1) of both tissues is approximately 0.75, and therefore the drag coefficient, K, is very high and ranges from 1014 to 1015 Ns/m4•
B2.4 ELASTIC PROPERTIES
Under quasi-static loading, or in conditions under which 'short-term' loading responses are expected to occur [27], both meniscal and discal tissues may be modeled as linear elastic and orthotropic. Under a constant load rate, the non-linear behavior may be described by an exponential stress-strain relationship given by
(J' = A[eB• -1] (B2.3)
where A and B are constants for the given material. The constant B is proportional to the tangent modulus (i.e., dalde), and sometimes a third constant C is defined as C = A*B, and is the tangent modulus as a ~ 0 [8].
The macroscopic tensile strength of the entire meniscus was studied by Mathur et at. [4] by gripping the horns of the meniscus, and stretching it to failure. The results suggested that the medial meniscus was significantly

52 II L __________________ F_IB_R_O_C_A __ R_T_IL_A_G_E __________________ ~
weaker than the lateral meniscus (ultimate loads of 247 Nand 329 N respectively), and that the mode of failure was not by transverse cracking, but predominantly by oblique (medial) or spiral (lateral) tearing.
Strength and modulus of the meniscus vary with different locations and with different orientations of the specimen due to structural and compositional changes (Table B2.4). For loading parallel to the fibers, it appears that the meniscus may be stronger in the anterior location, and that the lateral meniscus may be stronger than the medial meniscus. This may be explained in part by the fact that the fiber orientation is more random in the posterior part of the medial meniscus.
A similar trend is seen in the tensile modulus of meniscal specimens oriented parallel to the circumferential direction (Table B.2.5), and if a power law is used as the constitutive equation (equation B2.3), the coefficients A and C show an identical pattern [7, 10, 28].
The properties of intervertebral discs are more complex than those of the menisci, since properties vary with disc level, and discs must withstand loads and moments in three orthogonal directions. (Table B2.6).
As with the meniscus, strength and modulus of discal tissue vary with location and orientation of the specimen (Table B2.7). Lin et al. [15, 16] have however shown that elastic moduli of annular specimens are independent of disc level.
Table B2.4 Tensile strength of meniscal tissue (MPa)a,*
Location
Meniscus Orientationf Anterior Central Posterior
Lateral Parallel 10.37 6.31 6.87 Perpendicular 0.80 0.88 0.54
Medial Parallel 3.36 5.86 Perpendicular 0.85 1.23
a: Averaged from data in [6]. * Tissues were fixed in formalin before testing. t Either parallel or perpendicular to the circumferential direction.
Table B2.5 Non-linear parameters and tensile modulus of menisci
Meniscus Location A B C Tensile modulusa (MPa)
Medial Anterior 1.6 28.4 42.4 159.6 Central 0.9 27.3 23.7 93.2 Posterior 1.4 20.1 25.2 110.2
Lateral Anterior 1.4 28.8 30.2 159.1 Central 2.1 31.9 55.7 228.8 Posterior 3.2 27.5 67.5 294.1
a: Slope of the stress-strain curve in the linear portion after the toe region.

VISCOELASTIC BEHAVIOUR
Table 82.6 Mechanical properties of the intervertebral disc
Stiffness (Nlmm or Nmlrad)
Loading mode Level Strength (N) Initiala
Compression L5-S1 5574d 1448d
L4-L5 5128d 306d, 413" L3-L4 5351d 1352d
L2-L3 4905d 439d, 461" Ll-L2
Flexion Lumbar 46f Extension Lumbar 74f Lateral bending Lumbar 64f Axial torsion Lumbar 157f Compression Lumbar Posterior shear Lumbar 102g Anterior shear Lumbar 91g Lateral shear Lumbar 113g
a: Slope of the toe region of the load displacement curve. b: Average slope of the load displacement curve.
Averageb
800g
c: Slope of the load displacement curve excluding the toe region. d: [29]; e: [30]; f: [31]; g: [32].
Table 82.7 Mechanical properties of the annulus fibrosus
Finale
3511d
2405d, 721" 2756d
3160d, 997e
8451f
704f 604f
148g 123g 169g
Layer Location
Property Specimen orientation Average Inner Middle Outer
Tensile Modulus Horizontal Parallel to fibers Perpendicular to lamellae
Ultimate stress Horizontal Parallel to fibers Perpendicular to lamellae
3.54C
3.41
a: MPa, Specimen 2x2.5 mm cross section, 6.5 mm length [33]. b: MPa, Specimen 7.5x2.5 mm cross section, 4.5 mm length [33]. c: N/mm, Specimen 2x1.5 mm cross section, 15-25 mm length [34].
B2.5 VISCOELASTIC BEHAVIOR
410" 0.16b
110" 0.187b
I
Finally, the rate dependent properties are usually modeled by a threeparameter solid which consists of a spring (m2) and a dashpot (h) in parallel connected to another spring (m t ) in series. Viscoelastic properties may also be expressed in terms of the dynamic modulus G*. A sinusoidal displacement of the form u = U o eiwt is applied to the specimen (this is usually a torsional strain), and the resulting force response F = Fo eiwt + 8 is measured. Here 'P = circular frequency, i = \'(-1) and 8
I 53

54 I I'----_________ F_I_B_R_O_C_A_R_T_IL_A_G_E _________ ---'
is the phase angle shift between the applied displacement and the measured force. The dynamic modulus is than obtained as
G* = ~ = ~ ei8 = G' +iG" U Uo
(B2.4)
where G' and G" are the loss and storage moduli respectively. In some cases, it may be more convenient to express viscoelastic properties in terms of the magnitude of the dynamic shear modulus and the phase angle shift as
IGI* = ,(G'2+G"2); 8 = tan- l ( g~) (B2.5)
The anisotropic viscoelastic properties in shear of the meniscus have been determined by subjecting discs of meniscal tissue to sinusoidal torsional loading [35](Table B2.8). The specimens were cut in the three directions of orthotropic symmetry, i.e. circumferential, axial and radial. A definite correlation is seen with the orientation of the fibers and both the magnitude of the dynamic modulus IG*I and the phase angle 5.
Table 82.8 Viscoelastic properties of meniscal tissue
Specimen orientation
Circumferential Axial Radial
IG*1 (MPa)
36.8 29.8 21.4
8 (degrees)
16.7 19.4 20.8
The viscoelastic properties of the human intervertebral disc have been modeled [36, 37] using the three-parameter solid. The parameters were obtained by fitting experimentally obtained creep curves to analytical equations using linear regression (Table B2.9).
Table 82.9 Viscoelastic properties of the intervertebral disc* [36,37]
m l (MPa) m2 (MPa) h (GPas)
10-13 13-40 65-280
* Ranges.
B2.6 DISCUSSION
Since it is nearly impossible to carry out meaningful experiments in vivo on the human disc or meniscus, the properties reported above have been obtained from cadaveric tissue. Test specimens were obtained from autopsy material (10-48 hours after death), and were either tested
~ _______________ A_D_D_I_T_IO_N __ A_L_R_E_A_D_I_N_G ________________ ~I I 55
immediately or stored frozen for varying periods of time before testing. Statistical analyses of these data show high standard deviations and errors that are caused by a number of factors. Changes in water content (which may be a consequence of aging and degeneration, diurnal changes or surgical interventions) cause a subsequent change in mechanical properties. Further, it has been well documented that the mechanical properties of collagenous tissues change with storage medium, storage temperature, time after death and 'preconditioning' state [38, 39]. Both the disc and the meniscus contain highly oriented collagen fibers, and location and orientation of the test specimen can cause significant changes in the test results. Additional factors such as sex, diet, and level of activity also play a relatively minor role in this variation.
ADDITIONAL READING
Ghosh, P. (ed.) (1988) The Biology of the Intervertebral Disc, Vol I and II, CRC Press, Boca Raton.
One of the most comprehensive texts available about the intervertebral disc. It is written from the biological perspective, and contains exhaustive information about each component of the disc. Volume I includes chapters on disc structure and development, vasculature, innervation, collagen and non-collagenous proteins. Volume II contains information on nutrition and metabolism, mechanics, pathology and disease states.
Mow, V.c., Amoczky, S.P. and Jackson, D.W. (1992) Knee Meniscus: Basic and Clinical Foundations. Raven Press, New York.
This monograph is designed to serve as a comprehensive reference for clinicians and researchers interested in the meniscus. It includes chapters on gross anatomy, structure and function of the menisci and their mechanical behavior, pathological disorders, clinical and surgical methods of treatment and meniscal disorders.
Mow, V.e. and Hayes, W.e. (1991) Basic Orthopaedic Biomechanics, Raven Press, New York.
This book is aimed at teaching senior engineering students or orthopaedic residents the fundamental principles of biomechanics of the musculoskeletal system. The book contains several chapters on the mechanics of joints, and the properties and functions of joint tissues. The chapter devoted to articular cartilage and the meniscus includes a review of collagen-proteoglycan interactions, and how these directly affect the mechanical behavior of the tissue. The biphasic and the triphasic theories for the viscoelastic properties are also discussed.
White, A.A. and Panjabi, M.M., (1990) Clinical Biomechanics of the Spine, J.B. Lippincott Company, Philadelphia.
An excellent reference book for an engineer or a physician interested in the spine. Each topic is written from the viewpoint of a biomechanician and the topics covered include kinetics and kinematics of vertebral joints, pathological disorders of the spine and their surgical management. Chapter 1 contains an introductory section on the intervertebral disc that describes its structure, function and biomechanics.

56 I IL __________________ F_IB_R_O_C_A __ R_T_IL_A_G_E ________________ ~
REFERENCES
1. Armstrong, e.G. and Mow, V.c. (1982) Variations in the intrinsic mechanical properties of human articular cartilage with age, degeneration and water content. J. Bone Joint Surg., 64A, 88-94.
2. Mow, V.e., Holmes, M.H. and Lai, W.M. (1984) Fluid transport and mechanical properties of articular cartilage: A review. J. Biomech., 102, 73-84.
3. Hayes, W.C. and Bodine, A.1. (1978) Flow independent viscoelastic properties of articular cartilage matrix. J. Biomech., 11,407-419.
4. Mathur, P.D., McDonald, 1.R and Ghormley, RK. (1949) A study of the tensile strength of the menisci of the knee. J. Bone Joint Surg., 32A, 650-654.
5. Aspden, RM., Yarker, Y.E. and Hukins, D.W.L. (1985) Collagen Orientations in the meniscus of the knee joint. J. Anat., 140,371-380.
6. Bullough, P.G., Munuera, L., Murphy, 1. and Weinstein, AM. (1970) The strength of the menisci of the knee as it relates to their fine structure. J. Bone Joint Surg., 52B,564-570.
7. Fithian, D.C., Kelly, M.A and Mow, V.c. (1990) Material properties and structure-function relationships in the menisci. C/in. Orthop. Rei. Res., 252, 19-31.
8. Mow, V.C., Zhu, W. and Ratcliffe, A (1991) Structure and function of articular cartilage and meniscus, in Basic Orthopaedic Biomechanics, (eds V.c. Mow and W.C. Hayes), Raven Press, New York, pp. 143-198.
9. Eyre, D.R and Wu, 1.1. (1983) Collagen of fibrocartilage: A distinctive molecular phenotype in bovine meniscus. F. E. B. S. Letters, 158, 265-270.
to. Fithian, D.e., Zhu, W.B., Ratcliffe, A, Kelly, M.A and Mow, V.c. (1989b) Exponential law representation of tensile properties of human meniscus. Proceedings of the Institute of Mechanical Engineers. The Changing Role of Orthopaedics, Mechanical Engineering Publications Limited, London. pp. 85-90
11. Ghosh, P. and Taylor, T.K.F. (1987) The knee joint meniscus: A fibrocartilage of some distinction. C/in. Orthop. Rei. Res., 224, 52-63.
12. Ingman, AM., Ghosh, P. and Taylor, T.K.F. (1974) Variation of collagenous and non-collagenous proteins of human knee joint menisci with age and degeneration. Gerontology, 20, 212-223.
13. Pooni, 1.S., Hukins, D.W.L., Harris, P.F., Hilton, RC. and Davies, K.E. (1986) Comparison of the structure of human intervertebral discs in the cervical, thoracic and lumbar regions of the spine. Surg. Radiol. Anat., 8, 175-182.
14. Hirsch, e., Inglemark, B-H. and Miller, M. (1963) The anatomical basis of back pain. Acta Orthop. Scand., 33, 2-17.
15. Lin, H.S., Liu, Y.K. and Adams, K.H. (1978) Mechanical response of the lumbar intervertebral joint under physiological (complex) loading. J. Bone Joint Surg., 60A, 41-55.
16. Lin, H.S., Liu, Y.K., Ray, G. and Nikravesh, P. (1978) System identification for material properties of the intervertebral joint. J. Biomech., 11, 1-14.
17. Taylor, 1.R (1975) Growth of human intervertebral discs and vertebral bodies. J. Anat., 120, 49-68.
18. Panjabi, M.M., Summers, D.1., Pelker, RR, Videman, T., Friedlander, G.E. and Southwick, W.O. (1986) Three-dimensional load-displacement curves due to forces on the cervical spine. J. Ortho. Res., 4, 152-161.

L-___________________ R_E_FE_R __ E_N_C_E_S __________________ ~I I 57
19. Inoue, H. (1981) Three-dimensional architecture of lumbar intervertebral discs. Spine, 6, 139-146.
20. Panagiotacopulos, N.D., Knauss, W.G. and Bloch, R (1979) On the mechanical properties of human intervertebral disc materials. Biorheology, 16, 317-330.
21. Marchand, F. and Ahmed, AM. (1988) Investigation of the laminate structure of lumbar disc annulus fibrosus. Trans. Orthop. Res. Soc., 13,271.
22. Best B.A, Guilak, F., Setton, L.A, Zhu, W., Saed-Nejad, F., Ratcliffe, A, Weidenbaum, M. and Mow, V.c. (1994) Compressive mechanical properties of the human annulus fibrosus and their relationship to biochemical composition. Spine, 19, 212-221.
23. Gower, W.E. and Pedrini, V. (1969) Age-related variations in protein-polysaccharide from human nucleus pulposus, annulus fibrosus and costal cartilage. J. Bone Joint Surg., 51A, 1154-1162.
24. Lyons, G., Eisenstein, S.M. and Sweet, M.B.E. (1981) Biochemical changes in intervertebral disc degeneration, Biophysics Acta, 673, 443.
25. Lai, W.M. and Mow, V.c. (1980) Drag-induced compression of articular cartilage during a permeation experiment. Biorheology, 17, 111-123.
26. Proctor, C.S., Schmidt, M.B., Whipple, RR, Kelly, M.A and Mow, V.c. (1989) Material Properties of the normal medial bovine meniscus. J. Ortho. Res., 7, 771-782.
27. Eberhardt, AW., Keer, L.M., Lewis, 1.L. and Vithoontien, V. (1990) An analytical model of joint contact. J. Biomech. Eng., 112,407-413.
28. Fithian D.C., Schmidt, M.B., Ratcliffe, A and Mow, V.c. (1989a) Human meniscus tensile properties: Regional variation and biochemical correlation. Trans. Orthop. Res. Soc., 14, 205.
29. Brown, T., Hansen, Rl. and Torra, AI. (1957) Some mechanical tests on the lumbosacral spine with particular reference to the intervertebral discs. J. Bone Joint Surg., 39A, 1135-1164.
30. Hirsch, C. and Nachemson, A (1954) New observations on the mechanical behavior of the lumbar discs. Acta Orthop. Scand., 23, 254-283.
31. Schultz, AB., Warwick, D.N., Berkson, M.H. and Nachemson, AL. (1979) Mechanical properties of human lumbar spine motion segments Part I. J. Biomech. Eng., 101, 46-52.
32. Berkson, M.H., Nachemson, A and Schultz, AB. (1979) Mechanical properties of human lumbar spine motion segments Part I. J. Biomech. Eng., 101,53-57.
33. Marchand, F. and Ahmed, AM. (1989) Mechanical properties and failure mechanisms of the lumbar disc annulus. Trans. Orthop. Res. Soc., 14,355.
34. Galante, 1.0. (1967) Tensile properties of the human lumbar annulus fibrosus. Acta Orthop. Scand., (Supp\. 100), 1-91.
35. Chern, K.Y., Zhu, W.B. and Mow, V.c. (1989) Anisotropic viscoelastic shear properties of meniscus. Adv. Bioeng., BED-15, 105-106.
36. Burns, M.L. et af. (1984) Analysis of compressive creep behavior of the vertebral unit subjected to uniform axial loading using exact parametric solution equations of Kelvin solid models Part I. J. Biomech., 17, 113-130.
37. Kazarian, L.E. and Kaleps, I. (1979) Mechanical and physical properties of the human intervertebral joint. Technical Report AMRL-TR-79-3, Aerospace Medical Research Laboratory, Wright Patterson Air Force Base, OH

58 I ~I __________________ F_IB_R_O_C_A __ R_T_IL_A_G_E ________________ __
38. Black, J. (1976) Dead or alive: The problem of in vitro tissue mechanics. J. Biomed. Mats. Res., 10,377-389.
39. Black, J. (1984) Tissue properties: Relation of in vitro studies to in vivo behavior, in Natural and Living Biomaterials, Ed. G.W. Hastings and P. Ducheyne, CRC Press, Boca Raton, pp. 5-26.
Ligament, tendon and fascia
S. L-Y. Woo and R.E. Levine
B3.1 INTRODUCTION
Ligament, tendon, and fascia are soft tissues composed primarily of collagen fibers. In ligaments and tendons these fibers are organized into roughly parallel bundles to transmit tensile forces between two bones (ligament) or between muscle and bone (tendon). In tendons the bundles are nearly all oriented along the long axis, whereas in ligaments, typically shorter than tendons, the bundles are also generally organized except for bends and twists at insertion sites to bone, e.g. the anterior cruciate ligament in the knee [1]. Fascia, on the other hand, is a sheet of fibrous tissue which encloses muscle. In the leg, fascia lata encompasses the entire thigh musculature and becomes thicker as it progresses distally [2].
An extensive compilation of mechanical properties of human ligament, tendon and fascia was published in 1970 by Yamada in Strength of Biological Materials [3]. Since then, numerous studies of the connective tissue in human joints has been published. The data presented in this review are from studies conducted since 1970 and are limited to mechanical (or material) properties determined from uniaxial tensile tests. Samples of tendons and ligaments are usually gripped by their muscle or bone ends. The tensile test yields a load-elongation curve representing the structural properties of a bone-ligament-bone (or muscle-tendonbone) complex. The area of a transverse section of the tissue sample (cross-sectional area), generally assumed to be constant along the sample length, is used to convert load to stress. Strain in the direction of loading is calculated as a change in length divided by an initial gauge length. The initial gauge length is taken to be either the initial length of the test
Handbook of Biomaterial Properties. Edited by J. Black and G. Hastings. Published in 1998 by Chapman & Hall, London. ISBN 0412603306.

60 I ~I ____________ L_I_G_A_M_E_N_T_,_T_E_N_D_O_N __ A_N_D __ FA __ SC_I_A ____________ ~
specimen from one clamp to the other (grip-to-grip length) or a smaller gauge length marked with dye on the midportion of the tissue (direct). From the stress-strain curve, the modulus, ultimate tensile strength (UTS), strain at UTS, and strain energy density are calculated [1].
Although tendons and ligaments are often tested as composite boneligament-bone and muscle-tend on-bone complexes for ease of gripping, the maximum load, stiffness and elongation values represent the average properties of a composite, and vary depending on the material behavior of the bone, and the size, shape, and orientation of the test specimen [4]. Due to the complex geometry of human ligament, tendon, and fascia, uniform loading across a specimen during a tensile test may not always be possible. Thus, while some studies tested the entire ligament or tendon [5-7], other studies partitioned the ligaments and tendons [8-24] such that distinct bundles could be tested with a more uniform stress distributions throughout the tissue during a tensile test. In the case of fascia, samples are obtained by cutting out a rectangular bands from the fascia sheet for testing [11].
Tables B3.1 and B3.2list the mechanical properties of human ligaments, tendons, and fascia from various joints. For those tissues that were either
Table 83.1 Mechanical properties of lower limb ligaments, tendons and fascia
Ultimate Strain at Strain tensile ultimate energy
Modulus strength tensile density Tissue (MPa) (MPa) strength (%) (MPa) Source
Knee Ligament
Ant. cruciate 65-541 13-46 9-44 1-3 [11,24, 25] Pos. cruciate 109-413 24-36 10-29 2-3 [620,24]
Tendon Patellar 143-660 24-69 14-27 4-5 [8, 9, 11, 13, 17]
Ankle Ligament
Lat. collateral 216-512 24-46 13-17 na [7] Med. collateral 54-321 16-34 10-33 na [7,21]
Tendon Achilles 65 24-61 24-59 na [26,27] Palmaris longus 231O±620 91±15 na na [21]
Other Tendon
Semitendinosus 362±22 89±5 52±3 23±1 [11] Gracilis 613±41 112±4 34±2 18±2 [11]
Fascia Tibial 283±132 14±4 na na [28] Fascia lata 150-571 30-105 27-29 13±2 [11] [11, 26, 27, 29]
Notes: Ant.: anterior; Pos.: posterior; Med.: medial; Lat.: lateral, Long.: longus; Semi tend.: semitendenosis; na: not available.

[ INTRODUCTION I Table B3.2 Mechanical properties of upper limb and trunk ligaments and asso-ciated tissues
Modulus Ultimate tensile Strain at ultimate Tissue (MPa) strength (MPa) tensile strength (%) Source
Shoulder Ligament
Inf. glenohum. 30-42 5--6 8-15 [30] Capsule 32--67 8-21 na [16]
Spine Ligament
Pos. long. na 21-28 11-44 [6, 19] Liga. flavum na 1-15 21-102 [6, 19] Ant. long. 286-724 8-37 10-57 [6, 18, 19] Supraspinal na 9-16 39-115 [6, 19] Interspinal na 2-9 39-120 [6, 19] Intertransverse na 51±1.4 16.5±0.7 [6]
Forearm Ligament
Carpal joint 23-119 na na [22] Palmar radioul. 39±18 5.7±1.7 51±24 [23] Dorsal radiolul. 52±33 8±5 61±29 [23]
Interosseous membrane 528±82 43±1.4 10±2 [10]
Notes: Ant.: anterior; Inf.; inferior; Long.: longitudinal; Radioul.: radioulnar; Glenohum.: glenohumoral; na: not available.
partitioned into separate bundles and/or that were tested in mUltiple studies, the mechanical properties are given as a range of values. Data determined for one specimen bundle or measured in one study are given as mean ± one standard deviation.
A variety of factors contribute to the quality of biomechanical data [1], including donor age [4, 17,25,27,31], donor gender, storage method, test environment [15], orientation of tissue during testing [4], rate of loading [9], and accuracy of measuring devices [11,32]. Errors in mechanical property measurements may be due to the use of a grip-to-grip gauge length [5, 7-9, 12-16, 19-26], rather than a midsubstance gauge length [10, 11, 17, 18, 30, 32], for strain measurement, due to nonuniform elongation along the specimen length. Another source of error may be the crosssectional area measurement methods which contact, or deform, the tissue surface [5, 7-9, 11-13, 15, 16, 18, 19, 20-23, 25]. A comparative study by Woo et al. [33] demonstrated that measurements made with two contact methods, digital calipers and a constant pressure area micrometer, were 16% and 20% smaller, respectively, than those measured by a non-contact laser micrometer system. Further discussion of the strengths and weaknesses of those studies referenced in the tables are included in the annotated bibliography.
I 61

62 I LI ____________ L_I_G_A_M_E_N_T_,_T_E_N_D_O_N __ A_N_D __ FA __ SC_I_A ____________ ~
B3.2 DISCUSSION
The use of tendon, ligament, and fascia as allografts or autografts motivate the investigation of their biomechanical properties. One-dimensional, static properties such as the ultimate tensile strength, modulus, strain, and strain energy density values shown in Tables B3.1 and B3.2 are useful for comparing different candidates for replacement tissue. However, other biomechanical characterizations of human connective tissue are available in the literature. Several experimental studies have examined the timeand history-dependent, or viscoelastic, properties of human ligament and tendon [15, 17, 28, 31, 34, 35] to help predict tissue behavior after long periods of use. Mathematical models have also been used to describe short-term behavior observed in experiments [36, 37] and to predict longterm behavior [17, 34, 36-38]. Various mathematical models of ligaments and tendons have been described by Woo et al. [38], including a description of the quasi-linear viscoelasticity (QLV) theory, a commonly used viscoelastic model of ligaments and tendons. Other studies have examined how certain biomechanical properties vary throughout the tissue [14, 18, 32, 39]. Future studies must recognize that human ligament, tendon, and fascia are three-dimensional, anisotropic, nonhomogenous, composite materials which are subject to complex, dynamic loads. Successful replacement of these tissues depends on accurate replication of their static and dynamic mechanical properties.
ADDITIONAL READING
Blevins F.T., Hecker A.T., Bigler G.T., et al. (1994) The effects of donor age and strain rate on the biomechanical properties of bone-patellar tendon-bone allografts. American Journal of Sports Medicine, 22(3), 328-33.
Patellar tendons from donors ranging in age from 17 to 54 years were tested at either 10% or 100% elongation per second, to examine effects of donor and strain rate on tensile properties. A pressure micrometer was used to measure cross-sectional area and the initial length of the tendon (from patellar to tibial insertion site) was used for strain measurements. Specimens were kept moist with a saline spray during tensile testing. Medial, lateral, and sometimes central portions were taken from 25 donors; regional differences across the tendon were not considered.
Butler D.L., Grood E.S., Noyes F.R., et al. (1984) Effects of structure and strain measurement technique on the material properties of young human tendons and fascia. Journal of Biomechanics, 17(8),579-96.
This study compares mechanical properties between different tissue structures as well as analyzing the effect of strain measurement technique on tissue modulus. A diverse number of analysis techniques were employed including light microscopy, scanning electron microscopy, and tensile testing. Surface strain was measured using high-speed filming. A constant pressure micrometer was

L-___________________ R_E_F_E_R_E_N_C_E_S __________________ ~I I 63
used to measure cross-sectional area. Specimens were tensile tested at 100%/second at room temperature and humidity. Data are given as mean ± SEM (standard error of the mean) rather than standard deviation.
Hurschler C, Vanderby R. Jr., Martinez D.A, et at. (1994) Mechanical and biochemical analyses of tibial compartment fascia in chronic compartment syndrome. Annals of Biomedical Engineering, 22(3), 272-9.
This study was the first to report mechanical properties of tibial compartment fascia in humans. Fascia specimens were tested in directions along a visible fiber orientation (axial) and perpendicular to the fibers (transverse). Crosssectional area was measured using a caliper and surface strain was measured from video analysis of stain markers on the tissue surface. Specimens were subject to stress relaxation tests as well as as load-to-failure tests conducted at 20 mm/second at room temperature and humidity.
Neumann P., Keller T.S., Ekstrom L., et al. (1992) Mechanical properties of the human lumbar anterior longitudinal ligament. Journal of Biomechanics, 25(10), 1185-94.
A motion analysis system was used to measure the distribution of surface strain along the anterior longitudinal ligament. Calipers were used to measure specimen thickness and width for calculating cross sectional area. Specimens were tensile tested to failure at a displacement rate of 2.5 mm/second at room temperature and humidity. Although a strain distribution was measured, area was assumed to be constant along the ligament length.
REFERENCES
1. Woo, S.L-Y., An, K-N., Arnoczky, S.P., et al. (1994) Anatomy, Biology, and Biomechanics of Tendon, Ligament, and Meniscus, in Orthopaedic Basic Science, (eds S.R. Simon), American Academy of Orthopaedic Surgeons, pp. 45-87.
2. Fox, J.M. (1986) Injuries to the thigh, in The Lower Extremity and Spine in Sports Medicine, (eds J.A Nicholas and E.B. Hershman), The C. V. Mosby Company, St Louis, pp. 1087-1117.
3. Yamada, H. (1970) Mechanical properties of ligament, tendon, and fascia, in Strength of Biological Materials, (eds F.G. Evans), The Williams & Wilkins Co., Baltimore, pp. 92-105.
4. Woo, S.L., Hollis, J.M., Adams, D.J., et al. (1991) Tensile properties of the human femur-anterior cruciate ligament-tibia complex. The effects of specimen age and orientation. American Journal of Sports Medicine, 19(3), 217-25.
5. Chazal, J., Tanguy, A, Bourges, M., et at. (1985) Biomechanical properties of spinal ligaments and a histological study of the supraspinal ligament in traction. Journal of Biomechanics, 18(3), 167-76.
6. Prietto, M.P., Bain, J.R., Stonebrook, S.N., et al. (1988) Tensile strength of the human posterior cruciate ligament (PCL). Transactions of the Orthopaedic Research Society, 13, 195.
7. Siegler, S., Block, J. and Schneck, CD. (1988) The mechanical characteristics of the collateral ligaments of the human ankle joint. Foot & Ankle, 8(5), 234-42.

64 I I'--______ L_IG_A_M_E_N_T_,_T_E_N_D_O_N_A_N_D_F_A_SC_I_A _____ ----'
8. Bechtold, J.E., Eastlund, D.T., Butts, M.K., et al. (1994) The effects of freezedrying and ethylene oxide sterilization on the mechanical properties of human patellar tendon. American Journal of Sports Medicine, 22(4), 562-6.
9. Blevins, F.T., Hecker, A.T., Bigler, G.T., et al. (1994) The effects of donor age and strain rate on the biomechanical properties of bone-patellar tendonbone allografts. American Journal of Sports Medicine, 22(3), 328-33.
10. Boardman, N.D., Pfaeffie, H.J., Grewal, R, et al. (1995) Tensile properties of the interosseous membrane of the human forearm. Transactions of the Orthopaedic Research Society, 20, 629.
11. Butler, D.L., Grood, E.S., Noyes, F.R, et al. (1984) Effects of structure and strain measurement technique on the material properties of young human tendons and fascia. Journal of Biomechanics, 17(8), 579-96.
12. Butler, D.L., Guan, Y., Kay, M.D., et al. (1992) Location-dependent variations in the material properties of the anterior cruciate ligament. Journal of Biomechanics, 25(5), 511-8.
13. Butler, D.L., Kay, M.D. and Stouffer, D.C. (1986) Comparison of material properties in fascicle-bone units from human patellar tendon and knee ligaments. Journal of Biomechanics, 19(6), 425-32.
14. Chun, K.J., Butler, D.L., Bukovec, D.B., et al. (1989) Spatial variation in material properties in fascicle-bone units from human patellar tendon. Transactions of the Orthopaedic Research Society, 14,214.
15. Haut, RC. and Powlison, A.c. (1990) The effects of test environment and cyclic stretching on the failure properties of human patellar tendons. Journal of Orthopaedic Research, 8(4), 532--40.
16. Itoi, E., Grabowski J., Morrey, B.F., et al. (1993) Capsular properties of the shoulder. Tohoku J. Exp. Med., 171,203-10.
17. Johnson, G.A., Tramaglini, D.M., Levine, RE., et al. (1994) Tensile and viscoelastic properties of human patellar tendon. Journal of Orthopaedic Research, 12(6), 796-803.
18. Neumann, P., Keller, T.S., Ekstrom, L., et al. (1992) Mechanical properties of the human lumbar anterior longitudinal ligament. Journal of Biomechanics, 25(10), 1185-94.
19. Pintar, F.A., Yoganandan, N., Myers, T., et al. (1992) Biomechanical properties of human lumbar spine ligaments. Journal of Biomechanics, 25(11), 1351-6.
20. Race, A. and Amis, A.A. (1994) The mechanical properties of the two bundles of the human posterior cruciate ligament. Journal of Biomechanics, 27(1),13-24.
21. Regan, W.O., Korinek, S.L., Morrey, B.F., et at. (1991) Biomechanical study of ligaments around the elbow joint. Clinical Orthopaedics & Related Research, 271,170-9.
22. Salvelberg, H.H.C.M., Kooloos, J.G.M., Huiskes, R, et al. (1992) Stiffness of the ligaments of the human wrist joint. Journal of Biomechanics, 25(4), 369-376.
23. Schuind, F., An, K.N., Berglund, L., et al. (1991) The distal radioulnar ligaments: a biomechanical study. Journal of Hand Surgery - American Volume, 16(6), 1106-14.
24. Sheh, M., Butler, D.L and Stouffer, D.C. (1986) Mechanical and structural properties of the human cruciate ligaments and patellar tendon. Transactions of the Orthopaedic Research Society, 11, 236.
L-___________________ R_E_F_E_R_E_N_C_E_S __________________ ~I I 65
25. Noyes, F.R. and Grood, E.S. (1976) The strength of the anterior cruciate ligament in humans and rhesus monkeys. Journal of Bone and Joint Surgery, 58-A(8), 1074--1082.
26. France, E.P., Paulos, L.E., Rosenberg, T.D., et at. (1988) The biomechanics of anterior cruciate allografts, in Prosthetic Ligament Reconstruction of the Knee (eds MJ. Friedman and RD. Ferkel), W.B. Saunders Company, Philadelphia, pp.180-5.
27. Paulos, L.E., France, E.P., Rosenberg, T.D., et al. (1987) Comparative material properties of allograft tissues for ligament replacement: effects of type, age, sterilization and preservation. Transactions of the Orthopaedic Research Society, 12, 129.
28. Hurschler, C., Vanderby, R Jr., Martinez, D.A., et al. (1994) Mechanical and biochemical analyses of tibial compartment fascia in chronic compartment syndrome. Annals of Biomedical Engineering, 22(3), 272-9.
29. Butler, D.L., Noyes, F.R, Walz, K.A., et al. (1987) Biomechanics of human knee ligament allograft treatment. Transactions of the Orthopaedic Research Society, 12, 128.
30. Bigliani, L.U., Pollock, RG., Soslowsky, L.J., et al. (1992) Tensile properties of the inferior glenohumeral ligament. Journal of Orthopaedic Research, 10(2), 187-97.
31. Hubbard, RP. and Soutas-Little, RW. (1984) Mechanical properties of human tendon and their age dependence. Journal of Biomechanical Engineering, 106(2), 144--50.
32. Noyes, F.R, Butler, D.L., Grood, E.S., et at. (1984) Biomechanical analysis of human ligament grafts used in knee-ligament repairs and reconstructions. Journal of Bone & Joint Surgery, 66-A(3), 344--52.
33. Woo, S.L-Y., Danto, M.I., Ohland, KJ., et al. (1990) The use of a laser micrometer system to determine the cross-sectional shape and area of ligaments: A comparative study with two existing methods. Journal of Biomechanical Engineering, 112,426-431.
34. Lyon, RM., Lin, H.C., Kwan, M.K-W., et al. (1988) Stress relaxation of the anterior cruciate ligament (ACL) and the patellar tendon (PT). Transactions of the Orthopaedic Research Society, 13,81.
35. Schwerdt, H., Constantinesco, A. and Chambron, J. (1980) Dynamic viscoelastic behavior of the human tendon in vitro. Journal of Biomechanics, 13, 913-922.
36. Arms, S.W. and Butler, D.L. (1989) Cruciate ligament fiber bundle recruitment: A mathematical model. Transactions of the Orthopaedic Research Society, 14, 190.
37. Chun, KJ., Butler, D.L., Stouffer D.C., et al. (1988) Stress-strain relationships in fascicle-bone units from human patellar tendon and knee ligaments. Transactions of the Orthopaedic Research Society, 13,82.
38. Woo, S.L-Y., Johnson, G.A., and Smith, B.A. (1993) Mathematical modeling of ligaments and tendons. Journal of Biomechanical Engineering, 115,468-473.
39. Butler, D.L., Sheh, M.Y., Stouffer, D.C., et at. (1990) Surface strain variation in human patellar tendon and knee cruciate ligaments. Journal of Biomechanical Engineering, 112, 38-45.
]B4]] ~ _____ S_k_in __ a_n_d_m __ u_sc_l_e_* ____ ~ A.F.T. Mak and M. Zhang
B4.1 INTRODUCTION
Early studies [11] of the material properties of human skin and muscle are largely suspect due to problems of inappropriate tissue handling, preservation and specimen preparation. Recent efforts have focused on methods which can determine properties in situ in living individuals or on very freshly excised tissues. Among the in vivo testing methodologies, indentation has proven to be the most popular, although it sums up the contributions of various tissue layers [1, 3, 4, 6, 7, 9]. The load-displacement curve obtained during indentation depends in decreasing degree upon each of the tissues beneath the indentor. The derived properties, in addition, can be expected to vary with anatomical site, subject age and external environmental conditions (temperature, relative humidity, etc.). Additional results have been obtained in vivo through the use of Doppler ultrasound techniques [2, 5].
B4.2 IN-VIVO MECHANICAL PROPERTIES
B4.2.1 Doppler Results
Krouskop et at. [5, 8] applied Doppler ultrasound techniques to measure the point-to-point biomechanical property of the human skin and subcutaneous musculatures. Tests of the forearms and legs suggested that the elastic moduli are strongly dependent on the contraction status of the muscles. A 16-fold increase (from 6.2 kPa to 109 kPa) in the modulus
* Data are provided from indentation and ultrasound measurement techniques only.
Handbook of Biomaterial Properties. Edited by J. Black and G. Hastings. Published in 1998 by Chapman & Hall, London. ISBN 0412 60330 6.

IN-VIVO MECHANICAL PROPERTIES I I 67 L-______________________________________________________ ~
was reported at a 10% strain as muscle contraction changed from minimal to maximum. Malinauskas et al. [5] used the same technique to examine the stump tissues of above-knee amputees and found that the average modulus was significantly higher in posterior tissues than in other locations (Table B4.1). They found, additionally, that superficial tissues were stiffer than deeper structures. Note that the ages and sex of the subjects of these two studies [2, 5] were not reported.
Table B4.1 Apparent Elastic Moduli of Relaxed Above Knee Tissues [5]*
Anatomical Location Elastic Modulus (kPa)(std dev.)
Anterior Lateral Posterior Medial Superficial Underlying
* Determined by Doppler ultrasonic techniques.
B4.2.2 Indentation results
57.9 (31.1) 53.2 (30.5) 141.4 (79.1) 72.3 (45.5) 117.6 (63.0) 59.1 (74.0)
Ziegert and Lewis [9] measured the in vivo indentation properties of the soft tissues covering the anterior-medial tibiae. A preload of 22.4 N was used with indentors of 6 to 25 mm in diameter. The observed load displacement relationship were essentially linearly elastic. The structural stiffness was noted to vary by up to 70% between sites in one individual and up to 300% between individuals. Unfortunately, the thicknesses of overlying tissues were not determined at the different sites for the individuals studied.
Lanir et al. [3] measured the in vivo indentation behavior of human forehead skin with pressures up to 5 kPa. The observed behavior was linearly elastic and calculated stiffnesses were 4 to 12 kPa.
Bader and Bowker [1] studied the in vivo indentation properties of soft tissues on the anterior aspects of human forearms and thighs by applying constant pressures of 11.7 and 7 kPa respectively. Tissue thickness was measured by using a skinfold caliper and Poisson's rato was assumed to be 0.3. With these data, the stiffness of forearm and thigh tissue were calculated to be, respectively, 1.99 and 1.51 kPa.
Vannah and Chlidress [7] applied similar techniques to measure the human calf, but confined the limb within a shell. They noted that stress relaxation occurred within one second of load application and no preconditioning effect was noted. Torres-Morenos et al. [6] performed a similar study, working through ports in quadrilateral sockets of three above-knee amputees. However, they found the mechanical properties of

68 I LI __________________ SK __ IN __ A_N_D_M __ U_S_C_L_E ________________ ~
the tissues to be significantly non-linear, with site and rate dependencies, as well as being strongly influenced by muscular activity.
Mak et al. [4] (Table B4.2) measured the in-vivo indentation properties of the below knee tissues of young adults (N=6) between the ages of 25 and 35. A 4 mm diameter indentor was used, with a final indentation of about 5 mm. The fixed indentation was then maintained for 2-3 seconds to observe the difference between initial and relaxed (equilibrium) properties. The tests were done with the knee in 20° of flexion and were repeated with and without muscular contraction. The Poisson's ratio was assumed to be 0.5 for initial measurements and 0.45 for relaxed (equilibrium) measurements.
Table 84.2 Initial and Relaxed Elastic Moduli of Tissues Around Proximal Human Tibiae [4]*
Anatomical Location
Medial Relaxed Contracted Con.!Relax. Lateralt Relaxed Contracted Con.!Relax.
Initial Elastic Modulus (E;,,) (kPa)(std dev.)
102.6 (8.6) 147.3** (15.8)
1.44
132.9 (7.2) 194.3** (24,7)
1.46
Relaxed Elastic Modulus (Eeq) (kPa)(std dev.)
99.8 (9.2) 142.9** (16.7)
1.43
130.1 (7.9) 188.4** (23.0)
1.45
* By indentation; ** Different from relaxed (p <0.001); t Between tihia and fibula.
ADDITIONAL READING
Bader, D.L. and Bowker, P. (1983) Mechanical characteristics of skin and underlying tissues in vivo. Biomaterials, 4, 305-8
This paper describes an indentation experiment to investigate in vivo the bulk mechanical properties of the composite of skin and underlying tissues on the anterior aspects of human forearms and thighs by applying constant pressures. Significant variations in tissue stiffness with sex, age and body site were also demonstrated.
Malinauskas, M., Krouskop, T.A. and Barry, P.A. (1989) Noninvasive measurement of the stiffness of tissue in the above-knee amputation limb. J. Rehab. Res. Dev., 26(3), 45-52
The paper reports a noninvasive technique to measure the mechanical properties of the bulk soft tissues by a pulsed ultrasonic Doppler system. An ultrasonic transducer was used to measure internal displacement resulting from external acoustical perturbations. Measurements were made at four sites of 8 aboveknee residual limbs. The Young's moduli were found in a range of 53-141 kPa. Superficial tissue had a significantly higher modulus than the tissue beneath.

L-___________________ R_E_F_E_R_E_N_C_E_S __________________ ~J I 69
The repeatability test indicated an acceptable repeatibility. An improved device can possibly be a useful tool in prosthetic fitting and CAD socket design.
Rab, G.T. (1994) Muscle, in Human Walking (2nd ed.) (eds J. Rose, J.e. Gamble), Williams & Wilkins, Baltimore, pp. 101-122.
A concise description of the active properties of muscle tissue, with direct application to the development of forces within the human gait cycle.
Reynolds, D. and Lord, L. (1992) Interface load for computer-aided design of below-knee prosthetic sockets. Med. & BioI. Eng. & Comput., 30, 419-426.
The authors investigated the bulk tissue behaviour of the below-knee amputee's residual limb. An assessment of Young's modulus was made by matching the indentation experimental curves with the curves produced by the finite element modelling of the indentation into a layer of tissue with idealized mechanical properties. In vivo tests, conducted at four sites of a below-knee amputee's limb (patella tendon, popliteal, and anterolateral regions) found the local moduli to be 145,50,50 and 120 kPa respectively. The effect of muscle tension on the measured indentation response was also investigated. The results showed that the stiffness increased with muscle contraction.
REFERENCES
1. Bader, D.L. and Bowker, P. (1983) Mechanical characteristics of skin and underlying tissues in vivo. Biomaterials, 4, 305-8.
2. Krouskop, T.A, Dougherty. D.R and Vonson, F.S. (1987) A pulsed Doppler ultrasonic system for making noninvasive measurements of the mechanical properties of soft tissue. I. Rehab. Res. Dev., 24(1), 1-8.
3. Lanir, Y., Dikstein, S., Hartzshtark, A, et al. (1990) In-vivo indentation of human skin. Trans. ASME (J. Biomech. Eng.), 112,63-69.
4. Mak, AF.T., Liu, G.H.W. and Lee, S.Y. (1994) Biomechanical assessment of below-knee residual limb tissue, J. Rehab. Res. Dev., 31, 188-198.
5. Malinauskas, M., Krouskop, T.A and Barry, P.A (4) (1989) Noninvasive measurement of the stiffness of tissue in the above-knee amputation limb. I. Rehab. Res. Dev., 26(3), 45-52.
6. Torres-Morenos, R, Solomonidis, S.E. and Jones, D. (1992) Geometric and mechanical characteristics of the above-knee residual limb. Proc. 7th. World Congo Int. Soc. Prosthetics Orthotics, pp. 149.
7. Vannah, W.M. and Chlidress, D.S. (1988) An investigation of the three dimensional mechanical response of bulk muscular tissue: Experimental methods and results, in Computational Methods in Bioengineering (eds RL. Spilker and B.R Simon), Amer. Soc. Mech. Eng., New York, pp. 493-503.
8. Yamada, H. (1970) (ed. F.G. Evans) Strength of Biological Tissues, Williams & Wilkins, Baltimore.
9. Ziegert, J.e. and Lewis, J.L. (1978) In-vivo mechanical properties of soft tissue covering bony prominence, Trans ASME (I. Biomech. Eng.), 100, 194-201.

\B5\ \~ ______ B_r_al_·n_t_i_ss_U_e_s ______ ~ s.s. Margulies and D.F. Meaney
B5.1 INTRODUCTION
The brain is organized into the cerebrum, brain stem, and cerebellum. The cerebrum consists of two cerebral hemispheres, basal ganglia, and the diencephalon. The hemispheres contain the cerebral cortex and underlying white matter, and are associated with higher order functioning, including memory, cognition, and fine motor control. The basal ganglia, contained within the hemispheres, controls gross motor function. The diencephalon is much smaller than the cerebrum, contains the thalamus and hypothalamus, and is associated with relaying sensory information and controlling the autonomic nervous system. The brains tern contains the mesencephalon, pons and the medulla oblangata. The smallest segment of the brain, the mesencephalon, is located below the diencephalon and is thought to playa role in consciousness. Muscle activation, tone and equilibrium is controlled in the pons and cerebellum located below the mesencephalon, and respiratory and cardiac processes are governed by the medulla oblongata, located directly beneath the pons.
The brain contains grey matter and white matter substances that are easily distinguished upon gross examination. Grey matter contains a densely packed network of neural cell bodies and associated glial cells, whereas white matter contains myelinated axonal tracts, relatively few neuronal cell bodies, and a supporting environment of glial cells. The entire brain is surrounded by cerebrospinal fluid contained within an extensive ventricular system that occupies approximately one-tenth of the total brain volume. The ventricular system supports the brain as well a~ the spinal cord, and provides nutrients to and removes waste product~ from the central nervous system.
Handbook of Biomaterial Properties. Edited by J. Black and G. Hastings. Published in 1998 by Chapman & Hall, London. ISBN 0412603306.

COMPOSITION I I 71 ~----------------------------------------------------~
Understanding the response of the complex brain structure to thermal, electrical, or mechanical stimuli necessitates a thorough investigation of the physical properties of each brain component. This task is still in its infancy, and therefore the material cited in this chapter is accompanied by several caveats. First, most properties cited are for whole brain. However, where available, properties of the white matter, gray matter, cerebrum, cerebellum, and brainstem are noted. Second, extensive studies have been conducted on brain tissue from a broad range of species. To provide the reader with information most similar to human tissue, only primate data (nonhuman and human) have been included. Exceptions occur only when there is no primate data available, and are noted. Finally, because the brain is a highly perfused organ and its properties may differ between in vivo and in vitro conditions, and with the post mortem time period before testing. To facilitate comparison between tests, information regarding in vivo/in vitro conditions, post mortem time, and test procedure is included with the data.
B5.2 COMPOSITION
Table 85.1 Brain Tissue Composition
Water (wt%) Ash (wt%) Lipid (wt%) Protein (wt%)
Whole brain Grey matter White matter
76.3-78.5 (77.4) 83-86 68-77
1.4--2 (1.5) 1.5 1.4
9-17 5.3 18
8-12 8-12 11-12
Approximate overall ranges given. Values in parentheses indicate averages. Source: [1-3).
B5.2.1 Mass [2]
Adult male whole brain (20-30 yr): 1400 g (cerebrum 1200 g, cerebellum, 150 g)
Adult female whole brain (20-30 yr): 1200 g Adult male whole brain (90 yr): 1161 g
B5.2.2 Dimensions and shape [2]
The adult brain with the brain stem is approximately half an ellipsoid.
Diameter: Male: Female:
Vertical 13cm 12.5 cm
Transverse 14cm 13cm
Anteroposterior 16.5 cm 15.5 cm

72 I ~I ___________________ B_RA ___ IN __ T_IS_S_U_E __________________ ~
85.2.3 Density (adult) in kglm3
Brain 1030-1041 [2] Grey matter 1039 [1, 3] White matter 1043 [1, 3]
85.3 MECHANICAL PROPERTIES
85.3.1 8u1k modulus
Excised brain samples: 2.1 x 10⁶ kPa (independent of frequency) [4].
85.3.2 Poisson's ratio
Using the relationship v = (3K - E)/6K where K is the bulk modulus and E is the elastic modulus, and considering that K is 4-5 orders of magnitude larger than E, brain is approximated as an incompressible material (v=O.5) [5].
85.3.3 Elastic and shear moduli
See Table B5.2.
85.3.4 Creep modulus
See Table B5.3.
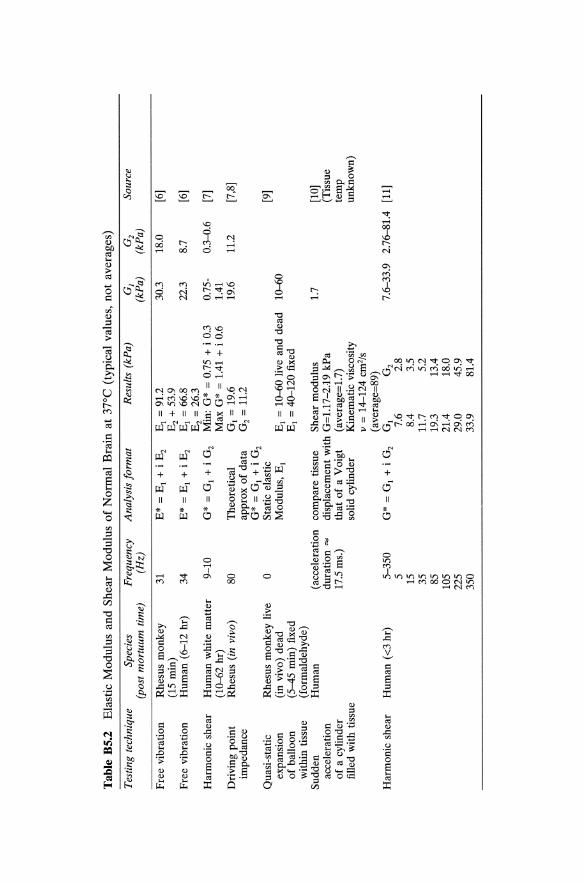
Tab
le B
5.2
Ela
stic
Mod
ulus
an
d S
hear
Mod
ulus
of
Nor
mal
Bra
in a
t 37
°C (
typi
cal
valu
es,
not
aver
ages
)
Tes
ting
tech
niqu
e Sp
ecie
s (p
ost
mor
tuum
tim
e)
Fre
e vi
brat
ion
Rhe
sus
mon
key
(15
min
) F
ree
vibr
atio
n H
uman
(6-
12 h
r)
Har
mon
ic s
hear
H
uman
whi
te m
atte
r (1
0--6
2 hr
) D
rivi
ng p
oint
R
hesu
s (i
n vi
vo)
impe
danc
e
Qua
si-s
tati
c R
hesu
s m
onke
y liv
e ex
pans
ion
(in
vivo
) de
ad
of b
allo
on
(5-4
5 m
in)
fixe
d w
ithin
tis
sue
(for
mal
dehy
de)
Sud
den
Hum
an
acce
lera
tion
of
a c
ylin
der
fille
d w
ith t
issu
e
Har
mon
ic s
hear
H
uman
(<3
hr)
Fre
quen
cy
(Hz)
31
34 9-10
80 o
( acc
eler
atio
n du
rati
on =
17
.5 m
s.)
5-35
0 5 15
35
85
105
225
350
Ana
lysi
s fo
rmat
R
esul
ts (
kPa)
E*
= E
j +
i E
z E
j =
91.
2 E
z +
53.
9 E
* =
Ej
+ i
Ez
Ej
= 6
6.8
Ez
= 2
6.3
G*
= G
j +
i G
z M
in:
G*
= 0
.75
+ i
0.3
M
ax G
* =
1.4
1 +
i 0
.6
The
oret
ical
G
j =
19.
6 ap
prox
of
data
G
z =
11.
2 G
* =
Gj
+ i
Gz
Sta
tic
elas
tic
Mod
ulus
, E
J E
j =
10-
-60
live
and
dead
E
j =
40-
120
fixe
d
com
pare
tis
sue
She
ar m
odul
us
disp
lace
men
t w
ith G
=l.
l7-2
.19
kPa
that
of
a V
oigt
(a
vera
ge=
1.7)
so
lid c
ylin
der
Kin
emat
ic v
isco
sity
v
= 1
4-12
4 cm
z/s
(ave
rage
=89
) G
* =
Gj
+ i
Gz
Gj
Gz
7.6
2.8
8.4
3.5
11.7
5.
2 19
.3
13.4
21
.4
18.0
29
.0
45.9
33
.9
81.4
G]
(kP
a)
30.3
22.3
0.75
-1.
41
19.6
10--
60
1.7
G2
(kP
a)
18.0
8.7
0.3"
{).6
11.2
Sour
ce
[6)
[6)
[7)
[7,8
)
[9)
[10)
(T
issu
e te
mp
unkn
own)
7.6-
33.9
2.
76-8
1.4
[11)

Tab
le B
5.2
Con
tinu
ed
Tes
ting
tech
niqu
e Sp
ecie
s F
requ
ency
A
naly
sis
form
at
Res
ults
(kP
a)
01
O2
Sour
ce
(pos
t m
ortu
um t
ime)
(H
z)
(kP
a)
(kP
a)
Har
mon
ic s
hear
H
uman
«3
hr)
G
* =
G1
+ i
Gz
G1
Gz
[11]
G
rey
mat
ter
2-10
A
xis
1 10
.6
1.5
Axi
s 2
6.3
1.5
Axi
s 3
4.1
1.4
aver
age
7.0
1.5
7.0
1.5
whi
te m
atte
r 2-
10
Axi
s 1
7.7
2.6
Axi
s 2
7.0
3.2
Axi
s 3
7.3
3.5
aver
age
7.3
3.1
7.3
3.1
* A
ssum
ed t
issu
e is
inc
ompr
essi
ble
(v=
O.5
), th
eref
ore
G*
= E
*/3.

Tab
le B
5.3
Cre
ep M
odul
us o
f N
orm
al B
rain
at
37°C
(ty
pica
l va
lues
, n
ot
aver
ages
)
Test
ing
tech
niqu
e*
Spec
ies
Mod
el
Com
pres
sion
Com
pres
sion
Com
pres
sion
Com
pres
sion
Rhe
sus
mon
key
J(t)
= C
1 +
~ I
n(t)
(1
5 m
in)
Hu
man
(6
-12
hr)
Hu
man
(6
-12
hr)
Hu
man
(6
-12
hr)
J(t)
= C
1 -~ I
n(t)
Non
line
ar s
olid
( )
_ <T
oe-,..
..I (
<To
(K22
+ 4
<ToK
3)11
2 K
2)
_ (1
_
I) e
t ---+
-+
---
-e,.
... K
2 K
l 2K
3 2K
3 w
here
,...
.=K
iCl
Non
line
ar f
luid
e(t)
=~+ Cl~
_ C
1(C
2 2 +
4<T
OC3)1
12
~
2Kl~
2K1C
3
+_
1_
[(C2
2 +
4<TO~
)112 _
~] (
t +
....s
-.e-
"'I)
2C
3 K
l
+~ -
[1 +
....
s-.]
(1
-e-
",I)
Kl
~
Res
ults
C1
= 2
_97
kPa-
1 ~ =
0_1
8 kP
a-1
t >0
_1 s
C1
= 2
.45
kPa-
1
~ =
0_1
8 kP
a-1
t >0
_1 s
Kl
= 2
5_77
kP
a K
2 =
20.
46 k
Pa,
K
3 =
104
_04
kPa
C1
= 6
51.8
kP
a s
<To
= 3
.44,
4.8
2, 6
.89
kPa
Kl
= 7
4.41
kP
a K
2 =
20.
67 k
Pa
C1
= 1
266.
38 k
Pa
~ =
365
99.7
kP
a s
~ =
1.3
8 kP
a S2
<T
o =
3.4
4, 4
.82,
6.8
9 kP
a
Sour
ce
[6]
[6]
[12]
[12]

Tab
le B
5.3
Con
tinu
ed
Tes
ting
tec
hniq
ue*
Spec
ies
Com
pres
sion
Flu
id i
nfus
ion
Hu
man
(6
-12
hr)
Cat
Mod
el
Hyp
erel
asti
c w
ith
mat
eria
l di
ssip
atio
n
~ =
["A2
-J:
..][1
+ ~ ]
+ ~
2C
j "A
Cj"
A
Cj
["A2
-6"
A3 +
1]
Por
oela
stic
ae
at
= K
(2G
+ "
A)V
2 e
G =
sh
ear
mod
ulus
"A
= L
ame
cons
tant
K
=
perm
eabi
lity
* A
ll te
sts
cons
iste
d of
a l
oad
appl
ied
rapi
dly
and
then
hel
d co
nsta
nt.
X
"A3
Res
ults
Cj
= 6
.89
kP
a C
2 =
17.
23 k
Pa
Bj
= 0
.55
kP
a S2
"A
= s
tret
ch r
atio
'Ii.
= st
retc
h ra
te
Gre
y m
atte
r G
= 2
kP
a "A
= 9
0 k
Pa
K =
7.5
X 10
-9 k
Pa-
m2 /
s W
hite
mat
ter
G =
0.9
kP
a "A
= 4
0 k
Pa
K =
5 X
10
-9 k
Pa-
m2 /
s
Sour
ce
[12]
[13]

L-_______________ D_IFF __ U_S_I_O_N_P_R_O_P_E_R_T_I_E_S ______________ ~I I 77
85.4 ELECTRICAL PROPERTIES
(no primate data available)
85.4.1 Electrical conductivity temperature coefficient [14]
Cow and pig whole brain (/}.cr/cr)//}.T = 3.2 °e'.
Table B5.4 Electrical conductivity of brain tissues
Temp (0C) Conductivity (s) (mS/cm) Species
Whole brain 37 1.7 cow, pig Cerebrum 39 1.38-1.92 rabbit Cerebellum 39 1.17-1.64 rabbit Cortex body 3.1 rabbit Cortex 37 4.5 cat White matter body 1.0 rabbit White matter 37 2.9 cat
85.5 THERMAL PROPERITES
Source
[14] [15] [15] [16] [17] [18] [17]
Table B5.5 Thermal properties of normal, unperfused human brain tissue
Temp Conductivity, Diffusivity, Specific heat, (0C) (WlmOK) (cm2ls x 1()3) (Jig OK) Source
Whole brain 5-20 0.528 1.38 ± 0.11 [19] Whole brain 37 0.503-0.576 [20] Cortex 37 0.515 1.47 [21]
5-20 0.565 1.43 ± 0.09 3.68 [19] White matter 5-20 0.565 1.34 ± 0.10 3.60 [19]
Values A-B indicate approximate range, values A ± B indicate mean ± standard deviation.
85.6 DIFFUSION PROPERTIES
5.6.1 Sucrose (feline brain) [22]
o - 3.2-3.8 X 10.6 cm2/sec matter - 1.3 - 1.9 x 10⁻⁶ cm2/sec white matter
85.6.2 Small ions [23]
o - 8.6 X 10⁻⁶ cm2/sec

BRAIN TISSUE 78 I I L-__________________________________________________________ ~
5.6.3 Large molecules (>150 angstrom): [23]
Hindered diffusion occurs
B5.7 COMMENTS
The list of primate brain tissue properties presented in this chapter highlights the numerous areas where data are either unavailable or largely incomplete. With a renewal of interest in modeling the normal and pathological response of the brain to various stimuli, it is possible that some of the missing tissue property data will be generated in the near future. Investigators should be cautioned, however, that because brain tissue properties vary with environmental factors, measurements made under unphysiologic conditions may differ from those of living tissue. As an example, the brain is highly vascularized, and the role of blood flow, volume, and pressure on tissue behavior remains to be determined.
The caution exercised by the experimentalist in generating new data should be matched by sound skepticism on the part of the investigators who are developing analytical or computational models of brain functional and structural response. Although the ability to calculate detailed responses has improved greatly in the past decade, these sophisticated models are limited by the available experimental data used to develop and validate the models. To create a realistic representation of normal or pathological response of the brain, it is essential that the model parameters be based on measured tissue properties and that any conclusions drawn from the models be validated with measured response data. Therefore, it is clear that future experimental studies are needed to determine the properties and response of living primate brain tissue.
ADDITIONAL READING
Cooney, D.O. (1976) Biomedical Engineering Principles: An introduction to fluid, heat and mass transfer processes, Marcel Dekker, New York.
Provides more detailed examples in bioheat transfer and pharmacokinetics which may be useful in modeling heat and mass transfer in the brain parenchyma.
Fung, Y.c. (1993) Biomechanics: Mechanical properties of living tissues, 2nd ed., Springer-Verlag, New York.
Fung, Y.c. (1990) Biomechanics: Motion, flow, stress and growth, Springer-Verlag, New York.
Fung, y.c. (1965) Foundations of Solid Mechanics, Prentice Hall, Englewood Cliffs. These works describe both basic principles of mechanics and their specific appli
cations in biomechanics. A review of the constitutive property relationships for biological tissues included throughout these texts may be particularly helpful for applying the material-property information listed previously.

L-___________________ R_E_FE_R __ EN __ C_E_S __________________ ~I I 79
Lih, M.L. (1975) Transport Phenomena in Medicine and Biology, John Wiley & Sons, New York.
A concise review of the principles used in modeling the transport phenomena in several biological systems including examples of heat and mass transfer.
Nolte, J. (1988) The Human Brain, 2nd. ed., C.V. Mosby, St Louis Provides a more detailed review of the structure and function of the different
brain regions.
REFERENCES
1. Duck, F.A. (1990) Physical Properties of Tissue, Academic Press, New York. 2. ICRP (1975) Report of the Task Group on Reference Man, ICRP Publication
23, International Commission on Radiological Protection, Pergamon Press, Oxford, pp. 212-215; 280--281.
3. Woodard, H.Q. and White, D.R. (1986) The composition of body tissues. Brit. J. Radiol., 59, 1209-1219.
4. McElhaney, J.H., Roberts, V.L. and Hilyard, J.F. (1976) Handbook of Human Tolerance, Japanese Automobile Research Institute, Tokyo, pp. 151.
5. Fung, Y.c. (1993) Biomechanics: Mechanical properties of living tissues, 2nd ed., Springer-Verlag, New York.
6. Galford, J.E. and McElhaney, J.H. (1970) A viscoelastic study of scalp, brain, and dura. J. Biomech., 3, 211-221.
7. Fallenstein, G.T., Hulce, V.D. and Melvin, J.W. (1969) Dynamic mechanical properties of human brain tissue. J. Biomech., 2, 217-226.
8. Wang, H.C. and Wineman, A.S. (1972) A mathematical model for the determination of viscoelastic behavior of brain in vivo - I: Oscillatory response. J. Biomech., 5, 431-446.
9. Metz, H., McElhaney, J. and Ommaya, A.K. (1970) A comparison of the elasticity of live, dead, and fixed brain tissue. J. Biomech., 3, 453-458.
10. Ljung, C. (1975) A model for brain deformation due to rotation of the skull. 1. Biomech., 8,263-274.
11. Shuck, L.Z. and Advani, S.H. (1972) Rheological response of human brain tissue in shear. J. Basic Eng., Trans ASM E, 94, 905-91l.
12. Pamidi, M. and Advani, S. (1978) Nonlinear constitutive relations for human brain tissue. J. Biomech. Eng., 100,44-48.
13. Basser, P. (1992) Interstitial pressure, volume and flow during infusion into brain tissue. Microvascular Res., 44, 143-165.
14. Osswald, K. (1937), (Measurement of the conductivity and dielectric constants of biological tissues and liquids by microwave) (Ger.) Messung der Leitfahigkeit und Dielektrizitatkonstante biologischer gewebe und Flussigkeiten bei kurzen Wellen. Hochfrequentz Tech. Elektroakustik, 49, 40-49.
15. Crile, G.W., Hosmer, H.R. and Rowland, A.F. (1922) The electrical conductivity of animal tissues under normal and pathological conditions. Am. J. Physiol., 60, 59-106.
16. Ranck, J.B. and Be Merit, S.L. (1963) Specific impedance of rabbit cerebral cortex. Exp. Neurol., 7 144-152.

80 I I'---__________ B_R_A_I_N_T_IS_S_U_E _________ ----'
17. Freygang, W.H. and Landaw, W.M. (1955) Some relations between resistivity and electrical activity in the cerebral cortex of the cat. J. Cell. Compo Physiol., 45, 377-392.
18. van Harreveld, A., Murphy, T. and Nobel, K.W. (1963) Specific impedance of rabbit's cortical tissue. Am. J. Physiol., 205, 203-207.
19. Cooper, T.E. and Trezek, G.l. (1972) A probe technique for determining thermal conductivity of tissue. J. Heat Transfer, Trans. ASME, 94, 133-140.
20. Bowman, H.F. (1981) Heat transfer and thermal dosimetry. J. Microwave Power, 16, 121-133.
21. Valvano, 1.W., Cochran, 1.R. and Diller, K.R. (1985) Thermal conductivity and diffusivity of biomaterial measured with self-heating thermistors. Int. J. Thermophys., 6, 301-311.
22. Rosenberg, G.A., Kyner, W.T. and Estrada, E. (1980) Bulk flow of brain interstitial fluid under normal and hypermolar conditions. Am. J. Physiol., 238, f42-f49.
23 Nicholson, C. (1985) Diffusion from an injected volume of substance in bn tissue with arbitrary volume fraction and tortuosity. Brain Research, 3: 325-329.

Arteries, veins and lymphatic vessels
X. Deng and R. Guidoin
B6.1 INTRODUCTION
Blood and lymphatic vessels are soft tissues with densities which exhibit nonlinear stress-strain relationships [1]. The walls of blood and lymphatic vessels show not only elastic [2, 3] or pseudoelastic [4] behavior, but also possess distinctive inelastic character [5, 6] as well, including viscosity, creep, stress relaxation and pressure-diameter hysteresis. The mechanical properties of these vessels depend largely on the constituents of their walls, especially the collagen, elastin, and vascular smooth muscle content. In general, the walls of blood and lymphatic vessels are anisotropic. Moreover, their properties are affected by age and disease state. This section presents the data concerning the characteristic dimensions of arterial tree and venous system; the constituents and mechanical properties of the vessel walls. Water permeability or hydraulic conductivity of blood vessel walls have been also included, because this transport property of blood vessel wall is believed to be important both in nourishing the vessel walls and in affecting development of atherosclerosis [7-9].
The data are collected primarily from human tissue but animal results are also included in places for completeness. Among the three kinds of vessels, the arterial wall has been extensively investigated while studies of lymphatic vessels are very rare.
Handbook of Biomaterial Properties. Edited by 1. Black and G. Hastings. Published in 1998 by Chapman & Hall, London. ISBN 0412603306.
B6

82 I IL-____ A_R_T_E_Rl_E_S_, VE __ IN_S_AND __ L_YMP __ HA __ T_IC_VE_SS_E_LS ____ --'
B6.2 MORPHOMETRY OF THE ARTERIAL TREE AND VENOUS SYSTEM
Detailed measurements of the number and size of blood vessels in the living body are very difficult to perform, so reliable information is scarce. Moreover, data collected on vessels in one tissue or organ are not applicable to another. Thus one should be cautious in using morphometric data; only the data for large vessels are reliable.
The aorta is tapered, but most other arteries can be considered to have a constant diameter between branches. The rate of taper varies from individual to individual, presumably, between species. However, in the dog, the change of aortic cross sectional area can be described by the exponential equation:
(B6.1)
where A is the cross sectional area of the aorta, Ao and Ro are the respective cross sectional area and radius at the upstream site, x is the distance from the upstream site, and 13 a taper factor, which varies between 0.02 and 0.05 [10]. In man, the taper is found not to be as smooth as implied by the above equation; thus values of 13 are unavailable.
Morphometric and related data are given in Tables B6.1, B6.2 and B6.3.
B6.3 CONSTITUENTS OF THE ARTERIAL WALL
B6.3.1 Normal arterial wall
The main constituents of normal human arterial tissues from young adult subjects (20-39 years) are listed in Table B6.4 [20]. The major part of the
Table B6.1 Morphometric and Related Properties of the Human Systemic Circulation*
Vessel
Ascending aorta Arch of aorta Thoracic aorta Abdominal aorta Femoral artery Carotid artery Radial artery Large artery Capillaries Large veins Vena cava
Diameter Wall thickness (mm) (mm)
32 1.6 25-30
20 1.2 17-20 0.9
8 0.5 9 0.75 4 0.35
2-6 0.005-0.01
5-10 20
Length (cm)
5-5.5 4-5 16 15 32 18 23
Blood velocity Reynolds (ern/sec) number
63 3600-5800
27
20-50 0.05-0.1 15-20 11-16
1200-1500
110-850 0.0007-0.003
210-570 630-900
* Source [11-17]. Note: The Reynolds numbers were calculated assuming a value for the viscosity of the blood of 0.035 poise.

CONSTITUENTS OF THE ARTERIAL WALL I
Table B6.2 Morphometries of the Pulmonary Arterial System*
Zone Number of branches Diameter (mm) Length (mm)
Proximal 1.000 30.000 90.50 3.000 14.830 32.00 8.000 8.060 10.90 2.000 x 10 5.820 20.70 6.600 x 10 3.650 17.90 2.030 x 10² 2.090 10.50 6.750 x 10² 1.330 6.60 2.290 x 10³ 0.850 4.69
Intermediate 5.861 x 10³ 0.525 3.16 1.756 x 10⁴ 0.351 2.10 5.255 x 10⁴ 0.224 1.38 1.574 x 10⁵ 0.138 0.91
Distal 4.713 x 10⁵ 0.086 0.65 1.411 x 10⁶ 0.054 0.44 4.226 x 10⁶ 0.034 0.29 1.266 x 10⁷ 0.021 0.20 3.000 x 10⁸ 0.013 0.13
* Source: Adapted from [18]. Note: The data were obtained from a 32-year-old woman who had been free of respiratory disease and died of uremia. For the purpose of description, the pulmonary arterial tree was divided into three zones.
dry matter in the arterial wall consists of proteins such as elastin and collagen. Because the importance of elastin and collagen in the mechanical properties of arterial wall, the composition of media and adventitial layers in terms of collagen, elastin, smooth muscle and ground substance is listed in Table B6.5 for three different arterial tissues [1]. The collagen in adventitia and media is mostly Type III, some Type I, and a trace of Type V while the collagen of the basal lamina is Type IV [1].
Table B6.6 lists the constituents of additional arteries (canine), and the the ratio of collagen to elastin [21].
Composition changes of arterial tissues with age
The composition of normal human arterial tissues is altered with age in many aspects. Table B6.7 lists the observed changes in human aorta, pulmonary and femoral arteries [20]. There is a tendency that both the dry matter and nitrogen content of arterial tissues decreases with age. However, the relative quantity of collagen [22] and elastin [23, 24] in the arterial wall remains almost unchanged with age. Below the age of 39, the wall of human thoracic aorta has 32.1 ± 5.5% elastin, between the age 40-69, the wall contains 34.4 ± 9.3%, and from 70-89, the elastin content is 36.5 ± 10.1 [24].
I 83

Tab
le B
6.3
Mor
phom
etri
c an
d R
elat
ed P
rope
rtie
s of
the
Can
ine
Syst
emic
Cir
cula
tion
*t
Site
A
scen
ding
D
esce
ndin
g A
bdom
inal
F
emor
al
Car
otid
V
ena
cava
, P
ulm
onar
y ao
rta
aort
a ao
rta
arte
ry
arte
ry
Art
erio
le
Cap
illar
y V
enul
e in
feri
or
arte
ry,
mai
n
Inte
rnal
dia
met
er,
1.5
1.3
0.9
0.4
0.5
5 x
10.3
6 X
10
4 4
X 10
.3
1.0
1.7
d j (c
m)
(1.0
-2.4
) (0
.8-1
.8)
(0.5
-1.2
) (0
.2-0
.8)
(0.2
-0.8
) (1
-8 x
10-
3 )
(4-8
x 1
04)
(1-7
.5 x
10-
3 )
(0.6
-1.5
) (1
.0-2
.0)
Wal
l th
ickn
ess,
0.
065
0.05
0.
04
0.03
2
x 10
-3
1 x.
104
2 X
10
4 0.
015
0.02
h
(cm
) (0
.05-
0.08
) (0
.04-
0.06
) (0
.02-
0.06
) (0
.02-
0.04
) (0
.01-
0.02
) (0
.01-
0.03
)
h1~
0.07
0.
06
0.07
0.
08
0.4
0.17
0.
05
0.01
5 0.
01
(0.0
55-0
.084
) (0
.04-
0.09
) (0
.055
-0.1
1)
(0.0
53-0
.095
)
In v
ivo
leng
th
5 20
15
10
15
0.
15
0.06
0.
15
30
3.5
(cm
) (1
0-20
) (0
.1-0
.2)
(0.0
2-0.
1)
(0.1
-0.2
) (2
0-40
) (3
-4)
Cro
ss-s
ecti
on
area
(cm
2 )
2 1.
3 0.
6 0.
2 0.
2 2x
1O-5
3x
lO-7
2x
10-5
0.
8 2.
3
Tot
al v
ascu
lar
cros
s-se
ctio
n at
ea
ch l
evel
(cm
2 )
2 2
2 3
3 12
5 60
0 57
0 3.
0 2.
3
Blo
od v
eloc
ity
1.2
1.05
0.
55
1.0
0.75
0.
07
0.35
0.
25
0.7
(pea
k) (
ms-
I)
(0.4
-2.9
) (0
.25-
2.5)
(0
.5-0
.6)
(1.0
-1.2
) (0
.15-
0.4)
Blo
od v
eloc
ity
0.2
0.2
0.15
0.
1 (5
-10
x 10
-3)
2-17
x 1
04
2-5
X 10
-3
0.15
(m
ean)
(m
s-I)
(0
.1-0
.4)
(0.1
-0.4
) (0
.08-
0.2)
(0
.1-0
.15)
(0
.06-
0.28
)
Pea
k R
eyno
lds
num
ber,
Re
4500
34
00
1250
10
00
0.09
0.
001
0.03
5 70
0 30
00
* S
ourc
e: A
dapt
ed f
rom
[19
]. t
Nor
mal
val
ues
for
cani
ne c
ardi
ovas
cula
r pa
ram
eter
s. A
n ap
prox
imat
e av
erag
e va
lue,
and
the
n th
e ra
nge,
is
give
n w
here
pos
sibl
e. A
ll v
alue
s ar
e fo
r th
e do
g ex
cept
tho
se f
or a
rter
iole
, ca
pill
ary,
and
ven
ule,
whi
ch h
ave
only
bee
n m
easu
red
in s
mal
ler
mam
mal
s.

CONSTITUENTS OF THE ARTERIAL WALL I I 85 L-______________________________________________________ ~
Table 86.4 Composition of Normal Arterial Tissue*
Aorta Femoral artery Brachial artery Components (human) (human) (human)
Organic Dry matter 28.0t 25.3 26.3 Nitrogen 4.1 3.5 Total lipids 1.680 Cholesterol 0.290 0.135 0.185
Inorganic Total ash 0.730 0.675 0.670 Calcium 0.070 0.147 0.144 Total P04 0.375
* Source: Adapted from [20). t Values are expressed in percentage of wet tissue weight.
Table 86.5 Composition of Human Arteries at In Vivo Blood Pressure
Thoracic aorta
Media Smooth muscle Ground substance Elastin Collagen Adventitia Collagen Ground substance Fibroblasts Elastin
* Source: Adapted from [1). t (Mean ± S.D.)
33.5 ± lO.4t 5.6 ± 6.7
24.3 ± 7.7 36.8 ± 10.2
77.7 ± 14.1 10.6 ± 10.4 9.4 ± 11.0 2.4 ± 3.2
Plantar artery
60.5 ± 6.5 26.4 ± 6.4 l.3±1.l
11.9 ± 8.4
63.9 ± 9.7 24.7 ± 2.6 11.4 ± 2.6
o
Pulmonary artery
46.4 ± 7.7 17.2 ± 8.6 9.0 ± 3.2
27.4 ± 13.2
63.0 ± 8.5 25.1 ± 8.3 10.4 ± 6.1 1.5 ± 1.5
Changes in elastin and collagen content due to hypertension
Experimental observation by Wolinsky [25] showed that the absolute amounts of both elastin and collagen contents increased in hypertensive rats; however, the percentage of these elements remained essentially constant (Table B6.8)
Changes in elastin and collagen content due to atherosclerosis
Table B6.9 lists the changes in elastin and collagen contents of canine carotid and iliac arteries due to dietary atherosclerosis [26]. In the iliac site the ratio of collagen to elastin was increased, while the ratio in the carotid site was decreased.

Tab
le B
6.6
Art
eria
l W
all
Con
stit
uent
s, a
nd R
atio
of
Col
lage
n to
Ela
stin
*
Art
ery
nt
Cor
onar
y 9
Aor
ta,
asce
ndin
g 9
Car
otid
6
Aor
ta,
abdo
min
al
10
Cra
nial
mes
ente
ric,
10
pr
oxim
al
Cra
nial
mes
ente
ric,
9
dist
al
Cra
nial
mes
ente
ric,
10
br
anch
es
Ren
al
9 F
emor
al
10
* So
urce
: [2
1] b
y pe
rmis
sion
. t
Num
ber
of s
peci
men
s.
Per
cent
age
of
wet
tis
sue
HP
E
xtra
cted
fat
+H
2O
63.2
± 1
.0:1:
71
.5 ±
1.4
73
.8 ±
0.6
74
.0 ±
0.5
71
.1 ±
0.1
71
.2 ±
0.1
70
.4 ±
0.4
70
.8 ±
0.3
70
.8 ±
0.5
71
.6 ±
0.4
71.4
± 0
.4
72.0
± 0
.4
69.5
± 0
.6
73.1
± 0
.7
70.4
± 0
.7
70.8
± 0
.7
68.0
± 0
.3
68.1
± 0
.3
Per
cent
age
of
dry
defa
tted
tis
sue
Col
lage
n E
last
in
Col
lage
n+el
astin
47.9
± 2
.6
15.6
± 0
.7
63.5
± 2
.7
19.6
± 1
.2
41.1
± 2
.1
60.7
± 2
.2
50.7
± 2
.1
20.1
± 1
.0
70.8
± 2
.5
45.5
± 1
.7
30.1
± 1
.7
75.6
± 1
.8
38.1
± 1
.7
26.5
± 1
.7
64.6
± 1
.8
37.4
± 1
.4
22.4
± 1
.5
59.8
± 1
.6
36.1
± 1
.5
21.8
± 0
.9
57.9
± 1
.7
42.6
± 1
.6
18.7
± 1
.8
61.3
± 2
.1
44.5
± 1
.4
24.5
± 1
.6
69.0
± 2
.1
C
E
3.12
± 0
.21
0.49
± 0
.04
2.55
± 0
.13
1.58
± 0
.15
1.51
± 0
.15
1.72
± 0
.11
1.69
± 0
.10
2.46
± 0
.27
1.89
± 0
.14
* Spe
cim
ens
slig
htly
deh
ydra
ted
owin
g to
una
void
ably
lon
g di
ssec
tion.
Mea
n ±
sta
ndar
d de
viat
ion.
All
perc
enta
ge v
alue
s re
fer
to w
/w.

CONSTITUENTS OF THE ARTERIAL WALL I I 87
Table 86.7 Variation of Normal Human Arterial Tissue Composition with Age*
Aorta Age Acid-group Dry Nitro- Total Choles- Total Cal- Total soluble Potas-(years) matter gen lipids terol ash cium P04 P04 sium
10-19 29.5t 4.38 1.23 0.15 0.Q3 0.25 0.16 0.055 30-39 28.5 4.03 1.75 0.28 0.81 0.09 0.40 0.29 0.040 50-59 28.0 3.67 1.90 0.48 1.55 0.21 0.54 0.41 0.039 70-79 28.0 3.38 0.71 2.80 0.39 0.033
Pulmonary artery Femoral artery Age group Dry Nitro- Choles- Cal- Potas- Dry Nitro Choles- Total Cal-(years) matter gen terol cium ium matter gen terol ash cium
10-19 26.5 3.91 0.12 0.025 0.033 26.9 3.84 0.11 0.59 0.14 30-39 25.7 3.71 0.17 0.028 0.031 24.4 3.30 0.15 0.71 0.18 50-59 24.9 3.45 0.22 0.027 0.026 22.8 2.83 0.23 1.15 0.40 70-79 23.0 3.25 0.060 0.025 25.3 2.90 0.55 3.17 1.07
* Source: Adapted from [20]; see for additional age group values. t Values expressed in percentage of wet tissue weight.
Table 86.8 Effect of Hypertension on Composition of Arteries*
dry wt Elastin (E) Collagen (C) E and C
Group Nt (mg) Wt(mg)(% total wt) WT(mg)(% total wt) (% total wt)
III Ct 2 5.25 1.76 33.5 0.69 13.1 46.6 5.58 2.20 39.0 0.83 14.3 53.3
III Ht 2 7.00 2.86 41.6 1.44 20.6 62.2 6.50 2.78 42.8 1.06 16.3 59.1
IIC 2 4.96 2.23 44.9 0.72 14.5 59.4 5.26 2.14 40.6 0.68 12.8 53.4
IIH 2 8.12 2.94 36.2 1.68 20.7 56.9 7.50 2.70 36.0 1.52 20.3 56.3
IC 2 4.36 1.91 43.8 1.12 25.7 69.5 5.56 2.09 37.6 1.24 22.3 59.9
IH 2 8.88 3.08 34.7 2.08 23.4 58.1 10.89 3.50 32.1 2.33 21.4 53.5
P<O.Ol# P<O.OOl P>0.2 P<O.OI P=0.2 P>0.8
* Source: [25] by permission: t: N = number of animals (rats); C = normotensive; H - hyper-tensive. #: Normotensive vs. hypertensive

88 I I<--____ A_R_T_E_R_I_E_S_, V_E_IN_S_A_N_D_L_Y_M_P_H_A_T_IC_V_E_SS_E_L_S ___ ----'
Table 86.9 Effect of Atherosclerosis on Comparison of Arteries*
Collegen + HP (g/kg Collagen Elastin Elastin Collegen
Site wet wt) (% dry wt) (% dry wt) (% dry wt) Elastin
Carotid Control (n = 11) 740±3t 50.6±0.8
Diet (n = 7) 764±7## 49.8±1.6 Iliac
Control (n = 16) 742±3 46.2±0.6 Diet (n = 5) 724±6## 37.8±2.0
* Source: (26) by permission; canine subjects. t means ± SE.
28.0±0.3 78.6±0.8 33.1±1.3## 84.2±1.9##
33.0±0.7 79.2±1.1 25. l± 1.2## 66.0±2.3##
## Significantly different, P < 0.01; # Significantly different, P < 0.05.
B6.4 CONSTITUENTS OF THE VENOUS WALL
B6.4.1 Normal venous wall
1.81±0.04 1.61±0.07#
1.41±0.03 1.49±0.02#
The main constituents of normal human venous tissue are listed in Table B6.10.
Table 86.10 Composition of Normal Human Venous Tissue*
Dry matter Nitrogen Cholesterol Total ash Calcium Potassium
Femoral vein
28.0t 4.08 0.076 0.590 0.058
* Source: adapted from (27). t Percentage of wet tissue weight.
Vena cava, inferior
26.1
0.083
0.012 0.065
B6.4.2 Changes with age in composition of normal venous tissues
The changes with age in the composition of normal venous vessels are listed in Table B6.11.
B6.5 MECHANICAL PROPERTIES OF ARTERIES
The blood vessel wall consists of three layers: the intima, media, and adventitia. The intima contains mainly the endothelial cells that contribute little to the strength of the blood vessels. The media and the adventitia

MECHANICAL PROPERTIES OF ARTERIES I Table 86.11 Composition of Normal Human Venous Tissue*
Femoral vein Age group Dry matter Nitrogen Cholesterol Total ash Calcium
0-9 31.1t 4.63 0.058 0.525 0.051 20-29 27.4 3.88 0.071 0.586 0.053 40-49 24.7 3.34 0.064 0.542 0.065 60-69 23.2 3.06 0.087 0.555 0.075 70-79 21.8 2.92 0.087 0.600 0.083
Vena cava, inferior Age group Dry matter Nitrogen Cholesterol Calcium Potassium
0-9 30.9 20-29 26.8 0.082 0.011 0.072 40-49 24.5 0.091 0.011 0.053 60-69 21.7 0.097 0.010 0.048 70-79 22.7 0.097 0.011 0.048
* Source: [27] by permission.; see source for additional age groups. t Percentage of wet tissue weight.
contain smooth muscle cells, elastin and collagen. Elastin is the most 'linearly' elastic biosolid material known. Unlike elastin, collagen does not obey Hooke's Law. However, collagen is the main load carrying element of blood vessels. Table B6.12 lists the mechanical properties of tissues composing the blood vessel wall.
B6.5.1 Static mechanical properties of arteries
Studies of arterial wall mechanics have clearly established the anisotropic nature of arteries [1, 29, 30]. In vivo pressurized arteries are deformed simultaneously in all directions. But, experimental studies [31] have demonstrated that arteries deform orthotropically. Therefore, arterial deformations may be examined in three orthogonal directions, namely, the longitudinal, circumferential, and radial directions. There are nine
Table 86.12 Mechanical Properties of Layers of the Vascular Wall*
Young's Relative Maximum Tensile modulus extensibility· extension strength
Material ( dynes/cm2) (cm) (%) (dynes/cm2)
Elastin 3 to 6 X 10⁶ 10 100-220 3.6 x 10⁶ to 4.4 X 10⁷
Collagen 1 x 10⁹ to 2.9 X 10¹⁰ 0.03 5.50 5 x 10⁷ to 5 X 10⁹
Smooth muscle Relaxed 6 x 10⁴ 300 Contracted 1 x 10⁵ to 12.7 X 10⁶ 2.3 300
* Source: Adapted from [28]; Fiber 10 em in length, 1 mm2 cross section, sustaining a load of 30 g.
I 89

90 I LI ________ A_R_T_E_R_I_E_S_,_V_E_IN_S_A __ N_D_L_Y_M __ PH __ A_T_IC __ V_E_SS_E_LS ________ ~
elastic parameters: the three elastic moduli, Eo, Ez and Er; and six Poisson's ratios, O"rO' O"Or' O"ZO, O"oz, O"rz and O"zr. As far as hemodynamics is concerned, however, among the three elastic moduli the circumferential one is most important.
The cicumferential elastic modulus is termed the incremental modulus and determined by the following equation (B6.2):
tlp 2(1 - (J'2)R R2 E _ I 0 I
9 - tlRo (Ro2 - Rl) (B6.2)
where Llpi is the transmural pressure increment, Ro and R; are the respective external and internal diameter of the vessel, LlRo is the change in the external diameter due to LlPi' and 0" the Poisson's ratio (the ratio of transverse strain to longitudinal strain). The detailed technique for measuring the circumferential incremental elastic modulus of the arteries was described by Bergel [32].
Table B6.13 presents the circumferential incremental elastic modulus of human arterial walls from young adults (~ 35 years) at a transmural pressure of 100 mmHg.
Experimental data by Bader [34] demonstrated that the circumferential elastic modulus of human thoracic aorta increased almost linearly with age. Table B6.14 gives the variation with age in the elastic moduli for human thoracic and abdominal aorta at a pressure of 100 mmHg.
It should be mentioned that all the circumferential elastic moduli given in Table B6.14 are based on the assumption of a Poisson's ratio of 0.5. This is not strictly true when large strains are considered [36]. Patel et al. [37] measured Poisson's ratios for the aorta in living dogs at a transmural pressure of about 110 mmHg, as well as the circumferential, longitudinal and radial incremental elastic moduli and determined that individual values vary between 0.29 and 0.71.
Table B6.13 Elastic Modulus of Human Arteries*
Arterial segment
Thoracic aorta Abdominal aorta Iliac artery Femoral artery Carotid artery
E9 (x1ff1 dynes/cm2)
4.0-10 4.0-15 8.0-40 12-40
3.0-8.0
* Source: Adapted from [33,34]; young subjects (~ 30 years) at a transmural pressure of 100 mmHg. Note: The circumferential elastic moduli were calculated assuming that the arterial walls have a Poisson's ratio (the ratio of transverse to longitudinal strain) of 0.5.
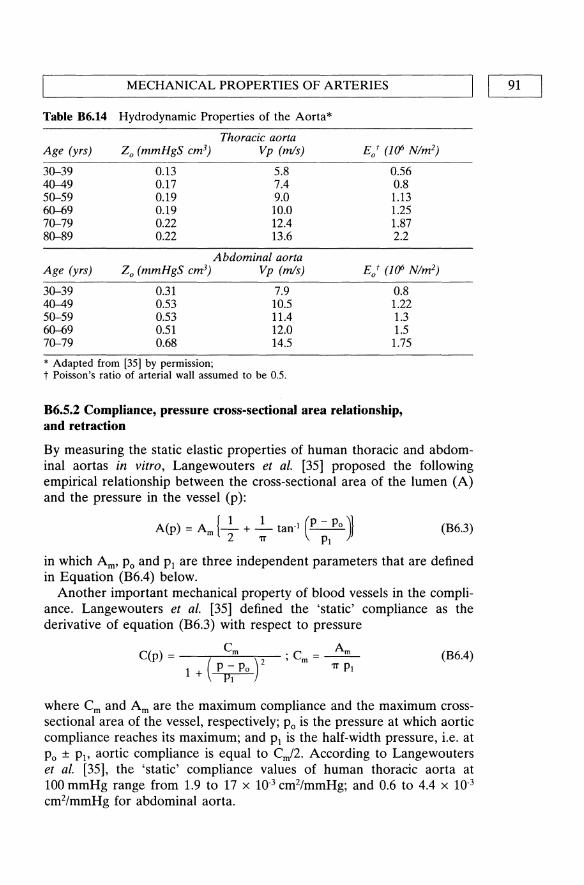
'--____ M_E_C_H_A_N_I_C_A_L_P_R_O_P_E_R_T_I_E_S_O_F_A_R_TE_R_I_E_S ____ -----11 I 91
Table B6.14 Hydrodynamic Properties of the Aorta*
Thoracic aorta Age (yrs) Zo (mmHgS em3) Vp (m/s) E/ (J(/> Nlm2)
30--39 0.13 5.8 0.56 40--49 0.17 7.4 0.8 50--59 0.19 9.0 1.13 60--69 0.19 10.0 1.25 70--79 0.22 12.4 1.87 80--89 0.22 13.6 2.2
Abdominal aorta Age (yrs) Zo (mmHgS em3) Vp (m/s) Eot (J(/> Nlm2)
30--39 0.31 7.9 0.8 40--49 0.53 10.5 1.22 50--59 0.53 11.4 1.3 60--69 0.51 12.0 1.5 70--79 0.68 14.5 1.75
* Adapted from [35] by permission; t Poisson's ratio of arterial wall assumed to be 0.5.
B6.5.2 Compliance, pressure cross-sectional area relationship, and retraction
By measuring the static elastic properties of human thoracic and abdominal aortas in vitro, Langewouters et al. [35] proposed the following empirical relationship between the cross-sectional area of the lumen (A) and the pressure in the vessel (p):
A(p) = Am {_I + _1 tan· I (P - Po )~ 2 1T PI
(B6.3)
in which Am' Po and PI are three independent parameters that are defined in Equation (B6.4) below.
Another important mechanical property of blood vessels in the compliance. Langewouters et al. [35] defined the 'static' compliance as the derivative of equation (B6.3) with respect to pressure
C(p) = (Cm t 1 + P - Po
PI
·C =~ , m (B6.4) 1T PI
where Cm and Am are the maximum compliance and the maximum crosssectional area of the vessel, respectively; Po is the pressure at which aortic compliance reaches its maximum; and PI is the half-width pressure, i.e. at Po ± PI' aortic compliance is equal to Cm/2. According to Langewouters et al. [35], the 'static' compliance values of human thoracic aorta at 100 mmHg range from 1.9 to 17 x 10-3 cm2/mmHg; and 0.6 to 4.4 x 10⁻³
cm2/mmHg for abdominal aorta.
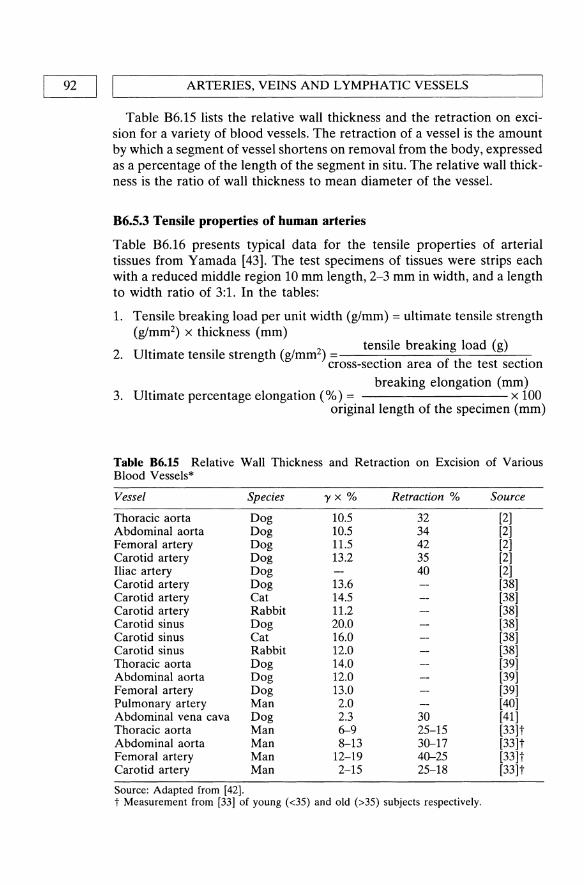
92 I IL-_______ A_R_TE __ R_I_E_S_,V __ E_IN_S_A_N __ D_L_Y_M_P_H_A __ T_IC __ V_E_SS_E_L_S ______ ~
Table B6.15 lists the relative wall thickness and the retraction on excision for a variety of blood vessels. The retraction of a vessel is the amount by which a segment of vessel shortens on removal from the body, expressed as a percentage of the length of the segment in situ. The relative wall thickness is the ratio of wall thickness to mean diameter of the vessel.
B6.5.3 Tensile properties of human arteries
Table B6.16 presents typical data for the tensile properties of arterial tissues from Yamada [43]. The test specimens of tissues were strips each with a reduced middle region 10 mm length, 2-3 mm in width, and a length to width ratio of 3:1. In the tables:
1. Tensile breaking load per unit width (g/mm) = ultimate tensile strength (g/mm2) x thickness (mm) Ul . '1 h 2 tensile breaking load (g)
2. tIm ate tens 1 e strengt (glmm). . cross-section area of the test sectlOn
breaking elongation (mm) 3. Ultimate percentage elongation (%) = x 100
original length of the specimen (mm)
Table B6.15 Relative Wall Thickness and Retraction on Excision of Various Blood Vessels*
Vessel Species 'Y x % Retraction % Source
Thoracic aorta Dog 10.5 32 [2] Abdominal aorta Dog 10.5 34 [2] Femoral artery Dog 11.5 42 [2] Carotid artery Dog 13.2 35 [2] Iliac artery Dog 40 [2] Carotid artery Dog 13.6 [38] Carotid artery Cat 14.5 [38] Carotid artery Rabbit 11.2 [38] Carotid sinus Dog 20.0 [38] Carotid sinus Cat 16.0 [38] Carotid sinus Rabbit 12.0 [38] Thoracic aorta Dog 14.0 [39] Abdominal aorta Dog 12.0 [39] Femoral artery Dog 13.0 [39] Pulmonary artery Man 2.0 [40] Abdominal vena cava Dog 2.3 30 [41] Thoracic aorta Man 6-9 25-15 [33]t Abdominal aorta Man 8-13 30-17 [33]t Femoral artery Man 12-19 40-25 [33]t Carotid artery Man 2-15 25-18 [33]t
Source: Adapted from [42]. t Measurement from [33] of young (<35) and old (>35) subjects respectively.

L-________ M __ E_C_H_A_N_I_C_A_L_P_R_O_P_E_R_T_I_E_S_O_F_A_R_TE __ R_I_E_S ________ ~I I 93
Table 86.16 Tensile Properties of Human Coronary Arterial Tissue* (Longitudinal Direction)
Age (yrs)
10-19 20-39 40-59 60-79 Adult (average)
* Adapted from [43].
Tensile Breaking Load/Unit width
(g/mm)
85±3.1 82±1.8 82±1.8 79±2.9
81
Ultimate Tensile Strength (g/mm2)
140±3.0 114±9.3 104±4.7 104±4.7
107
Ultimate Elongation
(%)
99±2.4 78±1.6 68±3.5 4.5±3.8
64
Table B6.l6 lists the tensile data for human coronary arterial tissue in the longitudinal direction. Other arteries have similar properties [43]. Yamada [43] provides the tensile properties of animal tissues in various tables.
B6.5.4 Dynamic mechanical properties of arteries
The most direct way to study arterial viscoelasticity is to determine the response of the test tissue to oscillatory stresses. If the arterial wall is conceived to be represented by a simple Kelvin-Voigt model consisting of a spring and a dash pot in parallel, the dynamic elastic component and the viscous component of a vessel can be expressed as
ED=Ecos<l>
1]00 = E sin <I> (B6.5)
where E is the complex dynamic elastic modulus that is identical to the incremental elastic modulus under static stresses; cf> is the phase lag of the strain behind the stress (in the case of circumferential direction, it is the phase lag of diameter behind the pressure); ED is the dynamic elastic modulus of the vessel; and 1]W is the viscous retarding modulus (1] is the viscous constant and w the angular frequency). For measuring the circumferential dynamic mechanical properties, the test vessel is usually subjected to an oscillatory pressure. The pressure oscillations are in a sinusoidal form. In circumferential direction, E can be calculated from equation (B6.2) with the recorded diameter of the blood vessel and the oscillatory pressure [44].
Table B6.l7 lists the dynamic mechanical properties of different arteries at a frequency of 2.0 Hz at a mean pressure of 100 mmHg. In this table, Ep is the circumferential pressure-strain modulus defined as
(B6.6)

94 I ,-I ____ A_R_T_E_R_I_E_S_, V_E_IN_S_A_N_D_L_Y_M_PH_A_T_IC_V_E_SS_E_LS ____ ---'
Table 86.17 Circumferential Dynamic Mechanical Properties of Different Human Arteries*
Vessel
Ascending aorta Carotid Carotid Thoracic aorta Abdominal aorta Femoral Carotid Pulmonary artery
Ep (dynes-cm·2 x 10.6)
0.8 6.2 004
0.6-1.0 0.7-1.5 2.5-7.0 2.5-3.0
0.1-0.16
* Adapted from [42].
cf>(radians)
0.12 0.1 0.15 0.1
6.0 17
4.6+ 6-9+ 6-8+
13-18
2.3-2.9
Source
[29] [29] [45] [33]++ [33]++ [33]++ [33]++ [29]
Elastic modulus and pulse-wave velocity values collected from the literature. Those values for the PWV marked thus: + were measured, the others have been calculated from dynamic elasticity measurements; ++ measurements for young (<35) and old (>35) subjects respectively. <I> = phase difference between wall stress and strain at 2 Hz. Ep is defined in eq (B6.6). The mean pressure was 100 mmHg.
in which dPj is the pressure increment, Ro is the external diameter of the vessel and dRo the external diameter change. Ep is essentially a reciprocal of the compliance of an artery and differs from elastic modulus in that it defines the stiffness of the total artery. Nevertheless, it is an indication of ED'
Another important parameter listed in Table B6.17 is the pulse-wave velocity V p (PWV) that can be calculated from the Moens-Korteweg equation:
YZp = Ehl2Rp (B6.7)
where E = elastic modulus of the wall, h = wall thickness, R = mean radius of the vessel, p = density of blood.
There is general understanding that the dynamic elastic modulus is not strongly frequency dependent above 2-4 Hz and that it increases from the static value at quite low frequencies. Bergel [42] provides additional values for canine vessels.
B6.5.5 Creep and stress relaxation
When a subject is suddenly strained and then the strain is maintained constant afterward, the corresponding stresses induced in the subject decrease with time, this phenomenon is called stress relaxation. If the subject is suddenly stressed and then the stress is maintained afterwards, the subject continues to deform, this phenomenon is called creep. Creep and stress relaxation are another two important phenomena in the arterial viscoelasiticity. Langewouters et al. [46] studied the creep responses of human thoracic and abdominal aortic segments. The pressure in the

MECHANICAL PROPERTIES OF ARTERIES I I 95 L-______________________________________________________ ~
segments was changed in steps of 20 mmHg between 20 and 180 mmHg. Aortic creep curves at each pressure level were described individually by a constant plus biexponential creep model (C-model, [47])
(B6.8)
where A = aortic cross-sectional area; A1 = sample value of aortic creep response at time tj; SA = change in aortic area upon a 20 mmHg pressure step; t = time; i = sample number; a" a2 = creep fraction; T" T2 = time constant. Table B6.18 lists the creep fractions and time constants for all aortic segments [46].
Stress relaxation relations for human arteries are not available; however, Tanaka and Fung [48] studied the stress relaxation spectrum of the canine aorta. They expressed the stress history with respect to a step change in strain in the form:
T (t, I) = G (t) . T(e) (I), G(O) = 1 (B6.9)
where G (t) is the normalized relaxation function of time; T(e) (I) is a function of strain I, called elastic response. This is the tensile stress instantaneously generated in the aortic tissue when a step elongation, I, is imposed on the specimen.
If the relaxation function is written as:
G(t) = ~ [1+ f: S (T)e·thdT] (B6.1O)
in which
sfJ = [1+ f: S (T)dT]
is a normalized factor, then the spectrum S (t) is expected to be a continuous function of relaxation time t. A special form of S (t) is proposed
Table 86.18 Creep Constants of Human Thoracic and Abdominal Aortas*
Thoracic aorta (n = 35) Abdominal aorta (n = 16)
Parameter Range Mean S.D. Range Mean S.D.
U l 0.05-0.13 0.076 0.017 0.05-0.12 0.078 0.017 u2 0.03-0.15 0.102 0.G28 0.07-0.15 0.101 0.G25 tl (S) 0.31-1.43 0.73 0.29 0.33-0.81 0.61 0.12 t2 (S) 5.9-23.5 14.0 4.1 4.6-17.7 12.1 3.4 C (1O~3 cm2
mmHg) 1.5-12.3 5.1 2.5 0.5-3.3 1.5 0.78 Age 30-78 63 14 30-78 58 15
* Adapted from [46] by permission. Cll, Cl2, creep fractions; tl, ~, time constants; C, compliance; S.D., standard deviation.

96 I ~I ________ A_R_T_E_R_I_E_S_,_V_E_IN_S_A __ N_D_L_Y_M __ PH __ A_T_IC __ V_E_S_SE_L_S ________ J S(t) = cIt for tl ~ t ~ t2
= 0 for t < t1, t > t2 (86.11)
Values for segments of the canine aorta are given in [48].
86.6 MECHANICAL PROPERTIES OF VEINS
86.6.1 Static mechanical properties of veins
The structure of the venous walls is basically similar to that of the arterial walls. The main difference is that they contain less muscle and elastic tissue than the arterial walls, which raises the static elastic modulus two to fourfold [49]. Because the venous walls are much thinner than the arterial wall, they are easily collapsible when they are subject to external compressions.
Table B6.19 lists the static incremental elastic moduli of the canine jugular vein and human saphenous vein. For the purpose of comparison, the static increment elastic modulus of the canine carotid artery segments are also presented in the table. This comparison is of interest because in some arterial reconstructive surgeries, a vein is used as a substitute for an artery.
TableB6.19 Comparison of elastic Moduli between Venous and arterial Segments*
Incremental venous Carotid artery Extension ratio elastic modulus Incremental modulus
Pressure A6 Az E6 (dynes/ Ez (dynes/ E6 (dynes/ Ez (dynes/ (cm HP) cm2 x I(/» cm2 x/(/» cm2 x I(/» cm2 x I(/»
Canine Jugular Vein 10 1.457 1.481 15 ± 3* 1.2 ± 0.18t 7.62 5.16 25 1.463 1.530 47 ± 6t 4.4 ± 0.35t 8.39 7.15 50 1.472 1.597 88 ± 7t 11.8 ± 2.1 9.51 10.69 75 1.478 1.646 98 ± 7t 46 ± 13* 10.37 13.97 100 1.482 1.675 117 ± lOt 67 ± 25 10.92 16.24 125 1.484 1.686 134 ± 24t 89 ± 32 11.16 17.17 150 1.484 1.686 171 ± 9t 113 ± 13t 11.16 17.17
Human Saphenous Vein 10 1.357 1.169 0.27 ± 0.12t 1.61 ± 0.32* 5.30 0.017 25 1.417 1.206 0.65 ± O.13t 2.03 ± 0.39* 5.82 0.328 50 1.500 1.266 1.89 ± 0.41 t 2.75 ± 0.78 6.00 0.735 75 1.561 1.325 9.85 ± 1.6 3.18 ± 0.76 9.66 1.80 100 1.602 1.381 15.0 ± 2.6 3.56 ± 0.58 12.77 3.15 125 1.621 1.430 20.4 ± 1.6* 3.98 ± 0.96 14.79 4.59 150 1.621 1.470 25.1 ± 7.5 4.75 ± 1.2 15.51 5.93
* Adapted from [50] by permission. * p < 0.05 for the comparison between the venous and carotid moduli. t P < 0.01 for the comparison between the venous and carotid moduli.

L-__________ M __ E_C_H_A_N_I_C_A_L __ PR __ O_P_E_R_T_IE_S __ O_F_V_E_I_N_S __________ ~I I 97
Sobin [51] obtained data on the mechanical properties of human vena cava from autopsy material. The data may be expressed by the following equation:
T == exEC>.. [a(E2 - E*2) 1
E == (>..2 - 1)/2
T* == exCE*>"*
(B6.12)
where "A. is the ratio of the changed length of the specimen divided by the reference length of the specimen, C and a. are material constants, and E* is the strain that corresponds to a selected value of stress S*. The product of the constant a.C is similar to the elastic modulus, provided that the modulus is defined as the ratio, S*IE*, where S* = T*/"A.*. Fung [1] provides typical values of these constants obtained experimentally; however, no universal constants have been discovered.
Table B6.20 Tensile Properties of Human Venous Tissue*
Age group
Vein Direction 20-39 yr 40-50 yr 60-69 yr adult average
Tensile Breaking Load per Unit Width (g/mm) Inferior vena cava L 102.0 87.0 68.0 89.0
T 245.0 224.0 224.0 232.0 Femoral L 159.0 149.0 149.0 153.0
T 211.0 217.0 224.0 216.0 Popliteal L 116.0 116.0 116.0 116.0
Inferior vena cava
Femoral
Popliteal
Inferior vena cava
Femoral
Popliteal
T 180.0 197.0 158.0 182.0
Ultimate Tensile Strength (kg/mm2)
L 0.15 0.11 0.08 T 0.36 0.28 0.27 L 0.24 0.21 0.20 T 0.32 0.31 0.29 L 0.20 0.17 0.15 T 0.31 0.29 0.20
Ultimate Percentage Elongation L 98.0 77.0 70.0 T 58.0 47.0 44.0 L 97.0 72.0 72.0 T 79.0 67.0 56.0 L 112.0 97.0 81.0 T 77.0 77.0 77.0
0.12 0.31 0.22 0.31 0.18 0.27
84.0 51.0 82.0 70.0 100.0 77.0
* Adapted from [43].L = longitudinal; T = transverse.

ARTERIES, VEINS AND LYMPHATIC VESSELS QOI ~----------------------------------------------------~ B6.6.2 Tensile properties of veins
The tensile properties of human venous tissues are presented in Table B6.20. For the testing method and definitions of the terms in the table, please refer to Section B6.5 on Mechanical properties of arteries.
B6.7 MECHANICAL CHARACTERISTICS OF LYMPHATIC VESSELS
The problem concerning the ontogenesis of the lymphatic vessels is still not completely solved. However, most of the evidence indicates that the large lymphatic vessels are derived from the veins [52]. Therefore, lymphatics can be considered modified veins. According to the reports by Ohhashi et al. [53, 54], the circumferential elastic modulus of the bovine mesenteric lymphatics ranged from 4.2 x 10⁴ to 2.7 X 10⁵ dynes/cm2 at a pressure range from 0 to about 20 mmHg, and the elastic modulus of canine thoracic duct is about 2.0 x 10⁵ dynes/cm2. These values are less than those of veins obtained by Bergel [55]. Therefore, the lymphatics are more distensible than the veins.
B6.8 TRANSPORT PROPERTIES OF BLOOD VESSELS
Under transmural pressures, fluid or plasma will flow across the walls of blood vessels. On one hand, convective fluid motion through the blood vessel wall plays a very important role in nourishing the vessel walls, on the other hand, it is involved in atherogenesis by promoting the transport of macromolecules such as lipoproteins into the arterial wall [55-58], possibly through leaky endothelial cell junctions in regions of high endothelial cell turnover [59]. Table B6.21 lists the filtration properties of excised, presumably normal, human iliac blood vessels.
Table 86.21 Water Permeability of Iliac Vessels*
Vessel
Iliac artery
Iliac vein
* Adapted from [56].
Pressure (mmHg)
0-20 25-80
100 200 0-20
21--40 41-60 61-80 81-100
Filtration rate (em/sec x 1(0)
o 2.58 4.08 6.42 6.94 9.72
11.67 12.22 12.78

L-_E_F_F_E_CT_O_F_A_G_E_, _H_Y_P_E_R_T_E_N_SI_O_N_A_N_D_A_T_H_E_R_O_S_C_L_E_R_O_S_IS_---'I I 99
B6.9 EFFECT OF AGE, HYPERTENSION AND ATHEROSCLEROSIS ON BLOOD VESSELS
B6.9.1 Age
Two well known changes accompany aging of the cardiovascular system are dilation of thoracic aorta [60] and increased thickness of arterial wall [61]. Arterial walls become less distensible with aging [34, 62, 63]. Both dry matter and nitrogen content of artery tissue show a tendency to decrease with age in large and medium sized arteries [20]. But the relative quantity of collagen [22] and elastin [23, 24] in the arterial wall remains essentially unchanged. With aging the arterial wall becomes progressively stiffer. Bader [34] found that the circumferential elastic modulus of human thoracic aorta increased linearly with age. At 100 mmHg, the static circumferential modulus of 'young' « 35 years) human thoracic aorta averaged 7.5 x 10⁶ dynes/cm2, and for the 'old' (> 35 years) the average was 16.6 x 10⁶ dynes/cm2 [33]. Young peripheral arteries tend to have a greater viscosity (1]w) than the older ones [33]. Despite the overall increase in stiffness, the arterial wall itself is considerably weaker than the younger/older one [43].
B6.9.2 Hypertension
Several studies have shown that the water content of human, rat and dog arteries is increased in hypertension, and this increased water content may be associated with an increased wall thickness [64, 65]. Due to the limitations in studying samples from human subjects, animal models (mainly rats) have been employed. Mallov [66] found that the aorta from hypertensive rats had more smooth muscle than normal aorta. Greenwald and Berry [67] reported increased elastin and decreased collagen content in the aorta from spontaneous hypertensive rats when compared with the normal aorta. Wolinsky [25] observed an increase in the absolute amounts of both medial elastin and collagen contents in hypertensive rats. However, the relative percentage of these elements remained essentially constant. Experimental studies [67-69] showed an increase in vessel stiffness with the development of hypertension. This increase in vessel stiffness results in a smaller vessel diameter for a given distending pressure, i.e. a decrease in the distensibility [70].
B6.9.3 Atherosclerosis
It is generally accepted that substantial changes in the arterial wall occur with atherosclerosis in man. In human atherosclerotic arteries, it appears that there may be an absolute increase in collagen and a decrease in muscle fibers when compared with normal arteries [28]. In canine iliac

100 II ~ ________ A_R_T_E_R_I_E_S_,_V_E_IN_S_A __ N_D_L_Y_M __ PH __ A_T_IC __ V_E_SS_E_LS ________ ~
artery the ratio of collagen to elastin was found to be increased, while the ratio in carotid was decreased [26]. The elastic moduli of the diseased aorta and common iliac arteries are several times higher than those reported [33] for normal arteries. The most popular model used to study the effect of atherosclerosis on arterial wall properties is the rabbit subject to a high cholesterol diet. Cox and Detweiler [26] have shown that in the iliac arteries from high cholesterol fed greyhounds, collagen and elastin contents are decreased, but the ratio of collagen to elastin is increased. In carotid arteries from the treated animals, the elastin content is increased and the collagen to elastin ratio is decreased. Their results also show that the elastic modulus of the iliacs from the cholesterol fed animals is higher than that of the normal iliacs while the treated carotids are unchanged. By using a rabbit model, Pynadath and Mukherjee [71] found that cholesterol feeding had no effect on the longitudinal dynamic elastic modulus of the aorta, but the circumferential one was affected significantly. After six weeks of feeding, the circumferential dynamic elastic modulus increased from the normal value of 2.7 x 10⁶ dynes/cm2 to 4.0 x 10⁶
dynes/cm2. This increase showed a remarkable correlation with the cholesterol content in the aortas. Although animal models shed some light on the effects of cholesterol feeding, since atherosclerotic changes in the arterial wall are so closely related to aging, it is difficult to separate the effect of atherosclerosis from those of aging. The effects of atherosclerosis on the mechanical properties of the arterial wall remain unclear. Confusion with the effects of aging and other forms of arteriosclerosis such as medial calcification make interpretation of the results difficult.
B6.10 FINAL COMMENTS
Mechanical properties of the arteries from human and various animals have been extensively studied. However, literature on lymphatic vessels is very scarce. The data on the circumferential elastic modulus of the lymphatic vessels obtained by Ohhashi et al. [53, 54] seem to be too low considering that the lymphatics are originating from the veins.
The overall viscoelastic properties of a large blood vessel such as the aorta are known to be nonlinear [2, 44] and anisotropic [37]. But due to the fact that the blood vessel wall is incompressible [72] and deforms orthotropically [31], the mechanical properties of blood vessels can be described mainly by six coefficients: an elastic and a viscous moduli in the longitudinal, circumferential and radial directions. Among them, only the moduli in the circumferential and longitudinal directions have been studied widely. Much fewer data in the radial direction can be found in literature. In calculation of the circumferential elastic moduli, it was

L-_______________ A_D_D_I_T_IO_N __ A_L_R_E_A_D __ IN_G ________________ ~I I 101
usually assumed that the Poisson's ratio was 0.5 that is not strictly true when large strains are considered [36]. In fact, the measured data [37, 73] show that the Poisson's ratio is about 0.3, not 0.5 as would be predicted for an isotropic material. But the Poisson's ratio was almost constant with respect to circumferential strain and pressure in both relaxed and constricted canine carotid arteries [73].
To our best knowledge, water diffusion properties of blood vessels have been studied extensively, but their electrical and thermal properties are still unknown.
ACKNOWLEDGEMENT
This work was supported by the Medical Research Council of Canada (Grant MT-7879). The assistance of Y. Marois, M. King and Y. Douville in preparation of this material is gratefully acknowledged.
ADDITIONAL READING
Canfield, T.R. and Dorbin, P.B. (1987) Static properties of blood vessels, in Handbook of Bioengineering (eds R. Skalak and S. Chien), McGraw-Hill Book Company, New York, pp. 16.1-16.28.
The authors discuss the mechanical behavior of arteries and the mathematical method required for quantification of such data. The discussion is entirely concerned with the elastic or pseudoelastic behavior of blood vessels. It should be emphasized that the arterial wall also exhibits inelastic properties, such as viscosity, creep, stress & relaxation and pressure-diameter hysteresis. Very few data on mechanical properties of blood vessels are presented.
Dorbin, P.B. (1983) Vascular mechanics, in Handbook of Physiology, Vol. 3 The Cardiovascular System, (eds J.T. Shepherd and F. Abboud), Amer. Physiol. Soc., Washington, DC, Section 2, pp. 65-102.
This chapter reviews the essential concepts of vascular mechanics and its methods of quantification. Some of the important controversies are discussed, and further research areas are pointed out. Detailed information is provided on the structural and mechanical changes of arteries with age. The effect of vascular disorders such as arterosclerosis and hypertension on the mechanical behavior of blood vessels is discussed as well. Extensive addition literature sources are provided.
Schneck, D.J. (1995) An outline of cardiovascular structure and function, in The Biomedical Engineering Handbook, (ed. J.D. Bronzino), CRC Press, Boca Raton, pp. 3-14.
The cardiovascular system is described as a highway network, which includes a pumping station (the heart), a working fluid (blood), a complex branching configuration of distributing and collecting pipes and channels (the blood vessels), and a sophisticated means for both intrinsic (inherent) and extrinsic

102 I IL-_______ A_R_T_E_R_I_E_S_,V __ E_IN_S_A_N __ D_L_Y_M_P_H __ A_T_IC __ V_E_SS_E_LS ________ ~
(antonomic and endocrine) control. Data on both the arterial and venous systems are tabulated. However, no detailed sources are provided for the data listed. This is a very suitable reference for biomedical engineers.
Hargen, AR and ViIIavicenco, J.L. (1995) Mechanics of tissue/lymphatic support, in The Biomedical Engineering Handbook, (ed J.D. Bronzino), CRC Press, Boca Raton, pp. 493-504.
From an engineering point of view, the authors discuss the lymphatic system as a drainage system for fluids and waste products from tissues. Basic concepts of lymphatic transport along with clinical disorders are discused, although briefly. Extensive additional sources are cited.
REFERENCES
1. Fung, Y.C. (1993) Biomechanics, Mechanical Properties of Living Tissues, 2nd edn, Springer-Verlag, New York, pp. 321-391.
2. Bergel, D.H. (1961) The static elastic properties of the arterial wall. J. Physiol., 156,445-457.
3. Patel, D.J. and Vaishnav, R.N. (1972) The rheology of large blood vessels, Cardiovascular Fluid Dynamics, D.H. Bergel (ed.), Academic Press, New York, Vol. 2, pp. 1-64.
4. Fung, Y.e., Fronek, K. and Patitucci, P. (1979) Pseudoelasticity of arteries and the choice of its mathematical expression. Am. J. Physiol., 237, H620-H631.
5. Remington, J.W. (1955) Hysteresis loop behavior of the aorta and other extensible tissues. Am. J. Physiol., 180,83-95.
6. Alexander, RS. (1971) Contribution of plastoelasticity to the tone of the cat portal vein. Circ. Res., 28, 461-469.
7. Anitschkov, N. (1933) Experimental arteriosclerosis in animals, in Arteriosclerosis, E.V. Cowdry, Editor, Macmillan, New York, pp. 298-299.
8. Wilens, S.L. and McCluskey, RT. (1954) The permeability of excised arteries and other tissues to serum lipid. Circ. Res., 2, 175-182.
9. Baldwin, AL., Wilson, L.M. and Simon, B.R (1992) Effect of pressure on aortic hydraulic conductance. Arterio. Thromb., 12, 163-171.
10. Fung, Y.e. (1984) Biodynamics, Circulation, Springer-Verlag, New York, p. 77.
11. Brecher, G.A. (1956) Venous Return, Grune & Stratton, New York, pp. 30-67. 12. Helps, E.P.W. and McDonald, D.A (1954) Observation on laminar flow in
veins. J. Physiol., 124, 631-639. 13. Spencer, M.P. and Denison, AB. (1963) Pulsatile blood flow in the vascular
system, in Handbook of Physiology, Section 2, Circulation, W.F. Hamilton and P. Dow, Editors, Am. Physiol. Soc., Washington, pp. 839-864.
14. Fry, D.L. and Greefield, J.e. Jr. (1964) The mathematical approach to hemodynamics, with particular reference to Womersley's theory, in Pulsatile Blood Flow, Attinger, E.O. (ed), McGraw-Hili, New York, pp. 85-99.
15. Maggio, E. (1965) Microhemocirculation, Observable Variables and Their Biological Control, e.e. Thomas, Springfield.
16. Whitmore, RL. (1968) Rheology of the Circulation, Pergamon Press, Oxford, pp.99-108.

L-___________________ R_E_FE __ R_E_N_C_E_S __________________ ~I I 103
17. Morse, D.E. (1979) The normal aorta: embryology, anatomy, and histology of the aorta, in The Aorta, J. Lindsay, Jr. and J.W. Hurst, Editors, Grune & Stratton, New York, pp. 15-37.
18. Singhal, S., Henderson, R, Horsfield, K. et a!. (1973) Morphometry of human pulmonary arterial tree. Circ. Res., 33, 190-197.
19. Fung, Y.e. (1984) Biodynamics, Circulation, Springer-Verlag, New York, pp. 77-165.
20. Kirk, J.E. (1962) Arterial and arteriolar system, biochemistry, in Blood Vessels and Lymphatics, D.1. Abramson, Editor, Academic Press Inc., London, pp. 82-95.
21. Fischer, G.M. and Liaurado, J.G. (1966) Collagen and elastin content in canine arteries selected from functionally different vascular beds. Cire. Res., 19, 394-399.
22. Kanabrocki, E.L., Fels, I.G. and Kaplan, E. (1960) Calcium, cholesterol and collagen levels in human aorta. 1. Gerontol., 15, 383-387.
23. Lansing, A., Alex, M. and Rosenthal, T.B. (1950) Calcium and elastin in human arteriosclerosis. 1. Gerontol., 5, 112-119.
24. Kraemer, D.M. and Miller, H. (1953) Elastin content of the abdominal fraction of human aortae. Arch. Pathol., 55, 70-72.
25. Wolinsky, H. (1970) Response of the rat aortic media to hypertension. Morphological and chemical studies. Circ. Res., 26, 507-523.
26. Cox, RH. and Detweiler, D.K. (1979) Arterial wall properties and dietary atherosclerosis in the racing greyhound. Am. 1. Physiol., 5, H790-H797.
27. Kirk, J.E. (1962) Venous system, biochemistry, in Blood Vessels and Lymphatics, D.1. Abramson, Editor, Academic Press Inc., London, pp. 211-213.
28. Strand ness, D.E. and Sumner, D.S. (eds) (1975) Hemodynamics for Surgeons, Grune & Stratton, New York, New York, pp. 161-205.
29. Patel, D.J., Greenfield, J.e. and Fry, D.L. (1964) In vivo pressure-length-radius relationships of certain vessels in man and dogs, in Pulsatile Blood Flow, E.G. Attinger, Editor, McGraw-Hill, New York, pp. 293-302.
30. Cox, RH. (1975) Anisotropic properties of the canine carotid artery in vitro. 1. Biomech., 8,293-300.
31. Patel, D.J. and Fry, D.L. (1969) The elastic symmetry of arterial segments in dogs. Circ. Res., 24, 1-8.
32. Bergel, D.H. (1958) A photo-electric method for the determination of the elasto-viscous behavior of the arterial wall. 1. Physiol., 141, 22-23.
33. Learoyd, B.M. and Taylor, M.G. (1966) Alteration with age in the viscoelastic properties of human arterial walls. Circ. Res., 18, 278-292.
34. Bader, H. (1967) Dependence of wall stress in the human thoracic aorta on age and pressure. Circ. Res., 20, 354-361.
35. Langewouters, G.J., Wesseling, K.H. and Goedhard, W.J.A. (1984) The static elastic properties of 45 human thoracic and 20 abdominal aortas in vitro and the parameters of a new model. 1. Biomech., 17, 425-435.
36. Bergel, D.H. (1960) The Visco-elastic Properties of the Arterial Wall. PhD thesis, University of London.
37. Patel, D.J., Janicki, J.S. and Carew, T.E. (1969) Static anisotropic elastic properties of the aorta in living dogs. Circ. Res., 25, 765-779.

104 I ~I ________ A_R_T_E_R_I_E_S_,_V_E_IN_S_A __ N_D_L_Y_M __ PH __ A_T_IC __ V_E_SS_E_L_S ________ ~
38. Rees, P.M. and Jepson, P. (1970) Measurement of arterial geometry and wall composition in the carotid sinus baroreceptor area. Circ. Res., 26, 461-467.
39. Gow, B.s. and Taylor, M.G. (1968) Measurement of viscoelastic properties of arteries in the living dog. Circ. Res., 23, 111-122.
40. Reid, L. (1968) Structural and functional reappraisal of the pulmonary artery system, in Scientific Basis of Medicine, Annual Reviews, Vol. 8, pp. 289-307.
41. Yates, W.G. (1969) Experimental studies of the variations in the mechanical properties of the canine abdominal vena cava, in SUDAAR Report 393, Stanford University, California.
42. Bergel, D.H. (1972) The properties of blood vessels, in Biomechanics, Its Functions and Objectives, Y.c. Fung, Editor, Prentice-Hall, Englewood Cliffs, N.J., p. 110 and p. 131.
43. Yamada, H. (1970) Strength of Biological Materials, F.G. Evans, Editor, Williams and Wilkins, Baltimore, pp. 106-277.
44. Bergel, D.H. (1961) The dynamic elastic properties of arterial wall. 1. Physiol., 156,458-469.
45. Arndt, J.~., Klauske, J. and Mersch, F. (1968) The diameter ofthe intact carotid artery in man and its change with pulse pressure. PflUger's Arch" 30, 230--240.
46. Langewouters, G.J., Wesseling, K.H. and Goedhard, W.J.A. (1985) The pressure dependent dynamic elasticity of 35 thoracic and 16 abdominal human aortas in vitro described by a five component model. 1. Biomech., 18, 613--620.
47. Langewouters, G.J. (1982) Visco-Elasticity of the Human Aorta in vitro in Relation to Pressure and Age. PhD thesis, Free University, Amsterdam, The Netherland.
48. Tanaka, T.T. and Fung, Y.c. (1974) Elastic and inelastic properties of the canine aorta and their variation along the aortic trees. 1. Biomech., 7, 357-370.
49. Attinger, E.O. (1967) Modelling of pressure-flow relations in arteries and veins (Abstract). Biorheology, 4, 84.
50. Wesly, R.L.R., Vaishnav, R.N., Fuchs, J.c.A. et at. (1975) Static linear and nonlinear elastic properties of normal and arterialized venous tissue in dog and man. Circ. Res., 37, 509-520.
51. Sobin, P. (1977) Mechanical Properties of Human Veins. M.S. thesis, University of California, San Diego, California.
52. Susznyak, I., FOldi, M. and Szab6, G. (1967) Lymphatics and Lymph Circulation: Physiology and Pathology, Pergamon Press, London, pp. 33-50.
53. Ohhashi, T., Azuma, T. and Sakaguchi, M. (1980) Active and passive mechanical characteristics of bovine mesenteric lymphatics. Am. 1. Physiol., 239, H88-H95.
54. Ohhashi, T. (1987) Comparison of viscoelastic properties of walls and functional characteristics of valves in lymphatic and venous vessels. Lymphatic, 20, 219-223.
55. Berge!, D.H. (1964) Arterial viscoelasticity, in Pulsatile Blood Flow, E.O. Attinger, Editor, McGraw-Hill, New York, pp. 275-292.
56. Wilens, S.L. and McCluskey, R.T. (1952) The comparative filtration filtration properties of excised arteries and veins. Am. 1. Med. Sci., 224, 540--547.
57. Tedgui, A. and Lever, M.J. (1985) The interaction of convection and diffusion in the transport of I31I-albumin within the media of rabbit thoracic aorta. Circ. Res., 57, 856-863.

L-___________________ R_E_FE_R __ E_N_C_E_S __________________ ~I I 105
58. Tedgui, A. and Lever, MJ. (1987) Effect of pressure and intimal damage on 131I-albumin and 14C-sucrose spaces in aorta. Am. 1. Physiol., 253, H1530-H1539.
59. Weinbaum, S., Tzeghai, G., Ganatos, P. et al. (1985) Effect of cell turnover and leaky junctions on arterial macromolecular transport. Am. 1. Physiol., 248, H945-H960.
60. Bazett, H.C., Cotton, F.S., Laplace, L.B. et al. (1935) The calculation of cardiac output and effective peripheral resistance from blood pressure measurements with an appendix on the size of the aorta in man. Am. 1. Physiol., 113,312-334.
61. Anderson, J.R. (1980), Muir's Textbook of Pathology, Arnold, London, pp. 360-395.
62. Nakashima, T. and Tanikawa, J. (1971) A study of human aortic distensibility with relation to atherosclerosis and aging. Angiology, 22, 477-490.
63. Mozersky, DJ., Summer, D.S., Hokanson, D.E. et af. (1972) Transcutaneous measurement of the elastic properties of the human femoral artery. Circulation, 46, 948-955.
64. Tobian, L. (1960) Interrelationship of electrolytes, juxtaglomerular cells and hypertension. Physiof. Rev., 40, 280-312.
65. Peterson, L.H. (1963) Systems behavior, feed-back loops and high blood pressure research. Circ. Res., 12,585-596.
66. Mallov, S. (1959) Comparative reactivities of aortic strips for hypertensive and normotensive rats to epinephrine and levarterenol. Circ. Res., 7, 196-201
67. Greenwald, S.E. and Berry, c.L. (1978) Static mechanical properties and chemical composition of the aorta of spontaneously hypertensive rats, a comparison with the effects of induced hypertension. Cardiovas. Res., 12,364--372.
68. Feigl, E.O., Peterson, L.H. and Jones, A.W. (1963) Mechanical and chemical properties of arteries in experimental hypertension. 1. Clin. Invest., 42, 1640-1647.
69. Bandick, N. and Sparks, H. (1970) Viscoelastic properties of the aortas of hypertensive rats. Proc. Soc. Exp. Bioi. Med., 134,56-60.
70. Greene, M.A., Friedlander, R., Boltax, AJ. et al. (1966) Distensibility of arteries in human hypertension. Proc. Roy. Soc. Exp. Bioi., 121, 580-585.
71. Pynadath, T.!. and Mukherjee, D.P. (1977) Dynamic mechanical properties of atherosclerotic aorta: A correlation between the cholesterol ester content and the viscoelastic properties of atherosclerotic aorta. Atherosclerosis, 26, 311-318.
72. Carew, T.E.R., Vaishnav, R.N. and Patel, DJ. (1968) Compressibility of the arterial wall. Circ. Res., 23, 61-68.
73. Dobrin, P.B. and Doyle, J.M. (1970) Vascular smooth muscle and the anisotropy of dog carotid artery. Circ. Res., 27, 105-119.

I B7 I IL-__ T_h_e_i_D_tr_a_O_C_ll_la_r_l_e_D_S_---I
T. V. Chirila
B7.1 INTRODUCTION
Although the existence of the intraocular crystalline lens, usually referred to as the lens, in the eye was recognized by the scientists of the Hellenistic period (about 2000 years ago), it was 400 years ago that the real role of the lens in vision was properly understood, and truly scientific approaches to the lens measurements and properties began to be applied only in the nineteenth century [1]. For instance, the first to weigh the human lens was Smith in 1883 [2].
The lens is positioned between the aqueous humor and vitreous body of the eye. The lens refracts the light which enters the eye through the pupil and focuses it on the retina. The lens (i) provides refractive power to the optical system of the eye; (ii) provides the accommodation necessary for normal vision; (iii) maintains its own transparency; and (iv) absorbs UV radiation and blue light, both deleterious to the subsequent ocular segments.
The lens is a biconvex body similar to a flattened globe. For descriptive purposes, it has two poles (anterior and posterior), an equator, and therefore two diameters (polar, or lens thickness, and equatorial).
The lens is composed of epithelial cells which become anuclear and elongated as they are displaced further toward the center. Because of the enormous length finally attained by these cells, they are referred to as lens fibers. The lens is surrounded by a transparent acellular capsule of variable thickness. A proper epithelium underlies the capsule along the anterior side and equator, but not under the posterior capsule. The superficial layers of cells and fibers constitute the lens cortex, and the lens
Handbook of Biomaterial Properties. Edited by J. Black and O. Hastings. Published in 1998 by Chapman & Hall, London. ISBN 0412603306.

L-______________ C_H_E_M_I_C_A_L_C __ O_M_P_O_S_IT_I_O_N ______________ ~I I 107
nucleus is situated in the center. The fibers are continuously formed throughout life and the new fibers cover the old ones which are displaced toward the nucleus.
At present, there are significantly more compositional and physical property data on animal lenses than on the human lens.
Even the determination of a straightforward property like the water content has led to variable results (Tables B7.1 and B7.2), likely due both to nonuniform distribution of the water in the lens and to the variability of methods employed for measurements. While data on the inorganic content of the human lens (Table B7.3) are generally in agreement, there was a larger variation in reporting the organic content. This is presumably due to the greater sensitivity of the organic metabolism to age and disease. The most reliable results are included in Table B7.4.
Tables B7.5-B7.7 provide some key dimensional properties of the lens while Table B7.8 focuses on perhaps the most important feature, the optical properties.
Mechanical characteristics of the lens required sophisticated procedures for measurements and the data are probably difficult to reproduce. All the available mechanical properties of the human lens are included in Tables B7.9-B7.13. Large variations in the electrical properties of animal lenses have been reported, but it seems that the only measurements performed on human lenses are those shown in Table B7.14.
B7.2 CHEMICAL COMPOSITION
Table B7.1 Water content of the normal human lens
Method Value (%) Source
n.a. 65" [3] Vacuum dehydration 68.6 ± 4.3b [4]
63.4 ± 2.9c
Microsectioning 52.5 - 66.2c,d [5] 72.5 - 90d,e
Raman microspectroscopy 69 ± 4b [6] 65 ± 4c
Freeze drying 68c [7] 80e
75f
Raman micro spectroscopy 58.0 ± 4.7 «70 yr)" [8] 63.0 ± 2.8 (>70 yr)" 85.3 ± 9.4e
80.9 ± 8.3 f
± = Standard deviation; a whole lens;b cortex;c nucleus; dage 62 years to 68 years; eoutermost anterior cortex; foutermost posterior cortex.

108 I 1'-----________ T_H_E_l_N_T_R_A_O_C_U_L_A_R_L_E_N_S _______ ---'
Table 87.2 Water content of cataractous human lenses
Method
Drying
Freeze drying
Drying
Value (%)
67.6" 75.4b
79c,d
83.5c,e
78d ,f
87,se.f 68d ,c,g
63,8 « 60 yr) 67,7 (> 80 yr)
Source
[9]
[8]
[10]
, No sclerosis, average age 64,7 years;b advanced sclerosis, average age 70,8 years;C outermost anterior cortex,;d primary nuclear cataract;" subcapsular cataract;f outermost posterior cortex;g nucleus,
Table 87.3 Inorganic ions content of the normal adult human lens
Ion Representative value Source
Sodium 91 mg/lOO g wet wt [3] Potassium 170 mg/IOO g wet wt [3] Calcium 1.4 mg/IOO g wet wt [3] Magnesium 0.29 mg/IOO g wet wt [3]
6.2 jl.g/g dry wt [11] Zinc 21 jl.g/g dry wt [3]
25 jl.g/g dry wt [11] Copper < 1 jl.g/g dry wt [3]
0.6 jl.g/g dry wt [11] Manganese 0.2 jl.g/g dry wt [11] Iron 0.4 jl.g/g dry wt [11] Rubidium 6.8 jl.g/g dry wt [11] Chloride 35.3 mg/100 g wet wt [3] Phosphate 25 mg/IOO g wet wt [12] Sulfate 24 mg/IOO g wet wt [12] pH 7.3 to 7.7 [13]
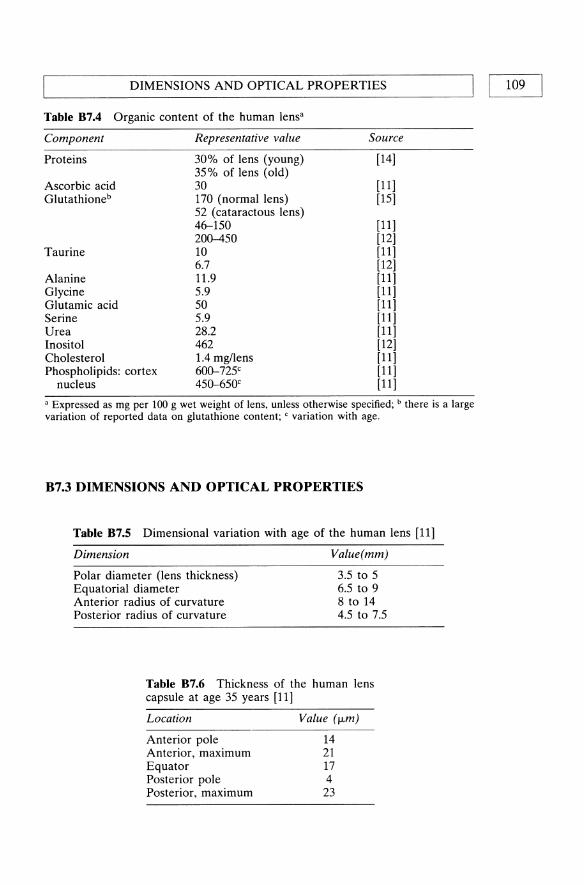
~ _________ D_IM __ E_N_SI_O_N_S_A __ N_D_O_PT __ I_C_A_L_P_R_O_P_E_R_T_I_E_S ________ ~I I 109
Table 87.4 Organic content of the human lensa
Component
Proteins
Ascorbic acid Glutathioneb
Taurine
Alanine Glycine Glutamic acid Serine Urea Inositol Cholesterol Phospholipids: cortex
nucleus
Representative value
30% of lens (young) 35% of lens (old) 30 170 (normal lens) 52 (cataractous lens) 46-150 200--450 10 6.7 11.9 5.9 50 5.9 28.2 462 1.4 mg/lens 600-725c
450-650c
Source
[14]
[11] [15]
[11] [12] [11] [12] [11] [11] [11] [11] [11] [12] [11] [11] [11]
a Expressed as mg per 100 g wet weight of lens, unless otherwise specified; b there is a large variation of reported data on glutathione content; C variation with age.
B7.3 DIMENSIONS AND OPTICAL PROPERTIES
Table 87.5 Dimensional variation with age of the human lens [11]
Dimension
Polar diameter (lens thickness) Equatorial diameter Anterior radius of curvature Posterior radius of curvature
Value(mm)
3.5 to 5 6.5 to 9 8 to 14 4.5 to 7.5
Table 87.6 Thickness of the human lens capsule at age 35 years [11]
Location
Anterior pole Anterior, maximum Equator Posterior pole Posterior, maximum
Value (/Lm)
14 21 17 4 23
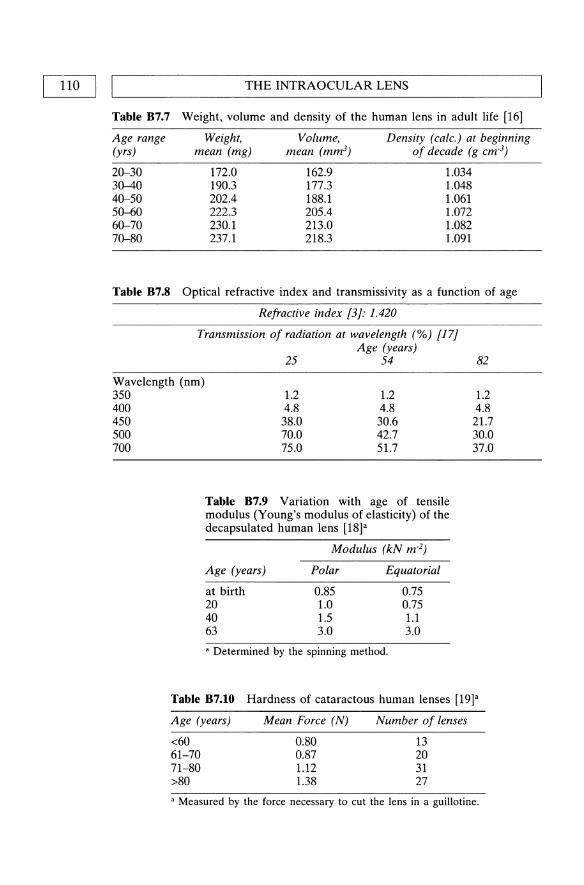
Table 87.7
Age range (yrs)
20-30 30-40 40-50 50-60 60-70 70-80
THE INTRAOCULAR LENS
Weight, volume and density of the human lens in adult life [16]
Weight, Volume, Density (calc.) at beginning mean (mg) mean (mm3) of decade (g cm·3)
172.0 190.3 202.4 222.3 230.1 237.1
162.9 177.3 188.1 205.4 213.0 218.3
1.034 1.048 1.061 1.072 1.082 1.091
Table 87.8 Optical refractive index and transmissivity as a function of age
Refractive index 13}: 1.420
Transmission of radiation at wavelength (%) 117} Age (years)
25 54 82
Wavelength (nm) 350 400 450 500 700
1.2 1.2 4.8 4.8 38.0 30.6 70.0 42.7 75.0 51.7
Table 87.9 Variation with age of tensile modulus (Young's modulus of elasticity) of the decapsulated human lens [18]"
Modulus (kN m·2)
Age (years) Polar Equatorial
at birth 0.85 0.75 20 1.0 0.75 40 1.5 1.1 63 3.0 3.0
• Determined by the spinning method.
1.2 4.8
21.7 30.0 37.0
Table 87.10 Hardness of cataractous human lenses [19]'
Age (years)
<60 61-70 71-80 >80
Mean Force (N)
0.80 0.87 1.12 1.38
Number of lenses
13 20 31 27
• Measured by the force necessary to cut the lens in a guillotine.

'-----_____ D_IM_E_N_SI_O_N_S_A_N_D_O_PT_I_C_A_L_P_R_O_P_E_R_T_I_E_S ____ -----'I I 111
Table 87.11 Mechanical properties of the human lens capsule [20]a
Age (years) Property Value
20 50 SO
< 20 > 70 b b
Tensile modulus (MPa)
Ultimate tensile stress (MPa)
Elongation (%) Poisson's ratio
5.6 4.0 1.5
2.3 0.7 29
0.47 ± 0.5
± = Standard deviation; 'determined from the volume-pressure relationship upon distension with isotonic saline; bindependent of age.
Table 87.12 Force of contraction for maximum accommodation of the human lens [21]a
Age (years) Force (mN)
25 35 45 55
7.2 10.9 12.S 11.4
, Determined from the stress-{\ioptric power relationship.
Table 87.13 Spring constants of human lens and zonules[22]a
Spring constant at 10%elongation, m N
Age range (years) 2-39 40-70
Lens, polar Lens, equatorial Zonulesb
13.5±0.SO 12.3±0.65 0.3S±0.32
25.4±0.24 36.5±0.23 0.65±0.S5
± = Standard deviation; , spring constant is defined here as S'=F/(Illllo)' where F total force and Illlio is elongation; b determined on specimens zonule-lenszonule, after the excision of the ciliary muscles.
Table 87.14 Translenticular electrical properties in the isolated human lens [23]
Property
Potential differencea
Short circuit current densityb Resistance
Value
7 mY 5 uA cm·z 1.5 kD cmz
, Anterior side positive; b reflects sodium transport from the posterior to the anterior lens side and is expressed as a current density; c calculated as a ratio between potential difference and current density.

112 I ~I ________________ T_H_E_I_N_T_R_A_O_C_U __ L_A_R_L_E_N __ S ______________ ~
ADDITIONAL READING
Bellows, J.G. (ed.) (1975) Cataract and Abnormalities of the Lens, Grune & Stratton, New York.
A valuable collection of 42 contributions on the lens, its pathology and surgery, written by known experts such as Barraquer, Bellows, Choyce, Girard, Hockwin, Kaufman, Rosen and Yanoff. The first five introductory chapters present historical aspects, development and characterization of the lens. However, most of the book is dedicated to cataract and its treatment.
Spector, A. (1982) Aging of the lens and cataract formation, in Aging and Human Visual Function (eds R. Sekuler, D. Kline and K. Dismukes), Alan R. Liss, Inc., New York, pp. 27--43.
A brief, but comprehensive account of the changes which take place in the composition and metabolism of the lens during aging and cataractogenesis.
Duncan, G. and Jacob, T.1.C. (1984) The lens as a physicochemical system, in The Eye, vol. 1b, 3rd ed. (ed. H. Davson), Academic Press, Orlando, FL, pp. 159-206.
This text develops some topics usually neglected in other books, including the structural order in the lens, optical properties of the lens, role of lens membranes, and electrolyte transport and distribution in the lens.
Cotlier, E. (1987) The lens, in Adler's Physiology of the Eye, 8th ed. (eds R.A. Moses and W.M. Hart), C.V. Mosby Co., St. Louis, pp. 268-290.
A systematic presentation of the anatomy, biochemistry and physiology of the lens.
Moses, R.A. (1987) Accommodation, in Adler's Physiology of the Eye, 8th ed., (eds R.A. Moses and W.M. Hart), C.V. Mosby Co., St. Louis, pp. 291-310.
A thorough exposition of all aspects of the mechanism of accommodation and the role of the lens in vision. A text, by now classic, on a topic much more complex than it appears.
Jones, W.L. (1991) Traumatic injury to the lens. Optom. Clin., 1, 125--42. This review article analyzes the effects of concussive trauma to the eye, empha
sizing the types of injuries to the lens. The mechanical response of the anterior and posterior segments of the eye to external forces is also described.
REFERENCES
1. Grom, E. (1975) History of the crystalline lens, in Cataract and Abnormalities of the Lens, (ed. J.G. Bellows), Grune & Stratton, New York, pp. 1-28.
2. Smith, P. (1883) Diseases of crystalline lens and capsule. 1. On the growth of the crystalline lens. Trans. Ophthalmol. Soc. UK, 3, 79-99.
3. Kuck, J.F.R. (1970) Chemical constituents of the lens, in Biochemistry of the Eye, (ed. C.N. Graymore), Academic Press, London, chapter 3.
4. Fisher, R.F. and Pettet, B.E. (1973) Presbyopia and the water content of the human crystalline lens. J. Physiol., 234, 443-7.
5. Bours, J., Fodisch, H.J. and Hockwin, O. (1987) Age-related changes in water and crystalline content of the fetal and adult human lens, demonstrated by a microsectioning technique. Ophthalmic Res., 19, 235-9.

REFERENCES I I 113 L-____________________________________________________ ~
6. Huizinga, A, Bot, Ae.e., de Mul, F.F.M. et al. (1989) Local variation in absolute water content of human and rabbit eye lenses measured by Raman microspectroscopy. Exp. Eye Res., 48, 487-96.
7. Deussen, A and Pau, H. (1989) Regional water content of clear and cataractous human lenses. Ophthalmic Res., 21, 374-80.
8. Siebinga, I., Vrensen, G.F.J.M., de Mul, F.F.M. et al. (1991) Age-related changes in local water and protein content of human eye lenses measured by Raman microspectroscopy. Exp. Eye Res., 53, 233-9.
9. Salit, P.W. (1943) Mineral constituents of sclerosed human lenses. Arch. Ophthalmol., 30, 255-8.
10. Tabandeh, H., Thompson, G.M., Heyworth, P. et al. (1994) Water content, lens hardness and cataract appearance. Eye, 8, 125-9.
11. Harding, J.J. and Crabbe, MJ.e. (1984) The lens: development, proteins, metabolism and cataract, in The Eye, vol. 1b, 3rd ed., (ed. H. Davson), Academic Press, Orlando, FL, pp. 207-492.
12. Paterson, e.A (1985) Crystalline lens, in Biomedical Foundations of Ophthalmology, vol. 2, 2nd ed., (eds T.D. Duane and E.A Jaeger), Harper & Row, Philadelphia, chapter 10.
13. Kuck, J.F.R (1970) Metabolism of the lens, in Biochemistry of the Eye, (ed. e.N. Graymore), Academic Press, London, chapter 4.
14. Davson, H. (1990) Physiology of the Eye, 5th ed., Macmillan, London, Chapter 4.
15. Dische, Z. and ZiI, H. (1951) Studies on the oxidation of cysteine to cystine in lens proteins during cataract formation. Am. f. Ophthalmol., 34, 104-13.
16. Scammon, RE. and Hesdorfer, M.B. (1937) Growth in mass and volume of the human lens in postnatal life. Arch. Ophthalmol., 17, 104-112.
17. Lerman, S. (1987) Chemical and physical properties of the normal and ageing lens: spectroscopic (UV, fluorescence, phosphorescence, and NMR) analyses. Am. f. Optom. Physiol. Optics, 64, 11-22.
18. Fisher, RF. (1971) The elastic constants of the human lens. 1. Physiol., 212, 147-80.
19. Heyworth, P., Thompson, G.M., Tabandeh, H. et al. (1993) The relationship between clinical classification of cataract and lens hardness. Eye, 7, 726-30.
20. Fisher, RF. (1969) Elastic constants of the human lens capsule. f. Physiol., 201, 1-19.
21. Fisher, RF. (1977) The force of contraction of the human ciliary muscle during accommodation. f. Physiol., 270, 51-74.
22. van Alphen, G.W.H.M. and Graebel, W.P. (1991) Elasticity of tissues involved in accommodation. Vision Res., 31, 1417-38.
23. Platsch, K.D. and Wiederholt, M. (1981) Effect of ion substitution and ouabain on short circuit current in the isolated human and rabbit lens. Exp. Eye Res., 32,615-25.

I ell I L....-_B_I_oo_d_a_D_d_r_el_a_te_d_ft_u_i_d_s-------I
V. Turitto and S.M. Slack
Ct.t INTRODUCTION
This section provides data for several human biological fluids including blood, plasma or serum, cerebrospinal (CS) fluid, lymph, synovial fluid, and tear fluid. The material presented here was gleaned from a variety of sources, with emphasis placed on the most recently published work, and includes physicochemical properties (Table Cl.l), cellular compositions (Table Cl.2), concentrations of inorganics (Table Cl.3), organics (Table ClA), and major proteins (Table Cl.S). In addition, various properties of the major proteins are presented in Table Cl.7, while Tables Cl.8 and Cl.9 contain information regarding the components of the coagulation and complement cascades, respectively. Because of the variability in values for many properties of biological fluids, in many cases a normal singular range of such values is listed. In all cases, the data are those compiled for normal human adults and, where possible, differences with respect to gender are included. It must be stressed that fluid properties can readily change as a result of disease, aging, or drug ingestion.
Handbook of Biomaterial Properties. Edited by J. Black and G. Hastings. Published in 1998 by Chapman & Hall, London. ISBN 0 412 60330 6.

~ __________________ INT __ R_O_D_U __ CT __ IO_N __________________ ~I I 115
Table CI.I Physiochemical properties [1-3]
Property
Dielectric constant Freezing point Depression (0C) Osmolality (mosmlkg) pH Refractive index Relative viscosity Specific gravity Specific conductivity (S/cm) Specific heat (cal/g/°C) Surface tension (dyne/cm)
Property
Dielectric constant Freezing Point Depression (Oe) Osmolality (mosmlkg) pH Refractive index Relative viscosity Specific gravity Specific conductivity (S/cm) Specific heat (cal/g/°C) Surface tension (dyne/cm)
Whole blood Plasma (serum)
8.0-8.5 0.557-0.577 0.512--0.568
276--295 7.39-7.45
1.3485-1.3513 1.18-1.59
1.022-1.026 0.0117--0.0123
0.94
7.38-7.42
2.18-3.59 1.052-1.061
0.87 55.5-61.2
Synovial fluid
292-300 7.29-7.45
> 300 1.008-1.015
0.0119
CS fluid
0.540--0.603 290-324 7.35-7.70
1.3349-1.3351 1.020-1.027
1.0032-1.0048
60.0-63.0
56.2
Tear fluid
0.572--0.642 309-347 7.3-7.7
1.3361-1.3379 1.26-1.32
1.004-1.005
The refractive index, specific gravity, and surface tension were measured at 20°C, the specific conductivity at 25°C, and the relative viscosity at 37°C. The specific gravity is that relative to water. The viscosity of serum is slightly less than that of plasma due to the absence of fibrinogen. Blood viscosity depends strongly on shear rate and hematocrit and the value given in Table CLl is that at high shear rates (> 200 S·I) and normal hematocrits (40-45%). Blood is a non-Newtonian fluid and exhibits increased viscosity with decreasing shear rate. Correlations relating blood viscosity to hematocrit, shear rate, and protein content have been described in the literature [4,5]. The reader is referred to several excellent publications for further details regarding factors affecting blood viscosity [4,6-11].

BLOOD AND RELATED FLUIDS 116 I I ~------------------------------------------------------~
Table Ct.2 Cellular composition of biological fluids [12]
A. Whole blood
Whole blood: Half-life in Cell type Cells/IJ.L Cell size (IJ.m) circulation
Erythrocytes 4.6-6.2 x 10⁶ (M) 7-8 25 ± 2 days 4.2-5.2 x 10⁶ (F)
Leukocytes Neutrophils 3000-6500 10-15 6-8 hours Eosinophils 50-250 10-15 8-12 hours Basophils 15-50 10-15 ? Monocytes 300-500 12-20 1-3 days Lymphocytes 1000-3000 7-8 variable Platelets 1.5-3.5 x 10⁵ 2-4 3.2-5.2 days Reticulocytes 2.3-9.3 x 1()4 7-10
Synovial fluid: Cell type Celis/pL Leukocytes 4-5 Monocytes 35-40
Lymphocytes 15-16 Synovial cells 2-3
The variability in the half-life of circulating lymphocytes is a result of the many subsets of this cell type, e.g., B-cells, helper and suppressor T-cells, etc. Cerebrospinal fluid also contains - 1-5 celiS/ILL, primarily lymphocytes.

INTRODUCTION I I 117
Table Cl.3 Inorganic content of various fluids [1]
Compound Whole blood Plasma (serum) Synovial fluid
Bicarbonate 19.1-22.7 25-30 Bromide 0.033-0.074 0.043-0.093 Calcium 2.42 2.12-2.72 1.2-2.4 Chloride 77-86 100-108 87-138 Copper (J..LM) 11.3-19.5 13-22 Fluoride (J..LM) 5.3-23.7 Iodine (J..LM) 0.2-1.34 0.30-0.47 Iron 7.5-10.0 0.01-0.027 Magnesium 1.48-1.85 0.7-0.86 Phosphorous (total) 10.1-14.3 2.87-4.81 Potassium 40-60 3.5-4.7 3.5-4.5 Sodium 79-91 134-143 133-139 Zinc 0.076-0.196 0.011-0.023
Compound Cerebrospinal fluid Tear fluid Lymph
Bicarbonate 18.6-25.0 20-40 Bromide 0.018-0.048 Calcium 1.02-1.34 0.35-0.77 1.7-2.8 Chloride 119-131 110-135 87-103 Copper (J..LM) 0.13-0.37 Fluoride (J..LM) 55 Iodine (J..LM) Iron 0.0003-0.0015 Magnesium 0.55-1.23 Phosphorous (total) 0.442-0.694 2.0-3.6 Potassium 2.62-3.30 6.6-25.8 3.9-5.6 Sodium 137-153 126-166 118-132 Zinc
Concentrations are in mM, unless otherwise specified.

118 I Ll _____________ B_L_O_O __ D_A_N_D __ R_E_L_A_T_E_D __ FL_U __ ID_S ____________ ~ Table Cl.4 Organic content of various fluids [13-15]
Species Whole blood Plasma (serum)
Amino acids (mglL) Ammonia (mglL) Bilirubin (mglL) Cholesterol Creatine (mg/L) Creatinine (mg/L) Fat, neutral Fatty acids Glucose Hyaluronic acid Lipids, total Total nitrogen Nonprotein nitrogen Phospholipid Urea Uric acid (mglL) Water
Species
Amino acids (mglL) Ammonia (mg/L) Bilirubin (mg/L) Cholesterol Creatine (mg/L) Creatinine (mg/L) Fat, neutral Fatty acids Glucose Hyaluronic acid Lipids, total Total nitrogen Nonprotein nitrogen Phospholipid Urea Uric acid (mglL) Water
48-74 0.26--0.69
2-14 1.15-2.25
3-5 10-20
0.85-2.35 2.5-3.9
630-870
4.45--6.1 30--41
0.26--0.50 2.25-2.85
0.166--0.39 6--50
830-865
Synovial fluid
3.32
0.084--4.0 0.22--0.43
0.15 39
960-988
20-51 0.22--0.47
2-8 1.7-2.1 1.3-7.7 5.6--10.5
0.25-2.6 3.5--4.0 650-966
2.85--6.75 12-14.3
0.14-0.32 2.0-2.5
0.18--0.43 30.5-70.7 930-955
Tear fluid
50
0.Q25
1.58
0.33-1.4
982
Concentrations are in mglmL, unless otherwise specified.
CS fluid
10-15 0.14-0.26
<0.1
4.6--19 6.5-10.5
trace trace
430-640
0.01--0.02 0.16--0.22 0.11--0.20
0.002-0.01 0.14-0.36
1.1--6.3 980-990
Lymph
8 0.34-1.06
8-89
1.36--1.40
0.13-1.39
17-108 810-860

~ __________________ IN_T_R_O_D __ U_CT __ IO_N __________________ ~I I 119
Table Cl.S Major protein content of various fluids [12,14]
Protein
Albumin (XI-Acid glycoprotein
( orosomucoid) (XI-Antitrypsin P2-Microglobulin Haptoglobin
Type 1.1 Type 2.1 Type 2.2
Ceruloplasmin Transferrin C1 Inhibitor (Xz-Macroglobulin IgA IgO IgM Fibrinogen Lysozyme Fibronectin Hemopexin
Protein
Albumin (XI-Acid glycoprotein
( orosomucoid) (XI-Antitrypsin P2-Microglobulin Haptoglobin Ceruloplasmin Transferrin C1 Inhibitor (X2-Macroglobulin IgA IgO IgM Fibrinogen Lysozyme Fibronectin Hemopexin
Plasma (serum) CS fluid I
37.6-54.9 155±39
0.48-1.26 0.98-2.45 0.58-2.24
1.45±0.34 2.06±0.67 1.74±0.70 0.09-0.51 1.52-3.36 0.15-0.35 1.45-4.43 0.7-3.12 6.4-13.5
0.56-3.52 2-4
0.09-0.25 0.53-1.21
Synovial fluid
3.94
0.015
0.04
0.04-0.80 0.04-0.62
trace
1-2.8
1.85±0.74 7.0±3.0 0.1-1.9
2.24±1.5
0.88±0.21 8.42±3.5
4.64±1.84 2.26±0.95 13.9±6.6
0.65
I Protein concentrations in CS fluid are given in mglL. All others have units of mglmL.
Synovial fluid
6-10
0.78±0.017
0.1
0.043±0.016
0.31-0.21 0.62-1.15 1.47-4.62 0.09-0.22
Tear fluid
15-26.7
7.8

120 I LI ______________ B_L_O_O_D __ A_N_D __ R_E_L_A_T_E_D __ F_L_U_ID __ S ____________ ~
Table Cl.6 Fluid volumes [16]
Fluid Volume Male (mL)
Whole blood Erythrocytes Plasma Cerebrospinal fluid Tear fluid
4490 2030 2460
100-160 4-13
Volume Female (mL)
3600 1470 2130
100-160 4-13
The following equations can be used to estimate blood volume (BY, mL), erythrocyte volume (EY, mL), and plasma volume (PY, mL) from the known body mass (b, kg) with a coefficient of variation of approximately 10%: Males (M) BY = 41.0 x b + 1530 Females (F) BY = 47.16 x b + 864
PY = 19.6 x b + 1050 PY = 28.89 x b + 455 EY = 21.4 x b + 490 EY = 18.26 x b + 409
These equations, relating BY, PY, and EY to body weight, are taken from Lentner [12]. Additional correlations relating these volumes to body weight and surface area are available from the same source.

INTRODUCTION I I 121
Table Ct.7 Properties of major plasma proteins [16, 17]
Plasma concentration Molecular Protein (mg/mL) weight (Da) pi 51 D2
Prealbumin 0.12-0.39 54980 4.7 4.2 Albumin 38-52 66500 4.9 4.6 6.1 <Xl - Acid Glycoprotein
(Orosomucoid) 0.5-1.5 44000 2.7 3.1 5.3 <Xl - Antitrypsin 2.0-4.0 54000 4.0 3.5 5.2 <X2 - Macroglobulin 1.5-4.5 725000 5.4 19.6 2.4 <X2 - Haptoglobin
Type 1.1 1.0--2.2 100000 4.1 4.4 4.7 Type 2.1 1.6-3.0 200000 4.1 4.3-6.5 Type 2.2 1.2-2.6 400000 7.5
<X2 - Ceruloplasmin 0.15-.60 160000 4.4 7.08 3.76 Transferrin 2.0--3.2 76500 5.9 5.5 5.0 Hemopexin 0.56-0.89 57000 5.8 4.8 Lipoproteins 5.5-6 140000--20000000 5.4 IgA (Monomer) 1.4-4.2 162000 7 3.4 IgG 6-17 150000 6.3-7.3 6.5-7.0 4.0 IgM 0.5-1.9 950000 18-20 2.6 C1q 0.05-0.1 459000 11.1 C3 1.5-1.7 185000 6.1-6.8 9.5 4.5 C4 0.3-0.6 200000 10.0 Fibrinogen 2.0-4.0 340000 5.5 7.6 1.97
Plasma concentration Half-life Protein (mg/mL) £28/ V204 CH205 (days)
Prealbumin 0.12-0.39 14.1 0.74 1.9 Albumin 38-52 5.8 0.733 0 17-23 <Xl - Acid glycoprotein
( orosomucoid) 0.5-1.5 8.9 0.675 41.4 5.2 <Xl - Antitrypsin 2.0-4.0 5.3 0.646 12.2 3.9 <X2 - Macroglobulin 1.5-4.5 8.1 0.735 8.4 7.8 <X2 - Haptoglobin
Type 1.1 1.0--2.2 12.0 0.766 19.3 2-4 Type 2.1 1.6-3.0 12.2 Type 2.2 1.2-2.6
<X2 - Ceruloplasmin 0.15-.60 14.9 0.713 8 4.3 Transferrin 2.0--3.2 11.2 0.758 5.9 7-10 Hemopexin 0.56-0.89 19.7 0.702 23.0 9.5 Lipoproteins 5.5-6 IgA (Monomer) 1.4-4.2 13.4 0.725 7.5 5-6.5 IgG 6-17 13.8 0.739 2.9 20--21 IgM 0.5-1.9 13.3 0.724 12 5.1 C1q 0.05-0.1 6.82 8 C3 1.5-1.7 0.736 C4 0.3-0.6 Fibrinogen 2.0-4.0 13.6 0.723 2.5 3.1-3.4 1 Sedimentation constant in water at 20°C. expressed in Svedberg units. 2 Diffusion coefficient in water at 20°C, expressed in 10.7 cm2/s. 3 Extinction coefficient for light of wavelength 280 nm traveling 1 cm through a 10 mg/ml protein solution. 4 Partial specific volume of the protein at 20°C, expressed as ml g.l. 5 Carbohydrate content of the protein, expressed as the percentage by mass.

BLOOD AND RELATED FLUIDS 122 I I ~----------------------------------------------------~
Table Cl.8 Proteins involved in blood coagulation [19]
Protein
Fibrinogen Prothrombin Factor III (tissue factor) Factor V Factor VII Factor VIII Factor IX Factor X Factor XI Factor XII Factor XIII Protein C Protein S Protein Z Prekallikrein High molecular
weight kininogen <Xl Protease inhibitor Antithrombin III
Plasma concentration
(ll-g/mL)
2000-4000 70-140
4-14 trace -0.2 -5.0 -12
2.0-7.0 15-47 -10 -4.0 -22 -2.9
35-50
70-90 2500
230 ± 23
Relative molecular weight,
Mr (Da)
340000 71600 45000
330000 50
330000 57000 58800
160000 80000
320000 62000 77000 62000 85000
120000 55000 58000
Table Cl.9 Proteins in the compliment system
Protein Serum Relative concentration molecular weight,
(mg/L) Mr (Da)
C1q 70 ± 14 459000 Clr 39 ± 2 83000 CIs 36 ± 3 83000 C2 27 ± 5.6 108000 C3 1612 ± 244 185000 C4 498 ± 151 200000 C5 153 ± 29 185000 C6 50.9 ± 8 128000 C7 4 - 60 121000 C8 43.2 ± 6.5 151000 C9 57.5 ± 12.7 71000 Factor B 275 ± 55 92000 Factor D trace 24000 Properdin 28.4 ± 5 220000 C1 inhibitor 158 ± 14 100000 Factor H 525 ± 58 150000 Factor I 38.6 ± 5.5 88000
Biological half-life tv, (hr)
72-120 48-72
12-15 2-5 8-12 24
24-40 48-84 50-60
216-240 10
60
67
Sedimentation constant
S20W(Jo-J3~)
11.1 7.5 4.5 4.5 9.5
10.0 8.7 5.5 6.0 8.0 4.5 5-6 3.0 5.4
6.0 5.5
L-___________________ R_E_F_E_R_E_N_C_E_S __________________ ~I I 123
ADDITIONAL READING:
Ditmer, D.S. (ed.) (1961) Blood and Other Body Fluids, Federation of American Societies for Experimental Biology, Washington, D.e.
This text provides a thorough compilation of the physical properties and composition of numerous biological fluids. Unlike the Geigy Scientific Tables, this book also reports data for many non-human species. However, citations and some measurement techniques are somewhat outdated.
Kjeldsberg e.R. and Knight J.A. (eds) (1993) Body Fluids: Laboratory Examination of Amniotic, Cerebrospinal, Seminal, Serous & Synovial Fluids, 3rd ed., American Society of Clinical Pathologists, Chicago.
An excellent source of information, especially for a clinician or medical technologist. Includes numerous color photographs of fluids and cells. Discusses abnormal amounts or types of specific proteins and cells in fluids as potentially diagnostic of disease states.
Lentner, e. (ed.) (1984) Geigy Scientific Tables, Ciba-Geigy, Basle. This is the most comprehensive source of information available on properties and
composition of body fluids. Volumes 1 and 3 provide extensive data, generally in tabular form, on fluid content (as well as measurement technique), related to gender, age and disease state.
REFERENCES
1. Ditmer, D.S. (ed.) (1961) Blood and Other Body Fluids, Federation of American Societies for Experimental Biology, Washington, D.e.
2. Fullard, R.J. (1988) Current Eye Research, 7, 163-179. 3. Chmiel, H. and Walitza, E. (1980) On the Rheology of Blood and Synovial
Fluids, Research Studies Press, New York. 4. Barbanel, J.e., Lowe, G.D.D. and Forbes, e.D. (1984), The viscosity of blood.
in Mathematics in Medicine and Biomechanics, G.F. Roach (ed.), Shiva Publications, Nantwich, p. 19.
5. Begg, T.B. and Hearns, J.B. (1966) Components in blood viscosity: The relative contribution of hematocrit, plasma fibrinogen and other proteins. Clinical Science, 31, 87-93.
6. Whitmore, R.L. (1968) Rheology of The Circulation, Pergamon Press, New York.
7. Merrill, E.W. (1969) Rheology of blood. Physiology Reviews, 49, 863-867. 8. Harkness, J. (1971) The viscosity of human blood plasma: Its measurement in
health and disease. Biorheology, 8, 171-193. 9. Lowe, G.D.D., Barbanel, J.e. and Forbes, e.D. (eds) (1981) Clinical Aspects
of Blood Viscosity and Cell Deformability, Springer-Verlag, New York. 10. Lowe, G.D.D and Barbanel, J.e. (1988) Plasma and blood viscosity, in Clinical
Blood Rheology, G.D.D. Lowe (ed.), CRC Press, Boca Raton, pp. 11-44. 11. Schmidt-Schonbein, H. (1988) Fluid dynamics and hemorheology, in Clinical
Blood Rheology, G.D.D. Lowe (ed.), CRC Press, Boca Raton, pp. 129-220. 12. Lentner, e. (ed.) (1984) Geigy Scientific Tables, Ciba-Geigy, Basle.
124 I ~I _____________ B_L_O_O_D __ AN __ D __ RE __ L_A_TE __ D __ FL_U_ID __ S ____________ ~
13. Bicks, R.L. (1993) Hematology: Clinical and Laboratory Practice, Mosby, St Louis.
14. Sokoloff, L. (ed.) (1978) The Joints and Synovial Fluid, Academic Press, New York.
15. Hermens, W.T., Willems, G.M. and Visser, M.P. (1982) Quantification of Circulating Proteins: Theory and Applications Based on Analysis of Plasma Protein Levels, Martinus Nijhoff, The Hague.
16. Colman, R.W., Hirsh, J., Marder, V.J., et al. (eds) (1993) Hemostasis and Thrombosis, Lippincott, Philadelphia.
17. Schultze, H.E. and Heremans, J.F. (1966) Nature and Metabolism of Extracellular Proteins, Elsevier, Amsterdam.
18. Bing, D.H. (ed.) (1978) The Chemistry and Physiology of the Human Plasma Proteins, Pergamon Press, Boston.
19. Stamatoyannopoulos, G., Nienhuis, A.W., Majerus, P.W., et al. (eds) (1994) The Molecular Basis of Blood Diseases, W.B. Saunders, Philadelphia.

L..--_T_h_e_V_it_r_e_oll_s_H_ll_m_or_-,,11 e21 T.V. Chirila and Y. Hong
C2.t INTRODUCTION
The vitreous body, also termed the vitreous humor, vitreus, or vitreous, is a clear and transparent mass (gel or liquid or a mixture of both) that fills the posterior cavity of the eye in vertebrates, between the lens and the retina. The human vitreous body is a hydrogel with a very high water content which provides an adequate support for the retina, allows the diffusion of metabolic solutes, and allows the light to reach the retina. There are currently two differing concepts on the nature of vitreous body. A significant amount of evidence supports the view that the vitreous body is basically an extracellular matrix. Another model has been developed in which the vitreous body is considered as a specialized, but simple, connective tissue. The two concepts are not yet reconciled, therefore the structure and role of the vitreous body are usually regarded from both points of view. It is accepted that the vitreous body possesses a unique macromolecular organization, a double-network system consisting of a scaffold of randomly spaced rod-like collagen fibers filled and ental).gled with a network of very large coiled-up macromolecules of hyaluronic acid (hyaluronan). The latter is present in the form of its sodium salt (sodium hyaluronidate). The double-network model explains satisfactorily most of the properties of the vitreous body, as well as its remarkable stability, although it probably overestimates the importance of hyaluronan. The natural vitreous body displays true viscoelastic properties which enable it to resist sudden compression shocks, offering much the best protection for the retina against contusion trauma. It is believed that the hyauronan network imparts the latter feature, while the collagen network is responsible for the plasticity and tensile strength of the vitreous body.
Handbook of Biomaterial Properties. Edited by J. Black and G. Hastings. Published in 1998 by Chapman & Hall, London. ISBN 0 412 60330 6.

THE VITREOUS HUMOR 126 I I ~----------------------------------------------------~
As is the case with many other structural elements of the eye, there are presently much more data on animal vitreous body than on the human counterpart. Likely, the results reviewed here cover almost everything reported so far on the human vitreous. However, in many cases it is not possible to select a most reliable single value; dependable values representing a range are thus provided in several of the following tables.
Being a very loose tissue, albeit well structured in a very specific way, the vitreous body becomes homogeneous during processing for measurements and the resulting data for its physical properties merely illustrate the behavior of a fluid consisting mainly of water and containing minute amount of inorganic and organic components. The dimensional characteristics (Tables C3.1, C3.S and C3.6), bulk chemical composition (Tables C3.2 and C3.3) and optical properties (Table C4.7) are seemingly not affected by the morphological heterogeneity of the vitreous. However, some investigators took into account the separate existence of gel and liquid fractions in the vitreous (Tables C3.4, and C3.6).
Over the past few decades the vitreous body was perceived as a typical viscoelastic material. However, its characterization by rheometry (as shown in Table C3.8) is still in its infancy.
C2.2 GENERAL PROPERTIES
Table C3.1 Physical properties of the human vitreous body
Property
Volume Weight Water content
pH
Osmolality Osmotic pressure
(freezing point depression) Density Intrinsic viscosity Dynamic viscosity Refractive index
Value
3.9ml 3.9 g
99.7% 99% 7.5
7.4-7.52 7-7.3
288-323 mOsm kg-1
-0.554 to -0.518°C [4] 1.0053-1.0089 g cm-3
3-5 x 103 cm3 g-l
1.6 cP 1.3345
1.3345-1.337
Source
[1 ] [1 ] [2] [3] [4] [5] [6] [7]
[8] [9] [10] [11] [1]

GENERAL PROPERTIES
Table C3.2 Inorganic ions content of the human vitreous body
Ion Representative value Source
Sodium 2.714-3.542 mg cm-3 [12] 3.15 glkg H2O [3]
2.603-5.805 mg cm-3 [6] Potassium 130--470 IJ.g cm-3 [12]
0.15 glkg HzO [3] 308-788 IJ.g cm-3 [6]
Calcium 56-106 IJ.g cm-3 [12] 14-76 IJ.g cm-3 [6]
Phosphate 0.1-3.3 mEq dm-3 [12] Chloride 3.155-5.140 mg cm-3 [12]
4 glkg H2O [3] 3.477-7.621 mg cm-3 [6]
Bicarbonate 1.2-3.0 glkg HzO [3]
Table C3.3 Organic content of the human vitreous body (low molecular weight components)
Component Representative value Source
Lipids 2IJ.glmi [13] Glucose 17-105 mgldl [12]
30-70 mgldl water [3] Lactic acid 70 mgldl water [3] Urea 24-172 mgldl water [12] Creatinine 0.3-3.0 mgldl [12] Citrate 1.9 mgldl water [3] Pyruvic acid 7.3 mgldl water [3] Ascorbic acid 36mgl100g [14]
Representative value Component (lJ.g cm-3) Source
Proteins' 280-1360 [13] 450-1100 [15]
Hyaluronan 100--400 [15] 42-399 [6]
Collagen 40-120 [15] 30-532 [6]
Albumin 293 ± 18 [16] Immunoglobulin (IgG) 33.5 ± 3 [16] <Xl-Antitrypsin 141 ± 2.9 [16] <Xl-Acid glycoproptein 4 ± 0.7 [16]
± = Standard deviation; a total protein content.
I I 127

128 II L ________________ T_H_E_V_I_T_R_E_O_U_S_H __ U_M_O_R ________________ ~
Table C3.4 Variation with age of total protein content in the liquid human vitreous [15]
Age range (years)
10-50 50-80 >80
Protein (mg em-3)
0.4-0.6 0.7-0.9 0.9-1.0
Table C3.S Axial length of the human vitreous body during maturation [17]"
Age (years) Axial length, and gender (mm)
<13, male 10.48 <13, female 10.22 >13, male 16.09 > 13, female 15.59
a The axial growth of the vitreous body is essentially completed by the age of 13 years.
Table C3.6 Gel and liquid volume of the vitreous as a function of age (adapted from [18])"
Age Gel volume Liquid volume (years) (em3) (em3)
Birth 1.6 0 5 3.3 0 10 3.5 0.7 20 3.9 0.9 30 3.9 0.9 ~ 3~ ~ 50 3.5 1.3 60 3.2 1.6 70 2.8 2.0 80 2.5 2.3 90 2.2 2.6
a The liquid vitreous appears first in childhood and by the seventh decade it occupies half of the vitreous [18, 19].

ADDITIONAL READING I I 129 ~----------------------------------------------------------~
Table C3.7 Transmission of radiation through the vitreous body (adapted from [20])
Wavelength (nm)
300 325 350 400 500 600 700
C2.3 MECHANICAL PROPERTIES
Transmittance (total, %)
o 76 82 90 97 98 98
Table C3.8 Rheological characteristics of the human vitreous body [21]
Region in the vitreous Parameter Anterior Central Posterior
Residual viscosity 1.4 2.2 4.9 11m (Pa s) Internal viscosity 0.3 0.35 0.5 11k (Pa s) Relaxation time 0.38 0.30 1.61 Tm (S) Retardation time 0.27 0.41 0.46 Tk (S) Elastic compliance,
instantaneous, Jm (m-2N-I) 0.1 0.3 0.3 Elastic modulus,
internal, Gk (N m-2) 2.5 1.3 1.2
ADDITIONAL READING
Balazs, E.A. (1968) The molecular biology of the vitreous, in New and Controversial Aspects of Retinal Detachment, (ed. A. McPherson), Harper & Row, New York, pp. 3-15.
This is a landmark paper on the nature of the vitreous body, describing the 'mechanochemical' (or 'double-network') model. This model explains satisfactorily the correlations between some properties of the vitreous (composition, rheology, volume, cell population, transparency) and the physicochemical principles governing its stability (frictional interaction, expansion/contraction, the excluded-volume concept, and the molecular-sieve effect).

130 I LI ________________ T_H_E_V_I_T_R_E_O_U_S_H __ U_M_O_R ________________ ~
Berman, E.R. and Voaden, M. (1970) The vitreous body, in Biochemistry of the Eye, (ed. C.N. Graymore), Academic Press, London, pp. 373-471.
A comprehensive summary of knowledge at that time on animal and human vitreous body, including development, chemical composition, metabolism, and aging effects.
Shields, J.A. (1976) Pathology of the vitreous, in Current Concepts of the Vitreous including Vitrectomy, (ed. K.A. Gitter), C.V. Mosby Co., St. Louis, pp. 14-42.
This book chapter presents competently the pathologic vitreous, including developmental abnormalities, inflammation, hemorrhage, effects of trauma, systemic diseases, and degenerative processes.
Gloor, B.P. (1987) The vitreous, in Adler's Physiology of the Eye, 8th ed., (eds R.A. Moses and W.M. Hart), C.V. Mosby Co., St. Louis, pp. 246-267.
A concise description of all aspects of the vitreous body, including properties, development, anatomy, structure, biochemistry, metabolism, and pathology.
Sebag, J. (1989) The Vitreous. Structure, Function, and Pathology, Springer-Verlag, New York.
This is probably only the second single-authored book in this century to be dedicated entirely to the topic of vitreous body. It is a well-structured and updated compendium. The first half of the book is dedicated to structure, properties and physiology of the vitreous. Pathology of the vitreous is analyzed in the other half from a biological angle. Although a clinician, the author manages to avoid typical clinical descriptions and to provide a text which integrates the basic scientific knowledge for both clinicians and scientists.
Williams, G.A. and Blumenkranz, M.S. (1992), Vitreous humor, in Duane's Foundations of Clinical Ophthalmology, vol. 2 (eds W. Tasman and E.A. Jaeger), J .B. Lippincott Co., Philadelphia, chapter 11.
This chapter (27 pages) presents the modern concepts in the pathophysiologic mechanisms of vitreous diseases, and in the clinical conditions involving the vitreous (detachment, macular holes and membranes, diabetes, proliferative vitreoretinopathy, hyalosis, amyloidosis). Aspects such as separation of the vitreous from the retina and traction of the vitreous by hypocellular gel contraction are explained according to the most recent findings.
REFERENCES
1. Redslob, E. (1932) Le corps vitre, Masson & Cie, Paris, pp. 299-305. 2. Duke-Elder, W.S. (1929) The physico-chemical properties of the vitreous body.
J. Physiol., 68, 155-65. 3. Nordmann, J. (1968) Chimie, in Biologie et chirurgie du corps vitre, (eds A.
Brini, A. Bronner, J.P. Gerhard et al.), Masson & Cie, Paris, pp. 95-167. 4. Morner, C.T. (1894) Untersuchung der Protei"nsubstanzen in den licht
brechenden Medien des Auges. Z. Physiol. Chern., 18,233-56. 5. Gala, A. (1925) Observations on the hydrogen ion concentration in the vitre
ous body of the eye with reference to glaucoma. Br. J. Ophthalmol., 9, 516-9. 6. Lee, B. (1994) Comparative rheological studies of the vitreous body of the
eye, Ph.D. Thesis, University of Pennsylvania, 1992, U.M.I.IBell & Howell Co., Ann Arbor, MI, pp. 102, 138-152.
REFERENCES I I 131 L-__________________________________________________________ ~
7. Sturner, W.Q., Dowdey, AB.e., Putnam, R.S. et al. (1972) Osmolality and other chemical determinations in postmortem human vitreous humor. 1. Forensic Sci., 17, 387-93.
8. Visser-Heerema, J. (1936) Ober das spezifische Gewicht der bei der Operation von NetzhautablOsungen gewonnenen Fliissigkeit. Arch. Augenheilkd., 109, 543-61.
9. Berman, E.R. and Michaelson, I.e. (1964) The chemical composition of the human vitreous body as related to age and myopia. Exp. Eye Res., 3, 9-15.
10. Shafer, D.M. (1965) Intraocular injections as adjuncts to other retinal detachment procedures, in Controversial Aspects of the Management of Retinal Detachment, (eds e.L. Schepens and e.DJ. Regan), Little, Brown & Co., Boston, pp. 186-204.
11. Guggenheim, I. and Franceschetti, A. (1928) Refraktometrische Untersuchungen des Glaskorpers von Kaninchen und Mensch (unter physiologischen und pathologischen Bedingungen). Arch. Augenheilkd., 98, 448-82.
12. Naumann, H.N. (1959) Postmortem chemistry of the vitreous body in man. Arch. Ophthalmol., 62, 356-63.
13. Swann, D.A (1980) Chemistry and biology of the vitreous body. Int. Rev. Exp. Pathol., 22, 1-64.
14. Siillmann, H. (1951) Chemie des Auges. Tabul. BioI., 22, 1-119. 15. Balazs, E.A and Denlinger, J.L. (1984) The vitreus, in The Eye, vol. la, 3rd
edn, (ed H. Davson), Academic Press, Orlando, FL, pp. 533-89. 16. Clausen, R., Weller, M., Wiedemann, P. et al. (1991) An immunochemical
quantitative analysis of the protein pattern in physiologic and pathologic vitreous. Graefe's Arch. Clin. Exp. Ophthalmol., 229, 186-90.
17. Larsen, J.S. (1971) The sagital growth of the eye. III. Ultrasonic measurement of the posterior segment (axial length of the vitreous) from birth to puberty. Acta Ophthalmol., 49, 441-53.
18. Balazs, E.A (1992) Functional anatomy of the vitreus, in Duane's Foundations of Clinical Ophthalmology, vol. 1, (eds W. Tasman and E.A Jaeger), J.B. Lippincott Co., Philadelphia, Chapter 17.
19. Balazs, E.A and Denlinger, J.L. (1982) Aging changes in the vitreus, in Aging and Human Visual Function, (eds R. Sekuler, D. Kline and K. Dismukes), Alan R. Liss, Inc., New York, pp. 45-57.
20. Boettner, E.A and Wolter, J.R. (1962) Transmission of the ocular media. Invest. Ophthalmol., 1, 776-83.
21. Lee, B., Litt, M. and Buchsbaum, G. (1992) Rheology of the vitreous body. Part I: Viscoelasticity of human vitreous. Biorheology, 29, 521-33.

PART II

L...--_M_e_ta_ll_ic_B_io_m_a_te_r_ia_l_s _-----'10 J. Breme and V. Biehl
1.1 INTRODUCTION
Compared with other biomaterials like ceramics and poylmers, the metallic biomaterials possess the outstanding property of being able to endure tensile stresses, which, in the case of alloys, may be extremely high and also of dynamic nature. This is the reason why alloys, for example those with sufficient bending fatigue strength, are widely used as structural materials for skeletal reconstructions if high acting loads are expected to occur. Typical examples for such highly loaded implants are hip and knee endoprostheses, plates, screws, nails, dental implants, etc. Ne",'ertheless, metallic biomaterials are also used for unloaded, purely functional devices such as cages for pumps, valves and heart pacemakers, conducting wires, etc.
The main requirements which must be fulfilled by all biomaterials are corrosion resistance, biocompatibility, bioadhesion (bone ingrowth), biofunctionality (adequate mechanical properties, especially fatigue strength and a Young's modulus as close to that of the bone as possible), processability and availability. These requirements are more or less satisfactorily fulfilled by the various customary groups of biomaterials. In comparison the different materials show a different behaviour according to the demands. A corrosion resistant material may not necessarily be biocompatible and, contrarily, a more biocompatible material may be less corrosion resistant. Especially fretting corrosion may pose a problem in articulating devices like knee joints or plate/screw systems. Often unique characteristic properties of a material are responsible for its application. Typical examples are the amalgams which in spite of their reduced
Handbook of Biomaterial Properties. Edited by J. Black and G. Hastings. Published in 1998 by Chapman & Hall, London. ISBN 0 412 60330 6.

136 I LI _______________ M __ E_T_A_L_L_IC __ B_IO __ M_A_T_E_R_I_A_L_S ______________ ~
corrosion resistance and biocompatibility were used over a long period of time for dental restoration due to their extremely good process ability provided by their ability to amalgamate with mercury at room temperature within a short time, showing in this condition a high hardness.
The biocompatibility of most metallic biomaterials is based on a passive oxide layer which is always present on the metal surface and which will be restored quickly (milliseconds) after damage. These oxide layers, similar to alumina, show an inert behaviour towards the surrounding tissue. Therefore, the chemical bonding of a metallic implant with the tissue, which is observed between bioactive ceramics like hydroxyapatite and bone, seems to be improbable, and the adhesion strength between the bone and the metal will have a primarily mechanical character. With stainless steel and a cobalt-chromium base alloy ('Vitallium') metallic materials exhibiting such a passive and highly inert oxide layer have been available for about 60 years. About 25 years ago, due to the favourable properties of the special metals niobium, tantalum and titanium, their application as biomaterials became the subject of much discussion. Especially titanium and its alloys began to compete with the existing biomaterials.
Because of this competitive situation an enormous advancement of the materials was set going in different directions. Quality assurance systems for customers and surgeons were created by standardization and normalization of the existing materials. In addition, attention was devoted to the further development of the existing base materials, one example being the development of a forgeable Ni-free cobalt-chromium alloy with an extremely low carbon content, with a resulting avoidance of the precipitation of brittle carbides. Examples related to titanium materials are the development of alloys containing no toxic elements like vanadium (e.g. Ti5A12.5Fe and Ti6AI7Nb) and the development of near (3- or (3-alloys. Besides a high fatigue strength these alloys have, due to a high content of the (3-phase, a Young's modulus which is even lower than that of conventional titanium materials, by means of which a good load transfer is achieved. Therefore, stress shielding can be avoided and new bone formation is stimulated.
A further direction of advancement was originated by the progress being made in research and surgery and by the demand for materials with special properties for special applications. For these cases the materials, which are often composite materials, had to be tailored to the intended application. One example is the development of the alloy TiTa30 which in its thermal expansion coefficient is very similar to alumina and can therefore be crackfree bonded with the ceramic. This material is used as a dental implant. The metallic biomaterial which can resist bending stresses is inserted into the jaw. The upper part of the implant consisting of alumina, which shows a smaller deposition of plaque than the metallic materials,

L-_______________ G_E_N_E_R __ A_L_D_I_S_CU __ SS_I_O_N ________________ ~I I 137
passes through the gingiva into the mouth cavity. Another example for the tailoring of materials is a surface treatment in order to improve the physical properties. Heart pacemaker leads, for example, which are produced by porous sintering of Ti-powder, are PVD-surface coated with Ir, TiN, TiB2' TiC, etc. in order to increase the electrical conductivity.
In the following chapters the various groups of metallic biomaterials are characterized in terms of their composition, physical and mechanical properties and their corrosion and biological behaviour. In addition, recommendations are given for their processing (deformation, machining, welding, brazing, etc.).
1.2 GENERAL DISCUSSION
Considering the testing meihods used to determine the main requirements which must be fulfilled by biomaterials, i.e. corrosion resistance, biocompatibility, bioadhesion and biofunctionality, it is obvious that only the measurement of the mechanical properties, including fatigue (biofunctionality), will supply objectively comparable results because these testing methods are standardized.
In the methods used for the investigation of corrosion resistance, biocompatibility and bioadhesion the researchers try to simulate and imitate the natural in vivo condition of the implant. Only in the near past have efforts been made to standardize these tests. Because of a longtime decline of standardization the tests described up until now in literature differ and the results of such diversified tests are not comparable. Corrosion measurements, for example, are performed in different solutions with changing pH values and atmospheres (aerated or de-aerated). Only if different materials have been investigated in one test and under the same conditions does a comparison of their behaviour for this test seem possible. Nevertheless, regarding the differing test results, the most corrosion resistant materials seem to be the special metals (titanium, niobium, tantalum and their alloys), followed by wrought CoCr-based, cast CoCr-based alloys and stainless steel.
The current density of various materials was determined as a function of the potential difference between the anodic and cathodic branches of the current potential curves in 0.9% NaCl with a stable redox system Fe (CN)64-lFe (CN)l [1]. The saline solution containing this redox system had a resting potential closely resembling that of a tissue culture fluid which has a redox potential of 400 mY. Ti and its alloys Ta and Nb exhibit a better resistance than the stainless steel AISI 316L and a wrought CoNiCr alloy. The same ranking can be observed during the measurement of the polarization resistance of the different materials [1]. Breakdown potential measurements of various implant materials in

138 I ~C=== _______________ M_E_T_A_L_L_IC __ B_IO __ M_A_T_E_R_I_A_L_S ______________ ~
Hank's solution also indicated a clear order of ranking of the materials. While commercially pure titanium and Ti6Al4V had high breakdown potentials of 2.4 and 2.0 V respectively, for stainless steel and CoCr alloys (cast and wrought) this value amounted to only 0.2 and 0.42 V respectively [2]. As already described [3], Ti and its alloys with Nb and Ta belong to the group of metals which cannot undergo a breakdown of passivity in body fluids. In these fluids a breakdown at a high potential causing pitting corrosion is impossible because it is more positive than the oxygen reduction reversible potential. On the other hand, the passivation potential is less positive than the water or hydrogen-ion reduction.
In all materials the passive layer can be damaged mechanically, for example, by fretting metal on metal (plate/screw) or by the instruments used during surgery. The repassivation time of the material is therefore very important. The repassivation behaviour of different materials in a saline solution was measured using an electrode which rotates at a rate of 10 S·1 in the solution, during which it is activated by an Al20 3 cutting tool. The decrease in the corrosion current is measured as a function of the time at different potentials. The repassivation is defined as being achieved when the current density amounts to lie (e [approximate or equal too] 2718) of the current density in the activated condition [4]. In addition, the time to.os of a residual active current density of 5 % was determined. The passive oxygen surface layer (te) is reconstructed as a function of the material in some milliseconds, demonstrating an advantage on the part of titanium materials. The growth of the surface layer (to.os) of cp-titanium and the titanium alloys is accelerated as compared to that of the other materials (stainless steel, wrought and cast CoCr).
In order to avoid damaging of the surface layer, coatings of hard layers of non-abrasive materials which also show favourable fretting behaviour, are recommended, especially for the movable parts of implants. Since the highest values for the acceleration tension are achieved by ion implantation, the best reaction and binding can be expected with this procedure. By the implantation of TiN on wrought CoCr, for example, not only the fretting behaviour, but also the corrosion resistance of the material tested in 0.17 M saline solution was improved. The pitting of the surface treated material amounted to 1.16 V, while the material which had not undergone surface treatment had a potential of 0.83 V [5]. If cracks and fissures are present in the surface layer, the corrosion rate will be accelerated due to the lower pH value in these crevices. Experiments with ion implantation of nitrogen in titanium surfaces produced good results concerning the fretting behaviour. Even the fatigue strength of the alloy Ti6Al4V, which was surface treated by nitrogen ion implantation, is reported to have increased due to compression stresses generated by the high acceleration tension of the nitrogen ions [6]. Another possibility of hardening the surface of Ti and its alloys without diminishing the corrosion

GENERAL DISCUSSION
behaviour and fatigue properties is a short annealing in air, e.g. by induction heating and subsequent quenching. This method was applied for the improvement of the friction behaviour of hip prosthesis heads [7].
For the biocompatibility and bioadhesion tests similar restrictions as in the corrosion resistance tests must be observed. A comparison of the behaviour of the different materials is possible only if the testing conditions are identical. Results obtained in animal experiments with rats and rabbits must be treated with reservations because both animals show intense bone growth and rapid healing after the implantation.
Measurements of the concentration of various metals in different organs of a rabbit six and sixteen weeks after implantation showed after six weeks a titanium content of 45.1 ppm in the spleen and 53.4 ppm in the lung. These values correspond to the values in a normal spleen or lung. No significant changes were observed in the liver or kidneys. However, Co and Ni from cobalt-based alloys and stainless steel were found in higher concentrations in these organs [8].
Patients with total hip replacements by implants of stainless steel or of CoCr alloys who experienced difficulties after two to fifteen years due to a loosening of the prosthesis and/or allergic reactions to Cr, Co or Ni were found to have an increased content of these elements in their urine, plasma and blood. Already fifteen months after removal the contents were excessive in these fluids [9].
The level of toxicity of the various elements was determined by investigating the reaction of salts of these elements with cells of the kidneys of green African monkeys. The so-called CCRso value was measured which is defined as the concentration of the studied substance which generates a reduction of survival of the renal cells of 50%. Of all the elements measured the lowest value of 3 x 10⁻² !J.glml was observed for vanadium [10]. This is the reason why absolutely biocompatible biomaterials containing no toxic elements such as Ti5A12.5Fe [11] and Ti5Al7Nb [12] were developed.
After insertion of wires of different metals into the epiphyseal region of rabbits and an exposure time of fifteen months, the histology showed different results. With materials of inert or biocompatible behaviour the cells in the vicinity of the implant were still supplied with blood, while the cells in the neighbourhood of toxic materials underwent an inflammatory reaction and died. A few elements (Cr, Co, Ni and V) have toxic effects and also have a relatively low polarization resistance. Ti and its alloys, Nb and Ta, which have a high polarization resistance, exhibit an inert behaviour. In between the materials were found which are capsulated. The results also show that not only the corrosion behaviour provided by the polarization resistance is responsible for the biocompatibility of the material exposed to the tissue. The steel 316L and the CoCr alloy, which have a polarization resistance similar to that of titanium, are encapsulated by a tissue membrane and their behaviour is not inert [13].

140 I ~I _______________ M_E_T_A_L_L_IC __ B_IO __ M_A_T_E_R_I_A_L_S ______________ ~
A sensitive and reproductive test of biocompatibility seems to be the cultivation of cells with an increasing content of fine metal powders «20 f.Lm). The survival rate is measured after a constant exposure time. The limit of toxicity Cso is defined as the value (f.Lglml) of the powder concentration which produces a dying off of 50% of the cells. (The results can be found in the chapters related to biocompatibility.)
In the implant/body system there are several interactions which can generate injuries:
(a) The corrosion process produces a flow of electrons in the implant metal and a flow of ions in the surrounding tissue. The latter may disturb the physiological ion movement of the nerve cells.
(b) An inorganic reaction of the implant or of primary corrosion products is caused by the solution of metal ions in the body fluid and transport to the various organs where they are concentrated and can produce systemic or hypersensitive effects if the limit of toxicity for a certain metal is exceeded.
(c) Direct organic reaction of the implant or of primary corrosion products with proteins of the tissue takes place, causing, for example, inflammation.
(d) Generation of H20 2 by inflamed cells and decomposition of H20 2 by the formation of a hydroxyl radical, causing injury in the biological system.
Whether one of these interactions occurs or not depends on the physical and chemical properties of the various materials. Ti, Ta and Nb are reported to be biocompatible because they form protective surface layers of semi- or nonconductive oxides. These oxides are able to prevent to a great extent an exchange of electrons and therefore a flow of ions through the tissue [14] due to their isolating effect. This isolating effect may be demonstrated by the dielectric constants of the different metal oxides. There are three groups of oxides. While Ti02 (rutile), Fe20 3 and Nb20 s have constants even higher than that of water, A120 3, Cr20 3 and Ta20 s have a lower isolating effect and a higher conductivity. For Ni- and V-oxides dielectric constants are not available because of their high conductivity [8). The relatively low isolating effect of Ta-oxide is indirectly proved by the cytotronic effects of Ta on the membrane properties and on the growth of spinal ganglion cells during in vitro tests. In contrast, Ti showed no effect on the membrane properties and on the growth of ganglion cells [15].
Concerning inorganic or organic reactions, the primary corrosion products of the metallic implants are mainly responsible for the biocompatibility of the implanted metal because they may have, due to their large surface, an interaction with the tissue or with the body fluid. The metal is transported by a solution in the body fluid to the various organs where due to an enrichment of the metal an undesirable interaction may occur.

GENERAL DISCUSSION I I 141 L-____________________________________________________ ~
The primary corrosion products of the most important elements in metallic implant materials vary in their thermodynamic stability. While the oxides or hydroxides of AI, Cr, Nb, Ta, Ti and V are stable due to a more negative heat of formation than that of water, the oxides and hydroxides of Co and Ni are unstable because of a less negative heat of formation than that of water [16]. The interaction between the oxide or hydroxide and the body fluid is increased if the heat of formation for the oxide or hydroxide is increased. Therefore, the thermodynamically stable corrosion products have a low solution product and a low solubility in the body fluid. This is directly demonstrated by the pk values (negative logarithm) of the solution product of the primary corrosion products [13]. While Ti, Ta-, Nb- and Cr-oxides have pk-values of >14, i.e. hydrolysis cannot play a role, Co-, Fe-, and Ni-oxides possess even negative pk values which cause a considerable solubility. In spite of a high negative heat of formation for Fe20 3 and Fe- and Cr-hydroxide negative pk values and a high solubility are reported [13]. A remarkable solubility of Cr in serum was observed [17], while titanium is practically insoluble due to the formation of the thermodynamically very stable oxide Ti02•
Thermodynamically stable primary corrosion products with a low solubility in body fluid are in a stable equilibrium with only a low reactivity with the proteins of the surrounding tissue.
The hydroxyl radical is able to cause injury in biological systems, e.g. biomembranes can be deteriorated. Titanium is able to bind H20 2 in a Ti-H20 2 complex. This complex can trap the superoxide radical which is formed during the H20 2 decomposition. By spectrophotometric spintrapping measurements and electron spin resonance measurements no hydroxyl radical formation rate in Ti-H20 2 could be detected. A similar result was observed with Zr, Au and Al [18].
The integration of metallic implants by ingrowth was studied for many different materials and implant systems. The ingrowth behaviour of miniplates of commercially pure titanium and of the stainless steel 316L was investigated by the implantation of these plates on the legs of Hanford minipigs. The mini plates were fixed to the legs of the pigs by screws. After removal following an exposure time of eight weeks a histologic examination was performed by fluorescence microscopy. In all animals where titanium plates had been used a new formation of bone could be observed in close contact to the surface of the screws and plates [19]. In contrast to this result, when stainless steel was used, there was less new bone formation and in addition granulated tissue was found between the metallic surface and surrounding bone [19]. This granulated tissue at the interface bone/implant has the disadvantage that it is not supplied with blood. Therefore, a systematic treatment of the host tissue against inflammatory reactions in the vicinity of the implant by means of injections is not successful because the antidote cannot be transported directlv
142 I LI _______________ M_E_T_A_L_L_IC __ B_IO __ M_A_T_E_R_I_A_L_S ______________ ~
to the inflamed area. In addition, the granulated connective tissue is not able to transfer or sustain forces, so that a loosening of the implant will take place. Growth of the bone in close contact with the metal has already been reported in many other investigations [20-25] in which the contact area tissue/implant has been studied in detail.
Dental implants made from different materials inserted into the jaws of dogs varied in their behaviour. With titanium implants the bone grew in close contact to the metal surface. In contrast, when stainless steel was used as the implant material, a fibrous encapsulation which separated the implant from the surrounding tissue was formed. In titanium implants instead of this fibrous encapsulation an intercellular substance appeared. A similar unfavourable behaviour was found in the case of dental implants of a CoCr alloy in dogs. Histological findings showed that 28 days after the implantation newly formed bone fibrils grew into the surface of the metal. However, already after 56 days the hole of the implant was enlarged due to a decrease in the newly formed bone caused by resorption. After 112 days a vitallium implant was lost, whereas a CoCr implant which had been plasma coated with titanium again had close contact to the bone [26].
The surface roughness of metallic implants plays an important role. This influence was investigated using cylinders of titanium and titanium alloys which were implanted on the legs of rabbits. A measurable adhesion of the titanium alloys could be observed only on implants with a surface roughness of >22 fJ.m. With increasing roughness the adhesion strength is improved.
The exposure time after the implantation also has an influence. With implants of Ti6Al4V the tensile strength required to tear the cylinders off the bone was more than doubled if the time was increased from 84 to 168 days. After the short exposure time of 84 days an implant of Ti5A12.5Fe already had an adhesion to the bone similar to that of an implant made of bioglass.
In contrast to the titanium alloys, the adhesion of the bioglass was not dependent on the surface roughness [27]. These results show that the growth of the bone and the tissue in close contact to Ti and its alloys with formation of a strong bond must have a more biomechanical than chemical-bioactive character. Consequently, it was shown that by an increase of the surface area, e.g. by drilling holes in the contact area of the implanted cylinders to the bone, the tear-off force necessary was increased. However, if the supplementary surface was taken into consideration, the adhesion strength was not increased. A Ti5A12.5Fe implant coated with hydroxylapatite had a maximum adhesion strength of 1.97 N/mm2 [27] already after 84 days.
The improved fixation of the bone at a structural implant surface leads consequently to a porous implant and implant surface respectively, which

REFERENCES I I 143 L-______________________________________________________ ~
allows an ingrowth of the bone. In addition to an improved fixation, the porous implant has two other advantages: its Young's modulus is decreased, which provides better transmission of the functional load and stimulation of new bone formation. In addition, the damping capacity of the implant is increased, and the shear stress generated by the functional loading is decreased because, similar to the thread of a screw, the load at this interface causes a normal stress perpendicular to the inclined area and a lower shear stress which is effective in the inclined area.
REFERENCES
1. Zitter, H. and Plenk, H. (1987) The Electrochemical Behaviour of Metallic Implant Materials as an Indicator of their Biocompatibility. l. of Biomedical Materials Research, 21, 881.
2. Fraker, AC., Ruff, AW., Sung, P. von Orden, AC. and Speck, K.M. (1983) Surface Preparation and Corrosion Behaviour of Titanium Alloys for Surgical Implants, in Titanium Alloys in Surgical Implants, (eds H.A Cuckey and F. Kubli), ASTM STP 796, pp. 206-219.
3. Mears, D.C. (1975) The Use of Dissimilar Metals Surgery. l. Biomed. Mat. Res., 6, 133.
4. Ratzer-Scheibe, H.J. and Buhl, H. (1984) Repassivation of Titanium and Titanium Alloys, in Proc. of the 5th World Conf on Titanium, Vol. 4, pp. 2641-2648.
5. Higham, P.A (1986). Proc. Conf. Biomed Mat., Boston, Dec. 1985,253. 6. Williams, J.M. and Buchanan, R.A (1985) Ion Implantation of Surgical Ti-
6AI-4V. Mater. Sci. Eng., 69, 237-246. 7. Zwicker, U., Etzold, U. and Moser, Th. (1984) Abrasive Properties of Oxide
Layers on TiAI5Fe2.5 in Contract with High Density Polyethylene, in Proc. of the 5th World Conf on Titanium, Vol. 2, pp. 1343-1350.
8. Ferguson, AB., Akahashi, Y., Laing, P.G. and Hodge, E.S. (1962) l. Bone and loint Surg., 44, 323.
9. Hildebrand, H.F., Mercier, J.V., Decaeslecker, AM., Ostapzuk, P., Stoeppler, u., Roumazeille, B. and DecIoulx, J., Biomaterials.
10. Frazier, M.E. and Andrews, T.K. (1979), in Trace Metals in Health and Disease (ed. N. Karash), Raven Press, NY, 71.
11. Zwicker, U., Buhler, U., Muller, R., Beck, H., Schmid, H.J. and Ferstl, J. (1980) Mechanical Properties and Tissue Reactions of a Titanium Alloy for Implant Material, in Proc. of the 4th World Conf on Titanium, Vol. 1, pp. 505-514.
12. Semlitsch, M. Staub, T. and Weber, H. (1985) Titanium-Aluminium-Niobium Alloy, Development for Biocompatible, High Strength Surgical Implants. Biomed. Tech. 30 (12), 334-339.
13. Steinemann, S.G. and Perren, S.M. (1984) Titanium Alloys as Metallic Biomaterials, in Proc. of the 5th World Conf on Titanium, Vol 2, pp. 1327-1334.

METALLIC BIOMATERIALS
14. Zitter, K., Plenk, H. and Strassl, H. (1980) Tissue and cell reactions in vivo and in vitro to different metals for dental implant, in Dental Implants, (ed. G. Heimke), C. Hanser, Mtinchen, p. 15.
15. Bingmann, D. and Tetsch, P. (1986) Untersuchungen zur Biokompatibilitat von Implantatmaterialien. Dt. Zeitschr. f Zahniirztl. Implantol., Bd. II, 190.
16. Kubashewski, 0., Evans, E.CI. and Alcock, c.B. (1967) Metallurgical Thermochemistry, Pergamon Press, London.
17. Zitter, H. (1976) Schadigung des Gewebes durch metallische Implantate. Unfallheilkunde, 79, 91.
18. Tengvall, P., Lundstrom, J., Sjoquist, L., Elwing, H. and Bjursten, L.M. (1989) Titanium-Hydrogen Peroxide Interactions. Model Studies of the Influence of the Inflammatory Response on Titanium Implants. Biomaterials 10 (3) 166-175.
19. Breme, J. Steinhauser, E. and Paulus, G. (1988) Commercially Pure Titanium Steinhauser Plate-Screw System for Maxillo facial Surgery. Biomaterials, 9, 310-313.
20. Krekeler, G. and Schilli, W. (1984) Das ITI-Implantat Typ H: Technische Entwicklung, Tierexperiment und klinische Erfahrung. Chirurgische Zahnheilkunde, U, 2253-2263.
21. Kirsch, A. (1980) Titan-spritzbeschichtetes Zahnwurzel-implantat unter physiologischer Belastung beim Menschen. Dt.Zahniirztl.Z., 35, 112-114.
22. Schroder, A., van der Zypen, E. and Sutter, F. (1981) The Reaction of Bone, Connective Tissue and Epithelium to Endosteal Implants with TitaniumSprayed Surface. J. Max. Fac. Surg., 9, 15.
23. Bn\nemark, P.I., Adell, R., Albrektsson, T., Lekholm, U. Lundkvist, S. and RockIer, B. (1983) Osseointegrated Titanium Fixtures in the Treatment of Edentulousness. Biomaterials, 4, 25.
24. Schroder, A., Stich, H., Strautmann, F. and Sutter, F. (1978) tiber die Anlagerung von Osteozement an einem belasteten Implantatkorper. Schw. Mschr. f Zahnheilkunde,4, 1051-1058.
25. Kydd, W.L. and Daly, C.H. (1976) Bone-Titanium Implant Response to Mechanical Stress. J. Prosthet. Dent., 35, 567-571.
26. Strassl, H. (1978) Experimentelle Studie tiber das Verhalten von titanbeschichteten Werkstoffen hinsichtlich der Gewebekompatibilitat im Vergleich zu anderen Metallimplanteten. Teil 1, Osterr. Z. Stomatol., 75 (4), 134-146.
27. Schmitz, H.J., Gross, V., Kinne, R., Fuhrmann, G. and Strunz, V., Der Einflu(3 unterschiedlicher Oberflachenstrukturierung plastischer Implantate auf das histologische Zugfestigkeitsverhalten des Interface, 7. DVM-Vortragsreihe Implantate.

~ ____ S_t_a_in_l_e_ss __ St_e_e_ls ____ ~1 11al
lA.l COMPOSITION
Table 1a.1 Comparison of international standard stainless steels for various medical applications
Great Chemical composition
Germanyl) Britain2) Frana?)
X20Cr13 (cast) X20Cr13 XI5Cr13 X46Cr13 X20CrNil72 X12CrMoS17 X5CrNi181O
XI0CrNiS189 X2CrNi1911 X2CrNi189 (cast) X12CrNi177 X5CrNiMo 17122 X5CrNiMo 17133 X2CrNiMol7132 X2CrNiMol7130 X2CrNiMo1810 (cast) X2CrNiMoNl7122 X2CrNiMoN17133
X2CrNiMo18164 X5CrNiMo1713 X6CrNiTi1810
Alloy No. B.S.1. No. AFNOR No.
1.4021 1.4021 1.4024 1.4034 1.4057 1.4104 1.4301
1.4305 1.4306
1.4310 1.4401 1.4436 1.4404
1.4406 1.4429
1.4438 1.4449 1.4541
410C21 420S27 420S29 (420S45) 431S29
304S15 304S16 303S21 304S12 304S11 301S21 316S16
315S11 316S12
316S61 316S62
304C12 317S12 317S16 321S12 321S31
Z12Cr13 Z20C13
Z38C13M Z15CN16.02 ZlOCF17 Z6CNI8-09
ZlOCNFI8.9 Z2CNFI8.9 Z2CN19 Z12CN17.07 Z6CND17.11 Z6CND17.12 Z2CND18.13 Z2CND17.12
Z2CND17.12Az Z2CND17.13Az Z12CN18.07 Z2CN18.9 Z2CND19.15
Z6CNT18.10
United States4)
AISIISAE No.
410CA-15 420
431 430F11405-89 304 304H 303 304U 1405-89 301 316
316L
316LN
317L 317 321
XlOCrNiNb189 1.4550 XI0CrNiMoNb1810 1.4580 X2CrNiN181O
ZlOCNNbl8-lO 347 Z8CNDNbl8-12 318
XM-21
x = sum of alloying elements >5 wt %. Figure after X = carbon content multiplied by 100. L = low carbon content. N = contains nitrogen.
Japan5)
lIS No.
SUS410 SUS4020J1
SUS431 SUS430F SUS304
SUS303 SUS19 SUS304L SUS301 SUS316
SUS316L
SUS316L
SUS17L SUS317 SUS321
l)standardized in DIN 17440 - 17443, DIN 174400 will be replaced by DIN EN 10088. 2)standardized in BS 970/1 and BS7253-1, BS7252-9: ISO 5832-1. 3)standardized in NFA 35-574, replaced by NF EN 10088-3. 4)also standardized in ASTM A276. 5)standardized in JIS Cr 4303.

Tab
le l
a.2
Che
mic
al c
ompo
siti
on (
wt%
) an
d ap
plic
atio
n of
ste
els
for
med
ical
ins
trum
ents
(R
ef.
2, 3
, 4)
Mar
tens
itic
and
aust
eniti
c fr
ee c
utti
ng s
teel
s
C
Si
Mn
P
S V
C
r M
o N
i A
ppli
cati
on
X12
CrM
oS17
0.
1-0.
17
~1.0
~1.5
~0.045
0.15
-0.2
5 -
15.5
-17
.5
0.1-
0.3
hand
les,
scr
ews,
nu
ts
X12
CrN
iS18
8 ~0
.15
~1.0
g
.o
~0.045
0.1-
0.2
9-11
.5
8-10
ha
ndle
s, s
crew
s bo
lts,
prob
es
Aus
teni
tic
stee
ls
X5C
rNi1
81O
~0
.07
~1.0
g
.O
~0.045
~0.0
3 17
-20
9-11
.5
pinc
ette
s, s
ciss
ors,
fo
rcep
s X
12C
rNi1
77
~0.15(AISI)
g.O
~0
.045
~0.0
3 16
-18
7-9
hand
les,
dri
lls
~0.1
2
X5C
rNiM
ol71
22
~0.D
7 ~1
.0
g.o
~0.045
~0.0
3 16
.5-1
8.5
2-2.
5 10
.5-1
3.5
pinc
ette
s, s
ciss
ors,
dr
ills
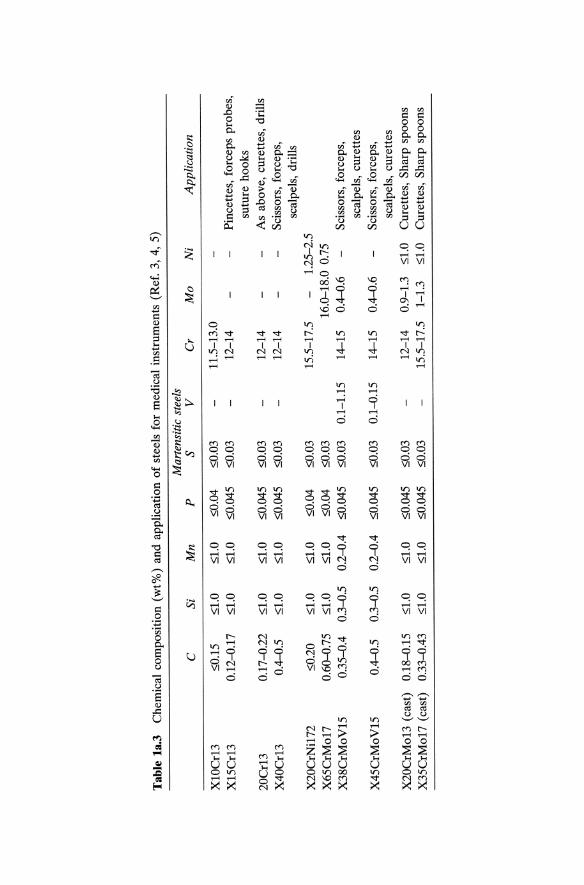
Tab
le 1
a.3
Che
mic
al c
ompo
siti
on (
wt%
) an
d ap
plic
atio
n o
f st
eels
for
med
ical
ins
trum
ents
(R
ef.
3, 4
, 5)
Mar
tens
itic
ste
els
C
Si
Mn
P
S V
C
r M
o
Ni
App
lica
tion
XlO
Cr1
3 ::;
0.15
::;
1.0
::;1.
0 ::;
0.04
::;
0.03
11
.5-1
3.0
X15
Cr1
3 0.
12-0
.17
::;1.
0 ::;
1.0
::;0.
045
::;0.
03
12-1
4 P
ince
ttes
, fo
rcep
s pr
obes
, su
ture
hoo
ks
20C
rl3
0.17
-0.2
2 ::;
1.0
::;1.
0 ::;
0.04
5 ::;
0.03
12
-14
As
abov
e, c
uret
tes,
dri
lls
X40
Crl
3 0.
4-0.
5 ::;
1.0
::;1.
0 ::;
0.04
5 ::;
0.03
12
-14
Sci
ssor
s, f
orce
ps,
scal
pels
, dr
ills
X
20C
rNil
72
::;0.
20
::;1.
0 ::;
1.0
::;0.
04
::;0.
03
15.5
-17.
5 1.
25-2
.5
X65
CrM
o17
0.60
-0.7
5 ::;
1.0
::;1.
0 ::;
0.04
::;
0.03
16
.0-1
8.0
0.75
X
38C
rMoV
15
0.35
-0.4
0.
3-0.
5 0.
2-0.
4 ::;
0.04
5 ::;
0.03
0.
1-1.
15
14-1
5 0.
4-0.
6 S
ciss
ors,
for
ceps
, sc
alpe
ls,
cure
ttes
X
45C
rMoV
15
0.4-
0.5
0.3-
0.5
0.2-
0.4
::;0.
045
::;0.
03
0.1-
0.15
14
-15
0.4-
0.6
Sci
ssor
s, f
orce
ps,
scal
pels
, cu
rett
es
X20
CrM
ol3
(cas
t)
0.18
-0.1
5 ::;
1.0
::;1.
0 ::;
0.04
5 ::;
0.03
12
-14
0.9-
1.3
::;1.
0 C
uret
tes,
Sha
rp s
poon
s X
35C
rMo1
7 (c
ast)
0.
33-0
.43
::;1.
0 ::;
1.0
::;0.
045
::;0.
03
15.5
-17.
5 1-
1.3
::;1.
0 C
uret
tes,
Sha
rp s
poon
s

Tab
le l
a.4
Che
mic
al c
ompo
siti
on (
wt%
) of
aus
teni
tic
stai
nles
s st
eels
(R
ef.
5)
Allo
y C
S
i M
n
P
S C
r M
o
Ni
Oth
ers
X12
CrN
il77
::;
;0.1
5 ::;
;1.0
::;;Z.
O ::;
;0.0
45
::;;0
.03
16.0
-18.
0 6.
0-8.
0 X
SCrN
i181
0 ::;
;0.0
8 ::;
;1.0
::;;Z.
O ::;
;0.0
45
::;;0
.03
18.0
-20.
0 8.
0-10
.5
X2C
rNi1
911
::;;0
.03
::;;1
.0 ::;
;2.0
::;;0
.045
::;
;0.0
3 18
.0-2
0.0
8.0-
12.0
X
25C
rNi2
522
::;;0
.25
::;;1.
5 ::;
;2.0
::;;0
.045
::;
;0.0
3 24
.0-2
6.0
19.0
-22.
0 X
25C
rNi2
520
::;;0
.25
1.5-
3.0
::;;Z.
O ::;
;0.0
45
::;;0
.03
23.0
-26.
0 19
.0-2
0.0
X5C
rNiM
ol71
33
::;;0
.08
::;;1
.0 ::;;
Z.O
::;;0
.045
::;
;0.03
16
.0-1
8.0
2.0-
3.0
10.0
-14.
0 X
2CrN
iMol
7133
::;
;0.03
::;
;1.0
::;;Z.
O ::;
;0.0
45
::;;0
.03
16.0
-18.
0 2.
0-3.
0 10
.0-1
4.0
X5C
rNiM
o181
64
::;;0
.08
::;;1
.0 ::;;
Z.O
::;;0
.045
::;
;0.0
3 18
.0-2
0.0
3.0-
4.0
11.0
-15.
0 X
2CrN
iMo1
8164
::;
;0.0
3 ::;
;1.0
::;;Z.
O ::;
;0.0
45
::;;0
.03
18.0
-20.
0 3.
0-4.
0 11
.0-1
5.0
X6C
rNiT
i181
O
::;;0
.08
::;;1
.0 ::;
;2.0
::;;0
.045
::;
;0.03
17
.0-1
9.0
9.0-
12.0
T
i ~ x
wt%
C

Tab
le l
a.S
Che
mic
al c
ompo
siti
on o
f st
eels
for
im
plan
t su
rger
y (w
t%)
(Ref
. 6)
Allo
y C
Si
M
n
P
S N
C
r M
o
Ni
Nb
X2C
rNiM
oN18
133
::;0.
03
::;1.
0 ::;
2.0
::;0.
G25
::;
0.01
0.
14-0
.22
17-1
8.5
2.7-
3.2
13-1
4.5
X2C
rNiM
o181
53
::;0.
03
::;1.
0 ::;
2.0
::;0.
G25
::;
0.01
::;
0.01
17
-18.
5 2.
7-3.
2 13
.5-1
5.5
X2C
rNiM
oN18
154
::;0.
03
::;1.
0 g
.O
::;0.
015
::;0.
01
0.1-
0.2
17-1
8.5
2.7-
3.2
14---
16
X2C
rNiM
nMoN
2213
6 ::;
0.03
::;
0.75
5.
5-7.
5 ::;
0.02
5 ::;
0.01
0.
35-0
.5
21-2
3 2.
7-3.
7 10
-16
0.1-
0.25
The
min
imum
con
tent
of
Cr
and
Mo
amou
nts
to :;
:: 26
acc
ordi
ng t
o th
e su
m o
f ef
fica
cy w
hich
is
give
n by
3.3
x %
Mo
+ %
Cr.

150 I ~I __________________ ST_A __ IN_L_E_S_S_S_T_E_E_LS __________________ ~
lA.2 PHYSICAL PROPERTIES
Table 1a.6 Physical properties of selected steels for medical instruments (Ref. 2)
Thermal Expansion Specific Specific Coefficient Thermal Heat Electrical between 70 Conductivity Capacity Resistivity Young's
Magnetic and 300"C at 20°C at 20°C at 20°C modulus Density Alloy Properties (xl(t6Ki) (WlmK) (JlkgK) (Jlilm) (GPa) (glcm3)
XlOCr13 9.9 24.9 0.57 200 7.8 XlSCr13 Magnet- 11.5 0.60 X20Cr13 izable 11.S 30 460 0.60 200 7.8 X40Cr13 11.5 0.60 X4SCrMoVlS 11.0 0.6S
Table 1a.7 Physical properties of austenitic stainless steels for medical instruments (Ref. 7)
Thermal Expansion Specific Specific Coefficient Thermal Heat Electrical between 70 Conductivity Capacity Resistivity Young's
Magnetic and 300°C at 20"C at 20°C at 20°C modulus Density Alloy Properties (xl (t6 Ki ) (WlmK) (JlkgK) (ilmm 21m) (GPa) (glcm3)
XI2CrNil77 17. 16.2 SOO 0.72 193 8.0
XSCrNi1810 17.8 16.2 SOO 0.72193 8.0 X2CrNi181O Para-
mag-X2SCrNi2S20 netic IS.1 17.S SOO 0.77 200 7.8
XSCrNiMoI7133 X2CrNiMol7133 IS.9 16.2 SOO 0.74 193 8.0 X2CrNiMoNI7133
X2CrNiMoI8164 lS.9 16.2 SOO 0.74 193 8.0 XSCrNiMo18164
X6CrNiTi181O 16.6 16.1 SOO 0.72 193 8.0
Table 1a.8 Physical properties of various stainless steels (Ref. 2)
Magnetic Alloy Properties
X12CrMoS17 FerroX20CrNil72 magnetic
Thermal Expansion Specific Coefficient Thermal Heat between 70 Conductivity Capacity and 300°C at 20°C at 20°C (xl (t6K-i) (WlmK) (JlkgK)
11.0 26.1 460 12.1 20.2 460
Specific Electrical Resistivity Young's
at 20°C modulus Density (ilmm 21m) (GPa) (glcm3)
0.60 0.72
200 200
7.8 7.8
L-___________ PR_O __ C_E_SS_I_N_G_O __ F_S_TA __ IN_L_E_S_S_S_T_E_E_L_S __________ ~I I 151
lA.3 PROCESSING OF STAINLESS STEELS (REF. 8, 9, 10, 11, 12)
la.3.1 Hot Working and Heat Treatment
Stainless steels are more difficult to forge than carbon or low-alloy steels because of their higher yield stress strength at elevated temperatures and the limitation of the maximum temperature at which they can be forged without microstructural damage due to the precipitation of 8-ferrite. Most austenitic stainless steels can be forged above 930°C. Above 1100°C some steels precipitate the 8-ferrite phase which decreases the forge ability. Typical forging temperatures are between 925 and 1100°C. If the precipitation of 8-ferrite does not appear, the deformation temperature can be increased to 1260°C. Nitrogen-alloyed austenitic stainless steels have a higher strength and a higher corrosion resistance than austenitic stainless steels due to the stabilization of the austenite by nitrogen. For this reason higher chromium and molybdenum contents can be used to improve the corrosion resistance.
In the forging of martensitic stainless steels, especially those with high carbon contents, precautions must be taken to avoid cracking during cooling caused by the martensitic transformation. These steels are cooled more slowly than austenitic steels to a temperature of about 590°C. Forging is recommended in the temperature range of 900-1200°C.
la.3.2 Working of Sheet
Alloys with low carbon contents (ferritic or austenitic stainless steels) are suitable for cold deformation such as bending, folding or deep-drawing. In general, austenitic stainless steels show better cold work properties than ferritic stainless steels.
In the deformation of ferritic stainless steels a temperature of 100-300°C should be used to achieve a better workability. If higher deformation rates are required, an intermediate annealing at 750-800°C should be performed.
Deformation of austenitic stainless steels results in a much higher work hardening than in ferritic stainless steels. Therefore, higher deformation forces, harder and more wear-resistant tools are required.
In drawing, excessively high speeds must be avoided. Best results are obtained with a speed of 6-8 mlmin.
In deep drawing a high holding-down force prevents the formation of folds, but results in a higher danger of cracks due to the higher stresses. Deformation should be carried out in one step because of the high rate of work hardening. Oil with graphite or MoS2 is used as a lubricant. Before the subsequent heat treatment the lubricant must be removed carefully in order to avoid a reaction with the steel.

152 I 1L-_________________ ST_A_nNL ___ E_S_S_S_TE __ E_LS ________________ ~
la.3.3 Descaling
Descaling of hot worked stainless steels can be accomplished by mechanical or by chemical cleaning, or by a combination of both methods. The surface can be cleaned by sand blasting, but unless it is machined after blasting, only nonmetallic blast material should be used in order to avoid contamination and a reduction of the corrosion resistance. Following blast cleaning stainless steels are usually acid pickled and washed with water. Common etching acids are:
(a) 1.5-2.0% NaOH (b) 10% H2S04
(c) 10% HN03 / 2% HF
la.3.4 Machining of Stainless Steels
Stainless steels are generally more difficult to machine than low-carbon steels due to their high work hardenability. The non-free machining steels have a tendency to develop long, stringy chips, which reduce the life of the tool. The cutting speed is lower and a higher power is necessary than with low-carbon steels. Because of the low thermal conductivity good lubrication and cooling are important requirements.
The machinability of martensitic stainless steels decreases with in creasing carbon content because of the higher amount of chromium carbides. Austenitic stainless steels have a high work-hardenability which causes a cold deformation of the surface during machining, which decreases the machinability.
By additions of manganese and copper the work hardenability is reduced and machinability improved. Strength and hardness are increased by carbon and nitrogen, which however causes a poorer machinability. Machining parameters of stainless steels are given in Table 1a.9.
The turning of stainless steels requires tools with top rake angles on the high side of the 5-10° range in order to control the formation of chips. Carbide-tipped tools can be used and allow higher speeds than high-speed tools. An interruption of the cuts should be avoided. Blade-type and circular cutoff tools can also be employed.
The drilling of stainless steels should be carried out with a sharp threecornered punch in order to avoid work hardening.
Thread rolling is possible with automatic screw machines of sufficient power and rigidity.
Milling can be accomplished with high-speed cutters and tools with carbide inserts, particularly in the case of alloys which are difficult to machine. The best surface quality is obtained by using helical or spiral cutters at high speeds.
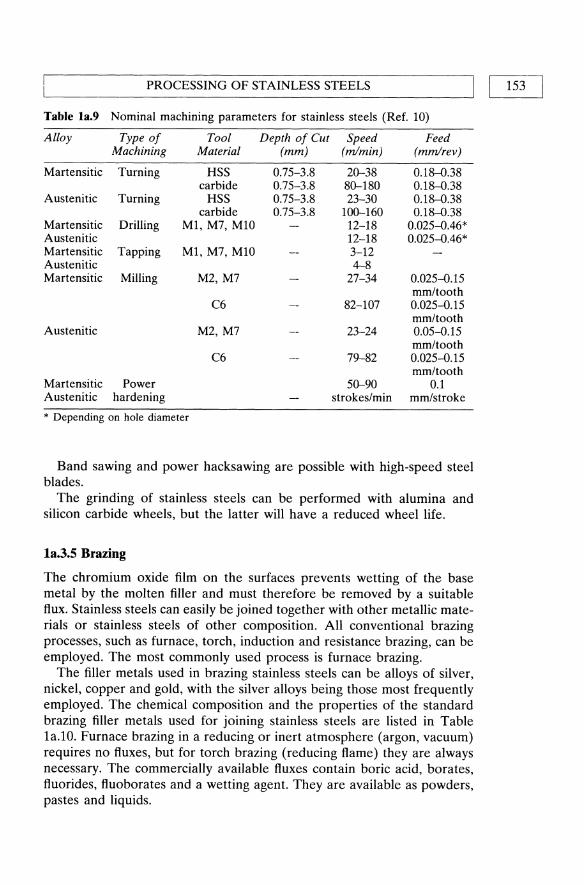
PROCESSING OF STAINLESS STEELS
Table la.9 Nominal machining parameters for stainless steels (Ref. 10)
Alloy Type of Tool Depth of Cut Speed Feed Machining Material (mm) (m/min) (mm/rev)
Martensitic Turning HSS 0.75-3.8 20-38 0.18--0.38 carbide 0.75-3.8 80-180 0.18--0.38
Austenitic Turning HSS 0.75-3.8 23-30 0.18--0.38 carbide 0.75-3.8 100-160 0.18--0.38
Martensitic Drilling M1, M7, M10 12-18 0.025--0.46* Austenitic 12-18 0.025--0.46* Martensitic Tapping M1, M7, MlO 3-12 Austenitic 4--8 Martensitic Milling M2, M7 27-34 0.025--0.15
mm/tooth C6 82-107 0.025--0.15
mm/tooth Austenitic M2, M7 23-24 0.05--0.15
mm/tooth C6 79-82 0.025--0.15
mm/tooth Martensitic Power 50-90 0.1 Austenitic hardening strokes/min mm/stroke
* Depending on hole diameter
Band sawing and power hacksawing are possible with high-speed steel blades.
The grinding of stainless steels can be performed with alumina and silicon carbide wheels, but the latter will have a reduced wheel life.
la.3.S Brazing
The chromium oxide film on the surfaces prevents wetting of the base metal by the molten filler and must therefore be removed by a suitable flux. Stainless steels can easily be joined together with other metallic materials or stainless steels of other composition. All conventional brazing processes, such as furnace, torch, induction and resistance brazing, can be employed. The most commonly used process is furnace brazing.
The filler metals used in brazing stainless steels can be alloys of silver, nickel, copper and gold, with the silver alloys being those most frequently employed. The chemical composition and the properties of the standard brazing filler metals used for joining stainless steels are listed in Table la.lO. Furnace brazing in a reducing or inert atmosphere (argon, vacuum) requires no fluxes, but for torch brazing (reducing flame) they are always necessary. The commercially available fluxes contain boric acid, borates, fluorides, fluoborates and a wetting agent. They are available as powders, pastes and liquids.
I 153l

Tab
le 1
a.10
C
hem
ical
com
posi
tion
and
bra
zing
tem
pera
ture
ran
ge o
f fi
ller
met
als
for
braz
ing
stai
nles
s st
eels
(R
ef.
13,
14)
Che
mic
al C
ompo
siti
on (
wt%
) B
razi
ng
Tem
pera
ture
F
iller
Met
al
Ag
C
u Z
n
Cd
Ni
Sn
Li
Mn
In
Ran
ge (
0C)
AgC
u 53
-93
bala
nce
:S;0.
5 76
5-98
0 A
g55S
n 54
-57
20-2
3 ba
lanc
e 2-
5 65
0 A
g56I
nNi
55-5
7 ba
lanc
e 3.
5-4.
5 13
-15
730
AgC
uZn
20-7
0 20
-40
14-4
0 :S
;3.5
:S;5.
5 65
0-87
0 A
gCuZ
nCD
30
-50
14-3
5 13
-25
12-2
5 62
0-84
0 A
gCuZ
nMn
20-5
0 15
-40
21-3
7 :s;
2.5
1.5-
8 70
0-87
0

L-___________ PR_O __ C_E_SS_I_N_G_O_F __ ST_A __ IN_L_E_S_S_S_T_E_E_L_S __________ ~I I 155
la.3.6 Wehling
Stainless steels can be welded by fusion (e.g. arc welding) or pressure welding (e.g. resistance welding) techniques. Steels which do not contain more than 0.03% sulphur, phosphorous or and selenium can be fusion welded by most welding techniques, such as shielded metal arc welding, submerged arc welding, inert gas metal welding, gas tungsten inert gas welding, plasma arc welding and flux cored arc welding.
Because of their low thermal conductivity and higher electrical resistance stainless steels require 20-30% less heat input than carbon steels during resistance welding. The resulting slow cooling rate may lead to a lower corrosion resistance because of the precipitation of chromium carbides.
Free-machining stainless steels are unweldable because of their high sulphur content.
To avoid contamination, especially by carbon, the stainless steel parts should be cleaned to remove organic substances.
Extra low carbon stainless steels, such as X2CrNiMo17133 do not tend to precipitate carbide and can therefore be welded without the danger of a diminished corrosion resistance.
Table la.ll lists electrodes and welding rods suitable as filler metals for the arc welding of stainless steels.
Table la.11 Filler metals for arc welding of stainless steels (Ref. 11, IS)
Steel
XI2CrNil77 XSCrNi1810 X2CrNiI911 X2SCrNi2S20 XSCrNiMoI7133* X2CrNiMo17133* XSCrNiMoI8164* X2CrNiMoI8164* X6CrNiTi181O
X20Cr13**
X20CrNiI81O***
Condition of Weld for Service
As welded or annealed As welded or stress relieved As welded As welded or annealed As welded or stress relieved As welded or annealed As welded or stress relieved As welded or stabilized and stress relieved Annealed or hardened and stress relieved As welded
Electrode or Welding Rod
X8CrNi2011 X8CrNi1811 X2SCrNi2S20 XSCrNiMo 17133 X2CrNiMol7133 XSCrNiMoI8164 X2CrNiMoI8164
X8CrNi1811
X20Cr13 X2SCrNi2S20 X8CrNi2011
* Welds may have poor corrosion resistance in as welded condition. Restoration by subsequent heat treatment possible: X5CrNiMol7133, X5CrNiMo18164: full annealing at 106S-1120°C; X2CrNiMol7133. X2CrNiMo18164: stress relieving at 870°C. ** Careful preheating and postweld heat treatment are required to avoid cracking. *** Careful preheating required.

156 I LI __________________ ST_A __ IN_L_E_S_S_S_T_E_E_LS __________________ ~
Preheating of austenitic stainless steels usually has no beneficial effect on the welding results.
Thermal stress relief can be carried out in wide temperature and time ranges, depending on the amount of relaxation required. Table 1a.12 gives two examples of the temperature and time required to achieve different stress relief.
In general, ferritic stainless steeels are less weldable than austenitic steels because of a grain coarsening during the welding operation and the risk of the formation of both austenite and martensite during cooling. This may reduce the toughness and ductility of the steel. Martensite can be eliminated by annealing, but this is not the case with coarsened ferrite.
Martensitic stainless steels are very difficult to weld because, during the welding operation, they become harder and less ductile, whereby cracking may occur. Whether preheating and postweld annealing are necessary in the case of the martensitic stainless steels depends on the carbon content. Table 1a.13 shows the recommended preheating temperatures, depending on the carbon content for martensitic stainless steels.
As compared to carbon steels, a resistance welding of austenitic stainless steels is possible with shorter welding times and lower welding currents than in the case of carbon steels because of their higher electrical resistivity. By comparison, the welding pressure must be higher for stainless steels.
Martensitic and ferritic stainless steels can also be resistance welded, but the welded seam shows a brittle behaviour in the as-welded condition. Therefore a postweld thermal treatment is required.
Table la.U Examples of the temperature and time required to achieve various degrees of stress relief in austenitic steels (Ref. 11)
Temperature (0C)
840-900 540-650
Time (min/cm section thickness)
25 95
Stress Relief (%)
85 35
Table la.13 Dependence of the preheating temperature on the carbon content for martensitic stainless steels (Ref. 11)
Carbon Content (wt%)
0<0.1 * 0.1-0.2 0.2-0.5
Preheating Treatment
No preheating or postweld treatment Preheating to 260°C, welding at 260°C, slow cooling Preheating to 260°C, welding at 260°C, annealing
* Not a standard carbon content.

'--_____ P_R_O_C_E_SS_I_N_G_O_F_ST_A_IN_L_E_S_S_S_T_E_E_L_S _____ -------'I I 157
1a.3.7 Heat Treatment
Table 1a.14 summarizes the various recommended heat treatments for martensitic, precipitation hardened, austenitic and ferritic austenitic steels.
Table 1a.14 Recommended heat treatments for various stainless steels (Ref. 1, 2, 8, 16)
Hot Soft Deformation Annealing Hardening Hardening Annealing
Alloy (0C) (0C) (0C) Medium (0C)
X20C13 750-1150 750-780 950-1000 Oil 650-700 X12CrMoS17 750-1100 800-850 1020-1050 Oil 550-600 X5CrNiMol7133 800-1150 1050-1100 Water, air X2CrNiMo17133 800-1150 1000-1100 Water, air X5CrNi1810 800-1150 1000-1050 Water, air X2CrNi181O 800-1150 1000-1050 Water, air X6CrNiTi1810 800-1150 1020-1070 Water, air
1A.4 MECHANICAL PROPERTIES
Table 1a.15 Mechanical properties of steels for medical instruments (Ref. 2, 3)
Young's Tensile Yeild Ultimate Ratio Elongation Reduction
Modulus Strength Tensile Yield at of *1()1 * (0.2 %) Strength ITensile Fracture* Area
Steel Condition (MPa) (MPa) (MPa) Strength (%) (%)
Martensitic steels X15Cr13 As forged 216 :'>720 X20Cr13 + Annealed 216 :'>740 X45CrMoV15 220 :'>900 X20CrMo13 As cast :'>800 X35CrMo17 + Annealed :'>950
Martensitic and austenitic free cutting steels X12CrMoS17 As forged 216 540-740 16
+ Annealed X12CrNiS188 As forged 200 195 500-700 35
+ Quenched Austenitic steels
X5CrNi181O As forged* 200 220-235 550-750 0.3--0.4 43-45 + Quenched
X5CrNiMo17122 As forged* 200 240-255 550-700 0.36--0.44 43-45 + Quenched
X12CrNi177 Wire, cold 185- 1250- >40 deformed 195 2450**
* Longitudinalltransversal. ** Depends on the degree of cold deformation.

158 I I STAINLESS STEELS
Table la.16 Mechanical properties of austenitic stainless steels (minimum values at room temperature) (Ref. 5, 9, 17)
Tensile Ultimate Ratio Elonga- Reduc-Yield Tensile Yield! tion at tion of
Alloy Strength Strength Tensile Fracture Area (bar) Condition (MPa) (MPa) Strength (%) (%)
X12CrNi177 Annealed 205 515 0.40 40 Full hard 965 1280 0.75 9
XSCrNi1810 Hot finished 205 515 0.40 40 50 + annealed
Cold finished 310 620 0.50 30 40
X2CrNiI911 Hot finished 170 480 0.35 40 50 + annealed
Cold finished 310 620* 0.50 30 40 + annealed
X25CrNi2520 Hot finished 205 215 0.95 40 50 + annealed
Cold finished 310 620 0.50 30 40 + annealed
X5CrNiMol7133 Hot finished 205 515 0.40 40 50 + annealed
Cold finished 310 620 0.50 30 40 + annealed
X2CrNiMol7133 Hot finished 170 515 0.33 40 50 + annealed
Cold finished 310 620 0.50 30 40 + annealed
X5CrNiMol713 Hot finished 205 515 0.40 40 50 + annealed
Cold finished 310 620 0.50 30 40 + annealed
X2CrNiMoI8164 Annealed 240 585 0.41 55 65
* Typical values.

MECHANICAL PROPERTIES I Table 1a.17 Mechanical properties of martensitic stainless steels (minimum values at room temperature) (Ref. 2, 5)
Tensile Ultimate Ratio Elonga- Reduc-Yield Tensile Yield! tion at tion of
Alloy Strength Strength Tensile Fracture Area (bar) Condition (MPa) (MPa) Strength (%) (%)
XlOCr13 Hot finished 275 485 20 45 + annealed 0.57
Cold finished 275 485 16 45 + annealed
X20Cr13 Hardened + 1480 1720 0.86 8 25 tempered 204°C
X20CrNi172 Hardened + 1070 1370 0.78 16 55 tempered 260°C
Hardened + 795 965 0.82 19 57 tempered 593°C
X65CrMo17 Hardened 415 725 0.57 20 + annealed
Hardened + 1650 1790 0.92 5 20 tempered 316°C
Table 1a.18 Mechanical properties of steels for implant surgery (Ref. 6)
Alloy
X2CrNiMoN18133 X2CrNiMo18153 X2CrNiMoN18154 X2CrNiMnMoN22136
* Minimum values. Special requirements:
Condition
Solution Treated
Tensile Yield Strength * (0.2%) (MPa)
300 190 285 500
Ultimate Ratio Yield! Tensile Tensile Strength Strength (MPa)
6~00 0.38-0.5 490-690 0.28-0.39 590-800 0.36-0.48 850-1050 0.48-0.59
1. Allowed melting procedures: vacuum arc furnace or e1ectroslag remelting. 2. After the solution heat treatment the material has to be free of delta-ferrite. 3. Grain size of at least ASTM4. 4. Resistance to intercrystalline corrosion determined according to Table la.5.
Elongation at
Fracture* (%)
40 40 40 35
5. Microscopic purity concerning inclusions of oxides and sulfides determined according to Table la.5.
I 159

160 I I~ _________________ S_T_A_I_N_L_E_S_S_S_T_E_E_L_S ________________ ~ Table la.19 Mechanical properties of wire for implant surgery (Ref. 6)
Ultimate Tensile Elongation at Alloy Condition Strength (MPa) Fracture* (%)
X2CrNiMoNI8133 Solution 800-1000 30 X2CrNiMoN18154 treated 800-1000 40
X2CrNiMoNI8133 Cold 1350-1850 X2CrNiMoN18154 worked 1350-1850
*Minimum values. The values depend on the diameter of the wire (solution heat treated) and on the degree of deformation (decrease of diameter and increase of degree of deformation = increase of value).
Table la.20 Mechanical properties of X2CrNiMol7133 stainless steel as a function of cold working (Ref. 18)
Degree of Cold Working (%)
o 31 50 63 70 76
Tensile Yield Strength (MPa)
255 831
1036 1169 1204 1252
Ultimate Tensile Strength (MPa)
584 912
1138 1255 1344 1421
Table la.21 Influence of heat treatment on the mechanical properties of steels for medical instruments (Ref. 2)
Tensile Ultimate Ratio Elonga- Reduc-Yield Tensile Yield! tion at tion of
Strength * Strength Tensile Fracture* Area Condition (0.2%) (MPa) (MPa) Strength (%) (%)
Martensitic steels XI5Cr13 Quenched 450 650-800 0.56-0.69 10-15 25-30 X20Cr13 + tempered 550 750-950 0.58-D.73 8-14 20-30
Martensitic and austenitic free cutting steels X12CrMo5 Quenched 450 640-840 0.54-D.70 11
+ tempered
* Minimum values. The values of the elongation at fracture and of the impact strength depend on the direction of sampling (longitudinal = higher values; transversal = lower values) and on the thickness of the sheet or rod (increase of thickness = decrease of value).

'------________ F_A_T_IG_U_E ________ -----'I I 161
Table la.22 Influence of a cold deformation on the mechanical properties of steels for implant surgery (standard qualities, other qualities - for all steels - as agreed upon) (Ref. 6)
Tensile Yield Ultimate Ratio Yield! Elongation Strength * Tensile Tensile at
(0.2%) Strength Strength Fracture* Alloy Condition (MPa) (MPa) (%)
X2CrNiMoN22136 As cold worked, 690 860-1100 0.63--0.8 12 X2CrNiMo18154 dia.:519 mm 650 860-1100 0.63--0.8 12
* Minimum values.
Table la.23 Influence of heat treatment on the hardness of various stainless steels (Ref. 1)
Alloy
X20Cr13
X12CrMoS17
X5CrNiMoI7133 X2CrNiMol7133
XSCrNi1810 X2CrNI1810
X6CrNiTi181O
IA.S FATIGUE
Heat Treatment VHN
Hardened and annealed I 190-235 Hardened and annealed II 230-275
Soft annealed (800-850°C) ]60-210 Soft annealed + drawn 160-210 Hardened + annealed 190-235 (1020-1050°C/oiI/550-600 OClair)
1050-1100°C/water quenched 130-180
1000-1050°C/water quenched 130-180
1020-1070°C/water quenched 130-190
Table la.24 Fatigue limit (2xl06 cycles) by the staircase method* of X2CrNiMoI7133 stainless steel (Ref. 18)
Tensile Strength Degree of Cold Stress Ratio, R Fatigue Limit (MPa) Work (%) (MPa)
658 7 0 283 1211 57 0 362 1211 57 -1 505
*Explanation: (1) Starting with a stress So. (2) if specimen fails before 2xlO+6 cycles --t new specimen with a stress S -~So
if specimen does not fail before 2xlO+6 cycles --t new specimen with a stress So+~S. (3) Do (2) for 15-20 samples and evaluate with standard statistical methods.

162 II L __________________ ST_A __ IN_L_E_S_S_S_T_E_E_LS __________________ ~
Table la.25 High cycle fatigue strength of hip endoprostheses of stainless steel, measured in 0.9% NaCI solution at 37°C. Testing conditions according to DIN 58840 (simulation of a loosened shaft) (Ref. 19)
Alloy Maximum load in 2x10⁷ cycles (kN)
0.9% NaCl (/ = 2 Hz)
hot wrought X2CrNiM017133 hot wrought X3CrNiMoNbN2317
2 5.5-7.5
Table la.26 High cycle fatigue strength (TD of various stainless steels (Wohler curves) and rotating; fatigue strength (TR(Ref. 20, 21, 22)
Alloy uD (MPa) (TR (MPa) R
X2CrNiMoI7133 250-320 250 X2CrNiMo18153 Annealed 250-320 -1
Cold worked 350-415 X2CrNiMnMoN22136 Hot forged 500-650
Table la.27 Fatigue properties of various stainless steels (Ref. 23)
Fatigue limit Heat Testing condition at NB=107
Alloy treatment Type R ak Medium (MPa)
X20Cr13 30 minll020°C/oil RB* -1 1 Air 481 + 2 h/550°C/air 1 30% NaCI 69
3.6 Air 206
3.6 30% NaCI 49 X20Cr13 30 minl1020°C/oil RB -1 1 Air 412
+ 2 h/625°C/air 1 30% NaCI 78 3.6 Air
177 3.6 30% NaCI
29 X5CrNi181O 30 minl1050°C/ RB -1 1 Air 220-250
water X5CrNiM017133 15 minl1050°CI RB -1 1 Air 265
water 30% NaCI 216
* RB = rotating bending.

L-_______________ C_O_R_R_O_S_IO __ N_A_N_D __ W_E_A_R ________________ ~I I 163
lA.6 CORROSION AND WEAR
Table 1a.28 Sum of efficacy and breakdown potential of various stainless steels in 1 M NaC! at room temperature (Ref. 21)
Alloy Sum of Efficacy Breakdown Potential (V)
X5CrNi1810 X5CrNiMol7133 X2CrNiMol7132 X2CrNiMoN18164 X2CrNiMoV1813
19 25 26.5 29.5 25
0.25 0.25 0.5 0.7 0.65
Table 1a.29 Rate of formation of corrosion products for the stainless steel X2CrNiMol7133 in Hank's solution during current-time-tests (Ref. 24)
Alloy Metal Converted into Compound (nglcm2h)
X2CrNiMo17133 Mechanically polished Chemically polished
7.8 230
Table 1a.30 Corrosion properties of the stainless steel X2CrNiMo17133 in 0.9% NaC!. Potential referred to standard calomel electrode (SCE) (Ref. 18)
Testing Method
ASTM F746-81 test (mV) Scratch test (mV) Potentiodynamic test
Current 10 .... Ncm2 (mV) Repassivation (mV)
Critical pitting temperature test Potentiostatic 200 m V eC) Potentiostatic 350 m V (0C)
Critical crevice temperature test Potentiostatic 200 m V eC) Potentiostatic 350 m V (0C)
Result
300 ±25 530 ±20
560 ±25 90 ±25
95 ±5 65 ±5
25 ±5 <25
Table 1a.31 Polarization current (i) and polarization resistance (Rc) of the stainless steel X2CrNiMol7133 in 0.9% NaC! and in 0.9% NaC! with a stable redox system [Fe(CN)64. / Fe(CN)63.j at 37°C corresponding to a potential of the body fluid of 400 m V (Ref. 25, 26)
Alloy 0.9% NaCl 0.9% NaCl + redox
X2CrNiMoI7133 0.006 1670 4.38

164 I ~I __________________ ST_A __ IN_L_E_S_S_S_T_E_E_L_S ________________ ~ Table la.32 Repassivation time of the stainless steel X2CrNiMo17133 in 0.9% NaCI and breakdown potential in Hank's solution (Ref. 21)
Alloy
X2CrNiMo17133
Breakdown Potential (mV) vs. Standard Calomel Electrode
200-300
Repassivation Time (ms)
-500 mV +500 mV
72000 35
Table la.33 Electrochemical data for the stainless steel X5CrNi181O in 0.1 M NaCl; influence of the pH-value (Ref. 27)
Alloy
X5CrNi181O pH 7 pH 2
Corrosion Potential Ecorr (mV)
-395 -661
Passive Current Density Ip (J.LAIcm2)
0.56
Breakdown Potential Eb (mV)
770 -270
Table la.34 Coefficients of friction of sliding materials (Ref. 20, 24)
Material
X2CrNiMo17133 vs. High density polyethelyne
Cartilage vs. cartilage
Lubricant
Synovial fluid: in vitro in vivo
In VIVO
Coefficient of friction
0.10 0.02
0.008
Table la.35 Influence of the N+ -implantation* on weight loss during wear testing** of the stainless steel X5CrNi181O (Ref.29)
Weight loss (flog) after Alloy 1000 cycles 3000 cycles 5000 cycles
X5CrNi181O 200 780 1000 W-implanted X5CrNi1810 320 460 440
* Implantation parameters: 100 keY nitrogen ions
3 x 10¹⁷ N~ nominal dose cm
** Testing conditions: dry; load: 5 N; speed 150 cycles/min; wear against high speed steel (66 HRC); wear distance: 23 mm/cycle.

~ ___________________ RE __ FE_R __ E_N_C_E_S __________________ ~I I 165
lA.7 BIOLOGICAL PROPERTIES
Table la.36 Influence of heat treatment (oxidation) on shear strength between X2CrNiMol7133 screw implants and bone (rat femur after various times of insertion (Ref. 28)
Time after insertion (days)
Shear strength (MPa) Control Heat treated*
4 5 6 10 35
0.01 ± 0.001 0.04 ± 0.01 0.28 ± 0.06 0.58 ± 0.09 1.58 ± 0.18
* Heat treatment: 200 minl280°C/air.
REFERENCES
1. Product information, Rochling Werke, Germany. 2. DIN 17440 (1985), Beuth. 3. DIN 17441 (1985), Beuth. 4. DIN 17442 (1977), Beuth.
0.03 ± 0.01 0.21 ± 0.07 0.68 ± 0.07 1.23 ± 0.19 2.61 ± 0.21
5. ASM Metals Handbook, Vol. 3: Properties and Selection: Stainless Steels, Tool Materials and Special-Purpose Metals.
6. DIN 17443 (1986), Beuth. 7. ASM Metals Handbook, Vol. 3: Properties and Selection: Stainless Steels, Tool
Materials and Special-Purpose Materials. 8. Heimann, W. Oppenheim, R. and Weizling, W. (1985) Nichtrostende Stahle,
in Werkstoffkunde Stahl, Bd. 2: Anwendungen, Springer-Verlag. 9. Harris, T. and Priebe E. Forging of Stainless Steels, in ASM Metals Handbook,
Vol. 14: Forming and Forging. 10. Kosa, T. and Ney, R.P. Machining of Stainless Steels, in ASM Metals
Handbook, Vol. 16: Machining. 11. Arc Welding of Stainless Steels, in ASM Metals Handbook, Vol. 6: Welding
Brazing, Soldering. 12. Resistance Welding of Stainless Steels, in ASM Metals Handbook, Vol. 6:
Welding Brazing, Soldering. 13. Brazing of Stainless Steels, in ASM Metals Handbook, Vol. 6: Welding Brazing,
Soldering. 14. DIN 8513 (1979), Beuth. 15. DIN 8856 (1986), Beuth. 16. Bergman, W. (1991) Werkstofftechnik, Teil 2: Anwendungen, Hanser Verlag,
Miinchen. 17. American Standard ASTM F138. 18. Cigada, A, De Soutis, G., Gratti, AM., Roos, A and Zaffe, D. (1993): In
vivo Behaviour of a High Performance Duplex Stainless Steel, J. of Appl. Biomaterials, 4, 39-46.

STAINLESS STEELS 166 I I L-__________________________________________________________ ~
19. Kunze, E. (1988) Vergleichende Untersuchungen zum Langzeit-Ermtidungsverhalten von Htiftgelenkprothesen an Luft und in NaCI-U:isung. Metal!, 2, 140-145.
20. Thull, R. (1979) Eigenschaften von Metallen, fUr orthopadische Implantate und deren Prtifung. Orthopiidie, 7, 29.
21. Breme, J. and Schmi~t, H.-J. (1990) Criteria for the Bioinertness of Metals for Osseo-Integrated Implants, in Osseo-Integrated Implants, Vol. 1, (ed. G. Heimke), pp. 31-80.
22. Webster, J.G. (ed) (1988) Encyclopedia of Medical Devices and Instrumentation, Vol. 1, Wiley-Interscience Publication.
23. Schmidt, W. (1981) Werkstoffverhalten bei schwingender Beanspruchung. Thyssen Edelst. Techn. Ber., 7 (1), 55-71.
24. Mears, D.C. (1977) Metals in Medicine and Surger. International Metals Review, Review 218, June, 119-155.
25. Breme, J. (1988) Titanium and Titanium Alloys, Biomaterials of Preference, in Proc. of the 6th World Conf on Ti, Vol. 1, pp. 57-68.
26. Zitter, H. and Plenk, H. (1987) The Electrochemical Behaviour of Metallic Implant Materials as an Indicator of their Biocompatibility. J. of Biomedical Materials Research, 21, 881.
27. Geis-Gerstorfer, J., Weber, H. and Breme, J. (1988) Electroche mische Untersuchung auf die Korrosionsbestandigkeit von Implantatlegierungen. Z. f Zahniirztl. Implantologie 4, (1), 31-36.
28. Hazan, R., Brener, R. and Oron, V. (1993) Bone growth to metal implants is regulated by their surface properties. Biomaterials 14 (8), 570-574.
29. Cavalieri, A. Gzuman L., Ossi, P.M. and Rossi, 1. (1986) On the Wear Behaviour of Nitrogen Implanted 304 Stainless Steel, Scripta Metallurgica 20, 37-42.
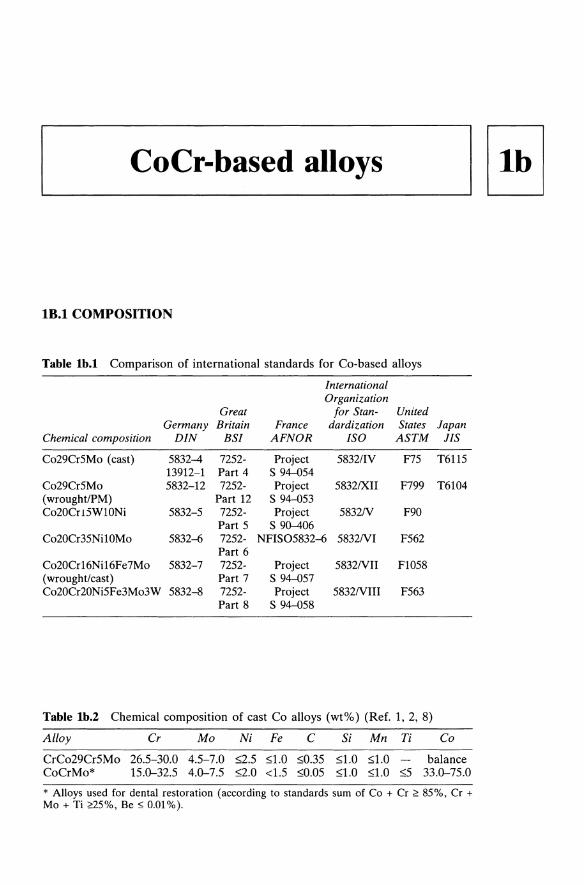
~ __ C_O_C_I_-b_a_s_e_d_a_II_O_YS __ ----,lllb I
lB.l COMPOSITION
Table lb.l Comparison of international standards for Co-based alloys
International Organization
Great for Stan- United Germany Britain France dardization States Japan
Chemical composition DIN BSI AFNOR ISO ASTM JIS
Co29Cr5Mo (cast) 5832-4 7252- Project 5832/1V F75 T6115 13912-1 Part 4 S 94--054
Co29Cr5Mo 5832-12 7252- Project 5832IXII F799 T6104 (wroughtIPM) Part 12 S 94--053 Co20Cr 15W10Ni 5832-5 7252- Project 5832N F90
Part 5 S 90-406 Co20Cr35NilOMo 5832--6 7252- NFlS05832--6 5832NI F562
Part 6 Co20Cr16Nil6Fe7Mo 5832-7 7252- Project 5832NII F1058 (wroughUcast) Part 7 S 94--057 Co20Cr20Ni5Fe3Mo3W 5832--8 7252- Project 5832NIII F563
Part 8 S 94--058
Table lb.2 Chemical composition of cast Co alloys (wt'Yo) (Ref. 1,2,8)
Alloy Cr Mo Ni Fe C Si Mn Ti Co
CrCo29Cr5Mo 26.5-30.0 4.5-7.0 g.5 S1.0 S0.35 S1.0 S1.0 balance CoCrMo* 15.0--32.5 4.0--7.5 g.O <1.5 SO.05 S1.0 S1.0 s5 33.0--75.0
* Alloys used for dental restoration (according to standards sum of Co + Cr ~ 85%, Cr + Mo + Ti ~5%, Be ~ 0.01%).

Tab
le I
b.3
Che
mic
al c
ompo
siti
on o
f w
roug
ht C
o al
loys
(w
t%)
(Ref
. 3,
4,
5, 6
, 7,
9)
All
oy
Cr
Mo
Ni
Fe
C
Si
Mn
P
S W
T
i C
o
Co2
0Cr1
5WlO
Ni
19.0
-9.
0-~.O
~0.1
5 ~1.0
~2.5
~0.0
4 ~0
.03
14.0
-B
alan
ce
21.0
11
.0
16.0
C
o20C
r35N
il0M
o*
19.0
-9.
0-33
.0-
~1.0
~0.1
5 ~0
.15
~0.1
5 ~0
.015
~0.01O
~1.0
B
alan
ce
21.0
10
.5
37.0
C
o20C
r16N
i16F
e7M
o 18
.5-
6.5-
14.0
ba
lanc
e ~0
.15
1.0-
2.5
~0.015
~0.0
15
39.0
-21
.5
8.0
18.0
42
.0
Co2
0Cr2
0Ni5
Fe3
Mo3
W
18.0
-3.
0-15
.0-
4.0-
~0.0
5 ~0
.05
~1.0
0 ~0.01O
3.0-
0.5
Bal
ance
22
.0
4.0
25.0
6.
0 4.
0 3.
5
* O
ther
ele
men
ts:
sing
le ~
O.l, s
um: ~O.4.
Be
~O.OO1.
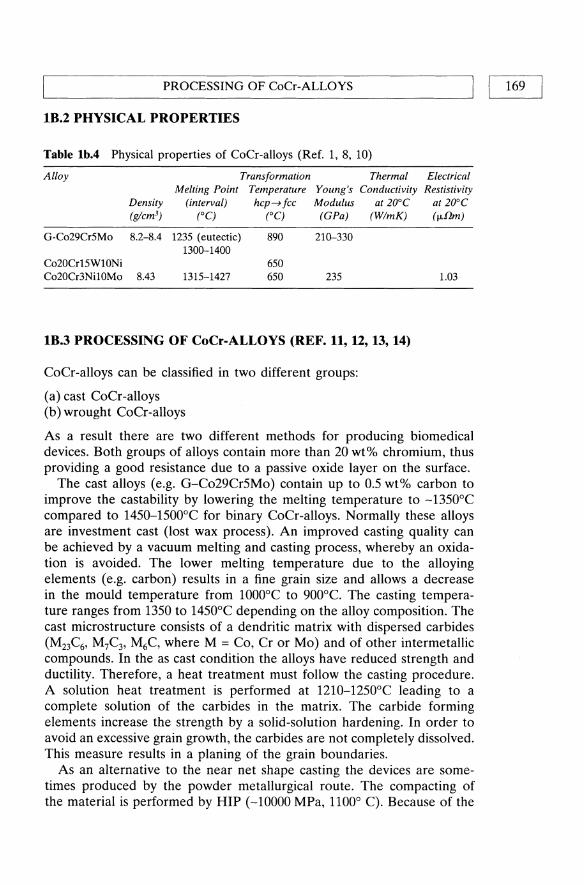
~ _____________ PR_O __ C_E_SS_I_N_G_O __ F_C_o_C_r-_A_L_L_O_Y_S ____________ ~I I 169
IB.2 PHYSICAL PROPERTIES
Table Ib.4 Physical properties of CoCr-alloys (Ref. 1, 8, 10)
Alloy Transformation Thermal Electrical Melting Point Temperature Young's Conductivity Restistivity
Density (interval) hcp~fcc Modulus at 20°C (glcm3) (0C) (0C) (GPa) (WlmK)
G-Co29Cr5Mo 8.2-8.4 1235 (eutectic) 890 210-330 1300-1400
Co20Cr15WlONi 650 Co20Cr3Ni10Mo 8.43 1315-1427 650 235
IB.3 PROCESSING OF CoCr-ALLOYS (REF. 11, 12, 13, 14)
CoCr-alloys can be classified in two different groups:
(a) cast CoCr-alloys (b) wrought CoCr-alloys
at 20°C (fJ.flm)
1.03
As a result there are two different methods for producing biomedical devices. Both groups of alloys contain more than 20 wt% chromium, thus providing a good resistance due to a passive oxide layer on the surface.
The cast alloys (e.g. G-C029CrSMo) contain up to 0.5 wt% carbon to improve the castability by lowering the melting temperature to -13S0°C compared to 14S0-1S00°C for binary CoCr-alloys. Normally these alloys are investment cast (lost wax process). An improved casting quality can be achieved by a vacuum melting and casting process, whereby an oxidation is avoided. The lower melting temperature due to the alloying elements (e.g. carbon) results in a fine grain size and allows a decrease in the mould temperature from 1000°C to 900°C. The casting temperature ranges from 1350 to 14S0°C depending on the alloy composition. The cast microstructure consists of a dendritic matrix with dispersed carbides (M23C6, M7C3, M6C, where M = Co, Cr or Mo) and of other intermetallic compounds. In the as cast condition the alloys have reduced strength and ductility. Therefore, a heat treatment must follow the casting procedure. A solution heat treatment is performed at 1210-12S0°C leading to a complete solution of the carbides in the matrix. The carbide forming elements increase the strength by a solid-solution hardening. In order to avoid an excessive grain growth, the carbides are not completely dissolved. This measure results in a planing of the grain boundaries.
As an alternative to the near net shape casting the devices are sometimes produced by the powder metallurgical route. The compacting of the material is performed by HIP (-10000 MPa, 1100° C). Because of the

170 I LI __________________ C_oC_r_-B __ A_S_E_D_A_L_L_O __ Y_S ________________ ~
relatively high costs this method is used only for highly loaded implants like femoral stems of total hip prostheses. Hipping of cast CoCr-alloys is recommended for a decrease of defects like gas or shrinkage pores, whereby an improvement of the mechanical properties is achieved.
Wrought CoCr-alloys have a lower Cr content (19-21 wt%) than cast alloys. Cr is substituted by Mo or W. In order to stabilize the fcc phase a certain content of Ni, Fe or Mn is necessary. Because of the high strength of the alloys at elevated temperatures higher forces must be applied for forging these alloys. For a plastic deformation the alloys must be annealed in order to produce the fcc structure which can be retained to room temperature. The hcp transformation, which causes an improvement of the mechanical properties, is induced by the mechanical deformation. After hot working the microstructure consists of a fcc matrix with fine hcp platelets. A hardening process may be achieved by cold working followed by aging between 500 and 600°C for 1-4 h, resulting in precipitation of C03Mo, which increases the hardness. Table 1b.1O shows the influence of hot working and heat treatment. Table 1b.ll summarizes the influence of cold working on the mechanical properties of the CoCr-alloys.
The alloy C020Cr35NilOMo is hot forged or rolled at temperatures between 870 and 1125°C. This multi phase alloy with a high strength and ductility is aged between 540 and 590°C after the hot working process. Table 1b.ll shows the influence of a deformation and of a heat treatment on the mechanical properties of the alloy.
Ih.3.1 Machining of CoCr-Alloys
Since CoCr-alloys have a low thermal conductivity, a high shear strength and a high work hardening rate and since they contain hard intemetallic compounds, they are expensive to machine because high cutting forces must be applied.
For turning CoCr alloys, tungsten carbide tools are usually applied. Ceramic coated carbide, boron nitride and high speed steels can also be used. Water soluble oils are applied as cutting fluids. Table 1b.5 gives the turning parameters for CoCr-alloys.
Drilling of CoCr-alloys is accomplished by similar methods. The speeds and feeds must be reduced because of the slower cooling rate and lubriant efficiency.
Milling of CoCr-alloys requires, like turning, higher forces and climb milling is preferred. Cuts deeper than 1.5 mm are not possible. Besides high-speed cutters carbide tools can also be used. Table 1b.7 gives the milling parameters for CoCr-alloys.
All types of sawing, such as band sawing, circular sawing and hacksawing, can be applied. A good supply of cutting fluid during the sawing operation is important.

PROCESSING OF CoCr-ALLOYS I I 171 ~------------------------------------------------------~
Table Ib.5 Turning parameters of cast and wrought CoCr-alloys (Ref. 11)
Alloy Condition Roughing Finishing Depth of Feed Speed Speed
(mlmin) (mlmin)
Cast CoCr As cast or as 3-15 3-18 cast and aged
Wrought CoCr Solution treated 5-17 6-27 or solution treated and aged
Cut Rate (mm) (mmlrev)
Rough: Rough: 2.5-5 0.13--0.18 Finish: 0.8 Finish: 0.13
Rough: 5 Rough: 0.25 Finish: 0.8 Finish: 0.13
Table Ib.6 Drilling parameters of cast and wrought CoCr-alloys (Ref. 11)
Alloy Condition Speed (mlmin) Feed Rate (mmlrev)
Cast CoCr As cast or as cast and annealed 2-4.5 6
4.5
0.025--0.15 0.05--0.1 0.05--0.1
Wrought CoCr Solution treated Solution treated and aged
Table Ib.7 Milling parameters of cast and wrought CoCr-alloys (Ref. 11)
Alloy Type of Milling
Cast CoCr Face with HSS tools
Wrought CoCr Face
Cast CoCr
Wrought CoCr
Cast CoCr
Wrought CoCr
Cast CoCr
Wrought CoCr
with HSS tools Face
with carbide tools Face
with carbide tools Finish with
HSS tools Finish with
HSS tools Finish with
Carbide tools Finish with
carbide tools
Depth of Cut Speed Feed Rate (mm) (mlmin) (mmlrev)
1 3.6-4.5 0.05 8 1.5-2.0 0.075 1 4.5-9.0 0.05 8 2.0--6.0 0.1 1 9-15 0.13 4 6-14 0.15 1 18-21 0.13 4 17-20 0.13--0.15
0.5 3.0-3.6 0.025--0.05
0.5 3.6-4.5 0.025--0.05
0.5 12-18 0.025--0.05
0.5 18-21 0.025--0.05

CoCr-BASED ALLOYS 172 I I L-____________________________________________________ ~
Grinding of CoCr-alloys requires good control of the parameters because of the sensitivity of the alloys to microcracks and because of alterations in the microstructure.
Brazing of CoCr-alloys can be performed either in a hydrogen atmosphere or in vacuum. As filler metals Ni- or Co-base alloys or Au-Pd-alloys can be used. In order to achieve a better wetting by the filler metals an electroplating or flashing with Ni is performed. Copper filler metals should be avoided because of the danger of an embrittlement of the seam. Table Ib.8 shows the compositions of a typical Co-base filler metal.
Table Ib.8 Chemical composition (wt%) of a Co-based filler metal (Ref. 12)
Cr Ni Si W Fe B C P S Al Ti Zr Co
18-20 16-18 7.S-8.S 3.5-4.S 1.0 0.7--D.9 0.3S--D.4S 0.02 0.02 O.OS O.OS O.OS Balance
Ib.3.2 Arc Welding of CoCr-Alloys
CoCr-alloys can be welded by tungsten inert gas welding (TIG), metal inert gas welding (MIG) and shielded metal arc welding (SMA W). Before welding the parts must be carefully cleaned by grinding, machining or washing with a solvent. Sand-blasting should be avoided because of the danger of contamination of the surface. TIG is accomplished with a thoriated tungsten electrode (W + 2% Th02). Automatic MIG is possible with argon or helium as shielding gases and with an electrode material corresponding to the base metal. The heat input provided by the current and voltage respectively and by the welding speed (Table Ib.9) should be low in order to produce a high cooling rate providing a favourable microstructure (for grains and fine precipitations of carbides). Therefore SMA W is performed in a flat position with a rapid welding speed and with little weaving.
Table Ib.9 Recommended parameters for the welding of CoCr-alloys by different processes (Ref. 12)
Parameter
Power supply Electrode diameter (mm) Filler metal Shielding gas Welding position Current (A) Voltage (V) Arc starting Welding speed (m/min)
TIG
DC transformer 1.1-1.6
Ar fiat 12-70 10-20 High frequency 0.4-2.3
MIG
DC transformer 0.9 According to base metal Ar fiat 130-160 22-25
0.75

L-_____________ M_E_C_H_A_N_I_C_A_L_P_R_O_P_E_R_T_I_E_S ____________ ~I I 173
CoCr-alloys are welded in the solution-treated condition with electrodes of a similar composition to the base metal. CoCr-alloys are more difficult to weld than wrought CoCr-alloys. Table 1b.9 gives recommended parameters for the welding of CoCr-alloys by different processes.
IB.4 MECHANICAL PROPERTIES
Table tb.tOa Mechanical Properties of cast CoCr and powder metallurgically produced (pm) alloys (Ref. 1, 2, 8, 15, 16)
Tensile Young's Yield Ultimate Ration Elonga· Reduc-
Modulus x J(Y Strength* Tensile Yield! tion at tion of (MPa) (0.2%) Strength Tensile Fracture* Area Hardness
Alloy Condition (MPa) (MPa) Strength (%) (%) HV
C029Cr5Mo As cast ~450 ~665 ~.69 ~8 ~8 CoCrMo* As cast 210- 500-650 1277 4-10 300-400
HIP 330 841 14
* Alloys used for dental restoration.
Table tb.U Influence of the hot working procedure and of the heat treatment on the mechanical properties of cast CoCrMo (Ref. 16)
Tensile Yield Ultimate TensiLe Ratio YieLd! Elongation at Strength Strength Tensile Fracture
Treatment (MPa) (MPa) Strength (%)
As cast 430-490 71~90 0.55-0.60 5-8 Solution annealed 450-492 731-889 0.55-0.62 11-17
1230°C/1 h/water quenched
Solution annealed 444-509 747-952 0.47-0.68 10-13.5 + aged 650°c/20 h
Cast and extruded 731 945 0.77 17 1200°C + annealed 1100°C/2 h
Cast and hot forged 876 1360 0.64 19 and rolled 1175°C + cold rolled 10% + 1050°c/40 min air cooled

CoCr-BASED ALLOYS
Table lb.U Influence of the cold working procedure on the mechanical properties of the alloy Co20Cr15WI0Ni (Ref. 16)
Tensile Yield Ultimate Tensile Ratio Yield! Elongation at Strength Strength Tensile Fracture
Treatment (MPa) (MPa) Strength (%)
Annealed Cold worked (17.5%) Cold worked (4%) Cold worked
450-650 1180 1610 1300
950-1200 1350 1900 1520
0.47~.54 0.87 0.85 0.85
37-60 22 10
Table lb.13 Influence of deformation and heat treatment on the mechanical properties of the alloy Co20Cr35NilOMo (Ref. 16)
Tensile Yield Ultimate Tensile Ratio Yield! Elongation at Strength Strength Tensile Fracture
Treatment (MPa) (MPa) Strength (%)
Wrought, annealed 300 800 0.37 40 >1050°C
Cold worked (50%) 650 1000 0.65 20 Cold worked (55%) 1413 1827 0.77 12 Cold worked (55%) 1999 2068 0.97 10
+ aged + 538°C/4 h Hot forged >650°C below 1300
the recrystallization temperature (950°C)
1B.5 FATIGUE
Table lb.l4 High cycle fatigue strength of various CoCr alloys (Ref. 16, 17)
Fatigue Rotating Reversed-Stress Bending Fatigue
Alloy Condition R (MPa) R Strength (MPa)
G-Co29Cr5Mo As cast -1 200-300 -1 300 Co20Cr35NilOMo As cast 200-300 Co20Cr15WlONi Wrought 540-600 500 pm-Co29Cr5Mo HIP 370-430 725

L-______________ C_O __ R_R_O_S_IO_N __ A_N_D __ W_E_A_R ______________ ~I I 175
Table Ib.15 Influence of the heat treatment on the fatigue strength (107 cycles) of CoCr-alloys (Ref. 16, 18)
Alloy Treatment
G-C029Cr5Mo As cast As cast + polished As cast + shot peened Solution annealed (1230°C/1 hlwater quenched Annealed 1170°C
C020Cr15WlONi Cold worked (17.5%) Cold worked (44%)
C020Cr35NilOMo Annealed >1050°C Cold worked (50%) Cold worked (50%) Hot forged + annealed Hot forged > 650°C
R
-1
Tensile Fatigue Strength (MPa)
300 >200 >260
220-280
280-350 490 587 340 435 405
400-450 520
Table Ib.16 High cycle fatigue strength of hip endoprostheses of CoCr alloys, measured in 0.9% NaCI solution at 37°C. Testing conditions similar to DIN 58840 (simulation of a loosened shaft, 50 mm free length) (Ref. 19)
Alloy
Cast C029CrMo Wrought CoNiCrMo
Maximum load in 2 x 10⁷ cycles (kN) Air (f = 25 Hz) 0.9% NaCl (f = 2 Hz)
7 5.5-6.5 5.5 4.5
IB.6 CORROSION AND WEAR
Table Ib.17 Influence of the pH value on the electrochemical data of the alloy Co29Cr5Mo in 0.1 M NaCI (Ref. 20)
Metal/Alloy
C029Cr5Mo pH 7 pH 2
Corrosion Potential Passive Current Density Breakdown Potential Ecorr (mV) Ip (p.A/cm2) Eb (mV)
-391 -465
1.36 0.54
340 476

CoCr-BASED ALLOYS 176 I I L-______________________________________________________ ~
Table lb.l8 Repassivation time in 0.9% NaCI and breakdown potential in Hank's solution of CoCr alloys (Ref. 21)
Alloy Breakdown Potential (mV) Repassivation Time (ms) vs Calomel Electrode -500mV +500mV
G-C029Cr5Mo C020Cr35NilOMo
+420 +420
44.4 35.5
36 41
Table lb.l9 Polarization current (i) and polarization resistance (Rc) of CoCr alloys in 0.9% NaCI and in 0.9% NaCI with a stable redox system at 37°C [Fe(CN)/lFe(CN)63-j, corresponding to a potential of the body fluid of 400 mY (Ref. 22,23)
Material Rc (kO cm2)
0.9% NaCl 0.9% NaCl + redox
C020Cr15WlONi 0.004 2500 3.32
Table lb.20 Rate of formation of corrosion products for the alloys C029Cr5Mo in Hank's solution under constant natural potential (Ref. 24)
Alloy
C029Cr5Mo Mechanically polished Chemically polished
Metal (Converted into Compound) (ng/cm2 h)
150 20
Table lb.21 Coefficients of friction of sliding materials (Ref. 17, 24)
Material
G-C029Cr5Mo/ G-C029Cr5Mo
G-C029Cr5Mo/HD Pe
C020Cr35NilOMo/ C020Cr35Nil0Mo Cartilage/Cartilage
Lubricant
Dry Distilled H20 Synovial fluid Globulin solution Albumin solution in vivo Synovial fluid
in vitro in vivo
H20
in vivo
Coefficient of Friction
0.80 0.38 0.16 0.16 0.18 0.04
0.04 0.02 0.58
0.008

BIOLOGICAL PROPERTIES I I 177 L-______________________________________________________ ~
Table Ib.22 Influence of nitrogen ion implantation on the mean wear rate and the coefficient of friction of the cast alloy Co29Cr5Mo (Ref. 25, 26)
Alloy
Co29Cr5Mo Co29Cr5Mo
nitrogen implanted Co29Cr5Mo Co29Cr5Mo
nitrogen implanted
Testing Load (N)
132 132
lO lO
Mean Wear Rate (mm3/1(f»
3.22 5.93
0.260 0.185
Coefficient of Friction
0.131 0.89
Testing conditions: Co29Cr5Mo - pin on UHMWPE disk; lubricant: bovine serum; testing speed: 85 mm/s.
1B.7 BIOLOGICAL PROPERTIES
Table Ib.23 Biocompatibility of cp-Co, cp-Cr, cp-Ni and NiCrCo alloys; survival rate of L-32 cells incubated with powders (Ref. 27, 28)
Metal/Alloy Powder Concentration Survival Rate (mg/l)
Co 25 50
Cr 200 400
Ni 200 400
Co20Cr15WlONi 200 400
Co20Cr35Ni10Mo 200 400
Table Ib.24 50% lethal concentration (LC50) of powders from Table 1 b.23 (Ref. 27)
Metal/Alloy LC50 (mg/l)
Co Cr Ni Co20Cr15WlONi Co20Cr35Nil0Mo
30 >400
25 80
100
(%)
45 18 65 62
0.9 0.1
33 23 25 14

178 I 1L-_________________ c_oC_r_-B_A __ SE __ D_A_L_L_O_Y __ S ________________ ~
REFERENCES
1. DIN/ISO 5832-4 (draft) (1980), Beuth. 2. American Standard ASTM F75 (1982) (ASTM F75-67). 3. DIN/ISO 5832-5 (draft) (1992), Beuth. 4. DIN/ISO 5832-6 (draft) (1980), Beuth. 5. DIN/ISO 5832-7 (draft) (1992), Beuth. 6. American Standard ASTM F75 (1990) (ASTM F90-68). 7. American Standard ASTM F562 (1984) (ASTM 578A). 8. CoCr-alloy producing industries. 9. DIN/ISO 5832-8 (draft) (1992), Beuth.
10. MP35N Alloys, Latrobe Steel Company, Pennsylvania. 11. ASM Metals Handbook, Vol. 16: Machining. 12. Brazing of Heat-Resisting Alloys, in ASM Metals Handbook, Vol. 6. Welding,
Brazing Soldering. 13. ASM Metals Handbook, Vol. 14: Turning and Forging. 14. Encyclopedia of Mat. Sci. Eng. (1986), Pergamon Press. 15. DIN 13912 (1982), Beuth. 16. Pilliar, R.M., Manufacturing Processes of Metals: The Processing and
Properties of Metal Implants, in Metal and Ceramic Biomaterials, Vol. 1. 17. Thull, R. (1979) Eigenschaften von Metallen, fUr orthopadische Implantate
und deren PrUfung. Orthopiidie, 7, 29. 18. Lorenz, M. Semlitsch, M., Panic, B., Weber, H. and Willhert, H.G. (1978)
Fatigue Strength of Cobalt-Base Alloys with High Corrosion Resistance for Artificial Hip Joints. Engineering in Medicine, 7 (4), 241.
19. Kunze, E. (1988) Vergleichende Untersuchungen zum Langzeit-ErmUdungsverhalten von HUftgelenkprothesen an Luft und in NaCl-U:isung. Metall, 2, 140-145.
20. Geis-Gerstorfer, J., Weber, H. and Breme, J. (1988) Electrochemische Untersuchung auf die Korrosionsbestandigkeit von Implantatlegierungen. Z. f Zahniirztl. Implantologie 4, (1), 31-36.
21. Breme, J. and Schmidt, H.-J. (1990) Criteria for the Bioinertness of Metals for Osseo-Integrated Implants, in Osseo-Integrated Implants, Vol. 1, (ed. G. Heimke), pp. 31-80.
22. Zitter, H. and Plenk, H. (1987) The Electrochemical Behaviour of Metallic Implant Materials as an Indicator of their Biocompatibility. 1. of Biomedical Materials Research, 21, 881.
23. Breme, J. (1988) Titanium and Titanium Alloys, Biomaterials of Preference, in Proc. of the 6th World Conf on Ti, Vol. 1, pp. 57-68.
24. Mears, D.C. (1977) Metals in Medicine and Surgery. International Metals Reviews, Review 218, June, 119-155.
25. Greer, K.W. and Jones, D.E. (1994) The importance of standardization of wear test parameters in the simulation of three wear mechanisms, Proc. of the 20th Annual Meeting of the Society for Biomaterials, p. 408.
26. Taylor, S.K. Serekian, P. and Manley, M. (1992) Effect of nitrogen ion implantation on CoCr wear performance against UHMWPE, Proc. of the 4th World Biomaterials Congress, p. 275.
27. Hildebrand, H.F. (1993) Biologische Aspekte beim Einsatz von ImplantatwerkstofJen, DGM Hochschulseminar, SaarbrUcken, Germany.
28. Breme, J. (1993) Metalle als Biomaterialien, DGM Hochschulseminar, SaarbrUcken, Germany.

Titanium and titanium alloys
IC.I COMPOSITION
Table lc.l Comparison of international standards for titanium and titanium alloys
International Great Organization United
Chemical Germany Britain France for Standard- States Japan Composition * DIN** BSI AFNOR ization ISO ASTM JIS
Ti-1 5832-2 2TA1 NFIS05832-2 5832111 F67/Grade 1 H4600 Ti-2 and 2TA2 and F67/Grade 2 Ti-3 17850 2TA6 S 90-404 F67/Grade 3 Ti-4 respectively BS7252-2 respectively F67/Grade 4
Ti6Al4V 5832-3 2TAlO, NFIS05832 5832/III F136 H4607 and 2TA13 and
17851 BS7252-3 S94-080 respectively respectively
Ti5A12.5Fe 5832-10 BS7252-10 5832/X and
17851 respectively
Ti6Al7Nb 5832-11 S94-081 5832/XI F1295 and
17851 respectively
* Ti-1-Ti-4 = commercially pure titanium; others: direct chemical composition, e.g. Ti6AI4V: 6 wt%, AI, 4 wt% V, balance Ti. ** terms of delivery: DIN 17860, DIN 17862.

180 I I TITANIUM AND TITANIUM ALLOYS
Table lc.2 Chemical composition of cp-titanium (wt%) (Ref. 1,2)
cp-Titanium Fe max. o approx. N max. C max. Hmax. Ti
Grade I 0.2 0.1 0.05 0.08 0.013 Grade II 0.25 0.2 0.06 0.08 0.013 Balance Grade III 0.3 0.25 0.06 0.1 0.013 Grade IV 0.35 0.3 0.07 0.1 0.013
Table lc.3 Chemical composition of (a+J3)-titanium alloys (wt%) (Ref. 1,3,4)
Others Alloy Al V Fe Nb Ta 0 N C H Single Sum Ti
Ti6AI4V 5.5- 3.5- 0.3 0.2 0.05 0.08 0.015 0.1 0.4 Balance 6.75 4.5
Ti5A12.5Fe 4.5- 2.0- 0.2 0.05 0.08 0.015 0.1 0.4 Balance 5.5 3.0
Ti6Al7Nb 5.5- 0.25 6.5- 0.5 0.2 0.05 0.08 0.009 - Balance 6.5 7.5
Table lc.4 Chemical composition-(wt%) of J3 and near J3 titanium alloys (experimental alloys) (Ref. 5, 6)
Alloy Al Mo Zr Ta Nb Sn Ti
Ti15Mo5Zr3Al Ti12Mo5Zr5Sn Ti30Nb Ti30Ta
3,8 15 11.5
lC.2 PHYSICAL PROPERTIES
5 5 4.5 Balance
30 30
Table lc.S Physical properties of commercially pure titanium (Ref. 1, 7, 9
Young's modulus Density Melting point Boiling point Transformation temperature a-J3 Crystal structure
Magnetic properties
(GPa) (g/cm3)
eC) (0C) (0C)
Heat of transformation (kJ/kg) Thermal neutron-capture cross section (cm2)
Specific heat at 15°C (kJ/kg K) Heat fusion (kJ/kg) Thermal conductivity at room temperature (W/mK) Thermal expansion coefficient between 20 and 200°C (Kl) Specific heat resistivity at 20°C (f-L!1m)
105-110 4.5 1700 3600 885 >850°C J3 bcc <850°C a hex paramagnetic 67 5.8 x 10⁻²²
0.52 419 17 9 x 10⁻⁶
0.5

PROCESSING OF cp-Ti AND Ti ALLOYS I I 181 L-____________________________________________________ ~
Table 1e.6 Physical properties of «(H~)-titanium alloys (Ref. 1, 7, 8, 9)
Property Ti6Al4V Ti5Al2.5Fe Ti6Al7Nb
Young's modulus (GPa) 100-110 110-116 110 Density (glcm3) 4.43 4.45 4.52 Type of phase at room a+~ a+~ a+~
temperature (0C) Microstructure Al-A9 Al-A9 Al-A9 Transformation temperature (0C) 990±15 950±15 1010±15 Thermal conductivity at 6.5
room temperature (W/mK) Coefficient of thermal 8.6 9.3
expansion between 30-200°C (xlO·6K·l)
Specific heat at 20°C 0.56 (kJ/kg K)
Specific electrical resistivity 1.66 at 20°C (52 mm2/m)
Table Ie. 7 Influence of alloying elements and heat treatment on Young's modulus (Ref. 10, 11)
Alloy Heat Treatment Young's Modulus (GPa)
Ti30Ta As rolled 80 1 hl1000°C/H20 63
Ti30Nb As rolled 70 Til5Mo5Zr3Alell Solution heat treated at 840°C 75
Solution heat treated at 740°C 88 Solution heat treated at 740°C 113
+ aged at 600°C
1C.3 PROCESSING OF ep-Ti AND Ti ALLOYS [1]
Provided that the following characteristics of titanium are taken into consideration, almost all processing procedures are possible:
1. high affinity to the gases oxygen, nitrogen and hydrogen 2. high reactivity to all metals producing intermetallic compounds 3. relatively low Young's modulus and therefore backspringing 4. relatively low thermal conductivity 5. tendency to stick to the tools
1e.3.1 Hot working and heat treatment
Titanium and titanium alloys are fabricated into semi-finished products by conventional methods such as forging, rolling, pressing, drawing etc.

182 I 1L-___________ T_IT_A __ N_IU __ M_A __ N_D_T_I_T_A_N_I_U_M __ A_L_L_O_y_S __________ ~
When Ti materials are heated, care must be taken to avoid an excessive pickup of oxygen, nitrogen and hydrogen. Heating and annealing should therefore take place in a neutral or slightly oxidizing atmosphere. During heating in a gas-fired furnace direct contact with the flame must be avoided because of the risk of hydrogen pickup and of local overheating. During a short heating period oxygen pickUp is restricted to the surface area. This surface zone must be removed by chemical or mechanical methods. Because hydrogen is able to penetrate the matrix rapidly, a reducing atmosphere must be avoided. The hot working temperature depends on the alloy composition and should be selected to obtain the best mechanical properties and grain structure (A1-A9 according to EITe2, Ref. 11). Table 1c.8 summarizes the deformation temperatures for the various Ti materials. Table 1c.9 gives the temperature ranges and recommended annealing times for stress relieving, soft annealing and solution treating + age hardening. Where the cross-section is very small, annealing is favourably carried out in a high vacuum furnace. Prior to this annealing treatment the oxide film must be removed from the surface in order to avoid diffusion of oxygen into the material.
Table le.S Deformation temperatures for various titanium materials (Ref. 1.13)
Alloy Deformation temperature (0C)
cp-Ti Grade 1 Grade 2 Grade 3 Grade 4 Ti6Al4V
650-870 650-870 700-900 700-930 760-1040
Table 1c.9 Recommendation for the heat treatment of cp-Ti and Ti alloys (Ref. 1, 7)
Alloy Stress Relief
Ti grade I Ti grade II 15 min-2 h Ti grade III at 450°C/air Ti grade IV
Ti6Al4V
Ti5A12.5Fe
3 min/mm min. 30 min max. 4 h at 500-600°C/air
Soft Annealing
15 min-8 h at 650-750°C
min. 15 min max. 4 h at 700-850°C/air slow cooling rate
to 550°C
Solution Annealing + Age Hardening
15-60 min at 820-950°C/HzO + 2 h at 480-600°C/air
15-60 min at 800-920°c/HzO + 2-4 h at 480-600°C/air

PROCESSING OF cp-Ti AND Ti ALLOYS I I 183 ~----------------------------------------------------~
Ic.3.2 Working of sheet
At room temperature cp-Ti, grades I and II, can be worked very well, grades III and IV only moderately well. The Ti alloys, because of their high yield/tensile strength ratio, can be worked only under certain conditions.
For deep drawing special coatings in the form of polymer foils have proved to be effective. At high temperatures colloidal graphite and common hot press greases with graphite or molybdenum disulphide additives have been successful. The Fe-, Ni- and Cr-contents should be limited to 0.05, 0.1 and 0.33 wt%, respectively, in order to allow during a short annealing treatment (1-5 min at 750-850°C) a grain growth producing an average grain size of 50-70 fLm. Due to this grain growth a deformation by twinning, with a resulting increased deep drawability, occurs (Ref. 14).
Superplastic forming is a material-saving and cost-reducing processs for manufacturing parts of complicated shape because it can be carried out together with diffusion welding in a single operation. Especially fine grained alloys like Ti6AI4V and Ti5AI2.5Fe can be used for a superplastic deformation. Other special deformation processes such as stretch forming, spinning or explosion forming are also possible.
1c.3.3 Descaling
With thick-walled parts the oxide layer on the surface generated during deformation and/or heat treatment is removed by sand-blasting and/or pickling. The workpiece is treated in an aqueous solution of 20 Wt. %. HN03 and 2% Wt. % HF.
Thin walled pieces are only pickled in an electrolytic or salt bath. It is important that not only the surface layer of oxide, but also the underlying oxygen enriched diffusion zone is removed. Otherwise, the machinability and the service life of turning and milling tools would be negatively affected.
Ic.3.4 Machining
The machining of titanium materials presents no difficulties provided the following characteristic properties are taken into account:
1. relatively low thermal conductivity which may cause high thermal stresses at the cutting edge of the tool
2. low Young's modulus which yields to the pressure of the tool 3. tendency to stick to the tool
The titanium materials must therefore be machined at low cutting speeds, at a relatively high feed rate with an ample supply of coolant

184 I ~I ___________ T __ IT_A_N_I_V_M __ A_N_D_T_I_T_A_N_I_V_M __ A_L_L_O_y_S __________ ~
(sulphur containing oil; mixture of tetrachloride carbon, molybdenum sulphide and graphite; 5% aqueous solution of sodium nitrite, 5-10% aqueous solution of water-soluble oil or sulphurized chlorinated oil). The cutting tools should be sharp and mounted as rigidly as possible. Recommended parameters for turning and milling are given in Table 1c.1O.
Since titanium dust and chips can easily catch fire, safety precautions must be taken.
Threads should be cut on a lathe, as thread-cutting discs are subject to seizure.
Sawing causes no difficulties if a high blade pressure is used and the coolant supply is ample. Coarse toothed blades (4 teeth per inch) are recommended.
For grinding, aluminium oxide (5-10 m/sec) and silicon carbide (20-30 m/sec) can be used.
Table le.lO Recommendations for the cutting and milling of cp-Ti and Ti alloys (Ref. 7)
Alloy Cutting Speed Feed Depth of Cut Cutting Relief (m/min) (mm/rev) (mm) Angle Angle
Rough cutting cp-Ti TC 30-75 0.2-0.4 0-60 ~o
HSS 7.5-4.0 0.1-1.25 6-150 5-70
>2.5 Ti alloys TC 15-25 0.2-0.4 0-60 6-80
HSS 3-15 0.1-0.4 6-150 5-70
Forecutting cp-Ti TC 60-100 0.1-0.4 6-60 6-80
HSS 18-50 0.075-0.2 6-150 5-70
0.75-2.5 Ti alloys TC 20-50 0.1-0.4 6-60 ~o
HSS 5-15 0.075-0.2 6-150 5-70
Finish cutting cp-Ti TC 60-100 0.075-0.3 0-150 6-80
HSS 20-50 0.05-0.1 5-60 5-70
0.1-0.75 Ti alloys TC 20-70 0.075-0.3 0-150 6-80
HSS 9-15 0.05-0.1 5-60 5-70
Milling cp-Ti TC 25-30 0.07-0.15 HSS 50-60 0.1-0.2 > 1.25 face cutter Ti alloys TC 7.5-20 0.07-0.2 >2.5 gear cutter HSS 15-30 0.1-0.2
TC = hard metal (tungsten carbide). HSS = high speed steel.

L-__________ P_R_O __ C_E_SS_I_N_G __ O_F_c_p_-T_i_A_N_D __ T_i_A_L_L_O_y_S __________ ~1 I 185
lc.3.5 Soldering and brazing
Immediately before soldering and brazing the oxide layer which is always present on the surface of titanium materials must be removed. For direct applications using a torch, aluminium-zinc and tin-zinc solders are suitable. The higher temperatures required for brazing present the difficulty of avoiding the formation of intermetallic phases. With almost all metals titanium forms brittle intermetallic phases in the fusion zone. The only exception is Ag, so that this metal forms one of the main constituents of brazers. The sources of heat used for brazing and soldering are the acetylene torch, high frequency induction coils, infrared radiation, an inert-gas-shielded arc with graphite or tungsten electrodes, furnaces with an argon atmosphere (min. 99.99% and/or a dew point below -50°C) and high vacuum furnaces. If brazing is not performed under vacuum or in a controlled atmosphere, fluxes are necessary to dissolve the oxide layers and prevent a pickup of gases.
lc.3.6 Welding
The inert-gas-shielded arc processes (TIG and MIG) are mainly used for fusion welding. In special cases resistance, ultrasonic, electron beam, diffusion and laser welding are applied. With the cp-Ti grades the weld attains mechanical properties approximating those of the base metal. A slight decrease in ductility may occur with high tensile grades. Under passivating conditions, titanium welds have the same corrosion resistance as the base metal. On the contrary, in reducing media the weld may be subjected to a more severe corrosive attack than the base metal. During the welding operation, the weld, the heat affected zone and the underside of the weld are shielded from the atmosphere. The filler rod used is an uncoated wire of the same grade or of a grade with a lower hardness than the base metal. Careful preparation of the joint is necessary, i.e. surface impurities must be removed by grinding or pickling in order to avoid porosity. Even fingermarks can produce a hardening of the weld. Sheet up to 2.5 mm thickness can be welded by a single layer. In order to avoid local oxygen concentrations oxidation products, such as those found at the tip of the electrode, must be cut off. The effectiveness of the inert gas is responsible for the welding rate. The optimum argon flow rate has proved to be about 6-8 l/mm. After welding the appearance of a dark blue or gray oxide layer indicates an insufficient inert gas shielding and an embrittlement of the weld due to oxygen and/or nitrogen pickUp. The hardness of a good weld may exceed that of the fully recrystallized base metal by a maximum of 50 VHN. If, after a slight grinding of the surface, a hardness test should give a higher value, the weld must be completely removed because of embrittelement.

186 I I~ __________ T_I_T_A_N_I_U_M __ A_N_D_T_I_T_A_N_I_U_M_A __ L_L_O_y_S __________ ~
Electron beam welding is particularly suitable for titanium materials. It offers many advantages such as very narrow seams and small heat affected zones, weldability of thick diameters, high welding speed and reproducibility of even complex welds.
Titanium materials can be spot welded without any particular preparation under similar conditions to those of stainless steel. Using flat-tipped electrodes, spot welding can be performed without inert gas. A hardening of the zone by up to 50 VHN compared with the base metal is regarded as normal and does not diminish the strength of the joint. Seam and flashbutt welding are also possible if an argon atmosphere is used.
Diffusion welding is of particular importance for titanium materials because these materials are more amenable to a homogeneous band in the solid state state than other metals. After welding, the joint zone shows a higher temperature under high vacuum or, in an inert atmosphere, a microstructure very similar to that of the base metal.
lC.4 MECHANICAL PROPERTIES
Table lc.n Mechanical properties of commercially pure titanium (Ref. 1, 14)
Tensile Bend radius yield Ultimate Ratio Elonga- Reduc- (105°) for sheet
strength tensile yield! tion at tion of Hard- thickness t (0.2 %) strength tensile fracture* area* ness <2mm >2mm
cp-Titanium Condition (MPa) (MPa) strength (%) (%) <5mm
Ti grade I 200 290-410 0.49-0.69 30 35 120 2t 3t Ti grade II sheet, 250 390-540 0.46-0.64 22 30 150 3t 4t Ti grade III as 320 460-590 0.54-0.7 18 30 170 4t 5t Ti grade IV rolled 390 540-740 0.53-0.72 16 30 200 5t 6t
* Minimum values.
Table 1c.12 Influence of a cold deformation on the mechanical properties of commercially pure titanium (Ref. 15)
Tensile Yield Ultimate Ratio Elongation Strength Tensile Yield! at
Condition (0.2%) Strength Tensile Fracture cp- Titanium (%) (MPa) (MPa) Strength (%)
Ti grade I 30 555 635 0.87 18 40 560 645 0.87 16 55 605 710 0.85 15 60 620 725 0.86 14 65 640 730 0.88 14.5
Ti grade II 30 605 680 0.89 18 40 645 740 0.87 17 50 680 780 0.87 16 60 685 795 0.86 16 65 692 810 0.85 16.5
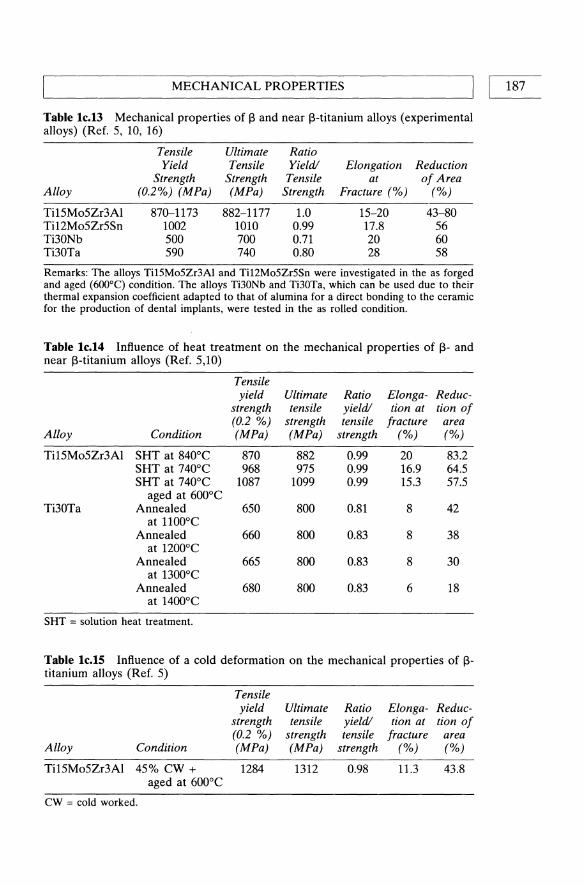
~ ______________ M_E_e_H_A_N_I_e_A_L_p_R_O_P_E_R_T_I_E_S ______________ ~I I 187
Table lc.l3 Mechanical properties of 13 and near l3-titanium alloys (experimental alloys) (Ref. 5, 10, 16)
Tensile Ultimate Ratio Yield Tensile Yield! Elongation Reduction
Strength Strength Tensile at of Area Alloy (0.2%) (MPa) (MPa) Strength Fracture (%) (%)
Ti15Mo5Zr3Al 870-1173 882-1177 1.0 15-20 43-80 Ti12Mo5Zr5Sn 1002 1010 0.99 17.8 56 Ti30Nb 500 700 0.71 20 60 Ti30Ta 590 740 0.80 28 58
Remarks: The alloys Ti15M05Zr3Al and Ti12M05Zr5Sn were investigated in the as forged and aged (600°C) condition. The alloys Ti30Nb and Ti30Ta, which can be used due to their thermal expansion coefficient adapted to that of alumina for a direct bonding to the ceramic for the production of dental implants, were tested in the as rolled condition.
Table lc.l4 Influence of heat treatment on the mechanical properties of 13- and near l3-titanium alloys (Ref. 5,10)
Tensile yield Ultimate Ratio Elonga- Reduc-
strength tensile yield! tion at tion of (0.2 %) strength tensile fracture area
Alloy Condition (MPa) (MPa) strength (%) (%)
Ti15Mo5Zr3Al SHT at 8400 e 870 882 0.99 20 83.2 SHT at 7400 e 968 975 0.99 16.9 64.5 SHT at 7400 e 1087 1099 0.99 15.3 57.5
aged at 6000 e Ti30Ta Annealed 650 800 0.81 8 42
at 11000 e Annealed 660 800 0.83 8 38
at 12000 e Annealed 665 800 0.83 8 30
at 13000 e Annealed 680 800 0.83 6 18
at 14000 e
SHT = solution heat treatment.
Table le.lS Influence of a cold deformation on the mechanical properties of 13-titanium alloys (Ref. 5)
Tensile yield Ultimate Ratio Elonga- Reduc-
strength tensile yield! tion at tion of (0.2 %) strength tensile fracture area
Alloy Condition (MPa) (MPa) strength (%) (%)
Ti15Mo5Zr3Al 45% ew + 1284 1312 0.98 11.3 43.8 aged at 6000 e
CW = cold worked.

188 I I TITANIUM AND TITANIUM ALLOYS
Table 1c.16 Mechanical properties of (a+13 )-titanium alloys (Ref. 1, 3, 17, 18)
Alloy Condition Tensile Bend radius yield Ultimate Ratio Elonga- Redllc- (105° )Jar sheet
strength tensile yield! tion at tion of Hard- thickness t Sheet as rolled (0.2 %) strength tensile fraclI/re' area* ness <2mm >2mm thickness (mm) (MPa) (MPa) strength (%) (%) <5mm
Ti6Al4V -6 870 950 0.92 8 25 310 9 t lOt 6-100 830 920 0.90 8 25 310
Ti5AI2.5Fe -6 780 860 0.91 8 25 310 9 t lOt
Ti6Al7Nb Extruded 811- 869- 0.93- 7-13 24-44 hot 952 1008 0.94
rolled 943- 1016- 0.93 11-16 40-55 + hot 1008 1086 forged
Ti6Mn -6 1058 1095 0.97 11.5 26 360
Ti6Mn was developed for a coating with hydroxyapatite. Due to a thermal expansion coef-ficient of this alloy, which is near to that of the ceramic, an extremely high shear strength of the surface layer has been achieved.
Table 1c.17 Influence of a solution treating and ageing on the mechanical properties of Ti6Al4V (Ref. 1)
Condition
Sheet::;; 12.5 mm 15--60 min at 800-920°CIHP + 2-4 h 480--6oo°C/air
Tensile Yield
Strength (0.2%) (MPa)
1070
Ultimate Tensile
Strength (MPa)
1140
Ratio Yield! Tensile
Strength
0.94
Elongation at
Fracture (%)
8
Reduction of Area
(%)
20
Table 1e.18 Fracture toughness of Ti-alloys (Ref. 5,19).
Alloy
Ti6Al4V
Ti5A12.5Fe
Ti15Mo5Zr3A1
Condition
Annealed Solution treated + annealed Annealed (2 h1700°C/air) Solution treated + annealed
(1 hl900°C/waterIl2 hl7oo°C/air) Solution treated at 740°C Solution treated at 740°C
+ annealed at 600°C 40% cold worked
+ annealed at 600°C
Fracture Toughness K1C
(Nlmm3f2)
1740 2020 1225
1785 4580
2430
980

FATIGUE I I 189 L-____________________________________________________ ~
Table lc.19 Influence of a plasma nitriding (PVD) on the mechanical properties of commercially Ti6Al4V (Ref. 20)
Treatment Tensile Yield Ultimate Tensile Ratio Yield! Elongation Strength (0.2%) Strength Tensile at Fracture
(MPa) (MPa) Strength (%)
Untreated 809 894 0.90 20 Vacuum annealed 815 924 0.88 21
20 h/850°C Plasma nitrided* 805 914 0.88 20
20 h1850°CIN2
Plasma nitrided* 880 984 0.89 20 20 h1850°CINH3
* Plasma nitriding at 20-40 kW.
le.S FATIGUE
Table lc.20 High cycle fatigure strength (TB and rotating fatigue strength (TR of titanium and titanium alloys (Wohler curves) (Ref. 10, 21, 22, 23, 24)
Alloy R (TB (MPa) R (TR (MPa)
cp-Ti -1 230-280 -1 200 Ti6Al4V -1 400-450 -1 500-660 Ti5A12.5Fe -1 -1 450-550 Ti6A17Nb -1 -1 450-600 ~~ ~ ~ 1~ cp-Ta -1 -1 200 Ti30Ta -1 -1 400
Table lc.21 Rotating bending fatigue tests of unnotched and notched titanium alloys (Ref. 19)
Fatigue Strength for Stress Alternating Tensile
Concentration Stresses (>107 cycles) Alloy R Condition Factor (MPa)
Ti6Al4V -1 1.0 725 Ti5AL12.5Fe -1 Wrought + annealed 1.0 725
-1 Wrought + solution -1 treated + annealed 3.6 300 -1 Cast + HIP 3.6 300 -1 Cast + HIP 1.0 450

190 I ~I ____________ T_IT_A_N_I_U_M __ A_N_D_T_I_T_A_N_I_U_M __ A_L_L_O_y_S __________ ~
Table lc.22 High cycle fatigue strength of hip endoprostheses of titanium alloys, measured in 0.9% NaCI solution at 37°C. Testing conditions similar to DIN 58840 (simulated loosened shaft, 50 mm) (Ref. 23, 25)
Alloy
Hot wrought Ti6AI4V Wrought Ti5A12.5F Ti6ALl7Nb
Maximum load in 2X10⁷ cycles (kN) 0.9% NaCl (f = 2 Hz)
6.5-8.0 8
3.5--6.0
Table lc.23 Influence of the mean stress Sm on the fatigue strength of Ti6AI4V (Ref. 26)
Sm (MPa)
o
250
500
750
R
-1
-0.1 0.33 0.33 0.66 0.7 0.81
Notch Factor Kf
1 2.82 1 2.82 1 2.82 1 2.82
Fatigue Strength (MPa) at 107 cycles
400 250 300 125 250 100 125 80
Table lc.24 Influence of the notch factor on the fatigue strength of Ti6AI4V (Ref. 27, 28, 29, 30)
Notch Factor Kf
1 1.7 3.7 6.0
Stress Ratio R
-1 -1 -1 -1
Fatigue Strength (MPa)
400 300 150 100

~ ________________ F_A_T_IG_U_E ________________ ~I I 191
Table lc.25 Influence of interstitial elements on the rotating bending strength of Ti6Al4V (Ref. 31)
Chemical composition of the base alloy (wt%)
Al V Fe C N 0 H Ti 6.03 3.96 0.10 0.02 0.009 0.1 0.005 balance
Notch Factor Fatigue Strength Composition Heat Treatment Kf R (MPa)
Base alloy 1 h 815°C/furnace ~ 1 -1 610 600°C air 3 -1 210
Base alloy 1 h 855°Clfurnace ~ 1 -1 510 + 0.07% N 600°C air 3 -1 180
Base alloy 1 h 870°Clfurnace ~ 1 -1 550 + 0.2% 0 600°C air 3 -1 210
Base alloy 1 h 840°C/furnace ~ 1 -1 560 + 9.2% C 600°C air 3 -1 230
Base alloy 1 h 930°C/furnace ~ 1 -1 580 + 0.07% N 600°C air 3 -1 240 + 0.2% 0 + 0.2% C
Table lc.26 Influence of texture and test directions on the rotating bending fatigue strength of Ti6Al4V (fine equiaxed microstructure in rolled plates) (Ref. 32)
Type of Texture and Method of Production
Basal (0002 tilted out of the rolling plane by about 30°) cross rolling in lower «HI3 )-field
Transverse (0002 aligned parallel to the rolling direction) uni-directional in the higher (a+I3)field, 950°C
BasaUtransverse (both are present), unidirectional roll-at about 930°C
Fatigue Strength (MPa) R Test Direction at 107 cycles
-1 Rolling direction 625
-1 Rolling direction 630 Transverse direction 590
-1 Rolling direction 720 Transverse direction 690

192 I ~I ____________ T_IT_A_N_I_V_M __ A_N_D_T_I_T_A_N_I_V_M __ A_L_L_O_y_S __________ ~
Table lc.27 Influence of heat treatment (annealing and precipitation hardening respectively) on the fatigue strength of Ti6Al4V (Ref. 30, 33)
Condition Yield Strength (MPa) Tensile Strength (MPa)
As annealed 900 955 As hardened 1100 1195
Fatigue Strength (MPa) Condition Sm Kf R at ]07 cycles
As annealed 0 ] -] 510 0 3.3 -1 300
As hardened 0 1 -1 600 0 3.3 -1 280
As annealed 200 1 -0.3 425 200 3.3 -0.01 200
As hardened 200 ] -0.5 600 200 3.3 0 200
As annealed 300 1 0.14 400 300 3.3 0.23 165
As hardened 300 1 -0.22 550 300 3.3 -0.2 190
Table lc.28 Influence of the beta field heat treatment on the fatigue strength of Ti6Al4V (Ref. 34)
Heat Treatment
0.5 h IOIO°C/AC + 2 h 700°ClAC 5 h 1000°C/AC + 2 h 700°ClAC 0.5 h IOIO°CIH20 + 2 h 7oo°ClAC 5 h 101O°CIH20 + 2 h 700°C/A~
R
o o o o
Fatigue Strength (MPa) at ]07 cycles
525 620 750 650
Table lc.29 Influence of the surface treatment on the rotating bending fatigue (fine lamellar microstructure, produced by annealing in ]5 min1l050°ClH20 + ] hl800°C/H20) (Ref. 35)
Surface Treatment
Electrically polished Mechanically polished (7 fLm) Mechanically polished (80 fLm) Mechanically polished (80 fLm) + ] h 500°C Mechanically polished (180 fLm) Mechanically polished (80 fLm)+ ] h 800°C
R
-]
-1 -1 -1 -1 -1
Fatigue strength (MPa) at ]07 cycles
680 750 605 550 600 450

~ ____________________ F_A_T_I_G_U_E ____________________ ~I I 193
Table lc.30 Influence of the surface treatment on the rotating bending fatigue of Ti6Al4V (fine equiaxed microstructure produced by rolling at 800°C/HzO + 1 h/800°C(HzO) (Ref. 35)
Surface Treatment
Electrically polished Shot peened Shot peened + 1 h 500°C Shot peened + 1 h 500°C
20 f.lm surface removed Shot peened + 20 f.lm surface removed
R
-1 -1 -1 -1
-1
Fatigue Strength (MPa)
610 710 390 800
820
Table lc.31 Influence of surface working on the rotating bending of Ti6Al4V (Ref. 27, 36)
Surface Working Notch Factor (Kf) R Fatigue Strength (MPa)
Mechanically polished 1 -1 620 Mechanically polished 1 -1 660
and cold roll bent Ground 1 -1 540 Mechanically polished 2.02 -1 330
Table lc.32 Influence of plasma nitriding (PVD) on the rotating bending fatigue of Ti6Al4V (Ref. 20)
Treatment
Untreated Vacuum annealed 20 h/850 °C Plasma nitrided* 20 h/850 °ClNz Plasma nitrided*20 h1700 °c/NH3
Solution treated 1 hl940 °C/vac. + Ar cooled
Solution treated 1 h/940 °C/vac. + Ar cooled + plasma nitrided* 20 h1770 °C/Nz
* Plasma nitriding at 20--40 kW.
R
-1 -1 -1 -1 -1
-1
Maximum Bending Stress at ]07 cycles (MPa)
600 370 470 550 530
500
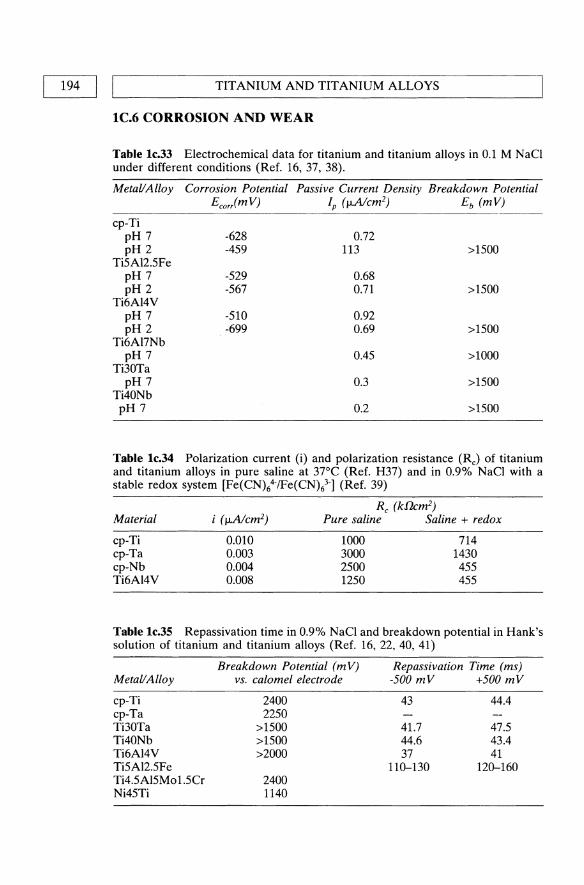
194 I ~I ____________ T_IT_A_N_I_U_M __ A_N_D_T_I_T_A_N_I_U_M __ A_L_L_O_y_S __________ ~
lC.6 CORROSION AND WEAR
Table lc.33 Electrochemical data for titanium and titanium alloys in 0.1 M NaCI under different conditions (Ref. 16, 37, 38).
Metal/Alloy Corrosion Potential Passive Current Density Breakdown Potential EcorimV) Ip (flAIcm2) Eb (mV)
cp-Ti pH 7 -628 0.72 pH 2 -459 113 >1500
Ti5A12.5Fe pH 7 -529 0.68 pH 2 -567 0.71 >1500
Ti6A14V pH 7 -510 0.92 pH 2 -699 0.69 >1500
Ti6AI7Nb pH 7 0.45 >1000
Ti30Ta pH 7 0.3 >1500
Ti40Nb pH 7 0.2 >1500
Table lc.34 Polarization current (i) and polarization resistance (RJ of titanium and titanium alloys in pure saline at 37°C (Ref. H37) and in 0.9% NaCI with a stable redox system [Fe(CN)64-/Fe(CN)l"] (Ref. 39)
Material
cp-Ti cp-Ta cp-Nb Ti6AI4V
0.010 0.003 0.004 0.008
Rc (kflcm2)
Pure saline Saline + redox
1000 3000 2500 1250
714 1430 455 455
Table lc.35 Repassivation time in 0.9% NaCI and breakdown potential in Hank's solution of titanium and titanium alloys (Ref. 16,22,40,41)
Metal/Alloy
cp-Ti cp-Ta Ti30Ta Ti40Nb Ti6AI4V Ti5A12.5Fe Ti4.5A15Mo 1.5Cr Ni45Ti
Breakdown Potential (mV) vs. calomel electrode
2400 2250
>1500 >1500 >2000
2400 1140
Repassivation Time (ms) -500 mV +500 mV
43
41.7 44.6 37
110-130
44.4
47.5 43.4 41
120-160

CORROSION AND WEAR I
Table 1c.36 Electrochemical data for anodic titanium and titanium alloys at 37°C in different solutions (de-aired) versus standard calomel electrode (SCE) (Ref. 42)
Corrosion Passive Current Breakdown Potential Density Potential E
Metal/Alloy vs. SCE Ep (mV) Ib (!J,Acm-2) (mV) Solution * cp-Ti -440 - -490 1.0-3.0 1300 1
-94-140 0-1.0 1750 2 -94 5.0-9.0 1950 3
Ti6Al4V -200--250 0.9-1.0 1155-1240 1 -240-300 0.8-1.5 1900 2 -180-250 0.9-2.0 1550 3
Ti15V3Cr3Sn3A1 mill -480-495 3.0-5.0 1900 1 -480-500 4.0-5.0 1700 2 -490-520 3.0 >2000 3
annealed 6h/51O°C/air -800-840 3.0-4.0 1000 1 -650-740 1.0-2.0 1300 2 -590-600 3.0-4.0 1800 3
* Key: 1 = Ringer's solution; 2 = Hank's solution; 3 = 0.17 M NaCI solution.
Table le.37 Repassivation rates in artificial saliva versus standard calomel electrode (Ref. 43)
Material
Titanium
Corrosion Potential (mV)
-355
Potential (m V) after I h 2 h 36 h
-308 -260 -160
Table 1c.38 Galvanic corrosion between titanium and other alloys in artificial saliva (Ref. 43)
Couples
Ti-HGC Ti-non gamma 2 amalgam Ti-CoCrMo cast alloy Ti-HGC-CoCrMo HGC-CoCrMo
Potential difference (mV)
-134 130
90-117 -22 225
HGC = high gold containing alloy.
Iga1v after 20 h (nA cm-2)
4 10 2 3
500
Titanium position
Anode Cathode Cathode Anode
I 195

196 I LI ____________ T_IT_A_N_I_U_M __ A_N_D_T_I_T_A_N_I_U_M __ A_L_L_O_y_S __________ ~
Table lc.39 Repassivation time of titanium and titanium alloys in contact with different metallic materials (Ref. 44)
NaC!, pH = 7.4 (shortcut alloy)
cp-Ti
Ti30Ta
Ti6AI4V
HC!, pH = 3 (activated alloy)
cp-Ti Ti30Ta Ti6AI4V cp-Nb C030Cr6.5Mo C028Cr5Mo X3CrNiM01812 cp-Ti Ti30Ta Ti6AI4V cp-Nb C030Cr6.5Mo C028Cr5Mo X3CrNiM01812 cp-Ti Ti30Ta
Repassivation Time t< (ms)
37.7 41.8
480.0 38.7 38.4
1000.0 43.0 48.6 39.0
1080.0 44.1
(4200) 1000.0
44.0 34.2
Table lc.40 Influence of the surface treatment on the fretting corrosion behaviour of Ti6AI4V (Ref. 45)
Total Weight loss Material Combination (!kg) Ti (!kg)
Untreated-untreated Untreated-nitrogen ion implanted Untreated-PVD coated with TiN Untreated-plasma ion nitrided PVD- PVD Plasma ion nitrided-plasma ion nitrided
2423 1295 1002
807 713 273
3925 1260 902 716 470 87
78.5 31.2 15.0 6.4 8.5 0.5
Testing conditions: • plate screw system with a micromotion of 100 IJ.m . • 14 days at 1 Hz for 1 200 000 cycles . • testing medium was calf serum solution.
Table lc.41 Influence of the surface treatment on the wear behaviour of Ti6AI7Nb as a result of a pin-on-disk test (Ref. 46)
Property
Wear factor (1O-7mm3/Nm )
Coefficient of friction Surface roughness Rz (!km) Wetting angle (0)
PVD coated with 3 pm TiN layer
2.111
0.078 0.159
47
Oxygen diffusion hardened (ODH)
(30 pm hardened surface)
1.353
0.051 0.330
49

~ ______________ B_IO __ L_O_G_IC_A __ L_P_R_O_P_E_R_T_IE_S ______________ ~I I 197
Table lc.42 Influence of ion implantation of nitrogen on the wear properties of commercially pure Ti and Ti6Al4V (Ref. 47)
Material Friction Couple Total Wear (mg) Friction Coefficient
cp-Ti* Untreated-untreated Nitrided-nitrided
4 hJ940°CIN2:H2=2:1 Ti6AI4V** Untreated-untreated
Nitrided-nitrided 4 hJ940°CIN2:H2=2:1
Nitrided-nitrided 6 hJ800°CIN2:H2=1:1
* Friction distance = 1257 m. ** Friction distance = 1885 m.
632.3 0.48 54.3 0.10
600.0 0.46 40.1 0.10
92.3 0.12
Table lc.43 Rate of formation of corrosion products for titanium and titanium alloys in Hank's solution during current-time-tests (Ref. 48)
Alloy Metal converted into compound (ng/cm2h)
cp-Ti Mechanically polished Chemically polished
Ti16Mo Ti5Ta
IC.7 BIOLOGICAL PROPERTIES
4.1 3.5 1.5 0.26
Table lc.44 Biocompatibility of cp-Ti and Ti alloys, survival rate of L132 cells incubated with powders (Ref. 49)
Metal Powder Concentration (mg/J) Survival Rate of Cells
cp-Ti Ti6Al4V Ti5AI2.5Fe Ti30Ta Ti30Nb
>400 >400 >400 >400 >400
>80%
Table lc.45 Influence of the implantation time (in vivo) on the surface roughness and peak-to-valley (P-V) height of Ti6Al4V femoral heads (Ref. 50)
Implantation Time
Before Implantation 85 months 110 months 124 months
Position R. (nm) P-V R. (nm) P-V R. (nm) P-V R. (nm) P-V
Anterior 43±10 370±72 58±50 746±509 250±147 2044±1178 86±81 812±763 Posterior 41±6 591±333 150±125 2281±1842 114±96 1175±778 142±131 1045±890 Medial 51±14 411±159 44±29 649±259 118±69 1224±731 412±11 401±125 Lateral 52±9 364±68 71±55 722±474 117±106 1195±1009 40±16 527±156

198 I ~I ____________ T_IT_A_N_I_U_M __ A_N_D_T_I_T_A_N_I_U_M __ A_L_L_O_Y_S __________ ~
IC.S TiNi - SHAPE MEMORY
Table lc.46 Properties of the alloy Ni45Ti (Ref. 37, 51, 52)
Above (= austenitic) Below (= martensitic) Transition temperature (55°C)
Density (glcm3)
Melting point eC) Young's modulus (GPa) Tensile yield strength (0.2%) (MPa) Ultimate tensile strength (MPa) Ratio yield/tensile strength Elongation at fracture (%) Electrical conductivity (S/m) Corrosion potential (mV) in 0.1 M NaCI pH 7
pH2 Passive current density (IJ.NcmZ)
in 0.1 M NaCI pH 7 pH 2
Breakdown potential (mV) in 0.1 M NaCI pH 7
pH 2
REFERENCES
83-110 621-793 827-1172 0.75-0.68
1-15
1. DTG Product Information, Germany 2. DIN 17850 (1990), Beuth.
6.4-6.5 1310
1-1.5
-431 -518
0.44 0.61
890 960
21-69 34-138 103-862
0.33-0.16 up to 60
3. Semlitsch, M., Staub, F. and Weber, H. (1985) Development of a Vital, HighStrength Titanium Aluminium-Niobium Alloy for Surgical Implants: Proc. 5th European Conf. on Biomaterials, Paris, Sept. 4-6, 1985.
4. DIN 17851 (1990), Beuth. 5. Steinemann, S.G., Mliusli, P.-A., Szmukler-MoncIer, S., Semlitsch, M., Pohler,
0., Hintermann, H.-E. and Perren, S.M. (1993) Beta-Titanium Alloy for Surgical Implants, Proc. of the 7th World Conf. on Titanium, pp. 2689-2696.
6. Mliusli, P.-A., Steinemann, S.G. and Simpson, J.P. (1984) Properties of surface oxides on titanium and some titanium alloys, in Proc. of the 6th World Conference on Titanium, Vol. 3, pp. 1759-1764.
7. DIN 17869 (draft), (1990), Beuth. 8. Specification Properties, IMI 367-alloy. 9. Microstructure Standard for titanium Alloy Bars, Technical Committee of
European Titanium Producers, Publication EITC2. 10. Breme, J. Wadewitz, V. and Burger, K. (1988) Verbund Titanlegierungen/
AlzOrKeramik fUr dentale Implantate - Entwicklung geeigneter Legierungen, in Verbundwerkstoffe - Stoffverbunde (ed. G. Ondracek), DGM 1988, pp. 123-130.
11. Breme, J., Biehl, V., Schulte, W., d'Hoedt, B. and Donath, K. (1993) Development and functionality of isoelastic Dental Implants of Titanium Alloys. Biomaterials, 14 (12), 887-892.

L-___________________ R_E_F_E_R_E_N_C_E_S __________________ ~I I 199
12. Hiilse, K., Kramer, K.-H. and Breme, J. (1989) Influence of Small Additions of Fe, Cr and Ni on the Recrystallisation Behaviour of cp-Ti. Proc. of the 6th Intern. Con! on Ti, Soc. Franc. de Metallurgie, 1675-1683.
13. Zwicker, U. (1974) Titan und Titanlegierungen, Springer-Verlag. 14. DIN 17864 (draft), (1990), Beuth. 15. Ramsdell, J.D. and Hull, E.D. (1960) Characterstics of cold-rolled and
annealed Ti, Bureau of Mines Rep. of Inv. 5656. 16. Breme, J. and Wadewitz, V. (1989) Comparison of Ti-Ta, Ti-Nb Alloys, J. of
Oral & Max. Implants, 4 (2), 113-118. 17. Breme, J., Zhou, Y. and Groh, L. (1995) Development of a titanium alloy suit
able for an optimized coating with hydroxyapatite, Biomaterials, 16, 239-244. 18. DIN 17860 (1990), Beuth. 19. Borowy, K.H. and Kramer, K.H. (1984) On the Properties of a New Titanium
Alloy (TiAI5Fe2.5) as Implant Material, in Proc. of the 5th World Con! on Ti, Vol. 2, 1381-1386.
20. Lanagan, J. (1988) Properties of plasma nitrided titanium alloys, Proc. of the 6th World Con! on Titanium, Vol. 4, pp. 1957-1962.
21. Thull, R (1979) Eigenschafien von Metallen, fUr orthopadische Implantate und deren PrUfung. Orthopiidie, 7, 29.
22. Breme, J. and Schmidt, H.-J. (1990) Criteria for the Bioinertness of Metals for Osseo-Integrated Implants, in Osseo-Integrated Implants, Vol. 1 (ed. G. Heimke), pp. 31-80.
23. Semlitsch, M. and Weber, H. (1992) Titanlegierungen fUr zementlose Hiiftprothesen, in Die zementlose Hilftprothese (E. Hipp, R Gradinger and R Asherl), Demeter Verlag, pp. 18-26.
24. Semlitsch, M. and Panic, B. (1994) 15 years of experience with test criteria for fracture-proof anchorage stems of artificial hip joints, in Technical Principles, Design and Safety of Joint Implants (eds G.H. Buchhorn and H.G. Willert), Hogrefe & Huber Publishers, pp. 23-36.
25. Kunze, E. (1988) Vergleichende Untersuchungen zum Langzeit-Ermiidungsverhalten von HUftgelenkprothesen an Luft und in NaCI-Losung. Metall, 2,140-145.
26. Reactive Metals Inc. Niles, Ohio, RMI-Titanium 1969. 27. Weinberg, I.G. and Hanna, I.E. (1957) an evaluation of the fatigue properties
of Ti and Ti-alloys, TML Rep. 77. 28. Mote, W.M. and Frost, RB. (1958) The engineering properties of commercial
Ti-alloys, TML Rep. 92. 29. Weltzin, RB. and Koves, G. (1968) Impact fatigue testing of Ti alloys. J. of
Materials, 3, 469-480. 30. ASM Metals Handbook (1961), Vol. 1: Properties and Selection of Metals. 31. Dittmar, C.B., Bauer, G.W. and Evers, D (1957) The effect of microstructural
variables and interstitial elements on the fatigue behavior of Ti and commercial Ti alloys, Mallory, Sharen Titanium Corp. AD-IlD726WADC-TR 56-304,95.
32. Liitjering, G. and Gysler, A. (1984) Fatigue, in Proc. of the 5th Can! on Ti, pp. 2065-2083.
33. Hempel, M. and HilInhagen, E. (1966) Dauerschwingfestigkeit der technischen Titanlegierungen TiA15Sn2.5 und TiAI6V4, Arch. ! Eisenhilttenwesen, 37, 263-277.

200 I IL-__________ T_I_T_A_N_I_U_M __ A_N_D_T_I_T_A_N_I_U_M_A __ L_L_O_Y_S __________ ~
34. Rtidinger, K. and Fischer, D. (1984) Relationship between primary alpha content, tensile properties and high cycle fatigue behaviour of Ti6AI4V, in Proc. of the 5th Conf on Ti, pp. 2123-2130.
35. Wagner, L. Gerdes, C. and Ltitjering, G. (1984) Influence of surface treatment on fatigue strength ofTi6A14V, in Proc. ofthe 5th Conf. on Ti, Vol. 4, 2147-2154.
36. Liu, H.W. (1956) Effect of surface finish on the fatigue strength of TiAI6V4-alloy, Dept. of Theoretical and Applied Mechanics, University of Illinois, T.u.AM. Rep. 533.
37. Geis-Gerstorfer, J., Weber, H. and Breme, J. (1988) Electrochemische Untersuchung auf die Korrosionsbestandigkeit von Implantatlegierungen. Z. ! Zahniirztl. Implantologie 4, (1), 31-36.
38. DIN 17851 (1990), Beuth. 39. Breme, J. (1988) Titanium and Titanium Alloys, Biomaterials of Preference,
in Proc. of the 6th World Con! on Ti, Vol. 1, pp. 57-68. 40. Fraker, AC, Ruff, AW. et al. (1983) Surface Preparation and Corrosion.
Behaviour of Titanium Alloys for Surgical Implants, in Titanium Alloys in Surgical Implants, ASTM STP796, (eds H.A Luckey and F.Kubli), pp. 206-19.
41. Breme, J., Wadewitz, V. and Ecker, D. (1986) Untersuchungen zum Einflu~ des Gefligezustandes auf das Korrosionverhalten der Implantatlegierung TiAI5Fe2, 5. Z. f Zahniirztl. Implantologie, Bd. II 32-37.
42. Gagg, c., Corrosion Characteristics of Ti15V3Cr3Sn3Al (Ti15-3) Alloy in a Physiological Environment.
43. Elagli, K., Traisnel, M. and Hildebrand, H.F. (1993) Electrochemical Behaviour of Titanium and Dental Alloys in Artificial Saliva. Electrochimica Acta, 38 (14), 1769-1774.
44. Wadewitz, V. and Breme, J. (1989) Titan-Legierungen flir dentale Implantate. Z. Zahniirztl. Implantol. V, 116-120.
45. Maurer, A, Brown, S.A and Merrit, K. (1992) Effects of Surface Treatments on Fretting Corrosion of Ti6AI4V, Proc. of the 4th World Biomaterials Congress, pp. 200.
46. Streicher, RM., Weber, H., Schon, Rand Semlitsch, M. (1991) Wet behaviour of different ceramic surfaces in comparison to TiN and OHD treated Ti6Al4V alloy paired with polyethylene, in Ceramics in Substitutive and Reconstructive Surgery (ed. P Vincenzini), Elsevier, pp. 197-205.
47. Hu, Y.-S .. Dai, D.-H. and Dong, Y.-L. (1988) The ion nitriding of titanium materials and its applications, Proc. of the 6th World Confer. on Titanium, Vol. 4, pp. 1801-1804.
48. Mears, D.C. (1977) Metals in Medicine and Surgery. International Metals Reviews, Review 218, June, 119-155.
49. Hildebrand, H.F. (1993) Biologische Aspekte beim Einsatz von Implantatwerkstoffen, DGM Hochschulseminar, Saarbrticken, Germany.
50. Easter, T.L., Graham, RM., Jacobs, J.J., Black, J. and LaBerge, M. (/994) Clinical Performance of Ti6Al4V Femoral Components: Wear Mechanisms vs. Surface Profile, Proc. of the 20th Annual Meeting of the Society for Biomaterials, pp. 185.
51. Ebel, B. (1990) Zur Biokompatibilitat von Implantatwerkstoffen, KfK 4476. 52. Tautzenberger, P. and StOckel, D. (1987) Vergleich der Eigenschaften von
Thermobimetallen und Memory-Elementen, 1,26-32.
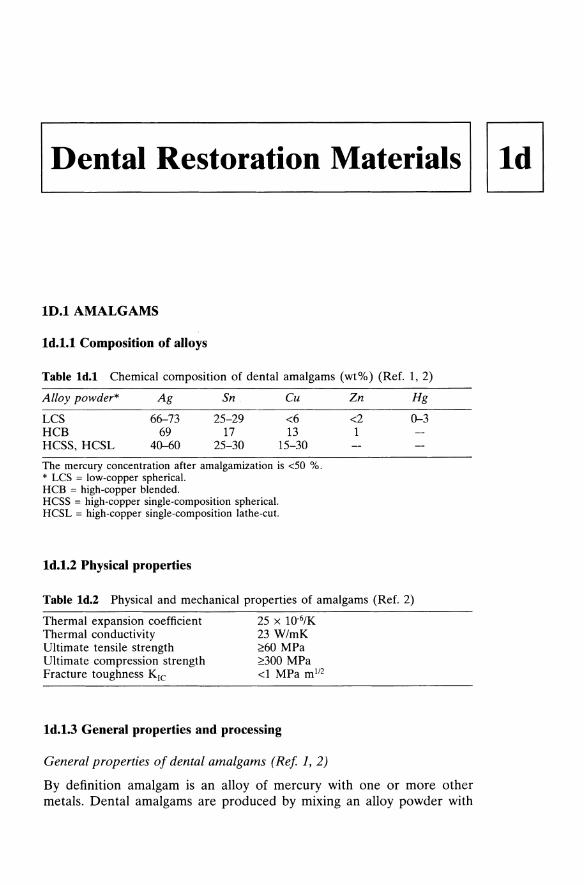
Dental Restoration Materials
10.1 AMALGAMS
Id.l.l Composition of alloys
Table ld.l Chemical composition of dental amalgams (wt%) (Ref. 1,2)
Alloy powder*
LCS HCB HCSS, HCSL
Ag
66-73 69
40-60
Sn
25-29 17
25-30
Cu
<6 13
15-30
The mercury concentration after amalgamization is <50 %. * LCS = low-copper spherical. HCB = high-copper blended. HCSS = high-copper single-composition spherical. HCSL = high-copper single-composition lathe-cut.
Id.l.2 Physical properties
Zn
<2 1
Hg
0-3
Table Id.2 Physical and mechanical properties of amalgams (Ref. 2)
Thermal expansion coefficient 2S x 1O·6/K Thermal conductivity 23 W/mK Ultimate tensile strength 2:60 MPa Ultimate compression strength 2:300 MPa Fracture toughness KIC <1 MPa ml12
Id.l.3 General properties and processing
General properties of dental amalgams (Ref 1,2)
By definition amalgam is an alloy of mercury with one or more other metals. Dental amalgams are produced by mixing an alloy powder with

202 I LI ___________ D_E_N_T_A_L __ R_E_S_T_O_R_A_T_IO __ N_M_A __ T_E_R_IA_L_S __________ ~
mercury. Usually the alloy powder is called 'amalgam' and the composition of amalgam denotes the composition of the powder. The two basic physical shapes of the alloy powder are:
1. irregular shaped particles (length 20-120 j..Lm, width 10-70 j..Lm, thick-ness 10-35 j..Lm) produced by lathe cutting.
2. spherical particles (diameter < 30 j..Lm) produced by atomization.
Amalgams for dental restorations are classified by their copper content in two basic types:
1. low-copper type, < 6 wt% Cu, used since the late 19th century. 2. high-copper type (non-gamma-2 amalgam), >6 wt% Cu, used since
1960.
The high-copper type is available in two alloy groups, classified by the mixture of different powder shapes:
2.1 mixed alloys consisting of 2.1.1 2/3 conventional lathe cutting + 1/3 spherical powder of Ag-Cu
eutecticum (total composition see Table 1d.1 composition of eutecticum: Ag30Cu)
2.1.2 1/3 conventional lathe cutting powder + 2/3 spherical powder (Ag25Sn15Cu)
2.2 one-component amalgams consisting of 2.2.1 ternary alloys, spherical shape 2.2.2 ternary alloys, irregular shape 2.2.3 quaternary alloys, non-spherical shape
During amalgamization the powder reacts with the mercury, producing different phases, depending on the amalgam powder:
1. low copper type: Ag3Sn + Hg ~ Ag2Hg3 + Sn7-8Hg + Ag3Sn "I phase "11 phase "12 phase "13 phase
2. high copper type, mixed alloy (a(i», reacts in two steps:
step one: Ag3Sn + Hg ~ Ag2Hg3 + Sn7-8Hg + Ag3Sn "I phase "11 phase "12 phase unreacted
step two: Sn7-8Hg - Ag-Cu ~ Cu6SnS + Ag2Hg3
"12 phase eutetic beads
The result of the amalgamization is a microstructure consisting of unreacted Ag3Sn and Ag-Cu surrounded by a layer of Cu6SnS and the "11
matrix. The microstructure of the one-component non-gamma-2 amalgams is similar to that of the mixed alloy except that the Cu6SnS particles are decomposed in the "11 phase and form no layer.

~ _______________ A_MA __ L_G_A_M_S ______________ ~I I 203
Processing of dental amalgams
For dental restoration (fillings) the mercury is mixed with the (amalgam) alloy immediately before application. The alloy is delivered in powder or pellet form. The amount of mercury after amalgamization must be below 50 wt%. Trituration is accomplished manually in a mortar with a pestle or more often automatically using a capsule of mercury with a given weight and an alloy pellet. The amalgam is placed in the cavity of the tooth in small portions which are pressed with a force of 40-50 N. On the surface of the filling a mercury-rich phase should appear, allowing a good bonding to the following portion. When the cavity is completely filled, the mercuryrich phase must be removed, and the filling can be modelled to the desired shape. 24 hours after the amalgamization the filling must be polished in order to achieve a smooth surface, resulting in a low corrosion rate.
Id.I.4 Mechanical properties
Table ld.3 Mechanical properties of dental amalgams (Ref. 2)
Amalgam * LCL LCS HCB HCSS, HCSL
ternary alloy HCSS, HCSL
quaternary alloy with indium
Ultimate compression Creep (%) (7 days strength (MPa) after amalgamization,
After 1 h After setting pressure 38 MPa)
120-170 380-450 2.5-3.5 140-180 380-450 0.3-1.5 120-330 410-460 0.2-1.7 230-320 460-540 0.002-0.3
210-410 430-480 0.06-0.1
* LCL = low-copper lathe-cut. LCS = low-copper sphericaL HCB = high-copper blended. HCSS = high-copper single-composition sphericaL HCSL = high-copper single-composition lathe-cut.
Id.I.S Corrosion and wear
Table ld.4 Average passive current density, range of passivity, corrosion and breakdown potential of a non-gamma-2 amalgam in artificial saliva (Ref. 3)
Passive Current Range of Corrosion Breakdown Density Passivity Potential Potential
Alloy (1lA cm-2) (mV vs. SCE) (mV vs. SCE) (mV vs. SCE)
Non-gamma-2 amalgam 1.5 -300 - +300 -400 300
Table ld.5 Repassivation rates in artificial saliva versus standard calomel electrode (Ref. 3)
Material Corrosion Potential Potential (m V) after (mV) lh 2h 36h
Non-gamma-2 amalgam -400 -408 -382 -290

204 I ~I ___________ D_E_NT __ AL ___ RE __ S_T_O_RA __ T_I_O_N_MA ___ TE __ R_IA_L_S __________ ~
Corrosion of amalgams
1. Corrosion of conventional amalgams The heterogeneous structure of conventional amalgams is responsible for high corrosion. The 'Y2 phase is the most active phase in electrochemical corrosion because it is less noble than 'Y and 'Yt. Therefore an anodic dissolution occurs. The corrosion products of the 'Y2 phase are
1.1 Sn2+ ions, in the presence of saliva Sn02 and Sn(OH)6CI 2.2 the released Hg reacts with particles of the 'Y phase.
2. Corrosion of the high copper type amalgams Because of the absence of the 'Y2 phase, the Cu6SnS phase is the electrochemically based phase. However, the total corrosion current in the non-gamma-2 amalgams is much lower than in the conventional types. Therefore, the amount of corrosion products· is much lower than in gamma-2 alloys. An additional advantage of these amalgams is the lack of mercury during corrosion.
Generally, to achieve a low corrosion in amalgams certain requirements must be fulfilled:
• a polished surface • no contact with gold (this would lead to a high corrosion of the amal
gams, setting mercury free and resulting in a reaction between gold and mercury).
Table Id.6 Rate of release of mercury vapour per unit area of different types of almagam dipped in an isotonic NaCI solution (pH = 6) (Ref. 4)
Alloy * LCL
HCB
HCSS, HCSL
New Old New Old New Old
Rate of Hg Release (ng/min mm2)
0.011 0.011 0.133 0.017 0.022 0.022
In-containing New 0.222 one component Old 0.350
LCL = low-copper lathe-cut. HCB = high-copper blended. HCSS = high-copper singlecomposition spherical. HCSL = high-copper single-composition lathe-cut. New = tested within 2 months after amalgamization. Old = tester after 1.5 years after amalgamization.
ID.2 NOBLE METALS
Id.2.1 Composition of alloys

Tab
le I
d.7
Che
mic
al c
ompo
siti
on o
f hi
gh g
old-
cont
aini
ng d
enta
l ca
st a
lloys
(w
t%)
(Ref
. 5,
6,
8)
Au
+ P
t Ty
pe*
Met
als
Au
Pt
Pd
Ir
Rh
Ag
Cu
Zn
Ta
In
R
e Fe
Sn
HG
C-1
88
.6
87.5
1.
0 0.
1 11
.5
HG
C-2
80
.5-8
1.2
75.7
-0.
3-1.
6-12
.3-
4.1-
0.4-
0-
79.3
1.
4 3.
3 15
.0
5.5
1.0
0.1
HG
C-3
78
.0-7
8.5
74.0
-0
-2
.0-
0.1
9.6-
7.0
-0.
9-74
.4
2.4
3.5
13.5
11
.5
1.0
HG
C-4
75
.5-8
0.0
65.5
-4.
4-0
.0-
0.1
0-
10.0
-8.
2-0.
5-71
.0
12.9
2.
0 1.
1 14
.0
10.0
4.
0
HG
C-1
-C
95.0
-97.
0 80
.0-
5.0-
3.3-
0.2
1.6
3.0-
85.0
11
.0
4.4
5.0
HG
C-2
-C
95.0
70
.0
7.5
15.0
0.
5 2.
0 5.
0
HG
C-3
-C
98.0
-99.
0 82
.6-
9.7-
0-
0.1-
0-
1.0-
86.0
10
.4
2.2
0.3
1.6
2.0
HG
C-4
-C
82.9
-97.
4 73
.8-
8.0-
5.0-
0.1
1.2-
0.3-
0-
0-
1.5-
0-
0-
0.5
84.4
9.
0 8.
9 9.
2 4.
4 2.
0 0.
2 2.
5 0.
2 0.
2 0.
8
HG
C =
hig
h go
ld-c
onta
inin
g (A
u +
Pt
met
als>
75
wt%
, Pt
met
als
= P
t, Pd
, Ir
, R
h, R
e, O
s).
1 =
soft,
2 =
med
ium
har
d, 3
= h
ard,
4 =
extr
a ha
rd.
c =
cera
mic
allo
y (b
ondi
ng w
ith c
eram
ic i
s po
ssib
le).

Tab
le I
d.8
Che
mic
al c
ompo
siti
on o
f lo
w g
old-
cont
aini
ng d
enta
l ca
st a
lloys
(w
t%)
(Typ
e 4:
ext
ra h
ard)
(R
ef.
5, 7
, 8)
Au
+ P
t Ty
pe*
met
als
Au
P
t P
d Ir
A
g C
u Sn
Z
n
In
Ga
Re
Ta
Fe
Co
LG
C-4
48
.0-
40.0
-0
-0
0.1
23.3
-7.
0-0
-0.
4-0
-66
.7
62.2
4.
4 9.
9 35
.0
12.0
1.
5 3.
5 5.
0
LG
C-4
-C
74.8
-43
.0-
29.0
-0.
1-0
-0
-0
-0
-0
-0
-0
-D-
O-
89.8
55
.1
38.5
0.
2 19
.5
0.3
0.5
9.0
1.5
0.2
0.1
0.2
2.8
* L
GC
-4 =
low
gol
d-co
ntai
ning
, ex
tra
hard
(60
wt%
$
Au
+ P
t m
etal
s $
75 w
t%).
L
GC
-4-C
= lo
w g
old-
cont
aini
ng,
extr
a ha
rd,
fusi
ble
(C =
cera
mic
allo
y (a
bon
ding
with
cer
amic
is
poss
ible
).

Tab
le I
d.9
Che
mic
al c
ompo
siti
on o
f A
gPd
and
Pd-
allo
ys (
wt%
) (R
ef.
5,8
)
Au
+ P
t Ty
pe
met
als
Au
Pt
Pd
Ir
Ag
Cu
Sn
Zn
In
R
u O
a O
e
AgP
d-1
29.5
2.
0 27
.5
70.0
0.
2 0.
3
AgP
d-4
29.5
-40.
0 ::;
;2.0
27
.4-3
9.9
0.1
52.0
-58.
5 0-
10.5
::;
;2.0
1.
5-4.
0 ::;
;2.0
Pd-
4-C
52
-88
0-17
::;
;1.0
25
-70
7.2-
38.0
0-
11.6
1.
9-7.
5 ::;
;2.0
0-
4.0
::;;0
.8
0-7.
2 ::;
;0.5
Key
: se
e T
able
Id.
7.

208 I I
DENTAL RESTORATION MATERIALS
Id.2.2 Physical properties
Table Id.lO Physical Properties of precious dental alloys (Ref. 5, 8)
Melting Mean Temperature Coefficient of Young's
Density (interval) Expansion Modulus Alloy (g/cm3) (0 C) (1(J6/K) 25-600°C (CPa)
HGC-l 17.2 1030-1080 HGC-2 16.1-16.4 900-1040 92-95 HGC-3 15.6-15.8 900-975 HGC-4 15.6-16.8 900-1000 98-109 HGC-I-C 18.3-18.6 1090-1370 14.1-14.8 HGC-2-C 17.3 1285-1370 13.6 HGC-3-C 18.4-19.5 1045-1220 14.2-14.7 100-105 HGC-4-C 16.7-18.1 900-1260 14.0-16.8 102-113 LGC-4 12.1-14.1 770-1065 94-106 LGC-4-C 14.0-14.8 1150-1315 13.8-14.8 AgPd-l 11.1 AgPd-4 10.6-11.1 950-1150 Pd-4-C 11.2-12.2 1100-1290 14.0-15.4 122-126
Key: see Table Id.7.
Id.2.3 Processing of Precious Metal Alloys (Ref. 2, 5, 8)
Casting
Precious metal alloys are normally cast by means of the lost wax process. The well-known method of wax modelling is applied. For the commonly used casting procedure, centrifugal and vacuum pressure casting, the alloys can be heated by the following methods:
• resistence • propane/oxygen torch (reducing flame zone) • HF induction • electrical arc
The alloys are melted in graphite or ceramic crucibles. After removal of the crucible the alloys can if required be hardened. After casting or brazing the alloys are descaled. Mechanical cleaning can be carried out with rotating tools, ceramic grinding wheels or rubber polishers.
Heat Treatment
Depending on the type of alloy and its application, the dental alloys are heat treated. After the casting the alloys are quenched. A homogenization at 700°C followed by rapid cooling should be carried out in order to

NOBLE METALS I I 209 L-____________________________________________________ ~
decompose grain segregations, especially in alloys containing platinum. After a cold deformation the alloys should be stress-relieved. Precipitation hardening is performed by:
• slow cooling from 700°C to room temperature • cooling from 450 to 250°C in 30 minutes, followed by quenching • heating between 350 and 450°C for 15 minutes, followed by quenching
Table Id.12 gives the recommended heat treatments for various noble metal alloys used in dental restoration.
Brazing
Brazing can be carried out with a torch or in a furnace. For larger surfaces furnace brazing is preferable. The best strength properties are obtained with a solder gap of 0.05 to 0.2 mm between the surfaces. Table Id.ll shows the chemical composition and the brazing temperatures of various filler metals.
Bonding with Ceramics
Precious metal alloys are cast by the lost wax process. After removal of the crucible with carbide tools the castings are sand-blasted with alumina (100-150 J..Lm, pressure 2 bar) to roughen the surfaces and to provide by increasing the surface an improvement in the adhesion strength. After cleaning with water and hot steam an additional cleaning of the alloys is performed by annealing for 10 minutes at 980°C. The bonding procedure takes place in the temperature range of 800-900°C. After bonding the surface must be carefully cleaned in order to provide good corrosion resistance. The final step of the process is a polishing operation with rotating cotton or wool buffers and a small amount of polishing paste.
Table Id.ll Chemical composition (wt%) and brazing temperatures of various filler metals (Ref. 5, 8)
Filler Metals Brazing for Brazing Temp. (0 C) Au Pt Pd Ir Ag Cu Zn In Re
HGC, LGC 700-840 50- ~19 ~1.0 ~O.1 8.0- 0- 6.0- ~2.0 ~0.1 73 28 9.0 14
AgPd 760-820 73 0.9 1.0 0.1 13.0 12.0
HGC-C, 700-1120 50- ~1.9 ~1.0 ~O.l 10.0- 0- 12.0- ~2.0 ~0.1 LGC-C 73 28.0 5.0 14.0
Pd-4-C 1030-1120 50- ~1.9 ~1.0 10.0- 3.0- 12.0- ~2.0 73 28.0 5.0 14.0
Key: see Table 1d.7.
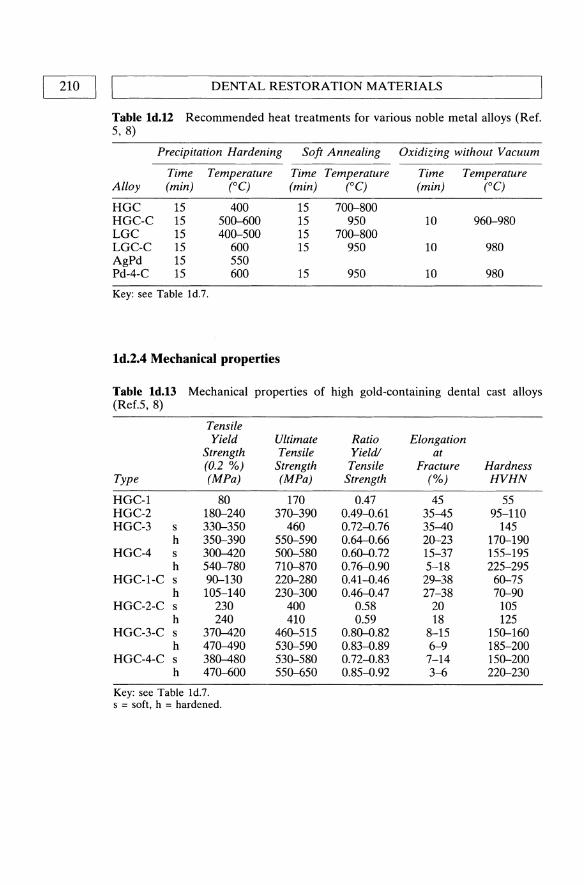
210 II L ___________ D_E_N_T_A_L __ R_E_S_T_O_R_A_T_IO __ N_M_A __ T_E_R_IA_L_S __________ ~
Table Id.12 Recommended heat treatments for various noble metal alloys (Ref. 5,8)
Precipitation Hardening Soft Annealing Oxidizing without Vacuum
Time Temperature Time Temperature Time Temperature Alloy (min) (0C) (min) (0C) (min) (0C)
HGC 15 400 15 700--800 HGC-C 15 500--600 15 950 10 960--980 LGC 15 400--500 15 700--800 LGC-C 15 600 15 950 10 980 AgPd 15 550 Pd-4-C 15 600 15 950 10 980
Key: see Table Id.7.
Id.2.4 Mechanical properties
Table Id.13 Mechanical properties of high gold-containing dental cast alloys (Ref.5,8)
Tensile Yield Ultimate Ratio Elongation
Strength Tensile Yield! at (0.2 %) Strength Tensile Fracture Hardness
Type (MPa) (MPa) Strength (%) HVHN
HGC-l 80 170 0.47 45 55 HGC-2 180--240 370--390 0.49-0.61 35-45 95-110 HGC-3 s 330--350 460 0.72-0.76 35-40 145
h 350--390 550--590 0.64-0.66 20--23 170--190 HGC-4 s 300-420 500--580 0.60--0.72 15-37 155-195
h 540--780 710--870 0.76-0.90 5-18 225-295 HGC-I-C s 90--130 220--280 0.41-0.46 29-38 60--75
h 105-140 230--300 0.46-0.47 27-38 70--90 HGC-2-C s 230 400 0.58 20 105
h 240 410 0.59 18 125 HGC-3-C s 370-420 460--515 0.80--0.82 8-15 150--160
h 470-490 530--590 0.83-0.89 6-9 185-200 HGC-4-C s 380-480 530--580 0.72-0.83 7-14 150--200
h 470--600 550--650 0.85-0.92 3-6 220--230
Key: see Table Id.7. s = soft, h = hardened.

NOBLE METALS I I 211 L-____________________________________________________ ~
Table Id.14 Mechanical properties of low gold-containing dental cast alloys (Ref.: 5,8)
Tensile Yield Ultimate Ratio Elongation
Strength Tensile Yield! at (0.2 %) Strength Tensile Fracture Hardness
Type (MPa) (MPa) Strength (%) VHN5
LOC-4 s 310-400 480-510 0.65--0.78 18-43 155-170 h 555-830 640-890 0.87--0.93 3-13 220-275
LOC-4C s 310-590 570-790 0.54--0.75 11-26 180-250 h 550-700 710-900 0.77--0.78 6-18 235-285
Key: see Table Id.7. s = soft, h = hardened
Table Id.IS Mechanical properties of AgPd and Pd-alloys (Ref.: 5, 8)
Tensile Yield Ultimate Ratio Elongation
Strength Tensile Yield! at (0.2 %) Strength Tensile Fracture Hardness
Type (MPa) (MPa) Strength (%) VHN5
AgPd-l 80 230 0.35 33 55 AgPd-4 285-595 510-950 0.56--0.63 3-31 140-310 Pd-4-C 340-630 630-900 0.54--0.70 8-30 180-285
Key: see Table Id.7.
Id.2.S. Corrosion and wear
Table Id.16 Polarization current (i) and polarization resistance (Rc) of gold in 0.9% NaCl and in 0.9% NaCl with a stable redox system [Fe(CN)/ / Fe(CN63'j at 37 °C corresponding to the potential of the body fluid of 400 mV (Ref. 7, 12)
Material i (fJ..AIcm2) Rc (kflcm2)
0.9% NaCl saline + redox
Au 0.009 1100 0.28
Table Id.17 Average passive current density, range of passIvity, corrosion and breakdown potential of a high gold containing alloy (HOC) in artificial saliva (Ref. 3)
Alloy
HOC
Passive Current Density
(f-lA cm·2)
1.5
Range of Passivity
(mV vs. SCE)
-100 - +400
Corrosion Potential
(mVvs. SeE)
-137
Breakdown Potential
(mVvs. SCE)
400

212 I LI ___________ D_E_N_T_A __ L_R_E_S_T_O_R_A_T_IO __ N_M_A __ T_E_R_IA_L_S __________ ~
Table Id.18 Repassivation rates in artifical saliva versus standard calomel electrode (Ref. 3)
Material
HGC
Corrosion Potential (mV)
-137
ID.3 CoCr-ALLOYS
See Chapter 1b, CoCr-alloys.
10.4 NiCr-ALLOYS (REF. 9, 10, 11)
Potential (mV) after 1 h 2 h 36h
-48 -26 -26
NiCr-alloys are difficult to classify because of the wide range of the chemical composition, as shown in Table 1d.19. The NiCr-alloys in dentistry are generally used for porcelain veneered and unveneered crowns, fixed and removable partial dentures and bridgework. As the processing is similar to that of the CoCr-alloys, it is not described here (see Chapter 1b.3). The requirements for these specific applications determine the chemical composition. The corrosion resistance of the NiCr-alloys is provided by the chromium content which produces a passive oxide layer on the surface. Beryllium is added as a solid solution strengthener and supports the self-fluxing at the porcelain veneering temperature. It is also responsible for the good chemical bonding to the porcelain. As it lowers the melting temperature, beryllium also improves the stability.
Aluminium also produces a passive oxide layer, aids in the bonding to the porcelain and strengthens the alloy due to the precipitation of AINi3•
Silicon lowers the melting temperature and, like manganese, acts as a deoxidizer. Molybdenum and niobium are added to improve corrosion resistance and, like iron, are used to adapt the thermal expansion coefficient to the coefficient of the porcelain.
The wide composition range results in an equally wide range of physical (Table 1d.20) and mechanical properties (Table 1d.21). The high rigidity and strength of these alloys as compared to that of the precious metal alloys make them suitable for the production of small prosthetic devices.

REFERENCES I Table Id.19 Chemical composition (wt%) of the NiCr-alloys used in dentistry Ref. 11)
Ni Co Fe Cr Mo Nb Ti W Be Ga Si C Others
58 0 0 12 0.5 0 0 0 0 0 0 ::;0.5 AI, Ce, B, Mn, Sn, Y, V,
82 2 9 26 16 7 3 4 1.5 7.5 3 Ta, La, Cu
Table Id.20 Physical and mechanical properties of NiCr-alloys used in dentistry (Ref. 11)
Melting interval Young's modulus Density
940-1430°C 170-220GPa 7.8-8.6 glcm3
Mean coefficient of linear thermal expansion between 25-600 °C 13.9-15.5 1O.6/K
Table Id.21 Mechanical properties of NiCr-alloys used in dentistry (Ref. 12)
Tensile Yield Strength (0.2%) (MPa)
255-800
REFERENCES
Elongation at Fracture (%)
3-25
Hardness (VHN5)
160-395
1. Cahn, R.W., Haasen, P. and Kramer, E.l. (eds) (1992) Materials Science and Technology, Vol. 14, VCH.
2. Combe, E. (1984) Zahniirztliche Werkstoffe, Hanser. 3. Elagli, K., Traisnel, M. and Hildebrand, H.F. (1993) Electrochemical
Behaviour of Titanium and Dental Alloys in Artificial Saliva. Electrochimica Acta, 38(14), 1769-1774. 881.
4. Berglund, A. (1993) An in vitro and in vivo study of the release of mercury vapor for different types of amalgam alloys. J. Dent. Res. 72 (5), 939-945.
5. Product information, Degussa, Germany. 6. DIN 13906-1 (=EN 21562, ISO 1562) (1990). Beuth. 7. DIN 13906-2 (invalid, replaced by DIN 28891) (1990). Beuth. 8. Product information, Wieland Edelmetalle, Germany. 9. Fraker, A.c., Corrosion of Metallic Implants and Prosthetic Devices, in Metals
Handbook, 9th Ed., Vol. 13: Corrosion, p. 1351. 10. Encyclopedia of Materials Science and Engineering, Vol. 2, (1986) Pergamon
Press, pp. 1057-1058. 11. NiCo-alloy producing industries. 12. Zitter, H. and Plenk, H. (1987) The Electrochemical Behaviour of Metallic
Implant Materials as an Indicator of their Biocompatibility. J. of Biomedical Materials Research, 21, 881.
I 213

01 L-__ C_o_m_p_o_s_it_e_m_a_te_r_i_al_s_-----l
L. Ambrosio, G. Carotenuto and L. Nicolais
2.1 TYPES OF COMPOSITES AND COMPONENT MATERIALS
Composites are combined materials created by the synthetic assembly of two or more components - a selected reinforcing agent and a compatible matrix binder - in order to obtain specific and advanced characteristics and properties. The components of composite do not dissolve or otherwise merge completely into each other, but nevertheless do act in concert. The components as well as the interface between them can usually be physically identified, and it is the behavior and properties of the interface that generally control the properties of the composite. The properties of a composite cannot be achieved by any of the components acting alone.
The composites can be classified on the basis of the form of their structural components: fibrous (composed of fibers in a matrix), laminar (composed of layers of materials), and particulate (composed of particles in a matrix). The particulate class can be further subdivided into flake (flat flakes in a matrix) or skeletal (composed of a continuous skeletal matrix filled by a second material). In general, the reinforcing agent can be either fibrous, powdered, spherical, crystalline, or whiskered and either an organic, inorganic, metallic, or ceramic material.
2.2 FIBRE TYPES AND PROPERTIES
A summary of the most important reinforcing filaments and their properties is presented in Tables 2.1-2.7.
Handbook of Biomaterial Properties. Edited by J. Black and O. Hastings. Published in 1998 by Chapman & Hall, London. ISBN 0 412 60330 6.

~ ___________ F_rn __ RE __ TYP ___ E_S_AND ____ P_R_o_PE_R_T_ffi __ S ____________ ~1 I 215
2.2.1 Glass fibers
Glass fibers are the most common of all reinforcing fibers for polymeric matrix composites. Their main advantages are low cost, high tensile strength, high chemical resistance and good insulating properties. On the other hand they display a low tensile modulus, a relatively high density comparated to the other fibers, a high sensitivity to wearing and a low fatigue resistance. Depending on the chemical composition of the glass they are commercially available in different grade: A, C, E, R, S. At one time 'A' or alkali glass was quite common as the basic material for glass fibre production. Today this has been virtually completely superseded by 'E' or electrical grade glass. E-glass is a very low alkali content borosilicate glass which provides good electrical and mechanical properties, coupled with good chemical resistance. Another glass produced in commercial quantities for fibers production is the C-glass, a special chemical resistant glass. This is used in the manufacture of surfacing tissues to provide additional chemical resistance over E-glass. For specific application 'R' and'S' glasses are available as fibers. These are high strength glasses used mostly for aerospace applications.
Table 2.1 Compositions and properties of various glasses (4)
Compound A C E R S
Si02 72.0 64.6 52.4 60.0 64.4 A120 3, Fe20 3 1.5 4.1 14.4 25.0 25.0 Cao 10.0 13.4 17.2 9.0 MgO 2.5 3.3 4.6 6.0 10.3 NazO, K20 14.2 9.6 0.8 0.3 B20 3 4.7 10.6 BaO 0.9

216 I I COMPOSITE MATERIALS
Table 2.2 Properties of fiberglass (2)
Grade of class Property A B E S
Physical properties Specific gravity 2.50 2.49 2.54 2.48 Mohs gravity 6.5 6.5 6.5
Mechanical properties Tensile strength, psix106 (MPa) At 72 of (22°C) 440 440 500 665
(3033) (3033) (3448) (4585) At 700 of (371 0C) 380 545
(2620) (3758) At 1000 of (538°C) 250 350
(1724) (2413) Tensile modulus elasticity at 72 of (22°C), 10.0 10.5 12.4
psix106 (GPa) (69.0) (72.4) (85.5) Yield elongation, % 4.8 4.8 5.7 Elastic recovery, % 100 100 100
Thermal properties Coefficient of thermal linear expansion, 4.8 4.0 2.8 3.1
in.lin.l°Fx10-6 (rnlrnl°C) (8.6) (7.2) (5.0) (5.6) Coefficient of thermal conductivity, Btu- 72
in.lhrlsq ftl°F (watt/motor K) (10.4) Specific heat at 72 OF (22°C) 0.212 0.197 0.176 Softening point, °F(°C) 1340 1380 1545
Electrical properties Dielectric strength, V Imil 498 Dielectric constant at 72 OF (22°C) At 60 Hz 5.9-6.4 5.0-6.4 At 106 Hz 6.9 7.0 6.3 5.1 Dissipation (power) factor at 72 OF (22 0C) At 60 Hz 0.005 0.003 At 106 Hz 0.002 0.003 Volume resistivity at 72 OF (22°C) and 500 V 1015 1016
DC, ~-cm
Optical properties Index of refraction 1013 lO" Acoustic Properties Velocity of sound, ft/sec (m/sec) 17,500 19,200
(5330) (5850)
2.2.2 Aramid fibers
The most common aramid fiber available is the Kevlar 49. These fibers are composed of a highly oriented crystalline polymer and present the highest tensile strength/weight ratio. On the other hand the disadvantages

L-_____________ FI_B_R_E __ TY __ P_E_S_A_N_D __ P_R_O_P_E_R_T_I_E_S ____________ ~I I 217
that they present are the low compressive strength, difficulty of manufacturing and a sensitivity to ultraviolet light and water. However, Kevlar fibers find applications in sporting goods.
Table 2.3 Thermal Properties of Kevlar 49 (8)
Property
Long-term use at elevated temperature in air, °C (OF) Decomposition temperature, °C (OF)
Tensile strength, MPa (Ksi) At room temperature for 16 months At 50°C (122 OF) in air for 2 months At 100°C (212 OF) in air At 200°C (392 OF) in air
Tensile modulus, OPa (103 Ksi) At room temperature for 16 months At 50°C (122 OF) in air for 2 months At 100 °C (212 OF) in air At 200°C (392 OF) in air Shrinkage, %/oC (%OF)
Thermal coefficient of expansion, 10-6 cm/cm °C Longitudinal, 0-100°C (32-212 OF) Radial, 0-100°C (32-212 OF) Specific heat at room temperature, J/gOC (Btu/lbOF)
Thermal conductivity at room temperature, J cm/sec m2°C (Btuin/hr ft2 OF)
Heat flow perpendicular to fibers Heat flow paraliel to fibers Heat of combustion, kJ/g (Btu/lb)
Table 2.4 Properties of Kevlar 29 (2)
Specific gravity 1.44 Tensile strength (OPa) 2.76 Tensile modulus (OPa) 58 Elongation (%) 4.0 Filament diameter (f-Lm) 12.1
2.2.3 Boron fibers
Value
160 (320) 500 (932)
No strength loss No strength loss
3170 2720
No modulus loss No modulus loss
113.8 (16.5) 110.3 (16.0)
4 x 10⁻⁴ (2.2 x 10⁻⁴)
-2 +59
1.42 (0.34)
4.110 (0.285) 4.816 (0.334) 34.8 (15,000)
These fibers are characterized by an extremely high tensile modulus coupled with a large diameter, offering an excellent resistance to buckling that contributes to a high compressive strength of the composites. Their high cost is due to the processing operations. For this reason boron fibers find application only in aerospace and military contexts.
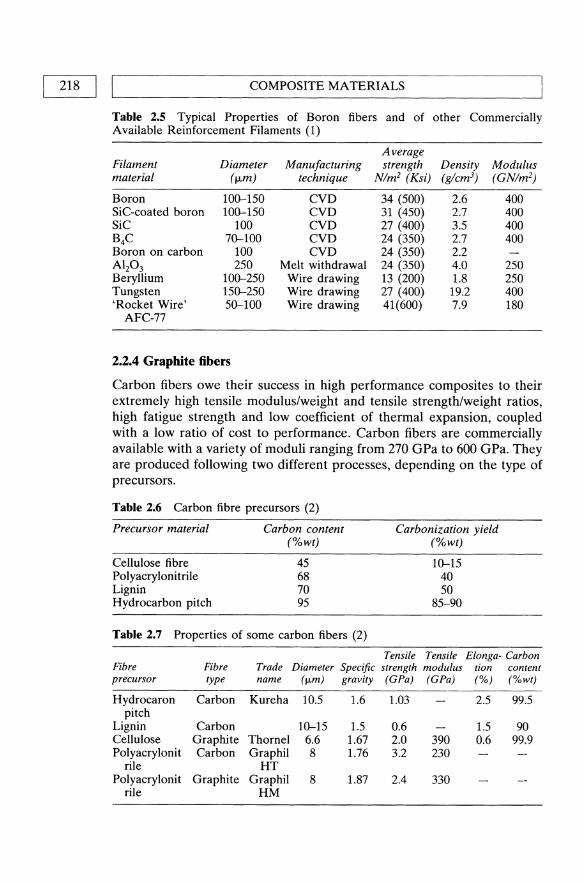
218 I LI ________________ C_O_M_P_O_S_IT_E __ M_A_T_E_R_I_A_L_S ______________ ~
Table 2.5 Typical Properties of Boron fibers and of other Commercially Available Reinforcement Filaments (1)
Average Filament Diameter Manufacturing strength Density Modulus material (f-Lm) technique Nlm2 (Ksi) (g/cm3) (GNlm2)
Boron 100-150 CVD 34 (500) 2.6 400 SiC-coated boron 100-150 CVD 31 (450) 2.7 400 SiC 100 CVD 27 (400) 3.5 400 B4C 70-100 CVD 24 (350) 2.7 400 Boron on carbon 100 CVD 24 (350) 2.2 Al20 3 250 Melt withdrawal 24 (350) 4.0 250 Beryllium 100-250 Wire drawing 13 (200) 1.8 250 Tungsten 150-250 Wire drawing 27 (400) 19.2 400 'Rocket Wire' 50-100 Wire drawing 41(600) 7.9 180
AFC-77
2.2.4 Graphite fibers
Carbon fibers owe their success in high performance composites to their extremely high tensile modulus/weight and tensile strength/weight ratios, high fatigue strength and low coefficient of thermal expansion, coupled with a low ratio of cost to performance. Carbon fibers are commercially available with a variety of moduli ranging from 270 GPa to 600 GPa. They are produced following two different processes, depending on the type of precursors.
Table 2.6 Carbon fibre precursors (2)
Precursor material
Cellulose fibre Polyacrylonitrile Lignin Hydrocarbon pitch
Carbon content (%wt)
45 68 70 95
Table 2.7 Properties of some carbon fibers (2)
Carbonization yield (%wt)
Tensile
10-15 40 50
85-90
Tensile Elonga- Carbon Fibre Fibre Trade Diameter Specific strength modulus tion content precursor type name (fLm) gravity (GPa) (GPa) (%) (%wt)
Hydrocaron Carbon Kureha 10.5 1.6 1.03 2.5 99.5 pitch
Lignin Carbon 10-15 1.5 0.6 1.5 90 Cellulose Graphite Thornel 6.6 1.67 2.0 390 0.6 99.9 Polyacrylonit Carbon Graphil 8 1.76 3.2 230
rile HT Polyacrylonit Graphite Graphil 8 1.87 2.4 330
rile HM

L-________________ M_A_T_R_I_X_M __ A_T_E_R_IA_LS ________________ ~I I 219 l
2.3 MATRIX MATERIALS
Polymer matrix resins bind the reinforcing fibers and fabrics together in composite structures. Resins also act as sizing, load distributors, and vibration dampeners in the composite structure. A wide variety of thermoset and thermoplastic resins are used in polymer composites. A summary of the most important materials used as composite matrix and their properties is presented.
2.4 THERMOPLASTIC MATRIX
Although many commercial applications for filled thermoplastics exist, use of thermoplastics in advanced composites is still in the developmental stage. In fact, the industry is still split on the use of thermoplastics for advanced composites. According to some, it is difficult to improve the rigidity, stability and thermal and chemical resistance of the thermoset resins currently available. Others believe that the majority of the thermoplastic resins available today not only possess the high-service temperature characteristics required, but also hold the potential of quicker and more economical processing once the existing problems are resolved. The various thermoplastics and their characteristics are described in the following paragraphs:
Polyamides, commonly referred to as nylons, are produced by condensation between diamines and diacids or by self-condensation of an amino acid. Like many other resins, the exact chemistry of polyamides can vary and, therefore, so can the final properties. However, all polyamides have low-service temperatures and low melting points.
Polyamideimides are marketed by Amoco Chemicals under the trade name Torlon. A polyamideimide is also a good candidate for the production of thermoplastic prepregs.
Polycarbonates are noted for an extremely high-impact strength in an unreinforced state. However, compared to such other crystalline polymers as PEEK, a polycarbonate does not bond well to reinforcing fibers. It also has poor chemical resistance, which can be greatly improved by alloying it with thermoplastic polyesters. Although only a small quantity of polycarbonate with carbon fiber reinforcement is used today, primarily for interior aircraft structures, polycarbonate is potentially one of the more promising matrix resins for advanced composites, especially in alloyed versions such as General Electric's Xenoy and Bayer's Makroblend.
Polyetheretherketones (PEEK) have excellent properties for use in advanced polymer composites, including low flammability, low smoke and toxic gas emission, and broad chemical and solvent resistance. PEEK

220 II ~ ________________ C_O_M_P_O_S_IT_E __ M_A_T_E_R_I_A_L_S ______________ ~
possesses a continuous service temperature of 200°C to 240°C (392°F to 464°F) and has a very high melting point of 334°C (633°F). PEEK also provides excellent abrasion resistance at its service temperature, radiation resistance, excellent fatigue and wear resistance and a relatively low specific gravity of 1.32. It is possible to process PEEK on conventional extrusion and molding equipment, and its highly crystalline nature responds well to fiber reinforcement.
Polyetherimides (PEl) have been commercially introduced by General Electric as ULTEM, and the company states that it could be a possible matrix for carbon fiber.
Polyether sulfones (PES) are also amorphous in structure. Although PES has poor resistance to solvents, it possesses several valuable properties. The resin is capable of providing thousands of hours of service at temperatures up to 180°C (356°F) and has very good load-bearing properties. It is dimensionally stable up to 200°C (392°F) and, like PEEK, possesses excellent flame resistance and favorable processing characteristics. In addition to thermoset polyimides, several thermoplastic polyimides are offered for high-temperature applications. Although difficult to process, these resins maintain favorable performance characteristics up to a higher temperature, 371°C (700°F), than their thermoset counterparts.
Polyphenylene sulfides (PPS), partially crystalline polymers, are produced by the reaction of p-dichlorobenzene and sodium sulfide. This polymer has metallic-like properties and responds well to reinforcement. PPS possesses good creep and good moisture resistance and a low coefficient of thermal expansion.
2.5 THERMOSETS MATRIX
The basic difference between thermoset and thermoplastic resins is the reaction heat. A thermoset resin is cured by the application of heat and often by the addition chemicals called curing agents. Once cured, the material is infusible, unsoluble and can softened or reworked with the addition of heat.
A thermoplastic, on the other hand, is capable of being repeatedly softened by addition of heat and hardened by decreasing temperature. The change occurring thermoplastic resin with the addition of heat is primarily physical, not chemical. This different provides one major advantage for thermoplastics: any scrap from fabrication can be reused.
Thermoset resins can vary greatly with respect to service temperature, solvent resist and other important characteristics. A description follows of the various thermoset resin their basic characteristics.

L-_________________ E_P_O_X_I_D_E __ R_E_SI_N_S __________________ ~I I 221
2.6 VINYL ESTER RESINS
Vinyl ester resins are thermosetting resins that consist of a polymer backbone with acrylate or methacrylate termination. The backbone component of vinyl ester resins can derived from an epoxide resins, polyester resins, urethane resin, and so on, but those base epoxide resins are of particular commercial significance.
Vinyl ester resins are produced by the addition of ethylenically unsaturated carbo acids (methacrylic or acrylic acid) to an epoxide resin (usually of the bisphenol epichlorohydrin type). The reaction of acid addition to the epoxide ring (esterification exothermic and produces a hydroxyl group without the formation of by-products. Appropriate diluents and polymerization inhibitors are added during or after esterification.
Epoxide resins that have been used to produce vinyl ester resins include:
• bisphenol A types (general-purpose and heat-resistant vinyl esters) • phenolic-novolac types (heat-resistant vinyl esters) • tetrabromo bisphenol A types (fire-retardant vinyl esters)
Vinyl ester resins contain double bonds that react and crosslink in the presence of free radicals produced by chemical, thermal or radiation sources.
2.7 EPOXIDE RESINS
Epoxide are materials which contain two or more glycidyl groups per molecule. The uncured resins range from free flowing liquids to high melting solids, which can be cross-linked by reaction with an appropriate curing agent.
Typical curing agents include primary and secondary amines, polyamides and organic anhydrides. Other curing agents used are the catalytic curing agents, such as the boron trifluoride complexes. No by-products are evolved during cure. The resultant cured resins are generally hard thermoset materials with excellent mechanical, chemical and electrical properties.
These materials can be conveniently divided into six classes of resins:
• bisphenol A based (e.g. diglycidyl ether of bisphenol-A (DGEBA» • glycidyl esters • glycidyl amines (e.g. tetraglycidyl amine of 4,4-diamino-diphenyl
methane) • novo lacs brominated resins (e.g. diglycidyl ether of tetrabromo
bisphenol A) • cycloaliphatic resins (e.g. Tetraglycidyl ether of tetraphenylene ethane)

222 I LI ________________ C_O_M_P_O_S_ITE ___ M_A_T_E_R_I_A_L_S ______________ ~
2.8 DILUENTS
Diluents are added to epoxide resins primarily to lower viscosity and thus to improve handling characteristics. They also modify the cured properties of the resin. Diluents can be divided into two classes: (a) the reactive diluents and (b) the non-reactive diluents.
2.8.1 Reactive diluents
• Butane-l,4-diol diglycidyl ether • n-Butyl glycidyl ether (nBGE) • Glycidyl methacrylate • Phenyl glycidyl ether (PGE) • 2-Ethylhexyl glycidyl ether (2EHGE) • Iso-octyl glycidyl ether (lOGE) • Diethylene glycol monobutyl glycidyl ether • Cresyl glycidyl ether (CGE) • p-t-Butylphenil glicidyl ether • Epoxide 7 (C8-ClO glycidyl ether) • Epoxide 8 (C12-C14 glycidyl ether) • Dibromocresyl glycidyl ether (BROC) • Dibromophenyl glycidyl ether (DER 599)
2.8.2 Non reactive diIuents
• Benzyl alcohol • Furfuryl alcohol • Dibutyl phthalate (DBP)
2.9 CURING AGENTS FOR EPOXIDE RESINS
These are known variously as curing agents, hardeners, activators or catalysts. They are required to convert liquid and solid epoxide resins into tough infusible thermoset polymers. The curing agents promote this curing reaction by opening the epoxide ring and become chemically bound into the resin in the process. Each of the curing agents for epoxide resins will now be discussed in turn.
2.9.1 Amine curing agents
Amine curing agents may be primary or secondary amines, aliphatic, alicyclic or aromatic. The reaction with an epoxide resin is an addition reaction where the amine links directly with an epoxide group to form a

CURING AGENTS FOR EPOXIDE RESINS I I 223 L-__________________________________________________ ~
combined polymer, with hydroxyl groups formed during the reaction. The amines commonly used are the following:
• Ethylenediamine (EOA) • Trimethylhexamethylenediamine (TMO) • Oiethylenetriamine (OTA) • 2-Hydroxyethyldiethylenetriamine (T) • Dipropylenetriamine (OPT A) • Triethylenetetramine (TETA) • Tetraethylenepentamine (TEPA) • Oiethylaminopropylamine (0 EAP A) • Oimethylaminpropylamine (0 MAP A) • m-Xylylenediamine (rnXDA) • N-Aminoethylpiperazine (AEP)
2.9.2 Anhydride curing agent
These consist of organic anhydrides and are used in roughly stoichiometric proportions with epoxide resins. The anhydride commonly used are the following:
• Phthalic anhydride (EPA) • Tetrahydrophthalic anhydride (THPA) • Methyltetrahydrophthalic anhydride (MTHPA) • Endomethylenetetrahydrophthalic anhydride (NA) • Hexahydrophthalic anhydride (HHPA) • Methylhexahydrophthalic anhydride (MHPA) • Trimellitic anhydride (TMA) • Pyromellitic dianhydride (POMA) • Oodecenylsuccinic anhydride (OOSA)
2.9.3 Accelerators for anhydride cured systems
Various accelerators can be used with epoxy/anhydride systems to promote cure. Some accelerators in use are:
• Benzyldimethylamine (BOMA) • Tris( dimethylaminomethyl)phenol • I-Methylimidazole (OY 070 from Ciba-Geigy) • N-Butylimidazole • 2-Ethyl-4-mathylimidazole • Triamylammonium phenate (OY 063 from Ciba-Geigy)
2.9.4 Polyamide curing agents
The polyamides used to cure epoxide resins are all reactive compounds with free amine groups. They may be amidopolyamines, aminopolyamides

224 I IL-______________ C_O __ M_P_O_S_IT_E __ M_A_T_E_R_I_A_L_S ______________ ~
or imidazolines. They are mostly used in coating systems and in adhesive formulations. Some suppliers of polyamide curing agents are listed below:
• Ancamide (Anchor Chemical Co, Ltd) • Araldite (Ciba-Geigy Plastics & Additives Co.) • Versamid, Genamid, Synolide (Cray Valley Products Ltd) • Plastamid (Croda Resin Ltd) • Grilonit (Grilon (UK) Ltd) • Beckopox (Hoechst AG(Reichhold Albert Chemie AG)) • Euredur (Schering Chemicals Ltd) • Epikure (Shell Chemicals UK Ltd) • Cas amid (Thomas Swan & Co. Ltd) • Uracure (Synthetic Resins Ltd) • Thiokol (Thiokol Chemicals Ltd) • Wolfamid (Victor Wolf Ltd)
2.9.5 Other curing agents
Several other types of curing agent are used with epoxide resins for laminating applications or in moulding compounds. Examples of these curing agents are:
• Dicyandiamide (Dicy) • Boron trifluoride complexes • Boron trifluoride monoethylamine • 2-Ethyl-4-methylimidazole • N-n-Butylimidazole
2.10 POLYESTER RESINS
The basic materials used to make a polyester resin are a dibasic organic acid or anhydride and a dihydric alcohol.
2.10.1 Catalysts or initiators
Catalyst or initiators for unsaturated polyester resin system consist of organic peroxides. Some commercially available catalysts are:
• Diacyl peroxides (benzoyl peroxide, 2,4-dichlorobenzoyl peroxide, dilauroyl peroxide, diacetyl peroxide).
• Ketone peroxides (methyl ethyl ketone peroxide, cyclohexanone peroxide, acetylacetone peroxide, methyl isobutyl ketone peroxide).
• Hydroperoxides (t-butyl hydroperoxide, cumene hydroperoxide). • Dialkyl and diaralkyl peroxides (dicumyl peroxide, di-t-butyl peroxide,
t-butyl cumyl peroxide, 2,5-dimethyl-2,5-bis(t-butylperoxy)hexane).

~ _______________ LA __ M_I_N_A_T_E_P_R_O_P_E_R_T_I_E_S ______________ ~I I 225
• Peroxyesters (t-butyl peroxybenzoate, t-butyl peroxydiethylacetate, t-butyl peroxyester, t-butyl peroxyisononanoate, t-butyl peroctoate, dit-butyl diperoxyphthalate, t-buthyl peroxypivalate).
• Perketals (2,2-bis(t-butylperoxy)butane, l,l-bis(t-butylperoxy)cyclohexane, 1 ,l-bis( t -butylperoxy )-3,3,5-trimethylcyclohexane).
2.10.2 Accelerators or promotors
These are materials which when used in conjunction with an organic peroxide catalyst increase the rate at which that peroxide breaks down into free radicals. Some of the commercially available accelerators are:
• Cobalt accelerators: cobalt siccatolate, naphthenate or octo ate • Manganese accelerators: manganese salts • Vanadium accelerators • Tertiary amine accelerators:
dimethyl aniline (used to accelerate diacyl peroxide catalysed system); diethylaniline (used to accelerate benzoyl peroxide catalysed system); dimethyl-p-toluidine (used to accelerate benzoyl peroxide catalysed system).
2.11 LAMINATE PROPERTIES
Current attitudes regarding composite materials emphasize the relationship of structural performance to the properties of a ply. A 'ply' is a thin sheet of material consisting of an oriented array of fibers, embedded in a continuous matrix material. These plies are stacked one upon other, in a definite sequence and orientation, and bonded together yielding a laminate with tailored properties. The properties of the laminate are related to the properties of the ply by the specification of the ply thickness, stacking sequence, and the orientation of each ply. The properties of the ply are, in turn, specified by the properties of the fibers and the matrix, their volumetric concentration, and geometric packing in the ply. Generally, the material is preformed and can be purchased in a continuous compliant tape or sheet form which is in a chemically semicured condition. Fabrication of structural items involves using this 'prepreg' material, either winding it on to a mandrel or cutting and stacking it on to a mold, after which heat and pressure or tension is applied to complete the chemical hardening process.
The basis for engineering design of a such material is then the properties of a cured ply or lamina as it exists in a laminate. This ply is treated as a thin two-dimensional item and is mechanically characterized by its stress-strain response to: (i) loading in the direction of the filaments, which exhibits a nearly linear response up to a large fracture stress; (ii) loading
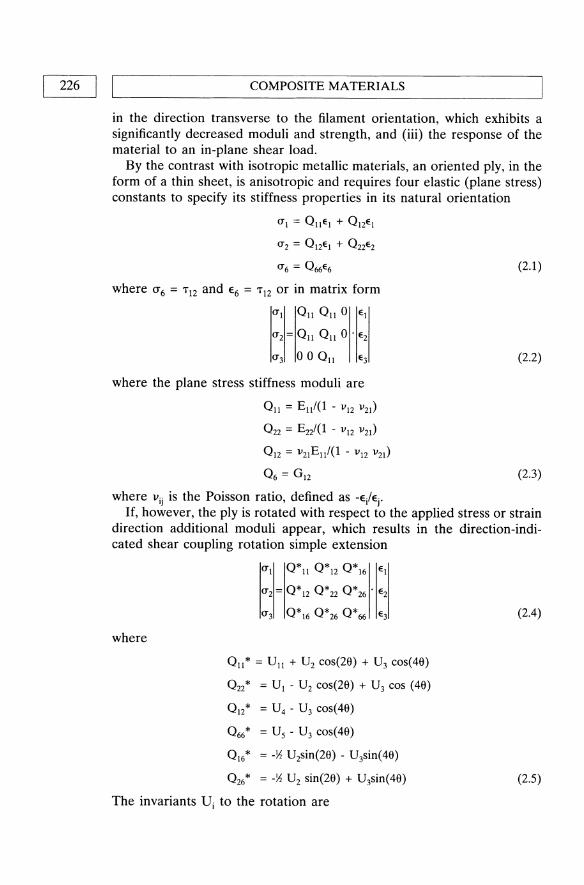
226 I IL-_______________ C_O_M_P_O_S_IT_E __ M_A_T_E_R_I_A_L_S ______________ ~
in the direction transverse to the filament orientation, which exhibits a significantly decreased moduli and strength, and (iii) the response of the material to an in-plane shear load.
By the contrast with isotropic metallic materials, an oriented ply, in the form of a thin sheet, is anisotropic and requires four elastic (plane stress) constants to specify its stiffness properties in its natural orientation
0"1 = 011EI + 012EI
0"2 = 012EI + 022E2
0"6 = 066E6
where 0"6 = T12 and E6 = T12 or in matrix form
0"1 0 11 0 11 0 EI
0"2 = 0 11 0 11 0 . E2
where the plane stress stiffness moduli are
0 11 = E11/(1 - Vl2 V21)
0 22 = E 2z1(1 - V 12 V21 )
0 12 = V2IE11/(1 - VI2 V21)
0 6 = °12
where v ij is the Poisson ratio, defined as -E/Ej .
(2.1)
(2.2)
(2.3)
If, however, the ply is rotated with respect to the applied stress or strain direction additional moduli appear, which results in the direction-indicated shear coupling rotation simple extension
where
0"1 0*11 0*12 0*16 El
0"2 = 0*12 0*22 0*26 . E2
0"3 0*160*260*66 E3
0 11* = V 11 + V 2 eos(2S) + V3 eos(4S)
0 22* = VI - V 2 eos(2S) + V3 eos (4S)
01z* = V 4 - V3 eos(4S)
0 66* = Vs - U3 eos(4S)
0 16* = -~ V2sin(2S) - V3sin(4S)
0 26* = -~ U2 sin(2S) + V3sin(4S)
The invariants U i to the rotation are
(2.4)
(2.5)

LAMINATE PROPERTIES I I 227 ~----------------------------------------------------~
VI = l1! (3QII + 3Q22 + 2Q\2 + 4Q66)
V 2 = ~ (QII - Q22)
V3 = l1! (QII + Q22 - 2QI2 - 4Q66)
V 4 = l1! (QII + Q22 + 6Q\2 - 4Q66)
Vs = l1! (QII + Q22 - 2QI2 + 4Q66) (2.6)
In addition, lamination can result in up to 18 elastic coefficients and increased deformational complexities, but the additional coefficients can all be derived from the four primary coefficients using the concept of rotation and ply-stacking sequence. These complications are the result of geometric variables. If the laminate is properly constructed, the in-plane stretching or stiffness properties can still be specified by four elastic coefficients. We shall consider laminates of this nature.
Note that both short and continuous fibers are handled in the same manner. These calculations, while tedious, are analytically simple. The 'plane stress', the Qij terms, are employed because lamination neglects the mechanical properties through the ply thickness. These stiffnesses are sometimes regrouped into new constants called 'invariants', the Vi terms, for analytical simplicity. To compute the properties of the laminate one then sums the ply (hk) properties through the thickness of the laminate, weighted by the thickness (hk) of each oriented ply
N
A· = I (Q")k hk I) k=1 I)
For a balanced (same number of ±6) and symmetrical system (+6 or -6 at same distance above and below the midplane) the laminate solution is
All = VI + V 2 cos(26) + V3 cos(46)
A22 = VI - V 2 cos(26) + V3 cos(46)
AI2 = V 4 - V3 cos(49)
A66 = Vs - V3 cos(46) (2.7)
Note the inverted terms Ajj yield the required elastic properties of the laminate in terms of the individual ply properties Ell' E12 and G 12.
El1 = (AIIA22 - A212)/A22
E22 = (Al1A22 - A\2)/AII
v\2/EII = A\2/(AIIA22 - A212) G12 = A66 (2.8)
These calculations have been thoroughly tested and agree closely with experiment. The circles and squares are the experimental points and the lines are the theoretical predictions for a nylon fiber reinforced rubber. The angle ply laminate is predicted from the ply properties. The

228 I LI ________________ C_O_M_P_O_S_IT_E __ M_A_T_E_R_I_A_L_S ______________ ~
ply properties are in turn correlated with the transformation equations and the micromechanics. The micromechanics employed in this demonstration are based upon the 'self-consistent method' developed by Hill (8). Hill rigorously modeled the composite as a single fiber, encased in a cylinder of matrix, with both embedded in an unbounded homogeneous medium which is macroscopically indistinguishable from the composite. Hermann (9) employed this model to obtain solution in terms of Hill's 'reduced moduli'. Halpin and Tsai (10) reduced Hermann's solution to simpler analytical form and extended its use for a variety of filament geometries
(2.9)
where
TJ = (t/tm - 1 )/(P(/Pm + ~)
~ = (e/d); ~G12 = 1 ~G23 = 1/(3 - 4vm )
P = En' G 12, G23; p( = E(, G(; Pm = Em. Gm (2.10)
These equations are suitable for single calculation and were employed previously for the single ply and angle ply properties. The short fiber composite properties are also given by the Halpin-Tsai equations where the moduli in the fiber orientation direction is a sensitive function of aspect ratio (l/d) at small aspect ratios and has the same properties of a continuous fiber composite at large but finite aspect ratios.
If the ply is used in the construction of a balanced and symmetrical 0/90 laminate and is mechanically tested, bilinear stress/strain curve is obtained, and the stiffness is the sum, through the thickness of the plane stress stiffness of each layer. As the laminate is deformed each ply possesses the same in-plane strain, and when the strain on the 90 layers in the laminate prevents the 90° layer from carrying its share of the load, Qj(900)=0. This load is transferred to the unbroken layers, the 0° layers for our illustration, and results in a loss of laminate stiffness or modulus. Continual loading will ultimately produce a catastrophic failure of the laminate when the strain capability of the unbroken, 0°, layers is exceeded. For a 0/90 construction, employing glass/epoxy material, the ratio of the ultimate failure stress to the crazing stress is 6.1. Note a change in stiffness as the 90° and then the 45° layers fail, and the correspondence of the theoretical ultimate strength of 356 MPa with the experimental results of 346 MPa. While the strain for transverse ply failure is constant from laminate to laminate, the stress required to craze the system as well as cause final failure is a function of laminate geometry, because the

~ ______________ C_O_M_P_O_S_I_T_E_F_A_B_R_I_C_A_T_IO_N ______________ ~I I 229
construction of the laminate specifies the stiffness properties (crazing stress = stiffness x allowable transverse ply strain). It must be noticed that the area under the stress/strain curve is proportional to the impact energy. Therefore, lamination permits the engineer to tailor a fixed prepreg system to meet the conflicting stress/strain demands at different points in a structure. A further point, the crazing stress threshold is generally at or below the creep fracture or fatigue limit for all classes of composites (for glass/epoxy the fatigue limit lies between 0.25 and 0.30 of static ultimate strength). Boron and graphite are fatigue insensitive filaments, thus no fatigue damage is realized below first ply failure.
Thus, the material properties of a laminate are specified in terms of the ply engineering moduli, Ell' E22, V12 and G12; the engineering strains to failure, E), E2 and E6; and the thermal expansion coefficients, E) and E2•
2.12 COMPOSITE FABRICATION
Various fabrications used in the reinforced plastics industry are discussed below:
2.12.1 Hand lay-up and spray-up procedures
In one of the simplest and labor intensive procedures, pigmented, catalysed resin is applied to the surface of the mold. This gel coat in room temperature lay-up techniques will end up on the surface of the finished composite (FRP). Catalysed resin-impregnated mat is then applied over the gel coat and this and subsequent layers are brushed or rolled to assure good contact between layers and to remove any entrapped air. This procedure is continued until the desired thickness of the composite is attained.
The assembled composite may be cured at room temperature or at elevated temperatures for faster cycles. This procedure, which was originally called contact molding, may be upgraded by the application of a vacuum or pressure bag placed over a Cellophane film on the final layer to reduce void formation in the composite. The laminate may also be built up by a spray-up process in which a mixture of chopped glass strands and catalysed resin is sprayed on the gel coat instead of resin-impregnated mat. In any case, the inner surface will be less smooth than the first layer formed by the gel coat. Tanks, boats and pipe may be fabricated by this technique.
2.12.2 Centrifugal casting
Fiber-reinforced plastic pipe (FRP) can be produced by rotating a mixture of chopped strand and catalysed resin inside a hollow mandrel. Because

230 I ~I ________________ C_O_M_P_O_S_IT_E __ M_A_T_E_R_I_A_L_S ______________ ~
of differences in specific gravity, there is a tendency for these composites to be less homogeneous than those produced by other techniques.
In addition to being available as continuous filaments and staple fibers in mats, fiberglass textiles are also available as biaxial, triaxial, knitted and three dimensional braided patterns. Many different resin matrices are in use but the emphasis in this chapter will be on unsaturated polyester and epoxy resins. While the strength and stiffness are controlled primarily by the reinforcements, the resinous matrix contributes to thermal conductivity and flexibility. The ultimate properties of these composites are based on a harmonious contribution of both the continuous and discontinuous phases.
2.12.3 Matched die molding
Matched die molding of a premix of chopped glass, roving, and catalyzed resin is used for relatively large scale production of reinforced articles. Uncured dough-like compositions are called bulk molding compounds (BMC). Uncured resin-impregnated sheets are called sheet molding compound (SMC). These compounds are supplemented by thick molding compounds (TMC) and XMC. TMC is produced continuously on a machine that resembles a 2 roll mill. XMC, in which the continuous impregnated fiber are arranged in an X-pattern, is produced on a filament winding machine.
Autoclave molding
Autoclave molding, the process of curing thermoset resins at elevated temperature and pressure in an inert environment, has an important role in the fabrication of continuous fiber reinforced thermoplastics. While most companies view thermoplastics as an alternative to traditional autoclave long-cycle processing, they have come to accept the following reasons for the autoclave processing of thermoplastic matrices:
• Availability • High temperature and pressure capability • Reduced tooling requirements • Uniform pressure distribution.
The dominant reason for the autoclaves' role in thermoplastics production is its availability. Aerospace first- and second-tier contractors, who conducted much of the developmental work in parts fabrication, all have autoclaves on hand.
While it may seem defeatist to use the autoclave for thermoplastic resins which undergo no chemical reaction and lend themselves to rapid fabrication, autoclave use offers other advantages.

COMPOSITE FABRICATION I I 231 L-______________________________________________________ ~
In the industry, many fabricators own autoclaves capable of processing high temperature thermosets (e.g. polyimides) at operating temperatures up to 800 OF and pressures of 150 to 200 psi; which can also accommodate high temperature thermoplastics such as PEEK, which is normally processed in the 700 to 750 OF range. One disadvantage, particularly for production-sized autoclaves, is the inability to finely control cool-down rate - a critical process step for the semicrystalline thermoplastics. This situation can be improved by implementing integrally cooled tooling.
Where high consolidation pressures are required, the autoclave can reduce tooling costs by eliminating the need for matched metal tooling, when compared to a molding process (e.g. compression molding or thermoforming). Less expensive tooling aids can be used for consolidation via the autoclave's pressurized environment. The autoclave also provides uniform pressure over the part's area and eliminates pressure distribution concerns associated with a matched tool in a press.
Thermoforming
Thermoforming offers vast potential for high volume thermoplastic composite parts fabrication. There are many thermoforming variations; but by basic definition, thermoforming is the heating of a reinforced thermoplastic matrix sheet or kit above the softening temperature, followed by forcing the material against a contour by mechanical (e.g. matched tooling, plug) or pneumatic (e.g. differential air or hydraulic) means. The material is then held and cooled sufficiently for shape retention, and removed from the mold. Thermoforming implies only those processes applicable to thermoplastic resins, and is often used in the same context as the term 'compression molding' which also applies to thermosets. In this section, the process is defined as the preheating of the lay-up or reconsolidated sheet, followed forming via a matched mold.
Phillips Petroleum has applied this technology to fabric reinforced Ryton (PPS) materials. A conveyorized infrared oven is used to rapidly preheat the lay-up to 600 OF in two to three minutes. The charge is quickly transferred to a preheated mold in a fast closing press for part forming. Total cycle times of one to three minutes are feasible with this automated approach.
High production rates can be achieved using thermoforming technology. However, it is difficult to form high quality continuous fiber reinforced thermoplastic parts with demanding geometries, due to the restricted movement of the fiber.
Du Pont's long discontinuous fiber sheet products with PEEK and J-2 resins provide easier fabrication of complex shapes. This product form is particularly attractive to helicopter manufacturers for the press forming of highly contoured secondary structure parts.

COMPOSITE MATERIALS
Transfer molding
Transfer molding is used for the manufacture of small components and is particularly useful with multi-cavity tools and where small inserts are to be moulded in. Materials used are polyester and epoxide dough moulding compounds, although a new liquid resin injection technique is reported.
Heated steel molds, preferably hard chrome plated, are used, which may be of multicavity design. Tooling costs are higher than for compression moulding since appropriate gates and runners must be included in the mould.
A pre-weighed quantity of DMC is placed in a heated transfer pot by hand. A punch or ram compresses the material and causes it to flow into the heated tool cavity where it cures. The tool is mounted between the platens of a press.
Factors to be considered with transfer molding are transfer and tool clamping pressures and transfer time. To reduce transfer time and increase overall efficiency the molding compound may be pre-heated in an oven or high frequency pre-heater such as a micro-wave oven.
Mold temperatures range from 155 to 170°C both for polyester and epoxide resin compounds, with molding pressures ranging from 5 to 100 MPa depending on the type of compound to be processed, mold design and temperature. Cure time in the mold (excluding pre-heat time) is usually of the order of 10-30 s per millimetre of wall thickness for both types of compound.
Injection molding
Injection molding, a technique used extensively for the processing of thermoplastic materials, has also been developed to process thermosetting resin systems. Due to high mould costs it is generally only suitable for the large scale production of small-to-medium sized components. Materials processed in this way are polyester and epoxy DMC and also phenolics, ureas, melamines and diallyl phthalate moulding compounds. These latter materials are generally more difficult to process than either polyester or epoxy DMC.
Thermoset moldings produced by injection moulding are used widely in the electrical and automotive fields, thus large production runs are common.
Injection molding has advantages over both compression and transfer molding in that the process is more automated and far higher production rates can be achieved. Although mould costs are higher than for compression molding, overall finished component costs are generally lower. With small weight components, scrap from runners can be high compared

[ COMPOSITE FABRICATION I I 233 L-____________________________________________________ ~
with compression molding but for large mouldings this becomes relatively insignificant. Injection molding is also better for thick parts since, with the pre-heating of the DMC before injection into the mold, shorter molding cycles are possible.
While injection molding machines designed specifically for processing thermoset materials are available, a number of manufacturers offer replacement screw and barrel assemblies and stuffer hoppers to convert conventional thermoplastic injection moulding machines to process thermosets.
Molding compound is transferred in the cold state by pressure from the material hopper into the main injection chamber. Here it can be preheated before injection into the heated mould tool. Injection, through a special nozzle, can be either by ram or screw pressure. If screw feed is used, the screw must be of the type designed to process thermosets as opposed to thermoplastics.
Early machines were designed with vertical clamping pressure on the mold but today horizontal machines are mostly used. Since thermosetting materials are liquid until gelation occurs, clamping pressure has to be maintained on the mould until the resin has cured. Unless this is done, excessive flash will form. Heated matched metal molds are used, which may be of multi-cavity design. These molds must be designed for use with thermosetting resins, taking into account the fact that thermoset moldings are harder, more rigid and less easily deformed than thermoplastics.
A typical temperature sequence for injection molding DMC would be: feed hopper and feed zone - ambient temperature; metering section 5~0°C; nozzle 80-90°C; mould temperature 135-185°C for polyester DMC or 160-22°C for epoxy DMC; injection pressure 80-160 MPa. Cure time is generally of the order of 10-20 s per millimetre of wall thickness. Very little finishing of moldings is necessary.
Where fully automatic molding machines are used, hydraulic ejection with perhaps a 'joggle' facility is necessary, since thermosets have a tendency to stick in the mold.
2.12.4 Filament winding
Filament winding is a technique used for the manufacture of pipes, tubes, cylinders and spheres and is frequently used for the construction of large tanks and pipework for the chemical industry. By suitable design, filament wound structures can be fabricated to withstand very high pressures in service. In general, products fabricated by filament winding have the highest strength to weight ratios and can have glass contents of up to 80% by weight.
The process is suitable for use both with polyester and epoxide resin systems and a variety of fibres including glass, carbon, aramid and metals,

234 I ~I ________________ C_O_M_P_O_S_lTE ___ M_A_T_E_R_I_A_LS ________________ ~
providing that these materials are available in continuous filament lengths. Glass fibre is by far the most common reinforcement used and will be used as the example in the description of the process.
Filament winding is basically a simple process, although numerous modifications have been developed to improve product quality. Moldings can be produced by either a wet lay-up process or from prepreg.
In recent years filament winding has been extended to the continuous production of pipe using a continuous steel band mandrel. In this way continuous lengths of pipe can be produced, with diameters ranging from about 0.3 to 3.5 m.
2.12.5 Wet lay-up
With the wet lay-up process glass rovings are drawn through a resin bath to impregnate them with resin. The impregnated rovings are then wound under tension round a rotating mandrel. Generally the feed head supplying the rovings to the mandrel traverses backwards and forwards along the mandrel.
The mandrel, which may be segmented for large diameter pipes, is generally wrapped with a release film, such as Cellophane, prior to wrapping with glass and resin. The mandrel may incorporate some means of heating the resin system, such as embedded electric heaters, or provision for steam heating. Alternatively, the fully wrapped mandrel and laminate may be transferred to a curing oven to effect cure.
In order to provide a resin-rich, corrosion resistant inner lining to the pipe, the mandrel may be wrapped with a surfacing tissue followed by one or two layers of chopped strand mat or woven tape prior to filament winding. This first layer is usually allowed to cure partially before winding commences to prevent the resin from being squeezed out into the main laminate.
The winding angle used during construction of pipes or tanks depends on the strength/performance requirements and may vary from longitudinal through helical to circumferential. Often a combination of different winding patterns is used to give optimum performance. Accurate fibre alignment is possible.
For pipe construction, steel mandrels are generally used. However, where cylinders or spheres are to be made, an alternative material has to be used so that it can be removed once the resin system has cured. In these cases the mandrel can be made from wax, a low melting metal alloy, or an inert plaster held together with a water soluble binder. Clearly, in these cases the mandrel can only be used once. Material choice for the mandrel will depend on the cure cycle needed for the resin system.
In addition to winding with continuous filament rovings, machines have been developed which permit winding with tapes or slit-width chopped

L-______________ C_O_M_P_O_S_IT_E __ F_A_B_R_IC_A __ T_IO_N ______________ ~I I 235
strand mat and woven rovings. These reinforcements may be used alone or combined with continuous filament rovings. Thus considerable design flexibility exists for the production of large simple shapes.
Improved chemical resistance can be achieved by the use of a thermoplastic or synthetic rubber liner. If the liner is sufficiently rigid it can be supported on a light frame and used as the mandrel, if not then it can be wrapped round the mandrel first. A grade of polypropylene is available which has a woven glass cloth partially rolled into one side to improve adhesion of the resin system (Celmar).
Dunlop has recently developed a new process for pipe production to produce pipes in the range 200-2000 mm diameter. Essentially the process is similar to conventional filament winding. A mandrel, suitably coated with release agent, is wrapped with an epoxide resin impregnated glass tape over this is wound a 150 mm high-strength steel strip angled to give 50% overlap. Epoxide resin system is applied to the steel strip to ensure that each layer is fully encapsulated. From three to 13 layers of steel may be applied to satisfy different pressure ratings. The pipe is finished by wrapping with further resin impregnated glass tape and the resin system cured. Pipe produced in this way has excellent corrosion resistance coupled with a high strength/weight ratio. It is said to provide up to 50% weight saving over conventional steel pipe.
Various processes are available for the 'on-site' construction of large filament wound storage tanks. By manufacturing these on site, transport problems are overcome and integral structures can be produced. With the various processes either horizontal or vertical mandrels are first constructed from preformed GRP sheets. These are then wrapped with resin impregnated glass rovings.
Filament wound vessels can be produced from prepreg tapes and rovings. This technique is often used with carbon fibre to reduce fibre damage during the winding operation and to permit the use of resin systems which cannot be handled by wet lay-up techniques. Here, it is essential to use a heated mandrel to melt the resin and hence displace air and consolidate and cure the laminate. Resin content of the laminate can be controlled more accurately with prepreg since the prepreg can be made with exactly the right resin content. The use of prepregs also makes for cleaner operation.
Filament winding has been used to provide a protective laminate on the outside of steel pressure pipes where external corrosion can take place. An example of this use is in the protection of the splash zone of steel riser pipes used on sea based oil and gas production platforms. Here, care has to be taken in the design of such a composite structure since the coefficient of expansion of the filament wound glass wrap can be lower than that of the steel core. If such a composite structure is produced using a heat cured resin system (say 120°C cure) and then SUbjected to subzero temperatures
236 I ~I ________________ C_O_M_P_O_S_ITE ___ M_A_T_E_R_I_A_L_S ______________ ~
in use, the steel pipe can shrink away from the laminate and permit entry of water by capillary action. Thus the object of wrapping the pipe to prevent corrosion can be defeated, since corrosion can then still take place under the laminate. once the bond has broken it can never be remade.
2.U.6 Centrifugal moulding
Centrifugal moulding or casting is a method used for making cylindrical objects with uniform wall thickness. It is mainly used for the production of large diameter pipes, up to 5 m in diameter, from either polyester or vinyl ester resin systems, although epoxide resin systems may also be used. Pipes produced in this way are void-free and smooth on both the inner and outer surfaces. Threaded sections can be molded into the external wall if required. More recently, a system has been developed for producing tapered and curved poles by centrifugal casting.
Molds need to be bored and polished to a mirror finish and of sufficient strength to withstand, without distortion, the high G-force exerted during spinning. A steam jacket or other means of heating may be built into the mould to cure the resin system, or alternatively hot air may be blown through the mold.
Release agents used include silicones, bake-on PTFE types or PV A, although silicones are generally preferred. If the exterior of the finished pipe is to be painted then a silicone release agent should not be used. Choice of resin system must depend on application and a heat cured resin may be used, particularly where chemical resistance is required. In addition, the process lends itself to the use of several different resin systems incorporated in the one pipe, such as an abrasion resistant outer skin, a general purpose centre and a chemically resistant inner skin. The resin system used should have some degree of flexibility to give good impact resistance to the pipe, coupled with good chemical resistance. To achieve both of these requirements in the one resin system may require a compromise in properties.
Various methods of fabrication can be used. With large diameter moulds, glass and resin can be applied by the hand lay-up technique using a slow gel resin system so that the whole mold can be coated and the mould spun before gelation of the resin takes place. Here, it is necessary to tailor the reinforcement to shape to avoid overlaps.
Alternatively, the reinforcement may be wrapped round a mandrel, inserted into the mould and then unwound onto the mould surface. The mandrel is removed before resin is injected into the mold. With this technique a faster gelling resin system may be used. Woven fabrics and chopped strand mat are suitable reinforcements.
A third method, capable of being fully automated, is generally preferred. Here, resin and glass are applied to the mold surface utilizing

COMPOSITE FABRICATION I I 237 L-____________________________________________________ ~
a travelling feeder arm fitted with a chopper and spray gun, which passes slowly backwards and forwards through the mold while the mold is rotated. The laminate can be built up in layers of 0.5-1 mm thickness per pass once the reinforcement and resin system have been placed in the mold it is rotated at up to 2500 revolutions per minute (rpm) depending on mold diameter, the larger the mould diameter the slower the speed. For example, with a 2 m diameter mould a rotation speed of about 180 rpm is used. At this speed the mould surface is rotating at about 68 km/h (42.4 mph).
After the main resin system has gelled, a chemically resistant topcoat may be applied while the mold is still rotating. Mold rotation is continued until all the resin has cured.
In all of the above techniques, a relatively flexible glass reinforced resin pipe is produced, with properties similar to some of those made by filament winding. To produce stiffer pipes a modification to the spray technique has been developed and is in use commercially. Stiffer pipes, particularly in the larger diameter range, offer considerable advantages in handling and installation and maintain their shape during installation.
With this modified process, which is fully automatic, the mold is coated with release agent and rotated at a suitable speed. The feeder arm is designed in such a way that it can deliver programmed amounts of resin, chopped glass and a filler such as sand, to the mold surface as it moves in and out of the mold. In this way a layer of abrasion resistant sand filled resin system can be applied to the mold surface over this is applied a layer of glass reinforced resin. By suitable design of the chopper unit, fibre orientation can be controlled. Next a layer of sand filled resin is applied followed by a further layer of glass reinforced resin. Depending on the type and size of pipe to be produced, several more layers of GRP alternated with filled resin may be added. Finally, the inner surface is coated with a suitable chemically resistant layer of resin, which may be lightly filled or reinforced, to give a smooth corrosion resistant lining.
The equipment used can be programmed to feed materials to the mould to build up the pipe wall thickness at a rate of between 0.5 and 1 mm per pass and to compact the materials by centrifugal force throughout the whole production cycle once the final layer of resin has been applied, hot air is passed through the mold to assist curing of the resin system. The mould is cooled to ambient temperature to assist removal of the finished pipe, which is pushed out using a hydraulically operated ram. Using this technique, rigid hard wearing pipes can be produced, tailored to meet end user requirements. This is a simplified version of the pipes produced commercially, to illustrate pipe construction. In practice several more layers of glass and sand filled system may be incorporated in the pipe wall. A range of bends and joints is also available to meet most needs.

238 I I L-____________________________________________________ ~ COMPOSITE MATERIALS
In the Usui process for producing tapered pipes, the glass fibre reinforcement is wound round a tapered mandrel to make a preform. This is inserted into the mould in the centrifugal machine and the mandrel removed. Resin is poured in and the mold tilted to a pre-determined angle and then rotated until the resin has cured.
To produce a curved tapered pipe, a flexible mold is used. This is bent to the required shape once the preform has been placed in position. It is also claimed that base plates can be simultaneously molded on by this method. These base plates are first preformed and then inserted into the mold where they become firmly bonded into the pole. Typical applications include poles for street lighting, flag poles and aerials.
2.U.7 Continuous sheet manufacture
For the purposes of this book, only those processes for which polyester resins and, to a limited extent, epoxide resins are used will be described. It should be noted, however, that the decorative laminates used in building and transport applications are in the main manufactured from melamine faced phenolic resin/paper laminates.
Several patented processes exist for continuous sheet production, all of which are similar in broad principle.
Resin and glass reinforcement are sandwiched between two sheets of release film, such as Melinex, Mylar or Cellophane and passed through rollers to consolidate the laminate before curing in an oven. Resin is applied to the release film either by spray or trickle process, care being taken to ensure that application is uniform. Glass reinforcement is laid in the resin and a second layer of release film applied. This sandwich is passed through a series of rollers to expel all air bubbles and consolidate the laminate to the correct thickness. During the next stage the laminate sandwich is either passed directly through an oven to produce flat sheet or through rollers or dies and then an oven to produce corrugated sheet. Once cured the sheet is trimmed to the required width and cut into suitable lengths. Depending on the process, corrugations may run longitudinally or transversely. Production speeds of up to 12 m/min are possible.
To produce clear sheeting the refractive index of the resin system must match that of the glass reinforcement. For this reason special resins have been developed which match the refractive index of E-glass. For translucent sheeting A-glass may be used but, due to its low refractive index, it is unsuitable for use in transparent sheeting. In any case today A-glass is rarely found.
Generally the glass reinforcement used consists of chopped strand mat with a soluble polyester powder binder or chopped rovings deposited directly into the resin film. However, for certain applications woven fabrics

L-______________ C_O_M_P_O_S_IT_E __ F_A_B_R_I_C_A_T_IO_N ______________ ~I I 239
may be used. With the latter and to a much lesser extent with chopped strand mat, the glass cloth may be drawn through a resin bath and excess resin removed between doctor blades or rollers, before placing between two layers of release film and processing as before.
With high quality sheeting a surfacing tissue may be used to ensure a resin-rich finish. Such sheeting must be installed with the resin-rich surface exposed to the weather.
Resin systems are generally specifically formulated for each machine, since gel time and viscosity must suit the particular operating conditions of the machine. Resin systems used include those suitable for producing clear fire retardant sheeting.
By the correct choice of resin system, sheeting can be manufactured which will not yellow to any extent after exposure to tropical weather conditions for several years. However, to ensure that this is the case the resin system must be chosen with care and must be fully cured. Also the release film must be removed before installation and the laminate should contain not less than 75% by weight of resin. In other cases the resin content of the laminate may fall between 65 and 75% by weight.
2.U.8 Pultrusion
Pultrusion is a technique used for producing continuous fibre reinforced sections in which the orientation of the fibres is kept constant during cure. The process is suitable for use with both polyester and epoxide resin systems, reinforced with glass, carbon or synthetic fibres. An infinite number of profiles can be produced using appropriate dies and includes rods, tubes and flat and angled sections. All profiles have high strength and stiffness in the lengthwise direction, with fibre content generally around 60-65% by volume.
The reinforcements used consist of continuous fibres such as glass rovings or continuous carbon fibre tows, woven rovings or chopped strand mat or a combination of the two, depending on the strength and rigidity required in the molded profile.
Two processes are available which use liquid resin systems. In the first the reinforcement is drawn through an impregnating bath containing catalysed resin. For this process, a resin system with a long pot-life at room temperature is necessary. The reinforcement is then drawn through a heated die which removes excess resin, determines the cross-sectional shape and cures the resin system.
In the second process the reinforcement, accurately positioned and under tension, is drawn through a heated metal die where impregnation of the fibres and cure of the resin system takes place. Here, by the use of appropriate resin injection equipment, a short pot-life system can be used. Typical resin injection pressures are between 0.1 and 0.5 MPa. To

240 I ~I ________________ C_O_M __ P_O_S_IT_E __ M_A_T_E_R_I_A_L_S ________________ ~
speed up cure, the reinforcement may be pre-heated to about 100°C before passing through the die. Production rates of I mlmin can be achieved. By careful design of the pulling mechanism, consistent profiles can be produced with no bending or twisting of the fibres. With some resin systems a tunnel oven may be required after the die to give a suitable post cure.
Apart from the wet processes it is also possible to make pultruded sections from prepregs. The forming procedure is the same as that used with wet resin systems. The prepreg is drawn through a heated die which melts the resin, compresses the prepreg into the required shape and cures the resin. This is a somewhat cleaner process than that using a resin bath.
It is reported that sandwich panels are being produced in the USA by pultrusion. In this process a plywood core is completely encased in a 3 mm thick glass polyester skin, resin penetrating the plywood during production to give increased bond strength and moisture resistance.
2.13 MECHANICAL PROPERTIES
A summary of the mechanical properties of the most important matrix materials and their composites with different reinforcing fibers are presented in Tables 2.8-2.39.

MECHANICAL PROPERTIES
Table 2.8 Properties of a Typical Filled and Unfilled Polypropylene (1)
PP PP PP PP 40% 40% 40% 30%
Properties PP Talc CaC03 Glass Graphite
T °C 170 168 168 163 168 ileat deflection temperature, 55 100 80 160 120
1.82 MPa °C Maximum resistance to 100 120 110 135 125
continuous heat °C Coefficient of linear expansion 9 6 4 3 3
cm/cmxlo-5 °C Tensile strength, MPa 35 32 26 82 47 % Elongation 150 5 15 2 0.5 Flexural strength MPa 48 60 45 100 62 Compressive strength, MPa 45 52 35 64 55 Notched Izod impact JIm 42 27 42 90 56 Hardness Rockwell R90 Rloo R88 R105 R100 Specific gravity 0.90 1.25 1.23 1.22 1.04
Table 2.9 Properties of a Typical PEEK Resin (1)
PEEK PEEK Properties PEEK 30% Glass 30% Graphite
T~ ~ ileat deflection temperature, 1.82 MPa °C 165 Maximum resistance to continous heat °C 150 Coefficient of linear expansion cm/cmx1o-5 °C 5.5 Tensile strength MPa 100 % Elongation 40 Flexural strength MPa 110 Notched Izod impact JIm 150 Hardness Rockwell R123 Specific gravity 1.32
334 282 270 2.1 162 2
255 110
R123 1.44
334 282 270 1.5 173 2
313 70
R123 1.32
I I 241

242 I I COMPOSITE MATERIALS :1
Table 2.10 Properties of a Typical Polyetherimide Resins (1)
Properties PEl PEl PEl PEl PEl 10% 20% 30% 30% Glass Glass Glass Graphite
T °C 216 216 216 216 216 ileat deflection temperature, 195 200 205 210 210
1.82 MPa °C Maximum resistance to 165 170 175 180 180
continuous heat °C Coefficient of linear 5 4 3 2 2
expansion cm/cmxlo-5 °C Tensile strength MPa 105 114 138 169 216 % Elongation 7 5 4 3 2 Flexural strength MPa 144 193 205 225 283 Compressive strength MPa 140 155 162 175 220 Notched Izod impact JIm 55 60 85 110 75 Hardness Rochvell M110 M116 M120 M125 M127 Specific gravity 1.3 1.35 1.45 1.5 1.4
Table 2.11 Properties of Typical Polycarbonate Sheets (1)
PC PC PC PC Polyester 10% 30% 40% 40% carbon-
Properties PC Glass Glass Glass Graphite ate
T °C 150 150 150 150 150 160 ileat deflection temperature, 139 142 144 144 146 150
1.82 MPa °C Maximum resistance to 125 130 130 130 130 135
continuous heat °C Coefficient of linear expansion 7 2 1 1 1 8
cmlcmx1o-5OC Tensile strength MPa 65 65 135 165 165 73 % Elongation 110 6 3 3 2 90 Flexural strength MPa 93 105 155 93 240 240 Notched Izod impact JIm 130 110 90 100 90 300 Hardness Rockwell M70 M75 M92 R118 R119 M85 Specific gravity 1.2 1.28 1.4 1.35 1.35 1.2

~ ______________ M_E_C_H_A_N_I_C_A_L_P_R_O_P_E_R_T_I_E_S ______________ ~I I 243
Table 2.12 Properties of Polyphenylene Sulfide Resins (1)
Properties PPS
T °C ileat deflection temperature, 1.82 MPa °C
290 133
Maximum resistance to continuous heat °C 120 Coefficient of linear expansion cm/cmx1o-5 °C 5 Tensile strength MPa 65 % Elongation 2 Flexural strength MPa 95 Compressive strength MPa 95 Notched Izod impact JIm 25 Hardness Rockwell R123 Specific gravity 1.3
PPS 40% Glass
290 260 240
2 135 2
185 160 80
R123 1.65
Table 2.13 Properties of a Typical Polyarylate (1)
Heat deflection temperature, 1.82 MPa °C 174 Maximum resistance to continuous heat °C 150 Coefficient of linear expansion cm/cmx1O-50C 6.5 Tensile strength MPa 68 % Elongation 50 Flexural strength MPa 74 Compressive strength MPa 93 Notched lzod impact JIm 210 Hardness Rockwell R125 Specific gravity 1.2
Table 2.14 Properties of Typical Polyamide-Imide Plastics (1)
PAl 30%
Properties PAl Glass
T °C 275 275 ileat deflection temperature, 1.82 MPa °C 275 275 Maximum resistance to continuous heat °C 260 260 Coefficient of linear expansion cm/cmx1o-5OC 3.6 1.8 Tensile strength MPa 150 195 % Elongation 13 6 Flexural strength MPa 200 315 Compressive strength MPa 258 300 Notched Izod impact JIm 135 105 Hardness Rockwell E78 E94 Specific gravity 1.39 1.57
PPS 40% Graphite
280 260 240
1 160 1.5 210 180 55
R123 1.45
PAl 30%
Graphite
275 275 260 2.0 205 6
315 300 45
E94 1.41

244 I I COMPOSITE MATERIALS
Table 2.15 Properties of Typical Polysulfones (1)
Polysulfo- PoIYSllIf- Modified
ne one Polysulf- Polyether PES PES Modified Polysulf-(Udel) 30% one SIIlfone 20% 30% Polysulf- one
Properties Gloss Graphite 30% (Victrex) Glass Graphite olle 30% Glass
Heat deflection temperature, 190 198 190 200 210 210 150 150 1.82 MPa °C
Maximum resistance to 170 175 175 185 200 200 150 150 continuous heat °C
Coefficient of linear 6 2.5 2.5 5.5 2 1 4 5 expansion cm/cmxl0-5 °C
Tensile strength MPa 70 100 100 138 127 190 43 115 % Elongation 5 115 115 85 2 115 50 2 Flexural strength MPa 106 200 215 120 175 250 85 175 Compressive strength MPa 176 95 175 95 150 150 125 150 Notched Izod impact JIm 64 58 64 110 75 75 150 75 Hardness Rockwell M69 M95 M80 M88 M98 R123 R117 M80 Specific gravity 1.25 1.5 1.36 1.4 1.5 1.5 1.35 1.5
Table 2.16 Properties of typical Nylons (1)
Nylon-6 Nylon-6 Nylon 66 Nylon 66 Nylon 66 Nylon 66 30% 30% 30% 30% 40% 50%
Properties Nylon 6 gloss graphite Nylon-66 gloss graphite clay mica
T °C 226 215 215 265 265 265 265 215 ileat deflection temperature, 78 210 215 75 250 260 190 230
1.82 MPa °C Maximum resistance to 65 190 205 100 225 240 150 170
continuous heat °C Coefficient of linear 8 4 5 8 2 2 3 3
expansion cm/cm x 10-5 °C Tensile strength MPa 62 138 205 82 180 227 75 90 % Elongation 30 5 3 60 4 3 9 9 Flexural strength MPa 96 150 135 103 180 170 160 150 Compressive strength MPa 55 130 155 55 110 88 50 85 Notched Izod impact JIm R119 M85 M80 M85 M85 R120 M80 M80 Hardness Rockwell 1.13 1.38 1.28 1.14 1.37 1.35 1.4 1.4 Specific gravity 96 275 315 103 275 330 205 400

MECHANICAL PROPERTIES I I 245
Table 2.17 Properties of typical Nylons (1)
Nylon 6-12
Properties Nylon Nylon Nylon 35% Nylon Nylon 69 6-10 6-12 Glass 11 12 Aramid
T °C 205 220 210 210 192 177 275 ffeat deflection temperature, 55 60 69 216 150 146 260
1.82 MPa °C Maximum resistance to 60 70 75 200 140 135 150
continuous heat °C Coefficient of linear 8 8 8 6 10 8 3
expansion cm/cmx1o-5 °C Tensile strength MPa 58 60 50 145 55 55 120 % Elongation 80 125 200 4 200 225 5 Flexural strength MPa 40 40 44 80 40 42 172 Compressive strength MPa 100 90 90 150 80 80 207 Notched Izod impact JIm 60 60 60 96 96 110 75 Hardness Rockwell RIll R105 M78 M93 R108 R105 E90 Specific gravity 1.09 1.08 1.08 1.35 1.04 .1.01 1.2
Table 2.18 Typical properties of Discontinuous Graphite-Fiber-Reinforced Thermoplastic Composites (8)
Nylon 66 Polysulfone PolyesterPolyphenilene ETFE Property 30% C 30% 30% sulfide 30%C 30%C
Specific gravity 1.28 1.32 1.47 1.45 1.73 Water absorption (24hr), % 0.5 0.15 0.04 0.004 0.015 Equilibrium, % 2.4 0.38 0.23 0.1 0.24 Mold shrinkage, % 1.5-2.5 2-3 1-2 1 1.5-2.5 Tensile strength, 35 19 20 27 15
ksi (MPa) (241) (131) (138) (186) (103) Tensile elongation, % 3-4 2-3 2-3 2-3 2-3 Flexural strength, 51 25.5 29 34 20
ksi (MPa) (351) (176) (200) (234) (138) Flexural modulus of 2.9 2.05 2.0 2.45 1.65
elasticity, Msi (GPa) (20) (14.1) (13.8) (16.9) (11.4) Shear strength 13 7 7
ft-Ib/in (JIm) (89.6) (48.1) (48.2) Izod impact strength 1.5 1.1 1.2 1.1 4--5
ft-Ib/in (JIm) (80.1) (58.7) (64.1) (58.7) 213-267) Thermal deflection temperature 495 365 430 500 465
at 264 psi (1.82 MPa), OF (257) (185) (221) (260) (241) Coefficient of linear thermal 1.05 0.7 0.5 0.6 0.8
expansion, inlin., °Fx1O-5 (1.89) (1.26) (0.9) (1.08) (1.44) ( m/m/°CxlO·5)
Thermal conductivity, 7.0 5.5 6.5 5.2 5.6 BTU-inlhr ft2 OF (W/m°C) (12.1) (9.5) (11.2) (9.0) (9.7)
Surface resistivity, 111m2 3-5 1-3 2-4 1-3 3-5
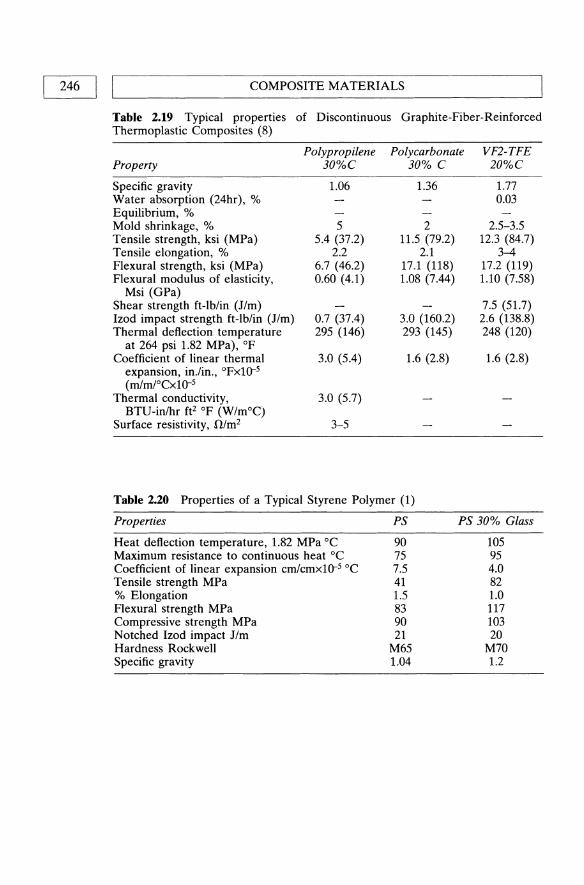
246 I ~I ________________ C_O_M_P_O_S_IT_E __ M_A_T_E_R_I_A_LS ________________ ~ Table 2.19 Typical properties of Discontinuous Graphite-Fiber-Reinforced Thermoplastic Composites (8)
Property
Specific gravity Water absorption (24hr), % Equilibrium, % Mold shrinkage, % Tensile strength, ksi (MPa) Tensile elongation, % Flexural strength, ksi (MPa) Flexural modulus of elasticity,
Msi (GPa) Shear strength ft-lb/in (Jim) Izod impact strength ft-lb/in (Jim) Thermal deflection. temperature
at 264 psi 1.82 MPa), OF Coefficient of linear thermal
expansion, in.!in., °FxlO-5 (rnIrn1°CxlO-5
Thermal conductivity, BTU-inlhr ft2 of (W/m°C)
Surface resistivity, !l/m2
Polypropilene 30%C
1.06
5 5.4 (37.2)
2.2 6.7 (46.2) 0.60 (4.1)
0.7 (37.4) 295 (146)
3.0 (5.4)
3.0 (5.7)
3-5
Polycarbonate 30% C
1.36
2 11.5 (79.2)
2.1 17.1 (118) 1.08 (7.44)
3.0 (160.2) 293 (145)
1.6 (2.8)
VF2-TFE 20%C
1.77 0.03
2.5-3.5 12.3 (84.7)
3-4 17.2 (119) 1.10 (7.58)
7.5 (51.7) 2.6 (138.8) 248 (120)
1.6 (2.8)
Table 2.20 Properties of a Typical Styrene Polymer (1)
Properties
Heat deflection temperature, 1.82 MPa °C Maximum resistance to continuous heat °C Coefficient of linear expansion crnlcmx1o-5 °C Tensile strength MPa % Elongation Flexural strength MPa Compressive strength MPa Notched Izod impact Jim Hardness Rockwell Specific gravity
PS
90 75 7.5 41 1.5 83 90 21
M65 1.04
PS 30% Glass
105 95 4.0 82 1.0 117 103 20
M70 1.2

MECHANICAL PROPERTIES I I 247
Table 2.21 Properties of Typical Polyester Resins (1)
PET PET PET PBT PBT PBT 30% 45% 30% 30% 45% 30%
Properties PET glass glass glass PBT glass glass glass
T °C 255 255 255 245 245 245 245 ileat deflection temperature, 220 225 225 85 210 210 215
1.82 MPa °C Maximum resistance to 200 210 210 80 200 200 205
continuous heat °C Coefficient of linear 6.5 2 3 6 2.5 2 3
expansion cm/cmx1o-5 °C Tensile strength MPa 58 165 175 50 220 90 155 % Elongation 100 3 115 100 3 3 2 Flexural strength MPa 110 175 260 100 175 140 215 Compressive strength MPa 90 155 105 98 145 105 100 Notched Izod impact JIm 35 75 75 40 50 50 70 Hardness Rockwell M97 Rl18 R125 M72 M90 M80 R120 Specific gravity 1.35 1.6 1.4 1.34 1.5 1.7 1.41
Table 2.22 Properties of Typical Polyimides (1)
Properties PI PI 40% graphite
T °C 330 365 ileat deflection temperature, 1.82 MPa °C 315 360 Maximum resistance to continuous heat °C 290 810 Coefficient of linear expansion cm/cmx1o-5 °C 5 4 Tensile strength MPa 96 44 % Elongation 9 3 Flexural strength MPa 165 145 Compressive strength MPa 240 125 Notched Izod impact JIm 83 38 Hardness Rockwell E70 E27 Specific gravity 1.4 1.65
Table 2.23 Properties of DAP (1)
Fiber glass Mineral Properties DAP filled filled
Heat deflection temperature, 1.82 MPa °C 155 225 200 Maximum resistance to continuous heat °C 100 210 200 Coefficient of linear expansion cm/cmx1o-5 °C 3 3.5 Tensile strength MPa 27.6 50 45 % Elongation 4.6 4 4 Flexural strength MPa 62.0 90 65 Compressive strength MPa 150 205 170 Notched Izod impact JIm 14 50 16 Hardness Rockwell EllS E84 E61 Specific gravity 11.3 1.80 1.75
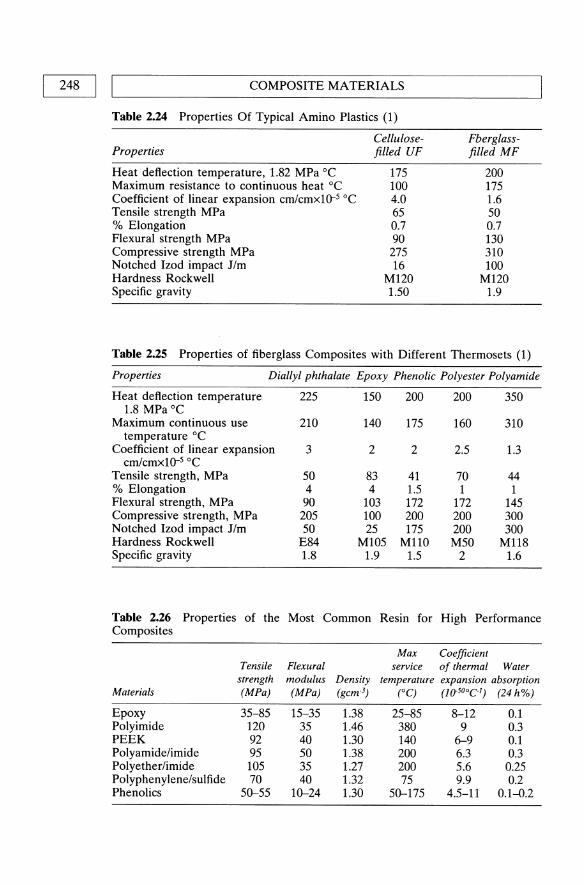
248 II L ________________ C_O_M_P_O_S_IT_E __ M_A_T_E_R_I_A_L_S ______________ ~ Table 2.24 Properties Of Typical Amino Plastics (1)
Properties
Heat deflection temperature, 1.82 MPa °C Maximum resistance to continuous heat °C Coefficient of linear expansion cmicmx1o-s °C Tensile strength MPa % Elongation Flexural strength MPa Compressive strength MPa Notched Izod impact JIm Hardness Rockwell Specific gravity
Cellulosefilled UF
175 100 4.0 65 0.7 90 275 16
M120 1.50
Fberglassfilled MF
200 175 1.6 50 0.7 130 310 100
M120 1.9
Table 2.25 Properties of fiberglass Composites with Different Thermosets (1)
Properties Diallyl phthalate Epoxy Phenolic Polyester Polyamide
Heat deflection temperature 225 150 200 200 350 1.8 MPa °C
Maximum continuous use 210 140 175 160 310 temperature °C
Coefficient of linear expansion 3 2 2 2.5 1.3 cm/cmx1o-s °C
Tensile strength, MPa 50 83 41 70 44 % Elongation 4 4 1.5 1 1 Flexural strength, MPa 90 103 172 172 145 Compressive strength, MPa 205 100 200 200 300 Notched Izod impact JIm 50 25 175 200 300 Hardness Rockwell E84 M105 M110 M50 M118 Specific gravity 1.8 1.9 1.5 2 1.6
Table 2.26 Properties of the Most Common Resin for High Performance Composites
Max Coefficient Tensile Flexural service of thermal Water
strength modulus Density temperature expansion absorption Materials (MPa) (MPa) (gcm o3) (0C) (l(f50°Cl) (24 h%)
Epoxy 35-85 15-35 1.38 25-85 8-12 0.1 Polyimide 120 35 1.46 380 9 0.3 PEEK 92 40 1.30 140 6-9 0.1 Polyamide/imide 95 50 1.38 200 6.3 0.3 Polyether/imide 105 35 1.27 200 5.6 0.25 Polyphenylene/sulfide 70 40 1.32 75 9.9 0.2 Phenolics 50-55 10-24 1.30 50-175 4.5-11 0.1-0.2

MECHANICAL PROPERTIES I I 249 ~------------------------------------------------------~
Table 2.27 Properties of Polyester Composites Reinforced by Continuous and Chopped Fiberglass
Continuous Chopped Transverse Transverse Filament Glass
Tensile Strength
MPa
Flexural Strength
MPa Tensile Strength Flexural Strength
(%) (%)
75 65 45 25 15
o 10 20 50 60
690 660 570 500 410
1200 1135 980 810 680
MPa MPa
24 27 60 95
125
35 90
155 200 260
Table 2.28 Typical properties of cured polyester resins
Resin
Orthophthalic Isophthalic Neo-pentylglycol Isophthalicl
neopentylglycol HET acid IsophthaliC/
HET acid Bisphenol A Chlorinated
paraffin Isophthalicl
chlorinated paraffin
Cast resin properties Laminate properties
Flexural Tensile Tensile % Flexural Tensile Tensile strength strength Modulus Elonga- HDT % strength strength modulus (MPa) (GPa) (GPa) tion (0 C) glass (MPa) (MPa) (GPa)
100 65-75 3.2 2.0-4.0 55-110 30 150 90 7 140 70-75 3.5 3.5 75-130 30 230 120 8 130 70 3.4 2.4 110 30 170 90 7 130 60 3.4 2.5 90-115 30 160 90 7
80 40-50 3.2 1.3-4.0 55-80 30 150 85 7 85 55 3.2 2.9 70 30 150 90 7
130 60-75 3.2 2.5-4.0 120-136 30 170 90 7 110 50-60 3.4 1.2-4.8 55-80 30 140 90 7
90 60 2.0 4.8 50 30 140 100 7

COMPOSITE MATERIALS 250 I I ~----------------------------------------------------------~
Table 2.29 Characteristics of Epoxy resins (8)
Resin
Epocryl® Resin 12
Description
A neat dimethacrylate ester of a low-molecularweight bisphenol A epoxy resin
Characteristics and end uses
Nominal 1 000 000 cp (1 kPa sec) viscosity designed for molding, adhesives, and electrical prepreg
Epocryl® Resin 370 A neat diacrylate ester of Base resin for fonnulation
CoRezyn VE-8100 Derakane® 411-C-50 Epocryl® Resin 321
Corrolite 31-345 CoRezyn VE-8300 Derakane® 411-45 Epocryl® Resin
Derakane® 470-36
Epocryl® Resin
Derakane® 51OA40
a low-molecular-weight of UV-cure inks and bisphenol A expoxy resin coating
A dimethacrylate ester of Nominal 100 cP (5 dPa sec) an intermediate-molecular- viscosity designed for weight bisphenol A epoxy chemical-resistant FRP resin containing 50 wt% applications: hand lay-up styrene and filament winding
A dimethacrylate ester of Nominal 500 cP (5 dPa a high-molecular-weight sec) viscosity designed bisphenol A epoxy resin for Chemical-resistant containing 45 wt% styrene FRP applications: hand
A methacrylate ester of a phenolicnovolac epoxy resin containing 36 wt% styrene
A methacrylate ester of a low-molecular-weight bisphenol A epoxy tesin containing 40 wt % styrene
A dimethacrylate ester of a brominated bisphenol A epoxy resin containing 40 wt% styrene
lay-up and filament winding
Nominal 200 cP (2 dPa sec) viscosity designed for solvent resistance and high-service-temperature FRP applications
Nominal 500 cP (5 dPa sec) viscosity designed for solvent resistance and high-service-temperature FRP applications. Exhibits high tensile strengths and elongation with high modulus. Designed for filament winding and hand lay-up applications
Nominal 350 cP (3.5 dPa sec) viscosity designed to impart fire retardancy for chemical-resistant FRP applications
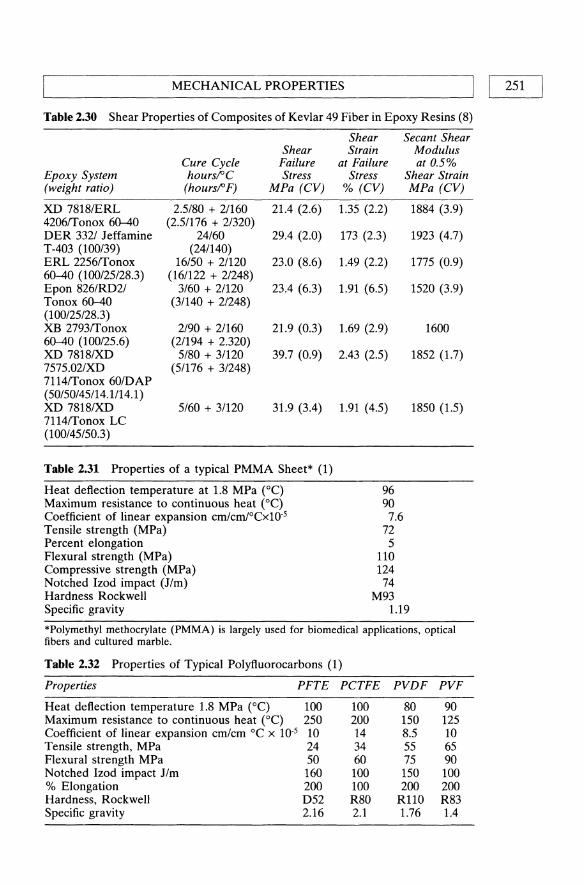
MECHANICAL PROPERTIES I I 251 ~----------------------------------------------------~
Table 2.30 Shear Properties of Composites of Kevlar 49 Fiber in Epoxy Resins (8)
Shear Secant Shear Shear Strain Modulus
Cure Cycle Failure at Failure at 0.5% Epoxy System hours!"C Stress Stress Shear Strain (weight ratio) (hours!" F) MPa (CV) % (CV) MPa (CV)
XD 7818IERL 2.5180 + 2/160 21.4 (2.6) 1.35 (2.2) 1884 (3.9) 4206ITonox 60-40 (2.51176 + 2/320) DER 3321 Jeffamine 24/60 29.4 (2.0) 173 (2.3) 1923 (4.7) T-403 (100/39) (24/140) ERL 22561T0nox 16/50 + 21120 23.0 (8.6) 1.49 (2.2) 1775 (0.9) 60-40 (100/25/28.3) (161122 + 2/248) Epon 826/RD21 3/60 + 21120 23.4 (6.3) 1.91 (6.5) 1520 (3.9) Tonox 60-40 (3/140 + 21248) (100/25/28.3) XB 27931T0nox 2/90 + 2/160 21.9 (0.3) 1.69 (2.9) 1600 60-40 (100/25.6) (21194 + 2.320) XD 7818IXD 5/80 + 3/120 39.7 (0.9) 2.43 (2.5) 1852 (1.7) 7575.02/XD (5/176 + 31248) 71141T0nox 60/DAP (50150/45/14.1114.1) XD 7818/XD 5/60 + 3/120 31.9 (3.4) 1.91 (4.5) 1850 (1.5) 71141T0nox LC (100/45150.3)
Table 2.31 Properties of a typical PMMA Sheet* (1)
Heat deflection temperature at 1.8 MPa (0C) 96 Maximum resistance to continuous heat (OC) 90 Coefficient of linear expansion cm/cm/°CxlO·5 7.6 Tensile strength (MPa) 72 Percent elongation 5 Flexural strength (MPa) 110 Compressive strength (MPa) 124 Notched Izod impact (Jim) 74 Hardness Rockwell M93 Specific gravity 1.19
*Polymethyl methocrylate (PMMA) is largely used for biomedical applications, optical fibers and cultured marble.
Table 2.32 Properties of Typical Polyftuorocarbons (1)
Properties PFTE PCTFE PVDF PVF
Heat deflection temperature 1.8 MPa (0C) 100 100 80 90 Maximum resistance to continuous heat (OC) 250 200 150 125 Coefficient of linear expansion cmlcm °C x 10-5 10 14 8.5 10 Tensile strength, MPa 24 34 55 65 Flexural strength MPa 50 60 75 90 Notched Izod impact Jim 160 100 150 100 % Elongation 200 100 200 200 Hardness, Rockwell D52 R80 R110 R83 Specific gravity 2.16 2.1 1.76 1.4

252 I I COMPOSITE MATERIALS
Table 2.33 Properties of typical Filled PTFE (1)
Unfilled 15% 25% 15% 60% Properties PTFE Glass Glass Graphite Bronze
Thermal conductivity mW/MK 0.244 0.37 0.45 0.45 0.46 Tensile strength MPa 28 25 17.5 21 14 % Elongation 350 300 250 250 150 Notched Izod impact JIm 152 146 119 100 75 Coefficient of friction, 3.4 MPa load 0.08 0.13 0.13 0.10 0.10 Wear factor I/pPa 5013 280 26 102 12 Shore durometer hardness 51D 54D 57D 61D 70D Specific gravity 2.18 2.21 2.24 2.16 3.74
Table 2.34 Properties of Typical LDPE Plastics (1)
Glass transition temperature (0C) -25 Coefficient of linear expansion cm/cm °CxlO·s 15 Tensile strength MPa 20 %Elongation 350 Shore hardness 47D Specific gravity 0.925
Table 2.35 Properties of a typical Filled and Unfilled HDPE (1)
Properties HDPE 30% Glass-Filled
HDPE
Melting point (0C) Heat deflection temp. at 1.82 MPa (0C) Maximum resistance to continuous heat (OC) Coefficient of linear expansion cm/cmoCxlO·s Tensile strength MPa % Elongation Flexural strength MPa Compressive strength MPa Notched Izod impact JIm Hardness Rockwell Specific gravity
130 40 40 10 27 100
21 133 D40 0.95
140 120 110 5
62 1.5 76 43 64
R75 1.3
Table 2.36 Thermal and Electrical Properties of Kevlar 49 Fabric/Epoxy Composites (8)
Property
Thermal conductivity (46 volume % fiber) Across fabric layers, W 1m OK Parallel to warp, W/m OK Thermal coefficient of expansion (20-100°C) Dielectric constant (58 volume % fiber) Perpendicular at 9.3x10⁹ Hz (room temperature) Parallel at 9.3x10⁹ Hz (room temperature) Perpendicular (48 volume % fiber) at 106 Hz Dielectric strength (48 volume % fiber), V/mm (V/mil) Volume resistivity (48 volume % fiber), ~-cm Surface resistivity (48 volume % fiber), ~ cm Arc resistance (48 volume % fiber), seconds
Value
0.22 0.91 o
3.3 3.7 4.1
24.4 5x101S
5x101S
125

Tab
le 2
:37
Pro
pert
y o
f U
nidi
rect
iona
l T
horn
el 3
00-K
evla
r 49
/Epo
xy H
ybri
d C
ompo
site
s (8
)
Ten
sion
C
ompr
essi
on
Fle
xure
Rat
io
Stre
ss
Stre
ss
Stre
ss
Stre
ss
Shor
t-Sh
ort-
Tho
rnel
U
ltim
ate
Ulti
mat
e at
0.0
2%
at 0
.02%
Ulti
mat
e U
ltim
ate
at 0
.02%
at
0.02
%
Ulti
mat
e U
ltim
ate
beam
-be
am
to
Spec
ific
Mod
ulus
Mod
ulus
st
ress
st
ress
of
fset
of
fset
st
ress
st
ress
of
fset
of
fset
st
ress
st
ress
sh
ear
shea
r K
evla
r gr
avity
G
Pa
(Msi
) M
Pa
(ksi
) (k
si)
(ksi
) M
Pa
(ksi
) M
Pa
(ksi
) sM
Pa
(ksi
) st
ress
st
ress
100/
0 1.
60
145
(21.
1)
1565
(2
27)
678
(98.
4)
1007
(1
46)
1605
(2
23)
1606
(2
33)
91
(13.
2)*
75/2
5 1.
56
120
(17.
4)
1281
(1
86)
469
(68.
8)
938
(136
) 12
48
(181
) 13
58
(197
) 76
(1
1.0)
50
/50
1.51
10
8 (1
5.7)
12
13
(176
) 41
3 (5
9.9)
68
8 (9
9.8)
82
7 (1
20)
1103
(1
60)
56
(8.1
) 0/
100
1.35
77
(1
1.2)
12
62
(183
) 18
2 (2
6.4)
28
6 (4
1.5)
33
9 (4
9.2)
63
4 (9
1.9)
49
(7
.1)
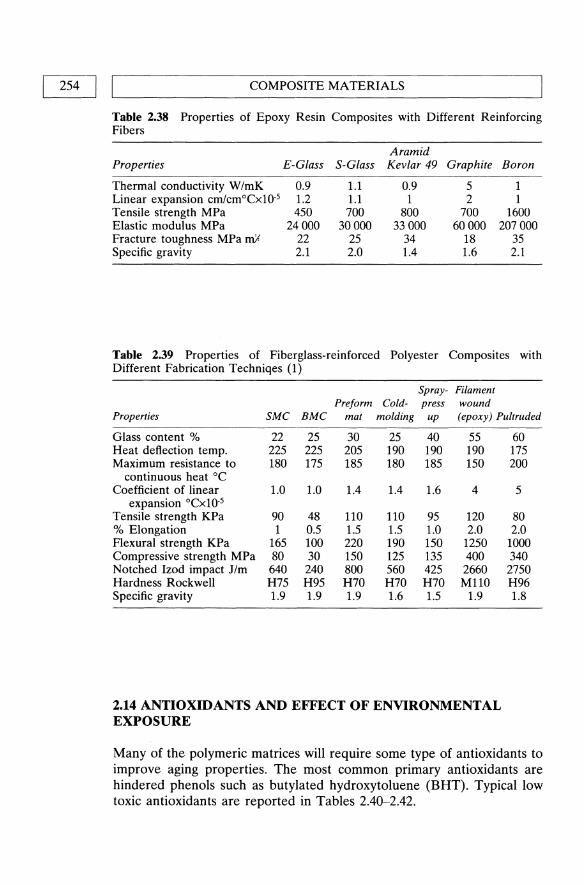
254 I I COMPOSITE MATERIALS
Table 2.38 Properties of Epoxy Resin Composites with Different Reinforcing Fibers
Aramid Properties E-Glass S-Glass Kevlar 49 Graphite Boron
Thermal conductivity W/mK 0.9 1.1 0.9 5 1 Linear expansion crn/cmoCX10-5 1.2 1.1 1 2 1 Tensile strength MPa 450 700 800 700 1600 Elastic modulus MPa 24000 30000 33000 60000 207000 Fracture toughness MPa mfl 22 25 34 18 35 Specific gravity 2.1 2.0 1.4 1.6 2.1
Table 2.39 Properties of Fiberglass-reinforced Polyester Composites with Different Fabrication Techniqes (1)
Spray- Filament Preform Cold- press wound
Properties SMC BMC mat molding up (epoxy) Pultruded
Glass content % 22 25 30 25 40 55 Heat deflection temp. 225 225 205 190 190 190 Maximum resistance to 180 175 185 180 185 150
continuous heat °C Coefficient of linear 1.0 1.0 1.4 1.4 1.6 4
expansion °CxlO-5 Tensile strength KPa 90 48 110 110 95 120 % Elongation 1 0.5 1.5 1.5 1.0 2.0 Flexural strength KPa 165 100 220 190 150 1250 Compressive strength MPa 80 30 150 125 135 400 Notched Izod impact 11m 640 240 800 560 425 2660 Hardness Rockwell H75 H95 H70 H70 H70 M110 Specific gravity 1.9 1.9 1.9 1.6 1.5 1.9
2.14 ANTIOXIDANTS AND EFFECT OF ENVIRONMENTAL EXPOSURE
60 175 200
5
80 2.0
1000 340 2750 H96 1.8
Many of the polymeric matrices will require some type of antioxidants to improve aging properties. The most common primary antioxidants are hindered phenols such as butylated hydroxy toluene (BHT). Typical low toxic antioxidants are reported in Tables 2.40-2.42.

ANTIOXIDANTS AND EFFECT OF ENVIRONMENTAL EXPOSURE I I 255
Table 2.40 Typical antioxidants of low toxicity (3)
Primary antioxidants Butylated hydroxy toluene (BHT) (usually hindered phenols)
Thioester antioxidants (usually derivates of thiodipropionic acid)
Phosphite antioxidants (usually derivates of aromatic phosphites)
Dilaryl thiodipropionate (DLTDP) Distearyl thiodipropionate (DSTDP)
Distearyl pentaerythritol diphosphite Tris (nonylphenyl) phosphite
The toxicity of commonly used polymer stabilizers and additives are classified in the following table.
Table 2.41 Toxicity of commonly used polymer stabilizers and additives (3)
Stabilizer
Fatty acid derivates of calcium, zinc and magnesium
Barium fatty acid compounds Lead & cadmium derivates
Amines (antioxidants)
Butylated hydroxy toluene (BHT) (antioxidant)
Octyl tin compounds
Toxicity
Low toxicity. Used in non-toxic medical applications
Moderately toxic Highly toxic. Not recommended in the
US for use in medical applications (cadmium pigments considered of low toxicity in England)
Generally toxic, with aromatic amines showing carcinogenic tendencies. Newer types less toxic
Considered non-toxic as also used in foods. Recently investigated and found non-carcinogenic
Only class of tin compound classified as of low toxicity and used in medical applications e.g. di-(n-octyl)tin maleate polymer
Table 2.42 Toxicity data on some common plasticizers used in plastic manufacture (3)
Plasticizer Adipates Glycolates
Phosphates Phthalates
Epoxidized soya bean oil
Toxicity To date animal experiments indicate possible carcinogenicity Generally of low toxicity levels. However studies underway
as commercial form are phthalyl derivates Generally cause irritation to skin and mucous membranes Although commercially used in medical devices,
environmental effects and toxicological properties continually under investigation
Chelating type of plasticizer with low toxicity

256 I ~I ________________ C_O_M_P_O_S_IT_E __ M_A_TE __ R_I_A_L_S ______________ ~
2.15 THE RADIATION STABILITY OF COMMERCIAL MATERIALS
The radiation resistance of common polymeric materials used as matrix for composite are shown in Tables 2.43-2.52. Generally, polystyrene and urethane rubber have the most resistance.
Table 2.43 The radiation resistance of common materials used as matrix of polymeric composites (3)
Material
ABS Polyamides Polyethylene Polypropylene Poly(vinyl chloride)
Polystyrene Poly( tetrafluoroethylene)
Polysulfone Poly aceta Is Polyurethane Polymethylmethacrylate Rubber natural
Rubber butyl Rubber silicones Urethanes
Stability effect
Stable for single dose of 2.5 Mrad Suitable for single doses of 2.5 Mrad level Stable under ordinary conditions at 2.5 Mrad Embrittles - newer variations more resistant Withstands single dose radiation cycle -
but discolors - some HCI liberated Most radiation - stable of common polymers Poor resistance to radiation - copolymers
less affected Stable under ordinary conditions at 2.5 Mrad Embrittles - discolors Stable under ordinary conditions at 2.5 Mrad Embrittles - discolors Stable under ordinary conditions when
properly compounded Poor stability at low radiation levels Stable under ordinary conditions at 2.5 Mrad Excellent radiation resistance

L-.-_T_H_E_R_A_D_IA_TI_O_N_ST_A_B_IL_IT_Y_O_F_C_O_M_M_E_R_C_I_A_L_M_A_T_E_R_IA_LS __ -,I I 257
Table 2.44 The radiation resistance of common materials used as matris of polymeric composites (3)
Material Thermoplastics Stability
AcrylonitrilelButadiene!Styrene Good (ABS)
Cellulosics Fair Undergoes chain scission, esters more stable Fluoinated ethylene propylene Fair Copolymers more resistant
(FEP) than Homopolymer Polyacetal Poor Embrittles Polyamides aromatic Excellent Polyamides aliphatic Fair Hardens as levels increased Polycarbonates Good Yellow - mechanical
properties unchanged Polyesters (aromatic) Good Polyethylene Good lowers melt flow Polymethylmethacrylate Poor Degrades-turns brown Polyphenylene sulfide Good Polyproplyene Fair Improved stability if properly
stabilized Polysuifone Excellent Yellow natural color Polystyrene Excellent Polytetrafluoroethylene Poor Acid evolved Polyvinylchloride homopolymer Good If properly stabilized Polyvinylchloride Copolymer Fair HCl evolved - turns brown Styrene! Acrylonitrile (SAN) Good More resistant than ABS
Table 2.45 The radiation resistance of common materials used as matrix of polymeric composites (3)
Material Thermosetting resin Stability
Epoxies Excellent Very stable with the use of aromatic curing agen
Phenol or urea formaldehyde Polyimides
Good Excellent Good Excellent
Polyesters Polyurethanes
Table 2.46 The radiation resistance of common materials used as matrix of polymeric composites (3)
Material elastomers
Polyisobutylene (butyl) Natural Urethanes Nitrile Polyacrylic Styrene-butadiene EPDM Silicones
Stability
Poor Good Excellent Good Poor Good Good Good

258 I IL-______________ C __ O_M_P_O_S_IT_E __ M_A_T_E_R_I_A_L_S ______________ ~ Table 2.47 The radiation resistance of polymers (3)
Textiles
Polyesters Cellulosics Nylon
Stability
Excellent Poor Fair
Table 2.48 Synergism between a UV absorber and a thermal antioxidant (6)
Additive (0.4 pph) UV stabilizer
None Octylphenyl salicylate None Octylphenyl salicylate 2-H ydroxy-4-n-
octoxybenzophenone None 2-Hydroxy-4-n
octoxybenzophenone
Antioxidant
None None
Tri (nonylphenyl) phosphite Tri (nonylphenyl) phosphite
None
Tri (nonylphenyl) phosphite Tri(nonylphenyl) phosphite
Time to embrittlement of low-density
polyethylene (in hours)
400 1600 1800 7000 2000
1000 8500
Table 2.49 Stability of hydrocarbon polymers with bound phenolic antioxidants (6)
Material
Low-density polyethylene: Uninhibited Reacted with diazooxide High-density Polyethylene: Commercially stabilized Reacted with diazooxide Polypropylene Uninhibited Reacted with diazooxide
Hours to react with 10 cc of O2 at 140°C
3 14
175 411
<1 31
Table 2.50 Additives incorporated into natural rubber and as bound antioxidants (6)
Additive
N ,N' -Diethy l-p-ni trosoaniline p-Nitrosodiphenylaniline p-Nitrosophenol 2,6-Diter-butyl-p-cresol
Hours to absorb 1% by wt. of O2
Before extraction
39 60 31 47
After extraction
30 53 30
4

POLYMERS AGING I I 259
2.16 POLYMERS AGING
Table 2.51 Summary of effects of moisture and ambient aging on epoxy compos-ites (7)
Flexural strength, MNlm2 (ksi)
Tempera- 24-h lUre H2O Retention 6-week 20-week Retention 52-week Retention
Orient K(OF) Control boil % humidity Retention ambient % ambient %
B/5505 boron/epoxy [0] 297 2070 1950 94 2120 103 2180 105 2280 110
(75) (300) (283) (308) (316) (330) [0] 450 1730 393 23 683 39 1030 59 910 53
(350) (251) (57) (99) (149) (132) [0±45] 450 862 545 63 641 74 882 102 807 94
(350) (125) (79) (93) (128) (117) A-S/3501 graphite/epoxy
[0] 297 1680 1680 100 1680 100 1850 110 1620 96 (75) (244) (244) (244) (268) (235)
[0] 450 1300 434 34 386 30 703 54 593 46 (350) (188) (244) (56) (102) (86)
[0±45] 450 676 365 54 276 41 545 81 386 57 (350) (98) (53) (40) (79) (56)
Table 2.52 Summary of thermal aging of epoxy and polyimide system (7)
Aging Test Retention Material temperature temperature Aging of tensile system Orientation K(OF) K(OF) time, h strength, %
BIE [0] 394 (250) 450 (350) 1000 99 rep] 94 [0] 450 (350) 450 (350) 1000 100 rep] 100
G/E [0] 394 (250) 450 (350) 1000 94 rep] 100 [0] 450 (350) 450 (350) 1000 100
rep] 100 G/PI [0] 505 (450) 505 (450) 1000 98
rep] 92 [0] 561 (550) 561 (550) 1000 87 rep] 100

260 I ~I ________________ C_O_M_P_O_S_IT_E __ M_A_T_E_R_I_A_L_S ______________ ~
2.17 COMPOSITE MATERIALS IN MEDICINE
In recent years, carbon fiber has been recognized as a material with many exciting applications in medicine. Several commercial products utilize carbon fiber as a reinforcing material which serves to enhance the mechanical properties of the polymeric resin systems in which it is included. The attractive feature of carbon reinforced polymer for this application is that the orientation and fiber content can be varied in the implant to provide the mechanical property orientation necessary for good function. The carbon fiber can be distributed in matrix material to provide strength in only those locations and directions where it is needed. The implant must be designed in a way that fatigue failure does not occur and the matrix material is not attacked by the physiological environment. The matrix materials used are listed in Table 2.53.
Table 2.53 Polymeric materials used as matrix for carbon fibers composites (3)
Polymer
Polysulfone
Polymer type Commercial name and manufacturer
Thermoplastic UDEL MG-ll, Union Carbide, Dallas, TX
Poly-methyl methacrylate Thermoplastic PMMA I.V. 0.4, Rohm & Haas, Philadelphia, P A
Epoxy (low viscosity) Epoxy (high viscosity)
Thermoset Thermoset
Stycast 1267 C-8W795 & H.R. 795, Hysol Corp.,
Los Angeles, CA
Table 2.54 Mechanical properties of carbon fibers used in carbon prosthesis
Tensile Elastic Strain to Density Diameter strength modulus failure ex
Fibre-type (g/cm3) (11m ) (MPa) (GPa) (%) (/J(j6K)
T300 1.75 7 3430 230 1.5 -1.5 HM 35 1.79 6.7 2350 358 0.6 -0.5
These polymers were combined with unsized carbon fiber, into ±15° laminated, test specimens approximately 2.5 cmx7.5 cmxO.3 cm. Testing was performed in three point bending giving the results in Table 2.55.
Table 2.55 Typical Mechanical Properties of Polymer-Carbon Composites (3)
Polymer Ultimate strength (MPa) Modulus (GPa)
PMMA Polysulfone Epoxy Stycast Epoxy Hysol
772 938 535 207
55 76 30 24

~ __________ C_O_M_P_O_S_IT_E __ M_A_T_E_R_I_A_L_S_IN __ M_E_D_I_C_I_N_E __________ ~I I 261
Because a composite hip will be subjected to the physiological environment in use, an accelerated test was performed to evaluate changes in properties. In this test, the samples were immersed in 0.9% saline solution maintained at 90°C for one week; the results are shown in Table 2.56.
Table 2.56 Accelerated Test Data (3)
Strength (MPa) Modulus (GPa)
Matrix Before After Before After
Polysulfone 807 723 77 67 PMMA 687 594 76 73 Epoxy (Stycast) 535 323 30 21
Blood compatible materials are essential to circulatory support devices. Numerous materials have been considered for use in prosthetic devices.
2.17.1 Carbons in heart valve prostheses
Carbons are widely used in prosthetic heart valves, as a result of their favorable mechanical and biological properties. Pyrolytic carbons, deposited in a fluidized bed, have high strength, and high fatigue and wear resistance. Compatibility with blood and soft tissue is good.
Table 2.57 Representative Mechanical Properties of L TI, Glassy, and VaporDeposited Carbons (3)
Property
Density, g/cm3
Crystallite size, A Flexural strength 1000 psi Young's modulus, 106 psi Strain to fracture, % Fatigue limit/fracture strength Strain energy to fracture, 100 psi
Glassy carbon
1.5 30 20 4.0 1.0 1.0 1
Vapordeposited
carbon
1.9 10 80 2.5 5.0 1.0 12
LTI carbon L TI with silicon
carbon (5-12%)
1.9 2.1 35 35 70 85 3.0 4.0 2.0 2.0 1.0 1.0 7 9

262 I LI ________________ C_O_M_P_O_S_IT_E __ M_A_T_E_R_I_A_L_S ______________ ~
2.17.2 Wound closure biomaterials
Virtually every operation requires the use of materials to close the wound for subsequent successful healing. The material must retain adequate strength during the critical period of healing; it should also induce minimal tissue reaction that might interfere with the healing process. The complexity involved in wound healing calls for different types of wound closure materials.
Table 2.58 Mechanical Properties of Suture Materials (3)
Yield Breaking Yield Breaking Modulus Specific work stress stress strain strain of of rupture
Suture (GPD) (GPD) (%) (%) elasticity (NITex)xJ(t2
Dexon 0.80 6.30 1.9 22.6 55 6.63 Vicryl 0.97 6.55 1.8 18.4 67.5 5.46 Mersilene 1.20 4.20 2.7 8 53 1.32 Silk 1.33 3.43 1.9 11.5 79.0 2.36 Nurolon 0.34 3.80 1.6 18.2 21.0 2.80 Ethilon 0.41 6.25 2.2 33 20.0 8.96 Prolene 0.52 5.14 1.2 42 58.5 14.69
2.18 METAL MATRIX COMPOSITES
The metal matrix composites can be described as materials whose microstructure comprises a continuous metallic phase into which a second phase (ceramic materials) has been artificially introduced during processing, as reinforcement.
2.18.1 Matrix materials
The most common matrices are the low-density metals, such as aluminum and aluminum alloys, and magnesium and its alloys. Some work has been carried out on lead alloys, mainly for bearing applications, and there is interest in the reinforcement, for example, of titanium-, nickel- and ironbase alloys for higher-temperature performance. However, the problems encountered in achieving the thermodynamic stability of fibers in intimate contact with metals become more severe as the potential service temperature is raised, and the bulk of development work at present rests with the light alloys.
2.18.2 Reinforcements
The principal reinforcements for metal matrices include continuous fibers of carbon, boron, aluminum oxide, silica, aluminosilicate compositions and

'---_______ M_E_T_A_L_M_A_T_R_IX_C_O_M_P_O_S_I_T_E_S ______ ----,I 1 263
silicon carbide. Some ceramic fibers are also available in short staple form, and whiskers of carbon, silicon carbide and silicon nitride can be obtained commercially in limited quantities. There is also interest in the use of refractory particles to modify alloy properties such as wear and abrasion resistance. In this case, particle sizes and volume fractions are greater than those developed metallurgically in conventional alloys, and incorporation of the particles into the metal is achieved mechanically rather than by precipitation as a consequence of heat treatment. Most metal-matrix composites consist of a dispersed reinforcing phase of fibers, whiskers or particles, with each reinforcing element ideally separated from the next by a region of metal. A summary of properties of the most important metal matrix composites is presented in Tables 2.59-2.69.
Table 2.59 Summary of Mechanical Properties of A13 Aluminum-28 v/o Thornel-50 Composite (5)
Property
Ultimate tensile strength
Rule-of-mixtures strength
Transverse tensile strength Tensile elastic modulus, E Shear modulus, G (calculated) Density Strength-to-density ratio Modulus-to-density ratio Poisson's ratio, m (calculated)
Value
730 MN/m2 (106000 psi) at 20°C 660 MN/m2 (95 000 psi) at 500 °c 700 MN/m2 (101 000 psi) at 20°C 550 MN/m2 (80 000 psi) at 500°C -83 MN/m2 (-12000 psi) 145 GN/m2 (21.0x10⁶ psi) 55 GN/m2 (7.9x10⁶ psi) 2.4 glcm3 (0.0805Ib/in.3)
2.4x106 cm (1.25x106 in.) 620x106 cm (248xl06 in.) 0.306
Table 2.60 Summary of Transverse Tensile Strengths of Various Aluminum-Graphite Composite Systems (5)
Composite Average
High Low Number Fiber Matrix (MNlm2) (psi) (psi) (psi) of tests
Thornel-50 AI-12Si 26 3777 6500 433 9 Courtaulds 220 Al 42 6117 8690 3760 20 Courtaulds 356 Al 70 10,008 14,600 5500 26 Courtaulds HM AI-lOMg 29.5 4280 4500 3600 5 Whittaker-Morgan 356 Al 50 7300 11,300 4100 5 Whittaker-Morgan 7075 Al 21 3040 5100 400 5

264 I IL-______________ C_O __ M_P_O_S_IT_E __ M_A_T_E_R_I_A_L_S ______________ __
Table 2.61 Uniaxial Tensile Data for Aluminum-Silicon Alloy-Thornel-SO Composite Thermally Cycled 20 Times from -193 to +SOO°C (S)
Sample number
C7 CS C9 C10 Average
Ultimate tensile strength (psi)
103 000 100000 100 000 99000
101000
Rule-oj-mixture strength (%)
103 99 99 99
100
Table 2.62 Transverse Tensile Strengths for 3S6 Aluminum-Courtaulds HM Graphite Composite (S)
Transverse strength
Sample number (MNlm2) (psi)
SOSA 91 13100 SOSA SS 12700 SOSA 74 10 700 SOSA 6S 9900 SOSB 79 11S00 S37A 67 9700 S37A 67.S 9S00 S37A 76 11100 S37B 67 9700 S37B 72 10 400
Table 2.63 Corrosion Behavior of Aluminum-Graphite Composite for 1000hr (S)
Environment Distilled water 3.S% NaCi solution
356 aluminum
(SO°C) Nil 4.9
356 aluminum-25 via Thornel-50
(23°C) 1.2 4.7
(SO°C) 1.2 9.S

METAL MATRIX COMPOSITES I I
265
Table 2.64 Tensile Properties of AI20 3-Whisker-Nickel Composites at 25 and 1000°C(5)
Test Whisker Composite Strength-to-Type of temperature volume strength density composite (0C) fraction (vlo) (MNlm2 ratio (1rY' cm)
Continuous 25 22 1230 1.63 25 51 1050 1.68 25 39 1350 2.0
1000 16 282 0.114 1000 21 495 0.665 1000 21 495 0.67 1000 29 759 1.08
Discontinuous 25 28 621 0.845 25 19 1180 1.52 25 11 938 1.14
1000 17 451 0.542 1000 28 106 0.144 1000 10 269 0.33 1000 20 618 0.80
Table 2.65 Off-Axis Tensile Properties of Ti-6AI-4V-28 vlo SiC (5)
Average Strength (ksi)
Filament Ultimate Elastic orientation tensile Proportional modulus Poisson's (degrees) strength limit (1 rY' psi) ratio
0 142 117 36 0.275 15 135 117 35 0.277 30 113 104 32 0.346 45 107 75 31 0.346 90 95 53 28 0.250
Table 2.66 Properties of Ti-6AI-4V-50 vlo Borsic Composites (5)
Elastic Elastic Coefficient Tensile Failure modulus modulus of
Temperature Orientation strength strain (1 rY' psi) (1rY' psi) expansion (OF) (degrees) (ksi) (min.lin.) Tensile Flexure (10-6;0 F)
70 0 140 3340 41.5 34.4 2.50 70 15 100 3220 36.8 33.3 70 45 66 4220 31.2 31.8 70 90 42 3130 29.8 31.2 3.17 500 0 119 33.2 2.80 700 0 107 32.4 850 0 109 31.5 3.17 850 15 86 29.9 850 45 53 27.6 850 90 35 24.4 3.64
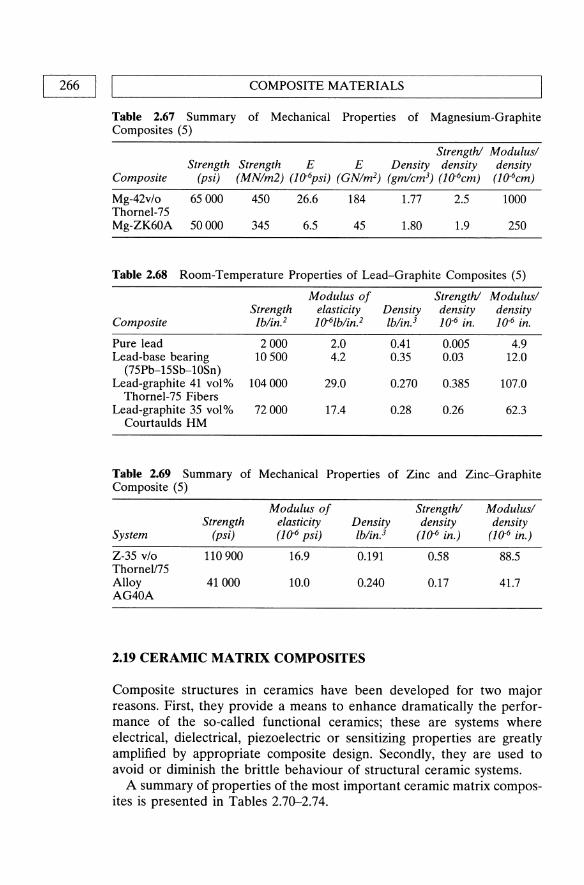
266 II L ________________ C_O_M_P_O_S_IT_E __ M_A_T_E_R_I_A_L_S ______________ ~
Table 2.67 Summary of Mechanical Properties of Magnesium-Graphite Composites (5)
Strength! Modulus/ Strength Strength E E Density density density
Composite (psi) (MN/m2) (10-6psi) (GN/m2) (gm/cm3) (10-6cm) (10-6cm)
Mg-42v/o Thornel-75 Mg-ZK60A
65000 450 26.6 184 1.77 2.5 1000
50000 345 6.5 45 1.80 1.9 250
Table 2.68 Room-Temperature Properties of Lead-Graphite Composites (5)
Modulus of Strength! Modulus/ Strength elasticity Density density density
Composite /b/in.2 10-6Ib/in.2 Ib/in.3 10.6 in. 10.6 in.
Pure lead 2000 2.0 0.41 0.005 4.9 Lead-base bearing 10500 4.2 0.35 0.03 12.0
(75Pb-15Sb-lOSn) Lead-graphite 41 vol% 104000 29.0 0.270 0.385 107.0
Thornel-75 Fibers Lead-graphite 35 vol% 72000 17.4 0.28 0.26 62.3
Courtaulds HM
Table 2.69 Summary of Mechanical Properties of Zinc and Zinc-Graphite Composite (5)
Modulus of Strength! Modulus/ Strength elasticity Density density density
System (psi) (1&6 psi) Ib/in.3 (10-6 in.) (10-6 in.)
Z-35 v/o 110 900 16.9 0.191 0.58 88.5 ThorneU75 Alloy 41000 10.0 0.240 0.17 41.7 AG40A
2.19 CERAMIC MATRIX COMPOSITES
Composite structures in ceramics have been developed for two major reasons. First, they provide a means to enhance dramatically the performance of the so-called functional ceramics; these are systems where electrical, dielectrical, piezoelectric or sensitizing properties are greatly amplified by appropriate composite design. Secondly, they are used to avoid or diminish the brittle behaviour of structural ceramic systems.
A summary of properties of the most important ceramic matrix composites is presented in Tables 2.70-2.74.

CERAMIC MATRIX COMPOSITES I I 267 ~------------------------------------------------------~
Table 2.70 Glass and Glass ceramics suitable as matrices (4)
Major Minor Maximum use Matrix type constituent constituent temperature
Glass 7740 Boro-silicate BP3' Si02 Na20, Al20 3 600°C 1723 Alumino- A120 3, MgO, CaO, Si02 B20 3, BaO 700°C
silicate 7930 High silica Si02 B20 3 1150°C
Glass ceramics LAS I Li20, A120 3, MgO, Si02 ZnO, ZrO, BaO 1000°C LAS II Li20, AlP3' MgO, ZnO, Zr02, BaO ll00°C
Si02, Nb20 5
LAS III Lip, A120 3, MgO, Si02, Zr02 1200°C NbP3
MAS MgO, A120 3, Si02 BaO 1200°C BMAS BaO, MgO, AlP3' Si02 1250°C
Table 2.71 Properties of silicon nitride and carbon/silicon nitride (4)
Property
Bulk density (g/cm3) Fibre content (vol.%) Bending strength (MPa) Young's modulus (GPa) Fracture toughness (MPa m1l2)
Work of fracture (1/m2)
3.44
473±30 247±16 3.7±0.7 19.3±
2.7 30
454±42 188±18 15.6±1.2
4770±770
Table 2.72 Room temperature strengths of RBSN* and SiClRBSN (4)
Test
Four point bend Three point bend Tensile
0% Fiber
107±26
Axial strength (MPa)
23% Fiber
539±48 717±80 352±73
* RBSN - Reaction bonded silicon nitride.
40% Fiber
616±36 958±45 536±20
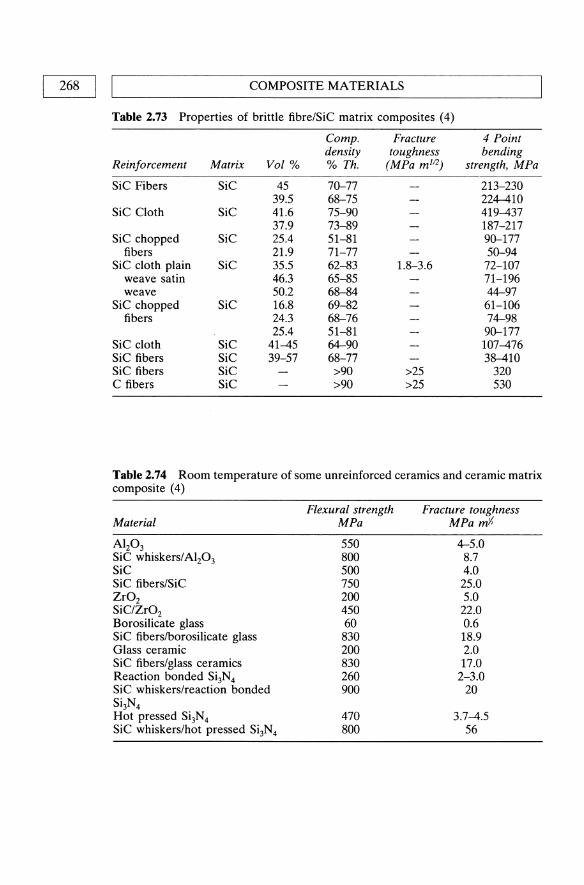
268 I I COMPOSITE MATERIALS
Table 2.73 Properties of brittle fibre/SiC matrix composites (4)
Compo Fracture 4 Point density toughness bending
Reinforcement Matrix Vol % % Th. (MPa m I12) strength, MPa
SiC Fibers SiC 45 70-77 213-230 39.5 68-75 224-410
SiC Cloth SiC 41.6 75-90 419-437 37.9 73-89 187-217
SiC chopped SiC 25.4 51-81 90-177 fibers 21.9 71-77 50-94
SiC cloth plain SiC 35.5 62-83 1.8-3.6 72-107 weave satin 46.3 65-85 71-196 weave 50.2 68-84 44-97
SiC chopped SiC 16.8 69-82 61-106 fibers 24.3 68-76 74-98
25.4 51-81 90-177 SiC cloth SiC 41-45 64-90 107-476 SiC fibers SiC 39-57 68-77 38-410 SiC fibers SiC >90 >25 320 C fibers SiC >90 >25 530
Table 2.74 Room temperature of some unreinforced ceramics and ceramic matrix composite (4)
Material
Al20 3
SiC whiskers/Alz03 SiC SiC fibers/SiC Zr02 SiOZr02
Borosilicate glass SiC fiberslborosilicate glass Glass ceramic SiC fibers/glass ceramics Reaction bonded Si3N4 SiC whiskers/reaction bonded Si3N4 Hot pressed Si3N4 SiC whiskers/hot pressed Si3N4
Flexural strength MPa
550 800 500 750 200 450 60 830 200 830 260 900
470 800
Fracture toughness MPa mi
4-5.0 8.7 4.0 25.0 5.0 22.0 0.6 18.9 2.0 17.0 2-3.0
20
3.7-4.5 56

L-__________________ R_E_F_E_R_E_N_C_E_S __________________ ~I I 269
REFERENCES
1. Seymour, R.B. (1990) Polymer Composites, VSP, Utrecht, The Netherlands. 2. Weatherhead, R.G. (1980) FRP Technology, Applied Science Publishers,
London. 3. Biocompatible Polymers, Metals, and Composites, edited by M. Szycher,
Technomic Publishing Co. Inc. 4. Islam, M.U., Wallance, W. and Kandeil, A.Y. (1985) Artificial Composites for
High Temperature Applications, Noyes Data Corporation, Park Ridge, New Jersey, USA.
5. Kreider, Kenneth G. (1974) Metallic Matrix Composites, Vol. 4, Academic Press, New York and London.
6. Hawkins, W.L. (1984) Polymer Degradation and Stabilization, Springer-Verlag. 7. Environmental Effects on Advanced Composite Materials, symposium
presented at the seventy-eighth Annual Meeting ASTM, Philadelphia, 1975. 8. Hill, R. (1964) J. Mech. Phys. Solids, 12, 199. 9. Hermann, J.1. (1970) Proc. Konigl. Nederl. Akad. Weteschappen Amsterdam,
870, l. 10. Halpin, J.e. and Pagano, N.J. (1964) J. Compos. Mater., 3, 720.

3 Thermoplastic Polymers In Biomedical Applications:
Structures, Properties and Processing
S.H. Teoh, Z.G. Tang and G.W. Hastings
3.1 INTRODUCTION
In general thermoplastic polymers are made up of long linear chain molecules which exhibit large scale chain mobility and deformation under shear forces above their softening temperature. This change is reversible. Above this temperature the thermal motions of the chain segments are sufficient to overcome inter- and intra-molecular forces. At room temperature the material is a viscoelastic solid. Their behaviour is dependent on chain morphology, structure, crystallinity and the types of additives added (often to aid processing). The materials can easily be processed into different type of products and are considered to be the most important class of plastic materials commercially available. The processability of this class of plastics is a key characteristic for developing biomedical applications.
Nine potential biomedical applications areas have been identified (Jones and Denning, 1988):
1. Membranes in extracorporeal applications such as oxygenators; 2. Bioactive membranes e.g., controlled release delivery systems and arti
ficial cells;
Handbook of Biomaterial Properties. Edited by J. Black and G. Hastings. Published in 1998 by Chapman & Hall, London. ISBN 0 412 60330 6.

INTRODUCTION I I 271 L-____________________________________________________ ~
3. Disposable equipment e.g., blood bags and disposable syringes; 4. Sutures and adhesives including biodegradable and non-biodegradable
materials; 5. Cardiovascular devices such as vascular grafts; 6. Reconstructive and orthopaedic implants; 7. Ophthalmic devices such as corneas and contact lens; 8. Dental restorative materials including dentures; 9. Degradable plastic commodity products.
This section focuses on 12 thermoplastic polymers which have found wide application in the above. Each part deals with one polymer or one group of polymers of structural similarity. The content includes the chemical structure, structure-property relationships, tables of physical, mechanical and thermal properties, and processing conditions of each candidate thermoplastic. Some properties can be predicted from the structural characteristics of the polymers.
In general, for a given polymer, higher molecular weight tends to improve mechanical properties, but the increase in the resistance to flow in the fluid state makes processing more difficult and costly. A wide range of molecular weight is generally more appropriate for processing of each polymer. The effect of branching in otherwise linear molecules is significant. Short but numerous branches irregularly spaced may reduce considerably the ability of portions of linear chains to form crystal-like domains, and the corresponding polymer will display a lower stiffness, a good example being the highly branched low-density polyethylene of lower degree of crystallinity than the less branched high density product. Tacticity of polymer molecules greatly affects crystallinity and stiffness. For example, commercial polypropylene is usually about 90-95% isotactic, and is stiff, highly crystalline and with a high melting point, whereas the atactic polypropylene is an amorphous somewhat rubbery material of little value. Within the range of commercial polymers, the greater the amount of isotactic material the greater the crystallinity and hence the greater the softening point, stiffness, tensile strength, modulus and hardness. The inter-molecular and intra-molecular forces also influence the properties of polymers. The hydrogen bonds or van der Waal's and other dispersion forces between adjacent molecules produce a large increase in melting temperature. A high energy barrier to molecular rotations hinders the ability of molecules to take up the required conformations to form crystals. Polymethylmethacrylate (PMMA), and polycarbonate exist in an amorphous state and are completely transparent. The crystallinity is controlled by both structural factors and processing conditions. From the processing standpoint, the higher the crystallinity, the bigger the shrinkage observed after product processing. Thermoplastic polymers exist in semi-crystalline and amorphous states. The ratio of these two states affects material

272 I I THERMOPLASTIC POLYMERS IN BIOMEDICAL APPLICATIONS
properties strongly and can be characterized using X-ray analysis and by observing the thermal behaviour of the polymers. Amorphous thermoplastics are normally transparent and do not have a fixed melting temperature like that of the semi-crystalline thermoplastics. They are also less resistant to solvent attack. Semi-crystalline thermoplastics, because of the presence of crystallites, are more fatigue and wear resistant. A typical case is polyacetal which has more than 20 years of in vivo experience as an occluder in the Bjork-Shiley tilting disc mechanical heart valves.
A main requirement for a polymeric candidate is its biocompatibility with biological tissues and fluids. Biocompatibility will depend on the polymer intrinsic chemical nature and the additives present. It is a complex issue not dealt with here. It is not always possible to distinguish the medical-grade polymers from the conventional polymers. They may come from a batch intended for general purposes, but are selected on the basis of clean condition or trace element analysis or mechanical properties. Subsequent processing requires clean room conditions and care to avoid any contamination. There is still some inherent uncertainty about constituents unless there has been complete disclosure and/or only a 'pure' polymer is used. With new developments in polymeric biomaterials, the situation should improve.
It is hoped that the following sections will be of value to researchers in science and engineering and to clinical practitioners who are engaged in the development and material selection of new thermoplastic polymers for biomedical applications.
3.2 POLYETHYLENE
Commercially, polyethylene is produced from ethylene in various densities (from linear low to ultra high). There are four quite distinct processes to the preparation of commercial polymers of ethylene: (a) high pressure processes, (b) Ziegler processes, (c) the Phillips process, (d) the Standard Oil (Indiana) process. High pressure polymers (British patent 471590, 1930) are of the lower density range for polyethylene (0.915-0.94 g/cm3 )
and usually also of the lower range of molecular weights. Until the mid-1950s, all commercial polyethylenes were produced by high pressure processes. These materials were branched materials and of moderate number average molecular weight, generally less than 50 000. Ziegler polymers (Ziegler, 1955) are intermediate in density (ca. 0.945 g/cm3) between the high pressure polyethylenes and those produced by the Phillips and Standard Oil processes. Phillips polymers have the highest density of any commercial polythylenes (ca. 0.96 g/cm3) Ziegler and Phillips processes produce polymers at lower temperature and pressures with a modified

POLYPROPYLENE I I 273 ~----------------------------------------------------~
structure giving a higher density, greater hardness higher softening points. The Standard Oil process gives a density of about 0.96 g/cm3) similar to the Phillips materials. Processes, such as a gas phase process developed by Union Carbide for making linear low density polyethylene (LLDPE), were aimed to produce polyethylenes with short chain branch but no long chain branch. High pressure polymers have more branching and even with side chains as long as the main chain. In contrast, the high density polyethylene (HDPE) produced by the Ziegler or Phillips methods has only 3 to 5 branches per 1000 C-atoms and the linear low density PE has very few branches. The weak point in the chain which is sensitive to degradative environmental effects is located at the branching site. The amount of branches in polyethylene also influences the crystallinity of polyethylene. A higher degree of crystallinity and associated denser packing leads to higher density and larger crystals (LDPE< 1 !-Lm; LLDPE, 2-4 !-Lm; HDPE, 2-8 !-Lm). The crystallinity IS increased with slower cooling rate. Only the HDPE and the ultra high molecular weight polyethylene (UHMWPE) find extensive medical applications.
Chemically, polyethylene is inert and there are no effective solvents at room temperature. However, polyethylene is subject to oxidation and halogenation. Chemicals like nitric acid produce oxidative deterioration and affect mechanical properties of polyethylene. The environmental oxidation of polyethylene happens at high temperature, under ultra-violet light and/or high energy irradiation, e.g., gamma irradiation. Polyethylene should be kept from contact with halogenating agents and environments. The lower molecular weight polyethylene may be dissolved at high temperature and swollen by chemicals such as benzene and xylene. The resistance to environmental stress cracking (ESC) increases with molecular weight, (copolymers being more resistant than homopolymers).
3.3 POLYPROPYLENE
Polypropylene is an addition polymer of propylene. The chemical structure of polypropylene is often described as the repeating unit of 2-methyl ethylene. During polymerization, the CH3 groups characteristic of this olefin can be incorporated spatially into the macromolecule in different ways. The resulting products have different properties and are classified as a. isotactic polypropylene, where the CH3 groups are on the same side of the main chain; b. syndiotactic polypropylene, where the CH3 groups are symmetrically arranged on the two sides of the main chain; c. atactic polypropylene, where the CH3 groups are randomly distributed in the spatial relationship to the main chain.
The atactic polymer is an amorphous somewhat rubbery material of little value, whereas the isotactic polymer stiff, highly crystalline and with

274 I I THERMOPLASTIC POLYMERS IN BIOMEDICAL APPLICATIONS
high melting point. Commercial polymers are usually about 90--95 % isotactic. Within the range of commercial polymers, the greater the amount of isotactic material, the greater the crystallinity, and hence the greater the softening point, stiffness, tensile strength, modulus, and hardness. The properties of the polymer will depend on the size and type of crystal structure formed in its construction.
Molecular weights of polypropylenes are in the range Mn = 38 000-60 000 and Mw = 220 000--700 000 with the values of MJMn = 5.6-11.9, higher than those encountered normally in polyethylene. The high molecular weight polymer from propylene was introduced in 1954 by G. Natta using a modified Ziegler process, and commercialized in 1957 by Montecatini under a trade name Moplen. This was followed in 1983 by the Spheripol process; in 1988, the Valtec process; and in 1990, Himont process. The greatest influence of molecular weight and molecular weight distribution is on the rheological properties. Rheological investigations show that polypropylene deviates more strongly from Newtonian behaviour than does polyethylene. The effect of shear rate on the apparent melt viscosity is greater for polypropylene
Although polypropylene and polyethylene are similar structurally,. polypropylene has a lower density around 0.90 glcm3 and a higher Tg and T m' The higher melting point of polypropylene gives the option for autoclave sterilization. The chemical resistance of polypropylene is similar to high density polyethylene, but it is more susceptible to oxidation, chemical degradation and crosslin king (irradiation, violet light and other physical means) than polyethylene. Polypropylene is better in creep resistance and in resisting environmental stress cracking than polyethylene.
3.4 POLYURETHANE
Polyurethanes are block copolymers containing blocks of low molecular weight polyethers or polyesters linked together by a urethane group. The variety of linkages in polymers results from the further reaction of urethane groups with isocyanates and of isocyanates with amines, water, or carboxylic acids.
Attention in this section will be focussed on the thermoplastic polyurethane elastomers. These polymers are based on three monomers: (1) an isocyanate source, (2) a macroglycol or carbonate, and (3) a chain extender, or curing agent. The isocyanates can be either aromatic or aliphatic. Although the aliphatic based polyurethanes are more expensive, and inferior in physical properties they do not show the embrittlement, weakening, and progressive darkening of the aromatic equivalents.
The final physical and biological properties of the polyurethanes depend principally on the type of macroglycol used in the synthesis. The

POLYTETRAFLUOROETHYLENE I I 275 ~----------------------------------------------------~
polyether-based polyurethanes are less sensitive to hydrolysis, and are thus more stable in vivo. The polycaprolactone-based polyurethanes, due to their quick crystallization, can be used as solvent-activated, pressuresensitive adhesives. For medical applications, the polyether-based polyurethanes, particularly those based on poly tetra methylene ether glycol (PTMEG) have been used. Among chain extenders, there are two choices: either difunctional or multifunctional monomers. For the production of linear elastomers, only difunctional chain extenders are used, of these, diols and diamines are by far the most important. The chain extenders for the thermoplastic polyurethanes must be linear diols, among which, l,4-butane diol has been chosen for medical applications. This chain extender produces thermoplastic polyurethanes with high physical properties, excellent processing conditions and clear polymers.
Polyurethane elastomers are a mixture of crystalline (hard segment) and amorphous domains(soft segment), and the hard segments are considered to result from contributions of the diisocyanate and chain extender components. They significantly affect mechanical properties, particularly modulus, hardness and tear strength. Soft segments therefore affect the tensile strength and elongation at yield and break.
Polyurethanes are sensitive to strong acids, strong alkalis, aromatics, alcohols, hot water, hot moist air and saturated steam. The hydrolytic stability of polyurethanes in applications must be considered carefully. However, polyurethanes are resistant to weak acids, weak alkalis, ozone, oxygen, mineral grease, oils and petroleum. There are doubts for the oxidation stability of polytetramethylene ether glycol based polyurethanes. Polycarbonate urethane is a promising substitute with good oxidation stability.
The thermoplastic polyurethanes are characterized by the following properties: a. high elongation at break and high flexibility (also at low temperature), b. low permanent deformation on static and dynamic loading, c. favourable friction and abrasion performance, d. high damping power, e. high resistance to high energy and UV radiation, and f. plasticizer free,
3.5 POLYTETRAFLUOROETHYLENE
Polytetrafluoroethylene, PTFE, is the polymerization product of tetrafluoro ethylene discovered in 1938 by R.J. Plunkett of Du Pont. The polymer is linear and free from any significant amount of branching. The highly compact structure leads to a molecule of great stiffness and results in a high crystalline melting point and thermal stability of the polymer.
The weight average molecular weights of commercial PTFE are in the range 400 000 to 9 000 000. The degree of crystallinity of the polymer

276 I I THERMOPLASTIC POLYMERS IN BIOMEDICAL APPLICATIONS
reaches 94%. The properties of PTFE moldings are considerably influenced by the processing conditions and polymer grades. After processing, cooling conditions determine the crystallinity of the molding. Slow cooling leads to higher crystallinity which affects the physical properties as well as mechanical and thermal properties.
PTFE is a tough, flexible material of moderate tensile strength with excellent resistance to heat, chemicals and to the passage of an electric current. The polymer is not wetted by water and absorption is not detectable. The permeability to gases is low, the water vapour transmission rate being approximately half that of low density polyethylene and polyethylene terephthalate. It has the lowest coefficient of friction of all solids and the dynamic and static coefficients of friction are equal, i.e. stick-slip does not occur. Abrasion resistance is low. The thermal stability of PTFE is excellent up to 300°C but it is degraded by high energy radiation.
Phase transition behaviour precludes the use of the conventional molding methods, and PTFE can be processed by employing a process similar to that of metallurgical sintering. In 1963, Shinsaburo Oslinge of Sumitomo Industries in Japan discovered a process for expanding PTFE during extrusion. The e-PTFE has been considered for fabrication of vascular grafts.
Apart from its good slip and wear characteristics the advantages of PTFE are: a. almost universal chemical resistance, b. insolubility in all known solvents below 300°C, c. high thermal stability, d. continuous service temperature range -270 to 260°C, e. low adhesion, f. low coefficient of friction, g. outstanding electrical and dielectric properties, h. resistant to stress cracking and weathering, but limited use in structural components because of the low modulus of elasticity.
3.6 POL YVINYLCHLORIDE
Commercial PVC polymers are largely amorphous, slightly branched molecules with the monomer residues arranged in a head-to-tail sequence. The molecular weights for most commercial polymers are in the range of Mw = 100000-200000, Mn = 45 000-64 000 although values may be as low as 40 000 and as high as 480 000 for the weight average molecular weight. The ratio of Mn/Mw is usually about 2 for the commercial material although it may increase with the higher molecular weight grades.
The polarity and strong inter-chain attraction gives a higher hardness and stiffness than polyethylene. Thus PVC has a higher dielectric constant and power factor than polyethylene, although at temperatures below the glass transition temperature the power factor is still comparatively low (0.01-0.05 at 60 Hz) because of the immobility of the dipole. PVC is

~ ___________________ PO __ LY __ A_M_I_D_E_S __________________ ~I I 277
mainly used in a plasticized form. There are many materials that are suitable plasticisers for PVc. They have similar solubility parameters to PVC, i.e., about 19.4 MPaP and are also weak proton acceptors and may be incorporated by mixing at elevated temperatures to give mixtures stable at room temperature.
The release of low molecular weight plasticizer has resulted in polymeric plasticisers being developed, but esters are still widely used and are effective in plasticisation. (Black, 1992; Brydson, 1982, and Park and Lakes, 1992).
Characteristic properties are:
3.6.1 Unplasticized PVC
a. high mechanical strength., rigidity and hardness, b. low impact strength in unmodified form, c. translucent to transparent (depending on method of manufacture), d. good electrical properties in the low voltage and low frequency range, and e. high chemical resistance.
3.6.2 Plasticized PVC
a. flexibility adjustable over a wide range, b. depending on type of plasticiser, toughness very temperature dependent, c. translucent to transparent, d. good electrical properties in the low voltage and low frequency range, e. chemical resistance is dependent on the formulation and very dependent on temperature, and f. the polymers contain less than 1 ppm vinyl chloride monomer.
3.7 POLYAMIDES
Chemically, the polyamides may be divided into two types: a. those based on diamines and dibasic acids, and b. those based on amino acids or lactams (Chapman and Chruma, 1985). Commercial use of nylons is dominated by two products, one from each type, nylon 66 and nylon 6 from e-caprolactam.
Aliphatic polyamide is linear and easy to crystallize but crystallinity varies widely with conditions. Crystalline content may be 50-60% by slow cooling and 10% by fast cooling. High interchain attraction in the crystalline zones and flexibility in the amorphous zones leads to polymers which are tough above their apparent glass transition temperatures (Brydson, 1982).
Polyamides have excellent fibre-forming capability due to interchain Hbonding and a high degree of crystallinity which increases strength in the fibre direction (Park and Lakes, 1992). Polyamides are hygroscopic and

278 I I THERMOPLASTIC POLYMERS IN BIOMEDICAL APPLICATIONS
lose strength in vivo. The amorphous region of polyamide chains is sensitive to the attack of water. The greater the degree of crystallinity, the less the water absorption and hence the less the effect of humidity on the properties of the polymer. The reversible absorption of water is associated with a change in volume and thus of dimensions.
The mechanical properties of moulded polyamide materials depend on molecular weight, crystallinity and moisture content. In the dry, freshly molded state, all polyamide grades are hard and brittle. When conditioned they are tough and wear resistant. High melting points result in good mechanical properties up to temperatures in the region of 120-150 0c.
They are only soluble in a few solvents (formic acid, glacial acetic acid, phenols and cresols), of similar high solubility parameter. Nylons are of exceptionally good resistance to hydrocarbons. Esters, alkyl halides, and glycols have little effect on them. Alcohols can swell the polymers and sometime dissolve some copolymers. Mineral acids attack the nylons but the rate of attack depends on the type of nylon and the nature and concentration of the acid. Nitric acid is generally active at all concentrations. The nylons have very good resistance to alkalis at room temperature. Resistance to all chemicals is more limited at elevated temperature (Brydson, 1989).
Generally, polyamides are characterized by: a. high strength, stiffness and hardness, b. high heat distortion temperature, c. high wear resistance, good slip and dry-running properties, d. good damping capacity, e. good resistance to solvents, fuels and lubricants, f. non-toxicity, g. good processability, h. aliphatic polyamides are partially crystalline and thus opaque, and i. moisture content impairs mechanical properties and affects dimensions of moldings.
3.8 POLYACRYLATES
Polyacrylates are based on acrylic acid, methacrylic acid, and their esters. Among them, polymethylmethacrylate (PMMA) and polyhydroxy ethylmethacrylate (PHEMA) have found wide applications as biomedical materials. The clinical history of polyacrylates began when it was unexpectedly discovered that the fragments of PMMA plastic aircraft canopies stayed in the body of the wounded without any adverse chronic reactions (Jones and Denning, 1988; Park and Lakes, 1992).
In normal conditions, PMMA is a hard transparent material. Molecular weight is the main property determinant. High molecular weight PMMA can be manufactured by free radical polymerization (bulk, emulsion, and suspension polymerisation). Bulk polymerization is used for cast semifinish products (sheet, profiles and even tubes), and the cast polymer is distinguished by superior mechanical properties and high surface finish

POLYACETAL I I 279 L-____________________________________________________ ~
(Brydson, 1982 and Domininghaus, 1993). Cast material has a number average molecular weight of about 106 whilst the Tg is about 106°C. The extensive molecular entanglement prevents melting below its decomposition temperature (approx. 170°C).
An amorphous polymer, PMMA has a solubility parameter of about 18.8 MPaI!' and is soluble in a number of solvents with similar solubility parameters. Solvents include ethyl acetate (8: 18.6 MPaJ!), ethylene dichloride (8: 20.0 MPaJ!), trichloroethylene (8: 19 MPaJ!), chloroform (8: 19 MPaJ!), and toluene (8: 20 MPaJ!). The polymer is attacked by mineral acids but is resistant to alkalis, water and most aqueous inorganic salt solutions. A number of organic materials although not solvents may cause crazing and cracking (e.g. aliphatic alcohols).
The characteristic properties of PMMA are, a. high hardness, stiffness and strength, b. homopolymers are brittle, copolymers are tough, c. scratch-resistant, high gloss surface capable of being polished, d. waterwhite transparency, copolymers exhibit inherent yellowish color, e. high heat distortion temperature, f. good electrical and dielectric properties, g. resistant to weak acids and alkaline solution as well as to non-polar solvents, grease, oils and water, h. susceptible to stress cracking, i. flammable, j. good process ability and machinability, k. rather low resistance to creep at temperature only slightly above room temperature, and l. high melt viscosity due to the high chain stiffness caused by restricted rotations about the C-bonds in the backbone chains
3.9 POLYACETAL
Polyacetal can be divided into two basic types, acetal homoploymer and acetal copolymer. Both homopolymer and copolymer are available in a range of molecular weights (Mn = 20000-100000). The homopolymer is a polymer of formaldehyde with a molecular structure of repeated oxymethylene units (Staudinger, 1932). Large-scale production of polyformaldehyde, i.e. polyacetal, commenced in 1958 in the USA (US Patent 2768994, 1956) (British patent 770 717, 1957). Delrin (1959) was the first trade mark for this polymer by Du Pont Company. The copolymers were introduced by the Celanese Corporation of America, and the first commercial product named Celcon (1960). One of the major advantages of copolymerization is to stabilize polyacetal because the homopolymer tends to depolymerize and eliminate formaldehyde. The most important stabilization method is structural modification of the polymer by, for example, copolymerization with cyclic ether.
As can been seen polyacetal has a very simple structure of a polyether. Unlike polyethylene, polyacetal has no branching, and its molecules can pack more closely together than those of polyethylene. The resultant

280 I I THERMOPLASTIC POLYMERS IN BIOMEDICAL APPLICATIONS
polymer is thus harder and has a higher melting point than polyethylene (175°C for homopolymer), exhibiting a high crystallinity (77-85%).
No effective solvents have been found for temperatures below 70°C. Swelling occurs with solvents of similar solubility parameter (5: 22.4 MPa/). However, polyacetal should be kept away from strong acids, strong alkalis, and oxidizing agents. Water can not degrade it but may swell it or permeate through it and affect the dimensions of its products. Prolonged exposure to ultra-violet light will induce surface chalking and reduce the molecular weight of the polymers. Polyacetals, both homopolymer and copolymer are also radiation sensitive. The radiation damage threshold is estimated at 0.5 Mrad with 25% damage at 1.1 Mrad (Szycher, 1991).
Generally, the polyacetals have the following characteristics, a. high tensile strength, shear strength, stiffness, and toughness, b. predictable stress/ strain relationships, c. predictable dimensional behavior, d. chemical and corrosion resistance, e. abrasion resistance, f. light weight and good appearance, g. acceptability for food contact application (most grades), h. ease of processing, and i. competitive costs.
The enormous commercial success of the polyacetals is owed to their very high resistance to creep and fatigue. The acetal resins show superior creep resistance to the nylons.
3.10 POLYCARBONATE
Polycarbonate, PC, is a linear thermoplastic based on the bis-phenol A dihydroxy compound. In 1898 Einhorn reacted dihydroxybenzenes with phosgene in solution in pyridine (Brydson, 1982), and production began in both Germany and USA in 1958. General purpose polycarbonate is a linear polyester of carbonic acid in which dihydric phenols are linked through carbonate groups, while standard grades are made from bisphenol A and phosgene (Carhart, 1985).
The rigid molecular back bone of bis-phenol A PC leads to high melting temperature (T m = 225-250°C) and high glass transition temperature (T g
= 145°C). The polymer does not show any crystallinity. After annealing polymer between 80 and 130°C there is a small increase in density and hence there must be a decrease in free volume, and a large drop in impact strength; impact strength may be reduced by annealing crystallization and aging (Brydson, 1982).
The limited crystallinity contributes to the toughness of PC. Highly crystalline samples prepared by heating for prolonged periods above their T g
or by precipitation from solution are quite brittle. Although of good impact strength and creep resistance tensile strain of 0.75% or more produces cracking or crazing. The refractive index of PC lies in the range

~ ___________ PO __ L_Y_E_T_H_Y_L_E_N_E_TE __ R_E_P_H_T_H_A_L_A __ T_E __________ ~I I 281
of 1.56 to 1.65 (higher than PMMA and silicone rubber) and the transparency of 85 to 90% is reached in the region of visible light (Domininghaus, 1993).
The chemical resistance of PC is poor and hydrolysis of aliphatic PC s is more prominent than that of bis-phenol A PC s. There is resistance to dilute (25%) mineral acids and dilute alkaline solutions other than caustic soda and caustic potash. Where the resin comes into contact with organophilic hydrolysing agents such as ammonia and the amines, the benzene rings give little protection and reaction is quite rapid. The absence of both secondary and tertiary C-H bonds leads to a high measure of oxidative stability. Oxidation takes place only when thin films are heated in air to temperatures above 300°C.
Typical properties include: a. low density, b. high strength, stiffness, hardness and toughness over the range from -150 to + 135°C unreinforced and from -150 to +145°C when reinforced, c. crystal clear transparency, high refractive index, high surface gloss, d. can be colored in all important shades, transparent, translucent or opaque with great depth of color, e. good electrical insulation properties which are not impaired by moisture, f. high resistance to weathering for wall thicknesses greater than 0.75 mm, g. high resistance to high energy radiation, and h. self-extinguishing after removal of the ignition source.
The main disadvantages are: a. processing requires care, b. limited chemical resistance, c. notch sensitivity and susceptibility to stress cracking.
3.11 POLYETHYLENE TEREPHTHALATE
Polyethylene terephthalate, PET, is a thermoplastic polyester made by condensation reaction of ethylene glycol with either terephthalic acid or dimethyl terephthalate (Margolis, 1985). By the end of the 1920s J.R. Whinfield and J.T. Dickson discovered PET (BP 578079). It was first commercialized by Du Pont in 1930 (Brydson, 1982) as Dacron®, followed by ICI with Terylene® Films and blow-molded articles have become very important commercially.
The average molecular weights are distributed from 15 000 to 20000. The physical properties of PET are largely determined by the degree of crystallinity, which varies between 30 and 40% depending on the processing conditions. The rate of crystallization of PET is considerably less than that of polyacetal (POM) and HDPE. The growth rate of the spherulites is only 10 J.1m/mm for PET compared with 400 J.1m/mm for POM and 5000 J.1m/mm for HDPE (Domininghaus, 1993). To achieve better crystallinity, the mould temperature should be equivalent to that for maximum growth. This point is about 175°C, higher than for POM

282 I I THERMOPLASTIC POLYMERS IN BIOMEDICAL APPLICATIONS
and HDPE. Rapid-crystallization agents, nucleating agents, reduce the process cycle time and permit lower mould temperatures below 100°C, leading to very fine spherulites and hard stiff mouldings. Extrusion and rapid quenching below the temperature at which most crystallization occurs (between 120 and 200°C), produces amorphous materials and this may be followed with uniaxial orientation for fibres and biaxial orientation for films. The orientation is carried out at 100-120°C, the glass transition temperature, Tg being 86°C.
The permeability of water vapor through PET is higher than that of polyolefins but lower than that of polycarbonate, polyamide, and polyaceta!. Antioxidants are necessary to prevent to the oxidation of polyether segments in thermoplastic polyester elastomer. Chemical resistance of PET is generally good to acids, alkalis, and organic solvents.
Typical properties for partially crystalline PET include, a. high strength and stiffness, b. favorable creep characteristics in comparison with POM, c. hard surface capable of being polished, d. high dimensional stability, e. good electrical, mediocre dielectric properties, and f. high chemical resistance except to strong acid and alkaline solution.
3.12 POLYETHERETHERKETONE
Polyetheretherketone, PEEK, is a polymer combining stiff conjugated aromatic groups and flexible ether segments. It was first prepared in the laboratory in 1977 and then marketed in 1978 by ICI, under the trade name of Victrex (Brydson, 1982).
The distribution of aromatic rings and polar flexible groups in the chain affects the glass transition temperature, such that PEEK has a Tg around 145°C and Tm ca. 335°C, PEK (polyether ketone) Tg ca. 165°C and Tm ca. 342°C. Normally the chain stiffness and bulkiness of aromatic rings make it difficult for these polymers to crystallize and although they invariably remain mainly amorphous (Mascia, 1989), PEEK is a partially crystalline thermoplastic. The maximum crystallinity of 48% is achieved from the melt at 256°C and by subsequent conditioning of moldings at 185°C (Domininghaus, 1993). PEEK polymers are capable of melt processing (Brydson, 1982). Other specific features are excellent gamma radiation resistance, and good resistance to environmental stress cracking. PEEK shows excellent chemical resistance and can be used in aggressive environments.
Generally, the main characteristics of this material include, a. high tensile and flexural strength, b. high impact strength, c. high fatigue limit, d. high heat distortion temperature (315°C for 30 glass reinforced), e. good electrical properties over a wide range of temperature, f. favourable slip and wear properties, g. high chemical resistance, h. high resistance to

~ __________________ P_O_L_Y_S_U_L_F_O_N_E __________________ ~I I 283
hydrolysis, j. high resistance to radiation, k. low flammability, very low gas and smoke emission, and 1. easy processing, no thermal after-treatment of injection moldings.
3.13 POL YSULFONE
Polysulfone is a polymer which has properties matching those of light metals (Park and Lakes, 1992). The first commercial polysulfone was introduced in 1965 by Union Carbide as Bakelite Polysulfone, now called Udel®. In 1967 3M offered Astrel 360 referred to as a polyarylsulfone. In 1972 ICI introduced a polyethersulfone Victrex®. A high toughness polysulfone was released in the late 1970s by Union Carbide. Although the commercial polymers are linear and most have regular structures they are all principally amorphous. The backbone aromatic structure leads to high values of the glass transition temperature between 190 and 230De. The Union Carbide materials have a secondary transition at -100DC and the ICI polymer at -70De. Typical Mn values are ca. 23 000. Commercial materials are described variously as polysulfones (Udel), polyarylsulfones (Astrel), polyether sulfones or polyarylethersulfones (Victrex) (Brydson, 1982).
The polymer is manufactured from bisphenol A and 4, 4-dichlorosulphonyl sulfone by multi-step condensation. The most distinctive feature of the backbone chain of those polymers is the diphenylene sulfone group. The sulphur atom in each group is in its highest state of oxidation and tends to draw electrons from the adjacent benzene rings, hence resisting any tendency to lose electrons to an oxidizing agent. Polysulfones thus show outstanding oxidation resistance. The aromatic nature of the diphenylene sulphone can absorb considerable energy applied as heat or radiation and so resists thermal degradation. The diphenylene sulfone group thus confers on the entire polymer molecule the inherent characteristics of thermal stability, oxidation resistance, and rigidity at elevated temperatures.
The potential for energy dissipation confers good impact strength and ductility down to -100DC with high elongation to break and tensile strength. Under most conditions, impact properties rival those of bisphenol A polycarbonate. Unlike polycarbonate, however, polysulfone can exhibit excellent resistance to hydrolysis or reduction of molecular weight even at elevated temperatures. Tests on the hydrolysis stability of polysulfones have been carried out up to 10 000 hours without observed loss of molecular weight.
The polymers are stable in aqueous inorganic acids, alkalis, salt solutions, aliphatic hydrocarbons, and paraffin oils, are transparent, capable of steam sterilization, and free from taste and smell. They should not

284 I I THERMOPLASTIC POLYMERS IN BIOMEDICAL APPLICATIONS
come in contact with ketones, aromatic solvents, chlorinated hydrocarbons, and polar organic solvents. They may show stress crazing on exposure to steam or water. A polyethersulfone, however, exhibited no crazing even after 300 hours and retained 90% of initial tensile impact strength. For a thermoplastic material, creep is low at moderate temperatures but is significant at temperatures approaching the glass transition. However, the wear properties of this material are not as good as PE and POM (Teoh et aI., 1994).
Generally polysulfone has the following characteristic properties, a. high strength, stiffness and hardness between -100 and + lS0°C short-term to 180D C, b. high thermal stability and heat distortion temperature, c. crystal clear (slightly yellowish) transparency, d. high processing temperature, e. high melt viscosity, f. high chemical resistance, g. susceptibility to stress cracking with certain solvents, h. high resistance to (3-, "1-, x- and IR-radiation, i. high transmittance for microwaves, and j. high flame resistance and low smoke development.

Tab
le 3
.1
Che
mic
al s
truc
ture
s of
the
rmop
last
ic p
olym
ers
in b
iom
edic
al a
ppli
cati
ons
1. P
olye
thyl
ene
(PE
)
2. P
olyp
ropy
lene
(P
P)
3. P
olyu
reth
ane
(PU
)
4. P
olyt
etra
fluo
roet
hyle
ne (
PT
FE
)
-[-
(CH
Z-C
HR
)m-(
CH
Z-C
H2)
n-]-
-[ C
Hz-
CH
(C
H3
)]-
isot
acti
c
synd
iota
ctic
at
acti
c
R =
H,
Me,
Et,
...
m
= 1
,2,
.. .
n =
1,2
, ..
. if
R =
H,
line
ar a
nd
hig
h de
nsit
y if
R *
-H,
bran
ched
and
low
er d
ensi
ty
H
H
H
I H
I
H
I
,../
c-.
....
....
I,..
/c-.
....
....
I/c-.
....
....
I C
I
C
I
H
I H
I
H
CH
3 C
H3
H
H
H
I H
I
CH
3 I
,../
c-.
....
....
I,..
/c-.
....
....
I,..
/c-.
....
....
I C
I
C
I
H
I H
I
H
CH
3 H
H
H
H
I H
I
CH
3 I
,../
c-.
....
....
I,..
/c-.
....
....
I,..
/c-.
....
....
I C
I
C
I
H
I H
I
CH
3 C
H3
H
-{O
-[(C
HZ
)xO
]n-C
ON
H-R
-NH
CO
-O(C
H2
) -O
CO
NH
-R-N
HC
O)-
-{O-[(CH2)P]n-CONH-R-NHCO-NH(C~\-NHCONH-R-NH
CO}-
R =
ali
phat
ic o
r ar
omat
ic g
roup
s x
and
n fo
r so
ft s
egm
ent,
y f
or e
xten
der
in r
igid
seg
men
t
F F
I I
-[-C
-C
-]-
I I
t:I
t:I

Tab
le 3
.1
Con
tinu
ed
5. P
olyv
iny1
chlo
ride
(P
VC
)
6. P
olya
mid
e (P
A)
7. P
olya
cryl
ate
(PM
MA
)
8. P
olya
ceta
l (P
OM
)
9. P
olyc
arbo
nate
(P
C)
H
H
I I
-[-C
-C
-]-
I I
H
CI
-[N
H-(
CH
2)x
-NH
CO
-(C
H2
)y-C
O]
nylo
nx+!
,y+!
an
d -[
NH
-(C
H2
)x-C
O]-
nylo
nx+!
R I
-(C
H2
-C
-) -
I CO
OR
'
-{(C
H2
-0
)0 -
[CH
2-C
H2-
(R)x
-0]m
jR
= C
H2
X =
0,
1,2
m
= 0
,1,2
n
= 1
,2,3
if
x =
m =
0,
hom
opol
ymer
if
x#m~ c
opol
ymer
CH
3 0
-@-I
-@-
II -[-0
0
I 0
O-C
-]-
CH
3

Tab
le 3
.1
Con
tinu
ed
10.
Pol
yeth
ylen
e te
reph
thal
ate
(PE
T)
o 0
-[CH
2-CH
2-0-
~ --@-~ -0
]-11
. P
olye
ther
ethe
rket
one
(PE
EK
) u
-[--
@-~-
-@-O
--@-
O-]-
12.
Pol
ysul
fone
(PS
) CH 3
0
-[--@-~--@-O--@-~--@-O-]-
CH 3
0 o
-[--
@-~-
-@-O
-]-
o o 0
--@
---
@-I
I-@
-@
-II
-[
0
0 0
s 0
0 s-]-
II II
o 0

Tab
le 3
.2
Pro
pert
ies
of
ther
mop
last
ic p
olym
ers
in b
iom
edic
al a
ppli
cati
ons
a. P
hysi
cal
prop
erti
es
Phy
sica
l pr
oper
ties
U
nit
PE
P
P
PU
P
TF
E
PV
C
PA
Den
sity
g/
cm3
0.95
4-0.
965
0.90
--0.
915
1.02
-1.2
8 2.
10-2
.20
1.16
-1.7
0 1.
02-1
.15
Wat
er a
bsor
ptio
n %
0.
001-
0.02
0.
01-0
.035
0.
1-0.
9 0.
01-0
.05
0.04
-0.7
5 0.
25-3
.5
Sol
ubil
ity
para
met
er
MP
a1l2
16
.4-1
6.6
16.3
16
.4-1
9.5
·12.
6 19
.4-2
1.5
23.0
2 R
efra
ctiv
e in
dex,
nD
20
1.52
-1.5
4 1.
47-1
.51
1.5-
1.65
1.
35-1
.38
1.52
-1.5
7 1.
52-1
.57
Phy
sica
l pr
oper
ties
U
nit
PM
MA
P
OM
P
C
PE
T
PE
EK
P
S
Den
sity
g/
cm3
1.12
-1.2
1.
40-1
.42
1.2-
1.26
1.
31-1
.38
1.29
-1.4
9 1.
13-1
.60
Wat
er a
bsor
ptio
n %
0.
1-0.
4 0.
2-0.
4 0.
15-0
.7
0.06
-0.3
0.
15-0
.51
0.14
-0.4
3 S
olub
ilit
y pa
ram
eter
M
PaX
18
.58
22.4
19
.4-1
9.8
21.5
4 20
.2
20.2
6-22
.47
Ref
ract
ive
inde
x, n
D20
1.
49-1
.51
1.48
1.
56-1
.60
1.51
1.
56-1
.67
b. M
echa
nica
l pr
oper
ties
Mec
hani
cal
prop
erty
U
nit
PE
P
P
PU
P
TF
E
PV
C
PA
Bul
k m
odul
us
GP
a 0.
8-2.
2 1.
6-2.
5 1.
5-2
1-2
3-4
2.
4-3.
3 T
ensi
le s
tren
gth
MP
a 30
-40
21-4
0 28
-40
15-4
0 10
-75
44-9
0 E
long
atio
n at
bre
ak
%
130-
500
100-
300
600-
720
250-
550
10-4
00
40-2
50
You
ng's
mod
ulus
G
Pa
0.45
-1.3
1-
1.6
0.00
18-0
.009
0.
3-0.
7 1.
0-3.
8 1.
4-2.
8 E
last
ic l
imit
M
Pa
20-3
0 20
-33
28-4
0 15
-30
23-5
2 40
-58
End
uran
ce l
imit
M
Pa
13-1
9.6
11-1
8.2
21-3
0 9-
18
13.8
-31.
2 22
-31.
9 F
ract
ure
toug
hnes
s M
Pa
m1
ll2
2.2-
4 1.
7-2.
1 0.
1-0.
4 2.
5-3
1-4
1.8-
2.6
Har
dnes
s M
Pa
60-9
0 60
-100
50
-120
27
-90
70-1
55
100-
160
Com
pres
sive
str
engt
h M
Pa
30-4
0 30
-45
33-5
0 30
-60
32-8
0 60
-100
P
oiss
on's
rat
io
0.4-
0.42
0.
4-0.
45
0.47
-0.4
9 0.
44-0
.47
0.37
-0.4
3 0.
38-0
.42
She
ar m
odul
us
GP
a 0.
18-0
.46
0.4-
0.6
0.00
08-4
-0.0
03
0.11
-0.2
4 0.
7-1.
1 0.
52-0
.9

Tab
le 3
.2
Con
tinu
ed
b. M
echa
nica
l pr
oper
ties
Mec
hani
cal
prop
erty
U
nit
PM
MA
P
OM
P
C
PE
T
PE
EK
P
S
Bul
k m
odul
us
GP
a 3-
4.8
4-5.
6 2.
8-4.
6 3-
4.9
4-4.
5 3.
8-4.
6 T
ensi
le s
tren
gth
MP
a 38
-80
70-7
5 56
-75
42-8
0 70
-208
50
-100
E
long
atio
n at
bre
ak
%
2.5-
6 15
-80
80-1
30
50-3
00
1.3-
50
25-8
0 Y
oung
's m
odul
us
CP
a 1.
8-3.
3 2.
55-3
.5
2-2.
9 2.
2-3.
5 3.
6-13
2.
4-2.
9 E
last
ic l
imit
M
Pa
35-7
0 65
-72
53-7
5 50
-72
12-6
0 58
-70
End
uran
ce l
imit
M
Pa
19.3
-38.
5 28
-42
29.2
-41.
3 30
-43.
2 33
-36
34.8
-42
Fra
ctur
e to
ughn
ess
MP
a m
1ll2
0.
8-1.
3 1-
1.5
2.5-
3.2
1,2-
2 2.
3-2.
5 1.
3-2
Har
dnes
s M
Pa
100-
220
110-
220
110-
180
97-2
10
100-
120
180-
240
Com
pres
sive
str
engt
h M
Pa
45-1
07
70-8
0 10
0-12
0 65
-90
80-1
20
72-1
00
Poi
sson
's r
atio
0.
4-0.
43
0.38
-0.4
3 0.
39-0
.44
0.38
-0.4
3 0.
38-0
.43
0.38
-0.4
2 S
hear
mod
ulus
G
Pa
0.6-
1.2
0.79
-1
0.95
-1.0
5 0.
83-1
.1
1.2-
1.4
0.8-
1
c. T
herm
al p
rope
rtie
s
The
rmal
pro
pert
y U
nit
PE
P
P
PU
P
TF
E
PV
C
PA
Ser
vice
tem
pera
ture
in
°C
90-1
30
140
80-1
30
300
55-1
00
130-
200
air
wit
hout
mec
hani
cal
load
ing
(sho
rt-t
erm
) S
ervi
ce t
empe
ratu
re i
n ai
r °C
70
-100
10
0 60
-80
250
50-8
5 70
-120
w
itho
ut m
echa
nica
l lo
adin
g (l
ong-
term
) M
inim
um s
ervi
ce
°C
-63
to -
53
-123
to
-23
-123
to
-23
-263
to
-253
-4
3 to
-28
-6
0 to
-50
te
mpe
ratu
re
Mel
ting
(T m
)/de
com
posi
ng
°C
125-
135
160-
180
180-
250*
32
2-32
7 15
0*
220-
267
(T d *
) ra
nges
G
lass
tra
nsit
ion
°C
-113
to
-103
-3
0 to
-3
-7
3 to
-23
20
to
22
-23
to 9
0 20
to
92
tem
pera
ture
Tg

Tab
le 3
.2
Con
tinu
ed
c. T
herm
al p
rope
rtie
s
The
rmal
pro
pert
y U
nit
PE
P
P
PU
P
TF
E
PV
C
PA
Sof
teni
ng t
empe
ratu
re
°C
40-5
0 70
-100
10
0 40
-110
80
-200
Sp
ecif
ic h
eat
J/g
.K
1.95
-2.2
0 1.
70-2
.35
0.4-
1.76
1.
00-1
.01
0.85
-1.8
0 1.
26-1
.8
The
rmal
exp
ansi
on
106 /
K
100-
200
80-2
00
150-
210
100-
150
60-2
10
80-1
50
The
rmal
con
duct
ivit
y W
/mK
0.
42-0
.52
0.12
-0.2
4 0.
29-1
.80
0.19
-0.2
5 0.
13-0
.26
0.23
-0.2
9
The
rmal
pro
pert
y U
nit
PM
MA
P
OM
P
C
PE
T
PE
EK
P
S
Ser
vice
tem
pera
ture
in
°C
76-1
08
110-
140
160
180-
200
300
160-
260
air
wit
hout
mec
hani
cal
load
ing
(sho
rt-t
erm
) S
ervi
ce t
empe
ratu
re i
n °C
65
-98
90-1
10
135
100
250
150-
200
air
wit
hout
mec
hani
cal
load
ing
(lon
g-te
rm)
Min
imum
ser
vice
°C
-1
23 t
o -7
3 -1
23 t
o -7
3 -1
33 t
o -1
23
-133
to
-38
-123
to
-103
-1
23 t
o -7
3 te
mpe
ratu
re
Mel
ting
(T m
)/de
com
posi
ng
°C
-170
* 16
4-17
5 22
5-25
0 24
5-25
5 33
5 >5
00*
(Td*
) ra
nges
G
lass
tra
nsit
ion
°C
106-
115
-13-
-75
145
67-1
27
144
167-
230
tem
pera
ture
Tg
Sof
teni
ng t
empe
ratu
re
°C
70-1
15
110-
163
138-
148
70-1
85
140-
315
150-
216
Spec
ific
hea
t Ji
g K
1.
28-1
.5
1.40
-1.4
6 1.
17-1
30
1.05
-1.6
0 1.
5-1.
6 1.
1-1.
30
The
rmal
exp
ansi
on
106 /
K
62-1
05
90-1
25
40-7
5 50
-120
15
-47
53-5
8 T
herm
al c
ondu
ctiv
ity
W/m
K
0.10
-0.1
9 0.
22-1
.1
0.14
-0.2
2 0.
15-0
.34
0.25
-0.9
2 0.
13-0
.28

Tab
le 3
.3
Pro
cess
ing
cond
itio
ns f
or t
herm
opla
stc
poly
mer
s in
bio
med
ical
app
lica
tion
s
The
rmop
last
ics
1. P
olye
thyl
ene
2. P
olyp
ropy
lene
Pro
cess
Inje
ctio
n m
ould
ing
Ext
rusi
on
Blo
w f
ilm e
xtru
sion
F
lat
film
ext
rusi
on
Blo
w m
ould
ing
The
rmof
orm
ing
Com
pres
sion
m
ould
ing
Inje
ctio
n m
ould
ing
Ext
rusi
on
Blo
w m
ould
ing
Com
pres
sion
m
ould
ing
The
rmof
orm
ing
Spec
ial
proc
ess
Film
pro
cess
ing
for
PE
-LD
R
otat
iona
l m
ould
ing
for
PE
-pow
ders
B
lock
, sh
eet,
tube
, pr
ofile
, an
d fil
m p
roce
ssin
gs f
or
PE
-HD
and
P
E-H
D-U
HM
W
Pow
der
sint
erin
g te
chno
logy
fo
r P
E-U
HM
W
Ext
rusi
on:
blow
n fi
lm,
flat
fi
lm,
shee
t, tu
be,
mon
ofil
amen
ts
Inje
ctio
n: L
ong-
last
ing
inte
gral
hin
ges
Bia
xial
ly o
rien
ted
pack
agin
g fil
m
Tap
es
Pre
-tre
atm
ent
No
pre-
dryi
ng
trea
tmen
t ex
cept
hy
gros
copi
c ad
diti
ves
are
adde
d.
Stab
iliz
ers
and
anti
oxid
ants
are
ne
eded
for
spe
cifi
c pr
oces
sing
.
No
pre-
dryi
ng
trea
tmen
t ex
cept
hy
gros
copi
c ad
diti
ves'
ar
e ad
ded.
St
abil
izer
s an
d an
tiox
idan
ts a
re n
eede
d fo
r sp
ecif
ic p
roce
ssin
g.
Rem
arks
PE
-UH
MW
in
solid
or
poro
us f
oml
has
been
use
d in
bio
med
ical
stu
dy a
nd
appl
icat
ion.
Its
mos
t ou
tsta
ndin
g pr
oper
ties
are
wea
r or
abr
asio
n re
sist
ance
, ex
cell
ent
impa
ct r
esis
tanc
e,
and
fati
gue
resi
stan
ce.
PE
-UH
MW
has
bee
n us
ed i
n fa
bric
atio
n of
ace
tabu
lar
cup
for
hip
join
t pr
osth
eses
. P
olyp
ropy
lene
has
exc
epti
onal
ly h
igh
flex
life,
exc
elle
nt e
nvir
onm
enta
l st
ress
cr
acki
ng r
esis
tanc
e, e
xcel
lent
wea
r re
sist
ance
, hi
gher
tem
pera
ture
res
ista
nce
(wit
hsta
ndin
g st
eam
ste
rili
zati
on),
and
lo
w c
ost.
Fib
er a
ppli
cati
ons
such
as
sutu
re,
sew
ing
ring
, br
aide
d li
gam
ent,
skin
and
abd
omin
al p
atch
es.
Pro
mis
ing
appl
icat
ions
in
thin
-wal
l pa
ckag
ing
com
peti
ng w
ith p
olys
tyre
ne.
Pol
ypro
pyle
ne h
as l
ower
spe
cifi
c he
at
and
the
flow
pro
pert
ies
are
mor
e se
nsiti
ve t
o te
mpe
ratu
re a
nd s
hear
rat
e.
The
mol
d sh
rink
age
is lo
wer
tha
n po
lyet
hyle
ne b
ut h
ighe
r th
an w
ith
poly
styr
ene.
It
has
high
er m
elt
stre
ngth
is
impo
rtan
t fo
r ex
trus
ion
blow
mol
ding
of
hol
low
obj
ects
. L
ower
mol
ecul
ar
wei
ght
grad
es a
re s
uite
d fo
r ex
trus
ion
of m
onof
ilam
ents
and
inj
ecti
on m
oldi
ng
of t
hin-
wal
led
artic
les.
Col
d fo
rmin
g m
ay b
e do
ne a
t ro
om t
empe
ratu
re
(rol
ling
), a
nd f
orgi
ng,
pres
sure
for
min
g,
rolli
ng a
nd s
tam
ping
at
tem
pera
ture
s be
low
the
cry
stal
lite
mel
ting
reg
ion
(150
to
160
°C).
Fil
m p
roce
ssin
g es
peci
ally
in
ori
ente
d fo
rm c
ompe
ting
with
po
lyet
hyle
ne.

Tab
le 3
.3
Con
tinu
ed
The
rmop
last
ics
3. P
olyu
reth
ane
4. P
oly t
etra
fl
uore
thyl
ene
Pro
cess
Inje
ctio
n m
ould
ing
Ext
rusi
on
Sin
teri
ng
Ram
ext
rusi
on
Pas
te e
xtru
sion
C
oati
ng f
ollo
wed
by
sin
teri
ng
Impr
egna
tion
Spec
ial
proc
ess
She
et e
xtru
sion
S
hape
ext
rusi
on
Cas
t o
r bl
ow f
ilm e
xtru
sion
F
iber
pro
cess
ing
Hig
h te
mpe
ratu
re s
inte
ring
pr
oces
s fo
r pa
rts,
she
ets,
pl
ates
R
am e
xtru
sion
for
rod
s,
tube
s, p
rofi
les,
wir
e co
atin
gs,
and
fibe
rs
Insu
lati
ng f
ilms,
cru
cibl
es
Exp
ande
d tu
bula
r fo
rm
Pre
-tre
atm
ent
Pol
yure
than
e, e
spec
iall
y al
ipha
tic
type
is
hygr
osco
pic;
the
pel
lets
m
ust
be d
ried
bef
ore
extr
usio
n.
PT
FE
is
a hy
drop
hobi
c po
lym
er a
nd p
re-d
ryin
g is
not
nec
essa
ry.
Rem
arks
Cha
ract
eris
tics
hig
h fl
exib
ility
and
hig
h im
pact
res
ista
nce,
and
exc
elle
nt
bioc
ompa
tibi
lity
. F
ilm
for
ms
of
poly
uret
hane
hav
e be
en u
sed
in
fabr
icat
ion
of
vasc
ular
gra
ft a
nd
patc
hes,
hea
rt v
alve
lea
flet
s, b
lood
pu
mps
, di
aphr
agm
s fo
r im
plan
tabl
e ar
tifi
cial
hea
rt,
and
carr
iers
for
dru
g de
live
ry.
Ela
stom
eric
fib
ers
(Spa
ndex
) m
ade
from
pol
yure
than
e co
poly
mer
ha
ve b
een
used
in
surg
ical
hos
es.
Unf
avor
able
pro
cess
ing
cond
itio
ns w
ill
indu
ce r
esid
ual
stre
sses
in
the
prod
ucts
w
hich
im
pair
the
bio
stab
ilit
y of
po
lyur
etha
ne-b
ased
pro
sthe
ses.
To
avoi
d re
sidu
al s
tres
ses
in p
olyu
reth
ane
tube
s, a
n up
per
lim
it o
f dr
awn
dow
n ra
tio
of 1
.5:1
.0 a
re r
ecom
men
ded
for
the
appr
opri
ate
stre
tchi
ng d
urin
g ex
trus
ion.
If
wat
er b
ath
for
tube
pr
oces
sing
is
too
cold
, re
sidu
al s
tres
ses
are
also
ind
uced
. A
rec
omm
ende
d te
mpe
ratu
re f
or t
he w
ater
bat
h is
be
twee
n 21
-27°
C.
Exc
epti
onal
che
mic
al r
esis
tanc
e,
tem
pera
ture
res
ista
nce,
and
rad
iati
on
and
wea
ther
ing
resi
stan
ce.
Out
stan
ding
ele
ctri
cal
prop
erti
es a
s in
sula
tor
or
diel
ectr
ic m
ater
ial.
L
ow a
dhes
ion
and
low
coe
ffic
ient
of
fric
tion
. E
xcep
tion
al f
lam
e re
sist
ance
. E
xpan
ded
PT
FE
(G
orte
x) h
as b
een
used
in
fab
rica
tion
of
bloo
d ve
ssel
pr
osth
eses
.

Tab
le 3
.3
Con
tinu
ed
The
rmop
last
ics
5. P
olyv
inyl
chlo
ride
6. P
olya
mid
es
7. P
olya
cryl
ates
Pro
cess
Ext
rusi
on
Cal
ende
ring
In
ject
ion
mol
ding
E
xtru
sion
blo
w
mol
ding
S
tret
ch b
low
mol
ding
C
ompr
essi
on
mol
ding
S
inte
ring
Inje
ctio
n m
oldi
ng
Ext
rusi
on
Ext
rusi
on b
low
m
oldi
ng
Inje
ctio
n m
oldi
ng
Ext
rusi
on
Com
pres
sion
m
oldi
ng
The
rmof
orm
ing
Spec
ial
proc
ess
Blo
wn
film
F
lat
film
S
heet
s T
ubes
and
pro
file
s C
able
she
athi
ng
Bri
stle
s an
d m
ono
fila
men
ts
Inje
ctio
n: t
hin-
wal
l ar
ticle
s,
engi
neer
ing
com
pone
nts
Ext
rusi
on:
bris
tles
, pa
ckag
ing,
ta
pes,
fib
er,
wir
e, f
ilm,
shee
t, tu
bes,
pro
file
s,
shea
thin
g
Pri
mar
y fo
rms:
sh
eet,
rod,
and
tub
e C
asti
ng f
rom
mon
omer
fo
r op
tica
l pr
oper
ties
E
xtru
sion
fro
m t
herm
opla
stic
re
sins
to
prod
uce
shee
t. In
ject
ion
mou
ldin
g fo
r sm
all
com
plex
par
ts
Pre
-tre
atm
ent
Pro
per
stor
ed
poly
viny
lchl
orde
can
be
used
wit
hout
pre
-dry
ing.
Pr
emix
ing
of i
ngre
dien
ts
will
be
cons
ider
ed f
or
plas
tici
zed
PV
c.
Poly
amid
es,
espe
cial
ly
alip
hati
c ty
pes
are
hygr
osco
pic.
Pre
-dry
ing
is ne
eded
bef
ore
proc
essi
ng,
and
also
pr
ecau
tion
will
be
cons
ider
ed d
urin
g an
d af
ter
proc
ess.
P
olya
cryl
ates
can
eas
ily
pick
up
moi
stur
e fr
om
envi
ronm
ent.
Pre
-dry
ing
is n
eces
sary
.
Rem
arks
Pla
stic
ized
PV
C f
avou
rs c
alen
deri
ng,
whi
le u
npla
stic
ized
PV
C p
refe
rs
extr
usio
n.
Inje
ctio
n m
ould
ing
is di
ffic
ult
for
both
pl
asti
cize
d an
d un
plas
tici
zed
PVC
s ex
cept
car
eful
con
trol
of
proc
essi
ng
cond
itio
ns o
r sp
ecia
l de
sign
of
mac
hine
. C
hara
cter
isti
c fl
ame
resi
stan
ce.
Dec
ompo
siti
on h
appe
ns a
t hi
gh
tem
pera
ture
. O
verh
eat
in p
roce
ssin
g sh
ould
be
avoi
ded.
T
ubul
ar,
shee
t, pl
ate,
and
film
for
ms
of
PV
C h
ave
been
use
d in
med
ical
dev
ices
su
ch a
s bl
ood
bags
and
cat
hete
rs.
Impl
ants
of
PV
C a
re n
ot e
ncou
rage
d.
Exc
elle
nt f
rict
ion
prop
erti
es a
nd g
ood
wea
r an
d ab
rasi
on r
esis
tanc
e.
Exc
elle
nt h
ydro
carb
on r
esis
tanc
e.
Film
s ar
e us
ed f
or p
acka
ging
. F
iber
for
m
is em
ploy
ed a
s su
ture
mat
eria
ls.
Exc
elle
nt t
rans
pare
ncy,
goo
d sc
ratc
h re
sist
ance
. G
ood
proc
essa
bili
ty a
nd m
achi
nabi
lity.
M
onom
er a
nd p
olym
er p
owde
r ca
stin
g to
pro
duce
bon
e ce
men
t. H
ydro
gel
has
been
use
d to
fab
rica
te
cont
act
lens
. M
onom
er-p
olym
er d
ough
s is
use
d fo
r pr
oces
sing
den
ture
s.

Tab
le 3
.3
Con
tinu
ed
The
rmop
last
ics
8. P
olya
ceta
l
9. P
olyc
arbo
nate
10.
Pol
yeth
ylen
ete
reph
thal
ate
Pro
cess
Inje
ctio
n m
oldi
ng
Ext
rusi
on
Blo
w m
oldi
ng
Com
pres
sion
mol
ding
Inje
ctio
n m
oldi
ng
Ext
rusi
on
Blo
w m
oldi
ngs
The
rmof
orm
ing
Hot
ben
ding
Inje
ctio
n m
ould
ing
Ext
rusi
on
Blo
w m
oldi
ng
Spec
ial
proc
ess
Inje
ctio
n m
ould
ing
Ext
rusi
on
Inje
ctio
n an
d ex
trus
ion
Film
s: e
xtru
ded
and
solv
ent
cast
, un
iaxi
ally
ori
ente
d am
orph
ous
and
part
iall
y,
crys
tall
ine
Tub
e, r
od,
prof
ile,
shee
t:
extr
usio
n F
iber
pro
cess
U
niax
iall
y or
ient
ed t
apes
Fi
lms,
pac
kagi
ng f
ilm,
shee
t, ar
ticl
es
Bia
xial
ly o
rien
ted
film
an
d sh
eet
Pre
-tre
atm
ent
Pol
yace
tal
is l
ess
hygr
osco
pic
than
nyl
on.
How
ever
, ac
etal
po
lym
er m
ust
be s
tore
d in
dry
pla
ce.
Pol
ycar
bona
te c
an p
ick
up e
noug
h m
oist
ure
to
dete
rior
ate
qual
ity
of
prod
ucts
. P
re-d
ryin
g is
nec
essa
ry.
Pol
yeth
ylen
eter
epht
hala
te
is hy
gros
copi
c.
Pre
-dry
ing
is n
eces
sary
.
Rem
arks
Ous
tand
ing
cree
p an
d fa
tigu
e re
sist
ance
. G
ood
toug
hnes
s an
d im
pact
res
ista
nce.
E
xcel
lent
str
engt
h fo
r en
gine
erin
g ap
plic
atio
n.
Pro
cess
ing
tem
pera
ture
mus
t be
car
eful
ly
cont
roll
ed.
Fib
er a
nd f
ilm f
orm
s of
pol
yace
tal
are
not
avai
labl
e.
Pol
yace
tal,
Del
rin,
has
bee
n us
ed i
n di
sc
of m
echa
nica
l he
art
valv
es.
App
lica
tion
s ha
ve b
een
foun
d in
co
nsid
erat
ion
of t
ough
ness
, ri
gidi
ty,
tran
spar
ency
, se
lf-e
xtin
guis
hing
ch
arac
teri
stic
s, g
ood
elec
tric
al i
nsul
atio
n an
d he
at r
esis
tanc
e.
Pol
ycar
bona
te h
as b
een
used
in
the
man
ufac
ture
of
cont
act
lens
es.
Cha
ract
eris
tic
crys
talli
zatio
n.
Bot
h am
orph
ous
and
crys
tall
ized
pro
duct
s ca
n be
mad
e th
roug
h co
ntro
l of
cr
ysta
lliz
atio
n.
The
ben
efits
fro
m P
ET
pro
duct
s ar
e th
eir
stif
fnes
s, w
arp
resi
stan
ce,
and
dim
ensi
on
stab
ility
. F
iber
for
m o
f P
ET
has
bee
n us
ed t
o fa
bric
ate
bloo
d ve
ssel
s an
d by
-pas
s pr
osth
eses
. S
utur
e m
ade
from
PE
T.
Dac
ron®
sew
ing
ring
and
med
ical
fab
rics
.

Tab
le 3
.3
Con
tinu
ed
The
rmop
last
ics
11.
Pol
yeth
ere
ther
keto
ne
12.
Pol
ysul
phon
e
Pro
cess
Inje
ctio
n m
oldi
ng
Com
pres
sion
mol
ding
E
xtru
sion
C
ompo
site
Inje
ctio
n m
oldi
ng
Ext
rusi
on
Blo
w m
oldi
ng
The
rmof
orm
ing
Spec
ial
proc
ess
Inje
ctio
n m
oldi
ng f
or
arti
cles
E
xtru
sion
: fi
lmIc
ast
and
orie
nted
mon
ofil
amen
t w
ire
cove
ring
C
ompo
site
: ca
rbon
fib
er/
PE
EK
com
posi
te
Inje
ctio
n m
oldi
ng f
or
arti
cles
E
xtru
sion
: fi
lm a
nd s
heet
w
hich
can
be
ther
mof
orm
ed
Pre
-tre
atm
ent
PE
EK
is h
ydro
phob
ic
poly
mer
but
pre
-dry
ing
is n
eces
sary
for
qua
lity
co
ntro
l.
Pol
ysul
phon
e is
hygr
osco
pic
and
pre
dryi
ng i
s re
quir
ed t
o av
oid
vapo
r fo
rmat
ion
duri
ng p
roce
ssin
g.
Rem
arks
Cha
ract
eris
tic
high
str
engt
h at
hig
h te
mpe
ratu
re.
Exc
elle
nt r
esis
tanc
e to
hyd
roly
sis
and
envi
ronm
enta
l st
ress
cra
ckin
g.
Car
bon
fibe
r/P
EE
K c
ompo
site
inve
stig
ated
in
bon
e fr
actu
re f
ixat
ion.
Goo
d ri
gidi
ty,
cree
p re
sist
ance
, an
d to
ughn
ess.
H
ydro
lysi
s re
sist
ance
and
can
und
ergo
re
peat
ed s
team
ste
rili
zati
on.
Tra
nspa
rent
pro
duct
s ca
n be
mad
e an
d us
ed i
n m
edic
al f
ield
. H
ollo
w f
iber
and
mem
bran
e de
vice
s ha
ve
been
use
d in
hem
odia
lysi
s.
Car
bon
fibe
r/po
lysu
lpho
ne c
ompo
site
has
be
en u
sed
for
bone
fra
ctur
e fi
xatio
n.

296 I LI _T_H_E_R_M_O_P_LA_ST_I_C_P_O_L_Y_M_E_R_S_IN_B_IO_M_E_D_I_C_A_L_A_P_P_L_IC_A_T_IO_N_S_-,
Table 3.4 Trade names of thermoplastic polymers in biomedical applications
1. Polyethylene (PE)
Eltex(Solvay, BE) Finathene (Fina, BE) Alathon, Sclair (Du Pont
Canada Inc., CA) Boalen (Petrirnex, CS) Hostalen (Hoechst, DE) Lupolen (BASF, DE)
Vestolen (Huls, DE) Ertileno (Union ERT, ES) Natene (Rhone-Poulenc,
FR) Lacqtene (Atochern, FR) Carlona (Shell, GB)
Rigidex, Novex (BP Chemicals, GB)
Tipolen (Tiszai Vegyi Kombinat, HU)
Eraclene (EniChern Base, IT)
Hostalen GUR (Hoechst AG, DE)
Eltex (Solvay, BE) Alathon, Sclair (Du pont
Canada, CA) Novapol LL (Novacor
Chern., CA) Lupolen (BASF, DE)
PE-LD and PE-HD
Fertene Maplen (Hirnrnont, IT) Rurniten (Rurnianca, IT) NeoZex (Mitsui, JP)
Nipolon (Toyo Soda, JP) Novatec (Mitsubishi, JP) Hi Zex (Mitsol, JP)
Mirason (Mitsui Polychern., JP) Sholex (Showa Denko, JP) Surnikathene (Surnitorno
Chern., JP) Suntec (Asahi Chern., JP) Staflene (Nisseki Plastic Chern.,
JP) Yukalon (Mitsubishi Petroleum,
JP) Starnylan (DSM, NL)
Ropol (Chern. Kornb. Borcesti; RO)
PE-HD-UHMW
Lupolen UHM (BASF AG, DE)
PE-LLD
Rurniten (Rurnianca, IT) Mirason (Mitsui Polychern., JP)
Novatex (Mitsubishi Chern., JP)
Surnikathene (Surnitorno Chern., JP)
Lotrex (Orkern Norsolor Ultzex (Mitsui Petrochemical, SA, FR) JP)
News (Neste Oy Chern., FI) Starnylex (DSM, NL) Visqueen (lCI, GB) Ladene (SABlC, Saudi Arabia) Eraclear (EniChern., IT) Dowlex (Dow Chemical, US)
2. Polypropylene (PP)
Asota, Ecofelt (Chemic Linz, AT)
Marlex (Phillips Petroleum Co., BE)
Istrono (Chern., Werke J. Dirnitrow, CS)
Tatren (Petrirnex, CS)
Eltex (Solvay, FR)
Carlona (Shell, GB)
Propathene (ICI, GB)
Biofol (Chern. Kombinat. Tisza, HU)
Hostalen PP (Hoechst, DE) Afax, Moplen, Valtec
Platilon (Deutsche A TOchern., DE)
(Hirnont, IT) Bifax (Showa denko. JP)
Ladene (SABlC, Saudi Arabia) Escorene (Exxon Chern, US) Fortiflex (Soltex Polymer, US)
Norchern (USI, US) Paxon (Allied Signal Corp., US) Microthene, Petrothene
(US I Chern., US) HiFax (Hirnont, US) Marlex (Phillips Petrol., US) Super Dylan (Arco Chern., US)
Tenite (Easrrnan Chern., US) Hipten (Hernijska Ind., YU)
Okiten (INAOKI, YU)
Escorene (Exxon Chern., US) Marlex TR 130 (Phillips
Petroleum, US) Microthene, Petrothene
(USI Chern., US) Norchern (USllExxon Chern.,
US) Rexene (EI Paso Chern., US)
Tenite (Eastman Chern., US)
Starnylan (DSM, NL)
Bicor (Mobil Chern., US)
Extrel, Twistlock, Vistalon(Exxon Chern, US)
Fortilene (Soltex Polymer Corp. US)
Liteplate S (Hercules, US)
Profax (Hirnont, US)

L-________________ P_O_L_Y_SU_L_F_O_N_E ________________ ~I I 297
Table 3.4 Continued
2. Polypropylene (PP)
Trovidur (HulsTroisdorf, DE)
Ultralen (Lonza Werke, DE)
Vestolen P (Huls, DE)
Apryl, Lacqtene P (Atochem., FR)
3. Polyurethane (PU)
Eperon (Kanegafuchi Chem., JP)
Noblen (Mitsubishi Petrochemical, JP)
Novatec (Mitsubishi Chem., JP)
PolyPro, Sunlet (Mitsui Petrochem., JP)
General
Ucefix, Ucellex (UCB, BE) Europolymers (Avalon
Fabeltan (Tubize Plastics, BE)
Caprolan, Elastolen, Elastolan (Elastogran Polyurethane, DE)
Desmopan (Bayer, DE)
Lurollex (Lehmann u. Voss Co., DE)
Oldopren (Busing u. Fasch & Co., DE)
Durelast (B & T polymers, GB)
Chemical Co., GB) Jectothane (Dunlop Holdings,
GB) Pemullex (Pemu Chemolimpex,
HU)
Uthane (Urethanes India, IN)
Pelprene (Toyobo Co., Resins Div., JP)
Durane (Swanson, US)
Medical special
Angiollex (Abiomed Mitrathane (PolyMedica Danvers, MA) Burlington, MA, US)
Biomer (Ethicon Pellethane (Dow Chemical La Somerville, NJ, US) Porte, TX, US)
Cardiothane (Kontron Surethane (Cardiac Control Everett, MA, US) Palm Coast, FL, US)
Chronollex (PolyMedica Tecollex (Thermedics Inc Burlington, MA, US) Woburn, MA, US)
Hemothane (Sams, Div Toyobo TM5 (Toyobo Co. 3M Ann Arbor, MI, US) Osaka, Japan)
4. Polytetralluoroethylene (PTFE)
Hostallon TF (Hoechst, DE)
Neollon (Daikin Ind., JP)
Rexene (EI Paso Chem., US)
Tenite (Eastman Chemical, US)
Urafil (Akzo-Wilson-Fiberfil, US)
Hi-Tuff (J.P. Stevens & Co., US)
Esteloc, Estane, Roylar (B.F. Goodrich Chemical Co., US)
Irogran, Plastothane (Morton Thiokol, US)
Proplastic (Pro Lam, US)
Q-Thane (Quinn & Co., US)
Corplex (Corvita Miami, FL, US)
Unithane 80F (NICPBP Beijing, China)
Corethane (Corvita Miami, FL, US)
PU 10 (Univ. NSW, Australia)
RT duroid (Rogers Corp., US)
Pamllon (Norton Pampus, Polyllon (Daikin Kogyo Co., JP) Rulon (Dixon Ind. Corp., US) DE)
Forallon (A TOCHEM, FR) Ferrotron, F1uorosint (Polymer Salox (Allegheny Plastics, US)
Sorellon (Pechiney U.K., FR)
Gallon (Plastic Omnium, FR)
Fluon (ICI, GB)
Corp., US) F1uoroloy (F1urocatbon, US)
FluoroMet (Raymark, US)
Goretex (W.L. Gore Assoc., US)
Algollon (Montedison, IT) Halon (Ansimont, US)
Tellon (Du Pont de Numours, US)
Turcite (W.S. Shamban & Co., US)
Tygallor (American Cyanamid Aerospace, US)
Xylon (Whitford Corp., US)

298 I LI _T_H_E_R_M_O_PL_A_ST_I_C_P_O_L_Y_M_E_R_S_IN_B_IO_M_E_D_I_C_A_L_A_P_P_L_IC_A_T_IO_N_S_---'
Table 3.4 Continued
5. Polyvinylchloride (PVC)
Benvic (Solvay, BE)
Plastilit, Selchim, Solvic (Solvay & Cie., BE)
Vipopham (Lonza, CH)
Corvic, Vynide, Welvic (ICI, GB)
Ongrovil (Barsodi Veggi Komb., HU)
Ravinil, Sicron, Vipla, Viplast (EniChem, IT)
Astralon, Trocal, Trosiplast, Vixir (S.I.R. (Montedison), IT) Trovidur, Vestolit (Huls-Troisdorf, DE)
Decelith (VEB Ellenburger Hishiplate (Mitsubishi Plastics Chemiewerk, DE) Ind., JP)
Vinnol (Wacker Chemie, Kureha, Viclon (Kureha Chern. DE) Ind., JP)
Genopak, Genotherm, Vinychlon (Mitsui Toatsu Hostalit (Hoechst, DE) Chern., JP)
Armodur (Rhone-Poulenc, Vinylfoil (Mitsubishi Gas Ind., FR) JP)
Bipeau, Orgavyl, Polycal Varian (DSM, NL) (ATOCHEM., FR)
Ekavyl (PCUK, FR)
Carina, Duraftex (Shell Intern. Chern Co., GB)
6. Polyamide (P A)
Norvinyl, Pevikon (Norsk Hydro, NO)
Oltivil (Chern. Komb. Pitesti, RO)
PA 6
Fabenyl (Tubize Plastics, Maranyl (ICI, GB) CH)
Grilon (Ems Chemie, CH) Latamid (L.A.T.I., IT)
Durethan B (Bayer, DE) Nivionplast (EniChem, IT)
Ultramid B (BASF, DE) Renyl (Snia Technopolimeri, IT)
Orgamide (ATOCHEM, Amilan, Amilon (Toray Ind., JP) FR)
Technyl C (Rhone-Poulenc Torayca (Toray Ind., JP) Specialites Chimiques, FR)
PA 66
Durethan A (Bayer, DE) Leona (Asahi Chemical Ind., JP)
Technyl A (Rhone-Poulenc Torayca (Toray Ind., JP) Specialites Chimiques, FR)
Maranyl A (ICI, GB) Akulon (Engineering Plastics
7. Polyacrylates
Umaplex (Synthesia, CS)
Acrifix (Rohm, DE) Lucryl (BASF, DE)
of AKZO Plastics, NL)
Asterite (ICI, GB)
Diakon (ICI, GB) Perspex (ICI, GB)
Rosevil (Chern. Kombinat Borzesti, RO)
Ensolite (Uniroyal Chern., US)
Ethyl (Ethyl Corp., Polymer Div., US)
Fiberloc, Geon (B.F. Goodrich, US)
Pliovic, Vinacel, Vycell (Goodyear, US)
Vygen (General Tire & Rubber Co., US)
Vynaloy (B.F. Goodrich Chern. Co., US)
Hipnil (Hemijska Industria, YU)
Jugotherm, Juvinil (Jugovinil, YU)
Zadrovil (Polikem, YU)
Akulon (Engineering Plastics of AKZO Plastics, NL)
Capron (Allied Signal Engn. Plastics, US)
Plaskon (Plaskon Moldings Div., US)
Zytel (Du Pont de Nemours, US)
Minion (Du Pont de Nemours, US)
Zytel (Du Pont de Nemours, US)
Sumipex (Sumitomo Chern. Co., JP)
Casoglas (Casolith, NL) Acrylite (Cy/Ro Industries, US)

~ __________________ P_O_L_Y_S_U_L_F_O_N_E __________________ ~I I 299
Table 3.4 Continued
7. Polyacrylates
Degaplast (Degussa, DE) Unilok (British Vita Co., GB)
Deglas, Dewglas (Degussa, Vetredil (Vetril, IT) DE)
Dewoglas (Degussa, DE) Vedril (Montedison, IT)
Paraglas (Degussa, DE)
Plexidur, Plexiglas (Rohm, DE)
Resarit (Resart, DE)
Vestiform (Huls, DE)
Acrypanel (Mitsubishi Rayon Co., JP)
Delmer, Depet (Asahi Chem. Ind., JP)
Eska (Mitsubishi Rayon, JP)
Palapet (Kyowa Gas Chem., JP)
Altuglas (Altulor, Orekem, Shinkolite (Mitsubishi Rayon FR) Co.,JP)
8. Polyacetal (POM)
Delrin (Du Pont, US)
CeIcon, Hostaform (Hoechst, DE)
9. Polycarbonate (PC)
SparJux (Solvay & Cie., BE)
Durolon (Policarbonateos do Brazil, BR)
Makrolon (Bayer, DE)
Homopolymers
Tenal (Asahi Chemical Ind., JP)
Copolymers
Duracon, Alkon, and Kematal (Daicel Polyplastic Co., JP)
Sinvet (EniChem, IT)
Novarex (Mitsubishi Chem. Ind., JP)
Panlite (Teijin Chemicals, JP)
Orgalan (A TOCHEM, FR) Xantar (DSM, NL) Star-C (Ferro Eurostar, FR) Calibre (Dow Chemical Corp.,
US) Royalite (British Vita Co., Ekonol (Carborundum Co., US)
GB)
10. Polyethyleneterephthalate
(PET)
Lucite (Du Pont de Nemours, US)
Corian (Du Pont de Nemours, US)
Crofon (Du Pont de Nemours, US)
Electroglas (Glasftex Corp., US)
Exolite (Cyro Industries, US)
Gardlite (Southern Plastics Co., US)
Oroglas (Rohm & Haas Co., US)
Swedcast (Swedlow, US)
Ultraform (BASF, DE)
Lexan (General Electric Plastics, US)
MerIon (Mobay Chemical Corp .. US)
Polycarbafil (Akzo-WilsonFiberfil, US)
Polygard (Poly tech, US) Stat-Kon (LNP Corp., US)
Crastin (Ciba Geigy, CH) Melinar, Melinite (lCI, GB) Pelion (Mobay Chem. Corp.,
Grilpet (Ems Chemie, CH) Impet (Hoechst, DE) Ultradur (BASF, DE)
11. Polyetheretherketone
US) Amite (Akzo Engng. Plastics, NL)Petra (Allied Signal, US) Etar (Eastman Chem. Intern., US)Ropet (Rohm & Hass Co., US) Mindel (Amoco Performance Rynite (Du Pont de Nemours,
Products, US) US)
(PEEK)
Victrex PEEK (lCI, UK)

300 I I THERMOPLASTIC POLYMERS IN BIOMEDICAL APPLICATIONS
Table 3.4 Continued
U. Polysulphone
Ultrason S (BASF DE)
Sumilik FST (Sumitorno, Chern. Co., JP)
REFERENCES
Stabar (ICI, UK) Udel (Amoco Performance Products, US)
Black, J. (ed.) (1992), in Biological Performance of Materials: Fundamentals of Biocompatibility, Second edition, Marcel Dekker. Inc, New York.
Brydson, J.A (ed.), Plastics Materials, Butterworths Scientific, fourth edition, 1982; fifth edition, 1989.
Carhart, RO. (1985) Polycarbonate, in Engineering Thermoplastics, Properties and Applications, Margolis, J.M. (ed.), Chapter 3, pp. 29-82.
Chapman, RD. and Chroma, J.L. (1985) Nylon plastics, in Engineering Thermoplastics, Properties and Applications, Margolis J.M. (ed.), pp. 83-122.
Charrier, J.M. (ed.) (1990) Polymeric Materials and Processing: Plastics, Elastomers and Composites, Hanser.
Domininghaus, H. (ed.) (1993) Plastics for Engineers, Materials Properties, Applications, Car-Hanser Verlag.
Goodman, S.B. and Fomasier, V.L. (1992) Clinical and experimental studies in the biology of aseptic loosing of joint arthroplasties and the role of polymer particles, in Particulate Debris from Medical Implants: Mechanisms of Formation and Biological Consequences, ASTM ATP 1144, K.R St John, (ed), American Society for Testing and Materials, Philadelphia, pp. 27-37.
Harper, C.A (eds) (1992) Handbook of Plastics, Elastomers, and Composites, McGraw-Hill.
How, T.V. (1992) Mechanical properties of arteries and arterial grafts, in Cardiovascular Biomaterials, Hastings, G.W. (ed.), Springer-Verlag, London, pp.1-35.
Jones, AJ. and Denning, N.T. (1988) in Polymeric Biomaterials: Bio- and Ecocompatible Polymers, A Perspective for Australia, Department of Industry, Technology and Commerce.
Lilley, P.A, Blunn, G.W., and Walker, P.S. (1993) Wear performance of PEEK as a potential prosthetic knee joint material, in 7th International Conference on Polymers in Medicine and Surgery, 1-3 September 1993, Leeuwenhorst Congress Center, Noordwijkerhout, The Netherlands, pp. 320--326.
Margolis, J.M. (1985) Engineering Thermoplastics: Properties and Applications, Dekker, New York.
Mascia, L. (1989), in Thermoplastics: Materials Engineering, Second Edition, Elsevier Applied Science, London and New York.
McMillin, C.R (1994) Elastomers for biomedical applications, Rubber Chem. and Tech. 67,417-446.
Park, J.B. and Lakes, RS. (1992) Biomaterials, an Introduction, Second Edition, Plenum Press, New York and London.

L-____________ ~-----R-E-FE-R--EN--C-E-S------------------~I I 301
Rubin, 1.1. (ed.) (1990), Handbook of Plastic Materials and Technology, John Wiley & Son.
Staudinger, H. (1932) Die Hochmolekularen Organischer Verbindungen, Julius Springer.
Stokes, K., McVenes, R., and Anderson, J.M. (1995) Polyurethane elastomer biostability, l. Biomaterials Applications, 9, 321-355.
Szycher, M. (1991) in Blood Compatible Materials and Devices: Perspectives Towards the 21st Century, Sharma, C.P. and Szycher, M. (eds), Technomic Publishing CO., Inc., Lancaster, Basel, pp. 33-85.
Teoh, S.H., Lim, S.C., Yoon, E.T., and Goh, K.S. (1994) A new method for in vitro wear assessment of materials used in mechanical heart valves, in Biomaterials Mechanical Properties, ASTM STP 1173, H.E. Kambic and AT. Yokobori, Jr. Eds., American Society for Testing and Materials, Philadelphia, pp.43-52.
Teoh, S.H., Lim, S.c., Yoon, E.T., and Goh, K.S. (1994a) A new method for in vitro wear assessment of materials used in mechanical heart valves, in Biomaterials Mechanical Properties, ASTM STP 1173, H.E. Kambic and AT. Yokobori, Jr. (eds), American Society for Testing and Materials, Philadelphia, pp.43-52.
Teoh, S.H., Martin, R.L., Lim, S.c., et al. (1990) Delrin as an occIuder material, ASAIO Transactions, 36, M417-421.
Watson, M., Cebon, D., Ashby, M., Charlton, C., and Chong, W.T. (eds) (1994) Cambridge Materials Selector V2.02, National University of Singapore, Granta Design Ltd.
Wenz, L.M., Merritt, K., Brown, S.A, and Moet, A (1990) In-vitro biocompatibility of polyetheretherketone and polysulphone composites,l. Biomed. Maters Res., 24, 207-215.
Ziegler, K.E. (1955) Angew. Chem. 67(426),541.
01 L...-__ B_i_o_m_e_d_ic_a_l_e_l_as_t_o_m_e_r_s_----'
l.W. Boretos and S.l. Boretos
4.1 INTRODUCTION
Elastomers are described as materials that possess pronounced elasticity and rebound. They can be tough, relatively impermeable to air and water and exhibit resistance to cutting, tearing and abrasion. Often they are modified by compounding to increase their hardness and strength. Or, conversely, they can be soft, compliant and absorbent to water if the need exists. In some instances their properties can closely simulate that of the tissues which they must contact. As biomedical materials they may have originated from commercial formulations or been custom designed from basic chemistry. Those that have been judged as biocompatible have made significant contributions towards the development of successful medical devices. Literally, every basic elastomer has been evaluated at some time for its possible suitability in contact with the body. This would include such materials as natural rubber, styrene rubber, polybutyl rubber, silicone rubber, acrylate rubber, Hypalon®, polyurethanes, fluorinated hydrocarbon rubbers, polyvinyl chloride, thermoplastic vulcanizates and others. Of these, only special medical grade formulations of silicone, polyurethane, polyvinyl chloride and thermoplastic elastomer have continued to be commercially successful.
There are important differences between materials and differences among similar materials within a given generic class. These differences are due to the chemical composition of the polymer, the molecular configuration of the polymer and the presence of functional groups. For instance, polyurethanes of a polyester base were initially tried and found unstable for implantation whereas polyether based polyurethanes were decidedly
Handbook of Biomaterial Properties. Edited by J. Black and G. Hastings. Published in 1998 by Chapman & Hall, London. ISBN 0412603306.

L-_______________ T_Y_P_E_S_O_F __ E_L_A_ST_O __ M_E_R ________________ ~I I 303
more stable. Elastomers with aromatic structures behave differently than the polymer having aliphatic structure. Not every material is suitable for every application. Some have been found to perform successfully under static conditions but fail or perform undesirably under dynamic situations. Often, the design of a device and the demands upon it will determine if the elastomer chosen is the proper selection. Therefore the material and its use are inseparable. They must be evaluated together. Merely passing an array of physical and biological tests do not confer success. Biocompatibility is an essential element of medical grade elastomers. A set of compatibility tests determine the general physiological acceptability of an elastomer. These consist of passing USP Class VI tests. Additional testing may be required depending upon the device, its area of application and the time it is in contact with tissues. A Master File is often registered by the manufacturer of the basic elastomer with the FDA to attest to its properties, composition and response to biological testing. Demands on medical device manufacturers have never been more stringent. Regulatory pressures, more indepth testing, the threat of litigation plus the constraints of health care cost containment are affecting all aspects of the design and development process and the availability of some biomedical elastomers. A variety of elastomeric materials are available to meet the design challenges presented by medical devices. However, there is still a need for even better materials.
The elastomers that are listed here should be considered in light of their suitability for a specific application. The properties tables should serve as a guide to design options for those in the early stages of the development process. Keep in mind that these properties listed in the tables and the compatibility standings are only indicative of the performance characteristics that an elastomer may exhibit.
4.2 TYPES OF ELASTOMER
Biomedical elastomers can be classified as to whether they are thermoplastic or thermosetting in nature. Thermoplastic biomedical elastomers are gaining in commercial importance and in some cases replacing traditionally used vulcanized versions. Thermosetting elastomers are irreversibly crosslinked and have had the longest history of medical use. Both groups will be described citing representative medical elastomers that are either commercially available or that may replace elastomers that have been recently withdrawn from the market.
4.2.1 Thermoplastic elastomers
Thermoplastic elastomers (TPEs) are a special class of materials that process similarly to other thermoplastic polymers, yet possess many of the

BIOMEDICAL ELASTOMERS
desirable properties of thermoset elastomers. Some TPEs are elastomeric alloys consisting of crosslinked particles of rubber surrounded by a thermoplastic matrix. Others consist of block copolymers and are typified by polyurethanes and styrene polymers.
Depending upon which thermoplastic elastomer is chosen, physical properties can vary over a wide range. They can be either hard, or soft, flexible or stiff, elastic or rigid. For the most part, they are smooth to the touch, yet will form tight seals to surfaces they contact. They can be processed using conventional techniques and equipment and in automated modes. Medical applications consist of such examples as pacemaker lead wire coatings, artificial hearts, and catheters. A wide variety of sundry uses have contributed to patient care and consists of bulbs and bladders, serum caps and tubes, cushions, diaphragms, electrical connectors, flexible medical wire coatings, gaskets, needle shields, pharmaceutical closures, seals, stoppers, tubing, and valves. Most of the TPEs can be sterilized using gas, steam and radiation with very little change in their molecular structures or properties (Table 4.13).
Thermoplastic vulcanizates
Thermoplastic vulcanizates are a separate class of thermoplastic elastomers (TPEs) with Santoprene® as the representative biomedical elastomer.
Santoprene® This thermoplastic vulcanizate is an olefin based elastomer; an elastomeric alloy. It is totally synthetic and does not contain any natural rubber thereby avoiding many of the allergic reaction problems associated with natural rubber latex. It exhibits outstanding flex-fatigue resistance, low temperature flexibility (-40°C) and resistance to tearing and abrasion. Its resistance to plastic deformation under tensile and compression stress is another of its features. Santoprene® is reported to be superior to natural rubber in some situations and replaces silicone elastomers in others. It has found use in peristaltic pump tubing, syringe plungers, seals, and caps, tracheal and enteral tubing, vial closures and pump seals, disposable anesthetic hoses, intravenous delivery systems, and other hospital devices. Santoprene® has met USP Class IV requirements for in vivo biological reactivity and conforms to the Tripartite Biocompatibility Guidance standards. However, the manufacturer does not recommend Santoprene® for use as part of human implants. The material may be injection molded, extruded, blow molded and thermoformed. For details on physical properties, processing and biocompatibility see Tables 4.1, 4.2, 4.13 and 4.14.

TYPES OF ELASTOMER I Table 4.1 Typical Properties of Thermoplastic Vu1canizates
Property
Durometer Tensile Elonga- Modulus Tear Compres-Specific hardness strength, tion, ASTM strength sion set,
Product gravity shore psi percent D-412 pli,die C percent and Product ASTM ASTM ASTM ASTM ASTM ASTM Manufacturer no. D-792 D-2240 D-412 D-412 psi % D-624 D-395
Santoprene® 281-45 0.97 45A 435 300 175 100 80 11 Rubber, 281-55 0.97 55A 640 330 250 100 108 23
281-64 0.97 64A 1,030 400 340 100 140 23 Advanced 281-73 0.98 73A 1230 460 520 100 159 26 Elastomer 281-87 0.96 87A 2,300 520 1,010 100 278 29 Systems 283-40 0.95 40 D 2,750 560 1,250 100 369 32
Table 4.2 Typical Properties of Copolyester Elastomers, PCCE
Property
Durometer Tensile Elonga- Modulus Tear Compres-Specific hardness strength, tion, ASTM strength sion set,
Product gravity shore psi percent D-412 pli,die B percent and Product ASTM ASTM ASTM ASTM ASTM ASTM Manufacturer no. D-792 D-2240 D-412 D-412 psi % D-624 D-395
EcdeJTM 9965 Elastomer, 9966 1.13 95 A
Eastman 9967 3,500 380 16,000 100 100
135 40
Chemical Co.
I 305

306 I I BIOMEDICAL ELASTOMERS
Table 4.3 Typical Properties of Polyurethane-based Elastomers
Property
Durometer Tensile Elonga- Modulus Tear Compres-Specific hardness strength, tion, ASTM strength sion set,
Product grallity shore psi percent D-412 pli,die C percent and Product ASTM ASTM ASTM ASTM ASTM ASTM Manufacturer no. D-792 D-2240 D-412 D-412 psi % D-624 D-395
Biospan Biospan® 75A 6000 850 575 100 segmented Biospan® D 70 D 6000 1000 550 100 polyurethane, Biospan® S 70 D 5500 1050 450 100
The Polymer Technology Group, Inc.
Hydrothane™, Dry 93 A 7800 580 Poly Medica Very dry 95 A 5800 475
Biomaterials, Wet 85 A 5600 500 Inc.
MF-5000 1.15 50A 3000 500 300 100 Medicallex™, MF-500l 1.15 55 A 3000 300 100
MF-5040 1.15 60A 5000 700 300 100 Advanced MF-5041 300 100
Resin MF-5056 1.15 65 A 5000 750 500 100 Technology MF-5057 550 100
MF-5062 1.14 60 A 5000 800 500 100
2363-55D 1.15 55 D 6900 390 2500 100 650 25 Pellethane TM 2363-55DE 1.15 53 D 6500 450 2300 100 600 30
2363 series, 2363-65D 1.17 62D 6460 2900 100 1100 30 2363-75D 1.21 76 D 5810 380 1470 2363-SOA 1.13 81 A 5200 550 880 100 470 25
Dow Chemical 2363-SOAE 1.12 85 A 4200 650 890 100 420 30 Co. 2363-80A 1.30 81 A 6860 670 970 100
R0l20 2363-90A 1.14 90 A 5850 500 1700 100 570 25 2363-90AE 1.14 90 A 6000 550 1475 100 540
PolyBlend™ PB1000-650 65 D to 75 D6500 350 5300 100 1000 and PB1100-55 1.02 55 A 2150 800 135 100 140 55-66
PolyBlend™ PB1100-60 1.02 60 A 2400 210 100 150 50-60 1100,
Poly Medica PB1100-75 1.02 75 A 3250 575 420 100 240 45-50 Biomaterials, PB1100-80 1.02 80A 4600 590 555 100 330 25-30 Inc.
EG60D 1.09 51 D 7829 363 2000 100 Tecoflex®, EG60D-B20 1.32 55 D 7484 370
EG65D 1.10 60 D 8074 335 2500 100 EG65D-B20 - 63 D 6986 321
Thermedics, EG68D 1.10 8686 332 Inc. EG72D 1.11 67 D 7739 307 3400 100
EG80A 1.04 72A 5640 709 400 100

TYPES OF ELASTOMER I I 307
Table 4.3 Continued
Property
Durometer Tensile Elonga- Modulus Tear Compres-Specific hardness strength, lion, ASTM strength sion set,
Product gravity shore psi percent D-412 pli,die C percent and Product ASTM ASTM ASTM ASTM ASTM ASTM Manufacturer no. D-792 D-2240 D-412 D-412 psi % D-624 D-395
Thennedics, EG80A-B20 1.24 73 A 5571 715 Inc. EG85A 1.05 77A 6935 565 700 100
EG85A-B20 1.25 83 A 5282 632 EG85A-B40 1.51 84 A 5093 559 EG93A 1.08 87 A 7127 423 1100 100 EG100A 1.09 94 A 8282 370 1800 100 EG100A-B20 1.29 93 A 7104 369 EG100A-B40 1.54 96 A 5607 360
1055D 1.16 54 D 9600 350 2500 100 Tecothane® 1065D 1.18 64 D 10000 300 3200 100
1074A 1.10 75 A 6000 530 530 100 1075D 1.19 75 D 8300 240 3600 100
Thermedics, 1085A 1.12 85 A 7000 450 800 100 Inc. 1095A 1.15 94 A 9400 400 1600 100
2055D 1.36 55 D 9000 360 2700 100 2065D 1.38 67 D 8500 300 3100 100 2074A 1.30 77A 5500 580 510 100 2075D 1.40 77D 7600 230 3000 100 2085A 1.32 87 A 6600 550 800 100 2095A 1.35 97 A 8200 450 1600 100
5187 1.20 87 A 6000 500 750 100 500 12 Texin™ 5265 1.17 65 D 6000 460 3300 100 1200 20
5286 1.12 86 A 6000 550 700 100 500 16 Miles, Inc. 5370 1.21 70 D 6000 180 4500 100 900
DP7-3002 88 A 2208 579 815 100 399 DP7-3003 50 D 3714 458 1049 100 564 DP7-3004 55 D 4783 392 1766 100 819
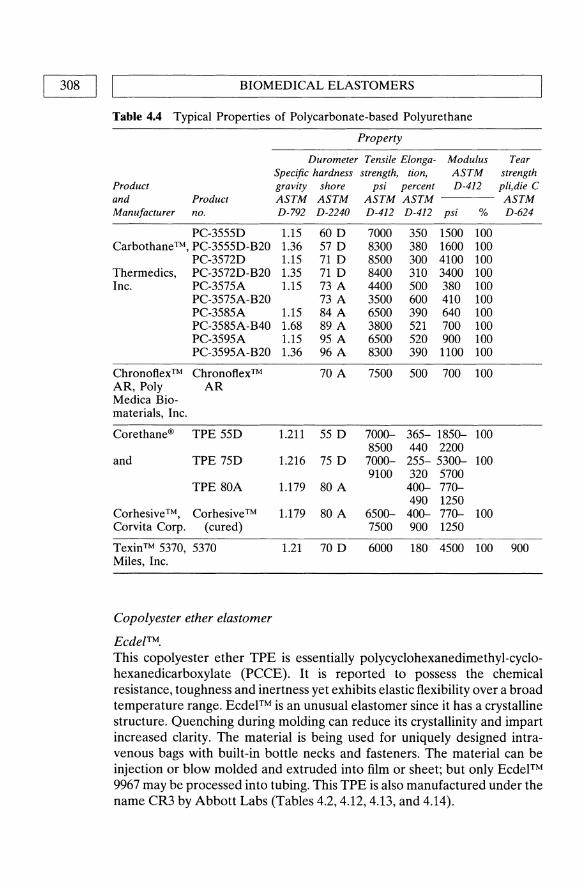
308 I I BIOMEDICAL ELASTOMERS
Table 4.4 Typical Properties of Polycarbonate-based Polyurethane
Product and Product Manufacturer no.
PC-3555D Carbothane™, PC-3555D-B20
PC-3572D Thermedics, PC-3572D-B20 Inc. PC-3575A
PC-3575A-B20 PC-3585A PC-3585A-B40 pC-3595A PC-3595A-B20
Chronoftex ™ Chronoftex™ AR, Poly AR Medica Bio-materials, Inc.
Corethane® TPE 55D
and TPE 75D
TPE 80A
Corhesive™, Corhesive ™ Corvita Corp. (cured)
Texin™ 5370, 5370 Miles, Inc.
Copolyester ether elastomer
EcdefTM.
Property
Durometer Tensile Elonga- Modulus Specific hardness strength, tion, ASTM gravity shore psi percent D-412 ASTM ASTM ASTM ASTM D-792 D-2240 D-412 D-412 psi %
1.15 60 D 7000 350 1500 100 1.36 57 D 8300 380 1600 100 1.15 71 D 8500 300 4100 100 1.35 71 D 8400 310 3400 100 1.15 73 A 4400 500 380 100
73 A 3500 600 410 100 1.15 84A 6500 390 640 100 1.68 89 A 3800 521 700 100 1.15 95 A 6500 520 900 100 1.36 96 A 8300 390 1100 100
70 A 7500 500 700 100
1.211 55 D 7000- 365- 1850- 100 8500 440 2200
1.216 75 D 7000- 255- 5300- 100 9100 320 5700
1.179 80 A 400- 770-490 1250
1.179 80 A 6500- 400- 770- 100 7500 900 1250
1.21 70 D 6000 180 4500 100
Tear strength pli,die C ASTM D-624
900
This copolyester ether TPE is essentially polycyclohexanedimethyl-cyclohexanedicarboxylate (PCCE). It is reported to possess the chemical resistance, toughness and inertness yet exhibits elastic flexibility over a broad temperature range. Ecdel™ is an unusual elastomer since it has a crystalline structure. Quenching during molding can reduce its crystallinity and impart increased clarity. The material is being used for uniquely designed intravenous bags with built-in bottle necks and fasteners. The material can be injection or blow molded and extruded into film or sheet; but only Ecdel™ 9967 may be processed into tubing. This TPE is also manufactured under the name CR3 by Abbott Labs (Tables 4.2, 4.12, 4.13, and 4.14).

TYPES OF ELASTOMER I I 309 L-____________________________________________________ ~
Table 4.5 Typical Properties of Polypropylene-based Elastomers
Property
Durometer Tensile Tear Compres-Specific hardness, strength, Elongation, strength sion set,
Product gravity shore psi percent pli, die B percent and Product ASTM ASTM ASTM ASTM ASTM ASTM Manufacturer no. D-792 D-2240 D-412 D-412 D-624 D-395
Sarlink® 3260 0.95 60 A 870 619 183 42 medical grade
DSM Thermoplastic Elastomers, Inc.
Polyurethane-based elastomers
Polyurethanes are another class of TPEs. They are a large family of chemical compounds that can consist of ether-based, ester-based, polycarbonate-based or polypropylene-based varieties. A number of copolymers are also included;. polyurethanes are combinations of macroglycols and diisocyanates that have been polymerized into tough and elastic materials. TPE polyurethanes have been used for peristaltic pump tubing, parenteral solution tubing and catheters. The tables list the majority of those that are commercially available. Among others are those either of limited supply, available for proprietary use only or that have been successful, but recently discontinued such as:
• Hemothane Sarns Div. of 3M. Restricted to proprietary use. • Biomer Ethicon, Inc. No longer available through this source. • Surethane Cardiac Control Systems, Inc. Redissolved Lycra® thread.
Some formulations may have a few percent PDMS blended with it. Limited availability.
• Pellethane ™ 2360 Dow Chemical, USA. This material is no longer available for medical implant use (see also Pellethane™).
• Angioflex ABIOMED, Danvers, Mass. Restricted to proprietary use. • Cardiothane Kontrol, Inc. A silicone-urethane interpenetrating poly
mer network. Limited availability.
Internationally, polyurethanes for medical use have been developed by Italy, China and Japan.
Biospan® This TPE is a segmented polyurethane and is reported to be not significantly different from biomer in chemistry and molecular weight. It is a polytetra-methyleneoxide-based aromatic polyurethane urea with mixed aliphatic and cycloaliphatic diamine chain extenders. A copolymer of
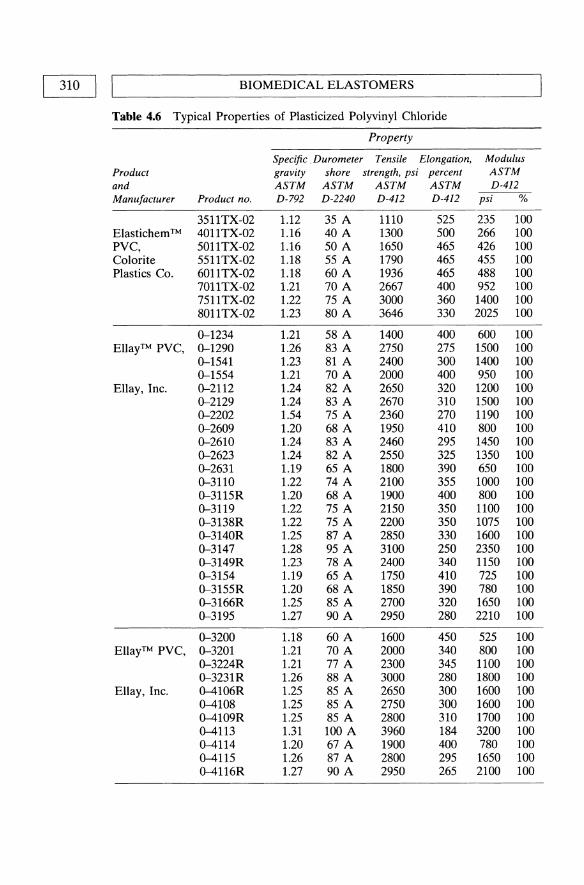
310 I I
BIOMEDICAL ELASTOMERS
Table 4.6 Typical Properties of Plasticized Polyvinyl Chloride
Property
Specific. Durometer Tensile Elongation, Modulus Product gravity shore strength, psi percent ASTM and ASTM ASTM ASTM ASTM D-412 Manufacturer Product no. D-792 D-2240 D-412 D-412 psi %
3511TX-02 1.12 35 A 1110 525 235 100 Elastichem ™ 4011TX-02 1.16 40 A 1300 500 266 100 PVC, 501ITX-02 1.16 50 A 1650 465 426 100 Colorite 5511TX-02 1.18 55 A 1790 465 455 100 Plastics Co. 6011TX-02 1.18 60 A 1936 465 488 100
701ITX-02 1.21 70 A 2667 400 952 100 7511TX-02 1.22 75 A 3000 360 1400 100 8011TX-02 1.23 80 A 3646 330 2025 100
0-1234 1.21 58 A 1400 400 600 100 EllayTM PVC, 0-1290 1.26 83 A 2750 275 1500 100
0-1541 1.23 81 A 2400 300 1400 100 0-1554 1.21 70 A 2000 400 950 100
Ellay, Inc. 0-2112 1.24 82 A 2650 320 1200 100 0-2129 1.24 83 A 2670 310 1500 100 0-2202 1.54 75 A 2360 270 1190 100 0-2609 1.20 68 A 1950 410 800 100 0-2610 1.24 83 A 2460 295 1450 100 0-2623 1.24 82 A 2550 325 1350 100 0-2631 1.19 65 A 1800 390 650 100 0-3110 1.22 74 A 2100 355 1000 100 0-3115R 1.20 68 A 1900 400 800 100 0-3119 1.22 75 A 2150 350 1100 100 0-3138R 1.22 75 A 2200 350 1075 100 0-3140R 1.25 87 A 2850 330 1600 100 0-3147 1.28 95 A 3100 250 2350 100 0-3149R 1.23 78 A 2400 340 1150 100 0-3154 1.19 65 A 1750 410 725 100 0-3155R 1.20 68 A 1850 390 780 100 0-3166R 1.25 85 A 2700 320 1650 100 0-3195 1.27 90 A 2950 280 2210 100
0-3200 1.18 60 A 1600 450 525 100 EllayTM PVC, 0-3201 1.21 70 A 2000 340 800 100
0-3224R 1.21 77A 2300 345 1100 100 0-3231R 1.26 88 A 3000 280 1800 100
Ellay, Inc. 0-4106R 1.25 85 A 2650 300 1600 100 0-4108 1.25 85 A 2750 300 1600 100 0-4109R 1.25 85 A 2800 310 1700 100 0-4113 1.31 100 A 3960 184 3200 100 0-4114 1.20 67 A 1900 400 780 100 0-4115 1.26 87 A 2800 295 1650 100 0-4116R 1.27 90 A 2950 265 2100 100

TYPES OF ELASTOMER I I 311
Table 4.6 Continued
Property
Specific Durometer Tensile Elongation, Modulus Product gravity shore strength, psi percent ASTM and ASTM ASTM ASTM ASTM D-412 Manufacturer Product no. D-792 D-2240 D-412 D-412 psi %
ElIay, Inc. 0-4120 1.21 68 A 2180 400 830 100 0-4121 1.23 81 A 2550 325 1400 100 0-4122 1.33 110 A 4500 135 4180 100 0-4124R 1.28 95 A 3050 250 2200 100 0-4125 1.24 80 A 3150 355 1310 100 0-4129 1.18 63 A 1670 430 620 100 0-4132 1.21 70 A 2000 395 900 100 0-4135 1.23 80 A 2550 320 1260 100 0-4140 1.23 80 A 2500 330 1250 100 0-4150 1.26 88 A 2900 290 2200 100 0-5210C 1.26 82 A 2300 225 1250 100 BB--69 1.23 78 A 2200 340 1150 100 EH-222C 1.21 70 A 2050 365 1100 100 ES-2967ZPH 1.22 75 A 2300 360 1200 100
Geon® PVC, 121AR 1.4 2800 380 213 1.4 2205 379 1010 100
B. F. Goodrich Co. 250x100 1700-1850430-460400-500 100
Multichem ™ 6014 1.15 60 A 1640 540 400 100 PVC, 7014 1.19 70 A 2040 600 625 100 Colorite 8014 1.22 80 A 2100 500 1000 100 Plastics Co. 8514 1.24 85 A 2250 530 880 100
3300-45 NT 1.13 45 A 1100 480 325 100 TeknorTM 3300-50 NT 1.14 50 A 1220 460 370 100 PVC, 3300-55 NT 1.16 55 A 1500 520 100
3300--60 NT 1.17 60 A 1550 450 560 100 Teknor Apex 3300--68 NT 1.18 68 A 1850 430 690 100 Co. 3300-75 NT 1.20 75 A 2150 420 900 100
3300-80 NT 1.21 80 A 2400 1,320 100 3300-85 NT 1.23 85 A 2800 380 1,560 100 3300-90 NT 1.25 90 A 3100 340 2,100 100 3310-50 NT 1.35 50 A 1000 430 330 100 3310-55 NT 1.35 55 A 1100 410 400 100 3310--60 NT 1.35 60 A 1300 400 480 100 3310--65 NT 1.35 65 A 1500 390 590 100 3310-70 NT 1.35 70 A 1770 380 700 100 3310-75 NT 1.35 75 A 1900 370 800 100 3310-80 NT 1.35 80 A 2200 360 1,050 100 3310-85 NT 1.35 85 A 2500 340 1,470 100 3310-90 NT 1.35 90 A 2900 330 1,900 100

[312:] BIOMEDICAL ELASTOMERS
Table 4.6 Continued
Product and Manufacturer
Teknor Apex Co.
Property
Specific Durometer Tensile Elongation, gravity shore strength, psi percent ASTM ASTM ASTM ASTM
Product no. D-792 D-2240 D-412 D-412
90A471R-60NT 1.16 60 A 1500 450 90A471R-65NT 1.17 65 A 1750 440 90A471R-70NT 1.18 70 A 1900 430 90A471R-75NT 1.20 75 A 2150 420 90A471R-80NT 1.23 80 A 2690 380 90A471R-85NT 1.23 85 A 2800 90A471R-90NT 1.27 90 A 3350 360
Modulus ASTM D-412
psi %
diisopropylamino-ethyl methacrylate and decyl methacrylate are added as a stabilizer. The material is supplied as 25% solids in dimethyl acetamide solvent (Tables 4.3, 4.12, 4.13, and 4.14).
Biospan®-S This is a silicone modified analog of Biospan® with a different stabilizer. It possesses a silicone-rich surface to enhance thromboresistance while maintaining the bulk properties of Biospan® (Tables 4.3, 4.12, 4.13, and 4.14).
Biospan®-D This is another version of Biospan® with surface modification by an oligomeric hydrocarbon covalently bonded to the base polymer during synthesis. The additive has a pronounced effect on the polymer surface chemistry but little effect on the bulk properties of the base polymer according to the manufacturer (Tables 4.3, 4.12, 4.13, and 4.14).
Hydrothane ™ Hydrothane™ is a TPE hydrogel belonging to the polyurethane family of polymers. Hydrothane™ is an aliphatic material with water absorption capabilities ranging from 5 to 25% by weight while still maintaining high tensile strength and elongation. Because of its water absorption capacity, Hydrothane™ is reported to be bacteria-resistant and lubricious. The polymer can be processed by conventional extrusion and injection molding techniques. It can also be dissolved in dimethyl acetamide solvent to produce a 25% solids solution suitable for dip-coating and other solution processing techniques (Tables 4.3, 4.12, and 4.13).

TYPES OF ELASTOMER I Table 4.7 Typical Properties of Styrene-based Thermoplastic Elastomers
Property
Durometer Tensile Elonga- Modulus Tear Compres-Specific hardness strength, tion, ASTM strength sion set,
Product gravity shore psi percent D-412 pli,die B percent and Product ASTM ASTM ASTM ASTM ASTM ASTM Manufacturer no. D-792 D-2240 D-412 D-412 psi % D-624 D-395
R70-001 0.90 50 A 1200 900 150 100 16 C-Flex®, R70-oo3 0.90 70 A 1280 760 340 100 25
R70-oo5 0.90 30 A 1400 950 100 100 11 R70-026 0.90 90 A 1830 650 1,010 100
Consolidated R70-028 0.90 35 A 990 800 120 100 13 Polymer R70-046 0.90 34 A 1320 940 110 100 135 12 Technologies,R70-050 0.90 48 A 1250 880 170 100 100 18 Inc. R70-051 0.90 74 A 1140 680 370 100 150 28
R70-058 0.94 70 A 2080 660 300 100 120 55 R70-057 0.92 40 A 1220 890 100 100 90 33 R70-068 0.93 50 A 1630 850 140 100 110 38 R70-0n 0.90 60 A 1270 780 240 100 20 R70-081 0.90 45 A 1440 920 120 100 17 R70-082 0.90 61 A 1270 860 230 100 130 19 R70-085 0.90 50 A 1380 750 200 100 17 R70-089 0.90 45 A 1640 700 R70-091 0.90 50 A 1280 780 130 100 R70-116 0.90 30 A 1105 810 100 100 84 24 R70-190 0.90 SA 270 1010 20 100 R70-214 0.90 18 A 450 780
D-2103 0.94 70 A 4300 880 400 300 205 Kraton®, D-2104 0.93 27 A 1700 1350 200 300 180
D-2109 0.94 44A 950 800 300 300 160 Shell G-2701 0.90 67 A 1600 800 480 300 260 Chemical G-2703 0.90 63 A 1200 670 470 300 230 Co. G-2705 0.90 55 A 850 700 400 300 140 38
G-2706 0.90 28 A 850 950 130 300 140 G-2712 0.88 42 A 840 820 250 300 140
M edicaflex ™ The Lambda series of Medicaftex is a polyurethane-based TPE polymer that exhibits low modulus characteristics with high tear strength and abrasion resistance. Those listed in the tables have passed USP Class VI compatibility tests and have been used as replacements in some natural rubber latex and silicone rubber applications. The polymer has been applied to uses such as catheters, tubing and films where softness, low durometer hardness, low modulus or high elongation are needed (Tables 4.3, 4.12, and 4.13).
I 313

314 II L ______________ B_I_O_M_E_D __ IC_A_L __ E_L_A_ST_O __ M_E_R_S ______________ ~
Peliethane™ polyurethane elastomers The 2363 series Pellethane™ TPE elastomers have a wide range of durometer hardness and are noted for their high tensile and tear strength and abrasion resistance. Chemically they are classed as polytetramethylene glycol ether polyurethanes. The ether series is the most widely used for medical applications although polyester versions of Pellethane ™ are useful for some applications. None of these polymers have the disadvantage of containing plasticizers which can migrate out of the polymer over time resulting in reduction in physical properties. Medical tubing made from Pellethane™ polymer is widely used. These TPEs are unaffected by ethylene oxide gas, gamma radiation and electron beam sterilization procedures. Pellethane ™ can be processed by injection molding and extrusion. For details on physical properties, processing and biocompatibility (Tables 4.3, 4.12, and 4.13).
Notice Regarding Long-Term Medical Implant Applications The Dow Chemical Company does not recommend Pellethane ™ elastomers for long-term medical implant applications in humans (more than 30 days). Nor do they recommend the use of Pellethane™ elastomers for cardiac prosthetic devices regardless of the time period that the device will be wholly or partially implanted in the body. Such applications include, but are not limited to, pacemaker leads and devices, cardiac prosthetic devices such as artificial hearts, heart valves, intra-aortic balloon and control systems, and ventricular bypass assist devices. The company does not recommend any non-medical resin (or film) product for use in any human implant applications.
PolyBlend™ polyurethane This TPE has been described as an aromatic elastoplastic polyurethane alloy. It possesses a low coefficient of friction, low extract ables, and dimensional stability. Hardness ranges from 65 to 75 Shore D. The material is classified for short-term (29 days or less) implantation. Clear and radiopaque formulations are available. Tubing should be annealed at 80°C for four hours to reduce crystallinity (Tables 4.3, 4.4, 4.12, and 4.14).
Tecoflex® polyurethane Tecoflex is an aliphatic polyether-based polyurethane that is available in clear and radiopaque grades. They are reaction products of methylene bis (cyclohexyl) diisocyanate (HMDI), poly (tetramethylene ether glycol) (PTMEG), and 1,4 butane diol chain extender. The manufacturer claims that the aliphatic composition of Tecoflex® eliminates the danger of forming methylene dianiline (MDA) which is potentially carcinogenic. MDA can be generated from aromatic polyurethanes if they are improperly processed or overheated. Tecoflex has been reported to crack under stress when implanted, long-term, in animals. An advantage of Tecoflex is that it softens considerably within minutes of insertion in the body. This

L-_______________ TY __ P_E_S_O_F __ E_L_A_ST_O __ M_E_R ________________ ~I I 315
feature can offer patient comfort for short-term applications such as catheters and enteral tubes; it is also reported to reduce the risk of vascular trauma (Tables 4.3, 4.12, and 4.13).
Tecothane® Tecothane® is an aromatic polyether-based TPE polyurethane polymer. It has processibility and biocompatibility characteristics similar to Tecoflex® except that it is an aromatic rather than an aliphatic polyurethane. Tecothane® is synthesized from methylene diisocyanate (MDI), polytetramethylene ether glycol and 1,4 butanediol chain extender. By varying the ratios of the reactants, polymers have been prepared ranging from soft elastomers to rigid plastics. The manufacturer of Tecoflex® and Tecothane® point out that there is not much difference between medical-grade, aliphatic and aromatic polyether-based polyurethanes with regard to chemical, mechanical and biological properties. However, they caution that with improper processing of Tecothane® (e.g., high moisture content or steam sterilization) it is possible to form measurable amounts of methylene dianiline (MDA), a listed carcinogen. The use of ethylene oxide or gamma radiation are suitable sterilizing agents that do not affect the chemical or physical properties (Tables 4.3, 4.12, and 4.13).
Texin™ There are four basic polymer formulations of Texin polyurethane TPE that may be suitable for medical applications. They range in hardness and flexural modulus. Texin elastomers are produced by the reaction of diisocyanate with a high molecular weight polyester or polyether polymer and a low molecular weight dio!. The polyethers (products 5286 and 5265) offer greater hydrolytic stability and stress crack resistance. The polyesterbased polyurethane (product 5187) and the polyester polyurethane/ polycarbonate blend (product 5370) possess high impact strength and high stiffness along with useful low-temperature properties. Texin is not recommended for implants of greater than 30 days duration. Texin should not be sterilized by autoclave or use of boiling water. Other advantages offered by Texin TPUs are that plasticizers are not necessary to achieve flexibility, the amount of extractables are low, and they possess high tensile strength, high tear strength, and high abrasion resistance. Texin polyurethanes are hydroscopic and will absorb ambient moisture. They can be processed by extrusion and injection molding if thoroughly dried beforehand. As with all chemical systems, the proper use and handling of these materials can not be over-emphasized (Tables 4.3, 4.12, and 4.13).
Texin™ 5370 is a blend of polyester-based polyurethane and polycarbonate. It offers high impact strength and high stiffness. Steam sterilization or boiling should be avoided (Tables 4.3, 4.12, and 4.13).

316 I ~I ______________ B_I_O_M_E_D __ IC_A_L __ E_LA __ ST_O __ M_E_R_S ____________ ~
Polycarbonate-based polyurethanes
Carbo thane TM.
This medical grade TPE polyurethane is the reaction product of an aliphatic diisocyanate, a polycarbonate-based macrodiol, and a chain terminating low molecular weight diol (Tables 4.4, 4.12, and 4.13).
ChronoFlex™ AR. Available as a dimethyl acetamide solution, this segmented, aromatic, polycarbonate-based TPE polyurethane was designed to mimic Ethicon Corporation's Biomer. The polymer is made from the addition of diphenylmethane 4,4'-diisocyanate to a polycarbonate diol followed by addition of a mixture of chain extenders and a molecular weight regulator. The polymer is believed to be resistant to environmental stress cracking such as that experienced by other polyurethanes coated onto pacemaker leads (Tables 4.4, 4.12, and 4.13).
Coremer™ Specifically designed as an 80 Shore A durometer TPE, this is a diamine chain extended version of Corethane®. Coremer™ solution cast films have a low initial modulus and high flex fatigue life. Information as to longterm biostability is not available at this time (Tables 4.4 and 4.13).
Corethane® A polycarbonate TPE polyurethane that claims biostability is achieved through its replacement of virtually all ether or ester linkages with carbonate groups. The soft segment is composed of a polycarbonate diol formed by the condensation reaction of 1,6-hexanediol with ethylene carbonate. The polycarbonate diol is converted to a high molecular weight polyurethane by the reaction with l,4-methylene bisphenyl diisocyanate (MDI) and 1,4-butanediol. It is reported to be resistant to environmental stress cracking as experienced with insulation on pacemaker lead wires. The polymer can be extruded, injection molded or compression-molded, and can be bonded with conventional urethane adhesives and solvents (Tables 4.4, 4.12, 4.13, and 4.14).
Corhesive ™ Corhesive™ is a solvent-free, two-component reaction adhesive system for use with polyurethanes, plasma treated silicones and certain metals (Tables 4.4, 4.12, 4.13, and 4.14).

L-_______________ TY __ P_E_S_O_F __ E_LA __ ST_O __ M_E_R ______________ ~I I 317
Polypropylene-based elastomers
Sarlink® This is a polypropylene-based TPE that has been used as a replacement for medical stoppers previously made from butyl rubber. Sarlink® has the characteristics typical of rubber vulcanizates such as elasticity, flexibility, high coefficients of friction and softness. Sarlink® combines gas impermeability without concern for contamination of biological medium. Applications for medical grade Sarlink® are inserts on syringe plungers, reusable injection caps, vacuum assisted blood sampling tubes, plus flexible grade tubing. The number of stoppers produced from Sarlink annually number in the billions. The material can be injection molded, blow molded, extruded, calendered, and thermoformed on standard processing equipment. It can be thermal bonded or adhesive bonded (Tables 4.5, 4.12, and 4.13).
Polyvinyl chloride elastomers
Polyvinyl chloride polymer is polymerized from vinyl chloride monomers. It is a hard material which can be made soft and flexible through the addition of a plasticizer or a copolymer. As such, it resembles an elastomer and can be included with other TPEs. Also optionally added to PVC are fillers, stabilizers, antioxidants and others. A typical PVC plasticizer for medical products is di(2-ethylhexyl) phthalate (also known as dioctyl phthalate, DOP). Some producers of PVC also offer non-phthalate formulations. PVC has been used extensively for blood bags, blood tubing, endotracheal tubes, catheters and fittings, urology tubes, intravenous tubing, respiratory devices and dialysis sets. Leaching of the plasticizer can offer difficulties if the application is not short-term. Medical grade PVC is available from B.F. Goodrich under the name Geon® RX, Elastichem™ PVC, EllayTM PVC, Multichem™ PVC, Teknor™ PVC, AlphaGary and others. PVC polymers have also been incorporated as additives to polyurethane to alter the properties of the latter.
Elastichem™ PVc. This polyvinyl chloride compound family is highly elastomeric and exhibits a dry non-tacky surface even at hardnesses as low as 40 Shore A durometer. Their rubber-like resilience, high elongation and low permanent set and fatigue resistance offer advantages over conventional formulations (Tables 4.6, 4.12, and 4.13).
EllayTM PVc. Compounds from Ellay Corp. are available with Shore hardness ranges from 55 A to 100 A. The polymers have been applied to medication

318 I ~I _______________ B_I_O_M_E_D_I_C_A_L __ E_L_A_S_T_O_M_E_R_S ______________ ~
delivery systems, blood collection, processing and storage, gastro-urological devices and collection systems. Product numbers ending in 'R' are special radiation resistant grades (Tables 4.6, 4.12 and 4.13).
Geon® PVc. Geon® PVC is associated with vinyl examination gloves. For this use, Geon® recommends a combination of Geon® 121 AR and 213. For a more 'latex type' feeling, Goodtouch 250xlOO is recommended. Typical film samples have passed patch insult tests when worn against the skin for extended periods (Tables 4.6, 4.12 and 4.13).
Multichem™ PVC This line of PVC polymers consist of alloys of PVC in combination with other polymers. They display notable dynamic properties and resistance to migration and extraction. These non-toxic PVC compounds (includes Multichem™ and Elastichem™) have over 25 years of experience in the medical field (Tables 4.6, 4.12 and 4.13).
TeknorTM Apex PVC This extrudable PVC has found use as tubing for blood transport and delivery systems, dialysis and enteral feeding systems, oxygen delivery systems, catheters, and drainage systems. Product numbers containing an R are special radiation resistant grades (Tables 4.6, 4.12 and 4.13).
Styrene-based elastomers
C-Flex® TPE. C-Flex® thermoplastic elastomers are based on styrene/ethylene-butylene/styrene block copolymers. C-Flex® polymers designated as 'medical grade' are clear and can be processed using conventional extrusion and injection molding equipment. They have been tested using Good Laboratory Practices and have successfully passed USP Class VI, biocompatibility tests. Translucent versions have high rebound values at ultimate elongation. Medical tubing, ureteral stents, blood pumps, feeding tubes and nephrostomy catheters are successful uses of this material (Tables 4.7, 4.12 and 4.13).
Kraton® Kraton® elastomer consists of block segments of styrene and rubber monomers and are available as Kraton® 0 and G series. The 0 series is based on unsaturated midblock styrene-butadiene-styrene copolymers whereas the G series is based on styrene-ethylene/butylene-styrene copolymers with a stable saturated midblock. Listed among the attributes of both series are such features as low extractables, dimensional stability,

TYPES OF ELASTOMER I I 319 L-____________________________________________________ ~
vapor and gas transmission properties, ease of sterilization, softness and clarity. They exhibit elastomeric flexibility coupled with thermoplastic processibility (Tables 4.7, 4.12, 4.13).
4.2.2 Crosslinked elastomers
NaturaL rubber
Natural rubber (cis-polyisoprene) is strong and one of the most flexible of the elastomers. The material has been used for surgeon's gloves, catheters, urinary drains and vial stoppers. However, because it has the potential to cause allergic reactions thought to be due to the elution of entrapped natural protein, this elastomer is being used less now than in the past. Safer substitutes. are being selected.
Silicone eLastomers
Silicone elastomers have a long history of use in the medical field. They have been applied to cannulas, catheters, drainage tubes, balloon catheters, finger and toe joints, pacemaker lead wire insulation, components of artificial heart valves, breast implants, intraocular lenses, contraceptive devices, bum dressings and a variety of associated medical devices. A silicone reference material has been made available by the National Institutes of Health to equate the blood compatibility of different surfaces for vascular applications. This material is available as a silica-free sheet. Contact the Artificial Heart Program, NHBLI, NIH, Bethesda, Md. for further information.
The silicone elastomers most commonly used for medical applications are the high consistency (HC) and liquid injection molding (LIM) types. The former is most often peroxide cured and the latter platinum cured although there are variations. Both materials are similar in properties. LIM offers greater advantages to the medical device molder and is gaining in popularity. This form of silicone may become the molder's material of choice within the next few years.
High consistency (He) silicone eLastomer High consistency silicone elastomer consists of methyl and vinyl substituted silicones with aromatic and fluorinated functional groups in some formulations. For the most part, they are peroxide crosslinked. Items are usually compression or transfer molded (Tables 4.8).
Liquid injection moLding (LIM) silicone eLastomer Liquid injection molding (LIM) with liquid silicone rubber (LSR) is fast

BIOMEDICAL ELASTOMERS 320 I I L-____________________________________________________ ~
Table 4.8 Typical Properties of High Consistency (HC) Silicone Elastomers
Property
Product and Manufacturer
Applied Silicone Medical Implant Grade, Applied Silicone Corp.
NuSil Silicone,
NuSil Technology
Silastic ®
Medical Materials,
Dow Corning Corp.
Product no.
40039 40040 40041 40042 40043 40044 40045 40046 40063
MED-2174 MED-2245 MED-4515 MED 4516 MED-4735 MED 4750 MED 4755 MED 4765 MED-4770
MDX4-421O 07-4535 07-4550 07-4565 07-4720 07-4735 07-4750 07-4765 07-4780
Specific Durometer Tensile Tear
gravity ASTM D-792
1.12 1.15 1.20 1.20 1.12 1.12 1.15 1.20 1.20
1.15 1.13 1.15 1.21 1.10 1.15 1.14 1.20 1.17
1.10 1.10 1.14 1.20 1.10 1.10 1.14 1.14 1.22
hardness, shore
ASTM D-2240
35 A 50 A 66 A 78 A 23 A 33 A 51 A 66 A 70 A
52 A 41 A 52 A 72A 35 A 50 A 57 A 65 A 70 A
25 A 33 A 51 A 66 A 23 A 35 A 50 A 50 A 78 A
strength, Elongation, strength psi percent pli, die B
ASTM ASTM ASTM D-412 D-412 D-624
1600 1500 1200 1200 1100 1600 1400 1200 1400
1200 1300 1350 1175 1310 1350 1375 1100 1375
550 1200 1375 1000 1200 1050 1300 1300 850
1200 900 900 600 1500 1015 600 500 850
715 700 450 370 1250 810 800 900 700
350 1015 600 550 1100 1200 900 900 600
200 220 260 280 160 150 190 250 280
200 140 90 80
200 230 300 240 300
50 160 170 210 150 200 230 230 190
becoming the technique of choice for processing silicone elastomers. Modifications of conventional injection molding equipment are required. For example, pumps to handle two components being injected simultaneously are required. The heaters on the injection barrel and nozzle are replaced by water cooled jackets. The mold is heated in the range of 300 to 400°F. Because the (LSR) flows easily, injection pressures are low (800 to 3000 psi). Elastomeric items cure rapidly in the mold (e.g., a 7 gram part will crosslink in about 15 seconds at 350 OF). Many formulations rely on platinum as a crosslinker. Perhaps in the future, the majority of silicone rubber molded parts will be made in this fashion. Appropriate equipment is commercially available.

TYPES OF ELASTOMER I Table 4.9 Typical Properties of Liquid Injection Molding (LIM) Silicone Elastomers
Property
Specific Durometer Tensile Tear hardness, strength, Elongation, strength
Product gravity shore psi percent pli, die B and Product ASTM ASTM ASTM ASTM ASTM Manufacturer no. D-792 D-2240 D-412 D-412 D-624
40023 1.11 lOA 500 750 80 Applied Silicone 40024 1.11 20 A 800 600 140 Medical Implant 40025 1.12 30 A 950 600 150 Grade, 40026 1.12 40 A 980 450 170 Applied Silicone 40027 1.13 50 A 1000 400 190 Corp. 40028 1.13 60 A 1100 350 220
40029 1.10 30 A 900 300 80 40071 1.14 70 A 1200 350 220 40072 1.10 25 A 650 400 60 40082 1.10 40 A 900 250 110
NuSil Silicone, MED-621O 1.04 50 A 1000 100 35 MED-6233 1.03 50 A 1200 300 75
NuSil Technology MED-6382 1.13 45 A 400 200 MED-6820 1.05 40 A 750 125 25
Silastic® 07-4840 1.12 40 A 950 425 150 Medical Materials, 07-4850 1.14 50 A 1350 550 225 Dow Corning Corp. 07-6860 1.16 60 A 1300 450 250
Tables 4.8, 4.9, 4.10 and 4.11 list the silicones made by Applied Silicone Corp., Dow Corning Corp., and NuSil Technologies. Table 4.12 lists their biocompatibility status and Table 4.13 recommended sterilization methods. Dow Corning no longer offers the following materials for general sale:
• Silastic MDX 4-4515 • Silastic MDX 4-4515 • Silastic Q7-2245 • Dow Corning Q7-2213
Further, they have discontinued the sale of all implant grade materials.
Other silicones
Silicones and polyurethanes have been used to produce denture liner materials and maxillofacial prostheses. Most of these materials are silicone based, e.g., Flexibase, Molloplast-B, Prolastic, RS 330 T-RTV, Coe-Soft, Coe-Super Soft, Vertex Soft, PERform Soft, and Petal Soft. Other custom
I 321
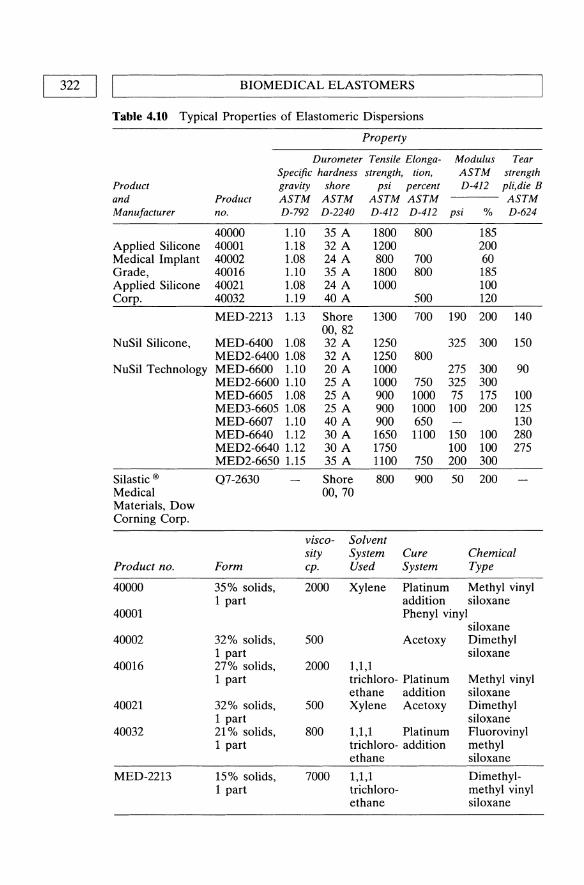
322 I LI ______________ B_I_O_M_E_D __ IC_A_L __ E_L_A_ST_O __ M_E_R_S ______________ ~
Table 4.10 Typical Properties of Elastomeric Dispersions
Product and Manufacturer
Applied Silicone Medical Implant Grade, Applied Silicone Corp.
NuSil Silicone,
NuSil Technology
Silastic ®
Medical Materials, Dow Corning Corp.
Product no.
40000
40001
40002
40016
40021
40032
MED-2213
Property
Product no.
Modulus ASTM D-412
Tear strength pli,die B
--- ASTM
Durometer Tensile ElongaSpecific hardness strength, tion, gravity shore psi percent ASTM ASTM ASTM ASTM D-792 D-2240 D-412 D-412 psi % D-624
40000 1.10 40001 1.18 40002 1.08 40016 1.10 40021 1.08 40032 1.19
MED-2213 1.13
MED-6400 1.08 MED2-6400 1.08 MED-6600 1.10 MED2-6600 1.10 MED-6605 1.08 MED3-6605 1.08 MED-6607 1.10 MED-6640 1.12 MED2-6640 1.12 MED2-6650 1.15
Q7-2630
35 A 32 A 24 A 35 A 24 A 40 A
Shore 00,82 32 A 32 A 20 A 25 A 25 A 25 A 40 A 30 A 30 A 35 A
Shore 00, 70
1800 1200 800 1800 1000
1300
1250 1250 1000 1000 900 900 900 1650 1750 1100
800
Form
viscosity cpo
Solvent System Used
800
700 800
500
700
800
750 1000 1000 650 1100
750
900
Cure System
185 200 60 185 100 120
190 200
325 300
275 300 325 300 75 175 100 200
150 100 100 100 200 300
50 200
140
150
90
100 125 130 280 275
Chemical Type
35% solids, 1 part
2000 Xylene Platinum Methyl vinyl
32% solids, 1 part 27% solids, 1 part
32% solids, 1 part 21 % solids, 1 part
15% solids, 1 part
500
2000
500
800
addition siloxane Phenyl vinyl
siloxane Acetoxy Dimethyl
1,1,1 trichloro- Platinum ethane addition Xylene Acetoxy
1,1,1 Platinum trichloro- addition ethane
siloxane
Methyl vinyl siloxane Dimethyl siloxane Fluorovinyl methyl siloxane
7000 1,1,1 Dimethylmethyl vinyl siloxane
trichloroethane
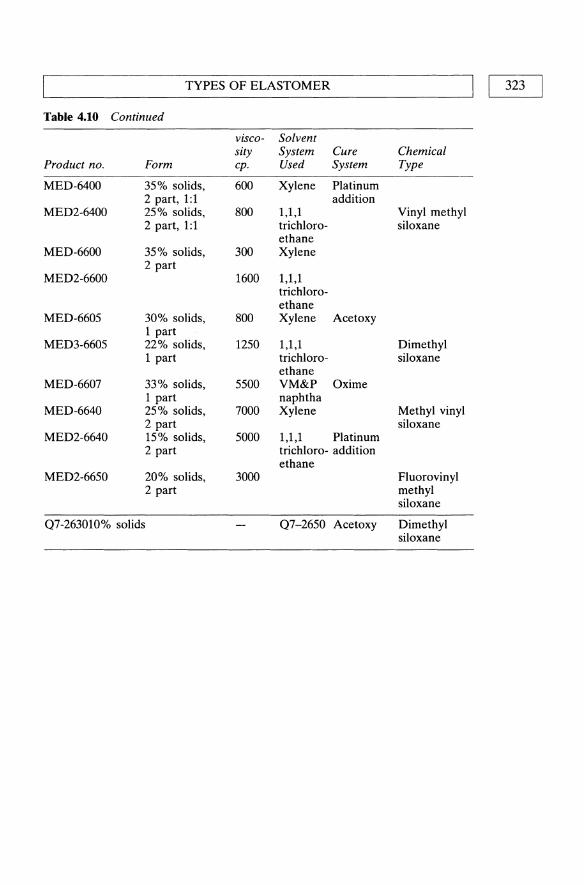
TYPES OF ELASTOMER I I 323
Table 4.10 Continued
visco- Solvent sity System Cure Chemical
Product no. Form cpo Used System Type
MED-64oo 35% solids, 600 Xylene Platinum 2 part, 1:1 addition
MED2-6400 25% solids, 800 1,1,1 Vinyl methyl 2 part, 1:1 trichloro- siloxane
ethane MED-66oo 35% solids, 300 Xylene
2 part MED2-66oo 1600 1,1,1
trichloro-ethane
MED-6605 30% solids, 800 Xylene Acetoxy 1 part
MED3-6605 22% solids, 1250 1,1,1 Dimethyl 1 part trichloro- siloxane
ethane MED-6607 33% solids, 5500 VM&P Oxime
1 part naphtha MED-6640 25% solids, 7000 Xylene Methyl vinyl
2 part siloxane MED2-6640 15% solids, 5000 1,1,1 Platinum
2 part trichloro- addition ethane
MED2-6650 20% solids, 3000 Fluorovinyl 2 part methyl
siloxane
07-263010% solids 07-2650 Acetoxy Dimethyl siloxane

324 I I BIOMEDICAL ELASTOMERS
Table 4.11 Typical Properties of Silicone Elastomeric Adhesives
Property
Durometer Tensile Tear Adhesive Specific hardness strength, Elongation, strength, strength
Product and Manufacturer
Applied Silicone Medical Implant Grade,
Applied Silicone Corp.
NuSil Silicone, NuSil Technology
Silastic® Medical Materials Dow Corning Corp.
Product no.
40064
gravity shore ASTM ASTM
Product no. D-792 D-2240
40064 Medical Grade 1.08 24 A RTV Silicone Adhesive Medical Grade High Strength RTV Silicone Adhesive
MED-1137 1.07 29 A
Medical Adhesive A 1.06 29 A 355 Medical 1.40 Grade Pressure Sensitive
Cure Conditions
Produces acetic acid. Cures @ RT with atmospheric moisture, 20 to 60% RH.
Medical Grade RTV Silicone Adhesive Medical Grade High Strength RTV Silicone Adhesive
24 hours @ 25°C, aged 24 hours @ RT.
MED-1137
Medical Adhesive A
355 Medical Grade Pressure Sensitive
Produces acetic acid. Cure 3 days @ RT with atmospheric moisture, 20 to 60% RH.
Produces acetic acid, requires 50% RH & 7 days to cure. Non-curing dispersion - becomes adhesive as solvent evaporates.
psi percent die B, pli (to ASTM ASTM ASTM silicone) D-412 D-412 D-624 pli
18+ 850 750 70 18
950 770 18
550 450
450 400 30 20+
Comments
Bonds silicones to each other and some synthetics, metals.
Bonding silicone to polyester, etc. High strength bonds to polyester, nylon, polyurethane and metals.
Bonding silicones to each other & some synthetics/metals. When fully cured resembles some conventional silicone elastomers.
Bonding silicone rubber to itself. Useful for cast films or parts from dispersions. Adheres to skin for use with ileostomy and colostomy appliances.

TYPES OF ELASTOMER I I 325 L-____________________________________________________ ~
Table 4.U Biocompatibility of Various Elastomers
Classification
Thermoplastic elastomer
PCCE copolyester elastomer
Polyurethanebased elastomers
Medicafiex™,
Biocompatibility Status*
Product and Product Intracutaneous Systemic Skin
Manufacturer no. Hemolysis Pyrogenicity Injection Injection Sensitiz.ation
Santoprene® 281-45 passed passed passed passed passed Rubber, 281-55 passed passed passed passed passed
281--{j4 passed passed passed passed passed Advanced 281-73 passed passed passed passed passed Elastomer 281-87 passed passed passed passed passed Systems 283-40 passed passed passed passed passed
EcdeJTM Elastomer, 9965 passed passed passed Eastman Chemical Co. 9966 Biospan® Segmented,
Polyurethane, Biospan® passed passed passed passed passed The Polymer Technology Group, Inc. H ydrothane TM, Poly Medica Hydrothane™ Biomaterials, Inc.
Advanced Resin Technology
Pellethane™ 2363 series, Dow Chemical Co. PolyBlend™ 1000 , and PolyBlend™ 1100 Poly Medica Biomaterials, Inc.
Intramuscular
MP-5000 MF-5001 MF-5040 MF-5041 MF-5056 MF-5057 MF-5062
Pellethane ™ 2363 series
PolyBlend™ 1000 and
PolyBlend™ 1100
passed passed passed
passed passed passed
Biocompatibility Status*
Tissue Cell Product no. 10 days 30 days 90 days Culture Comments
281-45 281-55 passed passed 281--{j4 281-73 281-87 283-40 9965 9966 Biospan® Hydrothane™
passed Passed USP Class VI testing, Tripartite testing, mouse embryo toxicity testing and Ames Mutagenicity testing.
passed
passed See text for status.

326 II L ______________ B_I_O_M_E_D __ IC_A_L __ E_L_A_ST_O __ M_E_R_S ____________ ~
Table 4.12 Continued
Biocompatibility Status*
Intramuscular Tissue Cell Product no. 10 days 30 days 90 days Culture Comments
MF-Sooo MF-SOO1 MF-5040 MF-S041 MF-50S6 MF-SOS7 MF-S062 Peliethane™ 2363 series PolyBlend™ 1000 and PolyBlend™
Classification
passed passed
passed
passed
Product and
Manufacturer
Tecoflex®, Polyurethane- and based Tecothane®, elastomers
Thermedics, Inc.
Miles, Inc.
Polycarbonate- Carbo thane TM, based polyurethanes Thermedics, Inc.
ChronoFlex™ AR, Poly Medica Biomaterials, Inc. Coremer™, Corethane®, and
Corhesive TM, Corvita Corp.
passed passed passed passed passed passed
Passed USP Class VI testing.
passed Passed USP Class VI testing. See text for status. See text for status.
Biocompatibility Status*
Product Intracutaneous Systemic Skin
no. Hemolysis Pyrogenicity Injection Injection Sensitization
EG60A passed EG80D lOSSD 106SD 1074A passed 1075D 108SA 109SA
Texin™
PC-3S5SD PC-3572D PC-3S7SA passed PC-3S8SA PC-3S9SA
ChronoFlex TMpassed AR
Coremer™ TPE SSD TPE 7SD TPE 80A passed
Corhesive ™ passed
passed passed
passed passed
passed passed passed
passed passed
passed passed passed
passed passed passed passed
passed passed passed passed passed passed passed
Sarlink® Sarlink® Polypropylene- medical grade, medical grade based DSM Thermoplastic elastomers Elastomers, Inc.

L-_______________ TY __ P_E_S_O_F __ E_L_A_ST_O __ M_E_R ________________ ~I I 327
Table 4.U Continued
Biocompatibility Status*
Intramuscular Tissue Cell Product no. 10 days 30 days 90 days Culture Comments
EG60A EG800 10550 10650 1074A 10750 1085A 1095A
Texin™
PC-35550 PC-35720 PC-3575A PC-3585A PC-3595A
ChronoFlex™ AR
Coremer™
TPE 550 TPE 750 TPE 80A Corhesive™
Sarlink® medical grade
Classification
Polyvinyl chloride elastomers EllayTM PVC,
Passed USP Class VI testing. passed passed See text for status.
passed passed Passed USP Class VI testing.
See text for status.
passed passed passed passed passed
passed passed passed passed passed passed passed passed
See text for status.
Biocompatibility Status*
Product Intracutaneous Systemic Skin Product and
Manufacturer no. Hemolysis Pyrogenicity Injection Injection Sensitization
Elastichem™ PVC, Elastichem™ Colorite PVC Plastics Co. EllayTM PVC passed passed passed Ellay, Inc. Geon® PVC, Geon® PVC B. F. Goodrich Co. Multichem™ PVC, Colorite Plastics Co.
Teknor™ PVC,
Teknor Apex Co.
Multichem™ PVC
3300-45 NT 3300-50 NT 3300--55 NT 3300-60 NT 3300-68 NT 3300-75 NT 3300--80 NT passed passed passed passed

328 II L ______________ B_I_O_M_E_D __ IC_A_L __ E_L_A_ST_O __ M_E_R_S ______________ ~
Table 4.12 Continued
Classification
Product and
Manufacturer
Teknor™ PVC,
Teknor Apex Co.
Intramuscular
Biocompatibility Status*
Product IntracutaneoltsSystemic Skin
no. Hemolysis Pyrogenicity Injection Injection Sensitization
3300-85 NT 3300-90 NT 3310-50 NT 3310-55 NT 3310-60 NT 3310-65 NT 3310-70 NT 3310-75 NT 3310-80 NT 3310-85 NT 3310-90 NT
90A471R-60NT 90A471R-65NT 9OA471R-70NT 90A471R-75NT 90A471R-80NT 90A471R-85NT 90A471R-90NT
passed passed passed passed
passed passed passed passed passed passed passed passed passed passed passed passed passed passed passed passed passed passed passed passed passed
Biocompatibility Status*
Tissue Cell Product no. 10 days 30 days 90 days Culture Comments
Elastichem™ PVC EllayTM PVC Geon® PVC Multichem™ PVC 3300-45 NT 3300-50 NT 3300-55 NT 3300-60 NT 3300-68 NT 3300-75 NT 3300-80 NT 3300-85 NT 3300-90 NT 3310-50 NT 3310-55 NT 3310-60 NT 3310-65 NT 3310-70 NT 3310-75 NT
passed
passed
passed
passed passed passed passed passed passed passed passed passed passed passed passed passed passed passed
See text for status.
Passed USP Class VI testing. See text for status. See text for status.
Passed USP Class VI testing. Passed USP Class VI testing.
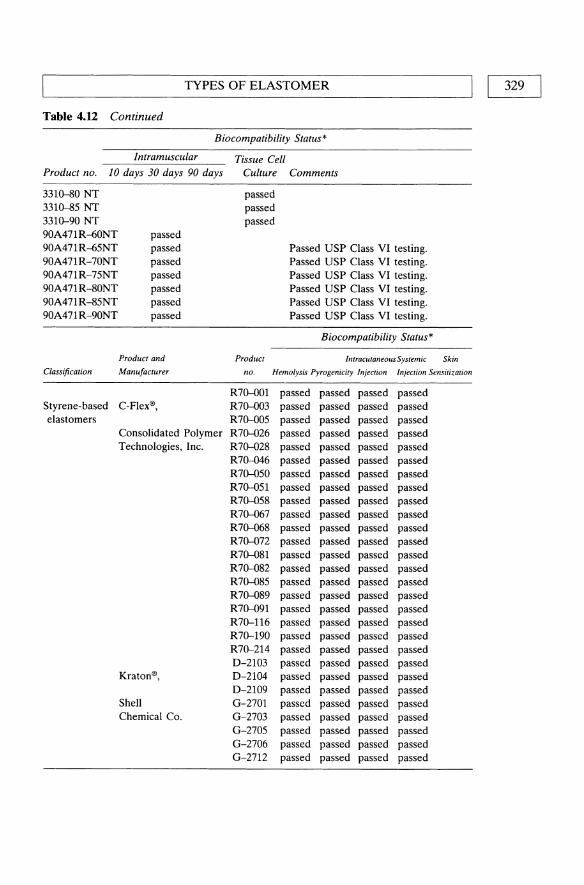
TYPES OF ELASTOMER I I 329
Table 4.U Continued
Biocompatibility Status*
Intramuscular Tissue Cell Product no. 10 days 30 days 90 days Culture Comments
3310--80 NT passed 3310--85 NT passed 3310-90 NT passed 90A471R--{)ONT passed 90A471R--{)5NT passed Passed USP Class VI testing. 90A471R-70NT passed Passed USP Class VI testing. 90A471R-75NT passed Passed USP Class VI testing. 90A471R-80NT passed Passed USP Class VI testing. 90A471R-85NT passed Passed USP Class VI testing. 90A471R-90NT passed Passed USP Class VI testing.
Biocompatibility Status*
Product and Product Intracutaneous Systemic Skin
Classification Manufacturer no. Hemolysis Pyrogenicity Injection Injection Sensitization
R70-001 passed passed passed passed Styrene-based C-Flex®, R70-003 passed passed passed passed elastomers R70-005 passed passed passed passed
Consolidated Polymer R70-026 passed passed passed passed Technologies, Inc. R70-028 passed passed passed passed
R70-046 passed passed passed passed R70-050 passed passed passed passed R70-051 passed passed passed passed R70-058 passed passed passed passed R70-067 passed passed passed passed R70-068 passed passed passed passed R70-072 passed passed passed passed R70-081 passed passed passed passed R70-082 passed passed passed passed R70-085 passed passed passed passed R70-089 passed passed passed passed R70-091 passed passed passed passed R70-116 passed passed passed passed R70-190 passed passed passed passed R70-214 passed passed passed passed D-2103 passed passed passed passed
Kraton®, D-2104 passed passed passed passed D-2109 passed passed passed passed
Shell G-2701 passed passed passed passed Chemical Co. G-2703 passed passed passed passed
G-2705 passed passed passed passed G-2706 passed passed passed passed G-2712 passed passed passed passed

330 I LI ______________ B_I_O_M_E_D __ IC_A_L __ E_L_A_ST_O __ M_E_R_S ______________ ~
Table 4.12 Continued
Product no.
R70--001 R70--003 R70--005 R70-026 R70-028 R7()....{)46 R70-050 R70-051 R70-058 R70--067 R70--068 R70-072 R70-081 R70-082 R70-085 R70-089 R70-091 R70-116 R70-190 R70-214 D-2103 D-2104 D-2109 G-2701 G-2703 G-2705 G-2706 G-2712
Classification
Polydimethylsiloxane
Biocompatibility Status*
Intramuscular
10 days 30 days 90 days
passed passed passed passed passed passed
passed passed passed passed passed passed passed passed passed passed passed passed passed passed passed passed passed passed passed passed passed passed passed passed passed passed passed passed passed passed passed passed passed passed passed passed passed passed passed passed passed passed passed passed passed passed passed passed passed passed passed passed passed passed
passed passed passed passed passed passed passed
Tissue Cell Culture
passed passed
passed passed passed passed passed passed passed passed passed passed passed passed passed passed passed passed passed passed passed passed passed passed passed passed passed
Product
Comments
C-Flex testing data is available from manufacturer.
Passed USP Class VI testing. Passed USP Class VI testing. Passed USP Class VI testing. Passed USP Class VI testing. Passed USP Class VI testing. Passed USP Class VI testing. Passed USP Class VI testing.
Biocompatibility Status*
IntracutaneousSystemic Skin Product and
manufacturer no. Hemolysis Pyrogenicity Injection Injection Sensitization
Applied Silicone Medical Implant Grade, Applied Silicone Corp. NuSii Silicone, NuSil Technology
Applied Silicone Medical Implant Grade
NuSii Silicone
MDX4-4210 Silastic ® 07-4535 passed Medical Materials, 07-4550 passed
07-4565 passed Dow Corning Corp. 07-4720 passed
07-4735 passed
passed passed passed passed passed passed passed passed passed passed passed passed
passed passed passed passed passed passed passed

TYPES OF ELASTOMER I I 331 L-____________________________________________________ ~
Table 4.12 Continued
Biocompatibility Status*
Product and Product Intracutaneous Systemic Skin
Classification Manufacturer no. Hemolysis Pyrogenicity Injection Injection Sensitization
Polydimethyl- Silastic ® 07-4750 passed passed passed passed siloxane Medical Materials, 07-4765 passed passed passed passed
07-4780 passed passed passed passed Dow Corning Corp. 07-4840 passed passed passed passed
07-4850 passed passed passed passed passed 07-6860 passed passed passed passed Medical
Adhesive A passed passed passed passed 355 Medical passed passed passed passed
Grade Pressure Sensitive
Biocompatibility Status*
Intramuscular Tissue Cell Product no. 10 days 30 days 90 days Culture Comments
Applied Silicone Medical Implant Grade NuSii Silicone MDX4-421O passed 07-4535 passed 07-4550 passed 07-4565 passed 07-4720 07-4735 passed 07-4750 passed 07-4765 passed 07-4780 passed 07-4840 passed 07-4850 07-6860 passed Medical Adhesive A
passed 355 Medical passed Grade Pressure Sensitive
passed passed passed passed
passed
passed
passed passed passed passed
Applied Silicone testing data is available from manufacturer.
See text for status. passed See text for status.
See text for status. See text for status. See text for status.
passed See text for status. See text for status. See text for status. See text for status. See text for status. See text for status.
passed See text for status. See text for status.
See text for status. See text for status.
passed See text for status.
* Biocompatibility based on comparison with USP negative controls Note: It is the user's responsibility to adequately test or determine that these materials are suitable or safe for any application.

332 I I BIOMEDICAL ELASTOMERS
Table 4.13 Sterilization Methods for Elastomers
Product Steam/autoclave Cobalt 60 Ethylene oxide Cold solution
Biospan OK OK Biospan D Biospan S C-Flex R70-00l OK OK OK
R70--003 OK OK OK R70--005 no OK OK R70-026 OK no OK R70-028 no OK OK R70-046 no OK OK R70-050 OK OK OK R70-051 OK OK OK R70-072 OK OK OK OK R70-081 OK OK OK R70-082 OK OK OK R70-085 OK OK OK R70-089 NR OK OK R70-091 NR OK OK R70-116 no OK OK R70-190 no OK OK R70-214 no OK OK
Carbothane with caution OK ChronoFlex Coremer OK OK OK Corethane 80A OK OK OK
55D OK OK OK 75D OK OK OK
Corhesive Ecdel elastomers OK no OK Hydrothane
Kraton G-series OK D-series OK
Medicaflex no OK OK Natural rubber, gum OK OK OK Natural rubber, latex with caution OK OK Pellethane no OK OK Poly blend Poly blend 1100 PVC Elastichem OK OK OK
Ellay OK OK OK Geon Multi-Chern OK OK OK Teknor OK OK OK in general Flexible with caution OK
PVC, OK rigid PVC, no
Santoprene OK OK OK OK Sarlink 3260

TYPES OF ELASTOMER I I 333 L-____________________________________________________ ~
Table 4.13 Continued
Product Steam/autoclave Cobalt 60 Ethylene oxide Cold solution
Silicone High consistency OK LIM OK Adhesives OK Dispersions OK
Tecoflex with caution Tecothane Texin no
OK OK OK OK OK OK OK
OK OK OK OK OK OK OK
with caution with caution
Caution: with some aromatic polyurethanes methylene dianiline (MDA) can be generated with steam sterilization.
Table 4.14 Water Absorption of Various Elastomers
Water absorption, percent
(after 24 hours) Classification Product and manufacturer Product no. ASTM-D 570
Thermoplastic Santoprene® Rubber, 281-55 6.0 vulcanizate 281-64
Advanced Elastomer Systems 281-87 0.0 283-40
PCCE Ecdel™ Elastomer, 9965 copolyester 9966 0.4 elastomer Eastman Chemical Co. 9967
Corethane®, TPE 80A 1.2 Polycarbonate- TPE 55D 0.9
based Corvita Corp. TPE 75D 0.8 polyurethanes Corhesive TM, 1.2
Corvita Corp. Biospan® segmented Biospan® 1.5
Polyurethane- polyurethane, Biospan® D 1.3 based The Polymer Technology Biospan® S 1.5 elastomers Group, Inc.
PolyBlend™ 1000, PB1000-650 < and PolyBlend™ 1100 PB1100-55
PB1100-60 <0.4 Poly Medica PB 11 00-75 Biomaterials, Inc. PBl100-80
Silicone rubber 0.1-0.5 Silicone type A <0.2
adhesive

BIOMEDICAL ELASTOMERS 334 I I L-____________________________________________________ ~
made elastomers have been applied to maxillofacial prostheses, e.g., Cosmesil, Silastic® 4-4210, Silastic® 4-4515, Silicone A-102, Silicone A-2186, Silskin II, Isophorone polyurethane, and Epithane-3. Denture liners with acrylic and silicone include Coe-Soft, Coe Super-Soft, Vertex Soft, Molloplast-B and Flexibase.
Dispersions
Solvent solutions of polyurethane elastomers and silicone elastomers are given in Table 4.10. These materials are helpful in casting thin films and odd or complex shapes.
4.3 ESTABLISHING EQUIVALENCE
Specific polymeric materials traditionally used for medical applications have been recently withdrawn from the medical market. Silicone elastomers are among those withdrawn. To maintain continued supply of vital implants, methods of determining equivalence for withdrawn elastomers with new or existing ones has been adopted by the FDA in the form of an FDA Guidance Document.
4.3.1 FDA Guidance document for substitution of equivalent elastomers
The FDA will allow manufacturers to change sources of silicone elastomers (and others) if they can show that the replacement material is 'not substantially different' from materials described in existing approved applications. The device manufacturer is still required to certify that the processes of fabrication, cure and sterilization it uses in the manufacture of its device are appropriate for the new material and that the device will perform as intended. Premarket notification submission under section 51O(k) of the Federal Food, Drug, and Cosmetic Act (21 USC 360(k) and 21 CFR 807.81(a)(3)(i), or a supplemental premarket approval application under 21 USC 360(k) section 515 and 21 CFR 814.39 is necessary when change could significantly affect the safety or effectiveness of the device. These submissions are required to be submitted and approved before the device may be marketed with the change.
There are a number of tests necessary for comparison of silicone elastomers as indicated by 'Guidance for Manufacturers of Silicone Devices Affected by Withdrawal of Dow Corning Silastic® Materials' (Federal Register, Vol. 58, No. 127, Tuesday, July 6, 1993/ Notices, 36207). They compare the physical, chemical and biological properties of the bulk poly-

ESTABLISHING EQUIVALENCE I I 335
Table 4.15 Equivalent Silicone Elastomers for Existing Dow Corning Silicones
NuSilt Applied,1 Dow Corning* Silicone Silicone Medical Grade Silicone Equivalent Equivalent Silicone Description
Medical MED-1137 40064 Medical RTV Adhesive, Acetoxy Adhesive A System (see also Rehau, Table 4.16) Q7-4535 MED-4535 40044 High Consistency, 35 Durometer,
Peroxide Cure Q7-4550 MED-4550 40045 High Consistency, 50 Durometer,
Peroxide Cure Q7-4565 MED-4565 40046 High Consistency, 65 Durometer,
Peroxide Cure Q7-4720 MED-4720 40043 High Consistency, 20 Durometer,
Platinum Cure Q7-4735 MED-4735 40039 High Consistency, 35 Durometer,
Platinum Cure Q7-4750 MED-4750 40040 High Consistency, 50 Durometer,
Platinum Cure Q7-4780 MED-4780 40042 High Consistency, 80 Durometer,
Platinum Cure MDX4-421O MED-42111 40072 Liquid Silicone, 25 Durometer, Platinum
Cure 40029 Liquid Silicone, 30 Durometer, Platinum
Cure Q7-4840 MED-4840 40026 Liquid Silicone, 40 Durometer Platinum
Cure Q7-4850 MED-4850 40027 Liquid Silicone, 50 Durometer, Platinum
Cure Q7-4865 MED-4865 Liquid Silicone, 65 Durometer, Platinum
Cure DC-360 MED-360 40047 Medical Grade Silicone Fluid, 1000 cps.
Specify 40073 Medical Grade Silicone Fluid, 350 cps. viscosity 40074 Medical Grade Silicone Fluid, 20 cps.
* Dow Corning Corp., Midland, Ml. + NuSii Silicone Technology, Carpinteria, CA 11 Applied Silicone Corp., Ventura, CA Note: It is the user's responsibility to adequately test or determine that these materials are suitable or safe for any application.

[33(;] BIOMEDICAL ELASTOMERS
Table 4.16 Equivalent Silicone Elastomers for Withdrawn Dow Corning silicones
NuSil:j: Appliedd Dow Corning* Silicone Silicone Sillicone Equivalent Equivalent
MDX4--4515 MDX4--4516 07-2245 07-2213 Rehau 1511¥
MED-4515 MED-4516 MED-2245 MED-2213
40045 40046 40009 40016 40076
Medical Grade Silicone Description
50 Durometer, peroxide cure 60 Durometer, peroxide cure 40 Durometer, platinum cure Dispersion in 1, 1, 1 trichloroethane Medical RTV adhesive, acetoxy system
* Dow Coming Corp., Midland, Ml. * NuSil Silicone Technology, Carpinteria, CA. ~ Applied Silicone Corp., Ventura, CA. ¥ Rehau AG and Co., Rehau, Germany. Note: It is the user's responsibility to adequately test or determine that these materials are suitable or safe for any application.
mers as they are received from the supplier and also compare the molded elastomer as it exists in the final medical device.
4.3.2 Equivalent silicone elastomers
Two manufacturers, NuSil Technology and Applied Silicone Corp., are providing equivalent silicone materials for the Dow Corning products that have been withdrawn. Tables 4.15 and 4.16 gives reported comparisons.

RELEVANT ASTM STANDARDS I I 337 L-__________________________________________________________ ~
Table 4.17 Relevant ASTM Standards
D 395 Test Method for Rubber Property - Compression Set D 412 Test Method for Vulcanized Rubber, Thermoplastic Rubbers and
D471 D 570 D 624
Thermoplastic Elastomer - Tension Test Method for Rubber Property - Effect of Liquids Test Method for Water Absorption of Plastics Test Method for Tear Strength of Conventional Vulcanized Rubber and Thermoplastic Elastomer
D 638 Test method for Tensile Properties of Plastics D 792 Test Method for Specific Gravity (Relative Density) and Density of
Plastics by Displacement D 797 Test Methods for Rubber Property - Young's Modulus at Normal and
Subnormal Temperatures D 1630 Test Method for Rubber Property - Abrasion Resistance (NBS
Abrader) D 1708 Test method for Tensile Properties of Plastics by Use of Microtensile
Specimens D 1790 Test method for Brittleness Temperature of Plastic Film by Impact D 1938 Test method for Tear Propagation Resistance of Plastic Film and Thin
Sheeting by a Single-Tear Method D 2240 Test Method for Rubber Property - Durometer Hardness D 2702 Standard Practice for Rubber Chemicals - Determination of Infrared
Absorption Characteristics D 3418 Test Method for Transition Temperatures of Polymers by Thermal
Analysis D 3593 Test Method for Molecular Weight Averages and Molecular Weight
Distribution of Certain Polymers by Liquid Size-Exclusion Chromatography (Gel Permeation Chromatography, GPC) Using Universal Calibration
D 5023 Test Method for Measuring the Dynamic Mechanical Properties of Plastics Using Three Point Bending
D 5026 Test Method for Measuring the Dynamic Mechanical Properties of Plastics in Tension
E 355 Standard Practice for Gas Chromatography, Terms and Relationships E 1356 Test Method for Glass Transition Temperatures by Differential
F 604 F 619 F 720
Scanning Calorimetry or Differential Thermal Analysis Classification for Silicone Elastomers Used in Medical Applications Standard Practice for Extraction of Medical Plastics Standard Practice for Testing Guinea Pigs for Contact Allergens: Guinea Pig Maximization Test
F 748 Standard Practice for Selecting Generic Biological Test Methods for Materials and Devices
F 749 Standard Practice for Evaluating Material Extracts by Intracutaneous Injection in the Rabbit
F 750 Standard Practice for Evaluating Material Extracts by Systemic Injection in the Mouse
F 813 Standard Practice for Direct Contact Cell Culture Evaluation of Materials for Medical Devices
F 895 Standard Practice for Agar Diffusion Cell Culture Screening for Cytotoxicity
F 981 Standard Practice for Assessment of Compatibility of Biomaterials (Non-porous) for Surgical Implants with Respect to Effect of Materials in Muscle and Bone

338 I LI ______________ B_I_O_M_E_D __ IC_A_L __ E_L_A_ST_O __ M_E_R_S ______________ ~
4.4 STERILIZATION OF ELASTOMERS
4.4.1 Sterilization methods
Not all materials respond alike when subjected to various means of sterilization. Some are heat sensitive, some will absorb sterilization fluids, some will be affected by molecular changes when subjected to radiation sterilization and others will absorb and hold irritating gases for extended periods of time. Table 4.13 gives sterilization methods that have been judged most appropriate for each elastomer. The consequences of using an inappropriate method can be loss in physical properties and an adverse biological response.
4.5 RELEVANT ASTM STANDARDS
Standard methods of testing elastomers used for medical applications are given by specific ASTM test methods. Physical and biological tests are provided here to serve as references for the data cited in the tables and listed in Table 4.17. They are also designated in the FDA Guidance Document.
4.6 BIOCOMPATIBILITY
Table 4.12 on biocompatibility of various elastomers is intended to show the status of in vitro and in vivo testing. The successful outcome of these tests can serve as guides to potentially acceptable performance of an elastomeric product in a medical device under development. However, the use of elastomeric products in medical devices is the responsibility of the device manufacturer who must establish their safety and efficacy with the FDA.
4.7 SOURCES
• AlphaGaryAlphaGary, Leominster, MA • Applied SiliconeApplied Silicone Corp., Ventura, CA • Biospan®Polymer Technology Group, Inc., Emeryville, CA • C-Flex®Consolidated Polymer Technologies, Inc., Largo, FL • Carbothane™Thermedics, Inc., Woburn, MA • ChronoFlex™PolyMedica Industries, Inc., Woburn, MA • Coremer™Corvita Corp., Miami, FL • Corethane®Corvita Corp., Miami, FL

I I 339 L-____________________________________________________ ~ SOURCES
• Corhesive™Corvita Corp., Miami, FL • EcdeFMEastman Chemical Co., Kingsport, TN • Elastichem™Colorite Plastics Co., Ridgefield, NJ • EllayTMEllay, Inc., City of Commerce, CA • Geon®B.F. Goodrich Co., Chemical Group, Cleveland, OH • Hydrothane™PolyMedica Industries, Inc., Woburn, MA • Kraton®Shell Chemical Co., Oak Brook, IL • Medicaflex™Advanced Resin Technology, Manchester, NH • Multichem TMColorite Plastics Co., Ridgefield, NJ • Natural rubberExxon Chern. Co., Buffalo Grove, IL Goodyear Tire
and Rubber Co., Akron, OH • NuSil SiliconeNuSil Technology, Carpinteria, CA • Pellethane™Dow Chemical Co., Midland, MI • PolyBlend™PolyMedica Industries, Inc., Woburn, MA • Santoprene® Advanced Elastomer Systems, St Louis MO • Sarlink®DSM Thermoplastic Elastomers, Inc., Leominster, MA • SilasticDow Corning Corp., Midland, MI • Tecoflex®Thermedics, Inc., Woburn, MA • Tecothane®Thermedics, Inc., Woburn, MA • Teknor™Teknor Apex Co., Pawtucket, RI • Texin™Miles, Inc., Pittsburgh, PA

5 Oxide bioceramics: inert ceramic materials in
medicine and dentistry
J. Li and G.W. Hastings
5.1 INTRODUCTION
Single oxide ceramics, e.g. aluminium oxide (AI20 3, alumina) and zirconium dioxide (Zr02, zirconia), are bioceramics of an inert nature. An inert ceramic does not form a bonding to bone similar to those bioceramics of bioactive nature. Alumina bioceramics are in the pure aluminium oxide form, whereas zirconia bioceramics are partially stabilized by additional oxides, e.g. yttrium oxide, calcium oxide or magnesium oxide.
Oxide ceramics exhibit superior mechanical properties, corrosion and wear resistance. Since the oxides are the highest oxidation state of the metal, they are stable even in the most invasive industrial and biomedical environments. Alumina and zirconia are utilized as load-bearing hard tissue replacements and fixation implants in dentistry and surgery.
5.2 SHORT HISTORY
Although the use of alumina as implants can be traced back to the 1930s as described by Hulbert et at. (1) (Table 5.1), the extensive use of alumina since the 1980s has depended on new powder processing technology enabling grain size reduction of the sintered ceramics from 10 micrometers
Handbook of Biomaterial Properties. Edited by J. Black and G. Hastings. Published in 1998 by Chapman & Hall, London. ISBN 0412 60330 6.
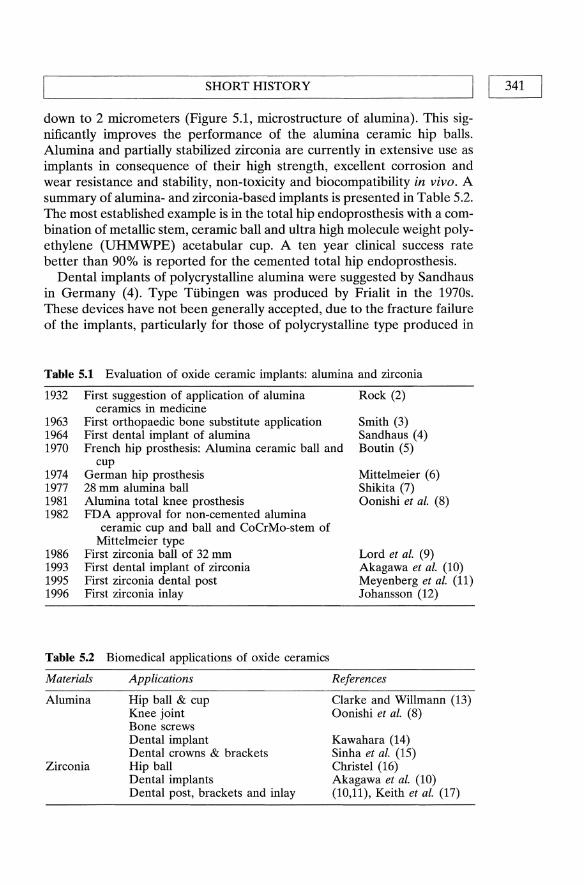
L-_________________ S_H_O_R_T __ H_I_ST_O_R_Y __________________ ~I I 341
down to 2 micrometers (Figure 5.1, microstructure of alumina). This significantly improves the performance of the alumina ceramic hip balls. Alumina and partially stabilized zirconia are currently in extensive use as implants in consequence of their high strength, excellent corrosion and wear resistance and stability, non-toxicity and biocompatibility in vivo. A summary of alumina- and zirconia-based implants is presented in Table 5.2. The most established example is in the total hip endoprosthesis with a combination of metallic stem, ceramic ball and ultra high molecule weight polyethylene (UHMWPE) acetabular cup. A ten year clinical success rate better than 90% is reported for the cemented total hip endoprosthesis.
Dental implants of polycrystalline alumina were suggested by Sandhaus in Germany (4). Type Ttibingen was produced by Frialit in the 1970s. These devices have not been generally accepted, due to the fracture failure of the implants, particularly for those of polycrystalline type produced in
Table 5.1 Evaluation of oxide ceramic implants: alumina and zirconia
1932 First suggestion of application of alumina ceramics in medicine
First orthopaedic bone substitute application First dental implant of alumina
Rock (2)
1963 1964 1970 French hip prosthesis: Alumina ceramic ball and
Smith (3) Sandhaus (4) Boutin (5)
1974 1977 1981 1982
1986 1993 1995 1996
cup German hip prosthesis 28 mm alumina ball Alumina total knee prosthesis FDA approval for non-cemented alumina
ceramic cup and ball and CoCrMo-stem of Mittelmeier type
First zirconia ball of 32 mm First dental implant of zirconia First zirconia dental post First zirconia inlay
Table 5.2 Biomedical applications of oxide ceramics
Materials
Alumina
Zirconia
Applications
Hip ball & cup Knee joint Bone screws Dental implant Dental crowns & brackets Hip ball Dental implants Dental post, brackets and inlay
Mittelmeier (6) Shikita (7) Oonishi et al. (8)
Lord et al. (9) Akagawa et at. (10) Meyenberg et al. (11) Johansson (12)
References
Clarke and Willmann (13) Oonishi et al. (8)
Kawahara (14) Sinha et al. (15) Christel (16) Akagawa et at. (10) (10,11), Keith et at. (17)

342 I 1'--__ O_XI_ D_E_B_I_O_C_E_RAM __ IC_S_IN_M_E_D_IC_ INE __ AN __ D_D_E_N_ Tl_S_T_R_y __ -----'
Figure 5.1 SEM micrograph of dense alumina, etched in boiling H 3P04 for 6 minutes to show the microstructure.
the early 1970s. The single crystal sapphire type, introduced in Japan by Kawahara in the 1970s (18) is, however, still being used and a recent 10-year clinical follow-up report from Sweden showed a 92% success rate (19) for the single crystal dental implants.
Alumina and zirconia ceramics are also being used for alveolar ridge reconstruction (20), maxillofacial reconstruction, as ossicular bone substitutes (21), and in ophthalmology (22), knee prosthesis (8), bone screws as well as other applications as dental biomaterials, such as dental crown core, post, bracket and inlay (23,24).
5.3 MATERIAL PROPERTIES AND PROCESSING
5.3.1 Materials properties
Although alumina is chemically more stable it is mechanically weaker than zirconia, and the phase changes or transformation mechanisms in zirconia produce a unique ceramic material having much higher strength and higher fracture toughness compared with alumina and other ceramics. The excellent mechanical properties of zirconia allow the design of hip balls of smaller diameter in order to reduce the wear of the UHMWPE cup with expected increased long-term clinical performance as a result.

~ ________ M_A_T_E_R_I_A_L_P_R_O_P_E_R_T_I_E_S_A_N_D __ P_R_O_C_E_S_SI_N_G ________ ~I I 343 J The chemical stability of alumina is related to its phase stability, whereas
the phase changes of zirconia result in degradation in strength and wear resistance. Release of substances from zirconia and alumina implants to the surrounding tissue is very low and neither local nor systemic effects have been reported.
Aluminium oxide: alumina
Aluminium oxide is produced by heating its hydrates. At least seven forms of alumina have been reported, but six of these forms have traditionally been designated 'gamma alumina'. When heated above 1200°C, all other structures are irreversibly transformed to the hexagonal alpha-alumina, corundum, a close-packed arrangement of oxygen ions. Thus alphaalumina is the only stable form above 1200°C and by far the most commonly used of structural ceramics. Alpha-alumina is thermodynamically stable and is crystallographically identical with the single crystal ruby and sapphire ceramics. Each aluminium ion is surrounded by six oxygen ions, three of which form a regular triangle on one side, the other three form a similar triangle on the other side, with the two planes of the triangles being parallel and the triangles being twisted 180° (25).
Physical and mechanical properties Table 5.3 and 5.4. Resulting from a strong chemical bond between the Al and 0 ions, as expected from the value of heat of formation (-400K cal/mol), Al20 3 has a high melting point, the highest hardness among known oxides, and high mechanical strength (26).
Chemical properties Alumina is chemically stable and corrosion resistant. It is insoluble in water and very slightly soluble in strong acids and alkalies. Therefore, practically no release of ions from alumina occurs at a physiological pH level, 7.4.
Wear resistance Arising from the chemical stability and high surface finish and accurate dimensions, there is a very low friction torque between the alumina femoral heads and the acetabular cup, leading to a low wear rate. Combinations of ceramic headlUHMWPE cup and ceramic head/ceramic cup were tested and compared to the metal headlUHMWPE cup. The wear resistance of the ceramic headlUHMWPE cup combination over metallUHMWPE has improved from 1.3 to 34 times in the laboratory and from three to four times clinically (27,28). No alumina wear particles from retrieved ceramiclUHMWPE were found, whereas UHMWPE wear particles from microns to millimetres in size were found in the retrieved

344 I LI ___ O_X_I_D_E_B_I_O_C_E_R_A_M_IC_S_I_N_M_E_D_I_C_IN_E_A_N_D_D_E_N_T_IS_T_R_Y __ --'
Table 5.3 Engineering Properties of Alumina and Zirconia (At 25 DC)*
Property
Physical Crystallography a (A) c (A) Space group Melting point (DC) Density (glcm3)
Grain size (fLm) Hardness (G Pa) Modulus of elasticity, (GPa) Poisson's ratio Thermal coefficient of expansion 25-200 DC Mechanical Flexural strength (MPa) Compressive Strength (MPa) Tensile strength (MPa) Fracture toughness (MPa m 112)
* Sources: refs 26, 44 and 45
Hexagonal 4.76 13.0 D6Sa
2040 3.98 1--6 22 366 0.26 6.5
551 3790 310 4.0
Tetragonal*** 3.64 5.27 P4z1nmc 2680 6.08 0.54 12.2 201 0.30 10.1
1074 7500 420 6-15
** Zirconia presented is the yttria-partially stabilized material *** Most of the medical-grade zirconia is partially stabilized tetragonal zirconia
Table 5.4 Properties of medical-grade ceramic materials according to the standards and the manufacturer's technical date - alumina and zirconia
Alumina according to
ISO-6474 Zirconia ASTM Frialit according to
F 603-83 bioceramic ISO/DIS Prozyr® Property DIN 58 8353 alumina 13356 zirconia
Purity (%) >99.5 >99.5 >99.5* >95 Density (g/cm3) >3.9 >3.98 ~6.0 6 Porosity (%) 0 ** 0 0 Grain size (fLm) <4.5 >2.5 :0;0.6 <1 Microhardness (GPa) 23 23 13 Young's modulus (GPa) 380 380 220 Flexural strength (MPa) >400 >450 >900 ~920
Biaxial flexural strength (MPa) 250 >550 Impact strength (cm MPa) >40 >40 124 Fracture toughness (MPa m1/2 ) 10 Wear resistance (mm3/h) 0.01 0.001 Corrosion resistance (mglm2d) <0.1 <0.1
* Zr02+Hf02+Y203 ** Not available.

~ ____ MA_TE_RIAL __ P_R_O_P_E_R_T_IE_S_AND __ P_R_O_C_E_S_SIN_G ____ ----11 1 345
surrounding tissues. However, from the ceramic/ceramic combination, ceramic particles resembling 'fine grains and great fragments in the ranges from 0.5 to 10 micrometers diameter, with the predominant size of about 1 micrometer' were found in the surrounding tissue (29). The advantage of ceramic/ceramic combination over ceramiclUHMWPE is, therefore, doubtful. For wear tests, we refer to ISO-6474 ASTM F-603.
Clinical performance The fracture of ceramic balls in ceramic: UHMWPE combination has been virtually zero. Fritsch and Gleitz (30) published a failure analysis on 4341 alumina ceramic heads articulating with 2693 alumina ceramic and 1464 polymer sockets implanted over 20 years (1974 to 1994), and concluded that the use of ball type neckless heads brought the fracture rate close to zero. The success rate of, to years follow-up is normally above 90% for the 'elderly' patient population. Stem and cup loosening are the causes of failure, where the consistent wear debris from UHMWPE and bone cement remain the problems.
Zirconium dioxide: zirconia
Zirconia ceramics are termed polymorphic because they undergo several transformations on cooling from a molten state to room temperature. It exhibits three well-defined polymorphs, the monoclinic, tetragonal and cubic phases and a high pressure orthorhombic form also exists. The monoclinic phase is stable up to about 1170DC where it transforms to the tetragonal phase, stable up to 2370DC, while the cubic phase exists up to the melting point 2680°C. A large volume change of 3 to 5% occurs when zirconia is cooled down and transforms from the tetragonal to the monoclinic phase.
Partially stabilized zirconia (PSZ) and tetragonal zirconia polycrystals (TZP) The volume change due to phase transformation is sufficient to exceed elastic and fracture limits and causes cracking of the zirconia ceramics. Therefore, additives such as calcia (CaO), magnesia (MgO) and/or yttria (Y 203) must be mixed with zirconia to stabilize the material in either the tetragonal or the cubic phase. PSZ is a mixture of cubic and tetragonal and lor monoclinic phases, whereas TZP is tOO% tetragonal (phase diagram Figure 5.2). Both PSZ and TZP are suggested for medical implant applications. Yttria-TZP ceramics have a strength and fracture toughness approximately twice that of alumina ceramics used in the biomedical field. This makes zirconia heads less sensitive to stress concentrations at the points of contact with metal cones.

OXIDE BIOCERAMICS IN MEDICINE AND DENTISTRY 346 I I L-______________________________________________________ ~
2500
2250
2000
1750 () 0
0)' L.
::J 1500 ... co L. 0)
0. E 0)
I- 1250
500~--~ ____ ~ ____ ~ __ ~ ____ ~ o
Zr02
5 10 15 25
CaO, mol%
Figure 5.2(a) Part of the equilibrium phase diagram for the system ZrOz-CaO. Css refers to the cubic solid-solution phase, Tss to the tetragonal solid-solution phase, and Mss to the monoclinic solid-solution phase (ref. 21).
Physical and mechanical properties Zirconia ceramics have a high density because of heavy zirconium ions, and a low microhardness and elastic modulus, together with high strength and fracture toughness compared to other ceramics including alumina. The superior mechanical strength provides the possibilities for producing ceramic ball heads of size below 32 mm.
Fracture toughness mechanisms: Garvie et al. were the first to realize the transformation toughening mechanism for zirconia ceramics. Increase of both strength and fracture
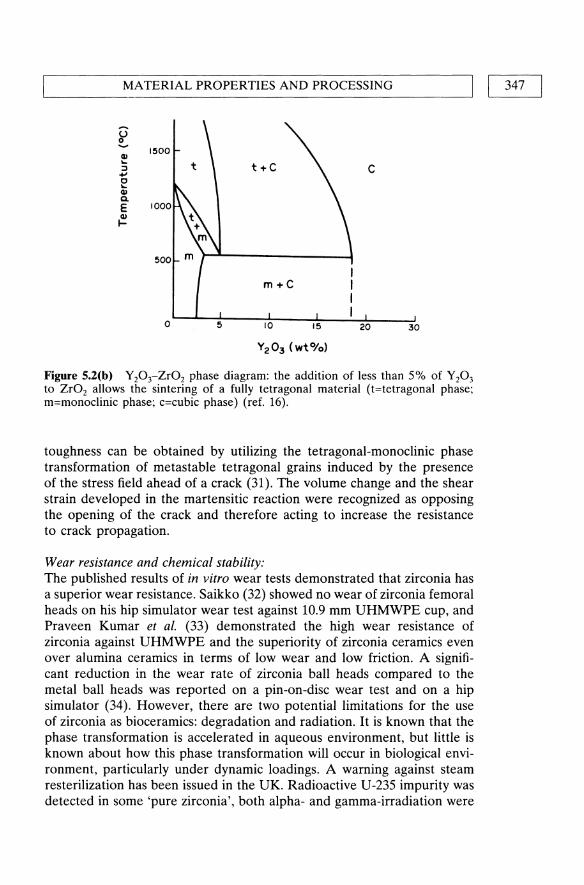
'--____ MA __ T_E_R_IA_L_P_R_O_P_E_R_T_IE_S_A_N_D_P_R_O_C_E_S_S_IN_G ____ ------JI I 347
c
O~~--~5----~IO~----~15~--~2~O----~30·
Figure 5.2(b) Y20rZr02 phase diagram: the addition of less than 5% of Y20 3
to Zr02 allows the sintering of a fully tetragonal material (t=tetragonal phase; m=monoclinic phase; c=cubic phase) (ref. 16).
toughness can be obtained by utilizing the tetragonal-monoclinic phase transformation of metastable tetragonal grains induced by the presence of the stress field ahead of a crack (31). The volume change and the shear strain developed in the martensitic reaction were recognized as opposing the opening of the crack and therefore acting to increase the resistance to crack propagation.
Wear resistance and chemical stability: The published results of in vitro wear tests demonstrated that zirconia has a superior wear resistance. Saikko (32) showed no wear of zirconia femoral heads on his hip simulator wear test against 10.9 mm UHMWPE cup, and Praveen Kumar et al. (33) demonstrated the high wear resistance of zirconia against UHMWPE and the superiority of zirconia ceramics even over alumina ceramics in terms of low wear and low friction. A significant reduction in the wear rate of zirconia ball heads compared to the metal ball heads was reported on a pin-on-disc wear test and on a hip simulator (34). However, there are two potential limitations for the use of zirconia as bioceramics: degradation and radiation. It is known that the phase transformation is accelerated in aqueous environment, but little is known about how this phase transformation will occur in biological environment, particularly under dynamic loadings. A warning against steam resterilization has been issued in the UK. Radioactive U-235 impurity was detected in some 'pure zirconia', both alpha- and gamma-irradiation were
OXIDE BIOCERAMICS IN MEDICINE AND DENTISTRY 348 I I ~----------------------------------------------------~
measured from zirconia femoral balls. Although the radioactivity was low, more work is required to verify this matter (13).
Clinical performance The surface degradation of the zirconia balls due to the phase transformation under loading seems to be a problem, although no significant change in mechanical strength was reported in some long-term in vivo and in vitro studies (35,36). Seriously, catastrophic failure of modular zirconia ceramics femoral head components after total hip arthroplasty was reported (37). Since zirconia femoral heads have a short clinical history and few clinical results are available, more investigation is required to eliminate the factors which impair the clinical stability of zirconia ceramics under loading.
5.3.2 Materials processing
An advanced ceramic is processed in such a way that the structure of the materials on different levels, including atomic, electronic, grain boundary, microstructural and macrostructural, is under strict control. In the manufacturing processes, emphasis is placed on producing dense ceramics with a fine microstructure. However, other factors such as chemical composition, the nature and distribution of the impurities, crystal structure, grain size, and defects are also of importance to the performance of the ceramic materials. Three basic processes are involved in the production of fine ceramic components, namely: 1. powder technology, 2. densification or sintering and 3. machining. Both alumina and zirconia hip balls are produced by compacting fined-grained powder (green bodies), and sintering at 1500-1700 °C and finally grinding or lapping to obtain a high surface finish and sphericity (Ra<0.02 J.Lm).
5.4 BIOCOMP ATffiILITY OF OXIDE BIOCERAMICS
No materials placed within a living tissue can be considered to be completely inert. However, oxide bioceramics, by their very nature, do not suffer from corrosion or degradation in biological environments, as metals or plastics do. Ceramics, having molecular structures completely different from those of living tissues, are generally stable inside the living body and provide a high degree of acceptance by the apposition to the surrounding tissue as shown by in vitro and in vivo studies Ichikawa et at. observed no adverse soft tissue responses to zirconia and alumina implants after 12 months of implanation (38). Takamura et al. reported that alumina and zirconia did not possess chronic toxicity to mice (39), whereas Steflik et al. found a biological seal at the alumina dental implant
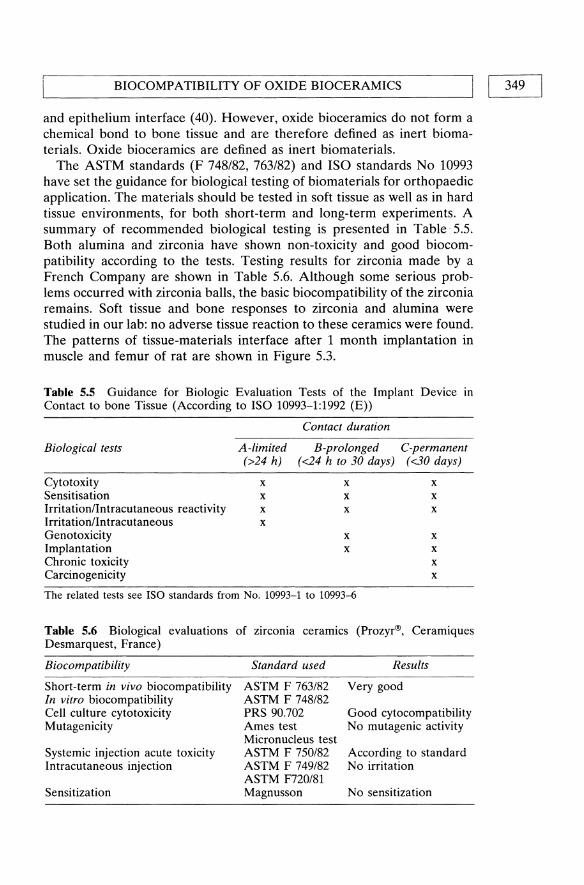
BIOCOMPATIBILITY OF OXIDE BIOCERAMICS I I 349 L-______________________________________________________ ~
and epithelium interface (40). However, oxide bioceramics do not form a chemical bond to bone tissue and are therefore defined as inert biomaterials. Oxide bioceramics are defined as inert biomaterials.
The ASTM standards (F 748/82, 763/82) and ISO standards No 10993 have set the guidance for biological testing of biomaterials for orthopaedic application. The materials should be tested in soft tissue as well as in hard tissue environments, for both short-term and long-term experiments. A summary of recommended biological testing is presented in Table· 5.5. Both alumina and zirconia have shown non-toxicity and good biocompatibility according to the tests. Testing results for zirconia made by a French Company are shown in Table 5.6. Although some serious problems occurred with zirconia balls, the basic biocompatibility of the zirconia remains. Soft tissue and bone responses to zirconia and alumina were studied in our lab: no adverse tissue reaction to these ceramics were found. The patterns of tissue-materials interface after 1 month implantation in muscle and femur of rat are shown in Figure 5.3.
Table 5.5 Guidance for Biologic Evaluation Tests of the Implant Device In
Contact to bone Tissue (According to ISO 10993-1:1992 (E»
Biological tests
Cytotoxity Sensitisation Irritation/Intracutaneous reactivity Irritation/Intracutaneous Genotoxicity Implantation Chronic toxicity Carcinogenicity
A-limited (>24 h)
x x x x
Contact duration
B-prolonged C-permanent (<24 h to 30 days) (<30 days)
x x x x x x
x x x x
x x
The related tests see ISO standards from No. 10993-1 to 10993..{j
Table 5.6 Biological evaluations of zirconia ceramics (Prozyr®, Ceramiques Desmarquest, France)
Biocompatibility
Short-term in vivo biocompatibility In vitro biocompatibility Cell culture cytotoxicity Mutagenicity
Systemic injection acute toxicity Intracutaneous injection
Sensitization
Standard used
ASTM F 763/82 ASTM F 748/82 PRS 90.702 Ames test Micronucleus test ASTM F 750/82 ASTM F 749/82 ASTM F720/81 Magnusson
Results
Very good
Good cytocompatibility No mutagenic activity
According to standard No irritation
No sensitization

350 I IL-__ O_XI_D_E_B_I_O_C_E_RA_M_ IC_S_IN_ME _ _ D_IC_I_NE _ _ AN_D_D_E_N_Tl_S_T_R_y __ ---'
(a)
Figure 5.3(a) Optical micrograph of alumina and soft tissue interface.
(b)
Figure 5.3(b) Zirconia and bone interface 1 month after implantation. Arrows are pointing to the interfaces.

APPLICATIONS I Table 5.7 Ceramic manufacturers known for their bioceramic productions
Primary Secondary Trade Names Manufacturer Country Materials Materials AlP3 (Zr02)
Astroment USA Zr02 AI20 3 Ceraver France AI20 3 Zr02
Cerasiv Germany AlP3 Zr02 Biolox Desmarquest France Zr02 (Proyzr) HiTech France Zr02 AIP3 Kyocera Japan AI20 3 Zr02 Bioceram Metoxit Switzerland Zr02 Morgan Matroc England Zr02 AIP3 NGK Japan Zr02 Biocare Sweden AlP3 Procera Unitek USA AI20 3 Transcend 2000 Maillefer Switzerland Zr02
5.5 APPLICATIONS
5.5.1 Orthopaedic appUcations
The dominating application of alumina and zirconia is as hip balls as well as cups of total femoral prosthesis. The neckless hip balls are the most popular design. In 1981, Oonishi et al. (8) reported on the use of an alumina ceramic total knee prosthesis. High alumina ceramic middle ear implants (Frialit) are used clinically in Europe since 1979 (21). An opthalmological implant device consisting of a combination of a single crystal alumina optional cylinder and a polycrystalline alumina holding ring was introduced clinically in 1977 (22). Kawahara (12) has reported extensively on single crystal alumina bone screws.
5.5.2 Dental applications
Alumina and zirconia ceramics have been utilized for root analogue, endosteal screws, blades and pin-type dental implants. The root and blade form dental implants used during the 1970s tended to fracture after a few years in function (41,42) (Brose et al., 1987, Driskell, 1987). Although initial testing of these polycrystalline alumina materials showed adequate mechanical strength, the long-term clinical results demonstrated functional limitations related to material properties and implant design. However, single crystalline alumina showed mechanical strength superior to that of polycrystalline alumina. It allows a much higher load. One-stage dental implants of single crystalline alumina are used clinically with a high success rate. McKinnery (43) had also reported on single crystal alumina blade
I 351

352 II L.. ___ O_X_I_D_E_B_I_O_C_E_R_A_M_IC_S_IN_ME_D_I_C_INE __ AN_D_D_E_N_T_IS_T_R_Y __ ~
and screw dental implants. Dental implants of zirconia have not been widely used clinically although zirconia has a similar mechanical strength and a much higher fracture toughness in addition to lower cost of production compared to single crystalline alumina. The term dental implant is used only for materials in contact with bone and soft tissue (14). Alumina and zirconia are also used in other dental applications, alumina ceramic crowns, Procera®(23), zirconia dental post, (10) and recently a dental inlay of zirconia was introduced (11). Orthodontic brackets made of oxide ceramics were also produced, tested and used clinically. Unfortunately, tooth surface damage was observed when the brackets were taken away (15). Modification of the debonding technique is under developing.
5.6 MANUFACTURERS AND THEIR IMPLANT PRODUCTS
Clarke and Willmann (13) make a comprehensive summary about the bioceramic manufacturers (Table 5.6). Some dental companies are included.
5.7 PROBLEMS AND FUTURE PROSPECTS
Hip balls of polycrystalline alumina have a minimum size limitation to ca. 28 mm due to strength limitations. A reduced ball size might have two positive effects on the applications: reduced wear and better suitability (smaller) for Asian patients. Although single crystalline alumina might overcome the strength limitation, the cost of manufacturing is unreasonably high and in addition, some processing problems remain. Zirconia, on the other hand, has a high strength and high fracture toughness, but it suffers from potential biodegradation. Therefore, the future research and development will focus on the understanding of degradation mechanisms of zirconia in the body and the improvement of stability of this material. Of course, combinations, such as alumina/zirconia composite and even non-oxide ceramic, such as nitrides and carbides, ought also to be investigated.
REFERENCES
1. Hulbert, S.F., Bokros, J.e., Hench, L.L., Wilson, J. and Heimke, G. In Ceramics in Clinical Applications, ed. by Vincenzini, P. Elsevier, Amsterdam, 1987, pp. 3-27.
2. Rock, M. German Patent 583589, 1933. 3. Smith, L. Arch. Surg. 1963; 87: 653-661. 4. Sandhaus, S. British Patent 1083769, 1967.

L-________________ R_E_F_E_RE_N_C_E_S ________________ ~I I 353 J 5. Boutin, P. Presse Med. 1971; 79: 639. 6. Mittelmeier, H. Z. Orthop. Ihre Grenzgeb 1974; lU: 27. 7. Shikita, T. Paper presented at the XIV World Congress of SICOT, Kyoto,
Japan, October 15-20, 1978. 8. Oonishi, H., Okabe, N., Hamaguchi, T. and Nabeshima, T. Orthopaedic
Ceramic Implants I, 1981; 11-18. 9. Lord, G. et al. Paper presented at the Harrington Arthritis Research Centre
Symposium, November 18-21, 1990. 10. Akagawa, Y. et al. 1. Prosthet. Dent. 1993; 69: 599~04. 11. Meyenberg, K.H., Luthy, H. and Scharer, P. 1. Esthet. Dent., 1995; 7(2): 73-80. 12. Johansson, B. Tandliikartidningen 1996; 14746-749. 13. Clarke, I.C and Willmann, G. In Bone implant Interface ed. H.V. Cameron,
Hugh U., Mosby, 1994, pp. 222. 14. Kawahara, H. In Encyclopedic handbook of biomaterials and bioengineering
ed. by Wise, Donald L. et al. Marcel Dekker, Inc., New York, 1995, pp. 1469-1524.
15. Sinha, P.K., Rohrer, M.D., Nanda, R.S. and Brickman, CD. American 1. Orthodont & Dentofacial Orthop, 1995; 108: 455-63.
16. Christel, P.S. In Condse Encyclopedia of Medical & Dental Materials, ed. by Williams, D.F., Pergamon Press, Oxford, 1990, pp. 375-379.
17. Keith, 0., Kusy, RP. and Whitley, J.O. American 1. Orthodont. & Dentofacial Orthop., 1994; 106(6): 605~14.
18. Kawahara, H. Orthopaedic Ceramic Implants 1,1981; 1-10. 19. Fartash, B. Single Crystal Sapphire Dental Implants: Experimental and Clinical
Studies. PhD thesis, Karolinska Institute, Sweden, 1996. 20. Hammer, N.B., Topazian, RG., McKinney, P.V. and Hulbert, S.F. 1. Dent.
Res. 1973; 52: 356-361. 21. Jahnke, K. Biomaterials in Otology, Martinus Nijhoff, The Hague, 1984:
205-209. 22. Polack, F.M. and Heimke, G. Ophthalmology, 1980; 87(7): 693~98. 23. Andersson, M. and Oden, A. Acta Odont. Scand., 1993; 51: 59~4. 24. Kittipibul, P. and Godfrey, K. American 1. Orthodont & Dentofadal
Orthopedics, 1995; 108(3): 308--315. 25. Heimke, G. In Metal and Ceramic Biomaterials Vol I Structure, ed. by
Ducheyne, P. and Hastings, G.W. CRC Press Inc., Boca Raton. Florida, 1984, pp. 41-42.
26. Miyayama. M. et al. In Ceramics and Glass, Engineered Materials Handbook Volume 4, ASM International, 1991, pp. 748-757.
27. Griss, P. In Functional Behavior of Orthopaedic Biomaterials 11, Ch 2, 1984. 28. Jager M. and Piitz, W. Triobology of aluminium ceramics, Symposium of
Biomaterials, pp. 114-122, 1981. 29. Willert, H.G. et af. In Implant Retrieval: Material and Biological Analysis, ed.
by Weinstein. A., Gibbons, D., Brown, S. and Ruff, W. 1981. 30. Fritsch, E.W. and Gleitz, M. Clin. Orthop. & Related Res., 1996; 328: 129-136. 31. Garvie, R.C, Hannink, R.H. and Pascoe, R.T. Nature, 1975; 258: 703. 32. Saikka, V.O. Acta Orthop. Scand., 1995; 66(6): 501-506. 33. Kumar, P. et al. J. Biomed. Mater. Res., 1991; 25: 813-828. 34. Derbyshire, B. et af. Medical Eng. & Phys., 1994; 16(39): 229-36.

354 I LI ___ O_X_ID_E_B_IO_C_E_R_A_M_I_C_S_I_N_M_E_D_I_C_IN_E_A_N_D_D_E_N_T_I_ST_R_Y __ -----.J
35. Shimizu, K. et al. J. Biomed. Mater. Res., 1993; 27: 729-734. 36. Cales, B., Stefani, Y. and Lilley, E. 1. Biomed. Mater. Res., 1994; 28: 619--624. 37. Hummer, CD., Rothman, R.H. and Hozack, W.J. 1. Arthroplasty, 1995; 10(6):
848-850. 38. Ichikawa, Y. et al. 1. Prosthet. Dent. 1992; 68: 322--6. 39. Takamura, K. et al. 1. Biomed. Mater. Res., 1994; 28: 583-589. 40. Steflik, D., McKinney Jr R.V. and Koth, D. In Bioceramics: Materials char
acteristics versus in vivo behavior, ed. by Ducheyne, P. and Lemons, J.E. Ann. N. y. Acad. Sci. 523, pp. 4-18.
41. Brose, M. et al. 1. Dent. Res., 1987; 66: 113. 42. Driskel, T.D. 1. Calif Dent. Assoc., 1987; 16-25. 43. Mckinney, R.V. and Koth, D.L. 1. Prosthet. Dent., 1982: 47: 69-84. 44. Park, J.B. and Lakes, R.S. Biomaterials: an Introduction, 2nd edition, Plenum
Press, New York, 1992. 45. Bajpai, P.K. and Billotte, W.G. In The Biomedical Engineering Handbook, ed.
by Bronzino, J.D. CRC Press, 1995, pp. 552-580.

Properties of bioactive glasses and glass-ceramics
L.L. Hench and T. Kokubo
Definition of bioactivity:
A bioactive material is one that elicits a specific biological response at the interface of the material which results in the formation of a bond between the tissues and the material. A common characteristic of bioactive glasses, bioactive glass-ceramics, and bioactive ceramics is that their surface develops a biologically active hydroxy carbonate apatite (HCA) layer which bonds with collagen fibrils. The HCA phase that forms on bioactive implants is equivalent chemically and structurally to the mineral phase of bone. It is that equivalence which is responsible for interfacial bondingl- 3•
6.1 BIOACTIVE BONDING
Bioactive materials develop an adherent interface with tissues that resist substantial mechanical forces. In many cases the interfacial strength of adhesion is equivalent to or greater than the cohesive strength of bone. The interfacial strength of a bioactive implant bonded to bone is 15-40 times greater than the interfacial adherence of non-bioactive materials (such as A120 3) (Table 6.1 and Figure 6.1), tested in the same animal model (rabbit tibia) (Figure 6.2)4.
Handbook of Biomaterial Properties. Edited by J. Black and G. Hastings. Published in 1998 by Chapman & Hall, London. ISBN 0 412 60330 6.
6

356 I I PROPERTIES OF BIOACfIVE GLASSES AND GLASS-CERAMICS
Pull-off Test Model
30 Cerabone® Bioactive Implant
(Failure in Bone)
20 Bioglass® Bioactive Implant I'll C. (Failure in Implant) ~
10
Alumina Non-Bioactive 11
0 (Failure at Inter
8 16 24 32 Time (Weeks)
Figure 6.1 Comparison of interfacial bond strengths of bioactive implants with non-bonding implants (alumina) using 'pull off' detaching test [4,5].
b a
Figure 6.2 Schematic of 'pull off' detaching test for determining bone-implant bonding (based upon T. Yamamuro, ref. 4).
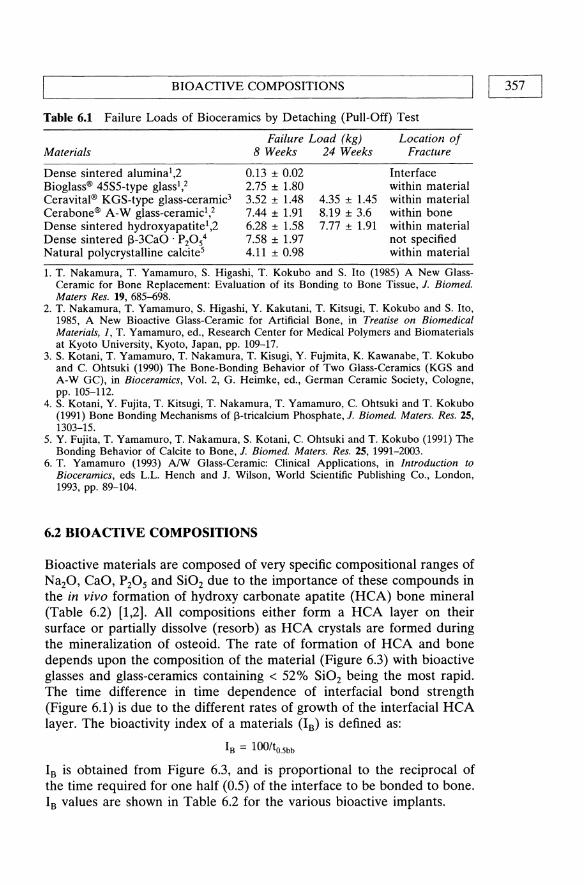
L-_____________ B_I_O_A_C_T_I_V_E_C_O_M __ P_O_SI_T_IO __ N_S ____________ ~I I 357
Table 6.1 Failure Loads of Bioceramics by Detaching (Pull-Off) Test
Failure Load (kg) Location of Materials 8 Weeks 24 Weeks Fracture
Dense sintered alumina l ,2 Bioglass® 45S5-type glass l ,2 Ceravital® KGS-type glass-ceramic3
Cerabone® A-W glass-ceramicl ,2
Dense sintered hydroxyapatite l ,2 Dense sintered f3-3CaO . P20 54
Natural polycrystalline calcite5
0.13 ± 0.02 2.75 ± 1.80 3.52 ± 1.48 7.44 ± 1.91 6.28 ± 1.58 7.58 ± 1.97 4.11 ± 0.98
4.35 ± 1.45 8.19 ± 3.6 7.77 ± 1.91
Interface within material within material within bone within material not specified within material
1. T. Nakamura, T. Yamamuro, S. Higashi, T. Kokubo and S. Ito (1985) A New GlassCeramic for Bone Replacement: Evaluation of its Bonding to Bone Tissue, J. Biomed. Maters Res. 19, 685-698.
2. T. Nakamura, T. Yamamuro, S. Higashi, Y. Kakutani, T. Kitsugi, T. Kokubo and S. Ito, 1985, A New Bioactive Glass-Ceramic for Artificial Bone, in Treatise on Biomedical Materials, J, T. Yamamuro, ed., Research Center for Medical Polymers and Biomaterials at Kyoto University, Kyoto, Japan, pp. 109-17.
3. S. Kotani, T. Yamamuro, T. Nakamura, T. Kisugi, Y. Fujmita, K. Kawanabe, T. Kokubo and C. Ohtsuki (1990) The Bone-Bonding Behavior of Two Glass-Ceramics (KGS and A-W GC), in Bioceramics, Vol. 2, G. Heimke, ed., German Ceramic Society, Cologne, pp. 105-112.
4. S. Kotani, Y. Fujita, T. Kitsugi, T. Nakamura, T. Yamamuro, C. Ohtsuki and T. Kokubo (1991) Bone Bonding Mechanisms of l3-tricalcium Phosphate, J. Biomed. Maters. Res. 25, 1303-15.
5. Y. Fujita, T. Yamamuro, T. Nakamura, S. Kotani, C. Ohtsuki and T. Kokubo (1991) The Bonding Behavior of Calcite to Bone, J. Biomed. Maters. Res. 25, 1991-2003.
6. T. Yamamuro (1993) A!W Glass-Ceramic: Clinical Applications, in Introduction to Bioceramics, eds L.L. Hench and J. Wilson, World Scientific Publishing Co., London, 1993, pp. 89-104.
6.2 BIOACTIVE COMPOSITIONS
Bioactive materials are composed of very specific compositional ranges of Na20, CaO, P20S and Si02 due to the importance of these compounds in the in vivo formation of hydroxy carbonate apatite (RCA) bone mineral (Table 6.2) [1,2]. All compositions either form a RCA layer on their surface or partially dissolve (resorb) as RCA crystals are formed during the mineralization of osteoid. The rate of formation of RCA and bone depends upon the composition of the material (Figure 6.3) with bioactive glasses and glass-ceramics containing < 52% Si02 being the most rapid. The time difference in time dependence of interfacial bond strength (Figure 6.1) is due to the different rates of growth of the interfacial RCA layer. The bioactivity index of a materials (IB) is defined as:
I B = 100/to.5bb
IB is obtained from Figure 6.3, and is proportional to the reciprocal of the time required for one half (0.5) of the interface to be bonded to bone. IB values are shown in Table 6.2 for the various bioactive implants.
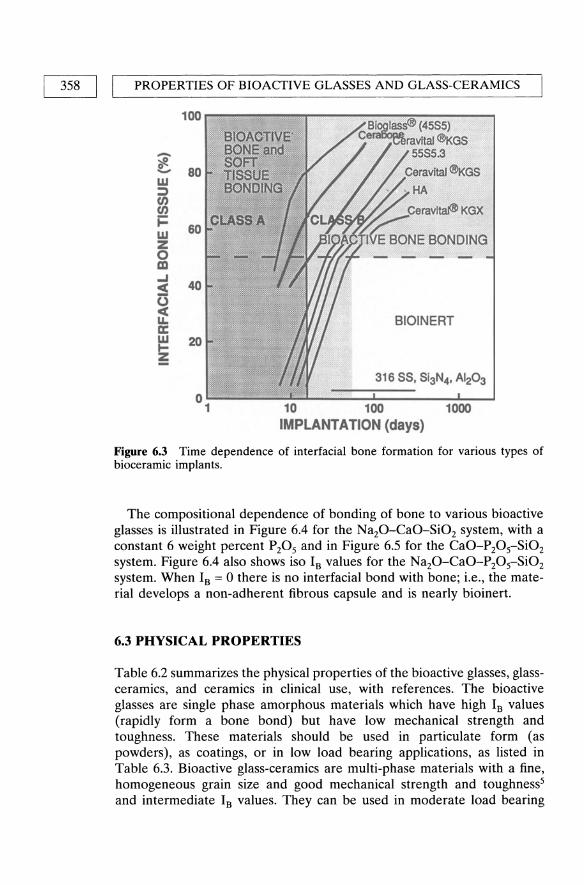
358 I I PROPERTIES OF BIOACTIVE GLASSES AND GLASS-CERAMICS
100
BIOAdTIVE: - BONE and ~ SOFT 0
80 - TiSSUE w BONDING ;::) U) U)
i= 60 w Z 0 ....... m ...J
40 c( <:) c(
BIOINERT PoL. a: w 20 t-Z -
316 SS, Si3N4• AI20 3
0 1 10 100 1000
IMPLANTATION (days)
Figure 6.3 Time dependence of interfacial bone formation for various types of bioceramic implants.
The compositional dependence of bonding of bone to various bioactive glasses is illustrated in Figure 6.4 for the Na20-CaO-Si02 system, with a constant 6 weight percent P205 and in Figure 6.5 for the CaO-P20 5-Si02 system. Figure 6.4 also shows iso IB values for the Na20-CaO-P20 5-Si02 system. When Is = 0 there is no interfacial bond with bone; i.e., the material develops a non-adherent fibrous capsule and is nearly bioinert.
6.3 PHYSICAL PROPERTIES
Table 6.2 summarizes the physical properties of the bioactive glasses, glassceramics, and ceramics in clinical use, with references. The bioactive glasses are single phase amorphous materials which have high Is values (rapidly form a bone bond) but have low mechanical strength and toughness. These materials should be used in particulate form (as powders), as coatings, or in low load bearing applications, as listed in Table 6.3. Bioactive glass-ceramics are multi-phase materials with a fine, homogeneous grain size and good mechanical strength and toughness5 and intermediate Is values. They can be used in moderate load bearing

Tab
le 6
.2
Com
posi
tion
and
Mec
hani
cal
Pro
pert
ies
of
Bio
acti
ve C
eram
ics
Use
d C
lini
call
y
Sint
ered
7 .8
.9
hydr
oxyp
atit
e Si
nter
edlO
.ll
Bio
glas
s®1
Gla
ss-c
eram
ic3
Gla
ss-c
eram
ic'
Gla
ss-c
eram
ic5
Gla
ss-c
eram
ic"
Ca
lO(P
O,M
OH
h f
3-3C
aO'
P20
5 C
ompo
siti
on
4555
S5
3P42
C
erav
itaf®
C
erab
one®
A-W
Il
map
lant
® L
l B
iove
rit®
>
99.
2%
> 9
9.7%
Na 2
0 24
.5 w
t%
22.6
wt%
5-
10 w
t%
o w
t%
4.6
wt%
3
-8 w
t%
K20
0
0.5-
3.0
0 0.
2 3
-8 w
t%
MgO
0
2.5-
5.0
4.6
2.8
2-21
C
aO
24.5
21
.8
30-3
5 44
.7
31.9
10
-34
Al 2
03
0 0
0 0
8-15
S
i02
45.0
53
.9
40-5
0 34
.0
44.3
19
-54
P20
S 6.
0 1.
7 10
-50
16.2
11
.2
2-10
C
aF2
0 0.
5 5.
0 F
3-23
B
2O,
0 P
hase
G
lass
G
lass
A
pati
te
Apa
tite
A
pati
te
Apa
tite
A
pati
te
Whi
tloc
kite
(C
a IO(P
04)
6
(Ca
IO(P
04)
6 (~-3CaO .
(0
,F2»
(O
H)z
) Pz
Os)
G
lass
~-
Wol
last
onit
e ~-
Wol
last
onit
e P
hlog
opit
e (C
aO·
Si0
2)
«N
aIK
)Mg
, (A
ISiO
IO)F
2)
Gla
ss
Gla
ss
Gla
ss
Den
sity
(g/
cm')
2.
6572
3.
07
2.8
3.16
3.
07
Har
dnes
s 45
8 ±
9.4
68
0 50
0 60
0 (V
icke
rs)
(HV
) C
ompr
essi
ve
500
1080
50
0 50
0-10
00
460-
687
stre
ngth
(M
Pa)
B
endi
ng
42(T
ensi
le)
215
160
100-
160
115-
200
140-
154
stre
ngth
(M
Pa)
Y
oung
mod
ulus
35
10
0--1
50
118
70-8
8 80
-110
33
-90
(GP
a)

Tab
le 6
.2
Con
tinu
ed
Bio
glas
s®l
Com
posi
tion
45
S5
Fra
ctur
e to
ughn
ess,
K
,c(M
Pa m
112)
Sl
ow c
rack
gro
wth
, n
Inde
x o
f bi
oact
ivit
y 12
.5
I 12
B
Gla
ss-c
eram
ic!
S53P
42
Cer
avita
[®
3.8
5.6
Gla
ss-c
eram
ic4
Gla
ss-c
eram
ic!
Cer
abon
e® A
-W
llmap
lant
® L
1
2.0
2.5
33
7.5
(est
)
Sint
ered
7 ,8,
9
hydr
oxyp
atit
e Si
nter
edlO
,ll
Gla
ss-c
eram
ic"
Ca l
O(P
04M
OH
)2 ~-3CaO' P
P5
B
iove
rit®
>
99.
2%
> 9
9.7%
0.5-
1.0
1.0
12-2
7 3.
1
1.
L.L
. H
ench
and
E.C
. E
thri
dge,
Bio
mat
eria
ls,
An
Inte
rfac
ial
App
roac
h, p
. 13
7, A
cade
mic
Pre
ss,
New
Yor
k, 1
982.
2.
D
.H.
And
erss
on,
K.H
. K
arls
son,
K.
Kan
gasn
iem
i, an
d A
. Y
li-U
rpo,
Mod
els
for
Phys
ical
Pro
pert
ies
and
Bio
acti
vity
of
Pho
spha
te O
pal
Gla
sses
, G
last
ech.
Ber
., 61
, 30
0-30
5 (1
988)
. 3.
H
. B
rom
er,
K.
Deu
tsch
er,
B.
Ble
nke,
E.
Pfei
l an
d V
. S
trun
z, P
rope
rtie
s of
the
Bio
acti
ve I
mpl
ant
Mat
eria
l C
erav
ital®
, in
Sci
ence
of
Cer
amic
s,
Vol
. 9,
197
7, p
p. 2
19-2
23.
4.
T.
Kok
ubo,
Mec
hani
cal
Pro
pert
ies
of a
New
Typ
e of
Gla
ss-C
eram
ic f
or P
rost
heti
c A
ppli
cati
ons,
in
Mul
tiph
ase
Bio
med
ical
Mat
eria
ls,
T.
Tsu
ruta
an
d A
. N
akaj
ima,
eds
, V
SP,
Utr
echt
, N
ethe
rlan
ds,
1989
. 5.
G
. B
erge
r,
F.
Sau
er,
G.
Ste
inbo
rn,
F.G
. W
ishs
man
n,
V.
Thi
eme,
St
K
ohle
r an
d H
. D
ress
el,
Clin
ical
A
ppli
cati
on
of S
urfa
ce
Rea
ctiv
e A
pati
telW
olla
ston
ite
Con
tain
ing
Gla
ss-C
eram
ics,
in
Pro
ceed
ings
of
XV
Int
erna
tion
al C
ongr
ess
on G
lass
, V
ol.
3a,
O.V
. M
azur
in,
eds,
Nau
ka,
Len
ingr
ad,
1989
, pp
. 12
0-12
6.
6.
W.
Vog
el a
nd W
. H
olla
nd,
The
Dev
elop
men
t of
Bio
glas
s® C
eram
ics
for
Med
ical
App
lica
tion
s, A
ng
ew C
hern
. In
t. E
d.
Eng
l. 26
,527
-544
(19
87).
7.
M.
Jarc
ho,
C.H
. B
olen
, M
.B.
Tho
mas
, J.
B
obic
k, J
.F.
Kay
an
d R
H.
Dor
emus
, H
ydro
xyap
atit
e Sy
nthe
sis
and
Cha
ract
eriz
atio
n in
D
ense
Po
lycr
ysta
lline
For
m,
1.
Mat
er.
Sci.
11,
2027
-203
5 (1
976)
. 8.
M
. A
kao,
H.
Aok
i, an
d K
. K
ato,
Mec
hani
cal
Pro
pert
ies
of S
inte
red
Hyd
roxy
apat
ite
for
Pro
sthe
tic
App
lica
tion
s, 1
. M
ater
. Sc
i. 16
,809
-812
(19
81).
9.
G,
Dew
ith,
H
.J.A
. V
an
Dijk
, N
. H
attu
an
d K
. Pr
ijs,
Pre
para
tion
, M
icro
stru
ctur
e an
d M
echa
nica
l P
rope
rtie
s of
D
ense
Po
lyer
ysta
lline
H
ydro
xyap
atit
e,l.
Mat
er.
Sci.
16,
1592
-159
8 (1
981)
. 10
. M.
Jarc
ho,
RL
. Sa
lsbu
ry,
M.B
. T
hom
as a
nd R
H.
Dor
emus
, Sy
nthe
sis
and
Fab
rica
tion
of
f3-tr
ical
cium
P
hosp
hate
(W
hitl
ocki
te)
Cer
amic
s fo
r P
oten
tial
Pro
sthe
tic
App
lica
tion
s, 1
. M
ater
. Sc
i. 14
, 14
2-15
0 (1
979)
. 11
. M.
Aka
o, M
. A
oki,
K.
Kat
o an
d A
. S
ato,
Den
se P
olyc
ryst
allin
e f3
-tric
alci
um P
hosp
hate
for
Pro
sthe
tic
App
lica
tion
s, 1
. M
ater
. Sc
i. 17
, 34
3-34
6 (1
932)
. 12
. L.L
. H
ench
, B
ioac
tive
Cer
amic
s, i
n B
ioce
ram
ics:
Mat
eria
ls C
hara
cter
isti
cs V
ersu
s In
V
ivo
Beh
avio
r, P
. D
uche
yne,
J.E
. L
emon
s, e
ds,
An
nu
als
of
the
NY
Aca
dem
y o
f Sc
ienc
es,
u523
, 19
88,
pp.
54-7
1
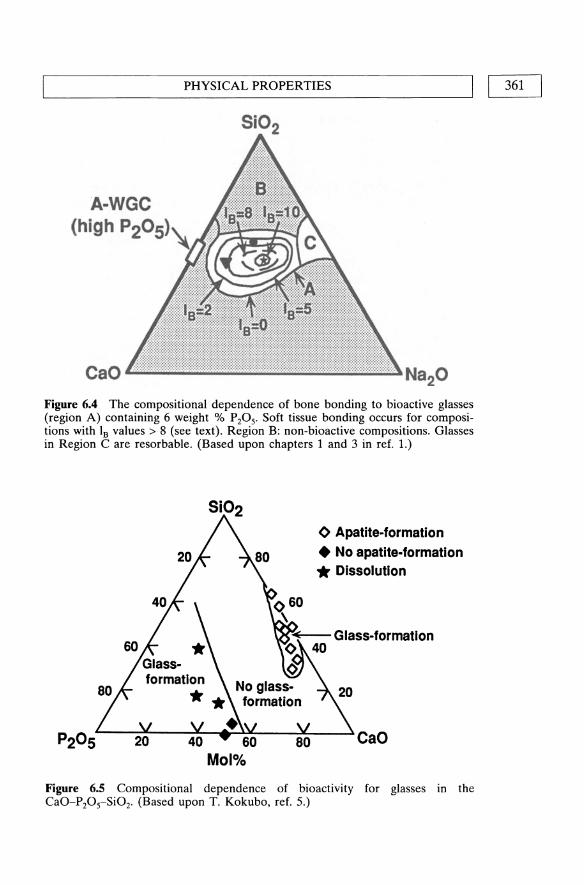
PHYSICAL PROPERTIES I I 361 L-____________________________________________________ ~
A-WGC (high P20S)
Figure 6.4 The compositional dependence of bone bonding to bioactive glasses (region A) containing 6 weight % P20 S' Soft tissue bonding occurs for compositions with Is values > 8 (see text). Region B: non-bioactive compositions. Glasses in Region Care resorbable. (Based upon chapters 1 and 3 in ref. 1.)
<> Apatite-formation • No apatite-formation .. Dissolution
CaO
Figure 6.5 Compositional dependence of bioactivity for glasses in the CaO-P20 s-Si02. (Based upon T. Kokubo, ref. 5.)

362 I I PROPERTIES OF BlOACfIVE GLASSES AND GLASS-CERAMICS
Table 6.3 Clinical Uses of Bioactive Glasses and Glass-Ceramics
Material Form Application Function
4SSS Bioglass® Bulk Endosseous alveolar Space filling and tissue ridge maintenance bonding
Bulk Middle ear prostheses Restore conductive hearing by replacing part of ossicular chain
Powder Repair of periodontal Restore bone lost by defects periodontal disease and
prevent epithelial down growth
Powder Fixation of revision Restore bone loss due to arthroplasty loosening of hip
prostheses Cerabone® Bulk Vertebral prostheses Replace vertebrae removed (AIW glass- in tumor surgery ceramic)
SS3P4
Iliac crest prostheses Replace bone removed for autogenous graft
Coating Fixation of hip prostheses Provide bioactive bonding of implant
Bulk Orbital floor prostheses Repair damaged bone supporting eye
Powder Cranial repair Repair bone lost due to trauma
INTERFACIAL THICKNESS (Jlm)
Initial Material Interface Bone
1000 100 10 1 0 1 10 100 1000 ! ! ! ! ! ! ! ! !
i 1000
~5S~~~~®~ _________________ __ ~~~mw __ ~ ________________ _ ~~~~~~u ________________ __
Ceravital® t---II,----------------------~w Gla!!l:2e.r.amiE.. ____________ __
~Mac~~bleGlass-Ce~mlc~-------
~en~H~------------t---------------
Dense AI2031 ~~r2!J.1t - - - - - - - - - __ ~~~H~-------3Is~~---------
or AI203
i 100
i 10
i 1
i o
i 1
i 10
i 100
i 1000
Figure 6.6 Thickness of interfacial bonding layers for various bioceramics.

L-___________________ RE __ FE_R __ EN __ C_E_S __________________ ~I I 363
applications as bulk materials (Table 6.3). Polycrystalline bioactive ceramics, such as synthetic hydroxyapatite (HA), have moderate strengths and relatively low Is values and should be used as particulate or in nonload bearing applications. Compositions with the highest IB values develop interfacial bonding layers (Figure 6.6) composed of both hydrated silica gel layers and Ca, P-rich layers. Compositions with low to moderate Is values form thinner bonding zones composed primarily of Ca-P-rich compounds. Non-bonding implants have a non adherent fibrous tissue layer at the implant interface.
REFERENCES
1. Hench, L.L. and Wilson, J. (eds) (1993) Introduction to Bioceramics, World Scientific Publishers, Lonqon and Singapore, pp. 1-24.
2. Gross, U., Kinne, R., Schmitz, H.J. and Strunz, V. (1988) The response of bone to surface active glass/glass-ceramics. CRC Critical Reviews in Biocompatibility, 4, 2.
3. Yamamuro, T., Hench, L.L. and Wilson, J. (eds) (1990) Handbook of Bioactive Ceramics, Vol 1: Bioactive Glasses and Glass-Ceramics, CRC Press, Boca Raton, FL.
4. Yamamuro, T. (1993) AIW glass-ceramic: clinical applications, in Introduction to Bioceramics (eds L.L. Hench and J. Wilson), World Scientific Publishers, London and Singapore, pp. 89-104.
5. Kokubo, T. (1993) AIW glass-ceramic: processing and properties, in Introduction to Bioceramics (eds L.L. Hench and J. Wilson), World Scientific Publishers, London and Singapore, pp. 75-88.
01L...-.. ____ w_e_ar ___ ---' M. LaBerge
7.1 INTRODUCTION
Biomaterials used in the fabrication of implants are subjected to wear. Wear of biomaterials and devices has been shown to be detrimental to their long term success resulting in implant retrieval and revision. One of the most dramatic impacts of the wear of biomaterials and its consequences is observed with artificial joints. As stated by Jacobs et ai., (1994) wear has emerged as a central problem limiting the long-term longevity of total joint replacements. Ultra-high-molecular-weight polyethylene (UHMWPE) wear debris has been shown by many authors to trigger an osteolytic reaction which leads to implant loosening (Mittlmeier and Walter, 1987). Wear is a process resulting in the progressive loss of material involving many diverse mechanisms and phenomena which are often unpredictable (Table 7.1). The wear process of materials is predominantly governed by their mechanical and/or chemical behavior. More often than not, the wear processes listed in Table 7.1 do not act independently. However, even though several wear mechanisms are involved, it is often the case that one particular mechanism dominates (Dowson, 1981).
Unfortunately surface wear of an implant results from its use, and therefore, cannot be avoided or eliminated. Because wear is a limiting factor in the successful outcome and lifetime of an implant, it is of the utmost importance to characterize the wear resistance of materials used in implant design, and the effect of the design on wear. The volume of material removed from surfaces in specific tribosystems as a result of wear processes has been described phenomenologically and estimated by different models (Table 7.2). Several experimental wear studies have been
Handbook of Biomaterial Properties. Edited by J. Black and G. Hastings. Published in 1998 by Chapman & Hall, London. ISBN 0 412 60330 6.

~ ________________ INT __ R_O_D_U_CT __ IO_N ________________ ~I I 365
Table 7.1 Wear Mechanisms
Wear Mechanisms Definition
Adhesive Wear Characterized by the transfer of material from one surface to another surface during relative motion. This type of wear is a consequence of adhesive forces acting at the junction of surface asperities. The transferred fragments may either be permanently or only temporarily attached to the other surface. Adhesive wear has been denoted as being the most commonly detected mechanism of wear, unfortunately it is also the least preventable (Dowson, 1981).
Abrasive Wear Results from a hard asperity damaging or ploughing the surface of a softer material. The presence of hard particles may be due to the original material properties of one of the surfaces or loose debris particles which have become entrapped between the two sliding surfaces and/or embedded into one of the surfaces expediting abrasive wear. Generally, the resistance to abrasion can be related to the hardness of the material, however, this relationship is not directly proportional (Suh, 1986).
Delamination Wear Involves material removal subsequently to plastic deformation, crack nucleation, and propagation in the subsurface (Jahanmir and Suh, 1977; Suh, 1986)
Fatigue Wear Associated with cyclic stress variations and therefore, the lifetime of the material is dependent on the number of cycles. Cyclic deformation of the contacting surfaces leads to the initiation and propagation of microcracks (Rowe, 1980). Subsurface crack initiation generally occurs in the region of maximum shear stress which will depend upon the geometry of the materials
Fretting Wear Generated by a relative oscillatory tangential movement of small amplitudes (damage can be caused by movement with amplitudes as small as 0.125 J.Lm) which may occur between two surfaces in contact subjected to vibration (Waterhouse, 1992).
Corrosive Wear Observed when the environment interacts chemically or electrochemically with one or both of the surfaces. Therefore, the wear rate is dependent on the environmental conditions affecting the chemical reactivity of the surfaces. This type of wear mechanism is important for biomaterials since they function in an extremely harsh environment, the human body (Black, 1988).
conducted to (1) predict the amount of material removed in specific conditions, (2) compare the effect of different fabrication and sterilization processes on materials, (3) produce wear debris to be used in biocompatibility studies, and (4) characterize the behavior of a new material destined for biomedical applications. Overall wear tests are primarily conducted to ascertain the basic mechanisms of wear for a particular

Tab
le 7
.2
Sel
ecte
d W
ear
Mod
els
Wea
r P
roce
ss
Adh
esiv
e W
ear#
(A
rcha
rd,
1980
)
(Hor
nbog
en,
1975
)
Mod
el
Arc
hard
Equ
atio
n:
V
FN
Wad
= L
=
K"H
Wad
= w
ear
rate
(w
orn
volu
me
per
unit
sli
ding
di
stan
ce)
K =
wea
r co
effi
cien
t V
= v
olum
e o
f w
ear
L =
sli
ding
dis
tanc
e FN
= n
orm
al l
oad
H =
hard
ness
of
the
soft
er m
ater
ial
Hom
bog
en e
quat
ion:
W
= N
2 P
y E
' FN
1.5
ad
K
2 H
1.5
IC
Wad
= w
ear
rate
K
IC =
fra
ctur
e to
ughn
ess
P =
yie
ld s
tren
gth
N =
wor
k ha
rden
ing
fact
or
E'
= e
quiv
alen
t el
asti
c m
odul
us
E'
= 1
/[(1
-v\
2)/E
\ +
(1
-v/
)1E
21
Spec
ific
atio
ns
• U
se h
ardn
ess
as t
he o
nly
mat
eria
l pr
oper
ty,
even
th
ough
K d
epen
ds o
n va
riou
s pr
oper
ties
of
both
m
ater
ials
• Im
plie
s th
at w
ear
rate
is
prop
orti
onal
to
real
co
ntac
t ar
ea i
n pl
asti
c co
ntac
ts a
nd m
ay n
ot b
e ap
plic
able
for
cas
es i
nvol
ving
ela
stic
con
tact
s
• B
ased
on
a co
mpa
riso
n of
the
str
ain
occu
rrin
g du
ring
asp
erit
y in
tera
ctio
ns w
ith
the
crit
ical
str
ain
at w
hich
cra
ck g
row
th i
s in
itia
ted.
If
the
appl
ied
stra
in i
s sm
alle
r th
an t
he c
riti
cal
stra
in,
the
wea
r ra
te i
s in
depe
nden
t of
tou
ghne
ss,
and
follo
ws
Arc
hard
's

Tab
le 7
.2
Con
tinu
ed
Wea
r P
roce
ss
Abr
asiv
e W
ear
(Rab
inow
icz,
196
5)
(Zum
Gah
r, 1
982)
Mod
el
Rab
inow
icz
mod
el:
V
K F
N
Wab
=1
: =
TIH
tan
9
Wab
= w
ear
rate
(w
orn
volu
me
per
unit
slid
ing
dist
ance
) K
= w
ear
coef
fici
ent
V =
vol
ume
of w
ear
L =
sli
ding
dis
tanc
e FN
= n
orm
al l
oad
H =
har
dnes
s of
the
sof
ter
mat
eria
l ta
n 9
= w
eigh
ted
aver
age
of t
he t
an 9
va
lues
of
all
the
indi
vidu
al c
ones
9 =
ave
rage
slo
pe
of t
he a
sper
itie
s
Zum
Gah
r m
odel
:
W -~
ab -
K1K
2'T
c
Wab
= w
ear
rate
cos
p si
n 9
F N
[ c
os( 9
/2) ]
0,5
cos(
9 -
p)
fab =
mod
el f
acto
r (1
for
mic
rocu
ttin
g)
K1 =
rel
axat
ion
of n
orm
al a
nd s
hear
str
ess
K2
= te
xtur
e fa
ctor
(1
for
fcc
met
als)
tc
= s
hear
str
ess
for
disl
ocat
ion
mov
emen
t p
= f
rict
ion
angl
e at
abr
asiv
e-m
ater
ial
inte
rfac
e
Spec
ific
atio
ns
• A
ssum
es t
hat
aspe
riti
es o
f th
e ha
rder
sur
face
are
co
nica
l
• C
onsi
ders
the
pro
cess
es o
f m
icro
cutt
ing,
m
icro
plou
ghin
g, a
nd m
icro
crac
king
in
the
abra
sive
w
ear
of d
ucti
le m
etal
s.
• T
his
mod
el i
nclu
des
the
effe
cts
of
• w
ork
hard
enin
g •
duct
ilit
y •
hom
ogen
eity
of
stra
in
• cr
ysta
l an
isot
ropy

Tab
le 7
.2
Con
tinu
ed
Wea
r P
roce
ss
Fat
igue
Wea
r (H
alli
ng,
1975
)
Cor
rosi
ve W
ear
(Qui
nn,
1980
; Q
uinn
et
al.,
1983
)
# N
ote
Mod
el
Hal
ling
mod
el:
'TJ"Y
W
Ca =
: K
--
FN
ef H
W
fa
=:
wea
r ra
te
'TJ =
: lin
e di
stri
buti
on o
f as
peri
ties
"y
=
: co
nsta
nt d
efin
ing
part
icle
siz
e e 1
=:
stra
in t
o fa
ilur
e in
one
loa
ding
cyc
le
H =
: ha
rdne
ss o
f th
e so
fter
mat
eria
l K
=:
wea
r co
effi
cien
t
Qui
nn M
odel
:
W
=:
dAc
exp[
-Q/(
RcT
c)]
F co
rr
3e2 p
2 v H
N
Wco
rr =
: w
ear
rate
p
=:
dens
ity
of m
ater
ial
Ac
=:
Arr
heni
us c
onst
ant
Q =
: ac
tiva
tion
ene
rgy
Rc
=:
gas
cons
tant
Tc
=:
cont
act
tem
pera
ture
d
=:
aspe
rity
con
tact
dia
met
er
v =
: sl
idin
g ve
loci
ty
e =
: cr
itic
al t
hick
ness
of
reac
tion
lay
er
Spec
ific
atio
ns
• In
corp
orat
es t
he c
once
pt o
f fa
tigu
e fa
ilur
e as
wel
l as
sim
ple
plas
tic
defo
rmat
ion
fail
ure.
• E
xpla
ins
wea
r in
ste
el a
nd a
ssum
es t
hat
surf
ace
aspe
rity
lay
ers
form
ed t
ribo
chem
ical
ly a
re
deta
ched
at
a ce
rtai
n cr
itic
al t
hick
ness
• T
he w
ear
fact
or (
k) i
s a
mea
sure
of
the
rate
at
whi
ch a
giv
en c
ombi
nati
on o
f m
ater
ials
wea
rs i
n th
e en
viro
nmen
t o
f th
e te
st.
K i
s w
idel
y us
ed
for
com
para
tive
pur
pose
s.
• A
ccor
ding
to
Dow
son
(199
5),
if t
he m
ean
cont
act
stre
sses
are
not
too
hig
h th
e w
ear
of p
olym
er a
gain
st a
har
d su
rfac
e (m
etal
or
cera
mic
) is
ob
tain
ed w
ith f
air
accu
racy
with
the
rel
atio
nshi
p V
= k
FL
. •
K i
s di
rect
ly i
nflu
ence
d by
the
rou
ghne
ss a
vera
ge (
Ra)
of
the
met
alli
c co
unte
rfac
e fo
r th
e co
ntac
t U
HM
WP
E-s
tain
less
ste
el i
n w
ater
und
er r
eci
proc
atin
g pi
n-on
-pla
te c
ondi
tion
s gi
ven
by t
he r
elat
ions
hip
k =
4.0
X 10
.5 R
a 1.
2(D
owso
n et
aI.,
198
5).

L-______________ I_N_V_I_T_R_O_W __ E_A_R_T_E_S_T_IN __ G ______________ ~1 I 369
combination of materials, or the more restrictive yet equally elusive determination of the rate of wear to facilitate the estimation of their 'clinical' life. Experimental results are highly dependent on the geometry of the contact, the lubricant, the tribological conditions including velocity and load, and material properties (Suh, 1986). Therefore, experimental protocols aimed at investigating the wear properties of biomaterials should be designed to assess or predict their behavior in simulated clinical conditions (Dumbleton, 1981).
7.2 IN VITRO WEAR TESTING
Although wear is a very complex process, apparatuses are available which allow for the accumulation of data resulting in an estimate of the wear resistance of a combination of materials or a device. Preliminary material studies will commonly be performed on laboratory wear benches while devices will be evaluated with simulators. Numerous in vitro and in vivo studies have been conducted to evaluate the wear properties of biomaterial tribosystems (Table 7.3). Over the years, different wear apparatuses (Table 7.4) and protocols have been used for this purpose. Only one standard procedure under the American Society for Testing and Materials (ASTM F-732-82, reapproved 1991) for Reciprocating Pin-on-Flat Evaluation of Friction and Wear Properties of Polymeric Materials for Use in Total Joint Prostheses) describes the testing protocol for characterizing the wear resistance of material combinations to be used in the design of implants. Several investigators have used modified or adapted versions of this standard to assess the wear resistance of bearing surfaces for orthopaedic applications (Streicher, 1991; Schmidt et ai., 1995; Jin et ai., 1993; Medley et ai., 1995; Brown et ai., 1976; Rose and Radin, 1982; Fisher and Dowson, 1991, Agrawal et ai., 1993). Other ASTM protocols pertinent to the evaluation of wear performance of engineering materials are listed in Table 7.5. Wear resistance is usually reported in terms of wear rate, either linear or volumetric, with different units such as volume lost per 106 cycles, mass loss per 106 cycles, or linear displacement per 106 cycles. A complete walking cycle is represented by two steps. One cycle on a reciprocating pin-on-flat system is obtained by two passes (return to starting point), while one cycle on a rotating pin-on-disc system corresponds to one revolution. It is assumed that a normal individual will make two million steps per year while an active subject may make more than 10 million steps (Dumbleton, 1981) at a maximum frequency of 1 Hz. Investigators have also reported wear rates as cubic millimeters (volume) per millimeter (sliding distance) (mm3/mm). The volume is calculated by measuring the mass loss and using the density of the polymer as a conversion factor. Tables 7.6 and 7.7 present a critical selection of

370 I IL-_________ W_EA_R ________ _
wear data available for biomaterial tribosystems useful to the orthopaedic design community. Both friction coefficient and wear rate are used as design parameters. Unless independently monitored, friction coefficients are usually acquired during wear tests. The static coefficient of friction is calculated using the force required to initiate motion. The kinetic coefficient of friction may vary during a test for a constant velocity and should be calculated from averaged force readings during the duration of the test. ASTM Standard GllS-93 proposes a guide for Measuring and Reporting Friction Coefficients (ASTM, 1993) which is designed to assist investigators in the selection of an appropriate method for measuring the frictional properties of materials.
Table 7.3 Biomaterial Combinations Tribologically Characterized
Material combinations
Stainless steel UHMWPE
Co-Cr-alloys UHMWPE
Titanium alloys UHMWPE
Alumina UHMWPE
Zirconia UHMWPE
CoCrMo CoCrMo
CoCrMo Delrin CoCrMo Alumina Ti6A14V Alumina Alumina Alumina
Polyurethane low modulus elastomers) Metal
Dental resins Enamel
Test apparatus
Pin -on disc; joint simulator (McKellop et aI., 1981; Dowson et aI., 1988; Kumar et al., 1991) Pin-on-disc; joint simulator (McKellop et aI., 1978; McKellop et al., 1981; Rose et al., 1984; Saikko, 1993) Pin-on-disc; joint simulator (Miller et al., 1974; McKellop et aI., 1978; McKellop and Rostliind, 1990) Pin-on-disc; joint simulator (Semlitsch et al., 1977; McKellop et aI., 1981; Saikko, 1993) Pin-on-disc; joint simulator (Saikko, 1993; Kumar et al., 1991) Pin-on-disc; joint simulator (Galante, 1973; Semlitsch et al., 1977; Streicher et aI., 1990; Medley et aI., 1995; Chan et al., 1996) Disc-on-ftat (Clarke et al., 1982) Joint simulator (Saikko et al., 1993) Joint simulator (Saikko et al., 1993) Wear and friction benches; joint simulator (Galante et al., 1973; Boutin et aI., 1972; Semlitsch et aI., 1977) Reciprocating friction benches; joint simulator (Gladstone and Medley, 1990; Jin et aI., 1993; Auger et aI., 1993; Chow et aI., 1994; Auger et aI., 1995; Graham et aI., 1995) Pin-on-ftat (Suzuki et aI., 1996)

L-______________ I_N_V_I_T_R_O_W __ E_A_R_T_E_S_T_I_N_G ______________ ~I I 371
Table 7.4 In vitro Measurement wear machines
Wear Apparatus Type
Pin-on-disc or pin-on-plate
Reciprocating pin-on-plate
Joint simulators (knee and hip simulators)
Comments
Useful in studying basic wear mechanisms. Steady and well controlled operating conditions. Fails to replicate the reciprocating motion observed in joints Simulates the reciprocating motion observed in vivo and fatigue loading (loading and unloading). Improved understanding of the wear processes encountered in prostheses.
Table 7.5 In vitro Friction and Wear Measurement Standards*
ASTM Standard Title
B460 Test Method For Dynamic Coefficient Of Friction And Wear Of Sintered Metal Friction Materials Under Dry Conditions (vol. 2.05, p. 223-225, 1989)
B461 Test Method For Frictional Characteristics Of Sintered Metal Friction Materials Run In Lubricants (vol. 2.05, 1989)
C808 Guidelines For Reporting Friction And Wear Test Results Of Manufactured Carbon And Graphite Bearing And Seal Materials (vol. 15.01, p. 243-344, 1989)
D1894 Test Method For Static And Kinetic Coefficients Of Friction Of Plastic Film And Sheeting (vol. 8.01, p. 439-444, 1995)
D3028 Test Method For Kinetic Coefficient Of Friction Of Plastic Solids (vol. 8.02, p. 225-233, 1995)
D3108 Test Method For Coefficient Of Friction, Yarn To Solid Material (vol. 7.01, p. 758-766, 1995)
D3334 Method Of Testing Fabrics Woven From Polyolefin Monofilaments (vol. 7.01, p. 516-520, 1989)
D3412 Test Method For Coefficient Of Friction, Yarn-To-Yarn. (vol. 7.02, p. 10-14, 1995)
F732 Practice For Reciprocating Pin-On-Flat Evaluation Of Friction And Wear Properties Of Polymeric Materials For Use In Total Joint Prosthesis (vol. 13.01, p. 183-188, 1995)
G40 Terminology Relating to Wear and Corrosion (vol. 3.02, p. 145-151, 1995)
G77 Test Method for Ranking Resistance of Materials to Sliding Wear Using Block-on-Ring Wear Test (vol. 3.02, p. 302-315, 1995)
G83 Test Method for Wear Testing with a Crossed-Cylinder Apparatus (vol. 3.02, p. 339-344, 1995)
G99 Test Method for Wear Testing with a Pin-on-Disk Apparatus (vol. 3.02, p. 380-390, 1995)
G 115 Standard Guide For Measuring And Reporting Friction Coefficients (vol. 13.01, p. 472-481, 1995)
* American Society for Testing and Materials, Annual Book of ASTM Standards, Philadelphia, P A.

Tab
le 7
.6
Fri
ctio
n co
effi
cien
ts o
f va
riou
s im
plan
t m
ater
ials
fro
m i
n vi
tro
stud
ies
Mat
eria
l co
ntac
t
Sta
inle
ss s
teel
(3
16L
VM
) +
UH
MW
PE
Sta
inle
ss s
teel
(3
16L
) +
UH
MW
PE
Sta
inle
ss s
teel
(1
00C
R6
-G
erm
an)
+ U
HM
WP
E
(Chi
rule
ne
Ger
man
)
Sta
inle
ss s
teel
+
UH
MW
PE
Sta
inle
ss s
teel
+
UH
MW
PE
(C
harn
ley)
Ave
rage
(o
r ra
nge)
fr
icti
on
coef
fici
ent
0.07
-0.1
3
0.D
78
0.17
(a)
0.
10 (
b)
0.16
(c)
0.
14 (
d)
0.03
-0.0
9
0.05
Tes
ting
app
arat
us
Pin
-on-
disk
Pin
-on-
disk
Bal
l-on
-dis
k vi
brot
ribo
met
er
(Opt
imol
SR
V -
Ger
man
)
Rec
ipro
cati
ng f
lat-
on-f
lat
Dua
l hi
p si
mul
ator
Tri
bolo
gica
l co
ndit
ions
• L
oad
= 3
.45
M P
a •
Vel
ocit
y =
50
x 10
6 m
mly
r •
Lub
#: s
erum
•
Dur
atio
n: 2
yea
rs t
est
.28
-32
DC
• L
oad
= 3
MP
a •
Vel
ocit
y =
60
mm
ls
• L
ub:
bovi
ne s
erum
, 40
-50
ml
.24
-26
DC
• 10
mm
dia
met
er b
all
• O
scil
lati
on =
10
Hz;
1.6
5 m
m a
mpl
itud
e •
Loa
d =
50
and
300
N
• L
ub:
(a)
none
; (b
) hu
man
syn
ovia
l flu
id;
(c)
yello
w b
one
mar
row
; (d
) re
d bo
ne m
arro
w
.37
DC
• L
oad
= 4
45N
•
Vel
ocit
y =
100
cyc
les/
min
•
Lub
: bo
vine
ser
um
• D
urat
ion:
3.7
x 1
06 cy
cles
• V
eloc
ity =
30
cycl
es/m
in
• L
oad
= 2
50 k
g •
Dur
atio
n: 1
000
h •
Lub
: se
rum
•
Roo
m t
empe
ratu
re
Ref
eren
ces
McK
ello
p et
at.
(197
8)
Kum
ar e
t at
. (1
991)
Gav
rjus
henk
o (1
993)
McK
ello
p et
at.
(198
1)
Sim
on e
t al
. (1
973)

Tab
le 7
.6
Co
nti
nu
ed A
vera
ge
(or
rang
e)
Mat
eria
l fr
icti
on
cont
act
coef
fici
ent
Sta
inle
ss s
teel
0.
034
(Ort
ron
90)
+ U
HM
WP
E
(AS
TM
F 6
48)
0.04
0
Sta
inle
ss s
teel
si
mul
ator
(3
16L
) +
UH
MW
PE
Sta
inle
ss s
teel
0.
03-0
.09
(316
L)
+ U
HM
WP
E
(AS
TM
F 6
48)
CoC
rMo
Dry
0.1
3 (P
rota
sul-
2)
Lub
: 0.
21
+ U
HM
WP
E
Co
-Cr
0.05
-0.1
1 +
UH
MW
PE
Tes
ting
app
arat
us
Sing
le c
hann
el h
ip j
oint
si
mul
ator
Sing
le c
hann
el h
ip j
oint
Tw
elve
cha
nnel
fri
ctio
n an
d w
ear
mac
hine
FW
-12
Rol
ling
-sli
ding
app
arat
us
Pin
-on-
disk
Tri
bolo
gica
l co
ndit
ions
• R
ange
of
mot
ion
= 3
0°
• L
ub:
Dei
oniz
ed w
ater
@ 37
°C
• L
oad
= 1-
4 kN
•
Ang
ular
Vel
ocit
y =
0.6-
2.4
radl
s •
Ran
ge o
f m
otio
n =
30
°
• L
ub:
Dei
oniz
ed w
ater
@ 3
7°C
•
Loa
d =
1-4
kN
• A
ngul
ar v
eloc
ity =
0.6
-2.4
rad
/s
• C
onfo
rmin
g, f
1at-o
n-f1
at c
onfi
gura
tion
•
Vel
ocit
y =
100
cyc
./min
•
Pre
ssur
e =
6.90
MP
a •
Dur
atio
n: 3
.7 x
106
cy
cles
•
Lub
: bo
vine
cal
f se
rum
w/5
5 so
dium
azi
de
• V
eloc
ity
= 2
5 m
lmin
•
Pre
ssur
e =
30N
/cm
2 •
Dur
atio
n: 2
0 h
• L
ub:
none
or
dist
ille
d w
ater
•
Roo
m t
empe
ratu
re
• L
oad
= 3.
45 M
Pa
• V
eloc
ity
= 50
x 1
06 m
mly
r •
Lub
: se
rum
•
Dur
atio
n: 2
yea
rs t
est
.28
-32
°C
Ref
eren
ces
Sai
kko
(199
2)
Sai
kko
(199
2)
McK
ello
p (1
981)
Sem
lits
ch e
t al
. (1
977)
McK
ello
p et
al.
(197
8)

Tab
le 7
.6
Co
nti
nu
ed A
vera
ge
(or
rang
e)
Mat
eria
l fr
icti
on
cont
act
coef
fici
ent
Tes
ting
appa
ratu
s T
ribo
logi
cal
cond
itio
ns
Ref
eren
ces
Co
-Cr
00.0
7--0
.25
Pin
-on-
flat
•
Axi
al l
oad
= 22
3 N
T
atei
shi
et a
l. (1
989)
+
UH
MW
PE
•
Dur
atio
n 25
0000
cyc
les
• L
ub:
bovi
ne s
erum
Co
-Cr-
Mo
0.
08--
0.15
P
in-o
n-fl
at
• C
onta
ct p
ress
ure
= 4.
8 M
Pa
Sai
kko
(199
3)
(Vit
alli
um)
• F
requ
ency
= 1
Hz
+ U
HM
WP
E
• Sl
idin
g di
st.
= 50
mm
•
Lub
: di
stil
led,
dei
oniz
ed H
zO
.37
.1°C
Co
-Cr-
Mo
0.
060-
-0.0
93
Rec
ipro
cati
ng m
otio
n •
Max
imum
str
ess
= 6
MP
a R
uger
(19
95)
(AS
TM
F79
9)
fric
tion
ben
ch (
line
/fla
t)
• L
ub:
86%
Gly
ceri
ne
+ U
HM
WP
E
• F
requ
ency
= 1
Hz
(GU
R 4
15)
• D
urat
ion:
500
000
cyc
les
• Sl
idin
g D
ist.
= 10
0 m
m/c
ycle
Co
-Cr-
Mo
0.
018-
-0.0
45
Dur
ham
hip
fun
ctio
n •
Ran
ge o
f m
otio
n =
20°
Uns
wor
th e
t al
. (1
988)
(M
ulle
r)
sim
ulat
or
• L
ub:
Car
boxy
met
hyl
Cel
lulo
se
+ U
HM
WP
E
• D
ynam
ic l
oad
= 20
00 N
•
Fre
quen
cy =
1 H
z
Co
-Cr-
Mo
0.
057
Sing
le c
hann
el h
ip j
oint
•
Ran
ge o
f m
otio
n =
30°
Sai
kko
(199
2)
(Vit
alli
um)
sim
ulat
or
• L
oad
= 1
-4 k
N
+ U
HM
WP
E
• A
ngul
ar v
eloc
ity =
0.6-
-2.4
rad
/s
(AS
TM
F 6
48)
• L
ub:
deio
nize
d w
ater
@ 3
7°C
Co
-Cr-
Mo
0.
038-
-0.0
63
Sing
le c
hann
el h
ip j
oint
•
Ran
ge o
f m
otio
n =
30°
Sai
kko
(199
2)
(Zim
allo
y)
sim
ulat
or
• L
oad
= 1.
4 kN
+
UH
MW
PE
•
Ang
ular
vel
ocity
= 0.
6--2
.4 r
ad/s
(A
ST
M F
648
) •
Lub
: de
ioni
zed
wat
er @
37
°C

Tab
le 7
.6
Co
nti
nu
ed A
vera
ge
(or
rang
e)
Mat
eria
l fr
icti
on
cont
act
coef
fici
ent
Tes
ting
appa
ratu
s T
ribo
logi
cal
cond
itio
ns
Ref
eren
ces
Co-
Cr-
Mo
0.04
4 H
ip s
imul
ator
mac
hine
•
Lub
: sy
novi
al f
luid
W
alke
r et
al.
(197
3)
(AS
TM
F75
) •
Pea
k lo
ad =
150
kg
+ U
HM
WP
E
Co-
Cr-
Mo
0.05
2-0.
070
Sing
le c
hann
el h
ip j
oint
•
Ran
ge o
f m
otio
n =
30°
S
aikk
o (1
992)
(A
ST
M F
799
) si
mul
ator
•
Loa
d =
1.4
kN
+
UH
MW
PE
•
Ang
ular
vel
ocity
= 0
:6-2
.4 r
ad/s
(A
ST
M F
648
) •
Lub
: de
ioni
zed
wat
er @
3
7°C
CoC
rMo
0.06
D
ual
hip
sim
ulat
or
• V
eloc
ity
= 3
0 cy
cles
/min
Si
mon
et
al.
(197
3)
+ U
HM
WP
E
• L
oad
= 2
50 k
g (C
harn
ley-
Mul
ler)
•
Dur
atio
n: 1
00 h
•
Lub
: se
rum
•
Roo
m t
empe
ratu
re
Co-
Cr-
Mo
0.05
-01.
1 T
wel
ve c
hann
el f
rict
ion
and
• C
onfo
rmin
g, f
lat-
on-f
lat
conf
igur
atio
n M
cKel
lop
(198
1)
+ U
HM
WP
E
wea
r m
achi
ne F
W-1
2 •
Vel
ocit
y =
100
cyc
./min
•
Pre
ssur
e =
6.9
0 M
Pa
• D
urat
ion:
3.7
x 1
06 cy
cles
•
Lub
: bo
vine
cal
f se
rum
w/5
5 so
dium
az
ide
Co-
Cr-
Mo
0.06
-0.0
7 H
ip j
oint
sim
ulat
or
• L
oad
2.5
kN s
tati
c lo
ad
Wei
ghtm
an e
t at
. +
UH
MW
PE
(a
,c)
(197
2)
0.10
-0.1
2 •
Lub
: (a
) se
rum
, (b
) se
rum
alb
umin
, (b
,d)
(c)
syno
vial
flu
id,
(d)
vero
n at
e bu
ffer
Co-
Cr-
Mo
0.04
-0.0
6 H
ip j
oint
sim
ulat
or
• L
oad
2.5
kN s
tati
c lo
ad
Wei
ghtm
an e
t al
. +
UH
MW
PE
•
Vel
ocity
: 30
cyc
les/
min
(1
973)
•
Dur
atio
n: 1
.8 m
illio
n cy
cles
•
Lub
: se
rum

Tab
le 7
.6
Co
nti
nu
ed
Mat
eria
l co
ntac
t
Co-
Cr-
Mo
+U
HM
WP
E
Ti-
6Al-
4V
+U
HM
WP
E
Ti-
6AI-
4V
+U
HM
WP
E
Ti-
6Al-
4V
(Ion
im
plan
ted)
+
UH
MW
PE
(A
ST
M F
648
)
Ti-
6AI-
4V E
LI
(AS
TM
F 1
36)
+U
HM
WP
E
(AS
TM
F 6
48)
Alu
min
a +
UH
MW
PE
Alu
min
a +
UH
MW
PE
Ave
rage
(o
r ra
nge)
fr
icti
on
coef
fici
ent
0.03
-0.0
5
0.04
-0.2
6
Tes
ting
app
arat
us
Pin-
on-d
isk
Pin-
on-f
lat
0.05
-0.1
21
Rec
ipro
cati
ng f
lat
on-f
lat
0.05
8 Si
ngle
cha
nnel
hip
joi
nt
sim
ulat
or
0.12
3-0.
133
Sing
le c
hann
el h
ip j
oint
si
mul
ator
0.06
-0.1
0 R
ecip
roca
ting
fla
t-on
-fla
t
0.05
6 P
in-o
n-di
sk
Tri
bolo
gica
l co
ndit
ions
• L
oad
= lO
ON
•
Lub
: R
inge
r's s
olut
ion
• V
eloc
ity
= 0
.05
mls
•
Dur
atio
n: 4
8 h
• A
xial
loa
d =
223
N
• D
urat
ion:
250
000
cyc
les
• L
ub:
bovi
ne s
erum
• L
oad
= 4
45N
•
Vel
ocit
y =
100
cycl
es/m
in
• L
ub:
bovi
ne s
erum
•
Dur
atio
n: 4
.1 x
1()6
cyc
les
• R
ange
of
mot
ion
= 30
° •
Lub
: de
ioni
zed
wat
er @
37
°C
• L
oad
= 1
-4 k
N
• A
ngul
ar v
eloc
ity =
0.6-
2.4
radl
s
• R
ange
of
mot
ion
= 30
° •
Lub
: de
ioni
zed
wat
er @
37°
C
• L
oad
= 1
-4 k
N
• A
ngul
ar v
eloc
ity =
0.6-
2.4
radl
s
• L
oad
= 2
23N
•
Vel
ocity
= 60
cyc
les/
min
•
Lub
: bo
vine
ser
um
• L
oad
= 3
MP
a •
Vel
ocit
y =
60
mm
ls
• L
ub:
bovi
ne s
erum
, 40
-50
ml
.24
--2
6°C
Ref
eren
ces
Ung
ethu
m a
nd R
efio
r (1
973)
Tat
eish
i et
al.
(198
9)
McK
ello
p et
al.
(198
1)
Sai
kko
(199
2)
Sai
kko
(199
2)
McK
ello
p et
al.
(198
1)
Kum
ar e
t al
. (1
991)

Tab
le 7
.6
Co
nti
nu
ed A
vera
ge
(or
rang
e)
Mat
eria
l fr
icti
on
cont
act
coef
fici
ent
Tes
ting
app
arat
us
Alu
min
a 0.
06-0
.18
Pin-
on-f
iat
(Vit
ox)
+U
HM
WP
E
Alu
min
a 0.
06-0
.25
Pin-
on-f
iat
+U
HM
WP
E
Alu
min
a D
ry:
0.16
R
ollin
g-sl
idin
g ap
para
tus
+U
HM
WP
E
Lub
: 0.
05
Alu
min
a 0.
022-
0.06
2 Si
ngle
cha
nnel
hip
joi
nt
(BIO
LO
X)
sim
ulat
or
+U
HM
WP
E
(AS
TM
F 6
48)
Alu
min
a 0.
050
Sing
le c
hann
el h
ip j
oint
(A
ST
M F
603
) si
mul
ator
+
UH
MW
PE
(A
ST
M F
648
)
Zir
coni
a (Y
-PS
Z)
0.04
9 P
in-o
n-di
sk
+ U
HM
WP
E
Tri
bolo
gica
l co
ndit
ions
• C
onta
ct p
ress
ure
= 4.8
MP
a •
Fre
quen
cy =
1 H
z •
Slid
ing
dist
. =
50
mm
•
Lub
: di
still
ed,
deio
nize
d H
20
.37
.1°C
• A
xial
loa
d =
223
N
• D
urat
ion:
250
000
cyc
les
• L
ub:
bovi
ne s
erum
• V
eloc
ity =
25
mlm
in
• P
ress
ure
= 3
0 N
/cm
2
• D
urat
ion:
20
h •
Lub
: no
ne o
r di
still
ed w
ater
•
Roo
m t
empe
ratu
re
• R
ange
of
mot
ion
= 3
0°
• L
ub:
deio
nize
d w
ater
@ 3
7°C
•
Loa
d =
1-4
kN
•
Ang
ular
vel
ocity
= 0
.6-2
.4 r
ad/s
• R
ange
of
mot
ion
= 3
0°
• L
ub:
deio
nize
d w
ater
@ 3
7°C
•
Loa
d =
1-4
kN
•
Ang
ular
vel
ocity
= 0
.6-2
.4 r
ad/s
• L
oad
= 3M
Pa
• V
eloc
ity
= 6
0 m
mls
•
Lub
: bo
vine
ser
um,
40-5
0 m
l .2
4-2
6°C
Ref
eren
ces
Sai
kko
(199
3)
Tat
eish
i et
al.
(198
9)
Sem
lits
ch e
t al
. (1
977)
Sai
kko
(199
2)
Sai
kko
(199
2)
Kum
ar e
t al
. (1
991)

Tab
le 7
.6
Co
nti
nu
ed A
vera
ge
(or
rang
e)
Mat
eria
l fr
icti
on
cont
act
coef
fici
ent
Tes
ting
app
arat
us
Tri
bolo
gica
l co
ndit
ions
R
efer
ence
s
Zir
coni
a 0.
05-0
.16
Pin
-on-
flat
•
Con
tact
pre
ssur
e ==
4.8
MP
a S
aikk
o (1
993)
(Z
yran
ox)
• F
requ
ency
==
1 H
z +
UH
MW
PE
•
Slid
ing
dist
. ==
50
mm
•
Lub
: di
still
ed,
deio
nize
d H
p
.37
.1°C
Zir
coni
a 0.
059
Sing
le c
hann
el h
ip j
oint
•
Ran
ge o
f M
otio
n ==
30°
S
aikk
o (1
992)
+
UH
MW
PE
si
mul
ator
•
Lub
: de
ioni
zed
wat
er @
3
7°C
(A
ST
M F
648
) •
Loa
d ==
1-4
kN
•
Ang
ular
vel
ocity
==
0.6-
2.4
radl
s
Sta
inle
ss s
teel
0.
6 (a
) B
all-
on-d
isk
vibr
otri
bom
eter
•
10 m
m d
iam
eter
bal
l G
avrj
ushe
nko
(199
3)
(10
0C
R6
-0.
26 (
b)
(Opt
imol
SR
V -
Ger
man
) •
Osc
illa
tion
==
10 H
z; 1
.65
mm
am
plit
ude
Ger
man
) 0.
106
(c)
• L
oad
== 5
0 &
300
N
+ S
tain
less
ste
el
0.1
(d)
• L
ub:
(a)
none
; (b
) hu
man
syn
ovia
l flu
id;
(100
CR
6-(c
) ye
llow
bon
e m
arro
w;
(d)
red
bone
G
erm
an)
mar
row
.3
7°C
Co-
Cr-
Mo
0.03
--0.
04
Pin
-on-
disk
•
Loa
d ==
100
N
Ung
ethu
m a
nd R
efio
r +
Co-
Cr-
Mo
• L
ub:
Rin
ger'
s so
luti
on
(197
4)
• V
eloc
ity
== 0
.05
mls
•
Dur
atio
n: 4
8 h
CoC
rMo
Dry
: 0.
4 R
ollin
g-sl
idin
g ap
para
tus
• V
eloc
ity
== 2
5 m
lrni
n Se
mlit
sch
et a
l. (1
977)
(P
rota
sul-
2)
Lub
: 0.
35
• P
ress
ure
== 30
N/c
m2
+ C
oCrM
o •
Dur
atio
n: 2
0 h
(Pro
tasu
l-2)
•
Lub
: no
ne o
r di
still
ed w
ater
•
Roo
m t
empe
ratu
re

Tab
le 7
.6
Con
tinu
ed A
vera
ge
(or
rang
e)
Mat
eria
l fr
icti
on
cont
act
coef
fici
ent
Co-
Cr-
Mo
0.12
-0.1
3 +
Co-
Cr-
Mo
(a,b
,c)
0.22
(d)
Co-
Cr-
Mo
0.13
-0.1
4 +
Co-
Cr-
Mo
Co-
Cr-
Mo
0.16
(A
ST
M F
75)
CoC
rMo
Ser
um &
+
CoC
rMo
syno
vial
(M
cKee
-Far
rar)
fl
uid:
0.1
2 Sa
line:
0.2
2
CoC
rMo
0.13
+
CoC
rMo
(McK
ee-F
arra
r)
Alu
min
a 0.
26-0
.35
+ a
lum
ina
Alu
min
a D
ry:
0.71
+
alu
min
a L
ub:
0.09
Tes
ting
app
arat
us
Hip
joi
nt s
imul
ator
Hip
joi
nt s
imul
ator
Hip
sim
ulat
or m
achi
ne
Dua
l hi
p si
mul
ator
Dua
l hi
p si
mul
ator
Pin
-on -
disk
Rol
ling-
slid
ing
appa
ratu
s
Tri
bolo
gica
l co
ndit
ions
• L
oad
2.5
kN s
tati
c lo
ad
• L
ub:
(a)
seru
m,
(b)
seru
m a
lbum
in,
(c)
syno
vial
flu
id,
(d)
vero
nate
buf
fer
• L
oad
2.5
kN s
tati
c lo
ad
• V
eloc
ity:
30 c
ycle
s/m
in
• D
urat
ion:
1.8
mill
ion
cycl
es
• L
ub:
seru
m
• L
ub:
syno
vial
flu
id
• P
eak
load
= 1
50 k
g
• V
eloc
ity =
30
cycl
es/m
in
• L
oad
= 25
0 kg
•
Dur
atio
n: 1
000
h •
Lub
: se
rum
& s
ynov
ial
fluid
or
sali
ne
• R
oom
tem
pera
ture
• V
eloc
ity
= 3
0 cy
cles
/min
•
Loa
d =
250
kg
• D
urat
ion:
100
0 h
• L
ub:
seru
m
• R
oom
tem
pera
ture
• L
oad
= l
OO
N
• L
ub:
Rin
ger's
sol
utio
n •
Vel
ocity
= 0
.05
mls
•
Dur
atio
n: 4
8 h
• V
eloc
ity
= 25
mlm
in
• P
ress
ure
= 3
0 N
/cm
2
• D
urat
ion:
20
h •
Lub
: no
ne o
r di
stil
led
wat
er
• R
oom
tem
pera
ture
Ref
eren
ces
Wei
ghtm
an e
t al
. (1
972)
Wei
ghtm
an e
t al
. (1
973)
Wal
ker
et a
l., (
1973
)
Sim
on e
t al
. (1
973)
Sim
on e
t al
. (1
973)
Ung
ethu
m a
nd R
efio
r (1
974)
Sem
litsc
h et
al.
(197
7)

Tab
le 7
.7
Wea
r R
ates
of
Var
ious
Mat
eria
l C
ombi
nati
on f
rom
in
vitr
o S
tudi
es
Mat
eria
l W
ear
Con
tact
W
ear
rate
C
oeff
icie
nt
Tri
bolo
gica
l C
ondi
tion
s W
ear
Mec
hani
sms
Ref
eren
ces
Sta
inle
ss s
teel
O
.4m
m/y
r N
A
• P
in-o
n-di
sk
Sm
ooth
pol
ymer
, m
etal
-M
cKel
lop
et a
l.,
(316
LV
M)
• L
ub*:
bov
ine
seru
m
scra
ches
. (1
978)
+
UH
MW
PE
•
Dur
atio
n: 2
yrs
tes
t •
Loa
d =
3.4
5 M
Pa
• V
eloc
ity
= 5
0 x
106
mm
/yr
.28
-32
°C
Sta
inle
ss s
teel
0.
17-0
.23
NA
•
Rec
ipro
cati
ng f
iat-
on-f
iat
Sur
face
scr
atch
ing.
M
cKel
lop
et a
l. (1
981)
(3
16L
) m
m3 /1
06
• L
oad
= 4
45 N
+
UH
MW
PE
•
Vel
ocit
y =
100
cyc
les/
min
•
Lub
: bo
vine
ser
um
• D
urat
ion
= 3
.7 x
106
cy
cles
Sta
inle
ss s
teel
N
A
27.7
x 1
0.7
• P
in-o
n-di
sk
Ori
gina
l m
achi
ne m
arks
K
umar
et
al.
(199
1)
(316
L)
mm
3 /N
m
• L
ub:
bovi
ne s
erum
, 40
-50
ml
gone
, ne
w w
ear
mar
ks.
+ U
HM
WP
E
• L
oad
= 3
MP
a •
Vel
ocit
y =6
0 m
mls
.2
4-2
6°C
Sta
inle
ss s
teel
M
achi
ned
NA
•
Ann
ular
dis
k on
fia
t pi
n U
HM
WP
E t
rans
fer
film
. M
ille
r et
at.
(197
4)
(316
L)
UH
MW
PE
: •
Ran
ge o
f m
otio
n =
110
° +
Mac
hine
d 3.
23 i
n/in
x 1
0.9
• Sl
idin
g ve
loci
ty =
43.
3 in
/min
U
HM
WP
E
Mol
ded
• S
tres
s =
500
psi
(H
iFax
190
0)
UH
MW
PE
: •
Lub
: R
inge
r's
solu
tion
1.
70 i
n/in
x 1
0-9
Sta
inle
ss s
teel
M
ax.
dept
h N
A
• D
ual
hip
sim
ulat
or
Evi
denc
e of
bri
ttle
fra
ctur
e.
Sim
on e
t at
. (1
973)
+
UH
MW
PE
of
wea
r:
• V
eloc
ity
= 3
0 cy
cles
/min
(C
harn
ley)
0.
15 m
m
• L
oad
= 2
50 k
g •
Dur
atio
n: 1
000
g •
Lub
: se
rum
•
Roo
m t
empe
ratu
re

Tab
le 7
.7
Con
tinu
ed
Mat
eria
l W
ear
Con
tact
W
ear
rate
C
oeff
icie
nt
Tri
bolo
gica
l C
ondi
tion
s W
ear
Mec
hani
sms
Ref
eren
ces
Stai
nles
s st
eel
UH
MW
PE
: N
A
• T
wel
ve c
hann
el f
rict
ion
and
Qua
ntif
icat
ion
of w
ear
McK
ello
p (1
981)
(3
16L
) 0.
20 m
m3 /1
06
wea
r m
achi
ne F
W-1
2 se
para
tely
fro
m c
reep
cy
cles
•
Con
form
ing,
fla
t-on
-fla
t de
form
atio
n.
conf
igur
atio
n A
dhes
ive/
abra
sive
wea
r •
Vel
ocity
= 1
00 c
yc.fm
in
emph
asiz
es o
ver
fatig
ue
UH
MW
PE
•
Pre
ssur
e =
6.90
MP
a w
ear.
0.
65 f
un/y
ear
• D
urat
ion:
3.7
x 1
06 cy
cles
•
Lub
: bo
vine
cal
f se
rum
w/5
5 so
dium
azi
de
Sta
inle
ss s
teel
U
HM
WP
E:
NA
•
Ten
sta
tion
hip
sim
ulat
or
Hig
hly
load
ed r
egio
n of
E
yere
r et
al.
(198
7)
+U
HM
WP
E
40 m
gf10
6 cy
cles
•
Ran
ge o
f m
otio
n =
460
UH
MW
PE
sm
ooth
& s
hiny
, •
Lub
: B
ovin
e bl
ood
seru
m
peel
ing,
pit
ting
. @
37°C
•
Loa
d =
Osc
illa
ting
0-2
030
N
• F
requ
ency
= 1
Hz
• D
urat
ion:
1 x
106
cyc
les
Stai
nles
s st
eel
NA
1.
62 x
10.
7 •
Bal
l an
d so
cket
sim
ulat
or
Uni
form
sup
erfi
cial
M
cKel
lop
&
Ros
tlun
d +
UH
MW
PE
•
Ra
< 0
.016
sc
ratc
hes,
occ
asio
nal
(199
0)
mm
3 fN
m
• S
teri
lize
d w
ith 2
.5 M
rad
gra
d
deep
er m
arks
. M
etal
•
Lub
: bo
vine
ser
um w
ith
part
icle
s, a
cryl
ic c
emen
t so
dium
azi
de
part
icle
s.
• L
oad
= 20
00 N
•
Spe
ed =
100
mm
/sec
Cas
t C
o-C
r-M
o P
E t
hick
ness
N
A
• R
ecip
roca
ting
pin
-on-
flat
A
bras
ive
wea
r of
PE
. Po
ggie
et
af.
(199
2)
pins
ch
ange
: •
Ste
rili
zed
with
2.5
Mra
d T
rans
fer
of P
E o
n C
o-C
r (A
ST
M F
-75)
64
±13
J.L
m
• L
ub:
deio
nize
d w
ater
pi
ns.
Oxi
dati
ve w
ear
of
+ U
HM
WP
E
• 36
MP
a L
ine
cont
act
stre
ss
Co-
Cr
pins
. (G
UR
415
•
Fre
quen
cy =
2.1
Hz
plat
e)
• S
trok
e le
ngth
= 15
mm
•
Dur
atio
n =
2 x
106
cyc
les
• F
inal
fri
ctio
n =
0.07
9 ±
0.0
01

Tab
le 7
.7
Co
nti
nu
ed
Mat
eria
l W
ear
Con
tact
W
ear
rate
C
oeff
icie
nt
Tri
bolo
gica
l C
ondi
tion
s W
ear
Mec
hani
sms
Ref
eren
ces
Wro
ught
Co-
Cr
PE
thi
ckne
ss
NA
•
Rec
ipro
cati
ng p
in-o
n-fl
at
Abr
asiv
e w
ear
of P
E.
Pogg
ie e
t at
. (1
992)
pi
ns
chan
ge:
• S
teri
lize
d w
ith 2
.5 M
rad
Trn
asfe
r of
PE
on
Co-
Cr
(AS
TM
F-9
0)
71 ±
25
f.Lm
• L
ub:
deio
nize
d w
ater
pi
ns.
Oxi
dati
ve w
ear
of
+ U
HM
WP
E
• 36
MP
a L
ine
cont
act
stre
ss
Co-
Cr
pins
. G
UR
415
•
Fre
quen
cy =
2.1
Hz
plat
e •
Str
oke
leng
th =
15
mm
•
Dur
atio
n =
2 x
106
cyc
les
• F
inal
fri
ctio
n =
0.1
01 ±
0.0
19
Co-
Cr-
Mo
CoC
rMo:
N
A
• R
olli
ng-s
lidi
ng w
ear
and
NA
M
cKel
lop
et a
l. (1
978)
(P
rota
sul-
2)
fric
tion
appa
ratu
s +
UH
MW
PE
0.
1 m
g/20
h •
Vel
ocit
y •
25 m
lmin
U
HM
WP
E:
• P
ress
ure
= 3
0 N
/cm
2
1 m
g/20
h •
Dur
atio
n: 2
0 h
• D
ry c
ondi
tion
•
Roo
m t
empe
ratu
re
Co-
Cr-
Mo
0.5
mm
/yr
NA
•
Pin
-on-
disk
S
moo
th p
olym
er,
met
al
Tat
eish
i et
al.,
(19
89)
(hot
pre
ssed
) •
Lub
: bo
vine
ser
um
-sc
ratc
hes.
+
UH
MW
PE
•
Dur
atio
n: 2
yrs
tes
t •
Loa
d =
3.4
5 M
Pa
• V
eloc
ity
= 5
0 x
106
mm
lyr
.28
-32
° C
Co-
Cr
1.05
mg/
106
NA
•
Pin
-on-
flat
T
rans
fer
of P
E t
o C
o-C
r S
aikk
o (1
993)
+
UH
MW
PE
cy
cles
•
Lub
: di
still
ed,
deio
nize
d w
ater
Su
rfac
e.
.Co
nta
ct p
ress
ure:
4.8
MP
a A
dhes
ive
wea
r.
• F
requ
ency
= 1
Hz
• Sl
idin
g di
st.
= 5
0 m
m
.37
.1 °
C

Tab
le 7
.7
Con
tinu
ed
Mat
eria
l W
ear
Con
tact
W
ear
rate
C
oeff
icie
nt
Co-
Cr-
Mo
Mac
hine
d N
A
(pas
siva
ted)
U
HM
WP
E:
+ U
HM
WP
E
3.23
inl
in x
10-
9
(HiF
ax 1
900)
M
olde
d U
HM
WP
E:
1.50
inl
in x
10-
9
Co-
Cr-
Mo
UH
MW
PE
: N
A
+ U
HM
WP
E
0.17
mm
3 /10
6
cycl
es
0.55
fL
mly
ear
Co
-Cr-
Mo
U
HM
WP
E:
NA
+
UH
MW
PE
68
mg/
106
cycl
es
Co-
Cr-
Mo
Max
. de
pth
NA
+
UH
MW
PE
of
wea
r:
(Cha
rnle
y-0.
08m
m
Mul
ler)
Tri
bolo
gica
l C
ondi
tion
s
• A
nnul
ar d
isk
on t
lat
pin
• R
ange
of
mot
ion
= 11
0°
• Sl
idin
g ve
loci
ty =
43.3
in/
min
•
Str
ess
= 50
0 ps
i •
Lub
: R
inge
r's
solu
tion
•
Tw
elve
cha
nnel
fri
ctio
n an
d
wea
r m
achi
ne F
W -1
2 •
Con
form
ing,
tla
t-on
-tla
t co
nfig
urat
ion
• V
eloc
ity
= 10
0 cy
c.lm
in
• P
ress
ure
= 6.
90 M
Pa
• D
urat
ion:
3.7
x 1
06 c
ycle
s •
Lub
: bo
vine
cal
f se
rum
w/5
5 so
dium
azi
de
• T
en s
tati
on h
ip s
imul
ator
•
Ran
ge o
f m
otio
n =
46°
• L
ub:
bovi
ne b
lood
ser
um
@37
°C
• L
oad
= O
scil
lati
ng 0
-203
0 N
•
Fre
quen
cy =
1 H
z •
Dur
atio
n: 1
x 1
06 c
ycle
s
• D
ual
hip
sim
ulat
or
• V
eloc
ity
= 30
cyc
les/
min
•
Loa
d =
250
kg
• D
urat
ion:
100
0 ho
urs
• L
ub:
seru
m
• R
oom
tem
pera
ture
Wea
r M
echa
nism
s
UH
MW
PE
tra
nsfe
r fil
m.
Qua
ntif
icat
ion
of w
ear
sepa
rate
ly f
rom
cre
ep
defo
rmat
ion.
A
dhes
ive/
abra
sive
wea
r em
phas
izes
ove
r fa
tigu
e w
ear.
Ref
eren
ces
Mil
ler
et a
l. (1
974)
McK
ello
p (1
981)
Hig
hly
load
ed r
egio
n of
E
yere
r et
at.
(198
7)
UH
MW
PE
sm
ooth
&
shin
y.
Pee
ling
. P
itti
ng.
Evi
denc
e of
bri
ttle
fra
ctur
e.
Sim
on e
t al
. (1
973)

Tab
le 7
.7
Con
tinu
ed
Mat
eria
l W
ear
Con
tact
W
ear
rate
C
oeff
icie
nt
Tri
bolo
gica
l C
ondi
tion
s W
ear
Mec
hani
sms
Ref
eren
ces
Co-
Cr-
Mo
0.15
mm
J1.8
x106
N
A
• H
ip j
oint
sim
ulat
or
Cre
ep,
abra
sion
, ad
hesi
on.
Wei
ghtm
an e
t al
. +
UH
MW
PE
cy
cles
•
2.5
kN s
tati
c lo
ad
Max
cup
wea
r de
pth.
(1
972)
(C
harn
ley)
•
Lub
: bo
vine
ser
um
• D
urat
ion:
1.8
x 1
06 cy
cles
•
Vel
ocit
y =
30cy
cles
/min
Co-
Cr-
Mo
0.07
5 m
m/
NA
•
Hip
joi
nt s
imul
ator
C
reep
, ab
rasi
on,
adhe
sion
. W
eigh
tman
et
al.
+ U
HM
WP
E
1.8x
106
cycl
es
• 2.
5 kN
sta
tic
load
M
ax c
up w
ear
dept
h.
(197
2)
(Cha
rnle
y-•
Lub
: bo
vine
ser
um
Mul
ler)
•
Dur
atio
n: 1
.8x1
06 cy
cles
•
Vel
ocit
y =
30cy
cles
/min
Co-
Cr-
Mo
1.8
mg/
105
NA
•
Kne
e jo
int
sim
ulat
or
Cre
ep a
nd f
atig
ue c
rack
s R
ose
et a
l. (1
984)
+
UH
MW
PE
cy
cles
•
700
lb p
eak
load
ev
iden
t. (D
uo-P
atel
la)
• V
eloc
ity
= 33
cyc
les/
min
•
Dur
atio
n: 1
05 c
ycle
s •
Lub
: do
uble
spu
n bo
vine
se
rum
Co-
Cr-
Mo
1.1
mg/
105
NA
•
Kne
e jo
int
sim
ulat
or
Cre
ep a
nd f
atig
ue c
rack
s R
ose
et a
l. (1
984)
+
UH
MW
PE
cy
cles
•
700
lb p
eak
load
ev
iden
t. (E
wal
d)
• V
eloc
ity
= 33
cyc
les/
min
•
Dur
atio
n: 1
05 c
ycle
s •
Lub
: do
uble
spu
n bo
vine
se
rum
Co-
Cr-
Mo
0.3
mg/
105
NA
•
Kne
e jo
int
sim
ulat
or
Cre
ep a
nd f
atig
ue c
rack
s R
ose
et a
l. (1
984)
+
UH
MW
PE
•
700
lb p
eak
load
ev
iden
t. (S
pher
ocen
tric
) •
Vel
ocit
y =
33 c
ycle
s/m
in
• D
urat
ion:
105
cyc
les
• L
ub:
doub
le s
pun
bovi
ne
seru
m

Tab
le 7
.7
Con
tinu
ed
Mat
eria
l W
ear
Con
tact
W
ear
rate
C
oeff
icie
nt
Tri
bolo
gica
l C
ondi
tion
s W
ear
Mec
hani
sms
Ref
eren
ces
Co-
Cr-
Mo
0.4
mg/
105
NA
•
Kne
e jo
int
sim
ulat
or
Cre
ep a
nd f
atig
ue c
rack
s R
ose
et a
l. (1
984)
+
UH
MW
PE
cy
cles
•
700
lb p
eak
load
ev
iden
t. (G
eom
edic
) •
Vel
ocity
= 33
cyc
les/
min
•
Dur
atio
n: 1
05 c
ycle
s •
Lub
: do
uble
spu
n bo
vine
se
rum
Co-
Cr-
Mo
0.3
mg/
105
NA
K
nee
join
t si
mul
ator
C
reep
and
fat
igue
cra
cks
Ros
e et
al.
(198
4)
+ U
HM
WP
E
cycl
es
• 70
0 lb
pea
k lo
ad
evid
ent.
(Geo
met
ric)
•
Vel
ocity
= 33
cyc
les/
min
•
Dur
atio
n =
lOS
cycl
es
• L
ub:
doub
le s
pun
bovi
ne
seru
m
Ti-
6AI-
4V
0.47
mg/
106
NA
•
Pin
-on-
flat
S
urfa
ce s
crat
chin
g.
Tat
eish
i et
al.
(198
9)
+ U
HM
WP
E
cycl
es
• A
xial
loa
d =
223
N
• D
urat
ion:
250
000
cyc
les
• L
ub:
bovi
ne s
erum
Ti-
6AI-
4V
0.3
mm
lyr
NA
•
Pin
-on-
disk
A
bras
ion
by c
emen
t M
cKel
iop
et a
l. (1
978)
+
UH
MW
PE
•
Lub
: bo
vine
ser
um
part
icle
s.
• D
urat
ion:
2 y
rs t
est
• L
oad
= 3.
45 M
Pa
• V
eloc
ity
= 50
x106
mm
lyr
.28
-32
DC
Ti-
6AI-
4V P
ins
PE
thi
ckne
ss
NA
•
Rec
ipro
cati
ng p
in-o
n-fl
at
Adh
esiv
e tr
ansf
er o
f P
E o
n Po
ggie
et
al.
(199
2)
+ U
HM
WP
E
chan
ge:
• S
teri
lize
d w
ith 2
.5 M
rad
cylin
ders
. O
xida
tive
wea
r G
UR
415
59
± 1
2 fL
m
• L
ub:
deio
nize
d w
ater
of
Ti-
6AI-
4V.
plat
e •
36 M
Pa
Lin
e co
ntac
t st
ress
A
bras
ive
wea
r of
PE
. •
Fre
quen
cy =
2.1
Hz
• S
trok
e le
ngth
= 15
mm
•
Dur
atio
n =
2 x
106
cycl
es
• F
inal
fri
ctio
n =
0.11
2 ±
0.0
07

Tab
le 7
.7
Con
tinu
ed
Mat
eria
l W
ear
Con
tact
W
ear
rate
C
oeff
icie
nt
Tri
bolo
gica
l C
ondi
tion
s W
ear
Mec
hani
sms
Ref
eren
ces
Ti-
6AI-
4V
0.9m
m1y
r N
A
• P
in-o
n-di
sk
No
scra
tche
s pr
esen
t.
McK
ello
p et
al.
(197
8)
(nit
ride
d)
• L
ub:
bovi
ne s
erum
+
UH
MW
PE
•
Dur
atio
n: 2
yrs
tes
t •
Loa
d =
3.4
5 M
Pa
• V
eloc
ity
= 5
0x10
6 m
mly
r •
28-3
2 °C
Ti-
6AI-
4V
Mac
hine
d N
A
• A
nnul
ar d
isk
on f
lat
pin
UH
MW
PE
tra
nsfe
r fil
m.
Mil
ler
et a
l. (1
974)
(p
assi
vate
d)
UH
MW
PE
: •
Ran
ge o
f m
otio
n =
110
° +
UH
MW
PE
0.
84-2
.07
• Sl
idin
g ve
loci
ty =
43.
3 in
/min
(H
iFax
190
0)
in/in
x 1
0-9
• S
tres
s =
500
psi
•
Lub
: R
inge
r's s
olut
ion
Ti-
6AI-
4V
Mac
hine
d N
A
• A
nnul
ar d
isk
on f
lat
pin
UH
MW
PE
tra
nsfe
r fil
m.
Mil
ler
et a
l. (1
974)
(n
itri
ded)
U
HM
WP
E:
• R
ange
of
mot
ion
= 1
10°
+ U
HM
WP
E
1.83
in/
in x
10-
9 •
Slid
ing
velo
city
= 4
3.3
in/m
in
(HiF
ax 1
900)
•
Str
ess
= 5
00 p
si
• L
ub:
Rin
ger's
sol
utio
n
Ti-
6Al-
4V
Mac
hine
d N
A
• A
nnul
ar d
isk
on f
lat
pin
UH
MW
PE
tra
nsfe
r fi
lm.
Mil
ler
et a
l. (1
974)
(n
ot p
assi
vate
d)U
HM
WP
E:
• R
ange
of
mot
ion
= 1
10°
+U
HM
WP
E
1.55
in/
in x
10-
9 •
Slid
ing
velo
city
= 4
3.3
in/m
in
(HiF
ax 1
900)
•
Stre
ss:
500
psi
• L
ub:
Rin
ger'
s so
luti
on
Ti-
6AI-
4V
0.04
-0.1
1 N
A
• R
ecip
roca
ting
fla
t-on
-fla
t S
urfa
ce s
crat
chin
g.
McK
ello
p et
al.
(198
1)
+ U
HM
WP
E
mm
3 /106
•
Loa
d =
445
N
• V
eloc
ity
= 1
00cy
cles
/min
•
Lub
: bo
vine
ser
um
• D
urat
ion:
4.1
x 1
06 c
ycle
s

Tab
le 7
.7
Co
nti
nu
ed
Mat
eria
l W
ear
Con
tact
W
ear
rate
C
oeff
icie
nt
Tri
bolo
gica
l C
ondi
tion
s W
ear
Mec
hani
sms
Ref
eren
ces
Ti-
6Al-
4V
NA
1.
9 x
10-7
•
Bal
l an
d so
cket
sim
ulat
or
Uni
form
sup
erfi
cial
M
cKel
lop
& R
ostl
iind
(i
mpl
ante
d w
ith
mm
3 IN
m
• R
a <
0_0
16
scra
tche
s, o
ccas
iona
l (1
990)
ni
trog
en)
• S
teri
lize
d w
i 2_
5Mra
d g
rad
de
eper
mar
ks_
+ U
HM
WP
E
• L
ub:
bovi
ne s
erum
wi
Met
al p
arti
cles
, ac
rylic
so
dium
azi
de
cem
ent
part
icle
s_
• L
oad
= 20
00 N
•
Spe
ed =
100
mrn
Isec
Ti-
6AI-
4V
NA
1.
98x1
0-7
• B
all
and
sock
et s
imul
ator
U
nifo
rm s
uper
fici
al
McK
ello
p &
Ros
tlii
nd
(con
vent
iona
l)
mm
3 IN
m
• R
a <
0_0
16
scra
tche
s, o
ccas
iona
l (1
990)
+
UH
MW
PE
•
Ste
rili
zed
wi
2.5M
rad
gra
d
deep
er m
arks
_ •
Lub
: bo
vine
ser
um w
i M
etal
par
ticl
es,
acry
lic
sodi
um a
zide
ce
men
t pa
rtic
les_
•
Loa
d =
2000
N
• S
peed
= 10
0 m
mls
ec
Alu
min
a N
A
18.2
x 1
0-7
• P
in-o
n-di
sk
Ori
gina
l m
achi
ne m
arks
K
umar
et
al.
(199
1)
+ U
HM
WP
E
mm
3 IN
m
• L
ub:
bovi
ne s
erum
, 40
--50
ml
wor
n, s
moo
ther
. •
Loa
d =
3 M
Pa
• V
eloc
ity
= 60
mm
ls
.24
-26
°C
Alu
min
a 0.
26 m
g/10
6 N
A
• P
in-o
n-fl
at
NA
M
cKel
lop
et a
l_ (1
981)
+
UH
MW
PE
cy
cles
•
Axi
al l
oad
= 22
3 N
•
Dur
atio
n: 2
5000
0 cy
cles
•
Lub
: bo
vine
ser
um
Alu
min
a 0_
04 m
g/10
6 N
A
• P
in-o
n-fl
at
Min
imal
wea
r_
Sai
kko
(199
3)
+U
HM
WP
E
cycl
es
• L
ub:
dist
ille
d, d
eion
ized
wat
er
• C
onta
ct p
ress
ure:
4_8
MP
a •
Fre
quen
cy =
1 H
z •
Slid
ing
dist_
= 50
mm
.3
7_
1°C

Tab
le 7
.7
Co
nti
nu
ed
Mat
eria
l C
onta
ct
Alu
min
a +
UH
MW
PE
Zir
coni
a +
UH
MW
PE
Wea
r ra
te
Alu
min
a:
0.1
mg/
20h
UH
MW
PE
: 0.
1 m
g/20
h
0.03
mg/
106
cycl
es
Solid
ytr
ria
PE
thi
ckne
ss
ZrO
z pi
ns
chan
ge:
+ U
HM
WP
E
33 ±
13
f.Lm
GU
R 4
15 p
late
ZrO
z su
rfac
e o
n Z
r-2.
5Nb
pins
+
UH
MW
PE
G
UR
415
pla
te P
e th
ickn
ess
chan
ge:
25
±20
f.Lm
Wea
r C
oeff
icie
nt
Tri
bolo
gica
l C
ondi
tion
s W
ear
Mec
hani
sms
NA
•
Rol
ling
-sli
ding
wea
r an
d N
A
fric
tion
app
arat
us
• V
eloc
ity
= 25
mlm
in
• pr
essu
re =
30 N
/cm
z •
Dur
atio
n: 2
0 h
• D
ry c
ondi
tion
•
Roo
m t
empe
ratu
re
NA
•
Pin
on
fia
t M
inim
al w
ear.
•
Lub
: di
stil
led,
dei
oniz
ed w
ater
•
Con
tact
pre
ssur
e: 4
.S M
Pa
• F
requ
ency
= 1
Hz
• S
lidi
ng d
ist.
= 5
0 m
m
.37
.1°C
Ref
eren
ces
Sem
lits
ch e
t at
. (1
977)
Sai
kko
(199
3)
NA
R
ecip
roca
ting
pin
-on-
fiat
A
bras
ive
wea
r fr
om t
he
Pog
gie
et a
l. (1
992)
•
Ste
rili
zed
wit
h 2.
5 M
rad
• L
ub:
deio
nize
d w
ater
•
36 M
Pa
Lin
e co
ntac
t st
ress
•
Fre
quen
cy =
2.1
Hz
• S
trok
e le
ngth
= 15
mm
•
Dur
atio
n =
2 x
106
cycl
es
• F
inal
fri
ctio
n =
0.0
33 ±
0.0
05
NA
•
Rec
ipro
cati
ng p
in-o
n-fi
at
• S
teri
lize
d w
ith
2.5
Mra
d •
Lub
: de
ioni
zed
wat
er
• 36
MP
a L
ine
cont
act
stre
ss
• F
requ
ency
= 2
.1 H
z •
Str
oke
leng
th =
15 m
m
• D
urat
ion
= 2
x 10
6 cy
cles
•
Fin
al f
rict
ion
= 0.
040
± O
.OOS
surf
ace
roug
hnes
s ch
arac
teri
stic
and
adh
esiv
e w
ear.
Abr
asiv
e w
ear
from
the
su
rfac
e ro
ughn
ess
char
acte
rist
ics
and
adhe
sive
wea
r.
Pogg
ie e
t at
. (1
992)
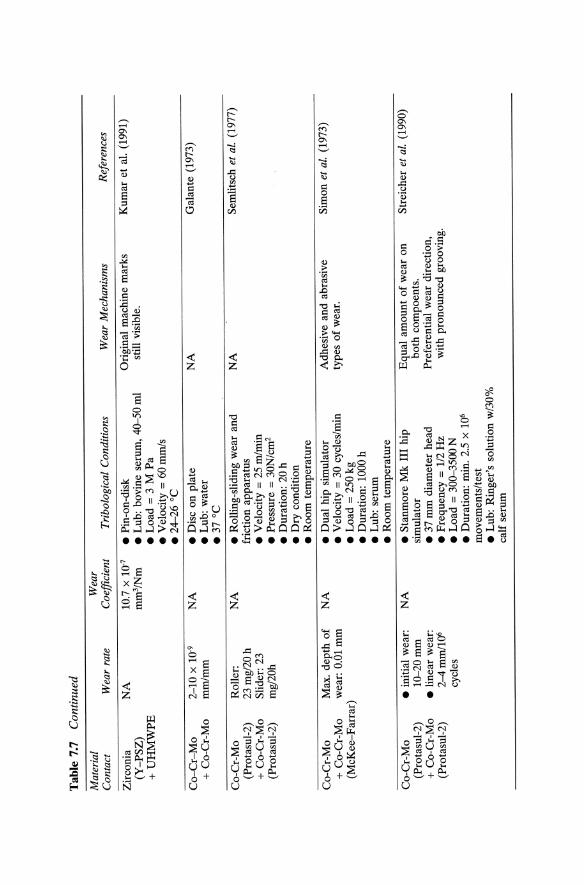
Tab
le 7
.7
Co
nti
nu
ed
Mat
eria
l C
onta
ct
Zir
coni
a (Y
-PS
Z)
+ U
HM
WP
E
Co
-Cr-
Mo
+
Co-
Cr-
Mo
Co-
Cr-
Mo
(Pro
tasu
l-2)
+
Co-
Cr-
Mo
(Pro
tasu
l-2)
Wea
r ra
te
NA
2-10
X 1
0-9
mm
lmm
Rol
ler:
23
mg
/20
h
Slid
er:
23
mg/
20h
Co-
Cr-
Mo
Max
. de
pth
of
+ C
o-C
r-M
o w
ear:
0.0
1 m
m
(McK
ee-F
arra
r)
Co-
Cr-
Mo
(Pro
tasu
l-2)
+
Co-
Cr-
Mo
(Pro
tasu
l-2)
• in
itia
l w
ear:
1
0-2
0m
m
• li
near
wea
r:
2-4m
m11
06
cycl
es
Wea
r C
oeff
icie
nt
10.7
X 1
0-7
mm
3 /N
m
NA
NA
NA
NA
Tri
bolo
gica
l C
ondi
tion
s
• P
in-o
n-di
sk
• L
ub:
bovi
ne s
erum
, 40
-50
ml
• L
oad
= 3
M P
a •
Ve1
0city
= 60
mm
ls
.24
-26
°C
• D
isc
on p
late
•
Lub
: w
ater
.3
7°C
• R
olli
ng-s
lidi
ng w
ear
and
fric
tion
app
arat
us
• V
eloc
ity
= 2
5 m
lrni
n •
Pre
ssur
e =
30N
/cm
2
• D
urat
ion:
20
h •
Dry
con
diti
on
• R
oom
tem
pera
ture
• D
ual
hip
sim
ulat
or
• V
eloc
ity
= 3
0 cy
cles
/min
•
Loa
d =
250
kg
• D
urat
ion:
100
0 h
• L
ub:
seru
m
• R
oom
tem
pera
ture
• S
tanm
ore
Mk
III
hip
sim
ulat
or
• 37
mm
dia
met
er h
ead
• F
requ
ency
= 1
/2 H
z •
Loa
d =
300
-350
0 N
•
Dur
atio
n: m
in.
2.5
x 10
6
mov
emen
ts/t
est
• L
ub:
Rin
ger'
s so
luti
on w
/30
%
calf
ser
um
Wea
r M
echa
nism
s
Ori
gina
l m
achi
ne m
arks
st
ill v
isib
le.
NA
Ref
eren
ces
Kum
ar e
t al
. (1
991)
Gal
ante
(19
73)
NA
S
emli
tsch
et
at.
(197
7)
Adh
esiv
e an
d ab
rasi
ve
Sim
on e
t af
. (1
973)
ty
pes
of
wea
r.
Equ
al a
mou
nt o
f w
ear
on
S
trei
cher
et
at.
(199
0)
both
com
poen
ts.
Pre
fere
ntia
l w
ear
dire
ctio
n,
wit
h pr
onou
nced
gro
ovin
g.

Tab
le 7
.7
Con
tinu
ed
Mat
eria
l W
ear
Con
tact
W
ear
rate
C
oeff
icie
nt
Tri
bolo
gica
l C
ondi
tion
s W
ear
Mec
hani
sms
Ref
eren
ces
Co
-Cr-
Mo
O
.01
3m
ml
NA
•
Hip
joi
nt s
imul
ator
A
bras
ion,
scr
atch
ing.
W
eigh
tman
et
al.
+ C
o-C
r-M
o 1.
8x10
6 cy
cles
•
2.5
kN s
tati
c lo
ad
Max
cup
wea
r de
pth.
(1
972)
(M
cKee
-Far
rar)
•
Lub
: bo
vine
ser
um
• D
urat
ion:
1.8
x106
cyc
les
• V
eloc
ity
== 30
cyc
les/
min
Co-
Cr-
Mo
• in
itia
l w
ear:
N
A
• S
tanm
ore
Mk
III
hip
Equ
al a
mou
nt o
f w
ear
on
Bou
tin
(197
2)
(Pro
tasu
l-21
WF
) 1
0-2
0m
m
sim
ulat
or
both
com
pone
nts.
+
Co-
Cr-
Mo
• li
near
wea
r:
• 28
& 3
2 m
m h
eads
P
refe
rent
ial
wea
r di
rect
ion,
(P
rota
sul-
21 W
F)
2-4
mm
/10
6 •
Fre
quen
cy =
= 11
12 H
z w
ith
pron
ounc
ed g
roov
ing.
cy
cles
•
Loa
d ==
300-
3500
N
• D
urat
ion:
min
. 2.
5x10
6
mov
emen
ts/t
est
• L
ub:
Rin
ger'
s so
luti
on
w/3
0%
cal
f se
rum
Alu
min
a 1.
2xlO
-7 m
m/m
m
NA
•
Dis
c on
pla
te
NA
S
emli
tsch
et
at.
(197
7)
+ a
lum
ina
• L
ub:
wat
er
.37
°C
Sta
inle
ss s
teel
2
.26
mm
/yr
3.4x
10-5
•
Pin
-on-
flat
N
o cr
eep.
D
owso
n &
Wal
lbri
dge
(316
S16
) m
m3 I
Nm
•
Lub
: bo
vine
ser
um
Par
ticl
es p
rese
nt.
(198
5)
+ P
TF
E
• R
a ==
O.O
mm
•
Load
==40
nlp
in
• S
peed
= 2
P r
ad/s
•
Sli
ding
dis
t. =
0.24
mls
Sta
inle
ss S
teel
31
mm
lyr
NA
•
Pin
-on-
flat
N
A
Cla
rke
(198
2)
+ D
elri
n 50
0 •
Vel
ocit
y ==
100
mm
lsec
•
Loa
d =
6.9
N/m
m2
• L
ub:
seru
m
• R
oo
m t
empe
ratu
re
• 4.
8 yr
s ef
fect
ive
use

Tab
le 7
.7
Con
tinu
ed
Mat
eria
l W
ear
Con
tact
W
ear
rate
C
oeff
icie
nt
Sta
inle
ss s
teel
52
1 m
m/y
r N
A
+ P
olye
ster
Stai
nles
s st
eel
(mg/
cyc)
N
A
+ A
lum
ina
SS:
176,
146
, (P
rote
k)
212
AlZ
03:
0.3,
2.
1,0.
2
Sta
inle
ss s
teel
(m
g/cy
c)
NA
+
Alu
min
a SS
: 50
.9,
62.4
, (T
hack
ray)
46
.0
.22
.2 m
m
Alz
03:
0.8,
he
ad
1.0,
0.7
Co-
Cr-
Mo
(mg/
cyc)
N
A
+ A
lum
ina
CoC
rMo:
39.
7,
(Lin
k)
48.2
.94.
0 A
lz03
: 1.
5,
0.5,
0.0
Tri
bolo
gica
l C
ondi
tion
s
• Pi
n-on
-fia
t •
Vel
ocit
y =
100
mm
lsec
•
Loa
d =
6.9
N/m
mz
• L
ub:
seru
m
• R
oom
tem
pera
ture
•
4.8
yrs
effe
ctiv
e us
e
• Fi
ve s
tati
on h
ip s
imul
ator
(H
elsi
nski
) •
32
mm
hea
d •
Fre
quen
cy =
1.08
SH
3 •
Loa
d =
35 k
N
• D
urat
ion:
3x1
06 c
ycle
s •
Lub
: di
still
ed,
deio
nize
d w
ater
.3
7 °
C
• F
ive
stat
ion
hip
sim
ulat
or
(Hel
sins
ki)
• F
requ
ency
= 1
.08 s~
• L
oad
= 3
5k
N
• D
urat
ion:
3xI
Q6
cycl
es
• L
ub:
dist
illed
, de
ioni
zed
wat
er
.37
°C
• Fi
ve s
tati
on h
ip s
imul
ator
(H
elsi
nski
) .3
2 m
m h
ead
• F
requ
ency
= 1
.08
SH3
• L
oad
= 35
kN
•
Dur
atio
n: 3
xIQ
6 cy
cles
•
Lub
: di
still
ed,
deio
nize
d w
ater
.3
7 °
C
Wea
r M
echa
nism
s
NA
Cor
rosi
on o
f st
ainl
ess
stee
l he
ads.
Cor
rosi
on o
f st
ainl
ess
stee
l he
ads.
NA
Ref
eren
ces
Cla
rke
(198
2)
Sai
kko
et a
l. (1
992)
Sai
kko
et a
l. (1
992)
Sai
kko
et a
l. (1
992)

Tab
le 7
.7
Con
tinu
ed
Mat
eria
l C
onta
ct
Co
-Cr-
Mo
+
Alu
min
a (H
owm
edic
a)
Co
-Cr-
Mo
+
Del
rin
550
Si3N
4
+ U
HM
WP
E
* L
ub =
lub
rica
nt.
Wea
r ra
te
(mgl
cyc)
C
oCrM
o:
2.6,
4.7,
4.3
A1 2
03:
0.
1,
0.0,
0.0
37.5
mm
/yr
0.27
mg/
106
cycl
es
Wea
r C
oeff
icie
nt
NA
NA
NA
Tri
bolo
gica
l C
ondi
tion
s
• F
ive
stat
ion
hip
sim
ulat
or·
(Hel
sins
ki)
.32
mm
hea
d •
Fre
quen
cy =
1.0
8 S
H3
• L
oad
= 3
5 kN
•
Dur
atio
n: 3
x106
cyc
les
• L
ub:
dist
illed
, de
ioni
zed
wat
er
.37
°C
•
Dis
k-on
-fla
t •
Vel
ocit
y =
106
mm
/sec
•
Loa
d =
3.7
N/m
m2
• L
ub:
wat
er
.37
°C
•
Pin
on
flat
•
Lub
: di
still
ed,
deio
nize
d w
ater
•
Con
tact
pre
ssur
e: 4
.8 M
Pa
• F
requ
ency
= 1
Hz
• Sl
idin
g di
st.
= 5
0 m
m
.37
.1°C
Wea
r M
echa
nism
s R
efer
ence
s
NA
S
aikk
o et
at.
(199
2)
NA
C
lark
e (1
982)
NA
S
aikk
o (1
993)

L-___________ C_O_M __ B_IN_E_D __ W_E_A __ R_A_N_D __ F_A_T_IG_V __ E __________ ~I I 393
7.3 CLINICAL WEAR
Methods have been proposed by Griffith et al. (1978) and Deavane et al. (1995) to radiographically measure linear wear in UHMWPE acetabular cups of total hip replacements. The overall penetration of a femoral head (Tables 7.8 and 7.9) into a UHMWPE acetabular cup is a consequence of both creep and wear, where creep is predominantly observed for the first million loading cycles (Dowson, 1995). Atkinson et al. (1980) estimated that the total UHMWPE residual compression due to creep in total hip replacements after x can be estimated by:
Residual compression = 94 + 33 (x-I) fLm
This relationship has served as a guide to the significance of UHMWPE creep for total hip arthroplasty (Dowson, 1995). Another important issue in the tribological behavior of polymers used as bearing surfaces is their viscoelastic-plastic character. For example, due to this time dependent stress-strain response, the measured hardness varies continuously as a function of indentation time. Therefore, in certain conditions the wear behavior of these materials cannot accurately be characterized in terms of wear coefficient alone and is often defined in terms of wear factor and Pv limit. The wear factor is described as K' = VIPS = V/Pvt where V is the wear volume, v the sliding velocity, P the normal load, and t the sliding time. The Pv limit or factor (which is equal to load times velocity) defines the onset of failure of polymeric surfaces. Pv limits have to be specified in terms of a limiting load at a given sliding velocity or limiting velocity at a given load. These values will depend on the test conditions (Suh, 1986).
7.4 COMBINED WEAR AND FATIGUE
Materials used in the design of medical devices are SUbjected to high stresses and high cycle loading. This very demanding loading condition results in failure of metals, ceramics, and polymers. The fatigue process depends on stress rather than load, therefore partly explaining the success of congruent total hip replacements and thick polymeric bearing components (7-10 mm thick) which allows for a larger contact area (Black, 1988). Fatigue cracking of polymers such as UHMWPE results in delamination wear following crack growth. In a corrosive environment like the human body, the fatigue wear process of metal surfaces will be coupled with corrosive wear since tensile stress increases chemical reactivity. Fretting wear caused by micromotion is commonly observed in implants. Modular implants used in orthopaedics are potentially degraded by fretting corrosion/wear which plays a deleterious role in the degradation process of

394 1 1--1 _________ WE_A_R ________ ---'
Table 7.S Clinical Penetration into UHMWPE Cups for Metallic Femoral Heads
Reference
Griffith et ai., 1978
Livermore et al., 1990
Isaac et ai., 1992
UHMWPE penetration rate
• 0.07 mmlyear average (range 0.06 mmlyear to 0.24 mmlyear)
• 0.13 mmlyr average (range 0 to 0.39 mmlyear) for 22 mm head size
• 0.08 mmlyr average (range 0 to 0.3 mmlyear) for 28 mm head size
• 0.10 mmlyr average (range 0 to 0.32 mm/year) for 32 mm head size
• 0.21 mmlyear (range 0.005 to 0.6 mmlyear)
Wroblewski et al., • 0.022 mm/year (range 1992 0.010 to 0.034 mmlyear)
Clinical
491 acetabular cups 8.3 year follow-up (range 7 to 9 years)
Follow-up at least 9.5 years after implantation (227 of the 22 mm femoral head size; 98 of the 28 mm size; and 60 of the 32 mm head size)
87 acetabular cups 9 year service life (range <1 to 17.5 years)
Four explained acetabular cups with no apparent deterioration of the finish of the femoral head 20 year mean service life (range 17 years to 23 years)
Table 7.9 Clinical Penetration into UHMWPE Cups for Alumina Ceramic Heads
Reference
Oonshi et al., 1989
Oonshi et ai., 1989
Okumura et ai., 1990 Egli et al., 1990
Femoral Head A verage Penetration Rate
Alumina 0.098 mmlyear (6 year follow-up; 28-mm cups)
Alumina 0.072 mmlyear (g irradiated UHMWPE) (6 year follow-up; 28-mm cups) Alumina 0.084 mmlyear Alumina 0.080 mmlyear
(38 acetabular cups over a period of 6.7 years)
Zichner and Willert, Alumina 1992
0.100 mmlyear
articulating surfaces. Hoeppner and Chandrasekaran (1994) reviewed the fretting of orthopaedic implants and its implication in implant failure emphasizing the complexity of implant surface change in use.
7.5 SOLVING THE WEAR PROBLEM
Historically, the evaluation of the tribological behavior of biomaterials has resulted in the development of new materials or the use of surface

~ _________________ CO_N_C_L_U_S_IO_N ________________ ~I I 395
treatments to improve their frictional and wear properties (Long and Rack, 1996). As such, the assessment of the poor tribological properties of Ti-6AI-4V as compared to other metallic bearing alloys (e.g. Co-Cr alloys) articulating against UHMWPE has triggered the use of surface treatments to enhance the hardness and the wear resistance of the alloy. Among numerous processes including plasma vapor deposition (PVD) coating (TiN, TiC) and thermal treatments (nitriding, surface hardening), ion implantation (N+) has been the most widely accepted surface treatment. Table 7.10 reports friction and wear data obtained for treated Ti alloys.
Another approach to improve the wear performance of total joint replacements is through lubrication optimization. In this respect, the use of elastomeric bearing surfaces (Table 7.3), also known as cushion bearings, has been proposed (Table 7.11). Despites providing an improved lubrication in simulated physiological conditions through elastohydrodynamic lubrication (Auger et aI., 1993; Graham et aI., 1995; Auger et ai., 1995), these materials have shown a poor fatigue behavior both in vivo and in vitro (LaBerge et aI., 1991; Chow et ai., 1994; Caravia et ai., 1993). However, only limited data on wear performance and wear mechanisms of cushion bearings are available (Table 7.11).
7.6 CONCLUSION
The wear and frictional properties of materials are dependent on tribological conditions of the tribosystem. Their investigation involves many parameters such as wear rate, wear mechanisms, transition between initial and steady-state wear, and generation and geometry of wear debris. The physical and mechanical properties of the materials, the environmental and operating conditions, and the geometry of the wearing bodies are determining factors for these parameters. Another important tribological attribute that should be reported along with wear data is the coefficient of friction. The use of different lubricants combined with the operating conditions (load, velocity) will result in different coefficients of friction and consequently different lubrication mechanisms of the tribosystem. The wear mechanisms and wear data are partly governed by the lubrication of the tribosystem.
By definition, a tribosystem is a dynamic system that can potentially change over time emphasizing the importance of wear monitoring during testing. It is of utmost importance to fully define and report the tribological conditions during testing. The confidence in the quality of the wear data is not only related to the tribological conditions, material properties, material combinations, and experimental method including device used for testing, but also to the number of tests conducted and number of specimens evaluated, level of statistical significance, and duration of

Tab
le 7
.10
Fri
ctio
n an
d W
ear
Dat
a fo
r T
itan
ium
Ort
hopa
edic
Allo
ys
A v
aila
bie
Tri
boio
gica
i T
itan
ium
all
oy
Con
diti
ons
Fri
ctio
n D
ata
Wea
r D
ata
Ref
eren
ce
Ti-
6AI-
7Nb
• P
in-o
n-di
sk
Fri
ctio
n co
effi
cien
t k
= 3
.32
X 10
7 (N
+)
Sem
litsc
h et
ai.,
199
2 •
Lub
: 30
% s
erum
0.
100
(N+
) k
= 2
.11
X 10
7 (T
iN)
• A
bras
ive
PM
MA
pin
0.
078
(TiN
) k
= 1
.35
X 10
7 (O
DH
) •
3.45
MP
a/ 2
5 m
m/s
ec
0.05
1 (O
xyge
n D
iffu
sion
ha
rden
ing
(OD
H»
Ti5
AI-
2.5F
e •
pin-
on-d
isk
NA
de
pth
of w
ear
trac
k on
dis
c Z
wic
ker
et a
i., 1
985
.0.9
% N
aC1
18-4
4 ,...
.m (
poli
shed
met
al)
• U
HM
WP
E d
isk
12-2
4 ,...
.m (
oxid
ized
met
al)
.50
N
Ti5
AI-
2.5F
e •
Bal
l-in
-soc
ket
Fri
ctio
n m
omen
t 0.
5-1.
0 Z
wic
ker
et a
i., 1
985
.0.9
% N
aCI
Nm
(ox
idiz
ed,
indu
ctio
n •
UH
MW
PE
soc
ket
hard
ened
) .1
00
-25
00
N
Ti-
15M
o-5Z
r-3A
1 •
NaC
1 so
luti
on
Fri
ctio
n co
effi
cien
t 0.
82
3 ti
mes
tha
t of
sta
inle
ss
Ste
inem
ann
et a
i.,
([3 a
lloy)
st
eel
316L
19
93
Ti-
12M
o-6Z
r-2F
e •
Pin-
on-d
isk
Fri
ctio
n co
effi
cien
t N
A
Wan
g et
ai.,
199
3 •
Dei
oniz
ed w
ater
0.
30-0
.44
• A
bras
ive
PM
MA
pin
•
100
g/ 7
4 m
m/s
ec
Ti-
12M
o-6Z
r-2F
e •
Pin
-on-
disk
F
rict
ion
coef
fici
ent
0.04
N
A
Wan
g et
ai.,
199
3 •
Dei
oniz
ed w
ater
•
UH
MW
PE
pin
•
500
gI 7
3 m
m/s
ec

Tab
le 7
.10
Con
tinu
ed Ava
ilab
le T
ribo
logi
cal
Tit
aniu
m a
lloy
C
ondi
tion
s F
rict
ion
Dat
a
Ti-
6AI-
4V (
N+
) •
Bal
l-in
-soc
ket
NA
(h
ip s
imul
ator
) •
32 m
m m
etal
bal
l; 'Y
irra
diat
ed
• U
HM
WP
E c
ups
• F
ilte
red
calf
ser
um
• 20
00N
; 1
Hz
• O
ne m
illi
on c
ycle
s
Ti-
6AI-
4V
• B
all-
in-s
ocke
t N
A
(hip
sim
ulat
or)
• 32
mm
met
al b
all;
'Y ir
radi
ated
•
UH
MW
PE
cup
s •
Fil
tere
d ca
lf s
erum
•
2000
N;
1 H
z •
One
mil
lion
cyc
les
Wea
r D
ata
Wea
r ra
te o
f U
HM
WP
E
39.5
± 0
.6 m
m3 /
106
cycl
es
(N +
Ti6
A14
V)
(met
alli
c w
ear
redu
ced
com
pare
d to
co
nven
tion
al T
i6A
14V
)
Wea
r ra
te o
f U
HM
WP
E
38.8
± 1
.0 m
m3 /
106
cycl
es
(Con
vent
iona
l T
i6A
14V
)
Ref
eren
ce
McK
ello
p an
d R
6stli
.ind,
199
0
McK
ello
p an
d R
6stl
tind
, 19
90

Tab
le 7
.11
Tri
bolo
gica
l P
rope
rtie
s of
Com
plia
nt S
urfa
ce M
ater
ials
In
Join
t R
epla
cem
ents
Ela
stom
er (
pin)
Pol
yure
than
e (T
ecof
lex™
EG
93A
)
Tri
bolo
gica
l co
ndit
ions
• 2.
5 m
m t
hick
lay
er
inje
ctio
n m
olde
d on
to
poly
sulf
one
(pin
wit
h a
30 d
egre
e co
ne a
ngle
) •
Sta
inle
ss s
teel
fla
t co
unte
rpar
t (R
A=
0.01
-0.0
25 J
..lm
) •
Tri
-pin
-on-
disk
•
Loa
d: 1
00 N
•
Spe
ed:
0.24
m/s
ec
• S
tres
s: A
ppro
x. 5
MP
a •
Lub
: di
stil
led
wat
er
Coe
ffic
ient
of f
rict
ion
• S
tart
-up
fric
tion
: 0.
2
• S
tead
y-st
ate
fric
tion
: 0.
003-
-0.0
08
Wea
r fa
ctor
• F
or
Ra
met
al o
f 0.
01:
9.2
x 10
-9 m
m3
Nm
•
For
Ra
met
al o
f 0.
02:
8.1
x 10
-8 m
m3
Nm
Ref
eren
ce
Jin
et a
l., 1
993

ADDITIONAL READING
the test. When these parameters are not reported, it is difficult to compare wear data obtained with different protocols. This often leads to an inconclusive analysis and disagreements. In this respect, the standardization of testing protocols for wear of biomaterials and devices as well as how they are reported can significantly improve the wear literature. This literature review clearly indicates that there is no convention for wear-testing systems as well as for reporting wear data.
ACKNOWLEDGEMENTS
The author thanks John Killar, Aude Leroy-Gallissot, Tara McGovern, Jonette M. Rogers, Tracy Tipton, and Jennifer Woodell for their assistance in preparing this chapter.
ADDITIONAL READING
1. Clarke, I.e. and McKellop, H.A. (1986) Wear Testing in Handbook of Biomaterials Evaluation (A.F. von Recum, Ed.) Macmillan Publishing Co., New York. pp. 114-130. A concise review of testing protocols used for wear testing of cardiovascular, orthopaedic, and dental implants. Introduces some of the technical parameters involved in the understanding and measurement of wear performance.
2. Dowson, D. (1995) A comparative study of the performance of metallic and ceramic femoral head components in total replacement hip joints. Wear, 190, 171-183. Historical review of tribological studies of metallic and ceramic bearing surfaces used for total hip arthroplasty (THA). Presents an objective assessment of wear mechanisms, wear measurement, laboratory studies, and clinical observations for THA.
3. Dumbleton, J.H. (1981) Tribology of natural and artificial joints. Elsevier, New York. An excellent critical review of testing parameters and conditions for wear and friction of orthopaedic materials. Includes an in-depth analysis of the polyethylene response to wear testing.
4. McKellop, H., Clarke, I., Markolf, K. and Amstutz, H. (1981) Friction and wear properties of polymer, metal, and ceramic prosthetic joint materials evaluated on a multichannel screening device. 1. Biomed. Mat. Res., 15,619-653. Compilation of laboratory tribological studies of currently used orthopaedic bearing materials. Presents a critical discussion of work by others and that of the authors. Data presented in this manuscript are commonly referred to by the orthopaedic tribology community.
5. Suh, N.P. (1986) Tribophysics., Prentice-Hall, Inc. Englewood Cliffs, NJ. Engineering analysis of friction and wear of materials. Gathers and presents an overview of the author's own work and others on basic engineering principles that should be included in tribological study design and analysis.
399

400 I LI __________________ W_EA_R ________________ ~
REFERENCES
1. Agrawal, CM., Micallef, D.M., Wirth, M.A, Lankford, J., Dearnaley, G. and McCabe, AR. (1993) The effects of diamond-like-carbon coatings on the friction and wear of enhanced UHMWPE-metal couples. Trans 21st Annual Meet of the Society For Biomaterials, Birmingham, AL. 26, 10.
2. Archard, J.F. (1980) Wear theory and mechanisms. in Wear Control Handbook (M.B. Peterson and W.O. Winer, eds) American Society of Mechanical Engineers, New York, pp. 35-80.
3. Atkinson, J.R, Dowling J.M. and Cicek, RZ. (1980) Materials for internal prostheses: the present position and possible future developments. Biomaterials, 1, 89-96.
4. Auger, D.D., Dowson, D., Fisher, J. and Jin, M.Z. (1993) Friction and lubrication in cushion form bearings for artificial hip joints. Proc. 1nstn Mech. Engrs, 207,25-33.
5. Auger, D.D., Dowson, D. and Fisher, J. (1995) Cushion form bearings for total knee joint replacement Part 1: design, friction, and lubrication. Proc. 1nst. Mech. Engrs, 209, 73-81.
6. Black, J. (1988) Orthopaedic Biomaterials in Research and Practice. Churchill Livingstone, NY, p. 255.
7. Boutin, P. (1972) Arthroplastie total de la hanche par prothese en alumina frittee, Revue de Chirurgie Orthopedique et Reparatrice de I'Appareil Moteur, 58,229.
8. Brown, K.J., Atkinson, J.R., Dowson, D. and Wright, V. (1976) The wear of ultra high molecular weight polyethylene and a preliminary study of its relation to the in vivo behaviour of replacement hip joints. Wear, 40, 255-264.
9. Caravia, L., Dowson, D. and Fisher J. (1993) Start up and steady state friction of thin polyurethane layers. Wear, 160, 191-197.
10. Chan, F. W., Medley, J.B., Krygier, J.1., Bobyn, J.D., Podgorsak, G.K. and Tanzer, M. (1996) Wear performance of cobalt-chromium metal-metal bearing surfaces for total hip arthroplasty. Trans. 42nd Annual Meeting of the Orthopaedic Research Society, 21 (2), p. 464.
11. Chow, AB., Medley, J.B. and LaBerge, M. (1994) Mechanical and tribological analyses of elastomeric surface layers in load bearing implants. Trans of 20th Annual Meeting of the Society for Biomaterials, Boston, MA p. 434.
12. Clarke, I.C (1982) Wear-screening and joint simulation studies vs. materials selection and prosthesis design. CRC Crit. Rev. in Biomed. Eng., 8, 29-91.
13. Clarke, I.C and McKellop, H.A (1986) Wear Testing in Handbook of Biomaterials Evaluation. (AF. von Recum Ed.) Macmillan Publishing Co., New York. pp. 114-130.
14. Deavane, P.A, Bourne, RB., Rorabeck, CH., Hardie, RM. and Horne, J.G. (1995) Measurement of polyethylene wear in metal-backed acetabular cups. Clin. Orthop. Ret. Res. 319, 303-316.
15. Dowson, D., El-Hady Diab M.M., Gillis B.J. and Atkinson, J.R (1985) Influence of counterface topography on the wear of ultra high molecular weight polyethylene under wet conditions. Am. Chern. Soc. Symposium Series No. 287, in Polymer wear and its control, Ed. Lieng-Huang Lee. Ch. 12, pp. 171-187.

~ ___________________ R_E_FE_R_E_N __ C_E_S __________________ ~I I 401
16. Dowson, D.B. and Jobbins, B. (1988) Design and development of a Versatile hip joint simulator and a preliminary assessment of wear and creep in Charnley total replacement hip joints, Engineering in Medicine, 17, 111-117.
17. Dowson, D. and Wallbridge N.C. (1985) Laboratory wear tests and clinical observations of the penetration of femoral heads into acetabular cups in total replacement hip joints I: Charnley prosthesis with polytetrafluoroethylene acetabular cups. Wear, 104,203-215.
18. Dowson, D. (1981) Basic Tribology in An Introduction to the Bio-mechanics of Joints and Joint Replacement. Mechanical Engineering Publications, Ltd, London, England, pp. 49-60.
19. Dowson, D. (1995) A comparative study of the performance of metallic and ceramic femoral head components in total replacement hip joints. Wear, 90, 171-183.
20. Dumbleton JH. (1981) Tribology of natural and artificial joints. Elsevier, NY; pp. 94-103, 110-148, 183-214.
21. Egli, A., Weber, B.G., Sieber, H., Semlitsch, M. and Dorre, E. (1990) Experience with the pairing of polyethylene/ceramic materials in hip endoprostheses, Ultra-High Molecular Weight Polyethylene as Biomaterial in Orthopaedic Surgery. (H.-G. Willert, G.H. Bucchorn, and P. Eyerer (eds», Hoffrefe and Huber, Gottingen, pp. 154-158.
22. Eyerer, P., Kurth, M., McKellop, H.A. and Mittimeier, T. (1987) Characterization of UHMWPE Hip cups run on joint simulators, Journal of Biomedical Materials Research 21, 275-291.
23. Fisher, J and Dowson, D. (1991) Tribology of total artificial joints. Proc. Instn Mech. Engrs, 205, 73-79.
24. Galante, J. and Rostoker, W. (1973) Wear in total hip protheses, Acta Orthopaedica Scandinavica (Supplement), 145, 1-46.
25. Graham, RM., Joseph, P.F., Dooley, RL. and LaBerge, M. (1995) Effect of lubricant viscosity and bearing surface stiffness on the lubrication mechanism of a point contact as a total hip arthroplasty model. Transactions of the Society For Biomaterials, 23, 124.
26. Gavrjushenko, N.S. (1993) Recommendations with respect to the improvement of lubrication quality of synovial fluid in artificial joints. Proc. Instn. Mech. Engs 207, 111-114.
27. Griffith, MJ, Seidenstein MK, Williams, D. and Charnley, J. (1978) Socket wear in Charnley low friction arthroplasty of the hip. Clin. Orthop. Rei. Res. 137,36-47.
28. Halling, J.A. (1975) contribution to the theory of mechanical wear. Wear, 34, 239-249.
29. Hoeppner, D.W. and Chandrasekaran, V. (1994) Fretting in orthopaedic implants: a review. Wear, 173, 189-197.
30. Hornbogen, E. (1975) The role of fracture toughness in the wear of metals. Wear, 33,251-259.
31. Isaac, G.I., Wroblewski, P.J., Atkinson, J. Rand Dowson, D. (1992) Tribological study of retrieved hip prostheses. Clin. Orthop. ReI. Res. 276, 115-125.
32. Jacobs J.J., Shanbhag A., Giant T.T., Black J. and Galante J.O. (1994) Wear debris in total joint replacements. JAm. Acad. Orthop. Surg., 2, 212-220.

WEAR 402 I I L-__________________________________________________________ ~
33. Jahanmir, Sand Suh, N.P. (1977) Mechanics of subsurface void nucleation in delamination wear. Wear, 44, 17-38.
34. Jin, Z.M., Dowson, D. and Fisher, J. (1993) Wear and friction of medical grade polyurethane sliding on smooth metal counterfaces. Wear, 162-164, 627-630.
35. Kumar P., Oka, M., Ikeuchi, K., Shimizu, K., Yamamuro, T., Okumura, H., Kotoura and Y. (1991) Low wear rate of UHMWPE against zirconia ceramic (Y-PSZ) in comparison to alumina ceramic and SUS 316L alloy. 1. Biomed. Mater. Res., 25, 813-828, 1991.
36. LaBerge, M., Kirkley, S. Chow, A., Medley, J.B. and Brox, W.T. (1991) Biotribological Study of the Contact Elastomer-Cartilage. Proceedings of the Combined Meeting of Orthopaedic Research Societies (USA, Japan, Canada), Banff, Alberta, Canada, June, 1991.
37. Livermore, J., Iistrup, D. and Morrey, B. (1990) Effect of femoral head size on wear of the polyethylene acetabular component. l. Bone Joint Surg., 72A, 518-528.
38. Long, M and Rack, H.J. Titanium alloys in total joint replacement - A review. Submitted to Biomaterials. March 1996.
39. McKeliop, H. (1981) Wear of artificial joint materials II. Twelve-channel wearscreening device: correlation of experimental and clinical results. Engg in Med., 10(3), 123-136.
40. McKeliop, H, Clarke, I, Markolf, K. and Amstutz, H. (1981) Friction and wear properties of polymer, metal, and ceramic prosthetic joint materials evaluated on a multichannel screening device. l. Biomed. Mat. Res., 15,619-653.
41. McKeliop, H.A., Clarke, I.e., Markolf, K.L. and Amstutz, H.e. (1978) Wear characteristics of UHMW polyethylene: A method for accurately measuring extremely low wear rates, l. Biomed. Mater. Res., 12, 895-927.
42. McKeliop, H.A., Clarke I.e., Markolf K.L. and Amstutz H.e. (1981) Friction and wear properties of polymer, metal, and ceramic prosthetic joint materials evaluated on a multichannel screening device, l. Biomed. Mater. Res., 15, 619-653.
43. McKellop, H.A., Rostliind, T.V. (1990) The wear behavior of ion-implanted Ti-6Al-4V against UHMW polyethylene, l. Biomed. Mater. Res., 24, 1413-1425.
44. McKeliop, H., Clarke, I.e., Markolf, K.L., Amstutz, H.e. (1978) Wear characteristics of UHMW polyethylene. Method to accurately measuring extremely low wear rates. l. Biomed. Mater. Res. 12, 895-927.
45. Medley, J.B., Krygier, J.J., Bobyn, J.D., Chan, F.W., Tanzer, M. (1995) Metalmetal bearing surfaces in the hip: Invetigation of factors influencing wear. Trans. Orthop. Res. Soc.; 20(2), 765.
46. Miller, D.A., Ainsworth, R.D., Dumbleton, J.H., Page, D., Miller, E.H. and Chi Shen (1974) A comparative evaluation of the wear of ultra-high-molecular weight polyethylene abraded by Ti-6Al-4V; Wear, 28, 207-216.
47. Mittlmeier, T. and Walter, A. (1987) The influence of prosthesis design on wear and loosening phenomena. CRC Critical Reviews in Biocompatibility. 3, 319-419.
48. O'Connor, D.O., Burke, D.W., Bragdon, e.R., Ramamurti, B.S. and Harris, W.H. (1995) Dynamic frictional comparisons of different femoral head sizes and different lubricants. Trans 21st Annual Meeting of the Society For Biomaterials, San Francisco, CA, 28, 230.

L _________________ RE_F_E_R_E_N_C_ES ________________ ~I I 403
49. Okumara, H., Yamamuro, P., Kumar, T., Nakamura, T. and aka, M. (1989) Socket wear in total hip prosthesis with alumina ceramic head. Bioceramics, 1,284-189.
50. Oonishi, H. and Takayama, Y. (1989) Comparisons of wear of UHMW polyethylene sliding against met! and alumina in total hip prostheses. Bioceramics, 1,272-277.
51. Poggie, RA., Wert, J.J., Mishra, A.K. and Davidson, J.A. (1992) Friction and wear characterization of UHMWPE in reciprocating sliding contact with Co-Cr, Ti-6AI-4V, and Zirconia implant bearing surfaces; in wear and friction of elastomers. ASTM STP 1145. R Denton and M.K. Keshavan, Eds., American Society For Testing and Materials, Philadelphia, pp. 65-81.
52. Quinn, T.F.1. (1983) A review of oxidational wear. Parts I and II. Tribology International, 16: 257-271, 305-315.
53. Quinn, T.F.J., Rowson, D. and Sullivan J.L. (1980) Application of the oxidationa I theory of mild wear to the sliding wear of low-alloy steel. Wear, 65, 1-20.
54. Rabinowicz, E. (1965) Friction and Wear of Materials. John Wiley and Sons, New York. pp. 53-58.
55. Rose, RM. and Radin, E.L. (1982) Wear of polyethylene in total hip prostheses. Clin. Orthop. Rei. Res., 170, 107-115.
56. Rose, RM., Ries, M.D., Paul, I.L., Crugnola, A.M. and Ellis, E. (1984) On the true wear rate of ultrahigh molecular weight polyethylene in the total knee prosthesis, J. Biomed. Mater. Res., 18,207-224.
57. Rowe, e.N. (1980) Lubricated wear, in CRC Handbook of Lubrication. Boca Raton, FL:CRC Press; pp. 209-225.
58. Ruger, L.M., Love, B.1., Drews, M.1., Hutton, W.e. and LaBerge, M. (1996) Effect of antioxidant on the tribological properties of gamma sterilized ultra high molecular weight polyethylene. Proc. Fifth World Biomaterials Congress. Toronto, Canada. May 29-June 2.
59. Saikko, V., Paavolainen, P., Kleimola, M. and Slatis, P. (1992) A five-station hip joint simulator for wear rate studies, Proc. Instn Mech. Engrs, Part H, 206, 195-200.
60. Saikko, V. (1992) Simulator study of friction in total replacement hip joints, Proceedings of the Institution of Mechanical Engineers Part H: Journal of Engineering in Medicine, 206, 201-211.
61. Saikko, V. (1993) Wear and friction properties of prosthetic joint materials evaluated on a pin on flat apparatus, Wear, 166, 169-178.
62. Schmidt, M.B., Lin, M. and Greer, K.W. (1995) Wear performance of UHWMPE articulated against ion implanted CoCr. Trans 21st Annual Meeting of the Society For Biomaterials, San Francisco, CA. 28, 230.
63. Semlitsch, M., Lehmann, M., Weber, H., Doerre, E. and Willert, H.G. (1977) New prospects for a prolonged functional life-span of artificial hip joints by using the material combination polyethylene/aluminium oxide ceramic/metal. J. Biomed. Mater. Res., 11,537-552.
64. Semlitsch, M.F., Weber, H., Streicher, R.M. and Schon, R (1992) Joint replacement components made of hot-forged and surface treated Ti-6AI-7Nb alloy. Biomaterials 13, 781-788.
[404] WEAR
65. Simon, S.R. and Radin, E.L. (1973) Lubrication and wear of the Charnley, Charnley-Muller, and McKee-Farrar prostheses with special regard to their clinical behavior, Proc. 1st Scient. Meet. Hip Society, Saint Louis, Chap.5, 33-45.
66. Steinemann, S.G., Mausli P-A, Szmukler-Moncler, S., Semlitsch, M., Pohler, 0., Hintermann, H.E. and Perren, S.M. (1993) Beta-titanium alloy for surgical implants. Titanium '92 Science and Technology. The Minerals, Metals & Materials Society, 2, 689-2, 696.
67. Streicher, R.M., Schon, R. and Semlitsch, M. (1990) Investigation of the tribological behaviour of metal-on-metal combinations for artificial hip joints, Biomed. Tech., 35(5), 3-7.
68. Streicher, R.M. (1991) Ceramic surfaces as wear partners for polyethylene in Bioceramics (Bonfiled, W., Hastings, G.W., Tanner, K.E. Eds), Butterworth-Heinemann Ltd, London, England, 4, 9.
69. Suh, N.P. (1986) Tribophysics. Prentice-Hall, Inc., Englewood Cliffs, New Jersey. pp. 3-11, 195-222.
70. Suzuki, S., Suzuki, S.H. and Cox, C.F. (1996) Evaluating the antagonistic wear of restorative materials. J. Am. Dental. Ass. 127, 74-80.
71. Tateishi, T., Terui, A. and Yunoki, H. (1990) Friction and wear properties for biomaterials for artificial joint, Bioceramics, 2, 145-15l.
72. Ungethum, M. and Refior, H.J. (1974) 1st Aluminiumoxidkeramik als Gleirlagerwekstoff fur Totalendoprothesen geeignet? Archiv fUr Orthopadische und Unfall-Chirurgie, 79: 97.
73. Unsworth, A., Pearcy, M.J., White, E.F.T. and White, G. (1988) Frictional properties of Artificial Hip Joints. Engineering in Medicine, 17, 101-104.
74. Walker, P.S. and Bullough, P.G. (1973) The effects of friction and wear in artificial joints. Orthopeadic Clinics of North America, 4, 275-293.
75. Wallbridge, H., Dowson, D. and Roberts, E.W. (1983) A study of the wear characteristics of sliding pairs of high density polycrystalline aluminum oxide with particular reference to their use in total replacement in human joints. Engg in Med., U(I), 23-28.
76. Wang, K., Gustavson, L. and Dumbleton, J. (1993) The characterization of Ti-12Mo-6Zr-2Fe. A new biocompatible titanium alloy developed for surgical implants. Beta Titanium in the 1990s. The Minerals, Metals & Materials Society, 2,49-60.
77. Waterhouse, R.B. (1992) Fretting wear. Friction, Lubrication and Wear Technology, 18,242-256.
78. Weightman, B., Simon, S., Paul, L.I., Rose, R. and Radin, E.L. (1972) Lubrication mechanisms of hip joint replacement prostheses, Journal oj Lubrication Technology (Trans. American Society of Mechanical Engineers) 94, 131.
79. Weightman, B., Paul, I.L., Rose, R.M. Simon, S.R. and Radin, E.L. (1973) A comparative study of total hip replacement prostheses, Journal oj Biomechanics, 6, 299.
80. Wright, K., Dobbs, H. and Scales, J. T. (1982) Wear studies on prosthetic materials using pin on disc-machines, Biomaterials, 3, 41-48.

~ ___________________ R_E_FE __ R_E_N_C_E_S ___________________ ~I I 405
81. Wroblewski, B.M., McCullagh, PJ. and Siney P.D. (1992) Quality of the surface finish of the head of the femoral component and the wear of the socket in long-term results of the Charnley low-friction arthroplasty. Engg in Med. 20, 181-183.
82. Zichner, L.P. and Willert, H.G. (1992) Comparison of alumina-polyethylene and metal-polyethylene in clinical trials. Clin. Orthop. ReI. Res. 282, 86--94.
83. Zum Gahr, K-H. (1982) Abrasive Wear of ductile materials. Z. f Metallkd., 73, 267-276.
84. Zwicker, J. Etzold, U, and Moser, T. (1985) Abrasive properties of oxide layers on TiA15Fe2.5 in contact with high density polyethylene. Titanium '84 Science and Technology. Deutsche Gesellschaft Fur Metallkunde E. v., 2, 1343-1350.
8 Degradation/resorption in bioactive ceramics
in orthopaedics
H. Oonishi and K. Oomamiuda
8.1 INTRODUCTION
Bioceramics have now been widely used as bone replacement materials in orthopaedic surgery. In particular, calcium phosphate ceramics have been applied as bioactive ceramics with bone bonding capacities.
Biological responses such as bone bonding and the biodegradation properties of these materials are very important in clinical applications. Any convincing conclusion has not yet been reached as to whether these materials are biodegradable or not, although it has been discussed for a long time.
Degradation is an important characteristic for biomaterials, and it is considered to have a large influence on the bone bonding properties. This degradation characteristic must be considered from the following two view points. These are the solution mediated dissolution process and the cellmediated process (phagocytosis).
This chapter overviews the literature regarding the biodegradation processes of bioactive calcium phosphate ceramics from the viewpoint of in vitro physico-chemical dissolution processes and in vivo/in vitro biological degradation processes.
In this chapter, each calcium phosphate material is abbreviated as follows:
Handbook of Biomaterial Properties. Edited by 1. Black and G. Hastings. Published in 1998 by Chapman & Hall, London. ISBN 0412 60330 6.
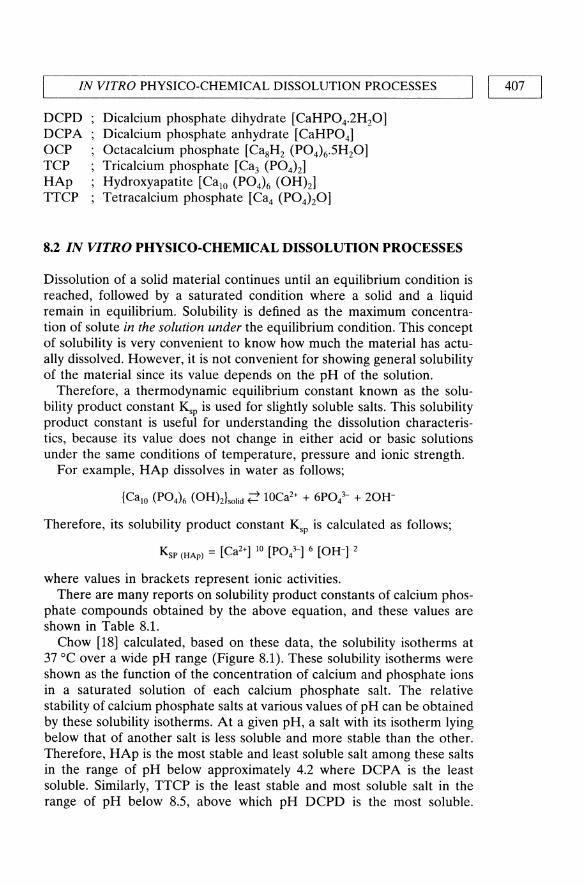
L-__ IN_V_IT_R_O_P_H_Y_S_IC_O_-_C_H_E_M_I_C_A_L_D_IS_S_O_L_U_T_IO_N_P_R_O_C_E_S_S_E_S _---'I 1 407
DCPD DCPA OCP TCP HAp TTCP
Dicalcium phosphate dihydrate [CaHP04.2H20] Dicalcium phosphate anhydrate [CaHP04] Octacalcium phosphate [CasH2 (P04)6.5HP] Tricalcium phosphate [Ca3 (P04)2] Hydroxyapatite [CalO (P04)6 (OHh] Tetracalcium phosphate [Ca4 (P04)20]
8.2 IN VITRO PHYSICO-CHEMICAL DISSOLUTION PROCESSES
Dissolution of a solid material continues until an equilibrium condition is reached, followed by a saturated condition where a solid and a liquid remain in equilibrium. Solubility is defined as the maximum concentration of solute in the solution under the equilibrium condition. This concept of solubility is very convenient to know how much the material has actually dissolved. However, it is not convenient for showing general solubility of the material since its value depends on the pH of the solution.
Therefore, a thermodynamic equilibrium constant known as the solubility product constant Ksp is used for slightly soluble salts. This solubility product constant is useful for understanding the dissolution characteristics, because its value does not change in either acid or basic solutions under the same conditions of temperature, pressure and ionic strength.
For example, HAp dissolves in water as follows;
{CalO (P04)6 (OH)2}solid ~ lOCa2+ + 6PO/- + 20H
Therefore, its solubility product constant Ksp is calculated as follows;
Ksp (HAp) = [Ca2+] 10 [PO/-] 6 [OH-] 2
where values in brackets represent ionic activities. There are many reports on solubility product constants of calcium phos
phate compounds obtained by the above equation, and these values are shown in Table 8.l.
Chow [18] calculated, based on these data, the solubility isotherms at 37°C over a wide pH range (Figure 8.1). These solubility isotherms were shown as the function of the concentration of calcium and phosphate ions in a saturated solution of each calcium phosphate salt. The relative stability of calcium phosphate salts at various values of pH can be obtained by these solubility isotherms. At a given pH, a salt with its isotherm lying below that of another salt is less soluble and more stable than the other. Therefore, HAp is the most stable and least soluble salt among these salts in the range of pH below approximately 4.2 where DCP A is the least soluble. Similarly, TTCP is the least stable and most soluble salt in the range of pH below 8.5, above which pH DCPD is the most soluble.

408 I I DEGRADATION/RESORPTION IN CERAMICS IN ORTHOPAEDICS
Table 8.1 Solubility product constants of calcium phosphate compounds at 25°C
Compound Abbreviation Formula p Ksp Reference
Dicalcium phosphate dihydrate DCPD CaHP04·2Hp 6.59 1,2 6.63 3
Dicalcium phosphate anhydrous DCPA CaHP04 6.90 2, 4 Octacalcium phosphate OCP CasHz 96.6 5
(P04)6· 5Hp 98.6 6 a-Tricalcium phosphate a-TCP a-Ca3(P04)z 25.5 7 J3-Tricalcium phosphate J3-TCP J3-Ca3(P04)z 28.9 2, 8
29.7 3 Hydroxyapatite HAp Ca lO(P04MOHh 115.5 2,9, 10
115-117 11 117 12-15 122 16 125 17
Tetracalcium phosphate ITCP Ca4(P04)P 38 15
pKsp: the negative logarithm of Ksp'
Newesely [19] and Monma and Kanazawa [20] reported that a-TCP was converted to HAp by hydration as follows;
3Ca3 (P04h + Caz+ + 20H- -? CalO (P04MOHh
However, this phase diagram can apply only in a thermodynamic equilibrium for the ternary system of Ca(OH)2-H3POcH20, and it shows only a general tendency under in vivo conditions where various different ions are involved. Furthermore, this relation is also considered to be influenced by the experimental conditions and the characteristics of the material used in the experiments.
Most of the implanted materials used in the investigations were TCP and HAp. It has been reported in earlier investigations that TCP dissolves more rapidly than HAp in various solutions [21].
Jarcho [22] compared the relative dissolution rates of dense HAp and TCP. The dissolution rate of TCP was 12.3 times higher than that of HAp in buffered lactic acid solution (0.4 M, pH 5.2), and was 22.3 times higher than that of HAp in buffered EDT A solution (0.05 M, pH 8.2). Klein et al. [23] carried out dissolution tests on HAp and I3-TCP with various values of porosity in buffered lactic acid solution. The dissolution rate of I3-TCP was three times higher than that of HAp. And it was concluded that the degradation rates of these materials were determined by neck dissolution rate and neck geometry, the latter factor being dependent on the crystallography and stoichiometry of the material and of the sintering conditions. Ducheyne et al. [15] compared the dissolution rate and the precipitation rate of the following six calcium phosphates in calcium and
IN VITRO PHYSICO-CHEMICAL DISSOLUTION PROCESSES I I 409
0
- 1
-2
...---. ro -3
c....;>
b.O 0 -4
.....J
-5
-6
-7 3 5 7 9 11 13
pH
0
DCPD
-2 DCPA
-4
P-.
b.O -6 0
.....J
-8
-10
-12 3 5 7 9 11 13
pH
Figure 8.1 Solubility phase diagram for the ternary system Ca(OH}z-H3POcH2O at 37°C [18].

410 I I DEGRADATION/RESORPTION IN CERAMICS IN ORTHOPAEDICS
phosphate free solution with pH 7.3. The dissolution rate increased in the following order:
HAp < CDAp < OHAp < I3-TCP < o:-TCP < TTCP
and the precipitation rate increased as follows:
I3-TCP < (HAp and o:-TCP) < CDAp
(CDAp; Ca-deficient HAp, OHAp; dehydroxylated HAp)
The precipitate that formed on CDAp was apatitic; on the other hand, the precipitates on HAp and j3-TCP had a much lower CalP. In TTCP, the precipitate was calcium deficient carbonate containing hydroxyapatite. Niwa et al. [24] evaluated the concentration of calcium and phosphate ions being slightly dissolved in saline solution from HAp sintered at the temperature range from 250 to 1250 dc. It was concluded that the sintering temperature was closely related to the crystallinity and the amount of dissolution of the material. Maximan et al. [25] compared the dissolution rate of plasma spray coated amorphous HAp and poorly crystallized HAp by exposure to Hank's physiological solutions (pH 7.2 and 5.2). The poorly crystallized HAp coating showed faster resorption, greater surface film precipitation and greater chemical changes than amorphous HAp coating.
8.3 IN VIVOIIN VITRO BIOLOGICAL DEGRADATION PROCESSES
Biological degradation processes have been investigated either by animal experiments in vivo and clinical applications or by cell cultures in vitro. These results were obtained by observing the remaining implanted materials and the behavior of each cell around the materials.
8.3.1 Animal experiments and clinical applications
Most of the implanted calcium phosphate materials that were used in animal experiments and clinical applications were TCP, HAp and calcium phosphate glasses. Table 8.2 shows major reports of these investigations.
Most of the reports on TCP have concluded that TCP is biodegradable although there are some differences depending on the characteristics of the materials used. Bhaskar et al. [26] concluded that this biodegradation of TCP was caused by the phagocytosis of the mesenchymal cells. Cameron et at. [28] stated that the ingestion by giant cells did playa significant role in the degradation of TCP although passive dissolution occurred. Klein et at. [32, 33] stated that the micro-pores played an important role in the biodegradation rate of TCP. The degradation of TCP started mostly

Tab
le 8
.2
Bio
degr
adat
ion
of c
alci
um p
hosp
hate
com
poun
ds i
n vi
vo.
Impl
ante
d m
ater
ial
(sin
teri
ng t
emp.
, po
rosi
ty o
r de
nsity
) Im
plan
tati
on
Dur
atio
n B
iode
grad
atio
n R
efer
ence
• T
CP
(pl
ug)
Tib
ia o
f ra
ts
14 w
eeks
P
rogr
essi
ve d
ecre
ase
26
• T
CP
(pe
llet
) T
ibia
of
rats
48
day
s 95
% o
f im
plan
t w
as d
egra
date
d 27
•
[3-T
CP
(por
ous
plug
) [3
6%]
Fem
ur o
f do
gs
4 m
onth
s C
onsi
dera
ble
reso
rpti
on
28
• T
CP
and
TT
CP
(po
rous
cyl
inde
r) [
45%
] T
ibia
of
dogs
10
mon
ths
TC
P;
reso
rbed
29
T
TC
P;
unch
ange
d •
TC
P (
bloc
k)
Ver
tebr
ae c
ervi
cale
s 22
wee
ks
Par
tial
ly r
esor
bed
(im
plan
ts w
ere
of d
ogs
crus
hed)
30
•
HA
p a
nd [
3-T
CP
(ten
typ
es o
f m
icro
T
ibia
of
rabb
its
9 m
onth
s H
Ap:
no
reso
rpti
on
31
and
mac
ro p
orou
s cy
lind
er)
TC
P:
mor
e or
les
s de
grad
able
•
[3-T
CP
(sev
en t
ypes
of
mic
ro a
nd m
acro
T
ibia
of
rabb
its
12 m
onth
s M
icro
poro
us>
mac
ropo
rous
po
rous
cyl
inde
r)
redu
ced
by a
ddit
ion
of
Mg2
+, F
-32
,33
• H
Ap
and
TC
P (
poro
us b
lock
) F
emur
of
dogs
50
wee
ks
HA
p: n
o re
sorp
tion
34
[H
Ap:
130
0 °C
-56
%,
TC
P:
1150
°C
-50
%]
TC
P: 2
5-30
% (
in 2
2 w
eeks
) •
Cor
al (
pori
tes)
-H
Ap
(po
rous
blo
ck)
Man
dibl
e of
dog
s 1
year
29
% o
f im
plan
t 35
•
Cor
al (
goni
opor
a) -
HA
p (
poro
us b
lock
) T
ibia
of
dogs
1
year
N
o bi
ores
orpt
ion
36
• C
oral
(po
rite
s an
d go
niop
ora)
-H
Ap
A
nim
al s
tudi
es
12 m
onth
s M
inim
al
37,3
8 (p
orou
s bl
ock)
C
lini
cal
appl
icat
ion
15 m
onth
s N
o de
grad
atio
n •
Cor
al (
goni
opor
a) -
HA
p a
nd T
CP
[36
%]
Ani
mal
exp
erim
ents
1
year
C
oral
-HA
p: n
ot a
ppar
ent
39
Cli
nica
l ap
plic
atio
n 4
year
s T
CP:
obs
erve
d in
man
y ca
ses
• H
Ap
(th
ree
type
s of
den
se b
lock
) D
orsa
l m
uscl
e an
d 6
mon
ths
No
degr
adat
ion
(no
diff
eren
ce i
n 40
[9
00°C
-97
%,
1200
°C
-97
and
99.
9%]
tibi
a o
f ra
ts
thre
e ty
pes)
•
HA
p (
poro
us b
lock
s) [
1300
°C,
56%
] F
emur
of
dogs
3.
5 ye
ars
Neg
ligi
ble
41
• H
Ap
(po
rous
blo
cks)
[90
0 an
d 12
00°C
, 86
%]
Tib
ia o
f do
gs
2 ye
ars
Slow
bio
reso
rpti
on
42
(900
°C>
1200
0c)
•
HA
p (
mac
ro a
nd m
icro
por
ous
bloc
ks)
Mid
dle
ear
of r
ats
1 ye
ar
Res
orpt
ion
by 1
5-20
ILm
dur
ing
[mac
ropo
rosi
ty:
26%
, m
icro
poro
sity
: 5%
] th
e fi
rst
yr.
43,4
4

Tab
le 8
.2
Con
tinu
ed.
Impl
ante
d m
ater
ial
(sin
teri
ng t
emp.
, po
rosi
ty o
r de
nsit
y)
• D
CP
D,
DC
PA
, O
CP
, a-
and
I3-T
CP,
HA
p,
amor
phou
s H
Ap
Bio
glas
s (g
ranu
le s
izes
of
100-
300
and
10 f.
Lm)
• M
BC
P (
mac
ropo
rous
blo
cks)
[40
-50%
] (6
0%H
Ap
+ 4
0% 1
3 -
TC
P)
• P
lasm
a sp
raye
d H
Ap
(cy
lindr
ical
plu
g)
• P
lasm
a sp
raye
d H
Ap,
TT
CP
, M
WL
(c
ylin
dric
al r
od)
(cry
stal
lini
ty o
f H
Ap:
10,
60,
95
%)
• P
lasm
a sp
raye
d H
Ap,
F A
p, M
WL
(c
ylin
dric
al p
lug)
• B
iogl
ass
(SiO
z-P
zOs-
CaO
-Naz
O s
yste
m)
• A
-W g
lass
-cer
amic
s (M
gO-C
aO-S
iOz-
PzO
s-C
aFz
syst
em)
Impl
anta
tion
D
urat
ion
Fem
ur o
f ra
bbit
s 12
wee
ks
Ani
mal
exp
erim
ents
18
wee
ks
Clin
ical
app
lica
tion
16
mon
ths
Tib
ia o
f ra
bbit
s 3
mon
ths
Fem
ur o
f ra
ts
4 w
eeks
Fem
ur a
nd h
umer
us
25 w
eeks
of
goa
ts
Fem
ur o
f ra
ts
6 w
eeks
Tib
ia o
f ra
bbit
s 25
wee
ks
Bio
degr
adat
ion
Ref
eren
ce
(a-
and
I3-T
CP)
< (
DC
PD
, 45
D
CP
A,
TT
CP
) <
(am
orph
ous
HA
p,O
CP
) In
itia
lly
fast
(-1
mon
th)
46
Los
s of
coa
ting
thi
ckne
ss
47
60%
-HA
p an
d T
TC
P: d
isti
nct
48
bulk
deg
rada
tion
, lO
%-H
Ap:
gr
adua
l su
rfac
e de
grad
atio
n 95
%-H
Ap
and
MW
L:
negl
igib
le
HA
p: c
onsi
dera
ble
and
prog
ress
ive
49
redu
ctio
n, M
WL
: co
nsid
erab
le
redu
ctio
n in
thi
ckne
ss,
FA
p: n
o de
grad
atio
n o
r di
ssol
utio
n Si
lica-
rich
lay
er a
nd C
a-P
ric
h 51
la
yer
form
atio
n C
a-P
ric
h la
yer
form
atio
n 53

L-~IN~V_I_V_O_-I_N_V_I_T_R_O~B_IO_L_O~G_IC_A~L_D_E_G_R~A_D_A_T_I_O_N_P_R_O~C_E_SS_E_S~--"I I 413
from the medulla by solution mediated disintegration processes, and fine particles released were phagocytosed and removed by macrophages in the medulla to the lymph nodes. Renooij et af. [35] reported that HAp was not affected by biodegradation processes, while TCP was subject to extensive bioresorption. Resorption debris from TCP was found in mononuclear phagocytes and multinuclear osteociastIike cells. Although multinuclear cells were occasionally seen near the surface of HAP, cells carrying HAP debris were never observed. And it was supposed that TCP was transformed into HAp in a physiologic environment.
Concerning the biodegradation of HAp, there are reports in the case of no degradation, slow or partial degradation and for the degradable case. The differences in these results are dependent on the experimental conditions such as the characteristics of the materials, animal species, implanted sites and methods of observation.
Holmes et af. [35-39] carried out investigations using HAp which was derived from marine coral and reported the results as follows. Significant biodegradation occurred when implanted in load bearing sites such as mandibles, while minimal biodegradation was observed in cortical bone of radius and no apparent evidence of biodegradation was observed in cancellous bone of tibia. In clinical applications, radiographic observations did not show any irrefutable evidence of biodegradation and history of biopsies showed no conclusive evidence of biodegradation, while osteoclasts were occasionally seen along the implant surface. In contrast to these results, degradation of TCP appeared to occur by passive dissolution and osteoclastic resorption, and in many cases it was radiographically observed in clinical trials, especially where the implant was applied in a diaphyseal onlay fashion. Denissen et af. [40] reportered no degradation of three different dense HAp varying in its density. Similarly, Hoogendoorn et af. [41] reported through their long-term study that porous HAp did not undergo biodegradation during 3.5 years of implantation, while giant multinucleated cells were occasionally seen in pores near the bone and ceramic surface.
On the other hand, Kurosawa et af. [42] observed the degradation of highly porous HAp in their experiments, and concluded that this degradation was caused in two ways; the mechanical collapse of the material and the ingestion of fine particles released from the HAp surface by multinuclear giant cells. Similarly, Blitterswijk et af. [43, 44] observed in their implantation experiments with dense and macroporous HAp that the deposition of calcium, partially in the form of calcium phosphate, was found on the implant surface, and the resorption of the implant occurred as the result of phagocytosis by mono- and multi-nuclear cells. Oonishi et af. [45] compared bioactivity for bone formation in several kinds of bioceramics. These materials were divided into three groups; bioinert ceramics (alumina), surface bioactive ceramics (HAp and Bioglass), and resorbable

DEGRADATION/RESORPTION IN CERAMICS IN ORTHOPAEDICS
bioactive ceramics (DCPO, OCPA, OCP, a-TCP, (3-TCP, TTCP and amorphous HAp). In resorbable bioactive ceramics, bioactivity or bioresorbability might increased in the following order:
(a- and I3-TCP) < (DCPD, DCPA and TICP) < (amorphous HAp and OCP)
Daculsi et at. [46] stated that the bioresorption of macroporous biphasic calcium phosphate consisting of HAp and (3-TCP was conducted by multinucleated cells (osteoclast like cells) and was related to the (3-TCP content of this material. Bruijin et at. [48] and Ohert et at. [49] compared the degradation of plasma spray coated TTCP, MWL (magnesium whitlockite) and three types of HAp with various degrees of crystallinity. It was revealed that both TTCP and semi-crystalline HAp underwent distinct bulk degradation and amorphous HAp showed a gradual surface degradation, while the degradation was negligible with the highly crystalline HAp and MWL. Biodegradation appeared to be related to bone apposition, since more bone seemed to be present on amorphous HAp and TTCP, as compared to highly crystalline HAp and MWL. The degrading surface of TTCP and amorphous HAp coatings was most likely a dynamic zone in which dissolution and reprecipitation occurs. This zone was therefore thought to be favourable for rapid bone formation and bonding. At the interface between bone and MWL, a seam of unmineralized bonelike tissue was frequently seen, and a substantial amount of aluminum was detected in the MWL coating and the un mineralized bone-like tissue, which might cause the impaired mineralization.
Since the discovery of Bioglass by Hench et at. [50], various kinds of bioactive glasses and glass ceramics have been developed and applied clinically. Hench et at. [51] summarized their study on Bioglasses which were based on the Si02-P20s-CaO-Na20 system. When a bioactive glass was immersed in an aqueous solution, three general processes occurred; leaching, dissolution and precipitation. In these reactions, hydrated silica was formed on the glass surface, resulting in a silica-rich gel layer, and then a calcia-phosphate-rich layer was formed on or within the gel layer. This layer was initially amorphous and later crystallized to a hydroxycarbonate apatite structure to which bone could bond. Kokubo et at. [52] developed A-W glass-ceramics which was based on the MgO-CaO-Si02-P20s-CaF2 system. In this material, oxyfluorapatite [CalO(P04MO,F2)] and (3-wollastonite [Cao . Si02] both in the form of rice grain-like particles were dispersed in an MgO-CaO-Si02 glass matrix. In their experiments [53] it was shown that a thin layer, rich in Ca and P, was formed on the surface of this material. This Ca, P-rich layer was identified as a layer of apatite, and this material was observed to be closely connected to the surrounding bone through this apatite layer without any distinct boundary. The same type of apatite layer was formed on the

'-----_IN_V_I_V_O_-I_N_V_I_T_R_O_B_IO_L_O_G_IC_A_L_D_E_G_R_A_D_A_T_I_O_N_P_R_O_C_E_SS_E_S_-----'I I 415
surface of this material exposed to the simulated body fluid, and consisted of carbonate-containing hydroxyapatite of defective structure and small crystallites. It was concluded that this apatite layer played an essential role in forming the chemical bond of all bioactive materials which bonded to bone.
8.3.2 Cell cultures
To study biodegradation and interfacial bonding phenomena, in vitro cell culture systems have been developed. Gregoire et af. [54] investigated the influence of calcium phosphate on human bone cell activities and demonstrated that the isolated human bone cells were capable of ingesting HAp and I3-TCP granules. And the capacity for ingesting a synthetic mineral component clearly suggested that bone cells were able to participate in the degradation of calcium phosphates. Gomi et af. [55] showed that osteoclasts are capable of resorbing sintered HAp in vitro and that the fusion of osteoclast mononuclear precursors was influenced by substratum rugosity. Similarly, Ogura et af. [56] demonstrated that osteoclast-like cells were capable of resorbing unsintered calcium phosphate substrata in vitro. Bruijn et af. [57-59] carried out a series of cell culture tests on various plasma sprayed calcium phosphate compounds and reported the results as follows. Rat bone marrow cells were cultured on plasma sprayed HAp. The cells formed a mineralized extracellular matrix that exhibited several characteristics of bone tissue. Two distinctly different interfacial structures were observed on HAp. An electron-dense layer which was rich in glycosaminoglycans was regularly present. A collagen-free amorphous zone was frequently seen interposed between the electron-dense layer and HAp. In cell culture tests on three types of plasma sprayed HAp varying in degree of crystallinity, an electron-dense layer was clearly visible on a stable, nondegrading crystalline HAp and was frequently observed at the interface of semi-crystalline HAp. An amorphous zone was regularly seen at degrading surfaces of semi-crystalline and poorly crystallized HAp. It was concluded that the crystallinity of plasma sprayed HAp was an important parameter which influenced the establishment of the bony interface and might, as a result, have an effect on the bone formation rate and bonding strength between HAp and bone tissue. Similarly, rat bone marrow cells were cultured on various plasma sprayed calcium phosphate coatings. Mineralized extracellular matrix was formed on HAp, TCP and TICP in 2 weeks, and was formed on FAp (fluorapatite) in 8 weeks. It was only occasionally observed in some area on MWL, which phenomenon might have been due to aluminium impurities in the coating. It was concluded that plasma sprayed calcium phosphates would display different bone-bonding and biodegradation properties, depending on their chemical composition and crystal structures.

Tab
le 8
.3
Bio
degr
adat
ion
of c
alci
um p
hosp
hate
com
poun
ds i
n vi
tro
Subs
trat
e (s
inte
ring
tem
p.,
poro
sity
or
dens
ity)
Stra
in
Incu
bati
on
Bio
degr
adat
ion
Ref
eren
ce
HA
p a
nd j
3-T
CP
(gra
nule
, <5
0/-L
m)
Hum
an b
one
cell
7 da
ys
Hum
an b
one
cell
are
capa
ble
of
54
inge
stin
g H
AP
and
TC
P g
ranu
les
HA
p (
dens
e di
sc;
thre
e ty
pes
of s
urfa
ce
Rat
bon
e m
arro
w
8 da
ys
Ost
eocl
ast-
like
cel
ls a
re c
apab
le
55
rugo
siti
es)
[113
0°C
] ce
ll o
f re
sorb
ing
HA
p
HA
p (
dens
e di
sc;
thre
e ty
pes
of p
oros
ity
Rat
bon
e m
arro
w
7 da
ys
Ost
eocl
ast-
like
cel
ls a
re c
apab
le
56
[dri
ed a
t 20
0°C
, un
sint
ered
] ce
ll of
res
orbi
ng H
Ap
P
lasm
a sp
raye
d H
Ap
(cr
ysta
llin
ity;
15
,43
,69
%)
Rat
bon
e m
arro
w
18 d
ays
15 &
43%
: ra
pidl
y de
grat
ed 6
9%;
58
cell
degr
adat
ion
rate
was
red
uced
P
lasm
a sp
raye
d H
Ap,
FA
p, T
CP
, T
ICP
, M
WL
R
at b
one
mar
row
2
wee
ks
Dif
fere
nt b
one-
bond
ing
and
59
cell
biod
egra
dati
on p
rope
rtie
s

~ ___________________ R_E_FE __ R_E_N_C_E_S __________________ ~I I 417
8.4 SUMMARY
No convincing conclusion has been reached as to the biodegradation mechanisms of bioactive ceramics. Many researchers have reported different results, as described above. These discrepancies are considered to be caused by the fact that materials used for the experiments were different, and that experimental methods and analytical methods were also different. Therefore, when these reported results are compared, it is important to consider the characteristics of the material used (chemical compositions, impurity, crystallinity, dense or porous, micro- or macroporous, porosity), experimental methods used (in vivo or in vitro, animal species, implanted duration, implanted sites, load bearing or not), and analytical methods used (radiographic, optical microscopic, electron microscopic). Futhermore, a good understanding of the characteristics of the materials to be used becomes important when bioactive ceramics are used clinically.
REFERENCES
1. L.e. Chow and W.E. Brown, J. Dent. Res., 54, 65-16, 1975. 2. F.e.M. Driessens, 1.W.E. van Dijk and 1.M.P.M. Borggreven, Calcif Tissue
Res., 26, 127-136, 1978. 3. 1.L. Meyer, and, E.D. Eanes, Calcif Tissue Res., 25, 59-68, 1978. 4. H.McDowell, W.E. Brown and 1.R Sutter, Inorg. Chern., 10, 1638-1643,1971. 5. M.S. Tung, N. Eidelman, B. Sieck and W.E. Brown, J. Res. Nat. Bur. Stand.,
93,613-624, 1988. 6. J.L. Shyu, L. Perez, S.J. Zawacki, J.e. Heughebaert and G.H. Nancollas, J.
Dent. Res., 62, 398-400, 1983. 7. B.O. Fowler and S. Kuroda, Calcif Tissue Int., 38,197-208, 1986. 8. T.M. Gregory, E.e. Moreno, J.M. Patel and W.E. Brown, J. Res. Nat. Bur.
Stand., 78(A), 667-674, 1974. 9. E.e.Moreno, T.M. Gregory and W.E. Brown, J. Res. Nat. Bur. Stand., 72(A),
773-782, 1968. 10. J.S. Clark, Can. J. Chern., 33, 1696-1700, 1955. 11. RM.H. Verbeek, H. Steyaer, H.P. Thun and F. Verbeek, J. Chern. Soc.
Faraday Trans. 1,76,209-219, 1980. 12. R Chuong, J. Dent. Res., 52, 911-914, 1973. 13. A.N. Smith, A.M. Posner and J.P. Quirk, J. Call. Inter. Sci., 54,176-183, 1976. 14. H.McDowell, T.M. Gregory and W.E. Brown, J. Res. Nat. Bur. Stand., 81(A),
273-281, 1977. 15. P. Ducheyne, S. Radin, L. King, K. Ishikawa and e.S. Kim, Biocerarnics volA,
eds W. Bonfield, G. W. Hastings and K.E. Tanner, Butterworth-Heinemann, London, UK, pp. 135-144, 1991.
16. M.B. Fawzi, J.L. Fox, M.G. Dedhiya, W.1. Higuchi and J.J. Hefferren, J. Call. Inter. Sci., 67, 304--311, 1978.

418 I I DEGRADATION/RESORPTION IN CERAMICS IN ORTHOPAEDICS
17. M.S. Wu, W.1. Higuchi, J.L. Fox and M. Friedman, J. Dent. Res., 55, 496--505, 1976.
18. L.c. Chow, J. Ceram. Soc. Japan, 99, 954-964, 1991. 19. H. Newesely, J. Oral Rehab., 4, 97-104, 1977. 20. H. Monma and T. Kanazawa, Yogyo-Kyokai-Shi, 84, 209-213, 1976. 21. R.W. Mooney and M.A Aia, Chern. Rev., 61, 433-462, 1961. 22. M. Jarcho, Clio Orthop. ReI. Res. 157, 259-278, 1981. 23. C.P.AT. Klein, A A Driessen and K. de Groot, Biomaterials, 5, 157-160,
1984. 24. J. Niwa, S. Takahasi and M. Sohmiya, Fineceramics, 2, 25-32, 1981. 25. S.H. Maximan, J.P. Zawadsky and M.G. Dunn, J. Biomed. Mater. Res., 27,
111-117,1993. 26. S.N. Bhaskar, J.M. Brady, L. Getter, M.F. Grower and T. Driskell, Oral Surg.,
32, 336--346, 1971. 27. D.E. Cutright, S.N. Bhaskar, J.M. Brady, L. Getter and W.R. Posey, Oral
Surg., 33, 850-856, 1972. 28. H.O. Cameron, I. Macnab and R.M. PiIIiar, J. Biomed. Mater. Res., 11,
179-186,1977. 29. K. Koster, H. Heide and R. Konig, Langenbecks Arch. Chir., 343, 173-181,
1977. 30. T. Shima, J.T. Keller, M.M. Alvira, F.H. Mayfield and S.B. Dunsker, J.
Neurosurg., 51, 533-538, 1979. 31. CP.AT. Klein, AA Driessen and K. de Groot, J. Biomed. Mater. Res., 17,
769-784, 1983. 32. CP.AT. Klein, K. de Groot, AA. Driessen and H.B.M. van der Lubbe,
Biomaterials, 6, 189-192,1985. 33. D.C.P.AT. Klein, K. de Groot, AA Driessen and H.B.M. van der Lubbe,
Biomaterials, 7, 144-146, 1986. 34. W. Renooij, H.A Hoogendoorn, W.J. Visser, R.H.F. Lentferink, M.G.J.
Schmitz, H.V. Ieperen, S.J. Oldenburg, W.M. Janssen, L.M.A Akkermans and P. Wittebol, Clio Orthop. ReI. Res., 197,272-285, 1985.
35. R.E. Holmes, Plast. & Reconstr. Surg., 63, 626--633, 1979. 36. R.E. Holmes, R.W. Bucholz and V. Mooney, J. Bone and Joint Surg., 68-A,
904-911, 1986. 37. R.E. Holmes, V. Mooney, R. Bucholz and A Tencer, Clio Orthop. ReI. Res.,
188,252-262, 1984. 38. DJ. Sartoris, D.H. Gershuni, W.H. Akeson, R.E. Holmes and D. Resnick,
Radiology, 159, 133-137, 1986. 39. R.W. Bucholz, A Carlton and R.E. Holmes, Orthop. Cli. North America, 18,
323-334, 1987. 40. H.W. Denissen, K. de Groot, P.Ch. Makkes, A van den Hooff and PJ.
Klopper, J. Biomed. Mater. Res., 14, 713-721, 1980. 41. H.A Hoogendoorn, W. Renooij, L.M.A Akkermans, W. Visser and P.
Wittebol, Clio Orthop. Rei. Res., 187,281-288, 1984. 42. H. Kurosawa, T. Iwata, I. Shibuya, K. Murase and Takeuchi, J. Joint Surg., 8,
1761-1769,1989. 43. C.A van Blitterswijk, J.J. Grote, W. Kuijpers, CJ.G. Blok-van Hoek and W.
Th. Daems, Biomaterials, 6,243-251, 1985.

REFERENCES J I 419 ~----------------------------------------------------------~
44. c.A. van Blitterswijk, J.J. Grote, W. Kuijpers, W. Th. Daems and K. de Groot, Biomaterials, 7, 137-143,1986.
45. H. Oonishi, S. Kushitani, T. Sugihara, H. Iwaki, H. Ohashi and E. Tsuji, Bioceramics vol. 8, eds L.L. Hench and J. Wilson, ELSEVIER, New York, 1995.
46. G. Daculsi, N. Passuti, S. Martin, C. Deudon, RZ. Legeros and S. Raher,l. Biomed. Mater. Res., 24, 379-396, 1990.
47. J.A. Jansen, J.P.C.M. van de Waerden, J.G.c. Wolke and K. de Groot, 1. Biomed. Mater. Res., 25, 973-989, 1991.
48. J.D. de Bruijn, Y.P. Bovell and c.A. van Blitterswijk, Calcium Phosphate Biomaterials: Bone-bonding and Biodegradation Properties, ed. J.D. de Bruijn, Offsetdrukkerij Haveka B.V., Alblasserdam, pp. 79-92, 1993.
49. W.J.A. Dhert, c.P.A.T. Klein, J.A. Jansen, E.A. van der Velde, RC. Vriesde, P.M. Rozing and K. de Groot, 1. Biomed. Mater. Res., 27, 127-138, 1993.
50. L.L. Hench, R.J. Splinter, W.c. Allen and T.K. Greenlee, 1. Biomed. Mater. Res. Symp., 2,117-141,1971.
51. L.L. Hench and B. Andersson, Advanced Series in Ceramic - Vol. I An Introduction to Bioceramics eds L.L. Hench and J. Wilson, World Scientific, Singapore, pp. 41-62, 1993.
52. T. Kokubo, S. Ito, S. Sasaki and T. Yamamuro, 1. Mater. Sci., 21, 536--540, 1986.
53. T. Kokubo, Advanced Series in Ceramics - Vol. I An Introduction to Bioceramics, eds L.L. Hench and J. Wilson, World Scientific, Singapore, pp. 75-88, 1993.
54. M. Gregoire, I. Orly and J. Menanteau, 1. Biomed. Mater. Res., 24, 165-177, 1990.
55. K. Gomi, B. Lowenberg, G. Shapiro and J.E. Davies, Biomaterials, 14,91-96, 1993.
56. M. Ogura, T. Sakae and J.D. Davies, Bioceramics vol. 4, eds W. Bonfield, G.W. Hastings and K.E. Tanner, Butterworth-Heinemann, London, UK, pp. 121-126, 1991.
57. J.D. de Bruijn, C.P.A.T. Klein, K. de Groot and c.A. van Blitterswijk, 1. Biomed. Mater. Res., 26, 1365-1382, 1992.
58. J.D. de Bruijn, J.S. Flachl, K. de Groot, c.A. van Blitterswijk and J.E. Davies, Calcium Phosphate Biomaterials: Bone-bonding and Biodegradation Properties, ed. J.D. de Bruijn, Offsetdrukkerij Haveka B.V., Alblasserdam, pp. 45-62, 1993.
59. J.D. de Bruijn, C.P.A.T. Klein, K. de Groot and c.A. van Blitterswijk, Calcium Phosphate Biomaterials: Bone-bonding and Biodegradation Properties, ed. J.D. de Bruijn, Offsetdrukkerij Haveka B.V., Alblasserdam, pp. 63-78, 1993.

9 Corrosion of Metallic Implants
M.A. Barbosa
9.1 GENERAL ASPECTS
9.1.1 Incidence of corrosion
The surfaces of passive metals are normally attacked at specific points where the oxide film has been destroyed and massive quantities of metal ions are released. Depending on the magnification with which surfaces are observed, various degrees of localized attack can be detected. Sometimes, however, corrosion may not be easily distinguishable from mechanical imperfections associated with manufacturing or handling. Even under the scanning electron microscope (SEM) it is often difficult to distinguish between mechanical indentations and pitting or crevice attack.
After determining the existence of corrosion, the next step is to assess its magnitude. This can be done, by corrosion scores, such as those given in Table 9.1 (Thomas et aI., 1988). In this table the 'no surface degradation' score is obtained with a magnification of 60x. If a higher magnification was used some 'non-degraded' surfaces might fall in one of the 'surface degradation' categories. The borderline between 'corroded' and 'non-corroded') surfaces is therefore very much dependent on magnification, as well as on surface preparation, as explained above. With these limitations in mind, it is useful to have an idea of the incidence of corrosion, i.e. of the percentage of implants that suffer some degree of attack. Table 9.2 compares the data obtained by several authors. Vacuum melting
Handbook of Biomaterial Properties. Edited by J. Black and G. Hastings. Published in 1998 by Chapman & Hall, London. ISBN 0412603306.

'--________ G_E_N_E_R_A_L_A_S_P_E_CT_S ________ ---'I [ 421 I Table 9.1 Grading scale used to evaluate the degree of interface and surface corrosion (Thomas et ai., 1988)
o = no surface degradation visible at 60x magnification 1 = very mild surface degradation visible at 60x magnification 2 = mild surface degradation visible at 60x magnification 3 = moderate surface degradation visible without magnification 4 = heavy surface degradation visible without magnification 5 = very heavy severe surface degradation visible without magnification
Table 9.2 Incidence of corrosion
Implant/material
38 fixation devices/AISI 316L 43 miniplates/AISI 316LVM*
19 miniplates/c.p Ti
* VM - Vacuum melted
Corroded implants
95%; crevice corrosion 19%; only at the
countersinks 0%
Ref
Thomas et al., 88 Torgersen and
Gjerdet,94 Torgersen and
Gjerdet,94
(VM) significantly reduces the susceptibility of 316L stainless steel to attack, while titanium is practically immune. Corrosion, apart from affecting the mechanical performance of the implants, also results in contamination of the tissues with metallic ions.
The detection of ions released from metallic implants is dependent on the technique used. Very minute amounts of ions can be detected by electrothermal atomic absorption spectroscopy (ET-AAS), which goes down to concentrations of the order of ng/g. Electrochemical methods enable the detection of extremely low corrosion current densities, below 1/-LA/cm2, corresponding to dissolution in the passive state. These rates of corrosion do not modify the aspect of the surface and are not normally considered as surface attack.
9.1.2 Potential-pH (Pourbaix) diagrams
These diagrams indicate the regions of immunity, passivation and corrosion of pure metallic elements in pure water at 25°C. Fig. 9.1 (a, b) gives the potential-pH diagrams of Cr and Ti. Cr is the element responsible for the passive behaviour of stainless steels and Co-Cr-Mo alloys. In Fig. 9.1a passivation by a Cr(OHh film is assumed. The film is thermodynamically stable over a wide range of pH and potential values. Below pH 4 the film

422 I I CORROSION OF METALLIC IMPLANTS
-2 0 2 4- 16 2 2
E! 1,6 1.6
1,2 i0-- corrosion 1,2 -.. 0,8 0,8
0,4
0 ""0---0,4
-0,8 ,8
-1,2
-1,6 immunity
-2 0 Z 4 6 8 16pH
Figure 9.1(a) Theoretical conditions of corrosion, immunity and passivation of chromium, at 25°C. (Pourbaix, 1974.)
is unstable and Cr is corroded. Ti is responsible for the excellent corrosion resistance of Ti-AI-V alloys. In Fig. 9.1b passivation by a hydrated Ti02.H20 oxide has been assumed. The passivation region extends to much higher potentials than in the case of Cr. The passive film is unstable below pH 2.5. In both diagrams the dotted lines give the region of stability of water: below line a hydrogen is evolved, whereas above line b oxygen is released. Normally, the corrosion potentials of implant materials do not reach such extreme values.
In spite of their usefulness in predicting the stability of metals and their oxides, potential-pH diagrams suffer from a number of limitations. They refer to pure metals, not to alloys, and to pure water, not to environments normally found in practical situations. For example, the diversity of chemical species, and particularly the presence of chloride ions in physiological media, is responsible for substantial differences between practical and predicted behaviour. Localized attack, in the form of crevice, pitting and corrosion fatigue, is due to the presence of chloride. Furthermore, the kinetics of metal dissolution or passivation cannot be assessed by these diagrams, which are purely thermodynamic. However, if not misused, potential-pH diagrams can give useful information which must be complemented by other type of date, namely of kinetic nature.

THE METAL COMPOSITION I I 423 L-______________________________________________________ ~
2 1 0 1 2 3 4 5 6 7 8 9 10 11 12 13 14 15 16 2 2
1.8
1.6
1.4
1.2
? 1.8 __ . corrosion ?__ 1.6 ?---? __ 1.4
0.8
0.6
0.4
0.2
o -D.2
-D.4
-D.6
-D.8
-1
-1.2
-1.4
-1.6
-1.8
-2
-2.2
passivation
passivation
1.2
1
0.8
0.6
0.4
0.2
o -D.2
-D.4
-D.6
-D.8
-1
-1.2
-1.4
-1.6
-1.8
-2
-2.2
-2.4 -2.4 2 1 0 1 2 3 4 5 6 7 8 9 10 11 12 13 14 15 16
Figure 9.1(b) Theoretical domains of corrosion, immunity and passivation of titanium, at 25°C, considering Tiltz (Pourbaix, 1971).
9.2 ASPECTS RELATED TO THE METAL COMPOSITION
9.2.1 Importance of materials purity in improving the corrosion resistance
The evolution of stainless steel composition can be used to illustrate the importance of materials purity in reducing corrosion susceptibility. Chromium and molybdenum are the key elements in promoting resistance to pitting and crevice attack of stainless steels, but high chromium and molybdenum concentrations are not sufficient to ensure an adequate corrosion resistance. Low concentrations of impurities, like carbon, silicon, phosphorous and sulphur, are required. Type 316L and 316LVM stainless steels are commonly employed to fabricate a variety of fracture fixation devices. They both have low carbon concentration, below 0.03 wt%, which is indicated by the letter L. VM stands for vacuum-melted, a technique

424 I ~I ___________ C_O_R_R_O_S_I_O_N_O_F __ M_E_T_A_L_L_IC __ IM __ P_LA __ N_T_S __________ ~
that enables the production of metals with very low concentrations of impurities.
A retrieval analysis of Kuntscher intramedullary rods (Cook et at. 1990) has shown that significant surface corrosion, inclusion content and carbon content occurred on early materials, which had remained in situ for 10 years or longer (maximum 23 years). Significant relationships were obtained for surface corrosion score vs. thin globular oxide inclusion content, and for surface corrosion score vs. sulphide inclusion content. Figure 9.2 shows the data obtained for the former correlation.
9.2.2. Type of metallic material and influence of alloying
Due to the presence of a thin oxide film, titanium has a very high corrosion resistance. However, its low resistance under wear conditions may lead to enormously high titanium concentrations in tissues adjacent to titanium implants (section 9.3.1). Rapid film formation after surface damage is therefore of critical importance to guarantee low levels of titanium ions.
4l ... o u rn c: o 'Uj o ... ... o U
4l U t'Il -... ~ en
5
4
3
2
1
• • • •
• • •
• •
0.2 0.4 0.6 0.8 1.0 1.2 1.4 1.6 1.8 2.0
Inclusion content
Figure 9.2 Relationship between surface corrosion and thin globular oxide inclusion content. Regression line y= 1.78x+0.52, r= 0.65, n= 18, p <0.05. (Cook et al., 1990,)

~ ______________ T_H_E_M_E_T_A __ L_C_O_M_P_O_S_I_T_IO_N ______________ ~I I 425
The current density (c.d.) required to form a passive film is called the critical c.d. for passivation, ie. The lower ie the better. Figure 9.3 shows that Zr, Nb, Ta and Pd decrease ie' whereas So increases it. It has been found (Okazaki et al. 1994) that ie can be related to the percentages of Pd, Ta, Nb, Zr and Sn by the following expression
ic(A.m-2 = 1O-2{98-89.5[%Pd]- 9.5[%Ta]- 3.4[%Nb]- O.67[%Zr] + 8[%Sn]}
A new alloy, Ti-15Zr-4Nb-2Ta-O.2Pd, with better corrosion resistance than the conventional Ti-6AI-4V, was proposed by the same authors.
Replacement of Nb for V, in order to eliminate the possible toxic effects of the latter, has been carried out (Semlitsch et al., 1992). Ti-6AI-7Nb showed a corrosion resistance similar to that of Ti-6AI-4V, as concluded from anodic polarization curves (Figure 9.4).
Although not as widely used as titanium, tantalum has found a number of applications, e.g. in vascular clips, as a suture and to fabricate flexible stents to prevent arterial collapse. The reader is referred to a paper by J. Black (1994), where the material properties are reviewed, together with
5
0.05 ~g TH5-10mass"lo)Zr·(4-8"1o)Nb·(2-4"1olTa·(0-0.2"1o)Pd
'\70 TH10-20"lo)Sn·I4-8"1o)Nb·2%Ta·0.2"1oPd <D THI5-20"lo)Zr·4"1or~b·2"1o Ta·0.2%Pd
310K Oeaeraled
o 0.2 2 4 6 8 10 12 14 16 18 20 22
Alloying content. Cx/mass%
Figure 9.3 Effects of Zr, Nb, Ta, Pd and Sn contents critical current density for passivation in 15% H2S04 and 5% HCl solutions at 310 K. (Okazaki et aI., 1994.)

426 I ~I ___________ C_O_R_R_O_S_I_O_N_O_F __ M_E_T_A_L_L_IC __ IM __ P_LA __ N_T_S __________ ~
10000
N 1000 E u ... < :J.
~ 100
11\ C Q> "0
~ 10
c Q> L L :J U
0.1 LL~~~~~~~~~~~-L~~-L~~~
-1000 -500 o 500 1000 1500 2000
Potential against SeE (mV)
Figure 9.4 Current density/potential curves of five different implant materials in Ringer's solution bubbled through with nitrogen .• AISI 316L; eCoNiCrMo; • Ti6AI-7Nb; ~ CP-titanium; x Ti-6AI-7Nb/ODH. (Semlitsch et at., 1992.)
the host response and clinical applications. In terms of corrosion resistance, tantalum is at least equivalent to titanium. Its oxide, Ta20 s, is very stable over very wide pH and potential ranges, thus explaining the excellent corrosion resistance. According to Black, high cost and difficulties of fabrication are some of the reasons for its limited usage.
Cr and Mo are the major alloying elements responsible for the corrosion resistance of stainless steels. These alloys are also very sensitive to inclusion content, which has led to continuous attempts to reduce impurity concentrations. F138 and F139 are variations of the AISI 316L stainless steel with a lower content of non-metallic inclusions. A duplex stainless steel, 25Cr-7Ni-4Mo-O.25N, shows a better corrosion resistance than conventional austenitic stainless steels (Cigada et aI., 1989). The authors have established the following ranking: 23Cr-4Ni<AISI 316L<ASTM F138<22Cr-SNi-3Mo<27Cr-31Ni-3.5Mo<25Cr-7Ni-4Mo-N.
9.2.3 Site for attack
Normally, pitting initiates at non-metallic inclusions. In stainless steels sulphides are particularly prone to attack. Oxide inclusions may also give origin to attack, but they are less active than sulphides. Carbides may also nucleate pitting attack and when they are numerous at grain boundaries they may give rise to intergranular corrosion. However, with surgical
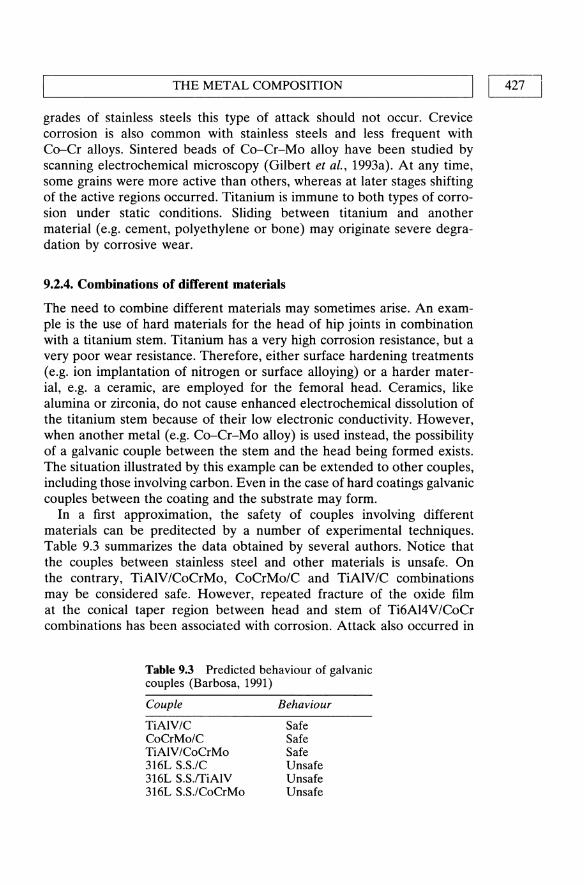
L-_____________ TH __ E __ M_E_T_A_L_C_O_M_P_O_S_I_TI_O_N ______________ ~I ~I -4-2-7-1
grades of stainless steels this type of attack should not occur. Crevice corrosion is also common with stainless steels and less frequent with Co-Cr alloys. Sintered beads of Co-Cr-Mo alloy have been studied by scanning electrochemical microscopy (Gilbert et ai., 1993a). At any time, some grains were more active than others, whereas at later stages shifting of the active regions occurred. Titanium is immune to both types of corrosion under static conditions. Sliding between titanium and another material (e.g. cement, polyethylene or bone) may originate severe degradation by corrosive wear.
9.2.4. Combinations of different materials
The need to combine different materials may sometimes arise. An example is the use of hard materials for the head of hip joints in combination with a titanium stem. Titanium has a very high corrosion resistance, but a very poor wear resistance. Therefore, either surface hardening treatments (e.g. ion implantation of nitrogen or surface alloying) or a harder material, e.g. a ceramic, are employed for the femoral head. Ceramics, like alumina or zirconia, do not cause enhanced electrochemical dissolution of the titanium stem because of their low electronic conductivity. However, when another metal (e.g. Co-Cr-Mo alloy) is used instead, the possibility of a galvanic couple between the stem and the head being formed exists. The situation illustrated by this example can be extended to other couples, including those involving carbon. Even in the case of hard coatings galvanic couples between the coating and the substrate may form.
In a first approximation, the safety of couples involving different materials can be preditected by a number of experimental techniques. Table 9.3 summarizes the data obtained by several authors. Notice that the couples between stainless steel and other materials is unsafe. On the contrary, TiAIV/CoCrMo, CoCrMo/C and TiAIV/C combinations may be considered safe. However, repeated fracture of the oxide film at the conical taper region between head and stem of Ti6AI4V/CoCr combinations has been associated with corrosion. Attack also occurred in
Table 9.3 Predicted behaviour of galvanic couples (Barbosa, 1991)
Couple
TiAIV/C CoCrMo/C TiAIV/CoCrMo 316L S.S./C 316L S.S.ITiAIV 316L S.S./CoCrMo
Behaviour
Safe Safe Safe Unsafe Unsafe Unsafe

CORROSION OF METALLIC IMPLANTS 428 I I L-____________________________________________________ ~
CoCr/CoCr combinations and was proportional to the duration of implantation, as seen in Figure 9.5 (Gilbert et aI., 1993b). A larger percentage (34.5%) of cases of corrosion was found with mixed CoCrITiAlV systems than with CoCr/CoCr systems (7%) (Cook et aI., 1994). Corrosion occurred at the interface between head and neck of modular components. No correlation between the presence or extent of corrosion with the time in situ was found. In another study the percentage of corroded tapered connections between titanium-alloy stems and cobalt-alloy heads was found to be about 57% (Collier et aI., 1991). Titanium-titanium and cobaltcobalt alloy combinations did not result in interfacial corrosion. 85% of prostheses made of dissimilar materials exhibited corrosion 24 months or more postoperatively. The data indicate that a correlation exists between corrosion and time of implantation.
In view of the above clinical data it is advisable to avoid using dissimilar metals for modular hip prostheses. The occurrence of fretting corrosion at the taper region is responsible for the release of metallic ions that may have cytotoxic effects.
120 . - - _. 0 heads -- A necks
100 0
80 "tl "1:1
II) OJ
0 "1:1 "tl 0 0
60 ... ... ... ... 0 0 ... ~' A U U
.> -' C 40 0 c OJ A II)
() ()
... .. ~ So. OJ .. 0' 0
II)
C- o.. 20 6
A 0 A
-20 ,~ ~~ r>:J\;) b<~ ,,:)\;) ~~ t\\;) to\;) cf>
~/ / / / / / / / /
" ~> ~, ~, ":), ~, t\' '0'
Time (months)
Figure 9.S Graphs summarizing the percentage of mixed metal components which show signs of moderate to severe corrosion as a function of duration of implanation. The dotted regression line was fit to the data for the heads (0) and the solid line was fit to the data for the necks (A). (Gilbert et aI., 1993b.)

THE PHYSIOLOGICAL ENVIRONMENT I I 429 L-______________________________________________________ ~
Laboratory galvanic current measurements can be very useful in the pre-screening of materials. For instance, in a study on dental implant bridges it has been reported that silver-palladium, when brazed to titanium, corrodes in vitro (Ravnholt and Jensen, 1991), thus eliminating the need to carry out in vivo tests.
As a final note it must be stressed that laboratory static tests should only be used to eliminate dangerous metal-metal combinations, and not as an acceptance criterion. Fretting may substantially alter the properties of the interface, by continuously removing the passive oxide film, thereby inducing severe attack of a metal which, otherwise, would remain unaffected.
9.3 ASPECTS RELATED TO THE PHYSIOLOGICAL ENVIRONMENT
9.3.1 Contamination of tissues by corrosion products
Contaminations of tissue with metals may have two origins. The first is the release of ionic species resulting from the process of electrochemical dissolution of the implant. This is normally associated with static corrosion. Under dynamic conditions, and particularly when fretting occurs, small metallic particles detach from the surface, and become embedded in the soft tissue around the implant. The fate of these particles may vary, depending on their size and chemical nature. They may, for instance, undergo a process of corrosion, with the consequent release of metal ions. This process may take place both in the extracellular matrix or as a result of macrophage activity. Table 9.4 gives the concentration of Cr, Ni, Fe and Co in biological samples. It shows that tissues around implants may be orders of magnitude richer in these metallic elements than normal blood or normal bone.
Table 9.4 Concentration of metallic elements in biological samples (Barbosa, 1992)
Sample
Normal blood*
Normal bone*
Tissue around Implants (max)**
316SS
Co-Cr-Mo
Cr
2-6 ppb 460 ppb
10000 ppm
10200 ppm
Ni
3-7 ppb 900 ppb 1400 ppm 1500 ppm
* Wet weight; data from Tsalev and Zaprianov, 1983. ** Concentrations in dry tissue; data from Pohlcr, 1983. ppm: Parts per million. ppb: Parts per billion.
Fe
200-680 ppm 91
ppm 20000 ppm 3650 ppm
Co
0.1-0.2 ppb
22000 ppm

430 I LI ___________ C_O_R_R_O_S_I_O_N_O_F __ M_E_T_A_L_L_IC __ IM __ P_LA __ N_T_S __________ ~
Titanium has a tendency to accumulate in tissues. The concentrations can be very high, as indicated in Table 9.5. Titanium was not excreted in the urine of hamsters injected with metal salts (Merritt et al., 1992). Small concentrations were found in the serum, red blood cells and organs. Only 5.5% of the injected titanium was found in the kidneys, liver, lung and spleen tissues. The authors suggest that titanium accumulates at the injection site due to the high stability of the titanium dioxide that is formed at physiological conditions. In the same study nearly all the injected vanadium was recovered in the urine. This behaviour is similar to that of nickel and cobalt, and is related to the formation of highly soluble compounds.
High concentrations of metals were found in capsule and fibrous membranes of loose titanium and Co-Cr stems of total hip prostheses (Dorr et al., 1990). The same work reports elevated metal ion concentrations in synovial fluid and blood whenever cemented and uncemented stems are loose, but no increase when they are fixed. The average values are given in Table 9.6. The standard deviations (not shown) were often very large, of the order of magnitude of the averages.
Polyethylene wear debris may artefactually contribute to high ion readings in periprosthetic tissues, as indicated in Tables 9.7 and 9.8 (Meldrum et al., 1993). The high concentrations found in UHMWPE are due to the manufacturing processes. These tables show that there are statistically significant increases in Co, Al and Ti in the nonarticulated inserts with
Table 9.5 Concentration of titanium in tissues surrounding titanium implants
Tissue
Bone Soft tissue Soft tissue
Concentrations (ppm)
< 2100 2000
56-3700
Ref
Ducheyne, 1984 Meachim, 1973
Agins, 1988
Table 9.6 Concentration (1J.g/l) of metals in tissues and blood retrieved during total arthroplasty of cementless stems (Dorr et aI, 1990)
TiAlV stems CoCr stems
Sample Ti Al V Co Cr Mo Ni
SF 556 654 62 588 385 58 32 SF (control) 13 109 5 5 3 21 5 CAP 1540 2053 288 821 3329 447 5789 CAP (control) 723 951 122 25 133 17 3996 FM 20813 10581 1027 2229 12554 1524 13234 Blood 67 218 23 20 110 10 29 Blood (control) 17 12.5 5.8 0.1-1.2 2-6 0.5-1.8 2.9-7.0
SF - synovial fluid; CAP - capsule; FM - fibrous membrane.
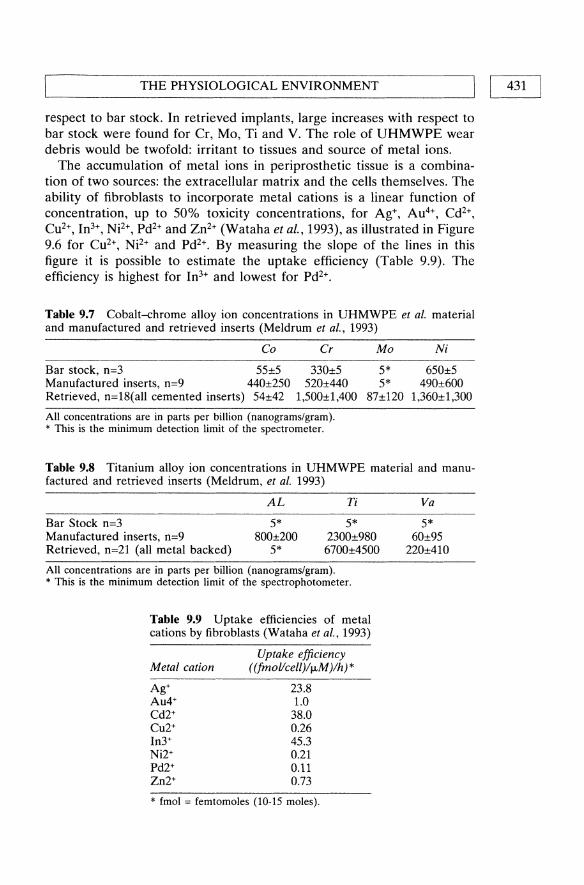
~ __________ T_H_E_P_H_Y_S_I_O_L_O_G_IC_A __ L_E_N_V_I_R_O_N_M_E_NT __________ ~I I 431
respect to bar stock. In retrieved implants, large increases with respect to bar stock were found for Cr, Mo, Ti and V. The role of UHMWPE wear debris would be twofold: irritant to tissues and source of metal ions.
The accumulation of metal ions in periprosthetic tissue is a combination of two sources: the extracellular matrix and the cells themselves. The ability of fibroblasts to incorporate metal cations is a linear function of concentration, up to 50% toxicity concentrations, for Ag+, Au4+, Cd2+,
Cu2+, In3+, Ni2+, Pd2+ and Zn2+ (Wataha et al., 1993), as illustrated in Figure 9.6 for Cu2+, Ni2+ and Pd2+. By measuring the slope of the lines in this figure it is possible to estimate the uptake efficiency (Table 9.9). The efficiency is highest for In3+ and lowest for Pd2+.
Table 9.7 Cobalt-chrome alloy ion concentrations in UHMWPE et al. material and manufactured and retrieved inserts (Meldrum et al., 1993)
Co Cr Mo Ni
Bar stock, n=3 55±5 330±5 5* 650±5 Manufactured inserts, n=9 440±250 520±440 5* 490±600 Retrieved, n=18(all cemented inserts) 54±42 1,500±1,400 87±120 1,360±1,300
All concentrations are in parts per billion (nanograms/gram). * This is the minimum detection limit of the spectrometer.
Table 9.8 Titanium alloy ion concentrations in UHMWPE material and manufactured and retrieved inserts (Meldrum, et al. 1993)
AL Ti
Bar Stock n=3 Manufactured inserts, n=9 Retrieved, n=21 (all metal backed)
5* 800±200
5*
5* 2300±980 6700±4500
All concentrations are in parts per billion (nanograms/gram). * This is the minimum detection limit of the spectrophotometer.
Table 9.9 Uptake efficiencies of metal cations by fibroblasts (Wataha et aI., 1993)
Metal cation
Ag+ Au4+ Cd2+ Cu2+ In3+ Ni2+ Pd2+ Zn2+
Uptake efficiency ((fmol/cell )/fJ.M )/h) *
23.8 1.0 38.0 0.26 45.3 0.21 0.11 0.73
* fmol = femtomoles (10-15 moles).
Va
5* 60±95
220±41O
432 I LI ___________ C_O_R_R_O_S_I_O_N_O_F __ M_E_T_A_L_L_IC __ IM __ P_LA __ N_T_S __________ ~
0.7..,.-----------------r--,
20.6 u ~ o E ~0.5
~ ~ ~ 0.4 .2 i u '0 OJ .~ C " 60.2 u =II i! ~ <0.1
O~~~~~~~~~~~~~~~~
o 50 100 150 200 250 300 Cone. of Cation in Medium (J.IM)
Figure 9.6 Plots of the average uptake of metal cation per cell vs. concentration of the metal cation in the medium for Cu2+, Nj2+, and Pd2+. The least-squares method was used to fit linear curves to the points. (Wataha et at., 1993.)
Two years after implantation of femoral components made of Ti-6AI-4V, the titanium and aluminium concentrations measured in the synovial fluid were higher for cemented components than for the uncemented (200 j.Lm HA, or porous Ti coatings) components (Karrholm et al., 1994). Table 9.10 gives the data for the synovial fluid and the aluminium concentrations in serum and urine. No significant concentrations of vanadium were found in any of the samples, which was also the case for titanium in serum and urine. Fast clearance of vanadium from the synovial fluid, due to high solubility of vanadium complexes, and formation of stable titanium compounds, e.g. titanium phosphates (Ribeiro et al., 1995), might be reasonable explanations for these findings.
Experiments with metal salts and with stainless steel and Co-Cr-Mo electrodes corroded in vivo by applying anodic potentials showed that all the nickel and most of the cobalt were rapidly excreted (Brown et aI., 1988). Acceleration of corrosion by the use of anodic potentials obeys similar mechanisms both in vivo and in saline when a potential of 500 m V
L-__________ T_H_E_P_H_y_S_I_O_L_O_G_I_C_A_L_E_N_V_I_R_O_N_M_E_NT __________ ~I I 433
Table 9.10 Metal concentrations (ng/g) in synovial fluid, serum and urine. Median (range) (Karrholm et al., 1994)
Cemented HA-coated Porous Controls
Ti/synovial fluid 37 (12-56) 3.5 (0-14) 6.4 (0-7.8) o (0-7.5) AI/synovial fluid 12 (6.7-28) 5.2 (2.6-13) 3.8 (2.9-9.1) 7.3 (1.9-19) AI/serum 2.1 (0-11) 1.4 (0-5.9) 5.7 (2.1-16) 3.7 (0-17) AI/urine 6.2 (1.7-17) 4.9 (1.7-7.0) 4.2 (3.7-4.6) 4.6 (2.1-14)
vs. SeE is applied. This is illustrated by the single straight line in Figure 9.7 (weight loss vs. total charge). In particular, this implies that the valency of the released cations is no different in both media, according to Faraday's law.
9.3.2 Problems associated with the chemical analysis of metallic elements in tissues
Acurate analysis of trace elements in tissues is essential to assess the degree of contamination. This is not an easy task, mainly because we are dealing with normal levels of the order of I-Lgllitre. Sampling and sample
o o 2 3 4 5 6 7 8
TOTAL CHARGE (Coulombs)
Figure 9.7 Linear regression analysis of weight loss as a function of total charge for stainless steel rods at 500 mV (SCE) for 30 min. Symbols: * = in saline, box = in 10% serum, circle = in vivo. (Brown et al. 1988.)

434 I ~I ___________ C_O_R_R_O_S_I_O_N_O_F __ M_E_T_A_L_L_IC __ IM __ P_L_A_NT __ S __________ ~
preparation are steps prone to serious contaminations, if the necessary precautions are not taken. As indicated in a review by Lugowski et al. (1990), reported 'normal' levels of Cr in blood span over four orders of magnitude. Contamination during sampling can be avoided by using P1FE or polyethylene materials for blood collection and sample storage. For cutting tissues a blade made of a material free from the elements to be analysed should be used. For example, in our laboratory we have been using pure titanium blades to cut soft tissues for Cr and Ni analysis. Contamination during sample preparation can be minimized by: (i) adopting a very strict protocol of labware cleaning; (ii) chemical treatment with ultrapure reagents, preferably in a microwave oven to reduce the time necessary for digesting tissues; (iii) use a laminar flow hood to prepare the samples, in order to avoid airborn contamination.
Lugowski has published a number of excellent works where the reader can find very detailed information on the above and other aspects. The degree· of precision and accuracy to be expected when adequate experimental methods are used is indicated in Table 9.11. This table refers to an 'internal' lab blood standard and to a Standard Reference Material (SRM) with vanadium concentration certification. The relative standard deviation (RSD) ranges from ca. 10% for Ni and Co, to ca. 29% for V.
9.3.3 Corrosion in sweat
The main constituents of sweat are chlorides (0.3-3.0 gil), urea (0.12-0.57 gil) and lactic acid (0.45-4.5 gil). When metallic objects come in contact with skin corrosion may occur, and if the corrosion products are toxic or irritating they may originate contact dermatitis. The most common example is dermatitis caused by nickel-containing jewelry. In North America ca. 10% of men and women have a history of nickel dermatitis (Rand in, 1988). Although the degree of sensitization may not be directly
Table 9.11 Precision of laboratory standard and precision and accuracy of SRM 909 human serum (Lugowski et ai., 1990)
Element X (JJ.gllitre) n SD RSD (%)
Al 1.88 10 0.35 18.8 Co 2.37 9 0.26 10.9 Cr 0.71 8 0.14 19.6 Ni 2.95 8 0.30 10.1 Ti 4.20 7 0.41 9.8 V 0.28 8 0.08 29.4 V in SRM 909 2.73 13 0.14 5.0 certified value = 2.70±0.56 JJ.gllitre
x - concentration; n - number of measurements; SD - Standard deviation; RSD - Relative SD.

THE PHYSIOLOGICAL ENVIRONMENT I I 435 L-______________________________________________________ ~
related to the amount of metal ions released from an object, due to variability of response from person to person, it is generally considered that a high corrosion resistance gives rise to fewer allergies.
The corrosion resistance of several materials in artificial sweat is given in Table 9.12 (Randin, 1988). The composition (gil) of the medium used was: 20 NaCl, 17.5 NH4CI, 5 urea, 2.5 acetic acid, 15 lactic acid, pH 4.7. The table gives the corrosion potential, Ecorp in 02- and N2-saturated medium, the pitting potential, Epit' and the corrosion rate, icorr' measured by the Tafel extrapolation method. icorr is given only for those alloys which are in the active state. For the other alloys Epit is given. The following materials were found to corrode in the active state: Ni, CuNi25, NiAI (50:50, 60:40 and 70:30), WC+Ni, white gold, FN42, Nilo Alby K, NiP. Alloys such as stainless steels, TiC+M02C+Ni, NiTi, Hastelloy X, Phydur, PdNi, and SnNi are in the passive state and may pit under exceptional circumstances. Titanium has an extremely high Epit and therefore cannot pit under normal use.
9.3.4 Influence of proteins on the corrosion resistance
Albumin has a detrimental effect on the corrosion resistance of cast Co-Cr-Mo alloy (Tomas et aI., 1994). The breakdown potential in 0.15 M NaCI is 0.40 ± 0.02 V vs. SCE, whereas in 0.15 M NaCI+albumin it is 0.25 ± 0.06 V vs. SCE.
The presence of 5% bovine serum in lactated Ringer's solution (pH=6.5) increases the corrosion rate of Ti-6AI-4V alloy, as shown in the last two columns of Table 9.13 (Lewis and Daigle, 1993b). This table gives data obtained by direct current (d.c.) and alternating current (a.c.) methods. The difference between d.c. and a.c. corrosion rates found in this system is not unusual. The same table also shows that decreasing the pH of lactated Ringer's solution to 1 has a dramatic effect on corrosion rate.
Table 9.14 summarizes data obtained for Co-Cr, 316L stainless steel and titanium. The type of electrochemical technique used has an important influence on the results, which might indicate that the electrode potential determines the beneficial or detrimental effect of proteins on corrosion.
9.3.5 Antibiotic-metal interactions
The interaction between a number of antibiotics (oxytetracycline, tetracycline, tobramycin, clindamycin, cefamandole, bacitracin and chloramphenicol) and surgical metallic materials (316L stainless steel, Co-Cr and commercially pure Ti) has shown that only oxytetracycline exerts an effect on the electrochemical response. For all the materials this antibiotic shifted the corrosion potential of abraded surfaces in the noble direction, as seen in Figure 9.8.

436 I I
CORROSION OF METALLIC IMPLANTS
Table 9.U Main Electrochemical Parameters in ISO Sweat (Randin, 1988)
Ecor,(VsHJ EpiC ico,,02
Materials N2 °2 VSHE (J.L4Icm2)
Ni200 -0.16 0.06 22 CuNi25 -0.09 0.06 24 NisoAlso -0.17 0.04 1.1 Ni60A14o -0.20 -0.09 3.6 Ni7oAl3o -0.07 -0.02 2.2 WC+Ni -0.11 0.23 19 TiC+MozC+Ni 0.25 0.31 0.43 White gold -0.01 0.23 0.6 FN 42 -0.24 0.07 0.08 -10 Nilo Alby K -0.24 -0.09 190 NiTi 0.03 0.12 0.60-1.05 AISI303 0.43 12112
} 0.32
AISI304 } -0.04 0.21 0.32 AISI 316F ± 0.09 ± 0.08 0.50 316 PX 0.53 AISI316L 0.53 Hastelloy X -0.06 0.17 >0.89 Phydur 0.26 0.29 0.46 NiP -0.19 -0.02 40 NiP/450 °C -0.15 0.09 18 PdNi 0.33 0.45 0.46 SnNi 0.07 0.08 0.2 Cr 0.21-0.36 0.26 0.85 Sandvik 1802 -0.02 0.22 0.61 Shomac 0.15 0.26 >0.75 Co -0.24 -0.15 340 COsoAlso -0.29 -0.26 18 WC+7% Co -0.24 -0.10 200 WC+10% Co -0.25 -0.12 480 Stellite 20 >0.75 Ni >3.0
9.4 ASPECTS RELATED TO THE OXIDE AND OTHER SURFACE LAYERS
9.4.1 Effect of anodizing and passivation treatments on the corrosion resistance of titanium
icor,N2
(f.LAlcm2)
0.18 <0.1
«0.1
«0.1 2.4 0.32
-0.1
-0.1
-0.1 -0.1
For a detailed description of anodic oxidation of titanium and its alloys the reader may refer to a review by Aladjem (1973).
The oxide on titanium can grow to thicknesses of the order of 100 nm or more by applying anodic currents in suitable electrolytes. H3P04 and NaOH baths have been used for this purpose. The colour of the oxide

L-__________ T_H_E_P_H_y_S_I_O_L_O_G_I_C_A_L_E_N_V_I_R_O_N_M_E_N_T __________ ~I I 437
Table 9.13 Electrochemical characteristics of Ti6Al4V alloy in three biosimulating solutions (Lewis, 1993b)
Eeo,,';' l3ab l3eac Rpd ReO idef iaeg
Solution (mV) (m V per decade) (M [)fem2) (nA/em2)
Lactated Ringer's (pH = 6.5)
Lactated Ringer's (pH = 6.5) + 5% bovine serum
Lactated Ringer's (pH = 1)
a Corrosion potential. b Anodic Tafel slope. C Cathodic Tafel slope.
185 210 301
336 187 234
147 306 1650
d Polarization resistance; obtained from d.c. results. e Polarization resistance; obtained from a.c. results.
2.57
1.45
0.33
f Corrosion current density; obtained from the values for ~. g Corrosion current density; obtained from the values for R".
P ........ , CmY va S.C.E.)
1.00 21
0.70 31
0.22 340
-100 0---_--- _ -.0------ --- -0------ ----0
_------5---
_... :"":;~~~=;~~~~;~;~c~~;~-:~----:~~=~-~~~ " ,,"/-r'" .,..,0-" _________ 0-----------0
!a' .. i.,·· , .. /" --------0-, _-----0----300 -;' . __ --
Ct' /// ,,-,,0-f i /"
-"00-' ,/ :1 ,
4 " 6'
-Ioof' o
-IOO-!r---------r----_____ ,r--------.,--------.,-------~.~., 10 120 1.0 240 300
54
65
510
Figure 9.8 Potential-time curves for pure titanium in 0.9% saline with and without additions of oxytetracycline: O(upper line), as received; O](lower line), abraded; 00.01 mg mJ-1; 00.1 mg mJ-1; t:, 1.0 mg mI-l. (von Fraunhofer et al., 1989.)

438 I ~I ___________ C_O_R_R_O_S_I_O_N_O_F __ M_E_T_A_L_L_IC __ IM __ P_LA __ N_T_S __________ ~
Table 9.14 The influence of proteins on the corrosion resistance of metals
Material Effect
F75 Co-Cr-Mo alloy Increased corrosion with porous coating rate of F75 beads
316L stainless steel Marginal increase in pitting potential
316L stainless steel Increased corrosion rate*
cp titanium Increased corrosion rate
Ti-6AI-4V Insignificant effect c.p. titanium Dual role
316L stainless steel Increased pitting potential
F75 Co-Cr-Mo alloy Increased Co and Cr release
Remarks
Accelerated anodic corrosion method: 10% serum (Hughes et al., 1990)
Anodic polarization curves; 10% serum (Chawla et al., 1990)
Polarization resistance method; static conditions 10% serum (Williams et al., 1988)
idem
idem Beneficial effect in the absence
of breakdown and detrimental when attack takes place; potentiodynamic and galvanostatic experiments; 10% serum (Sousa and Barbosa, 1993)
Potentiodynamic and galvanostatic experiments; 10% serum (Sousa and Barbara, 1991)
Constant potential (500mV vs. SCE); 10% serum (Brown et al., 1988)
316L stainless steel Decreased weight loss Constant potential (500mV vs. SCE); 10% serum (Brown et al., 1988)
* Under fretting conditions the corrosion rate decreases.
changes with thickness due to light interference. A gold colour corresponds to a thickness of the order of 10-25 nm whereas a blue colour is normally associated with thicknesses of 30-60 nm. The corrosion resistance of anodized titanium increases as the oxide becomes thicker. This is illustrated in Figure 9.9 (Cigada et al. 1992), which shows that films formed in H3P04 are thicker than those formed in air. They are also more protective, since the passive current density in a buffered physiological solution at 38°C is ca. 10% that measured for specimens oxidized in air. The same figure shows that anodizing in NaOH is not so effective in reducing the current density as doing it in H 3P04•
The corrosion rate of anodized titanium (solution: 60 ml ethanol, 35 ml water, 10 ml lactic acid, 5 ml phosphoric acid, 5 mg citric acid and 5 mg oxalic acid; 45V, 45s) is much lower than that of passivated titanium (40%

~ _______ T_H __ E_O_X_I_D_E_A __ N_D_O_T_H_E_R __ S_U_R_F_A_C_E_L_A_Y __ E_R_S ______ ~I I 439
-0.8 Specimens 0
oxidized in air- std. dev.
0.6
N , E 0 0.4 <{
.s
.Q.
0.2
0
-
-
-
-'--
~
2 nm
.. -
2 nm
Specimen anodizeo
In NaOH Specimens anodized in H3PO • -
-
-
-
r-
400 nm
high current density low current density
- .--l I I .- 1.-1 I I • -------.,
1 80 1 210 nm nm
20 140 nm nm
Oxide thickness
20 1140 1 nm nm
80 240 nm nm
D ~
Figure 9.9 Average passivity currents (between 600 and SOO h) and standard deviations in physiological solution of Ti6AI4V specimens, oxidized and anodized in different conditions. (Cigada et al. 1992.)
volume nitric acid, room temperature, 30 min.), as indicated in Table 9.15 (Ong et al., 1993). The corrosion potential of the former is also more noble, as indicated in the same table. The average thicknesses are given in Table 9.16. The anodized film is ca. 10 times thicker than the passivated film.
There have recently been reports (Lowenberg et aI., 19941 Callen et aI., 1995) indicating that passivation of Ti-6AI-4V in HN03 increases the release of all three constituent elements in a culture medium (a-Minimal Essential Medium with 15% foetal bovine serum and 10% antibiotics). Table 9.17 exemplifies the results obtained for titanium ions, for three periods of immersion of three days each. The level of Ti is significantly reduced throughout the 9-day experimental period.
Table 9.15 Corrosion results (Ong et aI., 1993)
Treatment
Non-passivated Passivated Anodized
Average Ecorr±l SD (mV)
-13S.4±25.9 -104.7±22.S
34.4±17.4
0.015±0.0l 0.003±0.00l
90.0006±0.000l

440 II L ___________ C_O_R_R_O_S_I_O_N_O_F __ M_E_T_A_L_L_IC __ IM __ P_LA __ N_T_S __________ ~
Table 9.16 Titanium oxide thickness (nm), relative to tantalum pentoxide (Ong et ai., 1993)
Treatment
Non-passivated Passivated Anodized
Mean
3.1 4.1
43.6
SD
0.6 1.8 4.9
Sample size
1.8 1.8 1.S
Table 9.17 Trace Levels of Ti, AI, and V in culture medium (Callen et al., 1995)
cpTi Wells Ti6Al4V Wells
Time Not Not Control points Passivated Passivated Passivated Passivated Values
Ti 1st 23.696±12.892 lS.73S±3.3S4 12.S99±3.8S0 23.338±8.497 4.983±0.977 2nd 12.6S0±S.27S 16.640±4.940 l1.0S0±1.601 24.64S±8.419 3rd 6.444±2.49S 8.738±2.983 S.S13±1.943 1O.486±3.674
Al 1st 4.091±0.677 4. 133±0.523 8.933±1.187 16.878±4.574 3.476±0.392 2nd 4.694±1.039 S.S23±2.784 S.703±0.707 9.6S6±2.7S0 3rd S.21S±1.096 4.l49±0.397 4.516±0.384 6.614±1.407
V 1st 0.S08±0.199 O.366±O.167 6.19S±2.191 21.104±8.828 O.246±O.O82 2nd O.2SS±0.018 O.l71±O.OSl 2.789±1.129 1O.096±S.697 3rd 0 O.330±O.213 O.S88±O.334 4.218±2.003
9.4.2 Effect of coatings and surface treatments on the corrosion resistance of stainless steel and titanium
When metals are used as coatings the possibility of occurrence of galvanic corrosion exists, since cracks or pores in the coating enable the corrosive medium to contact the substrate. Mainly for this reason metallic coatings have not been used in internal implants. However, surface treatments with inert materials have been widely applied and are now in clinical practice. The effect of these and other surface treatments will be addressed in this section.
With the development of ion implantation the plating of practically any element on any substrate opened new perspectives to surface modification of biomaterials. Carbon and nitrogen have been the species most widely employed to modify the corrosion and wear behaviour of stainless steels and titanium alloys. However, the plating of metallic elements, with a view to modifying either the corrosion performance and/or the biological behaviour of metallic implants, is an interesting possibility. This would be particularly valuable in the case of stainless steel substrates. Very little

~ _______ T_H __ E_O_X_I_D_E_A __ N_D_O_TH __ E_R __ S_U_R_F_A_C_E_L_A_Y __ E_R_S ______ ~I I 441
has been reported in this area. Titanium, niobium and tantalum coatings on stainless steel act as anodes, therefore indicating that they may retard the transfer of chromium and nickel into the environment (Gluszek and Masalski, 1992). In the same medium (Ringer's solution) the oxide layers formed on titanium, niobium and tantalum by prolonged (lOOh) exposure to air are not very stable. Figure 9.10 shows this effect (dotted line). The galvanic current first increases, corresponding to modification/destruction of the original oxide layer, and then decreases, corresponding to increased stability of the film formed in solution. When freshly ground specimens are used (solid line) the galvanic current decreases with time, due to film growth, which follows a logarithmic law [log i oc (- log t)].
Laser surface alloying (LSA) of Ti6Al4V with Nb, Mo and Zr, in order to increase surface hardness, has shown that the latter element is the most promising (Akgun and Inal, 1994). The hardness increase is almost threefold in comparison to the substrate and identical to that obtained by laser surface melting (LSM). Since a nitrogen atmosphere was used in LSA and LSM, TiN formed during melting appears to be the main reason for the
i,Acm-2
10-6
~'''''--''''''' , ... ,," ... , ...... , ... , ... / ' ....
/ .... , 'il
,/ anode cathode /--Ti St
, ----- Ti St (Ti passivated)
6.101
1
1 ,"""I. I
:: 1
t, s
hour
2L hours
Figure 9.10 Galvanic current density-time relationship for 316L1titanium couple in Ringer's solution. (Gluszek and Masalski, 1992.)

442 I LI ___________ C_O_R_R_O_S_I_O_N_O_F __ M_E_T_A_L_L_IC __ IM __ P_LA __ N_T_S __________ ~
high hardnesses obtained. The hardened zone extends to a depth of over 0.5 mm. Wear and fretting corrosion could be considerably reduced with such surface treatments, but no experimental data are yet available.
Radio-frequency (RF) plasma treatments in air (1.0 torr) produced enhanced ionic release from Co-Cr-Mo and Ti-6AI-4V alloys, without any improvement in biological behaviour (Kummer et at., 1992). Table 9.18 gives the Cr, Co and Ti concentrations obtained after 10 days exposure to cell culture fluid (DMEM with 10% FBS). The RF plasma-treated Ti-AI-V alloy shows a 3-fold increase after the plasma-treatment.
Depassivation of Ti-6AI-4V occurs during planar-planar rubbing against PMMA in Ringer's solution (Rabbe et at., 1994). The free corrosion potential drops to values below -650 mV vs. SCE. This potential is substantially lower than those obtained for nitrogen ion-implanted and ion-nitrided Ti-6AI-4V, which are of the order of, -100 mV vs. SCE. At high doses (-2xlOl.8 ions/cmZ) a TiN layer is formed on ion-implanted surfaces, whereas TiN and TizN form as a result of ion nitriding, thus increasing the hardness of the alloy surface.
Superalloy MA 956 (Fe-20Cr-4.5AI-O.5Ti-O.5Yz0 3, wt%) possesses the interesting ability of developing a fine a-alumina scale on the surface upon isothermal treatment at 110°C (Escudero and Gonzalez-Carrasco, 1994). This layer acts as a coating, being responsible for an improved corrosion resistance of the alloy, as indicated by the anodic polarization curves given in Figure 9.11. No pitting corrosion occurs for potentials up to 700 mV vs. SeE.
Hard ceramic coatings (Alz0 3 and SiC) deposited by radio-frequency (RF) sputtering on Ti and Co-Cr-Mo alloy resulted in significant corrosion resistance improvement, as seen in Table 9.19 (Sella et aI., 1990). The data in this table were obtained by applying a constant potential of 1.4 V vs. SCE and measuring the corrosion current density (c.d.) in artificial saliva. SiC coatings deposited on Ti caused a decrease of c.d. of ca. 300 times. The same coating applied to Co-Cr-Mo was only effective when an intermediate Ti sub layer was used to avoid cracking. An AI-Alz0 3
Table 9.18 Concentration of Cr, Co and Ti in cell culture fluid after 10 days (Kummer et al., 1992)
Sample
Control Co-Cr-Mo Co-Cr-Mo/RF Ti-AI-V Ti-AI-V/RF
Cr
1.1 96.5 120.5
RF = Radio-frequency plasma treated.
concentration (tJlmL)
Co
<2 720 960
Ti
35.6 102.0

L-_______ T_H __ E_O_X_I_D_E_A_N __ D_O_T_H_E_R __ S_U_RF __ A_C_E_L_A_y __ E_R_S ______ ~I I 443
-HE 101
u -4 ~ 102
>' 101 I-
III Z W 0
I-Z -I W 10 0: 0: -2 :::> 10 u
0 100 200 300 400 500 600 700
POL ARIZ A TlON, m VS.C.E
Figure 9.11 Anodic polarization curves for MA956 in the as-received and oxidized conditions after nine months of immersion in Hank's solution. 0 Oxidized; 0 as-received. (Escudero and Gonzalez-Carrasco, 1994.)
cermet sublayer was also very effective in improving the corrosion resistance of Al20 3-coated Co--Cr-Mo alloy; the c.d. decreased 200 times when both layers were used. The authors indicate that Al20 3 and SiC coatings gave better biocompatibility than Ti and that no signs of corrosion were observed on Al20 3-coated dental implants removed after several years of implantation.
Modification of Ti-6AI-4V alloy surfaces by ion implantation with iridium, at fluences of 0.74 x 10¹⁶ and 1.48x10¹⁶ ions/cm2, corresponding to 2.5 and 5.0 at% Ir peak concentrations, has been reported (Buchanan
Table 9.19 Comparison of the corrosion currents of coated and uncoated metals (Sella et aI., 1990)
Uncoated metal or alloy Ni-Cr Co-Cr-Mo Ti Experimental coatings SiC (1 !-lm) on Ti SiC (1 !-lm) on Co-Cr Ti (1 !-lm) on Co-Cr SiC (1 !-lm) + Ti (1 !-lm) on Co-Cr Alz0 3 (0.5 !-lm) on Co-Cr Alz0 3 (0.5 !-lm) + AI-Alz0 3 cerment on Co-Cr
Corrosion current at E=1.4V/SCE (flAIcm2)
6000-8000 8000 260
0.8 10000 500 28
1800 40

CORROSION OF METALLIC IMPLANTS 444 I I L-____________________________________________________ ~
and Lee, 1990). After pre-treatment of the implanted surfaces in 1N H2S04
the surfaces become enriched in Ir (the concentrations are over 60% and may approach 100%), as a consequence of alloy dissolution. The result is a corrosion potential in isotonic saline very close to that of pure Ir, as depicted in Figure 9.12. Owing to the very high corrosion resistance of Ir, its implantation onto titanium is of potential interest, particularly if it becomes significantly enriched on the surface. Galvanic couples formed between Ir and Ti is a possibility that justifies further research.
In an attempt to reduce the release of potentially harmful metal ions from Co-Cr-Mo surgical implants, a thin coating of TiN has been applied via physical vapour deposition (PVD) (Wisbey et aI., 1987). In vitro corrosion performance has been investigated using electrochemical techniques. The release of Co and Cr ions is reduced by the presence of the TiN coating. Data concerning this study are shown in Figure 9.13.
Thermal heating of titanium at 400°C or immersion in 30% HN03,
followed by aging in boiling distilled water for times in the range 6-14 h, greatly reduced the amount of Ti and Al released from Ti-6AI--4V, as shown in Table 9.20 (Browne and Gregson, 1994). The corrosive medium was bovine serum at 37°C. The table also gives the ion release for two other treatments: immersion in 30% HN03, for 10 min., which is the conventional commercial treatment, and immersion for 16h in the same solution followed by rinsing in distilled water (N). The beneficial effect of the first two treatments is attributed to formation of rutile, which is
800r-----------------------------____________ ~ -PURElr -- 2.5 aL -.- Ir IN TI-6AI-4V ---- 5.0 at. -" Ir IN T....oAI-4V
700r-·,
iii 600 ~ .\ --.- PREPASSIVATED T....oAI-4V - •• - AS-POUSHED T....oAI-4V ...
; 500~t-~~:\~~------------____________ ~~-> ~===:~-----------------~~==~ .5. 400.... ~--------J -------_____ •
~ 300- -"":.::::a.... b 200 f- •• - •• - •• ---•• -----••
c. 100 ~/ I
Or-
-1 00 ~--!.'_--Lr_---l, __ l--' __ ,L_..___Lr_--L., __ ...I...._ '_.l.-'-..J o 10 20 30 40 SO
TIME Cd)
Figure 9.U Corrosion potential vs. time in aerated isotonic saline. (Buchanan and Lee, 1990.)

L-________ T_H_E_O_X_I_D_E_A __ N_D_O_T_H __ E_R_S_U_RF __ A_C_E __ LA __ y_E_R_S ________ ~I I 445
more dense and has a closer packed structure, with fewer paths for ion diffusion, than the oxide formed upon passivation in nitric acid.
Commercially pure titanium and Ti--6Al--4V implants ion implanted with nitrogen heal as well as non-treated samples in cortical bone (Johansson et aI., 1993), as indicated by the existence of no statistically significant differences in total bone-metal contact.
1.5
N
E ~ ... ...:! >- 1.0 ..
·M c ..
"1J .. ... III .. ~ .2 iO .. ... 0.5 :E
Cobalt Chromium Molybdenum Titanium
Figure 9.13 Metallic dissolution products released from a polished Co-Cr-Mo alloy after 550 h in 0.17 M NaCI+2.7x10⁻³ M EDTA solution at 37°C. D uncoated; • TiN coated. (Wisbey et al., 1987.)
Table 9.20 Effect of various surface treatments on the dissolution of titanium and aluminium from Ti-6AI-4V alloy (Browne and Gregson, 1994)
Total ion release (fLglcm2)
30% HN03 (C) 30% HN03 (N) 400°C (T) Aged 10 h (A)
Titanium 700 h
0.1 0.11 0.03 0.03
C - Conventional treatment (10 min. immersion). A - Aging treatment (immersion in destilled water). N - Immersion in HN03 for 16 h. T - Thermal heating.
Aluminium 700 h
0.25 0.06 0.026 0.023

446 I I~ __________ C_O_R_R_O_S_IO __ N_O_F __ M_E_T_A_L_L_IC __ IM __ PL_A __ N_T_S ________ ~
9.4.3 EtTect of hydroxyapatite coatings on the corrosion resistance of titanium and stainless steels
Most of the data available on this topic refer to hydroxyapatite deposited by plasma spraying. Although compounds may form at the metal/hydroxyapatite interface, particularly in the case of titanium, their existence has not been unequivocally demonstrated. Titanium phosphates and phosphides, as well as calcium titanates, may exist, but they probably form very thin layers. The large surface roughness, caused by grit blasting of the substrate prior to hydroxyapatite deposition, is another factor that renders identification of any interfacial compounds by surface analysis techniques difficult.
Table 9.21 shows that the corrosion resistance of stainless steel increases upon coating with hydroxyapatite. The presence of calcium phosphate in solution, due to dissolution of hydroxyapatite, seems to be the cause for these changes. The same table indicates that calcium phosphate is detrimental to the corrosion resistance of titanium, both in terms of film breakdown potential and corrosion rate under passive conditions.
9.4.4 Interaction between metal ions and calcium phosphates
Metallic ions may influence the formation of calcium phosphates in different ways. Some inhibit (nickel, tin, cobalt, manganese, copper, zinc, gallium, thalium, molybdenum, cadmium, antimony, magnesium, and mercury), a few stimulate (iron [ferric] and iridium) whereas others have no effect (cerium, titanium, chromium, iron [ferrous], iridium, palladium, platinum, silver, gold, aluminum, and lead) (Okamoto and Hidaka, 1994). Figure 9.14 gives the induction time for calcium phosphate formation vs. concentration for the above metal ions.
Table 9.21 Effect of hydroxyapatite coatings and calcium phosphate solutions on the corrosion resistance of titanium and stainless steel
Material Solution Effect Ref
316L ss/HA Saline Increase in breakdown potential Hayashi et aI., 1990
Ti-6AI-4V/HA Saline Decrease in breakdown potential Hayashi et al., 1990
316L ss Saline+ Increase in breakdown potential Sousa and Ca phosphate Barbosa, 1991
316L ss Saline+ Decrease in corrosion rate Barbosa, 1991 b Ca phosphate (passive state)
Ti cp Saline+ Decrease in breakdown potential Sousa and Ca phosphate Barbosa, 1993
Ti cp Saline+ Increase in corrosion rate Barbosa, 1991 b Ca phosphate (passive state)

THE OXIDE AND OTHER SURFACE LAYERS I I 447 ~----------------------------------------------------~
Zn Mo
MgCdSb
l::::::~~::~~~~~~;;~~;TI~O~~~~NP'~ AuHgAlTIPb ~.,
5 1h is 50 250 Concentration (~M)
Figure 9.14 The induction time (min) versus concentration of various metal ions (open circle) and HEBP: I-hydroxyethylidene-l, I-biphosphonate (closed circle). (Okamoto and Hidaka, 1994.)
Heat treatment of Ti-6AI-4V at 280°C for 3 h produced a high accumulation of Ca deposited next to screws implanted in rats (Hazan et at., 1993), as indicated in Table 9.22. The oxide was twice as thick as that formed on non-treated screws.
The presence of Ca on the surface of titanium implants after a period in vivo is now well established. Ca deposition may be important in influencing protein adsorption, since it has been suggested that glycosaminoglycans adhere to the surface by a Ca-O link rather then via a Ti-N bond (Sutherland et at., 1993).
Aluminium induces demineralization of previously formed bone (Frayssinet et at., 1994), which can be ascribed to formation of stable complex aluminium phosphate compounds (Ribeiro et at., 1995). Aluminium ions may be produced either as a result of dissolution of Ti-6AI-4V alloy or of corrosion of alumina coatings. In pH 4 buffer the release of aluminium ions from alumina is much more significant than at
Table 9.22 Calcium deposition (mg) next to control and heat-treated Ti-6AI-4V implants (Hazan et al. 1993)
Time after immersion (days)
4 5 6 10 35
Control
2.0±0.2 3.l±0.5 4.0±1.0
Heat treated
4.5±6.5 7.4±1.1 9.6±1.0

448 I I~ __________ C_O_R_R_O_S_IO __ N_O_F __ M_E_T_A_L_L_IC __ IM __ PL_A __ N_T_S ________ ~
pH 7 (Frayssinet, 1994). V and Ti retard apatite formation and the growth of apatite seeds, as illustrated respectively in Figures 9.15 and 9.16 for V (Blumenthal and Cosma, 1989). The action of V appears to be related to the formation of V-P04 complexes, whereas that of Ti may be due to poisoning of active growth sites, as in the case of AI.
Hydroxyapatite coatings applied to porous titanium alloys significantly reduced the titanium and aluminium releases, but had no important effect on vanadium release, as shown in Figure 9.17 (Ducheyne and Healy, 1988). No major change was produced in the ion release kinetics from Co-Cr alloys.
2.000 A
... 1.500 :r 0
" z B z • C q 0
! 1.000 tI ~
!! a. j
:r 0
" z 0.500
2 4 6 8
Time (hours)
Figure 9.15 The action of V ions in affecting direct HA precipitation, V as VCls in solution at pH 7.4, 0.15 M NaCl, 37°C in a pH-stat. The quantity of HA precipitated is proportional to the extent of OH uptake. Ca concentration is 2.79 mM; P04 concentration is 1.87 mM, A= control (no V); B=0.50 mM V; C=l.OO mM V; D=2.00 roM V. (Blumenthal and Cosma, 1989.)

L-________ T_H_E_O_X_I_D_E __ A_N_D_O_T_H __ E_R_S_U_RF __ A_C_E __ LA __ y_E_R_S ________ ~I I 449
1.000
.... 0.750 B J: 0 «I Z Z ... a a
] 0.500 ... ~
~ 11 ::> J: 0
'" z 0.250
o 2 4 6 8
Time (hours)
Figure 9.16 The action of V ions on the growth of HA seeds. V as VCls in solution at pH 7.4, 0.15 M NaC!, 37°C in a pH-stat. The amount of HA seeded growth is proportional to the OH uptake. Ca concentration is 1.55 mM; P04 concentration is 1.07 mM, Seed crystals were 0.15 mg/mL, and the seeds had a surface area of 110 m2/g. A = control (no V); B = 1.00 mM V. (Blumenthal and Cosma, 1989.)
9.4.5 Physico-chemical properties of metal oxides
The corrosion resistance of some metals ultimately depends on the presence of a thin oxide film formed by the reaction of the metal with the environment. This is the case of titanium, tantalum, zirconium, molybdenum, aluminium, cobalt, chromium, etc. Table 9.23 gives the physicochemical properties of the oxides formed on some metals. A low oxide solubility is important to guarantee a low rate of corrosion, since any loss in oxide thickness, due to chemical dissolution, will tend to be balanced by oxidation of the metallic substrate. The oxides should also possess low ionic conductivity.
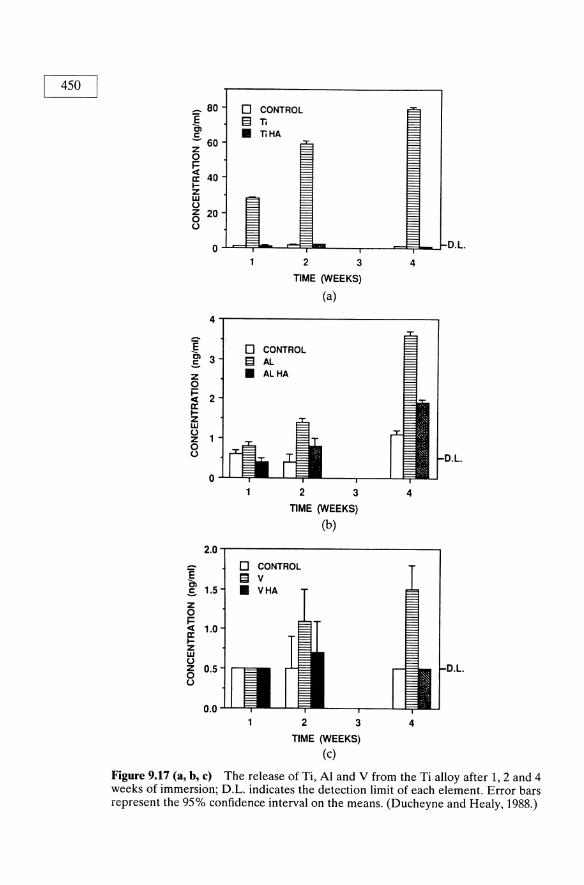
450
~ 80 D CONTROL E El Ti C, • TiHA c - 60 z 0 i= ct
40 II: I-Z W U z 20 0 u
0 D.L
2 3 4
TIME (WEEKS)
(a)
4
~ 3 .s z 0 i=
2 ct II: I-Z W U Z 0 u L
0 2 3 4
TIME (WEEKS)
(b)
2.0
E D CONTROL
C, 13 v .s 1.5 • VHA
Z 0 i= ct 1.0 1= z w U z 0.5 0 u
0.0 2 3 4
TIME (WEEKS)
(c)
Figure 9.17 (a, b, c) The release of Ti, Al and V from the Ti alloy after 1, 2 and 4 weeks of immersion; D.L. indicates the detection limit of each element. Error bars represent the 95% confidence interval on the means. (Ducheyne and Healy, 1988.)
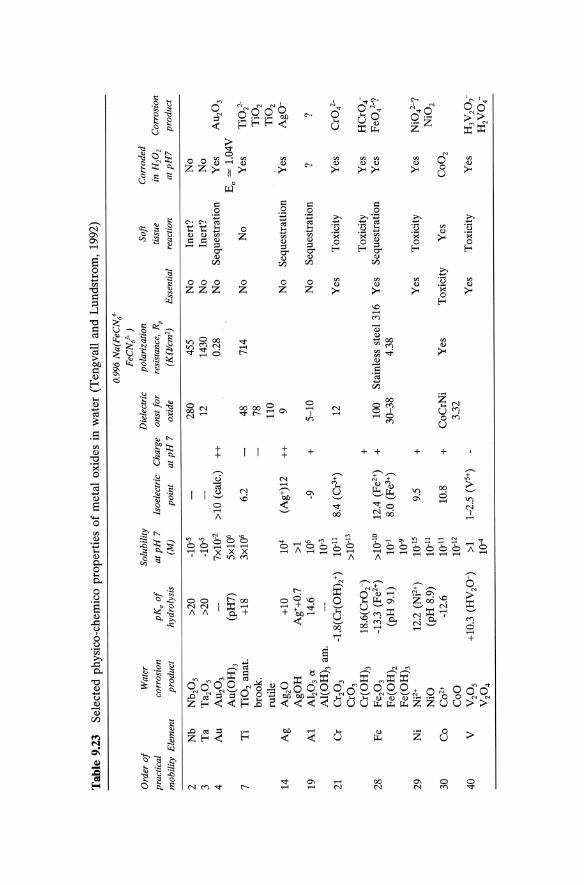
Tab
le 9
.23
Sel
ecte
d p
hy
sico
-ch
emic
o p
rop
erti
es o
f m
etal
ox
ides
in
wat
er (
Ten
gv
all
and
Lu
nd
stro
m,
1992
)
0.99
6 N
a(F
eCN
o"
FeC
N/
) O
rder
of
Wat
er
Solu
bili
ty
Die
lect
ric
pola
riza
tion
So
ft
Cor
rode
d
prac
tica
l co
rros
ion
pK
a o
f at
pH
7
lsoe
lect
ric
Cha
rge
onst
for
re
sist
ance
, Rp
ti
ssu
e in
H20
2 C
orro
sion
mob
ilit
y E
lem
ent
prod
uct
hydr
olys
is
(M)
poin
t a
tpH
7
oxid
e (K
Wcm
2 )
Ess
enti
al
reac
tion
a
tpH
7
prod
uct
2 N
b N
b 20
5 >2
0 _1
0-5
280
455
No
Iner
t?
No
3 T
a T
az05
>2
0 -1
0-5
12
1430
N
o In
ert?
N
o 4
Au
AU
203
7xlO
-2
>10
(cal
c.)
++
0.28
N
o S
eque
stra
tion
Y
es
AU
203
Au(
OH
)3
(pH
7)
5x10
6 Eo
=
1.04
Y
7 T
i T
i02
anat
. +1
8 3x
106
6.2
48
714
No
No
Yes
T
iOl-
broo
k.
78
Ti0
2 ru
tile
11
0 T
i02
14
Ag
Ag 2
0 +1
0 10
4 (A
g+)1
2 ++
9
No
Seq
uest
ratt
ion
Yes
A
gO-
AgO
H
Ag+
+0.7
>1
19
A
l A
I 20
3 ct
14.6
10
6 -9
+
5-
10
No
Seq
uest
rati
on
? ?
AI(
OH
)3 a
m.
10-3
21
Cr
Cr 2
03
-1.8
(Cr(
OH
h+)
1O.n
8.
4 (C
r3+)
12
Y
es
Tox
icit
y Y
es
CrO
l-C
r03
>10.
13
Cr(
OH
h
18.6
(Cr0
2)
+
Tox
icit
y Y
es
HC
r04-
28
Fe
Fe 2
03
-13.
3 (F
e2+)
>1
0-10
12
.4 (
Fe2
+)
+
100
Sta
inle
ss s
teel
316
Y
es
Seq
uest
rati
on
Yes
F
eOl?
F
e(O
H)2
(p
H 9
.1)
10-1
8.
0 (F
e3+)
30
-38
4.38
F
e(O
H)3
10
-9
29
Ni
Nj2
+ 12
.2 (
Nj2
+)
10-1
5 9.
5 +
Y
es
Tox
icit
y Y
es
NiO
l-?
NiO
(p
H 8
.9)
10-1
1 N
i02
30
Co
C02+
-1
2.6
10-1
1 10
.8
+
CoC
rNi
Yes
T
oxic
ity
Yes
C
o0
2 C
oO
10.12
3.
32
40
Y
Y20
5 +1
0.3
(HV
20-)
>1
1-
2.5
(y5+
) Y
es
Tox
icit
y Y
es
H3Y
207-
Y20
4 10
-4
H2Y
04-

452 I ~I ___________ C_O_R_R_O_S_I_O_N_O_F __ M_E_T_A_L_L_IC __ IM __ P_L_A_N_T_S __________ ~
9.4.6 Passive films on metallic implants
The oxide film on metallic implants is usually very thin (5-10 nm). It is formed as a result of a spontaneous reaction between the metal and the environment. In spite of the common use of immersion treatments in nitric acid solutions, usually known as passivation treatments, they are not necessary to form an oxide. They are often responsible for an increase in corrosion resistance due to removal of surface contaminations or inclusions, as in the case of stainless steels. As indicated in section 9.4.1, there have been reports suggesting that this acid treatment may decrease the corrosion resistance of titanium.
Generally, the oxide film grows according to a logarithmic law (log thickness proportional to log time), reaching a quasi-stationary thickness very rapidly. Under stationary conditions, film dissolution and film formation rates should be the same. Normally, film thickness increases slowly with time, after an initial period of rapid growth. This is illustrated in Figure 9.18, which depicts film thickening with implantation time (Kasemo and Lausmaa, 1994).
The dissolution kinetics of titanium follows a two-phase logarithmic model (Healy and Ducheyne, 1992, 1993). In the first phase the concentration of OH groups increases. The second phase coincides with the adsorption of P-containing species. Figure 9.19 clearly indicates the presence of a second phase after 400h of immersion. In the initial phase titanium is released either in the form of Ti(OH)n(4-n)+ or TiO(OHh. In the second phase adsorption of H2P04-
Ti(OH)3+(OX) + H2P04-(aq) -7 Ti/(ox) . HPOl-(ad) + HzO(aq)
followed by desorption into the concentration boundary layer
Ti4+(ox) . HPOl-(ad) -7 Ti HPOl+(aq) + (ox) (charge transfer)
In the bulk electrolyte the complex ion dissociates
TiHPOl+(aq) + H+ (aq) -7 Ti4+(aq) + H2P04 -(aq)
and forms a more stable complex
Ti4+ (aq) + 40H- (aq) -7 Ti(OH)4 (aq)
In these reactions (ox) represents 0 24- in Ti02•
This mechanism is consistent with the hypothesis that in the second stage dissolution kinetics is dependent on diffusion within the concentration boundary layer. It is conceivable that in the first stage field assisted dissolution may be the controlling step. In this stage formation of Ti(OH)4 or of hydroxy-cations, e.g. Ti(OHh+, has different effects on titanium transport. While Ti(OH)4 does not react with organic molecules, Ti(OH)3 + can form organometallic complexes which may be transported systemically.

I-~~-
!
I -- I. L_
,,,~ ...
. I",
,,.at
llOO
i
......... ~
~o-~
-to
....
q
.... ,
~
/~
.......,.
F<_"
0
.-&
...
....
..
"'It _
_
Fig
ure
9.18
A
n ar
tist
's a
ttem
pt t
o ca
ptur
e so
me
of t
he c
ompl
exit
y in
volv
ed i
n th
e in
tera
ctio
n be
twee
n a
mat
eria
l an
d liv
ing
tiss
ue,
exem
plif
ied
here
by
a ti
tani
um i
mpl
ant
in b
one.
Not
e th
e w
ide
rang
e of
dim
ensi
ons
and
tim
e sc
ales
tha
t ar
e re
leva
nt.
(Kas
emo
and
Lau
smaa
, 19
94.)

454 I LI ___________ C_O_R_R_O_S_I_O_N_O_F __ M_E_T_A_L_L_IC __ IM __ P_LA __ N_T_S __________ ~ .--... N
E u
c o
10r-----------------------------------------,
9
8
7
6
5
4
1000 1500 2000 2500
Time (hours) (a)
r-O 991
3000
lO~--------------------------------------~
9
8
7
6
5
4
3
2
~1_--__ ~~r~=~0~.9;46~==:::j:::!==~~=====::=~~~~~
3500
1 10 100 Time (hours)
(b)
1000 lE4
Figure 9.19 Normalized integral passive dissolution kinetics for titanium thin films immersed in EDTA/SIE (simulated interstitial electrolyte): (a) real time data empirically fitted with two-phase logarithmic law relationship; (b) a semilogarithmic plot of the data demonstrating the two-phase logarithm relationship. The correlation coefficient for the least-squares fit of the linear functions are given. (Healy and Ducheyne, 1992.)

THE OXIDE AND OTHER SURFACE LAYERS I I 455 L-____________________________________________________ ~
Airborne titanium oxide, Ti02_x' is oxygen defficient but upon immersion in simulated interstitial electrolyte with EDTA (a metal chelating agent) changes to nearly stoichiometric Ti02 (Healy and Ducheyne, 1993). Ti02 is also reported to exist on the surface of a new Ti-15Zr-4Nb-2Ta-O.2Pd alloy (Okazaki et at., 1994). The other oxides present were ZrOZ, Nb20 5 and Ta20 5•
Sterilization by various methods (conventional steam autoclaving, dry heat sterilization in air at 160--180°C, and packaging and sterilization in sealed glass ampoules) originates films with the composition Ti02• Their thickness is 2-6 nm, depending on the method of sterilization. Heat sterilization increased the thickness of the original oxide by a factor of ca. 2 (Lausmaa and Kasemo, 1990).
Films formed on metallic materials oxidized in pure oxygen at 300° C for 30 min. have the composition shown in Table 9.24 (Oshida, 1992). Strong oxidative conditions may exist in vivo, for example due to presence of the superoxide anion, O2-, formed by inflammatory cells. The possibility of O2- originating hydrogen peroxide, H20 2, has led Tengvall et aI., (1989) to suggest that hydrogen peroxide may be of great importance to the biological behaviour of titanium. Hydrogen peroxide is responsible for the appearance of an outer layer, formed on top of a Ti02
layer, composed of titanium oxi-hydroxide or hydrates, non-stoichiometric and rich in water (Pan et ai., 1994). The oxide thickness for wet-ground specimens is ca. 3 times that for dry-polished specimens, as shown in Table 9.25. Hydrogen peroxide reduces the oxide thickness and results in enhanced dissolution of titanium, according to the same authors. It is not certain whether titanium acts as a catalyst in the oxidative deterioration of biological molecules, a property which has been established for other metals, e.g. iron, copper, cadmium, chromium, lead, mercury, nickel and vanadium (Stohs and Bagchi, 1995). These metals produce reactive oxygen species, leading to lipid peroxidation, DNA damage, depletion of sulphydryls, apart from modifying calcium homeostasis. Since large concentrations of titanium debris may be found around Ti and Ti-alloy implants (section 9.3.1) the oxidative deterioration of biological molecules induced by the presence of Ti ions is a process that deserves to be studied.
Table 9.24 Type of oxide formed on biomaterials (pure oxygen, 300°C, 30 min.) (Oshida et al., 1992)
Material Type of oxide
Pure Ti Ti02 (rutile) Ti---6AI--4V Ti02 with traces of Al2Ti05
Ni-Ti, austenitic and martensitic Mixture of Ti02 and NiTi03 316L stainless steel spinel-type [(Fe,Ni)O· (Fe,Cr)P31a and
corundum-type oxides [(Fe,Crh031a a Possible composition.

456 I I~ __________ C_O_R_R __ O_S_IO_N __ O_F_M __ E_T_A_L_L_I_C_I_M_P_L_A_N_T_S __________ ~
Table 9.25 Thickness (nm) of titanium oxide films (Pan et al., 1994)
Source Polarized at 0.4 V/SCE
HP2 in the PBS (mM) Dry-polished Wet-ground o 1 10
XPS measurements 1.5 4.6 Capacitance measurements Literature data 1.2-1.6 4-5
6.3 6.7 6.6
6.2 5.5
5.8 6.0
The oxide formed on titanium upon passivation in HN03 is composed of regions of mixed titanium oxides (anatase and rutile), together with areas of amorphous titanium oxide (Browne and Gregson, 1994). Films formed on anodized titanium may be one order of magnitude thicker than those formed by passivation (section 9.4.1). The film is predominantly constituted by TiOz, with the presence of carboxyl groups (Ong, 1993). It appears that upon passivation of cp Ti and Ti-6AI-4V alloy the film on the former is thinner (3.2 ± 0.8 nm) than that on the latter (8.3 ± 1.2 nm) (Keller et aI., 1994). Ti02 films are generally amorphous, except in the case of thick films produced by thermal oxidation or anodizing. Table 9.26 summarizes the characteristics (composition, oxide thickness, surface
Table 9.26 Summary of surface characteristics of the four different types of Ti samples (Larsson et al., 1994)
Surface Substrate topography microstructure
Oxide Surface Oxide Preparation Composition thickness roughness crystallinity
Clinical reference TiOz+45-80% C, 4nm Rough, with Plastically traces of Ca, S, grooves, pits deformed, Si, P, CI and Na and protrusions, amorphous
$10 f1m metal surface Rnns=29±4 nm Non-crystalline
oxide Electropolished TiOz+55-90% C, 4-5nm Smooth, with Polycrystalline
traces of Ca, S, occasional pits, metal surface Si, P, Cl and Na $ 1 f1m Non-crystalline
Rrms = 2.7±0.9 nm oxide Electropolished + TiOz+55-70 %C, 21 nm Smooth, with Polycrystalline
anodized, 10 V traces of Ca, S, pits and porous metal surface Si, and Cl regions, -10 f1m Non-crystalline
Rrms=1.5±1 nm oxide Electropolished + TiOz+-34-40% 180nm Heterogeneous, Polycrystalline
anodized, 10 V + C, traces of Ca with smooth or metal surface. and Cl porous regions, Crystalline
- 10 f1m oxide Rrms=16±2nm (anatase)

~ ________ T_H_E_O_X_I_D_E_A __ N_D_O_T_H __ E_R_S_U_R_F_A_C_E_L_A __ Y_E_R_S ________ ~I I 457
topography/roughness, and substrate microstructure/oxide crystallinity) of titanium samples subjected to various treatments (Larsson et at., 1994). Electropolished + anodized (1M acetic acid, room temperature) films are thicker than those formed by electropolishing and on 'clinical reference' (machined) surfaces. For 80V the oxide is crystalline.
Table 9.27 summarizes the composition and thickness of oxides formed on a Co-Cr-Mo alloy exposed to 'dry air' and 'wet steam' for 1 h (Lewis, 1993a).
9.4.7 Contact angles of oxide-covered surfaces
When a metallic surface covered by an oxide (either formed naturally or by an appropriate treatment) is placed in contact with the body or a culture medium adsorption of various species, namely proteins, is the prime event. Contact angle, 6, measurements can be used to ascertain the afinity of a liquid to a biomaterial surface, in particular when adsorption occurs, which is revealed by a decrease in 6. Generally speaking, 6 is governed by the intermolecular forces between solid and liquid, and in the case of passive metals by the forces between metal oxide and liquid. is a complex function of surface roughness, oxide crystallinity and composition, liquid composition and time. Normally, wettability tends to progress from hydrophobic to hydrophilic. Table 9.28 gives the initial contact angles and the changes in contact angle as a function of time, d6/dt, for a number of materials (Oshida et at., 1992). Pure Ni and Ti-6AI-AV have the lowest initial contact angle, 60 , with low d6/dt; 316L stainless steel and Co-Cr alloy have high 60 with low d6/dt; and pure Ti, Ni-Ti alloys and a-alumina have high 6 and high d6/dt. Shot-peening and pre-oxidation (300° C, 30 min.) of the above materials reduced the standard deviation of contact-angle measurements, probably as a result of minimization of microscopic irregularities (Oshida et at., 1993). In this work pure Ti exhibited the highest initial contact angle 60 , and also the most noble corrosion potential. Both are related to the characteristics of the Ti02 oxide that covers the metal surface. Note that the value of 6 for Al20 3 is also high (Table 9.28).
Table 9.27 Composition of oxides formed on a Co-Cr-Mo alloy (Lewis, 1993a)
Medium Composition Thickness Remarks
Dry air C014Cr5Mo021 4 nm May disaggregate into Co, Cr, Mo, CoO, Cr02 and Mox(OH)y and suboxides of Co, Cr and Mo
Wet steam C03Cr6Mo020 3 nm May dis aggregate into Co, Cr, Mo, Co(OHh, CrP3' CoOOH, CoMo04, Mox(OH)y and suboxides and hydrated species of Co, Cr and Mo

458 II L ___________ C_O_R_R_O_S_I_O_N_O_F __ M_E_T_A_L_L_IC __ IM __ P_LA __ N_T_S __________ ~
Table 9.28 Initial contact angles and changes in contact angles as function of time of oxidized surfaces of biomaterials after mechanical and buff polishing (Oshida et aI., 1992)
Mechanical polish-oxidizing Buff polish-oxidizing
60 (deg) 8e.~t 6o(deg) salOt
Pure Ti 54.24 -0.0046 Ti6A14V 32.08 -0.0010 30.85 -U.0015 NiTi (m) 69.88 -0.0055 68.92 -0.0053 NiTi (a) 71.88 -0.0048 316L S.s. 56.46 -0.0024 55.73 -0.0025 Pure Ni 35.72 -0.0016 Co-Cr alloy 62.04 -0.0023 61.85 -0.0021 a-alumina 60.87 -0.0044
m - martensite; a - austenite.
Table 9.29 Critical surface tension of Ti surfaces (Kilpadi and Lemons 1994)
Critical Surface Tension, Tc
Specimen Plot (dynlcm) Comments
C No liquids were appropriate P 46.0±1.08 D 42.5±1.08 Only diiodomethane and bromonaphthalene
were used II C 31.6±0.48 Water was not used in these analyses, as it
did not fit with Good's criterion and also did not fall in line with the other liquids
P 35.4±0.48 Only glycerol and thiodoethanol were used D 34.9±0.48 Only diiodomethane and bromonaphthalene
were used III C 40.0±0.41
41.4±0.59 D 40.7±0.59 Only diiodomethane and bromonaphthalene
were used IV C 41.9±0.79
P 41.5±1.05D D 42.5±1.05 Only diiodomethane and bromonaphthalene
were used V C 37.4±0.51
P 31.0±0.30 Water was not included D 41.8±0.51 Only diiodomethane and bromonaphthalene
were used
I - Non-passivated, TFGD-treated, polished machined flats; II - Non-passivated, unsterilized, polished machined flats; III - Passivated, dry-heat-sterilized, polished machined flats; IV - Passivated, dry-heat-sterilized, polished coined flats; V - Passivated, dry-heat-sterilized, unpolished flats; C - Composite (includes all liquids); P - only polar liquids: D - only dispersive liquids. RFGD - Radio Frequency Glow Discharge.

L-___________________ R_E_F_E_R __ E_N_C_E_S __________________ ~I I 459
The critical surface tension (CST), which is the highest surface tension of a liquid that completely wets a given surface, is given in Table 9.29 (Kilpadi and Lemons, 1994) for titanium subjected to various surface treatments. Polar (double-distilled water, glycerol and thiodoethanol) and dispersive (diiodomethane, bromonaphthalene, dicyclohexyl and decane) liquids were used in the study. Radio frequency glow discharge (RFGD)treated samples showed the higher CST. Grain size (70 vs. 23 J..Lm) did not affect the CST of polished, passivated, and dry-heat-sterilized titanium surfaces.
The equilibrium contact angles of cp Ti and Ti-6AI-4V, both passivated in nitric acid, were 52±2° and 56±4°, respectively (Keller et aI., 1994). Wettability was measured employing water drops. This similarity in contact angles reflets the similarity in oxide film composition found in the same work. However, the film on the alloy surface was significantly thicker (S.3±1.2 nm) than that on the cp Ti (3.2±0.S nm).
REFERENCES
O.V. Akgun and O.T. Inal, 'Laser surface modification of Ti-6Al-4V alloy', Journal of Materials Science, 29, 1159-1168 (1994).
A. Aladjem, 'Review Anodic oxidation of titanium and its alloys', Journal of Materials Science, 8, 688-704 (1973).
M.A. Barbosa, 'Corrosion mechanisms of metallic biomaterials', Biomaterials Degradation-Fundamental Aspects and Related Clinical Phenomena, European Materials Research Society Monographs, Vol. 1 (eds. M.A. Barbosa, F. Burny, J. Cordey, E. Dorre, G. Hastings, D. Muster and P. Tranquilli-Leali), pp. 227-257, Elsevier Science Publishers, Amsterdam (1991 a).
M.A. Barbosa, 'Electrochemical impedance studies on calcium phosphate-metal interfaces', Bioceramics, Vol. 4 (eds. W. Bonfield, G.W. Hastings and K.E. Tanner), pp. 326-333, Butterworth-Heinemann (1991 b).
M.A. Barbosa, 'Surface layers and the reactivity of metallic implants', High-Tech Biomaterials, European Materials Research Society Monographs, Vol. 3 (eds. D. Muster, M.A. Barbosa, F. Burny, J. Cordey, E. Dorre, G. Hastings, and P. Tranquilli-Leali), pp. 257-283, Elsevier Science Publishers B.V., Amsterdam (1992).
J. Black, 'Biological Performance of Tantalum', Clinical Materials, 16, 167-173 (1994)
N.C. Blumenthal and V. Cosma, 'Inhibition of apatite formation by titanium and vanadium ions', Journal of Biomedical Materials Research: Applied Biomaterials, 23, 13-22 (1989).
M. Browne and P.J. Gregson, 'Surface modification of titanium alloy implants', Biomaterials, 15,894-898 (1994).
S.A. Brown, L.J. Farnsworth, K. Merritt, and T.D. Crowe, 'In vitro and in vivo metal ion release', Journal of Biomedical Materials Research, 22, 321-338 (1988).

460 I LI ___________ C_O_R_R_O_S_I_O_N_O_F __ M_E_T_A_L_L_IC __ IM __ P_LA __ N_T_S __________ ~
RA Buchanan and I.S. Lee, 'Surface modification of biomaterials through noble metal ion implantation', JournaL of BiomedicaL MateriaLs Research, 24, 309-318 (1990).
B.W. Callen, B.F. Lowenberg, S. Lugowski, R.N.S. Sodhi, and J.E. Davies, 'Nitric acid passivation of Ti6A14V reduces thickness of surface oxide layer and increases trace element release', JournaL of BiomedicaL MateriaLs Research, 29, 279-290 (1995).
S.K. Chawla, S.A Brown, K. Merritt, and J.H. Payer, 'Serum protein effects on polarization behavior of 316L stainless steel', Corrosion 46, 147-152 (1990).
A Cigada, G. Rondelli, B. Vicentini, M. Giacomazzi, and A Roos, 'Duplex stainless steels for osteosynthesis devices', JournaL of BiomedicaL MateriaLs Research, 23, 1087-1095 (1989).
A Cigada, M. Cabrini, and P. Pedeferri, 'Increasing of the corrosion resistance of the Ti6A14V alloy by high thickness anodic oxidation', JournaL of MateriaLs Science: MateriaLs in Medicine, 3, 408-412 (1992).
J.P. Collier, V.A Surprenant, RE. Jensen, and M.B. Mayor, 'Corrosion at the interface of cobalt-alloy heads on titanium-alloy stems', CLinicaL Orthopaedics, 271,305-312 (1991).
S.D. Cook, M.R Brinker, Re. Anderson, RJ. Tomlinson and J.e. Butler, 'Performance of retrieved Kuntscher intramedullary rods: improved corrosion resistance with contemporary material design', ClinicaL MateriaLs, 5, 53-71 (1990).
S.D. Cook, RL. Barrack, G.e. Baffes, AJ.T. Clemow, P. Serekian, N. Dong and M.A Kester, 'Wear and corrosion of modular interfaces in total hip replacements', ClinicaL Orthopaedics, 298, 80-88 (1994).
S.D. Cook, RL. Barrack, A.J.T. Clemow, 'Corrosion and wear at the modular interface of uncemented femoral stems', The JournaL of Bone and Joint Surgery [Br], 76-B, 68-72 (1994).
L.D. Dorr, R Bloebaum, J. Emmanual and R Meldrum, 'Histologic, biochemical, and ion analysis of tissue and fluids retrieved during total hip arthroplasty', ClinicaL Orthopaedics and ReLated Research, nr. 261, 82-95 (1990).
P. Ducheyne and K.E. Healy, 'The effect of plasma-sprayed calcium phosphate ceramic coatings on the metal ion release from porous titanium and cobaltchromium alloys', JournaL of BiomedicaL MateriaLs Research, 22, 1137-1163 (1988).
M.L. Escudero and J.L. Gonzalez-Carrasco, In vitro corrosion behaviour of MA956 superalloy BiomateriaLs, 15, 1175-1180 (1994).
P. Frayssinet, F. Tourenne, N. Rouquet, G. Bonel, and P. Conte, Biological effects of aluminium diffusion from plasma-sprayed alumina coatings, JournaL of MateriaLs Science: MateriaLs in Medicine, 5, 491-494 (1994).
J.L. Gilbert, S.M. Smith and E.P. Lautenschlager, Scanning electrochemical microscopy of metallic biomaterials: reaction rate and ion release imaging modes, JournaL of BiomedicaL MateriaLs Research, 27, 1357-1366 (1993a).
J.L. Gilbert, e.A Buckley, and J.J. Jacobs, In vivo corrosion of modular hip prosthesis components in mixed and similar metal combinations. The effect of crevice, stress, motion, and alloy coupling, JournaL of BiomedicaL MateriaLs Research, 27, 1533-1544 (1993b).

~ _______________ RE __ FE_RE __ N_CE_S ______________ ~I I 461
J. Gluszek and J. Masalski, Galvanic coupling of 316L steel with titanium, niobium, and tantalum in Ringer's solution, British Corrosion Journal, 27, 135-138 (1992).
K. Hayashi, I. Noda, K. Uenoyama, and Y. Sugioka, Breakdown corrosion potential of ceramic coated metal implants, Journal of Biomedical Materials Research, 24, 1111-1113 (1990).
R Hazan, R Brener and U. Oron, Bone growth to metal implants is regulated by their surface chemical properties, Biomaterials, 14, 570-574 (1993).
K.E. Healy and P. Ducheyne, The mechanisms of passive dissolution of titanium in a model physiological environment, Journal of Biomedical Materials Research, 26, 319-338 (1992).
K.E. Healy, and P. Ducheyne, Passive dissolution kinetics of titanium in vitro, Journal of Materials Science. Materials in Medicine, 4, 117-126 (1993).
P.J. Hughes, S.A. Brown, J.H. Payer, and K. Merritt, The effect of heat treatments and bead size on the corrosion of porous F75 in saline and serum, Journal of Biomedical Materials Research, 24, 79-94 (1990).
e.B. Johansson, J. Lausmaa, T. Rostlund, and P. Thomsen, Commercially pure titanium and Ti6Al4V implants with and without nitrogen-ion implantation: surface characterization and quantitative studies in rabbit cortical bone, Journal of Materials Science: Materials in Medicine, 4, 132-141 (1993).
J. Karrholm, W. Frech, K.-G. Nilsson and F. Snorrason, Increased metal release from cemented femoral components made of titanium alloy, Acta Orthop. Scand., 65, 599-604 (1994).
B. Kasemo and J. Lausmaa, Material-tissue Interfaces: the role of surface properties and processes, Environmental Health Perspectives, 102,41-45 (1994).
J.e. Keller, C.M. Stanford, J.P. Wightman, RA. Draughn and R Zaharias, Characterizations of titanium implant surfaces. III, Journal of Biomedical Materials Research, 28, 939-946 (1994).
D.V. Kilpadi and J.E. Lemons, Surface energy characterization of unalloyed titanium implants, Journal of Biomedical Materials Research, 28, 1419-1425 (1994).
F.J. Kummer, J.L. Ricci, and N.e. Blumenthal, RF plasma treatment of metallic implant surfaces, Journal of Applied Biomaterials, 3,39-44 (1992).
e. Larsson, P. Thomsen, J. Lausmaa, M. Rodahl, B. Kasemo and L.E. Ericson, Bone response to surface modified titanium implants: studies on electropolished implants with different oxide thickness and morphology, Biomaterials, 15, 1062-1074 (1994).
J. Lausmaa and B. Kasemo, Surface spectroscopic characterization of titanium implant materials, Applied Surface Science, 44, 133-146 (1990).
G. Lewis, X-ray photoelectron spectroscopy study of surface layers on orthopaedic alloys. II. Co-Cr-Mo (ASTM F-75) alloy, Journal of Vacuum Science Technology A, 11, 168-174 (1993a).
G. Lewis and K. Daigle, Electrochemical behavior of Ti-6AI-4V alloy in static biosimulating solutions, Journal of Applied Biomaterials, 4, 47-54 (1993b).
B.F. Lowenberg, S. Lugowski, M. Chipman, and J.E. Davies, ASTM-F86 passivation increases trace element release from Ti6Al4V into culture medium, Journal of Materials Science: Materials in Medicine,S, 467-472 (1994).
S. Lugowski, D.C. Smith, and J.C. VanLoon, Critical aspects of trace element analysis of tissue samples: a review, Clinical Materials, 6, 91-104 (1990).

462 I IL-__________ C_O_R_R __ O_S_IO_N __ O_F_M __ E_T_A_L_L_IC __ I_M_P_L_A_N_T_S __________ ~
RD. Meldrum, RD. Bloebaum, and L.D. Dorr, Metal ion concentrations in retrieved polyethylene total hip inserts and implications for artifactually high readings in tissue, Journal of Biomedical Materials Research, 27, 1349-1355 (1993).
K. Merritt, RW. Margevicius, and S.A. Brown, Storage and elimination of titanium, aluminium, and vanadium salts, in vivo, Journal of Biomedical Materials Research, 26, 1503-1515 (1992).
Y. Okamoto and S. Hidaka, Studies on calcium phosphate precipitation: effects of metal ions used in dental materials, Journal of Biomedicla Materials Research, 28,1403-1410 (1994).
Y. Okazaki, A. Ito, T. Tateishi, and Y. Ito, Effect of alloying elements on anodic polarization properties of titanium alloys in acid solution, Materials Transactions, JIM, 35, 58-66 (1994).
J.L. Ong, L.e. Lucas, G.N. Raikar, and J.e. Gregory, Electrochemical corrosion analyses and characterization of surface-modified titanium, Applied Surface Science, 72, 7-13 (1993).
Y. Oshida, R Sachdeva, and S. Miyazaki, Changes in contact angles as a function of time on some pre-oxidized biomaterials, Journal of Materials Science: Materials in Medicine, 3, 306-312 (1992).
Y. Oshida, R Sachdeva, S. Miyazaki, and J. Daly, Effects of shot-peening on surface contact angles of biomaterials, Journal of Materials Science: Materials in Medicine, 4, 443-447 (1993).
J. Pan, D. Thierry, and e. Leygraf, Electrochemical and XPS studies of titanium for biomaterial applications with respect to the effect of hydrogen peroxide, Journal of Biomedical Materials Research, 28, 113-122 (1994).
O.E.M. Pohler, Degradation of metallic orthopaedic implants, in Biomaterials in reconstructive surgery (ed. L.R Rubin), Chap. 15, The CV Mosby Co., 1983, pp. 158-228.
M. Pourbaix, Atlas of electrochemcial equilibria, NACE/CEBELCOR, 1974. A. Pourbaix, M. Marek and RF. Hochman, Comportement electrochimique du
titane a bas pH et bas potential d'electrode. Rapports Techniques CEBELCOR, 118, RT 197, (1971).
L.M. Rabbe, J. Rieu, A. Lopez and P. Combrade, Fretting deterioration of orthopaedic implant materials: search for solutions, Clinical Materials, 15, 221-226 (1994).
J.-P. Randin, Corrosion behavior of nickel-containing alloys in artificial sweat, Journal of Biomedical Materials Research, 22, 649-666 (1988).
G. Ravnholt and J. Jensen, Corrosion investigation of two materials for implant supra constructions coupled to a titanium implant, Scandinavian Journal of Dental Research, 99, 181-186 (1991).
e.e. Ribeiro, M.A. Barbosa, A.A.S.e. Machado, A. Tudor, and M.e. Davies, Modifications in the molecular structure of hydroxyapatite induced by titanium ions, Journal of Materials Science: Materials in Medicine, 6, 829-834 (1995).

~ ___________________ R_E_F_E_R_E_N_C_E_S __________________ ~I I 463
e. Sella, J.e. Martin, J. Lecoeur, J.P. Bellier, M.F. Harmand, A Nadji, J.P. Davidas, and A Le Chanu, Corrosion protection of metal implants by hard biocompatible ceramic coatings deposited by radio-frequency sputtering, Clinical Materials, 5, 297-307 (1990).
M.F. Semlitsch, H. Weber, R. Streicher and R Schon, Joint replacement components made of hot-forged and surface-treated Ti-6AI-7Nb alloy, Biomaterials, 13, 781-788 (1992).
S.R Sousa and M.A Barbosa, Electrochemistry of AISI 316L stainless steel in calcium phosphate and protein solutions, Journal of Materials Science: Materials in Medicine, 2, 19-26 (1991).
S.R Sousa and M.A Barbosa, Corrosion resistance of titanium cp in saline physiological solutions with calcium phosphate and proteins, Clinical Materials, 14, 287-294 (1993).
S.J. Stohs and D. Bagchi, Oxidative mechanisms in the toxicity of metal ions, Free Radical Biology and Medicine, 18, 321-336 (1995).
D.S. Sutherland, P.D. Forshaw, G.e. Allen, LT. Brown and K.R Williams, Surface analysis of titanium implants, Biomaterials, 14,893-899 (1993).
P. Tengvall, L. Lundstrom, L. Sjokvist, H. Elwing, and L.M. Bjurstein, Titaniumhydrogen peroxide interaction: model studies of the influence of the inflammatory response on titanium implants, Biomaterials, 10, 166-175 (1989).
P. Tengvall and I. Lundstrom, Physico-chemical considerations of titanium as a biomaterial, Clinical Materials, 9, 115-134 (1992).
K.A Thomas, S.D. Cook, AF. Harding, and R.J. Haddad Jr., Tissue reaction to implant. corrosion in 38 internal fixation devices, Orthopedics, 11, 441-451 (1988).
H. Tomas, AP. Freire, and L.M. Abrantes, Cast Co-Cr alloy and pure chromium in proteinaceous media: an electrochemical characterization, Journal of Materials Science: Materials in Medicine, 5, 446-451 (1994).
S. Torgersen and N.R Gjerdet, Retrieval study of stainless steel and titanium miniplates and screws used in maxillofacial surgery, Journal of Materials Science: Materials in Medicine, 5, 256-262 (1994).
D.L. Tsalev and Z.K. Zaprianov, Atomic absorption spectrometry in occupational and environmental health practice, Vol. I, CRC Press, Boca Raton, 1983.
J.A von Fraunhofer, N. Berberich, and D. Seligson, Antibiotic-metal interactions in saline medium, Biomaterials, 10, 136-138 (1989).
J.e. Wataha, e.T. Hanks, and RG. Craig, Uptake of metal cations by fibroblasts in vitro, Journal of Biomedical Materials Research, 27, 227-232 (1993).
A Wisbey, P.J. Gregson, and M. Tuke Application of PVD TiN coating to CoCr-Mo based surgical implants, Biomaterials, 8, 477-480 (1987).
RL. Williams, S.A Brown, and K. Merritt, Electrochemical studies on the influence of proteins on the corrosion of implant alloys, Biomaterials, 9, 181-186 (1988).

11011 ~ ________ C_a_rb_o_n_s ______ ~ A.D. Haubold, R.B. More and J.e. Bokros
10.1 INTRODUCTION
The biocompatibility of carbon has long been appreciated: ancient man, for example, knew that pulverized charcoal could be placed under the skin without any apparent ill effects (Benson, 1969). The charcoal particles visibly remained indefinitely and thus allowed ancient man the means to decorate himself permanently with tattoos. However, it was not until the mid-1960s that carbon was first considered for use as a structural material in implantable prosthetic devices. During this period, a specific, imperfectly crystalline, man-made, pyrolytic form of carbon was found to be well suited for application in prosthetic heart valves. Because of the outstanding clinical success of pyrolytic carbon in long-term structural components of heart valve prostheses, carbons have assumed a prominent position in our repertoire of biomaterials and have sparked investigation of other forms of carbons for possible in vivo use. A number of these forms are listed in Table 10.1. This chapter will be devoted to a discussion of the background and historical uses of carbons in medical devices along with suggestions for future research.
10.1.1 Background
Although only two allotropic crystalline forms of elemental carbon, diamond and graphite occur in nature, carbon also occurs as a spectrum of imperfect crystalline forms that range from amorphous through mixed amorphous, graphite-like and diamond-like to the perfectly crystalline allotropes. Such imperfect crystalline structures are termed turbostatic and
Handbook of Biomaterial Properties. Edited by 1. Black and G. Hastings. Published in 1998 by Chapman & Hall, London. ISBN 0412 60330 6.
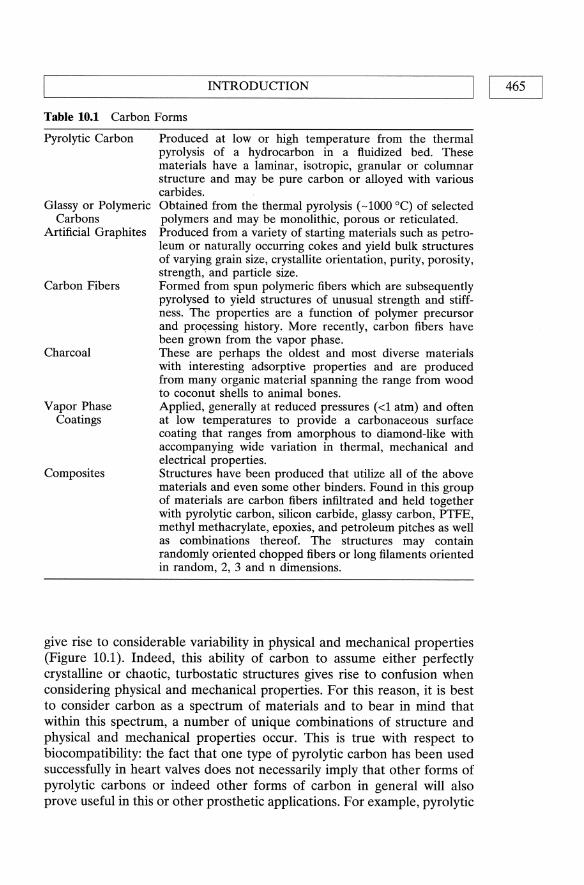
L-__________________ IN_T_R_O_D __ U_CT __ IO_N __________________ ~I I 465
Table 10.1 Carbon Forms
Pyrolytic Carbon
Glassy or Polymeric Carbons
Artificial Graphites
Carbon Fibers
Charcoal
Vapor Phase Coatings
Composites
Produced at low or high temperature from the thermal pyrolysis of a hydrocarbon in a fluidized bed. These materials have a laminar, isotropic, granular or columnar structure and may be pure carbon or alloyed with various carbides. Obtained from the thermal pyrolysis (-1000 0C) of selected polymers and may be monolithic, porous or reticulated. Produced from a variety of starting materials such as petroleum or naturally occurring cokes and yield bulk structures of varying grain size, crystallite orientation, purity, porosity, strength, and particle size. Formed from spun polymeric fibers which are subsequently pyrolysed to yield structures of unusual strength and stiffness. The properties are a function of polymer precursor and processing history. More recently, carbon fibers have been grown from the vapor phase. These are perhaps the oldest and most diverse materials with interesting adsorptive properties and are produced from many organic material spanning the range from wood to coconut shells to animal bones. Applied, generally at reduced pressures (<1 atm) and often at low temperatures to provide a carbonaceous surface coating that ranges from amorphous to diamond-like with accompanying wide variation in thermal, mechanical and electrical properties. Structures have been produced that utilize all of the above materials and even some other binders. Found in this group of materials are carbon fibers infiltrated and held together with pyrolytic carbon, silicon carbide, glassy carbon, PTFE, methyl methacrylate, epoxies, and petroleum pitches as well as combinations thereof. The structures may contain randomly oriented chopped fibers or long filaments oriented in random, 2, 3 and n dimensions.
give rise to considerable variability in physical and mechanical properties (Figure 10.1). Indeed, this ability of carbon to assume either perfectly crystalline or chaotic, turbostatic structures gives rise to confusion when considering physical and mechanical properties. For this reason, it is best to consider carbon as a spectrum of materials and to bear in mind that within this spectrum, a number of unique combinations of structure and physical and mechanical properties occur. This is true with respect to biocompatibility: the fact that one type of pyrolytic carbon has been used successfully in heart valves does not necessarily imply that other forms of pyrolytic carbons or indeed other forms of carbon in general will also prove useful in this or other prosthetic applications. For example, pyrolytic

~
(c)
Fig
ure
10.1
P
ossi
ble
atom
ic a
rran
gem
ents
of
crys
tall
ine
carb
on:
(a)
diam
ond
tetr
ahyd
ral,
cyc
lohe
xane
cha
ir,
crys
tall
ine
stru
ctur
e,
(b)
grap
hite
pla
nar
hexa
gona
l la
yere
d st
ruct
ure
(c)
thre
e-di
men
sion
al q
uasi
crys
tall
ine
turb
o st
atic
str
uctu
re.
Bio
med
ical
car
bons
hav
e a
turb
osta
tic
stru
ctur
e.
INTRODUCTION I I 467 L-____________________________________________________ ~
and glassy carbon can be finished to have identical appearances, yet the properties of glassy carbon make it unsuitable for use in prosthetic heart valves (Haubold et aI., 1981).
For successful use in implantable prostheses a material (1) must retain its properties required for device function in the hostile biological environment and (2) must not provoke adverse effects either locally or systemically. Most of the pure carbons are relatively inert and unlikely to provoke severe tissue reactions, however, only certain pyrolytic carbons have sufficient strength, fatigue resistance, wear resistance and biodegradation resistance to function as long-term implant structural components. In fact, the pyrolytic carbons were deliberately tailored to meet the specific biocompatibility requirements for heart valve component application (Bokros et ai, 1972; Haubold, 1977). Silicon was added in small amounts (5-12 wt%) as an alloying element in order to form silicon carbide inclusions to assure adequate wear. Furthermore, specific processing parameters were identified in order to produce suitable microstructures and densities, as well as the strength levels required. Glassy carbon, as mentioned above, could not be prepared with adequate strength and wear resistance. Thus, biocompatibility cannot be presumed a priori for carbon materials: each particular application has specific demands which require a unique set of properties. While the spectrum of carbon materials encompasses many such properties, the particular material must be engineered to uniquely satisfy all of the properties needed.
10.1.2 Diamond
Diamond, the hardest substance known, has the so called diamond cubic structure consisting of a network of regular tetrahedral arrays in which each carbon atom is covalently bonded to four other carbon atoms forming the corners of a regular tetrahedron (Figure 10.1). From X-ray diffraction data, there is a single value, 1.54 A bond length and a unit cube lattice spacing of 3.56 A. The entire crystalline array is a single covalently bonded molecule. Because many covalent bonds must be broken to break the crystal, a very large amount of energy is required, therefore, the substance is very hard (Pauling, 1964). There has been an ongoing interest in the use of diamond or diamond-like coatings (May, 1995). However, suitable manufacturing processes do not yet exist that allow economical preparation of diamond type materials in the quantity, quality, shapes and sizes required for durable long term biomedical applications. A specific application uniquely requiring diamond or diamond-like material for clinical success has not been identified as a justification to compel additional research efforts in preparation techniques.

468 II ~ _________________ C_A_R_B_ON_S ________________ ~
10.1.3 Graphites
Graphite has a layered hexagonal crystal structure. Each atom forms two single bonds and one double bond with its three nearest in-plane neighbors to form sheet-like layers of flat six atom ring arrays (Figure 10.1). Interatomic bond distances are 1.42 A within the layer and 3.4 A between each layer. Within each layer, bonding is covalent and between the layers, bonding is of the much weaker van der Waals type. Consequently, the layers are easily separated giving rise to the soft, lubricating properties of graphite.
Naturally occurring graphite is generally found as a isolated small scales or imperfect single crystal precipitates in granite. These small crystals such as those found in Madagascar, Ontario and in New York have dimensions on the order of a few millimeters. Larger graphite masses have been found in China and Korea. Natural graphites are thought to be formed by metamorphosis of sedimentary carbonaceous materials or by reaction with and precipitation from liquid magma. The naturally occurring graphite materials are useful primarily as the starting material for subsequent fabrication of some 'artificial graphites'.
Graphite was first synthesized accidentally by heating carborundum to extreme temperatures. The silicon was driven off leaving a graphite residue. A patent on this production process was granted over 100 years ago. Since then, petroleum and other types of cokes coupled with organic binders have become the major raw materials in the production of a wide variety of carbonaceous conglomerates called artificial graphite.
The manufacturing processes employed today are as varied as are the properties of the resultant materials. Bulk graphites are usually molded, extruded, hot isostatically compacted and may even be formed by combinations of these processes. They may be further reimpregnated with binder subsequent to graphitization (heat-treatment step), infiltrated isothermally or in a thermal gradient with methane or aromatic hydrocarbons. The resultant materials have widely varying properties and purity which can have a profound influence on the interaction of 'graphite' with the living en vironmen t.
Because of low strength and low wear resistance, graphite alone is not suitable as a structural member of an implant. But, investigations of colloidal graphite coatings as a blood compatible surface during the mid-1960s led investigators to examine pyrolytic carbon. Pyrolytic carbon, initially developed and used as a coating for nuclear fuel pellets, was found to have excellent blood compatibility, strength, wear resistance and durability for application in long term implants. The historical account leading to the use of L TI (low temperature-isotropic) pyrolytic carbon has been described (Bokros et aI., 1972, 1975). Graphite is widely used as a substrate for pyrolytic carbon coatings in heart valve components. In

~ __________________ IN_T_R_O_D __ U_CT __ IO_N __________________ ~I I 469
prosthesis applications, graphite is entirely encased in pyrolytic carbon coatings on the order of one mm thickness. Here the stronger, more durable coating stabilizes the interior graphite structures.
10.1.4 Pyrolytic carbons
Pyrolytic carbons of the type developed at General Atomic for use in bioengineering were an off-spring of research directed at developing carbon materials that would be suitable for structural applications in the severe environment of high-temperature, gas-cooled nuclear reactors. The isotropic carbon forms called high-temperature-isotropic carbon were derived from the gas phase nucleation and condensation of droplets formed during the pyrolysis of methane at temperatures in excess of 2000°C where densification can occur by thermally activated processes. The carbons called low-temperature-pyrolytic carbons are formed by the pyrolysis of other hydrocarbons (such as propane and propylene at lower temperatures in the range 1300-1500°C. The carbon materials so produced are not uniquely structured nor are all of them isotropic. Wide and complex variations in properties are possible ranging from weak to very strong, and in structure ranging from laminar and anisotropic, to isotropic, to columnar and granular, the latter also varying in anisotropy. A comprehensive review of the deposition and structure of pyrolytic carbon is given by Bokros (1969)
10.1.5 Glassy carbons
The preparation, structure and properties of glassy, or polymeric carbons has been described in detail by Jenkins and Kawamura (1976). These carbons are derived from a polymer by a slow pyrolysis process which results in a vitreous residue free of macroscopic bubbles.
Fabrication of glassy carbon materials is a relatively straightforward, but time consuming process. A preformed polymeric precursor such as phenol-formaldehyde, polyfurfuryl alcohol, polyvinyl alcohol or oxidized polystyrene is slowly heated in an inert atmosphere to a high temperature in excess of 2000 dc. Heating times may be as short as a day or as long as one month. It is not unusual to encounter exothermic temperature regions that must be traversed very slowly (Le., 1 °C temperature increase per hour) to avoid the nucleation of bubbles.
There is a volumetric shrinkage of about 50% so the resultant structure formed in this process is a miniature of the precursor preform. The gases generated within the preformed structure must have time to diffuse out and not nucleate bubbles so one dimension of glassy carbon structures is limited to about seven millimeters. Hence materials or objects are limited to thin flat plates or tubes with thin walls. Massive equiaxed

470 I ~I _________________ C_A_R_B_ON_S ________________ ~
structures are not possible unless they are small with dimensions compatible with the diffusional requirements.
10.1.6 Carbon fibers
Carbon fibers, thought by many to be a relatively new material, actually have a long history as evidenced by the issuance of the first patent for incandescent electric lamp filaments (carbon fibers). The patent was issued to Thomas Edison in 1892. Hiram Maxim (the inventor of the machine gun, among other things) was issued a process patent for carbon fibers in 1899. Prior to the 1950s, these fibers had marginal strength and were used primarily for their electrical properties.
High strength carbon fibers were developed in the 1950s for the aerospace industry and military aircraft. The mechanical properties of rayonbased carbon fibers were enhanced using stress graphitization. Since that time, a variety of other precursors have been used including polyacrylonitrile (PAN), specific fractions of asphalt or pitch, lignin, lignosulfonates, hetero and nonheterocyclic aromatic polymers, linear polymers and even coal. The processes for fiber manufacture are as varied as the precursors themselves. In the patent literature, hundreds of processes and variants can be found (Sittig, 1980). Nevertheless, generalizations can be made. The first step in the process is the selection and treatment of a suitable raw material which can be carbonized to a high yield. The second step generally consists of a low temperature (250-500 0c) heat treatment or preoxidation followed by high temperature (up to 2800°C) carbonization and graphitization steps.
The resultant fibers generally are of three types classified according to their structure and the degree of crystallite orientation. There are the high modulus (50 million psi or above), high strength fibers which, when incorporated into structures, give the highest stiffness per unit weight. Fibers with a lower modulus (about 30 million psi) but still of high strength are the second class of generally available fibers. The lowest modulus (less than 20 million psi) do not have structural applications.
10.1.7 Vapor phase coatings
Coatings formed at reduced pressure (<1 atm) are generally termed 'vapor deposited'. These coatings may be formed by physical vapor deposition, chemical vapor deposition or combinations thereof. Physical vapor deposition such as evaporation is probably the oldest technique for depositing thin films and involves generating a vapor from a source material at reduced pressure. The vapor subsequently condenses on the object to be coated. This technique suffers from a number of limitations such as only line-of-sight coating is possible. In the case of a carbon source, which

L-__________________ IN_T_R_O_D_U __ CT __ IO_N __________________ ~I I 471
does not evaporate but rather only sublimes at extreme temperatures, the object to be coated is exposed to direct thermal radiation from the subliming source. Few materials can withstand the intense thermal radiation for any great length of time. Hence coating thickness is limited as is the choice of substrate material to be coated. Much has been written on physical vapor deposition such as the comprehensive text by Maissel and GIang (1970).
More versatile coating techniques are broadly termed chemical vapor deposition (CVD). Coatings are formed through chemical reactions in the vapor phase or through the thermal decomposition or reduction of gases generally at reduced pressures. It is interesting to note that the process used to form pyrolytic carbon is a CVD process but is generally carried out at ambient pressures. The low temperature CVD processes are usually assisted by means of catalysts, glow discharge plasmas, ion beams and the like to activate gas reactions. In fact, production of diamond films is now almost routine through ion beam assisted disassociation of selected hydrocarbons in the presence of excess hydrogen. On the other hand, amorphous carbon films with little or no detectable crystallinity can also be produced by CVD. Thus chemical vapor deposition techniques are extremely versatile and consequently films and coatings produced by CVD must be carefully characterized and identified. An extensive and comprehensive review of thin film deposition technologies can be found in Bunshah (1982).
10.1.S Composites
Even more complex than the materials described above are a family broadly termed 'composites'. Three-dimensional structures can be formed by combining a filler material with an appropriate matrix. Herein lies the difficulty with composites; all too often, the starting materials are not adequately described and the resultant structure characterized.
Carbon-carbon composites can be produced with a multitude of structures. The simplest have two-dimensional order and consist of stacked plies of carbon fabric held together by a carbon matrix. The fabric fibers may be any of those described previously, prepared from the pyrolysis of polyacrylonitrile and the like. The matrix could be derived from petroleum pitch or be infiltrated pyrolytic carbon or even silicon carbide. The latter are generally referred to as SiC/C composites. From two-dimensional, the next progression in structure is three-dimensional on to n-dimensional. This terminology refers to fiber orientation within the matrix.
Filament wound carbon composites have also been developed. In this case the desired shape is, as the name implies, wound using carbon fibers onto a suitable mandrel. The fibers are bonded using an epoxy type or thermoset resin. The bonding of the matrix to the fibers and direction of

472 II ~ _________________ C_A_R_B_ON_S ________________ ~
fiber orientation in large part determine the mechanical properties of the composite. The biological properties are generally governed by the selection of matrix.
10.2 HISTORICAL OVERVIEW -IN VIVO APPLICATIONS
Encouraged by the success of the L TI form of pyrolytic carbon in the demanding mechanical heart valve application, other carbon materials and usages were explored. Different carbon materials have been evaluated because pyrolytic carbon was patented on the one hand and processing constraints limited its versatility on the other hand. Shown in Table 10.2 are examples that demonstrate medical and engineering ingenuity in attempts to expand the use of carbons in the biological environment. Although the attempts are numerous and varied, only the use of carbon as components for artificial heart valves has achieved widespread usage.
10.2.1 Dental
One of the earliest applications of carbon as an implant material was in restorative dentistry. The first devices were bulky posts fabricated from glassy carbon that were implanted in the maxilla or mandible to serve as artificial tooth roots. Because of the inherent lack of strength of glassy carbon, they were bulky and poorly accepted. As a further complication, the stainless steel post on which a crown was cemented formed a galvanic couple in vivo leading to complications caused by accelerated corrosion of the stainless steel.
In another attempt, artificial tooth roots in the form of blades were fabricated from pyrolytic carbon. Although they were less bulky than the glassy carbon implants, they were difficult to place. Improper seating of the blade caused micromotion after implantation that ultimately caused the prosthesis to fail. The success rate of 60% after 5 years was judged inadequate. Metal blades coated with carbon fared a similar fate.
Metallic mandibular reconstruction trays coated with a vapor deposited film of carbon generally performed well. The application was complicated by the fact that the trays were custom and many times fashioned directly in the operating room, making the logistics of coating with carbon unacceptable.
10.2.2 Vascular
Graft prostheses >6mm diameter are generally considered to work well and improvements in performance as a result of modifying the biochemical nature of the graft lumen with carbon coatings are difficult to quantify and

'-----___ H_I_S_T_O_R_IC_A_L_O_V_E_R_V_I_E_W_-_IN_V_IV_O_A_P_P_L_IC_A_T_I_O_N_S __ ----'I I 473
Table 10.2 Applications of Carbon in Medical Devices
Active Component in Hemodetoxifier Alveolar Ridge Maintenance Particles Carbon Fiber Patch Fabrics Cathether Tips Coated Components for Membrane
Oxygenators Coated Emboli Filters Coated Mandibular Trays Coated Tracheal Prosthesis Coated TMJ Condyle Prosthesis Coated Prosthetic Fabrics and Polymers Coated Aneurysm Clips Coating on Angioplasty Stents Coatings on Heart Valve Suture Rings Coatings on Indwelling Catheters and
Delivery Systems Coatings on Vortex Blood Pumps Coatings in Vascular Grafts Components for Centrifugal Blood Pumps Composites Soft Tissue Replacement
Carbon forms
Young's Flexural
Dental Implants
• Posts • Blades • Coating on metallic implants Electrodes
• Solid • Coated Ex vivo Blood Filters Femoral Stems • Coated • Composite Femoral Condyle Replacements Femoral Heads
• Coated Fracture Fixation Devices Left Ventricular Apex Inlet Tubes Ligaments and Tendons Mechanical Heart Valve
Components Ossicular Replacement Prosthesis Particles for Filling Periodontal
Defects Percutaneous Access Devices Small Joint Replacements
• Hand • Wrist • Elbow • Foot Tibial Plateau Replacements Vascular Attachment Prosthesis
Fracture Modulus Strength Hardness Density Toughness Wear
(CPa) (MPa) (DPH 500 g) (g/cm3) (Mpa1m)Resistance
Diamond 760--1040600--20005700--10400 2.9-3.5 5-7 Potentially Knoop excellent
Pure pyrolytic carbon 28 486 >230 1.5-2.1 1.67 Excellent Si-alloyed pyrolytic 31 389 >230 2.0--2.2 1.17 Excellent
Carbon Glassy or Polymeric 21 175 150 <1.54 0.5-0.7 Poor
Carbons Artificial Graphites 4-12 65-300 50--120 1.5-1.8 1.5 Poor Carbon fibers 172-517 896-2585 * 1.6-1.8 * * Charcoal NA NA NA NA NA NA Vapor phase coatings 17 1.8 Composites * * * * * * * Dependent upon matrix.
CARBONS 474 I I L-____________________________________________________ ~
not significant enough to justify the cost of carbon coating. Improvements in the patency of small diameter grafts «4 mm) as a result of carbon coating have been reported but even with the improvement, these grafts ultimately failed as a result of intimal hyperplasia proliferation at the anastomoses. While the carbon coating may retard clotting of certain grafts, the coating does little to ameliorate intimal hyperplasia formation. Carbon vascular attachment prostheses have also been reported to perform poorly, not as a result of poor biocompatibility, but rather the result of mechanical complications.
10.2.3 Orthopedics
Femoral stems fabricated from carbon composites fitted with a femoral head fabricated from pyrolytic carbon have been reportedly used successfully by some for over 10 years (Chen, 1986). Others have experienced disastrous failures through a lack of attention to engineering and material property details. Such failures naturally lead to questions on the suitability of 'carbon' for use in such medical devices. Attempts are underway to design and fabricate other joint replacements.
Ligaments and tendons have been fabricated from carbon fibers (Bejui and Drouin, 1988). These fibers in the initial stage perform well as a scaffolding material that aids in the regeneration of tendons and ligaments in vivo; but in the long term the fibers fracture and migrate to, for example, the lymph nodes.
Fracture fixation devices that are fabricated from stainless steel are unsuitable for coating or coupling with carbon because of galvanic effects (Haubold et at., 1986). Carbon composite devices have been used reportedly with good results but such usage has not become widespread presumably because of an unaccepted cost/benefit ratio.
10.2.4 Other
Many applications of devices listed in Table 10.2, while successful, are not in widespread use because, even in their non-carbon form, usage is limited. For example, left ventricular apex tubes (Haubold et at., 1979) are used successfully in the construction of a prosthesis to correct idiopathic hypertrophic subaortic stenosis but fortunately in man, such a medical condition is rare.
10.3 NEW DIRECTIONSIFUTURE TRENDS
LTI pyrolytic carbons, since their introduction in the late 1960s, have become the material of choice for use in the fabrication of mechanical prosthetic heart valves. Over 90% of the mechanical valves implanted

~ _________________ R_E_F_E_R_E_N_C_E_S ________________ ~I I 475
worldwide utilize such carbon components. To date, more than 2 million valves have been implanted which amounts to an accumulated experience in excess of 12 million patient years. While this material has proven to be the most successful carbon biomaterial, it can be improved. Recently, advances in process control methodologies have allowed refinements in the pyrolytic carbon coating preparation. These improvements allow the elimination of the potentially thrombogenic silicon carbide from the biomedical coatings. Furthermore, this pure pyrolytic carbon can be produced with substantially improved mechanical properties relative to the silicon alloyed material (Emken et aI., 1993; Ely et aI., 1994,). Such improvements in the material open possibilities for improvements in heart valve prosthesis design and performance.
Results from investigations on the suitability of other forms of carbon for in vivo use yielded mixed and often seemingly contradictory results. Some of the confusion developed because of misunderstanding of carbon structure and misunderstanding of the relationship of carbon properties to such structures. The use of the generic label 'carbon' compounded the problem. A similar situation exists with 'polyurethanes'. There are polyether urethanes, polyester urethanes, polyether urethane ureas and even polyester urethane ureas - all misappropriately called simply 'urethanes'. Thus it is not surprising that the biological responses of 'carbon' (Table 10.1) are so varied.
Biocompatibility claims for a particular form of 'carbon' based on published results for a totally different form or structure should be carefully scrutinized. For example, to claim that carbon fibers have the same biological properties as bulk pyrolytic carbons or even that all pyrolytic carbons behave similarly is unjustified. In the case of fibers, geometry plays a significant role. It is well known that bulk materials may be well tolerated when the same material in particulate form may not. The lack of characterization and standardization can be devastating.
More and more entrants are anticipated into the field of carbon biomaterials. In the past, because of technology, patent or cost constraints, there were only several sources for, for example, pyrolytic carbon. A number of the earlier constraints have now been removed. Consequently, these materials are being produced in limited but increasing quantities in many countries, using a multiplicity of fabrication techniques. The challenge for the future is to be precise in material identification, characterization and to avoid generalization.
REFERENCES
Bejui, J. and Drouin, G. (1988). Carbon Fiber Ligaments. In CRC Critical Reviews in Biocompatibility, 4(2), 79-108.

476 I ~I _________________ C_A_R_B_ON_S ________________ ~
Benson, J. (1969). Pre-Survey on the Biomedical Applications of Carbon, North American Rockwell Corporation Report R-7855.
Bokros, J.e. (1969). Deposition, Structure, and Properties of Pyrolytic Carbon. In Chemistry and Physics of Carbon, Vol. 5 (Walker, P.L., ed.). Dekker, New York, pp. 1-118.
Bokros, J.e. LaGrange, L.D. and Schoen, F.J. (1972). Control of Structure of Carbon For Use in Bioengineering. In Chemistry and Physics of Carbon, Vol. 9 (Walker, P.L., ed.). Dekker, New York, 103-171.
Bokros, J.e., Akins, RJ., Shim, B.S., Haubold, AD. and Agarwal, N.K. (1975). Carbon in Prosthetic Devices. In Petroleum Derived Carbons (Deviney, M.L., and O'Grady, T.M., eds). American Chemical Society, Washington, DC, pp. 237-265.
Bunshah, RF. (ed.) (1982). Deposition Technologies for Films and Coatings., Noyes Publications, Park Ridge.
Chen, Lan-Tian (1986). Carbon-Titanium Combined Joints. In Chinese Journal of Biomedical Engineering 3, 55-61.
Ely, J., Haubold, A, Bokros, J. and Emken, M. (1994), New Unalloyed Pyrolytic Carbon with Improved Properties for Implant Applications, XXI Congress European Society for Artificial Organs, Oct. 20-22, Barcelona Spain. Also US Patent 5514410.
Emken, M., Bokros, J., Accuntis, J. and Wilde, D., (1993) Precise Control of Pyrolytic Carbon coating, Extended Abstracts & Program Proceedings of the 21st Biennial Conference on Carbon, Buffalo New York, June 13-18, pp. 531-532. Also US Patent 5284676.
Haubold, AD., Shim, H.S., and Bokros, J.e. (1979). Carbon Cardiovascular Devices. In Assisted Circulation (Unger, F., ed.) Springer Verlag, Berlin, Heidelberg, New York, pp. 520-532.
Haubold, AD. (1977). Carbon in Prosthetics. In Annals of the New York Academy of Sciences, Vol. 283, The Behavior of Blood and its Components at Interfaces, (Vroman, L. and Leonard E.F., eds). New York Academy of Sciences, New York.
Haubold, AD., Shim, B.S., and Bokros, J.e. (1981). Carbon in Medical Devices. In Biocompatibility of Clinical Implant Materials, Vol II (Williams, D.F., ed.). CRC Press, Boca Raton, pp. 3-42.
Haubold, AD., Yapp, RA, and Bokros, J.e. (1986). Carbons for Biomedical Applications. in Encyclopedia of Materials Science and Engineering (Bever, M.B., ed.) Pergamon Press, Oxford, New York, Toronto, Sydney, Frankfurt, pp. 514-520.
Jenkins, G.M. and Kawamura, K. (1976). Polymeric Carbons - Carbon Fibre, Glass and Char. Cambridge University Press, Cambridge. London, New York, Melbourne.
Lewis, J.e. and Redfern, B., and Cowland, F.B. (1963). Vitreous Carbons as Crucible Materials for Semiconductors. In Solid State Electronics, 6, 251.
Maissel, L.I. and Giang, R (1970). Handbook of Thin Film Technology, McGrawHill, New York.
May, P.W. (1995), CVD Diamond - a new Technology for the Future?, Endeavor Magazine 19(3), 101-106.
Pauling, L. (1964), College Chemistry, W.H. Freeman and Co., San Francisco.

I I 477 L-____________________________________________________ ~ REFERENCES
Pierson, H.O. (1993) Handbook of Carbon, Graphite, Diamond and Fullerenes, Noyes Publications, Park Ridge, New Jersey.
Sittig, M. (1980). Carbon and Graphite Fibers. Noyes Data Corporation, Park Ridge. Mechanical Behavior of Diamond and Other Forms of Carbon, Materials Research Society Symposium Proceedings, Vol. 383, ed. Dory M.D. et al., Materials Research Society, Pittsburgh, Pennsylvania, 1995.

PART III

General Concepts of Biocompatibility
D.F. Williams
1.1 INTRODUCTION
The host responses to biomaterials are extremely varied, involve a range of different mechanisms and are controlled by factors that involve characteristics of host, material and surgical procedure. These responses themselves constitute a significant component of the phenomenon of biocompatibility. In this section, the broad concepts of biocompatibility are critically reviewed with particular reference to the role that the human host response plays in determining the performance of the biomaterial and of the device in which it is used. Particular emphasis is given to the influence of biocompatibility in the clinical applications of devices. It should be remembered, however, that biocompatibility phenomena are extremely difficult to interrogate remotely or to study in an active way, so that accurate information of the details of biomaterial-human tissue interactions is not readily available. As Black (1) has pointed out with reference to observations on the host response in general, we are usually limited to detecting events long after they have occurred by examining end-points, usually histopathologically, after the host is dead. This is largely the case with experiments on biocompatibility in animals, but is an even more relevant observation with the human clinical experience. All comments in this section must therefore be interpreted with this in mind.
Handbook of Biomaterial Properties. Edited by 1. Black and G. Hastings. Published in 1998 by Chapman & Hall, London. ISBN 0 412 60330 6.
1

482 I IL-_______ G_E_N __ E_R_A_L_C_O __ N_C_E_PT __ S_O_F_B __ IO_C_O __ M_P_A_T_IB __ IL_I_T_Y ______ ~
1.2 THE DEFINITION OF BIOCOMPATIBILITY
Etymologically, the term 'biocompatibility' sounds simple to interpret since it implies compatibility, or harmony, with living systems. This concept, however, is a little too simple to be useful and the meaning of compatibility has to be explored further.
It is intuitively obvious that a biomaterial or implanted medical device should cause no harm to the recipient by intent or by accident. This is the underlying principle of biological safety but is not the totality of biocompatibility. A material may well be entirely safe in the human body but unless it actually does something useful, it is not necessarily appropriate for a medical device. For many years during the evolution of biomaterials, this was not really taken into account and the 'requirements' of biomaterials were dominated by the perceived necessity to be safe, which was interpreted as a requirement that a biomaterial should be totally inert in the physiological environment and should itself exert no effect on that environment. In other words, there should be no interaction between biomaterials and the host, in the latter case implying that the material should be non-toxic, non-irritant, non-allergenic, non-carcinogenic, nonthrombogenic and so on.
This concept of biocompatibility, which equates the quality to inertness and biological indifference, has resulted in the selection of a portfolio of acceptable or standard biomaterials which have widespread usage. These range from the passivatable alloys such as stainless steel and titanium alloys, the noble metals gold and platinum, to some oxide ceramics such as alumina and zirconia, various forms of carbon and a range of putatively stable polymeric materials including silicone elastomers (polysiloxanes), polyolefins, fluorocarbon polymers and some polyacrylates. Of course, if this was all there was to biocompatibility, there would be few problems other than optimizing inertness and there would be little to write about.
In practice, biocompatibility is far more complex. There are at least four reasons for this. The first is that inertness in the physiological sense requires a great deal more than resisting degradation at the atomic or molecular level and the second is that even if it were so, this goal is extremely difficult to achieve. Indeed it is now recognized that no material is totally inert in the body. Even those very stable materials mentioned above will interact to some extent with tissues; titanium, although one of the most corrosion resistant engineering alloys, corrodes in the body, as judged by the presence of the metal in the surrounding tissues as well as serum and urine. With many materials, while the main component itself may be exceptionally inert, there are often minor components, perhaps impurities or additives which can be released under some circumstances. The leaching of plasticizers and other additives from plastics provide

L-________ TH ___ E_D_E_F_I_N_IT_I_O_N_O_F __ B_IO_C_O __ M_P_A_T_IB_I_L_IT_Y ________ ~I I 483
good examples of interactions which are not related to the molecular breakdown of the material but which confer a degree of instability to the product. Moreover, in the context of interactions which affect the overall performance of the material in the physiological environment, it is important to note that an interfacial reaction involving a physicochemical process such as protein adsorption will take place with the vast majority of materials, further emphasizing the fact that inertness is a very relative term and there is indeed no such thing as an inert biomaterial.
The third reason why biocompatibility cannot be equated with inertness is that there are several, and indeed an increasing number, of applications which involve intentionally degradable materials. The two most widely quoted situations here are absorbable sutures and implantable drug delivery systems but many more circumstances where degradable scaffolds and matrices could form an essential component of a device are envisaged. If biocompatibility is predicated on inertness, then degradable materials cannot, by definition, be biocompatible. This clearly does not make sense and suggests that the concept of biocompatibility needs to be altered.
The fourth reason is even more compelling, especially when considering biomaterials used in devices for tissue reconstruction. If a device is made from materials which are inert and which do not interact with the body in any way, then it is unlikely that it can be truly incorporated into the body. For effective long term performance in the dynamic tissue environment, it is far more preferable for there to be functional incorporation, which implies that the device should be stimulating the tissues to be reactive to it positively rather than negatively. Thus biocompatibility should not be concerned with avoiding reactions but selecting those which are the most beneficial to device performance.
On the basis of these ideas, biocompatibility was redefined a few years ago (2), as 'the ability to perform with an appropriate host response in a specific situation.' Clearly this definition encompasses the situation where inertness is still required for the most appropriate response in some situations is indeed no response. A traditional bone fracture plate is most effective when it is attached mechanically to the bone and does not corrode; no response of the tissue to the material is normally required. Even here, however, we have to concede that a material that could actively encourage more rapid bone healing might be beneficial so that a specific osteoinductive response would be considered appropriate.
More importantly, the definition allows a material to stimulate or otherwise favour a specific response, including cell activation, where that response optimizes the performance of the device. It will be obvious that the required response will vary with the particular application, which clearly implies that the response, both desired and actual, will vary with the different types of tissue encountered by biomaterials.
484 I ~I ________ G_E_N_E_R_A_L __ C_O_N_C_E_PT __ S_O_F_B_I_O_C_O_M __ PA __ T_IB_I_L_IT_Y ________ ~
The above definition also stipulates that the biocompatibility of a material has to be qualified by reference to the specific application. The response to some very common and popular biomaterials may vary quite considerably and some of the major problems of implantable medical devices have been caused by a misunderstanding about transferability of biocompatibility data. To recognize the very effective performance of a material under one set of conditions but then to assume that the same material can perform equally well under entirely different circumstances is inherently dangerous since it takes into account neither the variations one might expect to see in the host response from site to site nor the fact that what is appropriate for one situation may not be appropriate for another.
1.3 COMPONENTS OF BIOCOMPATIBILITY
The above definition of biocompatibility helps to explain the subject area but cannot describe exactly what it is. For this purpose we have to consider the various components that are involved in biocompatibility processes. Biocompatibility refers to the totality of the interfacial reactions between biomaterials and tissues and to their consequences. These reactions and consequences can be divided into four categories. These involve different mechanisms and indeed quite separate sectors of science but are, nevertheless, inter-related.
The first component is that of the protein adsorption mentioned above. This process is initiated as soon as a material comes into contact with tissue fluids such that relatively quickly the surface of the biomaterial is covered with a layer of protein. The kinetics and extent of this process will vary from material to material which will in any case be a dynamic phenomenon with adsorption and desorption processes continuously taking place. Under some circumstances, this layer is extremely important in controlling the development of the host response since cell behavior near the material may depend on interactions with these proteins. For example, thrombogenicity is controlled by a number of events including the interaction between plasma proteins and surfaces, these proteins being able to influence the attachment of platelets to the surface. In other circumstances, the effects of this protein layer are far from clear.
The second component of biocompatibility is that of material degradation. It is emphasized here that degradation is a component of biocompatibility rather than a separate phenomena. There is still confusion over this since it is often perceived that degradation, which occurs on the material side of the interface, is the counterpart to biocompatibility which is equated with the other (tissue) side. This is not correct since degradation is the counterpart to the local host response, both being contributory to the biocompatibility of the system.

~ __________ C_O_MP __ O_NE __ NT __ S_O __ F_B_IO __ C_O_MP __ A_T_IB_I_L_ITY ____________ ~I I 485
Degradation phenomena are covered elsewhere in this Handbook and will not be discussed in detail here. It is necessary to point out, however, that descriptions of material degradation mechanisms have to take the special, and indeed unique, features of the tissue environment into account. Whatever its location, a biomaterial will continuously encounter an aqueous environment during its use. This is not simply a saline solution, however, but a complex solution containing a variety of anions and cations, a variety of large molecules some of which are very reactive chemically, and a variety of cells which again may be in passive or active states. There are occasions when a degradation process can be explained, mechanistically and qualitatively, by the presence of an electrolyte. This is the situation with most metals when they suffer from corrosion in physiological environments (3). Even here, however, it is known that the kinetics of corrosion may be influenced by the organic species present, especially the proteins, and it is even possible for the corrosion mechanism to be somewhat different to that found in non-biological situations.
With other groups of materials, however, and especially with polymers, kinetics, mechanisms and consequences of the degradation are fundamentally related to the details of the environment. Although hydrolysis remains the substantive mechanism for degradation of most heterochain polymers, including polyurethanes, polyamides and polyesters, this hydrolysis may be profoundly influenced by the active species present in the tissue, especially in the tissue of the inflammatory response to materials. Included here are the influences of lysosomal enzymes (4). Moreover the hydrolysis may be supplemented by oxidative degradation, again occurring not only by virtue of passively dissolved oxygen in body fluids, but (and probably far more importantly) by active oxidative species such as superoxides, peroxides and free radicals, generated by activated inflammatory cells such as macrophages. It is thus possible for homochain polymers not particularly susceptible to hydrolysis and not normally oxidized at room temperature, to undergo oxidative degradation upon implantation (5). Polyolefins such as polyethylene and polypropylene come into this category.
The term 'biodegradation' is often used to describe degradation which occurs in such situations although the circumstances of and requirements for degradation to be so described have not been entirely clear. A recently agreed definition of biodegradation (6) states quite simply that it is the breakdown of a material mediated by a biological environment. The interpretation of 'biological' is left to the reader.
The purpose of explaining the role of the biological, or physiological environment in degradation phenomena, was to emphasize the crucial significance of the interaction between degradation and the host response, for not only can degradation be influenced by the host response but also it can control that response.

486 I ~I ________ G_E_N_E_R_A_L __ C_O_N_C_E_PT __ S_O_F_B_I_O_C_O_M __ PA __ T_IB_I_L_IT_Y ________ ~
To explain this in a little more detail, let us consider the evolution of the local host response, which is the third component of biocompatibility, using a model that involves inflammatory and repair processes (7). Whenever a material is implanted into the tissues of the body, there has to be a degree of trauma associated with the insertion process. This will inevitably establish an acute inflammatory response, which is the body's natural defence mechanism to any injury. The inflammation is totally desirable and helpful since it is the precursor to the second phase of the response, which is that of tissue repair. The response to a surgical incision is acute inflammation followed by repair, the consequences of which are a zone of fibrous (collagenous) scar tissue. If a biomaterial is placed within the tissue, this response will be modified by its presence, but the extent to which that modification occurs depends on many factors.
Considering first the role of the material, if that material were totally inert chemically and unable to react at all with the tissues, and if the device were not able to irritate the tissues in any way, the perturbation to the inflammation/repair sequence is minimal, and the result will be the formation of a zone of fibrous tissue analogous to the scar, but oriented in such a way as to envelope the implant. The classical response to an implant is its encapsulation by soft fibrous tissue. On the other hand, if the material is able to react with the tissues, chemically, mechanically or any other way, it will act as a persistent stimulus to inflammation. While there is nothing inherently harmful about inflammation as a response to injury, persistent inflammation occurring as a response to a persistent injury is less acceptable. At the very least, this results in a continued stimulus to fibrosis such that the capsule is far more extensive and may intervene between the material and tissue it is meant to be in contact with (for example bone in the case of joint prostheses) but perhaps more importantly it can change the immediate tissue environment from one of quiescent fibrosis to that of active chronic inflammation. This is rarely the appropriate response and, as noted above, is likely to generate an even more aggressive environment.
In the context of the definition of biocompatibility, therefore, it is important that the interaction between the material and the tissues is one which leads to an acceptable balance between inflammation and repair. A few points may serve to explain this further and qualify appropriateness. First, the nature of the host response and those features which constitute acceptability will vary very considerably from one host to another and from one location (or set of circumstances) to another within a particular host. It is often forgotten that host variables are as important as material variables in the determination of biocompatibility. This is particularly important when the wide variety of tissue characteristics is considered. Obviously bone is very different from nerve tissue or a vascular endothelium and there will be very considerable difference in the details of their

L-__________ C_O_M_P_O_N_E_N_T_S_O_F __ B_IO_C_O __ M_P_A_T_IB_I_L_ITY ____________ ~I I 487
responses. Not all tissues of the same variety will be able to respond in the same way and it should always be remembered that host variables such as age and overall health status will have a major effect.
Secondly, the importance of time and the sequence of events should never be underestimated. While the above model describes the sequence from surgical intervention to inflammation to repair, such that the process may undergo rapid resolution, with a resulting long lasting equilibrium, the inflammation may be restimulated at any time and rarely can we guarantee long term survival. In this context the third point becomes important, for any feature of the interaction between material and tissue and material can be responsible. In many situations it is the chemical reactivity, represented by degradation processes, which drives the inflammatory response, but it can equally well be a process by which fragments of the material are extracted by physical or mechanical means. The release of wear debris from orthopaedic prostheses is a good example here, since the presence of such particles in sufficient numbers can have a profound effect on the tissue response, which is mediated by the mechanisms of inflammation but where the clinical results, manifest by loosening of the prostheses, may not be seen for quite some time(8). As far as the response to debris is concerned, in general the effects of released fragments will be quite different to those of bulk materials, both by virtue of physical factors as well as changed chemical factors.
Thirdly, the identification of these events and their importance leads to various possibilities for the control of biocompatibility. In the balance of inflammation and repair we have the possibilities of controlling that balance by aiming to eliminate or at least minimize those events which are undesirable for one set of conditions or alternatively enhancing or optimizing those events which are most desirable. This has led to the emergence of the concept and indeed introduction of bioactive materials which have been defined as biomaterials that are designed to elicit or modulate biological activity.
As a final point about the local host response, it has to be recognized that there are significant regional and tissue-specific variations to the phenomena. These cannot be described here, but it is important to mention the particular case with blood. When a biomaterial comes into contact with blood, there are many different mechanisms by which the blood can interact with the material, most of which are preferably avoided. The most important of these are those processes, alluded to in an earlier paragraph, that are responsible for the clotting of blood. This is a vital defense mechanism which prevents death by uncontrolled bleeding under everyday circumstances, but unfortunately in the context of biomaterials, the two processes which can, either separately or together, initiate the formation of a blood clot, that is contact phase activation of clotting proteins and platelet activation, are themselves initiated by contact with

GENERAL CONCEPTS OF BIOCOMPATIBILITY 488 I I L-____________________________________________________ ~
foreign surfaces. Thrombogenicity, defined as the property of a material which promotes and/or induces the formation of a thrombus, is clearly an important feature of biocompatibility.
Turning now to the last component of biocompatibility, we have to recognize that if there is an interfacial reaction, there is no reason why the products of that reaction and their effects have to be confined to the locality of that interface and the presence of a benign local response is not necessarily indicative of the absence of any systemic or remote site effects. The possibility of systemic effects arising from the presence of biomaterials has long been recognized, although extreme difficulties exist with their identification and interpretation. Indeed, at the present time, there are few systemic effects that can be readily identified with biomaterials. The transformation of a thrombus into an embolus derived from an intravascular device has obvious implications and we can imagine and often demonstrate the systemic consequences of using overtly cytotoxic materials. However, the more intriguing speculations refer to the putative implant-related carcinogenicity and even more speCUlative implant-related immune responses. At this stage we have to be concerned about such possibilities but have to put the subject into context. While we cannot deny that there are possible mechanisms for biomaterials to induce tumors, the evidence that they do so in human clinical experience is very sparse. While it is possible for some hypersensitivity responses to be seen to implants, the evidence for any clinically ignificant response from the immune system to biomaterials is even less available.
1.4 CONCLUSIONS
This review attempts to outline the main concept that currently prevail in the subject area of biocompatibility. Clearly it is a complex subject, about which we are still relatively ignorant, not least because it involves a juxtaposition between two quite different sectors of science, the materials sciences and the molecular/cellular biological sciences. Based on these concepts, however, a better understanding is now emerging so that our biomaterials can be chosen, and where necessary treated, in order to determine that the tissues of the host do indeed respond appropriately to them.
ADDITIONAL READING
Black, J. (1992) Biological Performance of Materials - Fundamentals of Biocompatibility, 2nd edn, Marcel Dekker, Inc., New York.
A recently updated introductory text describing the basic principles of the performance of biomaterials in biological environments and the relevance of the biomaterial-tissue interactions.

~ _______________ RE __ FE_RE __ N_C_ES ______________ ~I I 489
Hench, L.L. and Etheridge, E.C. (1982) Biomaterials: An Interface Approach, Academic Press, New York.
An early text describing concepts of biomaterials and their interactions with tissues, concentrating on the interface and based on the authors' experiences with bioceramics.
Williams, D.F. (ed.) (1981) Fundamental Aspects of Biomaterials, Volumes I & II, CRC Press, Boca Raton.
An edited collection of contributions dealing with the major components of biocompatibility mechanisms, including corrosion and degradation phenomena, toxicology and the local tissue response.
REFERENCES
1. Black, l. (1984) Systemic effects of biomaterials. Biomaterials, 5, 11-18. 2. Williams, D.F. (1987) Definitions in Biomaterials, Elsevier, Amsterdam, pp.
49-59. 3. Williams, D.F. (1985) Physiological and microbiological corrosion. CRC
Critical Reviews in Biocompatibility, 1(1), 1-24. 4. Williams, D.F., Smith, R. and Oliver, C. (1987) The enzymatic degradation of
polymers in vitro. Journal of Biomedical Materials Research, 21, 991-1003. 5. Williams, D.F. and Zhong, S.P. (1991) Are free radicals involved in the
biodegradation of implanted polymers? Advanced Materials, 3, 623-626. 6. Williams, D.F., Black, l. and Doherty, P.l. (1992), in Doherty, P.l., Williams,
R.L., Williams, D.F. et al. (eds.) Biomaterial-Tissue Interfaces, Advances in Biomaterials, Volume 10. Elsevier, Amsterdam, pp. 525-533.
7. Williams, D.F. (1989) A model for biocompatibility and its evaluation. Journal of Biomedical Engineering, 11, 185-192.
8. Williams, D.F. (1976) Biomaterials and biocompatibility. Med. Prog. Tech., 4(112), 31-42.

01 L-__ S_o_ft_ti_ss_ll_e_r_e_s_p_O_D_se __ ----I
J .M. Anderson
2.1 INTRODUCTION
Soft tissue responses to biomaterials for medical devices are generally viewed from the inflammation and wound healing perspectives and are usually considered as parts of the tissue or cellular host responses to injury. Placement of a biomaterial or medical device in the soft tissue environment involves injection, insertion, or surgical implantation, all of which injure the tissues or organs involved. Early host responses are dynamic and change with time (Table 2.1). It is important to consider this time variable in determining the host response or biocompatibility of a material.
2.2 TYPES OF RESPONSE
Four general types of response may occur following the implantation of a biomaterial. These are a minimal response, a chemically induced response, a physically induced response, and cellular/tissue necrosis [1].
A minimal response is generally called fibrous encapsulation and the implant is encapsulated within fibrous tissue containing mainly collagen with a few fibroblasts. At the tissue/implant interface, a one to two cell layer of macrophages and foreign body giant cells is present which constitutes the foreign body reaction.
Chemically induced responses may range from an acute, mild inflammatory response to a chronic, severe inflammatory response. These responses may be the result of leaching of biomaterial additives or degradation products.
Handbook of Biomaterial Properties. Edited by 1. Black and G. Hastings. Published in 1998 by Chapman & Hall, London. ISBN 0412603306.
L-________________ TYP ___ E_S_O_F_RE __ S_P_O_N_S_E ________________ ~I I 491
Table 2.1 Sequence of Local Events Following Implantation
Injury Acute Inflammation Chronic Inflammation Granulation Tissue Foreign Body Reaction Fibrosis
Physically induced responses are usually the result of the size, shape, porosity, and other geometric factors of the biomaterial or device. The form and topography of the surface of the biomaterial may determine the composition of the foreign body reaction. With biocompatible materials, the composition of the foreign body reaction and the implant site may be controlled by the surface properties of the biomaterial, the form of the implant, and the relationship between the surface area of the biomaterial and the volume of the implant. High surface to volume implants such as fabrics, porous materials, or particulate, will have higher ratios of macrophages and foreign body giant cells at the implant site than will smooth-surface implants, which will have fibrosis as a significant component of the implant site [2-5]. These three general types of responses are generally found with biocompatible materials.
The fourth type of response, i.e., cellular necrosis, is a toxic reaction which leads to cell death. It is generally taken as a sign of the incompatibility of a material and is generally the response to highly toxic additives, residual monomer, or degradation products released from the biomaterial [6]. The similarity between chemically induced responses leading to chronic, severe inflammatory responses and cellular/tissue necrosis should be considered in determining the biocompatibility of a biomaterial.
Mechanical factors and edge effects may modify the response to a biomaterial. Implant motion or micromotion can lead to variations in the fibrous capsule thickness and the composition of the fibrous capsule and the interfacial foreign body reaction. Edges and sharp changes in surface features may lead to a variation in fibrous capsule thickness and the presence of variable concentrations of chronic inflammatory cells, i.e., monocytes and lymphocytes.
Immune and neoplastic responses are specialized responses which are rarely seen with biomaterials and medical devices. Immune responses are generally created by the phagocytosis of particulate by macrophages which biochemically process the material and communicate with lymphocytes to produce the immune response. The metal sensitivity response is a well-known immune response to metallic corrosion products. Neoplastic, i.e., tumor formation, responses are generally considered to be an example

492 I IL-_______________ S_O_FT __ T_IS_S_U_E_R __ E_SP_O_N_S_E ______________ ~
of solid state tumorigenesis. Solid state tumorigenesis is generally linked to the extent or degree of fibrous capsule formation and the potential for solid state tumorigenesis is reduced with increasing foreign body reaction.
2.3 INFLAMMATION
Inflammation is defined as the reaction of vascularized living tissue to local injury (Table 2.1) [7,8]. The size, shape, and intended application of a biomaterial or medical device determine the implantation procedure which in turn determines the extent or degree of initial injury. The size, shape, and chemical and physical properties of the biomaterial may be responsible for variations in the intensity and time duration of the inflammatory and wound healing processes. Figure 2.1 illustrates the temporal sequence of inflammation and wound healing. The inflammatory response is a series of complex reactions involving various types of cells whose implant site concentrations (densities), activities and functions are controlled by various endogenous and autogenous mediators [9]. The predominant cell type present in the inflammatory response varies with the age of the injury, i.e., the time since the implant was inserted. Neutrophils, which are the characteristic cell type of acute inflammation, predominate during the first several days following implantation and are replaced by monocytes as the predominant cell type. Acute inflammation is of relatively short duration, lasting from minutes to days, depending on the extent of injury. The main characteristics of acute inflammation are the exudation of fluid and plasma proteins (edema) and the immigration of leukocytes (predominantly neutrophils). Following localization of leukocytes at the implant site, phagocytosis and the release of enzymes, reactive oxygen intermediates (ROI), and other agents occur following activation of neutrophils and macrophages. Agents released from activated leukocytes, hydrogen ions (acid), enzymes, ROIs and others, may effect the biodegradation of biomaterials [10,11]. The major role of the neutrophils in acute inflammation is to phagocytose and destroy microorganisms and foreign material.
Acute inflammation is of relatively short duration, lasting from minutes to days, and is dependent on the extent of injury. As the acute inflammatory response subsides, monocytes and lymphocytes predominate in the implant site and are the characteristic cells of chronic inflammation [7,8]. Monocytes, migrating from the blood, in the acute and chronic inflammatory responses differentiate into macrophages within the tissue in the implant site. These macrophages will fuse or coalesce into foreign body giant cells (Figure 2.1). Macrophages and foreign body giant cells are prominent at the tissue/implant interface, even with biocompatible materials. In Figure 2.1, the intensity and time variables are dependent upon

INFLAMMA nON I I 493 L-______________________________________________________
ACUTE - CHRONIC -- GRANULATION TISSUE ~
."Neutrophils ,------------------- Macrophages .- " /' Neovascularization
I
//
,," _- Fibrosis
" ........... ,.t':.:: ......... Mononuclear
~ ________________________________________________ ~Le~ucoc~es
Time (Minutes. Hours. Days. Weeks)
Figure 2.1 The temporal variation in the acute inflammatory response, chronic inflammatory response, granulation tissue development, and foreign body reaction to implanted biomaterials. The intensity and time variables are dependent upon the extent of injury created in the implantation and the size, shape, topography, and chemical and physical properties of the biomaterial.
the extent of injury created in the implantation and the size, shape, topography, and chemical and physical properties of the biomaterial.
In the phagocytosis process, recognition and attachment of neutrophils and monocytes/macrophages are expedited when the biomaterial is coated by naturally occurring blood serum factors called opsonins. The two major opsonins are IgG and the complement-activated fragment C3b. Both of these plasma-derived proteins are known to adsorb to biomaterials and neutrophils and macrophages have corresponding cell membrane receptors for these opsonization proteins. These receptors may also playa role in the activation of the attached neutrophils, monocytes, macrophages, or foreign body giant cells. Small particles, of the order of 5 !-lm in largest dimension, may undergo the phagocytosis or engulfment process by neutrophils, monocytes/macrophages, or specialized cells in the reticuloendothelial system (liver, spleen, etc.). Medical devices with surface areas of biomaterial many times greater than the size of the cell may stimulate frustrated phagocytosis. Frustrated phagocytosis does not involve engulfment of the biomaterial but rather the extracellular release of leukocyte products in an attempt to degrade or destroy the biomaterial [12]. Macrophages and foreign body giant cells adherent to the surface of the biomaterial may undergo frustrated phagocytosis with the release of hydrogen ion (acid) enzymes, ROIs, and others. Little is known regarding the extent or time period of frustrated phagocytosis and its dependence on the chemical and physical properties of the biomaterial.

494 I ~I ________________ S_O_FT __ T_IS_S_U_E __ R_E_SP_O_N __ SE ________________ ~
The cells and components of vascularized connective tissue (Table 2.2) are involved in the inflammatory and wound healing responses. Thus, injury to soft tissues involves the specific types of cells which constitute the organ or tissue as well as the cells and components of vascularized connective tissue. Vascularized connective tissue can be viewed as the general network which holds together specific cell types in unique threedimensional patterns to constitute organs or tissues.
While it is convenient to consider blood-material interactions separately from tissue-material interactions, it must be emphasized that blood-material interactions and the inflammatory response are intimately linked and, in fact, early responses to injury involve mainly blood and blood vessels. Therefore, both cellular and humoral elements, i.e., plasma proteins, etc., are considered as cells and components of vascularized connective tissue.
2.4 WOUND HEALING AND FIBROSIS
The wound healing response is initiated by the action of monocytes and macrophages, followed by proliferation of fibroblasts and vascular endothelial cells, i.e., capillaries, at the implant site. The proliferation of fibroblasts and the formation of capillaries constitute granulation tissue. Modified fibroblasts, i.e., myofibroblasts, which have contractile properties which assist in wound site closure are transiently present in granulation tissue. As fibroblasts predominate over macrophages in the healing response, collagens and other extracellular matrix molecules are deposited in the implant site. The extent of the wound healing response is generally dependent on the extent or degree of injury or defect created by the implantation procedure. Wound healing progresses by primary union (or first intention) if the healing is clean such as a surgical incision in
Table 2.2 Cells and Components of Vascularized Connective Tissue
Intravascular (blood) cells Erythrocytes (RBC) Neutrophils Monocytes Eosinophils Lymphocytes Basophils Platelets
Connective tissue cells Mast Cells Fibroblasts Macrophages Lymphocytes
Blood plasma proteins Coagulative Proteins Complement Proteins Albumin Fibrinogen Gamma-Globulins Others
Extracellular matrix components Collagens Elastin Proteoglycans Fibronectin Laminin

REPAIR OF IMPLANT SITES I I 495 ~----------------------------------------------------~
which the wound edges have been approximated by surgical sutures, clips, or staples. Healing under these conditions occurs with a minimal loss of tissue. Wound healing by secondary union (or secondary intention) occurs when there is a large tissue defect that must be filled or there has been an extensive loss of cells and tissue. In wound healing by second intention, regeneration of specific organ or tissue cells cannot completely reconstitute the original architecture and more granulation tissue is formed resulting in larger areas of fibrosis or scar formation. Thus, the surgical procedure to create the implant site may influence the extent or degree of the wound healing response.
The end-stage healing response to biomaterials and medical devices is generally fibrous encapsulation by collagenous fibrous tissue. This has been previously described as the minimal response. In the minimal response, the tissue/implant interface has a layer of macrophages and foreign body giant cells, i.e., foreign body reaction, on the surface of the biomaterial and this is surrounded or encapsulated by a fibrous capsule which is composed of collagen, proteoglycans, and other extracellular matrix molecules. Fibroblasts may be present in the fibrous capsule.
2.5 REPAIR OF IMPLANT SITES
Repair of implant sites involves two distinct processes: regeneration, which is the replacement of injured tissue by parenchymal cells of the same type, or replacement by fibrous connective tissue that forms a capsule [7]. These processes are generally controlled by either (i) the proliferative capacity of the cells in the tissue or organ receiving the implant and the extent of injury as it relates to tissue destruction or (ii) persistence of the tissue framework of the implant site. The regenerative capacity of cells permits their classification into three groups: labile, stable (or expanding), and permanent (or static) cells. Labile cells continue to proliferate throughout life, stable cells retain this capacity but do not normally replicate, and permanent cells cannot reproduce themselves after birth of the host.
Perfect repair, with restitution of normal structure, theoretically occurs only in tissues consisting of stable and labile cells, whereas all injuries to soft tissues composed of permanent cells may give rise to fibrosis and fibrous capsule formation with very little restitution of the normal tissue or organ structure. Tissues composed of permanent cells (e.g., nerve cells, skeletal muscle cells, and cardiac muscle cells) most commonly undergo an organization of the inflammatory exudate, leading to fibrosis. Tissues composed of stable cells (e.g., parenchymal cells of the liver, kidney, and pancreas), mesenchymal cells (e.g., fibroblasts, smooth muscle cells, osteoblasts, and chondroblasts), and vascular endothelial and labile cells (e.g., epithelial cells and lymphoid and hematopoietic cells) may also

496 II ~ ________________ S_O_FT __ T_IS_S_U_E __ R_E_SP_O_N __ SE ________________ ~
follow this pathway to fibrosis or may undergo resolution of the inflammatory exudate, leading to restitution of the normal tissue structure. The condition of the underlying framework or supporting stroma of the parenchymal cells following an injury plays an important role in the restoration of normal tissue structure. Retention of the framework may lead to restitution of the normal tissue structure, whereas destruction of the framework most commonly leads to fibrosis. It is important to consider the species-dependent nature of the regenerative capacity of cells. For example, cells from the same organ or tissue but from different species may exhibit different regenerative capacities and/or connective tissue repair. An example of species differences in cell proliferation and regeneration is the endothelialization process, proliferation of endothelial cells, on the luminal surface of vascular grafts which does not occur in humans but does occur in other mammals including other primates.
Following injury, cells may undergo adaptations of growth and differentiation. Important cellular adaptations are atrophy (decrease in cell size or function), hypertrophy (increase in cell size), hyperplasia (increase in cell number), and metaplasia (change in cell type). Hyperplasia of smooth muscle cells at blood vessel/vascular graft anastomoses may lead to failure of the graft by stenosis or occlusion, i.e., narrowing of the lumen, and thrombosis. Other adaptations include a change in which cells stop producing one family of proteins and start producing another (phenotypic change) or begin a marked overproduction of protein. This may be the case in cells producing various types of collagens and extracellular matrix proteins in chronic inflammation and fibrosis. Causes of atrophy may include decreased workload (e.g., stress-shielding by implants), as well as diminished blood supply and inadequate nutrition (e.g., fibrous capsules surrounding implants).
Local and system factors may playa role in the wound healing response to biomaterials or implants. Local factors include the site (tissue or organ) of implantation, the adequacy of blood supply, and the potential for infection. Systemic factors may include nutrition, hematologic and immunologic derangements, glucocortical steroids, and pre-existing diseases such as atherosclerosis, diabetes, and infection.
2.6 SUMMARY
Inflammation, wound healing, foreign body response, and repair of implant sites are usuaIly considered components of the general soft tissue response to biomaterials or medical devices. The extent or degree and temporal variations in these responses are dictated by the inherent biocompatibility characteristics of the biomaterial or medical device. Factors which may playa role in the soft tissue response include the size,
L-_______________ A_D_D_I_T_IO_N_A __ L_R_E_A_D_I_N_G ______________ ~I I 497
shape, topography, and chemical and physical properties of the biomaterial. As the implantation procedure involves injury to vascularized connective tissue, blood responses and interactions may play a role in the general soft tissue response. The extent, degree or type of soft tissue response is generally considered to be tissue-specific, organ-specific, and species-specific. Thus, a given biomaterial may be considered to be biocompatible in one shape or form but not in another and in one tissue but not in another depending on the given application.
ADDITIONAL READING
Black, I. (1992) Biological Performance of Materials - Fundamentals of Biocompatibility, 2nd edn, Marcel Dekker, New York.
This volume is an excellent tutorial text for the engineer/biomaterial scientist/biologist/and others who have little or no knowledge in the area of biomaterials and medical devices. The text is divided into four parts: General considerations, material response: function and degradation of materials in vivo, host response: biological effects of implants, and methods of test for biological performance. The fourth part, Methods of test for biological performance, is unique to biomaterials texts and provides the reader with in vitro and in vivo test models and methods as well as perspectives on the design, selection, standardization, and regulation of implant materials.
Cohen, I.K., Diegelmann, R.F. and Lindblad, W.I. (eds) (1992) Wound Healing: Biochemical and Clinical Aspects, W.B. Saunders Co., Philadelphia.
This is an edited volume containing 35 chapters. The volume addresses the following areas: Biological processes involved in wound healing (6 chapters), structural and regulatory components of wound healing (7 chapters), factors affecting tissue repair (7 chapters), repair of specific tissues (7 chapters), and clinical management of healing tissues (7 chapters). This is an excellent volume which provides an up-to-date and in-depth perspective of various aspects of wound healing. The references lists provided at the end of each chapter are extensive. The strength of the volume is its biological perspective and little is provided on biomaterials. The chapter by Frederick Grinnell on cell adhesion does offer a biomaterial perspective.
Gallin, I. A., Goldstein, I.M. and Snyderman, R. (eds) (1992) Inflammation: Basic Principles and Clinical Correlates, 2nd ed, Raven Press, New York.
This is an edited volume containing 58 chapters by individual authors. The volume is divided in the following areas: Soluble components of inflammation (10 chapters), cytokines (5 chapters), cellular components of inflammation (21 chapters), responses to inflammation (3 chapters), clinical correlates (13 chapters), and pharmacologic modulation of inflammation (4 chapters). Each chapter is a critical, in-depth review of the indicated subject and the references are extensive. This is an excellent volume for those wanting an in-depth overview of the inflammatory process and its components. No information is provided on biomaterial/inflammation interactions.

498 I LI ________________ S_O_FT __ T_IS_S_U_E __ R_E_SP_O_N __ SE ________________ ~
Greco, RS. (ed.) (1994) ImpLantation BioLogy: The Host Response and BiomedicaL Devices, CRC Press, Boca Raton.
This is an edited volume containing 23 chapters. Three chapters deal with biomaterials in general, 6 chapters address specific blood and tissue interactions with biomaterials, 10 chapters address the use of biomaterials in specific surgical disciplines, and 3 chapters address tissue engineering and genetic manipulation of cells. The reference list for each chapter is extensive. This is an excellent overview of how biomaterials interact with the host and the specific use of biomaterials in indicated applications.
Harker, L.A., Ratner, B.D. and Didisheim, P. (eds) (1993) CardiovascuLar BiomateriaLs and Biocompatibility: A Guide to the Study of BLood-TissueMateriaL Interactions, CardiovascuLar PathoLogy, 2 (3 Suppl), IS-224S.
This is the third edition of a standard National Institutes of Health reference previously entitled Guidelines for BLood-MateriaL Interactions - Report of the NationaL Heart, Lung, and BLood Institute Working Group. The volume contains 20 chapters and 3 appendices. The chapters address the following areas: Pathophysiologic mechanisms, materials and their physicochemical characterization, safety testing of materials and devices, and blood-vessel-material interactions. The appendices are entitled: NIH Primary Reference Materials, International Standards for Biological Evaluation of Medical Devices, and Blood Analog Fluid for Medical Device Evaluation. This volume provides an in-depth perspective on cardiovascular materials and state-of-the-art information is provided regarding biomaterials. This is an excellent review, however, the editors limited the length and number of references for each chapter due to space considerations.
REFERENCES
1. Williams, D.F. and Roaf, R (1973) ImpLants in Surgery, W.B. Saunders Company Ltd., London, pp. 233-35.
2. Anderson, 1.M. (1993) Mechanisms of inflammation and infection with implanted devices. CardiovascuLar PathoLogy, 2 (3 Suppl.), M319-M321.
3. Anderson, 1.M. (1994) In vivo biocompatibility of implantable delivery systems and biomaterials. European JournaL of Biopharmaceutics, 40, 1-8.
4. Anderson, 1.M. (1994) Inflammation and the foreign body response. ProbLems in GeneraL Surgery, 11(2), 147-160.
5. Black, 1. (1992) The inflammatory process, in BioLogicaL Performance of MateriaLs -FundamentaLs of Biocompatibility, 2nd edn, Marcel Dekker, Inc., New York, pp. 125-147.
6. Marchant, RE., Anderson, 1.M. and Dillingham, E.O. (1986) In vivo biocompatibility studies. VII. Inflammatory response to polyethylene and to a cytotoxic polyvinylchloride. JournaL of BiomedicaL MateriaLs Research, 20, 37-50.
7. Cotran, RZ. et aL. (1994) Inflammation and repair, in PathoLogic Basis of Disease, 5th edn, Cotran, RZ., Kumar, V. and Robbins, S.L. (eds), W.B. Saunders Co., Philadelphia, pp. 51-92.

L-___________________ R_E_F_E_R_E_N_C_E_S __________________ ~I I 499
8. GalIin, J.I., Goldstein, I.M. and Snyderman, R. (eds) (1992) Inflammation. Basic Principles and Clinical Correlates, 2nd edn, Raven Press, New York.
9. Spector, M., Cease, C. and Tong-Li, X. (1989) The local tissue response to biomaterials. CRC Critical Reviews in Biocompatibility, 5 (4), 269-295.
10. Weissman, G., Smolen, J.E. and Korchak, H.M. (1980) Release of inflammatory mediators from stimulated neutrophils. New England Journal of Medicine, 303,27-34.
11. Henson, P.M. (1980) Mechanisms of exocytosis in phagocytic inflammatory cells. American Journal of Pathology, 101, 494-511.
12. Henson, P.M. (1971) The immunologic release of constituents from neutrophil leukocytes: II. Mechanisms of release during phagocytosis, and adherence to nonphagocytosable surfaces. Journal of Immunology, 107, 1547-57.

o L...-1 __ "_a_r_d_t_is_s_ll_e_r_e_s_p_o_D_s_e_------I
T. Albrektsson
3.1 INTRODUCTION
The initial tissue response when a biomaterial is implanted in the body is dependent on release of specific growth factors. It has been indicated by Frost [1] that the inevitable bone injury resulting from surgery and the presence of an implant will release various types of growth factors that will sensitize cells and promote cellular mitosis. This is a general healing response that will result in growth of all sorts of local connective tissues, bone as well as various types of soft tissue.
The balance between these tissue varieties is controlled by the action of chemical mediators which issue 'instructions' for the amount of bone and soft tissue to be formed as an appropriate healing response. This delicate balance can easily be disturbed inadvertently and may cause the undesirable end-result of an interfacial soft tissue embedment of the implant or, in the case of fracture healing, formation of a pseudoarthrosis. The discussion in this section will focus on various modes of implant fixation, such as cementation, ingrowth and osseointegration (Figure 3.1).
3.2 FIXATION BY CEMENTATION
Bone cement, a two component acrylic, is frequently used for implant fixation in the cases of hip and knee arthroplasties. Bone cement is toxic with localized as well as general adverse tissue reactions [2]. Therefore, the good long-term results reported with cemented arthroplasties seem to be quite puzzling. However, it must be understood that the strength of
Handbook of Biomaterial Properties. Edited by J. Black and G. Hastings. Published in 1998 by Chapman & Hall, London. ISBN 0 412 60330 6.

CE
ME
NT
ED
IM
PL
AN
T
CE
ME
NT
-FR
EE
IM
PL
AN
T
OSS
EO
INT
EG
RA
TE
D
IMPL
AN
T
CO
UA
GE
N A
ND
TIS
SVE
IN
TE
RD
IGIT
AT
ION
Fig
ure
3.1
Dif
fere
nt c
lass
ific
atio
n cr
iter
ia a
re u
sed
for
impl
ants
in
bone
. H
ere
we
dist
ingu
ish
betw
een
cem
ente
d im
plan
ts,
whi
ch a
re
depe
nden
t up
on c
ure
in p
lace
lut
ing
or f
illin
g ag
ents
; ce
men
t-fr
ee (
ingr
owth
im
plan
ts)
whi
ch a
re d
epen
dent
on
bone
tis
sue
grow
th
into
sur
face
fea
ture
s fo
r fi
xatio
n; a
nd o
sseo
inte
grat
ed i
mpl
ants
, w
hich
are
dep
ende
nt u
pon
coll
agen
and
cel
lula
r pr
oces
ses
and
thei
r ph
ysio
chem
ical
int
erac
tion
s w
ith
the
impl
ant
surf
ace
for
fixa
tion.
In
each
cas
e,
a 'r
idge
' fe
atur
e on
the
im
plan
t su
rfac
e is
sho
wn
in
cros
s-se
ctio
n; t
he w
idth
of
each
ban
d of
the
dia
gram
is
seve
ral
mil
lim
eter
s (c
ells
(os
teoc
ytes
) ar
e sh
own
larg
er t
han
actu
al s
ize)
.

502 II ~ _______________ H __ A_R_D_T_I_S_SU __ E_R_E_S_P_O_N_S_E ______________ ~
the cemented bone interface is not related to the live state of bone tissue: in reality, the curing bone cement invading the trabecular network results in a substantial cancellous bone interdigitation (Figure 3.1). The interfacial bone usually dies from the combined trauma of heat and monomer leakage. The width of this necrotic zone varies depending on the extent of the surgical trauma and the type of bone cement used, but is at least a few millimeters [2] . Ironically, a revitalization of the interfacial bone may prove disastrous, as the bone will then run an increased risk of resorption. In examining interfacial tissues reactions to retrieved cemented orthopaedic implants, most studies have examined the tissue after removal of the implant. This leads to an uncertainty in examining the proportion of true bone to implant contact.
We have been able to investigate bone implants in situ, at the resolution level of light microscopy, utilizing the techniques developed by Donath et al. [3]. Computer assisted calculations, using custom developed software, permit determination of the proportion of bone to implant contact, the amount of bone in the region adjacent to the implant and comparisons of the bone density adjacent to and in the immediate region of the implant ('outfolded mirror image') (Figure 3.2).
BONE
Figure 3.2 Computerized histomorphometric approach to evaluation of the bone-implant interface. The bone-to-implant contact percentage is the linear contact area between bone and implant in the inside zone; percent bone ingrowth is the ratio of bone 'inside' to that 'outside' in the 'mirror' zone.

FIXATION BY INGROWTH (CEMENT-FREE IMPLANTS IN BONE) I I 503
These data correlate positively to biomechanical tests: the more bone in the interfacial region of the implant, the greater the torque necessary to remove the implant when we apply controlled rotational forces to the implant body. Specimens of 10!Lm thickness have been investigated at the light microscopic level of resolution [4]. Other studies using cutting and grinding techniques have investigated the implant in situ, but ended up with sections of a final thickness of 40!Lm or more leading to clear overestimates of the true bone to implant contact. In a retrieval study of cemented resurface arthroplasties, Morberg [2] was able to overcome these methodological problems and verify a very poor bone to cement contact, even though he found bone fragments with disturbed mineral-ization bordering the cement. .
3.3 FIXATION BY INGROWTH (CEMENT-FREE IMPLANTS IN BONE)
In the absence of cement, fixation may be obtained by active bone tissue ingrowth into the implant surface irregularities of medullary stems (Figure 3.2). As pointed out by Black [5], one disadvantage of cement-free implants is the 3-4 week waiting time before the bone-implant interface can support significant shear loading; this is in contrast to a cemented interface which, if successful, has adequate shear strength within one hour of implantation. Osseo integrated implants have even lower interfacial shear strength at the the same 3-4 week post operative time point [6].
In the clinical experience, however, the results of cement-free joint arthroplasties utilizing ingrowth fixation have not matched those of cemented devices. The appropriate bone ingrowth is often disturbed and incomplete, leading to early failure of fixation. Cement-free knee arthroplasty components have been observed to migrate by up to 2 mm in the first post-operative year, while cemented devices of the same design migrate only half as much or less [7]. The failure rates of cement-free hip arthroplasties have been so substantial in comparison to cemented devices that the former mode of implant insertion has been restricted to young patients for whom cemented devices give poorer results at most clinics [8].
The outcome of cement-free orthopaedic implants depends, as does the outcome of craniofacial osseo integrated implants, on the more or less simultaneous control of a number of different factors including biocompatibility, design and surface conditions of the implant, the state of the host bed, the surgical technique and the loading conditions after implant insertion.
Herein is the explanation for the dubious results of many current designs of cement-free hips and knees: the implant material used, the design and

504 I LI _______________ H __ A_R_D_T_I_S_SU __ E_R_E_S_P_O_N_S_E ______________ ~
surface finish have been well adapted to engineering demands, but not so well matched to the biological needs.
Ideal implant characteristics with respect to bone anchorage are quite different from those of gliding surfaces. The surgical technique utilized when inserting a cement-free hip or knee of current designs is, of necessity, traumatizing: resulting in an impaired bone healing response. Current stem-type cement-free hips migrate when loaded, as do tibial components of artificial knees, leading to a change in the chemical mediators and subsequent increase of soft tissue formation. It is, therefore, not surprising to learn from studies of retrieved cement-free hips that there is, as a rule, only sparse bony ingrowth into retrieved acetabular cups [9], femoral cups [2, 10] or femoral stems [9, 11, 12]. More modern types of cement free hip prostheses with titanium meshwork or HA-coated surfaces have had slightly better clinical results than those implanted and retrieved during the 1980s and it may well be possible that there is more abundant bone ingrowth in some of the more recent designs. Nevertheless, from multicenter studies it seems quite clear that summed five-year failure rates for cement-free arthroplasties are greater than those for cemented devices [8]. This observation illustrates that the anchorage problems associated with cement free arthroplasties are far from solved.
3.40SSEOINTEGRATION
Osseointegration is a term introduced by Bd\nemark et al. [13] to describe a loaded, stable implant in direct contact with bone (no apparent intervening soft tissue under light microscopic examination). Osseo integrated implants differ from ingrown ones that are dependent upon bone growth into surface macroscopic features or irregularities. By contrast, osseointegration is dependent on tissue ingrowth into minute surface features, such as the fundamental asperities of a 'smooth' surface or, as postulated for surfaces of various crystalline calcium phosphates (such as calcium hydroxyapatite) or amorphous, bioactive glasses, on direct chemical bonding between tissue and implant. Irrespective of the type of interfacial contact - chemical bonding or mechanical interdigitation - an important difference is that while the former requires only limited tissue elements, the latter requires complete, mature bone elements for appropriate function. Theoretically, an ingrown interface may also be osseo integrated as well but experimental evidence for this, from examination of thin sections, is virtually nonexistent. Macroscopic features on implant surfaces designed for ingrowth fixation include sintered beads, rough plasma sprayed coatings and sintered meshes, since bone requires features of minimum dimensions of about 100 JJ.m for successful ingrowth [14, 15].

OSSEOINTEGRA nON I I 505 L-______________________________________________________
However, surface irregularities only in the nanometer to micrometer range are necessary for osseointegration when implant stability is dependent on cellular and/or collagen ingrowth, rather than bone ingrowth. Since this ingrowth (perhaps better termed 'ongrowth') of tissue elements occurs in a three dimensional manner, the osseointegrated implant will, from a biomechanical viewpoint, be a directly bone-anchored device. In fact, Wennerberg [16] has demonstrated that implant surfaces with a CLA (center line average) roughness of -1 ILm will experience more rapid bony incorporation, through osseointegration, than ones with CLAs of 0.1 or 2 ILm. This observation leads to the hypothesis that too smooth surfaces (CLA -0.1) may not permit proper collagen attachment while rougher ones (CLA ~ 2 ILm) may release too many metal ions that disturb cellular functions necessary for anchorage.
There is no doubt that osseointegration has resulted in a clinical breakthrough in oral implants. Soft tissue embedded load-carrying devices do not function adequately in the jaw. In sharp contrast, properly osseointegrated implants do. However, this does not necessarily imply that every functioning bone implant in other parts of the body need to be osseointegrated. On the contrary, cemented hip arthroplasties with a bone-cement interface consisting of soft tissue or mostly dead bone have demonstrated significant clinical longevity, in many cases exceeding ten to fifteen years.
Furthermore, the so called osseointegrated interface is still in need of a proper definition. First described by Bn\nemark [17] as a bone response that occurred everywhere around the implant circumference of c.p. titanium screws in placed in bone, osseointegration is regarded today as a more nonspecific tissue response resulting in a mix of interfacial soft and hard tissues. In reality, bone anchorage of foreign bodies is a more general type of tissue response that occurs to c.p. titanium alone [3]. The only definition of osseointegration that has stood up to a critical analysis is based on a clinical finding of implant stability: 'A process whereby clinically asymptomatic rigid fixation of alloplastic materials is achieved and maintained, in bone, during functional loading' [18]. The continued usage of a term such as osseointegration is motivated by the proven clinical results in the case of craniofacial implants and the hope to replicate these findings in the case of orthopaedic implants in the future. However, from a strict histological point of view osseointegration remains poorly defined.
Osseointegrated implants have resulted in a clinical breakthrough in two different clinical applications in the craniofacial skeleton: one of these being oral implants, irrespective of whether treating total or partial edentulousness [19, 20]; the other being skin penetrating extra-oral implants. The clinical results of screw-type, c.p. titanium oral implants in mandibles or maxillas for 5 years or more of follow up have been in the 90-99% range[21]. The results of skin penetrating implants in the temporal bone region have been similar, but not in the orbit region, where the host bed

506 I LI _______________ H __ A_R_D_T_I_S_SU __ E_R_E_S_P_O_N_S_E ______________ ~
has been irradiated. Now, 20 years since their clinical introduction in 1977, permanent skin-penetrating, osseointegrated, screw-shaped titanium implants are regarded as routine clinical treatments for facial disorders or certain types of hearing impairments [22, 23].
Press-fit fixation represents one approach to the osseointegration of orthopedic implants. The design of press-fit joint replacements is based on three dimensional geometric data with the intention of fitting the implant as closely as possible to the host bone. The objective of this design approach is to transfer load across the implant-bone interface to as wide an area of the bone as possible [24]. In theory, press-fit fixation may lead to osseointegration of the implanted device. However, as it is difficult to mimic precisely the resulting intravital loading patterns, osseo integration of initially stable press-fit components is threatened by subsequent bone remodeling processes. Too stiff a device may cause 'stress shielding,' leading to bone resorption. Conversely, too high local stresses may lead to pressure necrosis and resorption prior to remodeling. Finally, bone resorption may lead to local interfacial movements: these predispose to soft-tissue formation and may cause a subsequent failure of fixation.
Polymers are not one hundred percent stable under biological conditions, leading to highly variable clinical durability. Ultrahigh molecular weight polyethylene (UHMWPE), although relatively stable, has shown poor outcomes when press-fitted in knee replacement arthroplasties [25]. The poor fixation of such devices may relate both to intrinsic properties of the polymers involved as well as to differences in their elastic moduli from that of bone. For instance, the Young's modulus of UHMWPE is approximately 2% of that of cortical bone (0.3 GPa vs. 17 GPa). This leads to a quite different loading pattern for both the polymer and the surrounding tissue than that encountered in the case of c.p. titanium, which is approximately 7 times as stiff as cortical bone (127 GPa vs. 17 GPa).
Ceramics are still stiffer, with moduli up to 30 times that of cortical bone. Bulk ceramics, such as aluminum oxide (alumina) are well tolerated by bone but are generally insufficiently strong and tough to serve as load bearing implants, especially in the presence of tensile or bending loads. Calcium phosphates, such as calcium hydroxyapatite (CaHAP), although much weaker still, are an interesting class of biomaterials due to their assumed capability for 'bone bonding'. S!<1balle et al. [26] has observed that the addition of a CaHAP coating induces proliferating bone to bridge gaps in the bone-implant interface, in the presence of dynamic loading, which would be filled with soft tissue around uncoated metallic implants. He also suggests that such coatings enhance bone growth from osteopenic tissue, utilizing an experimental animal arthritis model with substantial pre-implantation loss of bone density.
In experimental studies, c.p. titanium has been demonstrated to induce a stronger bone response than most other pure metals or alloys, including

HOW BONE-BIOMA TERIAL INTERFACES FAIL I I 507 L-____________________________________________________ ~
Ti6Al4V [4, 27]. However, there is substantial evidence that CaHAP leads to a still more rapid healing response [28]. This may be due to a direct positive influence on interfacial bone from the calcium phosphate material and/or a relatively rough surface topography resulting from the manufacturing process in combination with the reduction of metal ion release by the presence of the CaHAP coating. Long term experimental and dental clinical data from CaHAP coated implants has been disappointing [29]. However, CaHAP remains a very interesting biomaterial with efforts underway to explore functional improvement through changes in crystallinity, coating thickness, method of application, etc.
Retrieval data [30-32] have contributed to our current knowledge of oral implants. Steflik and co-workers [32] reviewed 51 retrieved oral implants of different designs. They claimed that implants inserted 10 years ago or more fail generally due to loss of bone support and other biological features while more recently placed oral implants also fail secondary to intrinsic biomaterial failure such as implant fracture. One hundred stable (uncoated) Bn'memark System® 'Nobelpharma' implants were retrieved and studied at our laboratories: 33% were removed because of therapy-resistant pain or progressive bone resorption, 26% were removed after death from unrelated causes, 24% were fractured implants and 17% were removed for psychological reasons. The implants had been in situ and functioning for 1-18 years. There was on average 82% bone-toimplant contact and a similar percentage of bone within the threads of these retrieved implants (evaluated over the three best consecutive threads on both sides of the implant). Whenever possible, the entire bone to implant contact percentages were also calculated and found to be - 70%. In almost every case, there was >60% bone to implant contact. In fact, such extensive bone to implant contact percentages may represent a histological correlate to osseointegration.
3.5 HOW BONE-BIOMATERIAL INTERFACES FAIL
The implant-bone interface can fail for various reasons but the most common is so-called 'aseptic loosening': i.e. loosening not associated with infection. The causative factors for aseptic loosening may be classified as mechanical or biological. For example, early post-operative failures of cemented, cement-free (ingrown) as well as osseointegrated implants may be attributed to lack of initial fixation due to mechanical failure of the bone-cement (when present) or bone-implant interface. Such failures may relate to incidents of overload. However, early failures may also occur subsequent to overheating of the tissues during surgery, leading to bony necrosis, collapse and subsequent mechanical loosening. Overheating due to a combination of surgical trauma and polymerization heat release may

HARD TISSUE RESPONSE 508 I I ~----------------------------------------------------~
occur at bone-cement interfaces; surgical trauma, with associated heating, alone may prevent bone and other tissue elements from invading cement-free implant-bone interfaces, whether designed for ingrowth or osseointegration. Biological failure is also possible in the longer term, associated with generation or release of cytotoxic products, such as cement monomer or metallic corrosion products or through induction of specific immune responses [33] (Figure 3.3).
In clinical use, cylindrical shaped oral implants which lack any additional retention features, such as threads, grooves, etc., are prone to gradual failure due to ongoing bone 'saucerization' (gradual loss of bone at the implant-bone-mucosal boundary) [21]. In the case of orthopaedic implants with medullary structural elements (such as a femoral stem), Willert and Semlitsch were first to propose that bone loss occurred secondary to biological response to small particles, such as wear debris. [34] Macrophages (MP) and foreign body giant cells (GC) ingest these undigestible particles of metal, polymer or ceramic and release factors which stimulate osteolytic activity by cells in membranes associated with the implant-bone interface (Figure 3.3) [35]. With modern histological staining techniques, especially the use of oil red 0 [33], it has now become possible to appreciate the large amounts of small and submicron UHMWPE particles found in the vicinity of loose orthopaedic joint replacement implants. Many investigators believe that biological response to these particles is the leading biological cause of osteolysis leading to gradual, late implant failure.
3.6 CONCLUSIONS
The major advantage of the osseointegrated interface is its remodelling capacity. Gradual adaptation to load has been verified in retrieval studies; the implants are known to have almost no bone to implant contact during the first few weeks after placement but then demonstrate an increasing amount of interfacial bone tissue. The main proportion of osseointegrated implant failures occur during the first one or two years and result from failure to achieve a proper osseointegration. This trend is quite different from most orthopaedic studies reported in the literature, which show clinical failure rates increasing with time. Cemented arthroplasties of today have resulted in a significantly better clinical outcome than cement-free ones. It must be pointed out that the results of orthopaedic implants published in the literature are generally based on the number of revisions alone. This means that the actual number of successful arthroplasties is lower than the figures quoted in the literature. Furthermore, there is a patient drop-out of more than 20% in most clinical reports. From a biological viewpoint it is important to strive for improved cement-free implants

ME
TA
L
:': .'.
:.;-,
}i~
:i:;.~;.~:
ti?
c.} ••
BO
NE
oc
D ••• O
IIII
IIO
ill
... [
C'"
m
....
...
.......... ].
[
pH
. 1
o .. ,
-t
., •••
'.tI
Ilea
't t
ILl t
"'Ii,.,
"01."
Fig
ure
3.3
The
oret
ical
fai
lure
mod
es f
or a
n os
seoi
nteg
rate
d ca
lciu
m h
ydro
xyap
atit
e-co
ated
fem
oral
ste
m o
f a
tota
l hi
p re
plac
emen
t pr
osth
esis
[29
; by
per
mis
sion
]. K
ey:
GC
: m
ulti
nucl
eate
d gi
ant
cell;
MP:
mac
roph
age;
Ca:
cal
cium
; Ph
: ph
osph
orou
s; O
AF
: os
teo
clas
tic
acti
vati
ng f
acto
r; I
Ll:
inte
rleu
kin
1, T
NF
: tu
mor
nec
rosi
s fa
ctor
; P
GE
2: pr
osta
glan
din
E2.

510 II L _______________ H __ A_R_D_T_I_S_SU __ E_R_E_S_P_O_N_S_E ______________ ~
so that their clinical results will at least match those of the cemented arthroplasties. New types of osseointegrated hip and knee constructions have been designed and are presently in clinical trials. Altering prosthetic design (in comparison with current practice), and improving surgical instruments and procedures may well overcome some of the hurdles in the development of new osseointegrated arthroplasty devices.
ADDITIONAL READING
Lee, A.J.C. and Ling, RS.M. (1984): Loosening, in Complications of Total Hip replacement, (ed. RS.M. Ling), Churchill-Livingstone, Edinburgh, pp. 110-145.
Still useful account of the biological and mechanical features of loosening leading to clinical failure of the various interfaces formed between rigid biomaterials and bone. Extensive bibliography.
Manley, M.T. (1993): Calcium phosphate biomaterials: A review of the literature, in Hydroxylapatite Coatings in Orthopaedic Surgery, (eds G.T.R Geesink and M.T. Manley), Raven Press, New York, pp. 1-24.
The title speaks for itself. Additional chapters in the same book provide experimental and clinical results of osseointegration, specifically adhesion fixation.
Spector, M. (1987): Historical review of porous-coated implants. J. Arthroplasty, 2(2),163-177,1987.
Historical review of experimental and clinical results of ingrowth fixation, with extensive bibliography.
REFERENCES
1. Frost, H.M. (1989) The biology of fracture healing. Clinical Orthopaedics and Related Research, 248, 283-293.
2. Morberg, P. (1991) On bone tissue reactions to acrylic cement. PhD Dissertation, Biomaterials Group, University of Gothenberg, Sweden, pp. 1-142.
3. Donath, K., Laass, M. and Giinzl, H.-J. (1992) The histopathology of different foreign body reactions in oral soft tissue and bone tissue. Virchows Archiv A Pathologia Anatomica, 420, 131-137.
4. Johansson, C. (1991) On tissue reactions to metal implants. PhD Dissertation, BiomaterialslHandicap Research, University of Goteborg, Goteborg, Sweden, pp.I-232.
5. Black, J. (1988) Orthopaedic Biomaterials in Research and Practice. New York, Churchill Livingstone, pp. 267-284.
6. Steinemann, S.G., Eulenberger, J., Maeusli, P.-A. et al. (1986) Adhesion of bone to titanium. Adv. in Biomaterials 6, 40-44.
7. Ryd, L. (1986) Micromotion in knee arthroplasty. A Roentgen stereophotogrammetric analysis of tibial component fixation. Acta Orthop. Scand., Supp!. 220, 1-80.
8. Malchau, H., Herberts, P. and Anhfelt, L. (1993) Prognosis of total hip replacement in Sweden. Follow-up of 92,675 operations performed in 1978-1990, Acta Orthop Scand., 64, 497-506.

L-___________________ R_E_F_E_R_E_N_C_E_S __________________ ~I I 511
9. Collier, J.P., Mayor, M.B., Chae, J.e. et al. (1988) Macroscopic and microscopic evidence of prosthetic fixation with porous coated materials. Clin. Orthop. Rei. Res., 235, 173-180.
10. Willems, W.J., Eulderbrink, F., Rozing, P.M. et al. (1988) Histopathologic evaluation in failed Gerard double cup arthroplasty. Clin. Orthop. Rei. Res., 228, 123-133.
11. Engh, e.A, Bobyn, J.D. and Glassman, AH. (1987) Porous coated hip replacement. The factors governing bone ingrowth, stress shielding and clinical results. J. Bone Joint Surg., 698, 45-55.
12. Cook, S.D., Thomas, AK. and Haddad, R.J. (1988) Histologic analysis of retrieved human porous coated joint components. Clin. Orthop. ReI. Res., 234, 90-101.
13. Branemark, P.-I., Hansson, B.-O., Adell, R. et al. (1977) Osseointegrated implants in the treatment of the edentulous jaw. Scand. J. Plastic Reconst. Surg., Suppl 16, 1-116.
14. Albrektsson, T. (1979) Healing of bone grafts. In vivo studies of tissue reactions at autografting of bone in the rabbit tibia. PhD Dissertation, Laboratory for Experimental Biology, Goteborg University, Goteborg, Sweden, pp. 1-90.
15. Pilliar, R.M. (1986) Implant stabilization by tissue ingrowth. In Tissue Integration in Oral and Maxillofacial Reconstruction, D. van Steenberghe (ed.), Amsterdam, Excerpta Medica, pp. 60-76.
16. Wennerberg, A (1995) On surface topography of implants. PhD Dissertation, Biomaterials/Handicap Research, University of Goteborg, Goteborg, Sweden, pp.1-202.
17. Branemark, P.-I. (1985) Introduction to osseointegration, in Tissue Integrated Prostheses (eds P.-I. Branemark, G. Zarb and T. Albrektsson), Quintessence Co, Chicago, pp. 11-76.
18. Zarb, G. and Albrektsson, T. (1991) Osseointegration - A requiem for the periodontal ligament? - An editorial. Int. J. Periodontal and Restorative Dent., 11, 88-91.
19. Albrektsson, T., Dahl, E., Enbom, L. et al. (1988) Osseointegrated oral implants. A Swedish multicenter study of 8139 consecutively inserted Nobelpharma implants. J. Periodont., 59, 287-296.
20. Lekholm, U., vanSteenberghe, D., Herrmann, I. et al. (1994) Osseointegrated implants in partially edentulous jaws: A prospective 5-year multicenter study. Inter. J. Oral & Maxillofacial Implants, 9, 627-635.
21. Albrektsson, T. (1993) On the long-term maintenance of the osseointegrated response. Australian Prosthodontic J., 7, 15-24.
22. Tjellstrom, A and Granstrom, G. (1994) Long-term follow-up with the bone anchored hearing aid: A review of the first 100 patients between 1977 and 1985. Ear Nose and Throat J., 2: 138-140.
23. Jacobsson, M., Tjellstrom, A, Fine, L., et al. (1992) A retrospective study of osseointegrated skin-penetrating titanium fixtures used for retaining facial prostheses. Int. J. Oral & Maxillofacial Implants, 7, 523-528.
24. Pass, R., Robertson, D.D., Walker, P.S. et al. (1988) Anatomic stem design for press-fit and cemented application. In Non-cemented Total Hip Arthroplasty, R. Fitzgerald, Jr (ed.), New York, Raven Press, pp. 343-363.

512 I I~ ______________ H __ A_R_D_T_I_S_SU_E __ R_E_S_P_O_N_S_E ______________ ~ 25. Freeman, M.A.R, McLoed, H.c. and Levai, J.P. (1983) Cementless fixation
of prosthetic components in total arthroplasty of the knee and hip. Clin. Orthop. ReI. Res., 176, 88-94.
26. S¢balle, K. (1993) Hydroxyapatite ceramic coating for bone implant fixation. Acta Orthop. Scand. (Suppl 225), 64, 1-58.
27. Han, C.H., Johansson, c., Wennerberg, A. et al. (1995) A quantitative comparison of commercially pure titanium and titanium-6 aluminum-4 vanadium implants in rabbit bone. Proc. Fifth Biomaterials Club Meeting, Ischgl, Austria, Albrektsson T. and Tjellstrom, A. (eds), p. 25.
28. S¢balle, K., Hansen, E.S., Rasmussen, H.B. et al. (1993) The effect of osteoporosis, bone deficiency, bone grafting, and micromotion on fixation of porous coated vs. hydroxyapatite-coated implants. In Hydroxyapatite Coatings in Orthopedic Surgery, Geesink, RG.T. and Manley, M.T. (eds), New York, Raven Press, pp. 107-136.
29. Gottlander, M. (1994) On hard tissue reactions to hydroxyapatite-coated titanium implants. PhD Dissertation, Biomaterials/Handicap Research, University of Goteborg, Goteborg, Sweden, pp. 1-202.
30. Lemons, J.E. (1991) Bone-biomaterial interfaces in retrieved implants, in The Bone Biomaterial Interface (ed. J.E. Davies), University of Toronto Press, Toronto, pp. 419-424.
31. Albrektsson, T., Eriksson, A.R, Friberg, B., et al. (1993) Histologic investigations on 33 retrieved Nobelpharma implants. Clinical Materials 12 (1), 1-9.
32. Stefiik, D.E., Parr, G.R, Singh, B.B. et al. (1994) Light microscopic and scanning electron microscopic analyses of dental implants retrieved from humans. 1. Oral Implantol., 20(1), 8-24.
33. Campbell, P. (1995) On aseptic loosening of total hip replacements: The role of UHMWPE wear particles. PhD Dissertation, Biomaterials/Handicap Research, Goteborg University, Goteborg, Sweden, pp. 1-225.
34. Willert, H., Semlitsch, M. (1976) Reactions of the articular capsule to joint prostheses. In Biocompatibility of Implant Materials, D.F. Williams (ed.), London, Sector Publishing, pp. 157-169.
35. Goldring, S.R, Schiller, A.L., Roelke, M., et al. (1983) The synovial-like membrane at the bone-cement interface in loose total hip replacements and its proposed role in bone lysis. J. Bone Joint Surg., 65A, 575-584.

~ ____ I_m_m __ u_n_e_r_e_sp __ o_n_se ____ ~1 ~ K. Merritt
4.1 INTRODUCTION
There is increasing concern about the role of specific immune response to implanted materials. This section discusses the general principles governing immune responses and outlines techniques for their measurement and evaluation. This is a necessarily brief presentation of the issues, and the reader is encouraged to pursue the topic through relevant references provided for further study.
4.2 OVERVIEW OF THE SPECIFIC IMMUNE RESPONSE
The specific immune response is the normal response of vertebrates when a foreign substance is introduced into the body. This is a desirable protective response which detoxifies, neutralizes, and helps to eliminate such substances.
However, in some cases, responses to seemingly innocuous substances may cause harm to the host. Such effects are usually termed allergic or hypersensitivity responses. The responses have been classified into four types: Type I, Type II, Type III, Type IV.
These four responses share elements of a common mechanism, triggered by the presence of a foreign material termed an antigen. The antigen is initially processed by a cell, usually either a monocyte or macrophage, but occasionally a skin dendritic cell also referred to as an antigen processing cell (APC). The APe engulfs the antigen, processes it (usually by enzymatic digestion or attempted digestion), and transfers or presents
Handbook of Biomaterial Properties. Edited by J. Black and G. Hastings. Published in 1998 by Chapman & Hall, London. ISBN 0412603306.

IMMUNE RESPONSE
it to another cell, usually a Lymphocyte termed a T helper ceLL. The T helper cell then presents the processed antigen to another T lymphocyte, called the T cytotoxic ceLL, or to a B lymphocyte. The receiving cell, whether T- or B-type, initiates a response for interaction with the processed antigen, forming a less biologically active complex. In the former case, the immune response is a Type IV or cell mediated immunity while in the latter case, the final result is release of free antibody, which may lead to a humoral Type I, II, or III response. T-cell responses result in accumulation of T-cells at the site where the foreign material is present. B-cells remain at remote depots of lymphoid tissue while the antibody circulates and appears at the site of the foreign material.
The main features of the four types of responses are described in the following table:
Type: Antibody: Cells involved: Mediator: Consequences:
I IgE B-Iymphocytes Histamine, vasoactive Itching, rhinitis, amines vascular collapse
II IgG,lgM B-Iymphocytes Histamine, vasoactive Vascular collapse amines
III IgG,lgM Bclymphocytes Vasoactive amines Pain, swelling, some vascular plugging and collapse
IV none T -lymphocytes Cytokines Pain, swelling
Both the T- and B-cells are small lymphocytes, which circulate in the blood, and are found in lymphoid tissue. They arise from a common stem cell and then undergo processing in the thymus to become T-cells or an unknown site, probably the bone marrow, to become B-cells. They are difficult to distinguish and a great deal of work has been done to facilitate identification of these cells in order to elucidate specific immune responses. Identification ofT-cells has been greatly aided by the recognition that there are unique substances on the cell surface that can be recognized by the use of monoclonal antibodies generated using murine cells. These antigens are referred to as cluster differentiation markers (CDs) and are given numbers. There are a large number of them, more are being identified, and the importance of each is being evaluated. However, all T-cells express CD3 which is consequently referred to as a Pan (= all) T-cell marker. CD2 may also be a Pan T-cell marker. Additionally, the T helper cell expresses CD4 while the T cytotoxic cell expresses CD8. New CDs continue to be identified and their importance evaluated.
The B-cell retains small amounts of antibody on its surface which can be used for identification. The B-cell response results in further differentiation to plasma cells which produce antibody in large quantities. Antibody is a four chain immunoglobulin which has combining sites specific for a single antigen. Antibody is soluble, circulates in the plasma,
L-______________ D_E_T_E_CT __ IO_N __ O_F_A_N __ T_IB_O_D_Y ______________ ~I I 515
and the plasma or serum drawn from a vertebrate, or the antibody produced in cell culture for monoclonal antibodies, can be stored frozen and will last virtually forever.
There are five general classes of immunoglobulins produced as antibodies. In order of concentration in normal human blood from highest to lowest are IgG, IgM, IgA, IgE, and IgD. IgD is a surface marker on Bcells and will not be discussed further. IgE is the antibody associated with Type I responses. IgA is a secretory immunoglobulin, found in high concentrations in saliva, GI contents, and milk and in the associated organs. IgG and IgM are present in high concentrations in blood and are excellent antibodies for immunological testing since they can participate in Type II and III responses.
Type I responses and Type II responses have the same consequences, but the mechanisms are different. Type I responses are best known as hay fever and dust allergies and are immune responses to these antigens mediated by a skin fixing antibody (lgE).
Type II responses involve the reaction of IgG, rarely IgM, antibody with a cell surface antigen. The result is lysis of the cell with release of products. If the cell contains vasoactive amines, then the consequences are signs and symptoms described here. This is commonly seen in allergies to drugs which bind to blood platelets.
Type III responses are referred to as immune complex reactions and occur when both antigen and antibody are present in large quantities at the same time. In the normal immune response, the antigen is processed, the immune response is initiated, and the antigen disappears shortly. However, if the antigen is persistent, then significant amounts of immune complexes can form, plug small vessels, and result in tissue or organ damage.
Type IV responses are those most usually associated with chronic presence of a foreign body, such as an implanted biomaterial. They are typified by the common contact dermatitis caused by poison ivy.
In each case, an antigen stimulates the immune response and the immune response in turn reacts specifically with the antigen. T-cells, Bcells and circulating antibody each recognize only one antigen. For a substance to be antigenic, it must be foreign to the host, of high molecular weight (> 3000), and processable by an APe. However, some small substances become antigenic by binding to larger carrier molecules, usually proteins, found in the host. Such a small substance is called a hapten and the immune response is mounted to the hapten-carrier complex.
4.3 DETECTION OF ANTIBODY
To evaluate whether or not a patient has produced antibody against a substance, such as an implant, a blood sample needs to be drawn, tested
IMMUNE RESPONSE 516 I I L-____________________________________________________
and the results compared to those from controls. A pre-implantation sample is an ideal control but usually this is not available. The choice of appropriate controls is a major problem. The test procedure itself requires a known positive control (often difficult to obtain for evaluating responses to biomaterials), and a known negative control (usually saline, tissue culture media, or bovine or equine serum used for tissue culture). The controls for the patient popUlation under study are generally obtained from normal individuals without implants and without underlying disease, individuals with the disease (e.g. arthritis) but without the implant (e.g. total joint replacement), individuals with the implant and without problems, and individuals with diagnosed implant failure. The results for all of these need to be analyzed in order to ascertain whether or not antibody is increased in the patient population and whether or not its presence can be correlated with failure of the device.
Most current tests are based on immobilization of the antigen to a solid surface such as polystyrene. The general procedure is outlined in Figure 4.1. Detection of bound antibody involves the use of enzyme (EIA or ELISA assays) or a radioisotope labeled antibody (RIA). (The tests are simple to perform, but great care is needed to wash away excess materials and use the appropriate concentrations. Individuals wishing to initiate such testing procedures are encouraged to attend workshops (often offered by American Society for Microbiology, American Type Culture Collection, etc.) or obtain training in a clinical immunology lab, and also explore detailed manuals on procedures.) Antiserum to human antibodies, (all classes or individual types) with enzyme labels, can be purchased from several biological supply houses. Isotope labeled antibody is available to licensed laboratories.
--==-==-- Support = =--=-=--Figure 4.1 Standard immunoassay for antibody. An antigen is fixed (attached) to a solid support and binds a specific antibody from solution. The bound antibody is detected by binding a second, labeled (enzyme, isotope, etc.) antibody.

'----__ D_E_T_E_C_T_I_O_N_O_F_C_E_L_L_M_E_D_IA_T_E_D_R_E_S_P_O_N_S_E_S _CT_y_P_E_IV_)_-------'1 I 517
Problems with interpretation of results:
Positive results
If negative controls are negative and patient samples are positive, then the interpretation is that the patient made antibody to that antigen. However, the question remains as to whether or not the antigen is the correct one and if contaminating antigens are contributing to the reaction. This is difficult to determine but inhibition studies with well characterized antigens are helpful.
In vivo testing
Type I sensitivity is associated with histamine and vasoactive amine release with vascular responses. Often such sensitivity is determined by 'patch' (skin) testing. The positive reaction will occur in a few minutes as a wheal and erythematous (reddening) flare response in the skin. This test is hampered by availability of antigen for testing but the biomaterial applied directly to skin or a mucosal surface may stimulate a response. Caution needs to be taken in interpreting these tests, however, since this is a short term application.
Negative results
Negative results are the desired response in evaluating biomaterials for clinical use, but they are also difficult to evaluate. If there are no responses recorded except in the positive control sample, this is indicative that patient does not produce antibody to that antigen. Again the question of appropriateness of the antigen and its concentration on the solid support remains.
In vivo testing
A negative skin test presents the same problem: Was the antigen correct and/or was it applied to a correct site?
4.4 DETECTION OF CELL MEDIATED RESPONSES (TYPE IV)
The procedures for detecting cell mediated responses are much more complicated and difficult than for antibody determination. Most of the assays require the use of living cells and thus tests must be done shortly after obtaining the cells. Controls may have to be done at a different time which complicates the comparisons.

518 I Ll __________________ I_M_M_U_N __ E_RE __ S_P_O_N_S_E __________________ ~
The two most common in vitro test procedures used are lymphocyte proliferation and cell migration inhibition tests. The basic theory behind both of these is that T-cells have receptors on their surface which will each respond to a specific antigen. In the course of the response, soluble substances (cytokines or lymphokines), principally blastogenic factor and migration inhibition factor, which act on other cells, including other Tcells, are produced and released.
Blastogenic factor (lymphocyte transformation factor)
This causes other lymphocytes to transform and divide. If cell counts are done, an increased number is seen. If a radioactive cell proliferation precursor (such as tritiated thymidine) is added to the culture, the isotope is taken up by dividing cells and the 'counts' increase. This test, usually called L TT for lymphocyte transformation test, requires living cells to produce and respond to the factor. This takes several days, with 7 days being the general time for response to antigen. Some control stimulants (mitrogens) such as PHA (phytohemagglutinin) act in 4---5 days. Interpretation of the tests presents the same problems as with tests for antibody: Are the appropriate controls included, what was the antigen used, were the cells viable; if the results are negative, were the culture conditions correct?
Migration inhibition factor
Migration inhibition factor (MIF) is produced by the stimulated T-cell and acts on cells that are normally motile. The two cell types are the monocyte/macrophage line and polymorphonuclear leukocytes (polys). Thus the test, usually called LIF test (leukocyte inhibition test) requires living lymphocytes and living migrating cells which may be obtained from fresh, whole blood. The results of the LIF test are available in 18-24 hours. Blood does not contain enough monocytes to evaluate inhibition of their migration and this indicator cell is usually obtained from the peritoneal cavity of other animals, typically the mouse or the guinea pig. It is possible to stimulate human lymphocytes in culture for 24-48 hours and then harvest the culture fluid and add it to the macrophages obtained from the animals. Migration (or inhibition of migration) of cells is observed by placing them into tissue culture medium solidified with purified agarose and observing them with a microscope in 18-24 hours or by packing them into capillary tubes and observing migration from the tubes in a few hours giving the appearance of 'ice cream cones'. The factor for LIF and the one for MIF may be slightly different and thus the two separate terms remain.
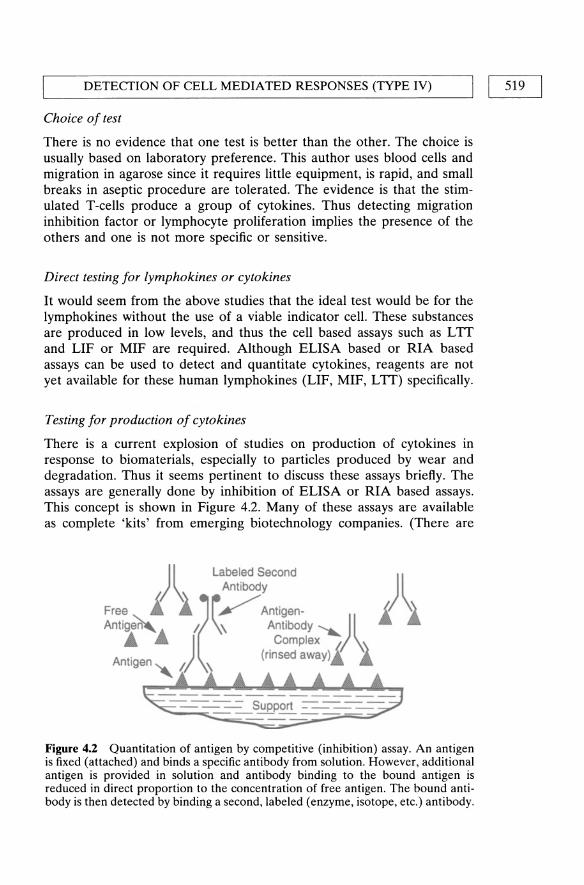
'-----__ D_ E_ T_E_CT_I_O_N_O_F_C_E_L_L_M_E_D_IA_T_E_D_R_E_S_P_O_N_S_E_S_(T_y_P_E_IV_) __ --'1 I 519
Choice of test
There is no evidence that one test is better than the other. The choice is usually based on laboratory preference. This author uses blood cells and migration in agarose since it requires little equipment, is rapid, and small breaks in aseptic procedure are tolerated. The evidence is that the stimulated T-cells produce a group of cytokines. Thus detecting migration inhibition factor or lymphocyte proliferation implies the presence of the others and one is not more specific or sensitive.
Direct testing for lymphokines or cytokines
It would seem from the above studies that the ideal test would be for the lymphokines without the use of a viable indicator cell. These substances are produced in low levels, and thus the cell based assays such as LIT and LIF or MIF are required. Although ELISA based or RIA based assays can be used to detect and quantitate cytokines, reagents are not yet available for these human lymphokines (LIF, MIF, LIT) specifically.
Testing for production of cytokines
There is a current explosion of studies on production of cytokines in response to biomaterials, especially to particles produced by wear and degradation. Thus it seems pertinent to discuss these assays briefly. The assays are generally done by inhibition of ELISA or RIA based assays. This concept is shown in Figure 4.2. Many of these assays are available as complete 'kits' from emerging biotechnology companies. (There are
)1 Labeled Second \ Antibody )1
Free i 1 (~ / Antigen· i 1 Antig~... I. \\ AntibOdY,,) 1
.& _ ) Complex \ A t· (rinsed away) (I \\
n Igen '" I. :\ A A
~~=t~~=~~ Figure 4.2 Quantitation of antigen by competitive (inhibition) assay. An antigen is fixed (attached) and binds a specific antibody from solution. However, additional antigen is provided in solution and antibody binding to the bound antigen is reduced in direct proportion to the concentration of free antigen. The bound antibody is then detected by binding a second, labeled (enzyme, isotope, etc.) antibody.

520 I LI __________________ I_M_M_U_N __ E_R_E_S_P_O_N_S_E __________________ ~
many companies, each doing only a few of the cytokines; thus no specific reference will be given. A glance at the methods section in an article reporting on assays will give their source. In addition, a glance at a biotechnology based journal and Science will give ads, or an immunologist's mail box will give you a plethora of choices). These tests are easy to perform, but have technical difficulties and must be done carefully. Interpretation of the results involves being sure that the control studies were done successfully. Again, as with most studies, a positive test can be evaluated but a negative test is difficult to interpret until you are confident of the laboratory doing the testing.
In vivo studies
The classical test for cell-mediated immunity (eMI) (Type IV) in the early days of immunology was the skin test. Antigens were applied to the skin or injected under the skin and swelling was observed in 24--72 hours if there was eMI. This was differentiated from Type I, IgE mediated responses, which occur rapidly (in minutes) and usually disappears in 24 hours. eMI begins in 24 hours, has a swelling with some resemblance to the wheal but does not show a flare. This author does not advocate skin testing for responses to biomaterials since the testing is difficult to do correctly, has the potential for producing sensitivity to the test agents and the results are easily misinterpreted. In general, the use of the actual biomaterial (rather than extracts, corrosion products or constituents) is contraindicated since mechanical irritation may be read as a false positive or or the biomaterial may fail to release the antigen and thus produce a false negative.
Skin testing is an excellent diagnostic procedure in patients with clinical suspicion of hypersensitivity. However, skin testing with haptens, such as metal ions, involves a risk of sensitization. For the immune response to be detected, the hapten must bind to dermal cells or proteins. However, such binding produces a complete antigen which may stimulate an immune response. Since this immune response takes time to develop, the skin test will be negative, but future tests may then be positive. Thus repeated testing increases the likelihood of inducing sensitivity and should be avoided. Bulk biomaterials will probably not give adequate release of soluble materials in the 24--48 period of testing so may produce false negative results.
Histochemical techniques
There are a number of studies now examining tissues removed from sites adjacent to implants. It is possible, using immunological techniques resembling those outlined in Figure 4.1, to identify cell types and perhaps cell products produced at the site. The major interest is in the detection and
HUMAN IMMUNE RESPONSE TO MATERIALS
typing of lymphocytes by use of antisera prepared against the CD markers described earlier. The same type of assay is being initiated for detection of the cytokines in the tissue. The techniques are simple but not all antisera work and thus a variety of antisera are used. The required antisera are available commercially.
Interpretation of the results is again a problem. Tests using 'home made' monoclonal antibodies are suspect until the antisera is made available to other investigators for conformation. The use of well characterized antisera from companies which supply to others is better at this stage. Since the tissue section is examined and scored by an observer, the 'data' from these studies are not really available for analysis by the reader. Computerized image analysis techniques are still not widely used. Thus, in evaluating the results, possible bias of the investigator must be taken into account.
4.5 DETECTION OF IMMUNE RESPONSES TO HAPTENS
Detection of immune responses to haptens is the same as that described above, but there are some special techniques now being used. A hapten-carrier complex can be prepared in vitro by combination in solution with a large protein such as albumin or a smaller molecule such as glutathione. These can then be used to coat a solid substrate. Alternatively, the protein carrier can be coated onto a substrate, the hapten added, and then the assay performed. This probably increases the amount of hapten that is available for antibody binding and minimizes that which is lost in the tertiary folding of the protein.
4.6 HUMAN IMMUNE RESPONSE TO MATERIALS
4.6.1 Latex
The term 'latex' actually is confusing since the name is given to some materials because of the way they are processed and not because of their source. The biomaterial latex used to fabricate gloves, condoms, etc. is a rubber (elastomer) extracted from a plant (Hevea brasiliensis). As such, there is a great deal of antigenic protein contamination. Allergies to latex are usually of the Type I, IgE mediated response, with an immediate reaction (in minutes) that can be life threatening. Since latex is encountered in many household objects such as household gloves, balloons, etc., sensitivity to it is a frequent pre-existing condition. Latex material cleaned of protein seems to be nonallergenic. Other types of immune response to latex have not been as frequent or of much concern. Latex is not used as a long term implanted material and thus the long term responses are
[52TJ

522 I LI _________________ I_M_M __ U_N_E_R_E_S_P_O_N_S_E ________________ ~
not noted. The population at greatest risk are the health care workers with the increased use of examining and surgical gloves.
4.6.2 Collagen
This is another material that is an extract of material of natural origin with bovine and orvine skin or tissue the favored source. This is a foreign protein and thus capable of stimulating a variety of immune responses. Antibodies of IgE, IgM, and IgG classes have been observed. Cell mediated immune responses have also been observed. As with latex, the important precaution is to remove as much foreign material as possible. Since collagen across mammalian species has a similar structure, it is possible to remove contaminating proteins and leave a relatively non allergenic material. Chemical treatment and cross linking of the collagen can further reduce antigenicity. Collagen products need to be carefully evaluated for their ability to initiate immune responses, but it is possible to produce safe products.
4.6.3 Synthetic polymers
The use of chemically defined synthetic polymers is associated with minimal human immune responses. These materials are based on carbon, hydrogen, nitrogen and oxygen which are basic building blocks of the biological system. Thus the generation of antigenic material would be unlikely. Nevertheless, there are some polymeric materials with additional chemical moieties that are of concern.
A. Polysiloxane (silicone elastomer)
There is abundant lay press comment and little scientific material on this topic. It is apparent that there can be binding of silicone to foreign protein with stimulation of the immune response. The use of a simple hapten test, as described in section 4.5, has added greatly to our knowledge of this. It is also apparent that silicone gel is a potent adjuvant enhancing immune responses to unrelated materials. Whether this is of relevance to the use of gel filled implants remains unknown. The possible stimulation of related and unrelated immune responses remain a major concern in the use of these materials.
B. Polyurethanes
This is a complex group of polymers. Their propensity to stimulate an immune response is very small since there are few molecular groups which would be perceived as foreign by the host, perhaps explaining why clinical immune responses to polyurethanes have not been reported.
CONSEQUENCES OF AN IMMUNE RESPONSE I I 523 L-____________________________________________________ ~
C. Poly(methyl)methacrylate
Acrylics are in widespread use in activities of daily living. As with metals, there are documented cases of contact dermatitis from the use of these materials, especially self curing glues containing methacrylate monomer that is very skin sensitizing, usually stimulating a Type IV response. The use of these materials for implants generally exposes the patient to the monomer for only a brief period of time as the bone cement or dental acrylic cures in situ. Acrylics which are fully polymerized before use will not be associated with an allergic response. Reports of sensitization responses of patients to acrylics are rare and the health care workers at most risk are the personnel, such as the surgeon and dental laboratory technician, handling the monomer frequently.
D. Metals
A number of metallic elements and alloys are used extensively in implants, external medical devices and are encountered in activities of daily living. Allergy to metals as a contact dermatitis (Type IV response) is well known in individuals in contact with metal salts, corroding metals, and jewelry or snaps and fasteners. Reactions have been seen to metals used in dental, orthopaedic, and general surgery. The contact dermatitis from topical use resolves when the device is removed. The role of the immune response in reactions to metals implanted into the deep tissue remains controversial. Cell mediated immune responses have been associated, in some studies but not in others, with pain and swelling at the implant site and loosening of the device. Antibodies to metals in patients with metallic implants have recently been reported, but again the consequences of this response remain unknown. Concern remains about the chronic use of metals that are known human sensitizers, such as chromium, nickel and cobalt.
4.7 CONSEQUENCES OF AN IMMUNE RESPONSE
The immune response is apparently intended to neutralize, detoxify, and help eliminate a foreign material. However, sometimes the immune response can inadvertently cause harm. This will be discussed in various categories in the next section.
1. Damage to the implant. The inflammation which is part of the initiation of the immune response is an oxidative response. Materials subject to oxidative attack, such as polyethylenes and polyurethanes, may be degraded.

524 I ~I _________________ I_M_M_U __ N_E_R_E_S_P_O_N_S_E ________________ ~
2. Damage to adjacent tissues. Products, particularly from Type II and IV responses, may initiate swelling and other vascular responses at the site. This may resolve with no further harm, or it may cause tissue necrosis and/or loss of tissue mass with loosening or movement of the device.
3. Systemic responses. Immune responses of Type I and II generate vasoactive substances which may circulate and cause vascular collapse. This is seen in response to latex materials and drugs which bind to platelets, mast cells, or eosinophils, resulting in an immune response and release of these vasoactive substances.
4. Autoimmune diseases: This is the most controversial area of consequences of immune response to implants. Autoimmune diseases are technically the result of an immune response to host tissue. Autoimmune diseases such as arthritis, glomerulonephritis, etc., occur in individuals with an unknown cause of onset although some have an association with a preceding infection (especially streptococci). Proving cause and effect is an epidemiological problem with surveys of large populations. It is important to refine our immunological testing techniques to prove cause and effect associated with implants and do thorough epidemiological studies.
These responses, if present in clinical popUlations, may arise from several mechanisms. The two most likely ones associated with the use of implants are (i) binding of the material to host tissue making it a foreign substance such as with hapten-carrier complexes or (ii) altering the host tissue through folding of proteins, degradation of cells or proteins thus making then antigenic for the host. This is the main issue now with the silicone breast implants. This is difficult to prove and massive studies as controlled as possible are needed.
4.8 CONCLUSIONS
There has been a rapid growth in our knowledge of the immune response and how to evaluate and quantitate it. As these techniques are applied to the population in contact with biomaterials, we will learn more about its importance in performance of the material. We will also learn more about how to process the materials to minimize the immune response. However, it is important to remember that the immune response is a protective response and detection of immune responses to products of biomaterials does not necessarily indicate clinical problems. On the other hand, implants are foreign material and will stimulate host responses, some of which may cause harm to the host or implant.
Thus the important issue is to distinguish between those immune responses which are normal and help to render antigens less biologically

L-_______________ A __ D_D_I_T_IO_N_A __ L_R_E_A_D __ IN_G ________________ ~J I 525
active from those which are harmful to the host. It is clear that IgE (Type I) responses are harmful. Detection of a Type I response to products of biomaterials indicates potential problems in the clinical setting. Responses of the IgG type are generally protective and may not be predictive of further problems unless there is continual release of antigenic material leading to a Type III-response. Biomaterial wear and degradation products that bind to platelets or mast cells pose a potential for adverse Type II responses.
The most commonly observed is the Type IV (cell-mediated) response. This is a protective response in walling off the stimulating agent and in killing cells which have the antigen on the surface, thus eliminating the antigen. However, the tissue reaction accompanying this response may cause harm to the host through soft and hard tissue necrosis. The difference between protection and allergy from Type IV responses is still unclear and careful evaluation of patients is required.
ADDITIONAL READING
General Immunology Golub, E.S. and Green, D.R (1990) Immunology, A Synthesis, 2nd Edition,
Sinauer Associates, Inc., Sunderland: Good general text. Roitt, I. (1971) Essential Immunology, Blackwell Scientific Publications, London:
Good description of types I-IV reactions. Annual Review of Immunology, Annual Reviews Inc., Palo Alto, CA: Yearly publi
cation with timely reviews. Immunology Today: Elsevier Science Inc. Tarrytown, NY: Monthly: Good review
articles.
Antigen Presentation Celada, A. and Nathan, C. (1994) Macrophage activation revisited. Immunology
Today, 15, 100-102: good review of macrophages. Chicz, RM. and Urban, R.G. (1994). Analysis of MHC presented peptides: appli
cations in autoimmunity and vaccine development. Immunology Today, 15, 155-160: good review on a complicated subject.
CD markers Kemeny, D.M., Noble, A. Holmes, B.J. et al. (1994) Immune regulation: a new
role for the CD8+ T cell. Immunology Today, 15, 107-110: Good description of the function of the CD8+ T-cell which is a key cell in Type IV responses.
Sclossman, S.F., Boumsell, L., Gilkes, L.W. et at. (1994) CD antigens 1993. Immunology Today, 15, 98-99: good description of recently reported CDs.
Cytokineslinterleukins Miyajima, A., Kitamura, T., Harada, N. et al. (1992) Cytokine receptors and Signal
Transduction. Annual Reviews of Immunology, 10, 295-331: Review of function and methods of stimulation.
Mizel, S.B. (1989) The interleukins. FASEB 1.3,2379-2388: good detailed review.

526 I LI _________________ I_M_M __ U_N_E_R_E_S_P_O_N_S_E ________________ ~
Effects of cytokines/interleukins Goldring, M.B., and Goldring, S.R. (1990) Skeletal tissue response to cytokines.
c/in. Orthop. ReI. Res., 258, 245-278: review of cytokines and orthopaedics. Stashenko, P., Obernesser, M.S., and Dewhirst, F.E. (1989) Effect of immune
cytokines on bone. Immuno Invest., 18, 239-249: one of the few reviews focussing on bone.
Immune response to metals/metallic implants Agrup, G. (1968) Sensitization induced by patch testing, Brit. J. Derm., 80, 631-634:
points out problem of routine skin testing in non allergic individual. Benson, M.K.D., Goodwin, P.G. and Brostoff, J. (1975) Metal sensitivity in
patients with joint replacement arthroplasties, Brit. Med. J., 4, 374-375: third of the original 1975 articles pointing to a possible problem. Skin test used.
Black J. (1988) Does corrosion matter? J. Bone Jt. Surg., 70B (4), 517-520: discusses issues of importance of understanding corrosion, minimizing it, and recognizing it can be important for the patient.
Brown, G.c., Lockshin, M.D., Salvati, E.A et al., (1977) Sensitivity to metal as a possible cause of sterile loosening after cobalt-chromium total hip-replacement arthroplasty, J. Bone Joint Surg., 59A(2), 164-168: Denies existence of metal allergy in orthopaedics. Complete misinterpretation of data. Uses negative results of an invalid test to draw conclusions. Limited patient population deliberately selected to prove lack of allergy.
Burholm, A; AI-Tawil, N.A; Marcusson, J.A et al. (1990): The lymphocyte response to nickel salt in patients with orthopedic implants. Acta Orthop. Scand., 61(2): 248-250: Example of use of LTT test.
Elves, M.W., Wilson, J.N. and Kemp, H.B.S. (1975) Incidence of metal sensitivity in patients with total joint replacements. Brit. Med. J., 4, 376-378: Second one of the original 1975 articles pointing to a possible problem. Skin test used.
Evans, E.M., Freeman, M.AR., Miller, AJ. et al. (1974) Metal Sensitivity as a Cause of Bone Necrosis and Loosening of the Prosthesis in Total Joint Replacement, J. Bone and Joint Surg., 56B (4), 626-642: One of the original articles pointing to a possible problem. Skin test used.
Goh, c.L. (1986) Prevalence of contact allergy by sex, race, and age. Contact Dermat., 14, 237-240: discusses normal population
Grimsdottir, M.R., Gjerdet, N.R. and Hensten-Pettersen, A (1992) Composition and in vitro corrosion of orthodontic appliances. Am. J. Orthod. Dentofac. Orthop., 101, 525-532: Discusses sensitivity and stainless steels. Release of nickel related to many metallurgical aspects and not necessarily to nickel content of the metal.
Lalor, P.A, Revell, P.A, Gray, AB. et al. (1991) Sensitivity to titanium. J. Bone and Joint Surg., 73B(1), 25-28: Description of possible titanium sensitivity. Patch test vehicle of unknown composition, larger cobalt-chromium component than titanium component in device. Of interest and important, but not conclusive.
Menne, T.; and Maibach, H.1. (1989) Systemic contact allergy reactions. Immunol Allergy c/in. N.A., 9, 507-522: Discusses extension from contact dermatitis to systemic reactions.

L-_______________ A __ D_D_I_T_IO_N_A __ L_R_E_A_D __ IN_G ________________ ~I I 527
Merritt, K. (1984) Role of medical materials, both in implant and surface applications, in immune response and in resistance to infection. Biomaterials, 5 (1), 47-53.: Review article. Out of date now but covers literature through 1983.
Merritt, K. (1986) Biochemistry/hypersensitivity/clinical reactions. in: Lang B, Morris, J. and Rassoog, J. (eds). Proc. International Workshop on Biocompatibility, Toxicity, and Hypersensitivity to Alloy Systems used in Dentistry. Ann Arbor, U. MI; pp 195-223.: Review article. Covers the literature through 1984. Good discussion of the problem in the discussion section of the symposium.
Merritt, K. (1986) Chapter 6. Immunological testing of biomaterials, Techniques of Biocompatibility Testing, D.F. Williams (ed.), Vol. II, CRC Press, Boca Raton: Description of possible test methods.
Merritt, K.; and Brown, S.A. (1980): Tissue reaction and metal sensitivity: An animal study. Acta Orthop. Scand. 51 (3), 403-411: Example of use of LIF test.
Rostoker, G., Robin, J., Binet, O. et a!. (1987) Dermatitis due to orthopaedic implants. l. Bone Joint Surg., 69A, 1408--1412: Example of a reaction to implant.
Rudner, E.J., Clendenning, W.E., Epstein, E. et al. (1975) The frequency of contact dermatitis in North America 1972-1974. Contact Derm. 1, 277-280: Incidence of contact dermatitis.
Shirakawa, T., Kusaka, Y. and Morimoto, K. (1992) Specific IgE antibodies to nickel in workers with known reactivity to cobalt. Clin. Exp. Allergy, 22 (2), 213-218: Measuring IgE and nickel cobalt interactions.
Trobelli, L., Virgili, A., Corassa, M. et a!. (1992) Systemic contact dermatitis from an orthodontic appliance. Contact Dermatitis, 27, 259-260: Example of reaction to dental application of metals.
Yang, J., and Merritt, K. (1994) Detection of antibodies against corrosion products in patients after Co-Cr total joint replacements. l. Biomed. Mater. Res., 28, 1249-1258: Method for measuring antibodies to metals
Immune response to latex, collagen, silicones Belsito, D.V. (1990) Contact urticaria caused by rubber. Analysis of seven cases.
Dermato!' Clin. 8, 61-66: Questions whether increased demand for latex may have decreased quality with more allergens leachable.
Hanke, C.W., Higley, H.R, Jolivette, D.M. et a!. (1991) Abscess formation and local necrosis after treatment with Zyderm or Zyplast collagen implant. l. Amer. Acad. Dermato!' 25, 319-326: Deals with some adverse responses to collagen materials which may be related to the immune response. Points to possible problems.
Meade, K.R, Silver, F.H. (1990) Immunogenicity of collagenous implants. Biomaterials, 11,176-180: Discusses immunogenicity problem and cross linking. Good place to begin reading.
Nairn, J.O., Lanzafame, RJ. and van Oss, c.J. (1993). The adjuvant effect of silicone gel on antibody formation in rats. Immunol Inv., 22, 151-161: Shows that the gel is better than Freund's adjuvant in stimulating the response to BSA in rats. Caution on use of gel.
Slater, J.E. (1989) Rubber anaphylaxis. New Eng. 1. Med. 320, 1126-1130: Good methods. Good literature review, real cases reacting to anaesthesia mask.

IMMUNE RESPONSE 528 I I L-__________________________________________________________ ~
Sussman, G.L., Tarlo, S. and Dolovich, J. (1991). The spectrum of IgE responses to latex. J. Am. Med. Assoc. 265, 2844-2847: Latex gloves on health workers causing allergic responses in patients. Can do skin test with latex to check patients or use non-latex gloves.
Warpinski, J.R, Folgert, J., Cohen, M. et al. (1991) RK. Bush. Allergic reaction to latex: a risk factor for unsuspected anaphylaxis. Allergy Proc. 12, 95-102: Clinical symptoms of Type I allergy. Identifies IgE antibodies against latex (gloves, balloons, condoms). IgE against proteins from latex.
Wolk, L.E., Lappe, M., Peterson, RD. et al. (1993) Immune response to polydimethylsiloxane (silicone): screening studies in a breast implant population. FASEB J., 7, 1265-1268: Very important study with a good technique. Hopefully more studies will be done with this technique. Valid test of antibody to silicone.
Oxidative damage of implants Carter, W.O., Narayanan, P.K. and Robinson, J.P. (1994). Intracellular hydrogen
peroxide and superoxide anion detection in endothelial cells. J. Leukocyte BioI. 55, 253-258: Good method for detecting H20 2 release and superoxide production. Example of biologically produced oxidizing species.
Kao, W.J., Zhao, Q.H., Hiltner, A. et al. (1994) Theoretical analysis of in vivo macrophage adhesion and foreign body giant cell formation on polymethylsiloxane, low density polyethylene, and polyetherurethanes. J. Biomed. Mater. Res., 28 (1), 73-80: Recent article on macrophages on polymers and references some articles on oxidative events.
Kaplan, S.S., Basford, RE., Jeong, M.H. et al. (1994) Mechanisms of biomaterialinduced superoxide release by neutrophils. J. Biomed. Mater. Res., 28, 377-86: Discusses the release of reactive oxygen species stimulated by biomaterials. Not all materials are activating.
Consequences of immune responses to materials Angell, M. (1994) Do Breast implants cause systemic disease? Science in the court
room New Eng. J. Med., 330 (24), 1748-1749: Editorial in response to article by Gabriel et al. (1994) Reiterates the necessity of doing detailed studies. Indictment of patients, manufacturers and government jumping to conclusions using inadequate data. Doesn't say how we get the adequate data though.
Gabriel, S.E., O'Fallon, W.M., Kurland, L.T. et al. (1994) Risk of connective tissue diseases and other disorders after breast implantation. New Eng. J. Med., 330 (24),1697-1702: Excellent study. Shows problems of doing studies on long term consequences. Example of how it ought to be done.

~ ________ c_a_n_c_e_r ________ ~1 ~ M. Rock
5.1 INTRODUCTION
The widespread use of temporary and permanent implants in the post World War II era has had a dramatic impact on the practice of medicine and on the life of disabled and ill individuals. Nowhere has this been more obvious than in the frequent use of implants to stabilize fractures and replace diseased joints which has revolutionized orthopedic practice and afforded millions of patients levels of function that previously could not be achieved. Although the metal alloys used in these implants exhibit excellent resistance to corrosion, oxidation of these large components ultimately produce free ions, chlorides, oxides, and hydroxides which, in combination with particulate metal matter released by wear and fretting, are released into the surrounding environment. Efforts to improve these alloys have included compositional as well as processing changes. Additionally, modifications have been made to the plastic articulating components in efforts to produce a much more consistent ultrahigh molecular weight polyethylene. The perceived need to improve implant wear and corrosion resistance and alter design has been largely motivated by the excessive soft tissue staining noted by orthopedic surgeons at the time of removal or revision of clinically failed joint arthroplasty. The presence of particulate metal matter, polyethylene, and even fragments of polymethyl methacrylate in local tissue has been confirmed histologically and by direct analysis [1-4]. In spite of all of the modifications made in implant composition, implant fixation, and articulation, biomaterial degradation and release of these products persist [4-7].
Handbook of Biomaterial Properties. Edited by 1. Black and G. Hastings. Published in 1998 by Chapman & Hall, London. ISBN 0412603306.

530 I ~I _________________ C_A_NC_E_R ________________ ~
5.2 RELEASE AND DISTRIBUTION OF DEGRADATION PRODUCTS
The body's response to the local presence of debris is dependent on the size, amount, and composition as well as rate of accumulation. The body attempts to neutralize these foreign particles by precipitating granulomatous foreign body reactions and/or removal through local lymphatic channels. If the local accumulation of debris exceeds the body's ability to neutralize and/or transport, the debris migrates from the site to remote areas including the bone-implant interface, possibly contributing to if not initiating the phenomena of loosening and osteolysis (Figure 5.1).
Of equal or possibly even greater concern is the detection of metal ions, metallic debris, polyethylene, and even methylmethacrylate in areas remote from the implant including circulating serum, excreted urine, and regional draining lymph nodes. Elevated serum levels of metal ions consistent with the composition of the implanted alloy have been confirmed in animal models [8] and in human patients after total hip arthroplasty [9]; identifying serum levels of cobalt, chromium, nickel, and titanium that are two and three fold higher than preoperative determinations. These figures represent significant elevations both over means for contemporary control groups and for the individual patients before operation [9]. However, since they are within the widely accepted normal range for these metallic ions in the unimplanted human controls, it is assumed that toxic levels of these foreign materials do not materialize. However, when analyzing the serum to urine concentration in patients subjected to conventional total hip arthroplasty, it has become apparent that the urinary concentration of chromium in particular does not rise with the same magnitude and time course as the serum level [9]. This observation parallels that made in the accounts of industrial overexposure to Cr6+ and suggests that metal ions accumulate in organs and tissues remote from implantation. Such accumulation is unlike that resulting from normal
Stress/fatigue -- Corrosion , Soluble products
Wear S Debris Fretting / '"
Small amount Large amount
+ + Neutralized Interaction/m igration
~I \ Metallosis Allergic Pseudotumor Malignancy
Hypersensitivity
Figure 5.1 Tissue Reaction to Implant Degradation Products.
L-___________________ N_E_O_P_L_A_S_I_A ____________________ ~I I 531
systemic circulation. This was previously suggested by Steineman [10] who calculated the potential release of metallic ions of 0.15 to 0.3 micrograms per cm2 per day which would translate to between 11 and 22 milligrams per year in patients with total hip replacement. This incidentally coincides with or exceeds the total body burden of such metallic ions in a 70 kilogram man [11].
Evidence for metallic debris accumulating in distant organs has also been confirmed by Langkamer et al. [12] who identified wide spread dissemination of particulate wear debris from hip prosthesis to lymph nodes, liver, and spleen. He reported increases above normal levels in these organs of 30 fold for aluminum, chromium, and iron in the lymph node, and 10 fold in the spleen and liver.
These findings suggest that concentrations of metal ions and debris at remote sites may reach such proportions as to precipitate altered cellular dynamics in organs principally of the lymphoreticular system. It would only be logical to assume that local concentrations of such debris at the site of implantation would be even higher, although attempts at quantifying the effects of local concentrations have been fraught with inaccuracies mostly due to sampling error and the need to distinguish between bioavailable and non bioavailable metal species.
What is potentially more disturbing is that these figures for serum concentrations and the identification of this debris in remote organs have come primarily from patients who have received conventional polymethyl methacrylate cemented components. With the advent of using uncemented porous coated implants, particularly in younger patients, these figures would be expected to increase, creating the distinct possibility of toxic levels in the serum, tissues and organs that will respond with altered cellular dynamics and function.
5.3 NEOPLASIA
Perhaps one of the greatest concerns with debris dissemination locally and within the systemic circulation is the possibility of inducing malignant neoplasia. This is thought to be possible by one of two mechanisms:
(i) A 'solid-state' mechanism has been proposed, whereby a large foreign object implanted in vivo possibly stimulates mutagenesis of local cells, thereby creating tumor by its mere presence. Most large foreign objects upon implantation will initiate a very marked fibrous reaction. The cells within this fibrous reaction ultimately mutate and become cancer growths.
(ii) The other possibility is that particulate metal matter or other debris have an innate capacity, upon corrosion or dissolution, to induce cancer through a more traditional chemical route.

CANCER
Cancer, the end product of carcinogenesis, is the result of transformation of a normal cells to ones which grow in an uncontrolled or malignant manner. Cancer is a genetic disease, which may result from expression of genetic pre-dispositions present from birth or from later insults to cells of many different types. In particular, the phagocytosis or pinocytosis of foreign matter (in an attempt to neutralize or eliminate it) may cause or precipitate malignant conversion. Such conversion, if not lethal to the cell, may then persist through cell duplication, creating first a cluster of cells with altered DNA and eventually a clinical malignant tumor. Malignancy is characterized by rapid, uncontrolled growth, invasion in surrounding tissues and seeding to form tumors (metastases) in other anatomical locations such as the lung.
Some of the more common malignant tumors of musculoskeletal origin are osteosarcoma (OS) of bone and malignant fibrous histiocytoma (MFA) of soft tissue.
Osteosarcoma is the most common tumor of bone: it occurs in children, adolescents and, less frequently, in adults. OS may also occur as a consequence of radiation therapy or in Paget's disease, an ostensibly benign bone embrittling disease of the elderly. It frequently appears about the knee (distal femur; proximal tibia), and in the proximal femur and proximal humerus.
MFA is the most common primary malignant tumor of soft tissues and can occur in bone in adults over the ages of 50-55. The more common soft tissue type usually involves the large muscular areas of the body, including the thigh, buttock and upper arm and shoulder.
5.4 EVIDENCE FOR CARCINOGENICITY OF IMPLANTED MATERIALS
Well-documented cases of carcinoma and sarcoma have developed in refinery workers who inhaled nickel and chromium and in miners who were exposed to iron or even at local injection sites of iron dextran [13]. Aluminum has been linked to a high rate of lung and bladder cancer in exposed individuals and titanium has been associated with experimental induction of lymphoreticular tumors and leukemia. Although the results have not been universally accepted, many animal experiments have shown a direct correlation between the initiation of sarcomas and the injection of particulate metal debris. This appears to be related to the concentration, as well as the physical nature, of the metal implanted [14]. Metal ions, particularly cobalt, chromium, and nickel, are known to induce infidelity of DNA synthesis by causing the pairing of non-complimentary nucleotides and thereby creating a misinterpretation of the genetic code which may lead to neoplasia.

L-______ C_A_S_E __ R_E_P_O_R_T_S_O_F __ IM __ PL_A __ N_T_R_E_L_A_T_E_D __ T_U_M __ O_R_S ______ ~i I 533
Furthermore, it must be remembered that particulate metal matter may not be the only solid-form material that can be, and has been proven to be, carcinogenic in appropriate environments. In 1954 long before the first total hip arthroplasty was performed, Laskin [15] observed the carcinogenic capabilities of polymethylmethacrylate after subcutaneous introduction of this material in mice. His conclusions suggested that similar occurrences of tumor may appears in humans that were being treated at that time with methylmethacrylate for dental deficiencies and that this evolution of cancer may take up to 20 years of exposure given the proportional time exposure before tumors were seen in the mice. A similar conclusion was reached [16] on the use of polyethylene plastic before it was conventionally used in the management of arthritic joints. Regardless of form, whether powder or large solid segments, polyethylene plastic produced sarcomas in 25 percent and 35 percent of rats, respectively. Their conclusions also suggested a latent period, after exposure, of 20 years in humans before such an event could be expected to occur.
It is, therefore, with interest that investigators were forewarning the medical community of the carcinogenic effect of metals and polymers years before the development and introduction of joint replacement using these very same materials. In 1961, Sir John Charnley introduced total hip arthroplasty as an alternative in the management of arthritic hips. No other orthopedic procedure has been adopted with such enthusiasm. Thirty-five years later we are still witnessing an incremental increase in the yearly utilization of this operation, attesting to the obvious success associated with it. According to some investigators, we may be coming into an era of increased tumor activity in the vicinity of or possibly remote from implantation sites of these orthopedic appliances.
5.5 CASE REPORTS OF IMPLANT RELATED TUMORS
In 1976, Harris et at. [17] were the first to describe an aggressive granulomatous lesion around a cemented femoral stem in a total hip replacement. This was a condition of localized tumor-like bone resorption that appeared radiographically as large lytic defects within the femur, approximating the cement mantle of the implant. Initially thought to be neoplastic, these lesions were surgically biopsied and found to be consistent with well-organized connective tissue containing numerous histiocytes, monocytes, and fibroblastic reactive zones. Immunohistologic evaluation revealed multinucleated giant cells and nonspecific esterasepositive monocyte macrophages. These findings suggest a foreign-body type reaction, and with the subsequent isolation of polyethylene, polymethyl methacrylate, and metal debris, it was theorized that these constituents of the construct likely migrated down around the implant
534 I I~ _________________ C_A_N_C_E_R ________________ ~ cement mantle in cemented prostheses and implant-bone interface in non-circumferentially coated ingrowth implants. Such a reaction suggests an excessive accumulation of debris at the site of articulation that surpasses the body's ability to neutralize and/or transport the material resulting in migration of debris to sites remote from the source. This rapid appearance of bone loss radiographically which is often associated with a deteriorating clinical course has been termed type-II aseptic loosening [17].
In 1978, two years after the recognition of pseudo tumors of bone induced by the degradation products of total hip arthroplasty, Arden and Bywaters [20] (Table 5.1) reported a case of a 56-year-old patient who developed a high-grade fibrosarcoma of soft tissue 2.5 years after receiving a metal-on-metal McKee-Farrar hip prosthesis. The tumor apparently did not have a direct association with the underlying bone or any components of the total hip arthroplasty. No formal analysis of the tumor for debris
Table 5.1 Malignancies Associated with Joint Replacements (published)
Time interval
Author Year Implant (yrs) Tumor type
Castleman and 1965 Austin-Moore 1 M.F.H.* McNeely [18]
Rushforth [19] 1974 McKee-Farrar 0.5 Osteosarcoma Arden and 1978 McKee-Farrar 2.5 Fibrosarcoma
Bywaters [20] Bag6-Granell et al. [21] 1984 Charnley-Muller 2 M.F.H. Penman and Ring [22] 1984 Ring 5 Osteosarcoma Swann [23] 1984 McKee-Farrar 4 M.F.H. Weber [26] 1986 Cemented TKA 4.5 Epithelioid sarcoma Ryu et at. [27] 1987 Uncemented Vitallium** 1.4 M.F.H. Vives et at. [28] Van der List [29] Lamovec et at. [30] Lamovec et at. [31] Tait et al. [32] Martin et at. [33] Haag and Adler [34] Mazabraud et al. [35]
Brien et al. [36] Troop et al. [37] Kolstad and
Hogstorp [38]
1987 Charnley-Muller 1988 Charnley-Muller 1988 Charnley-Muller 1988 Charnley-Muller 1988 Charnley-Muller 1988 Charnley-Muller 1989 Weber-Huggler 1989 unknown
1990 Charnley 1990 Charnley-Muller 1990 Freeman TKA
Jacobs et al. [39] 1992 Solomon and Sekel [40] 1992
AML cementless Charnley-M uller
* M.F.H. = malignant fibrous histiocytoma. ** Trademark, Howmedica, Inc. (Cobalt-Chromium alloy).
2 M.F.H. 11 Angiosarcoma 11 Synovial sarcoma 10 Osteosarcoma 11 M.F.H. 10 Osteosarcoma 10 M.F.H. 9 Epidermoid
sarcoma 8 Osteosarcoma
15 M.F.H. 0.25 Metastatic
adenocarcinoma 0.5 M.F.H.
7 M.F.H.

'-___ C_A_S_E_RE_P_O_R_T_S_O_F_IMP __ LANT __ RE_L_A_TE_D_TU_M_O_R_s ___ ---'I 1 535
products was performed. This case drew attention to the possibility of tumors being initiated in the presence of large orthopedic appliances. It was not until 1984 when this concept became fashionable in large part due to three articles that appeared simultaneously in the Journal of Bone and Joint Surgery recounting two malignant fibrous histiocytomas and one osteosarcoma at the site of a total hip arthroplasty [21-23].
This sudden and rather unexpected evolution prompted editorials [24, 25] in the same journal addressing the issue of sarcoma and total hip arthroplasty and encouraged the orthopedic community worldwide to report such cases to a central registry to obtain more accurate figures on the incidence of such a problem. These tumors occurred 2, 4, and 5 years after hip replacement that was performed with various femoral and acetabular components, some with metal-on-metal articulations and others with metal on polyethylene. In two of these cases, the proximal femur was extensively involved With tumor that was in direct contact with the component. The remaining case was a soft-tissue sarcoma not in direct approximation to the prosthesis. Two of these tumors were malignant fibrous histiocytomas, one of bone and one of soft tissue. The remaining tumor was osteosarcoma .. In this particular case, there was evidence of gray-brown pigmentation both intra- and extracellularly between the tumor and femoral component. No formal metal analysis was performed. Three additional cases emerged prior to 1988 at 15 months, 4.5 years, and 2.0 years after implantation [26-28].
In 1988, five cases were reported occurring at 10 [29, 30] and 11[29, 31, 32] years after implantation. The sarcomas included two osteosarcomas, two malignant fibrous histiocytomas, and one synovial sarcoma. Two of these were soft tissue in a location with no direct association with the implant, yet in the case reported by Tait et al. [32] there was evidence of nickel within tumor cells. The remaining three patients all had direct contact with either the cement or implant with the tumor originating in bone.
In 1990 there were three additional reports in the literature which included an osteosarcoma developing at the site of a Charnley total hip arthroplasty 8 years [36] after implantation, malignant fibrous histiocytoma developing 15 years after a Charnley-Muller total hip arthroplasty [37], and metastatic adenocarcinoma developing at the site of a Freeman total knee arthroplasty three months after implantation [38]. In 1992, Jacobs et al. [39] presented a malignant fibrous histiocytoma developing one half year after implantation of a cementless AML total hip arthroplasty.
In that same journal volume, unpublished but submitted reports of five tumors occurring around implants were brought to the attention of the orthopedic community [41] (Table 5.2). These included malignant fibrous histiocytomas around a Thompson and a Muller total hip arthroplasties,

536 I I~ ________________ C_A_N_C_E_R ________________ ~ an osteosarcoma around a Charnley total hip arthroplasty, a rhabdomyosarcoma of soft tissue in the vicinity of a Christiansen total hip arthroplasty, and a chondrosarcoma developing in a patient with Maffucci syndrome having a Charnley total hip arthroplasty. The intervals from implantation to tumor detection were 9, 3, 10, 9 and 1 years respectively. To this, we add two previously unreported additional patients, neither of whom had their joint replacement done at the Mayo Clinic (Table 5.2). The first is that of a 79-year-old man who nine months previously came to total hip replacement with an uncemented Harris-Galante component who was found to have a large malignant fibrous histiocytoma engulfing the proximal femur and extending to the implant. There was, however, no evidence of any particulate debris within the tumor cells removed. The second case was that of a 56-year-old man who developed a soft tissue osteosarcoma 14 months after a left total knee arthroplasty with conventional cemented components. The tumor extended down to both the femoral and patellar components.
5.6 CRITICAL ANALYSIS OF TUMORS
As such, 28 tumors have been reported in direct contact or in close proximity to joint arthroplasty. The vast majority of these appeared with total hip arthroplasty [27] with a smaller contribution from total knee arthroplasty [3]. There have been no reported cases of malignant degeneration occurring in the vicinity of total shoulder and/or total elbow arthroplasty. Of the reported 26 cases, 8 tumors were of soft tissue origin, 19 were of primary bone pathology, and 1 metastatic gastric carcinoma. The histogenesis of the soft tissue tumor included 3 malignant fibrous histiocytomas, 1 synovial sarcoma, 1 soft tissue osteogenic sarcoma, 1 fibrosarcoma, 1 epidermoid sarcoma and 1 rhabdomyosarcoma. The histogenesis of the primary bone tumors included 10 malignant fibrous histiocytomas,
Table 5.2 Malignancies Associated with Joint Replacements (unpublished)[41]
Time
Author
Harris Surin Lightowler Rees, Thompson, Burns Nelson Rock Rock
Year
1992 1992 1992 1992 1992 1992 1992
Implant
Charnley Christiansen Charnley Thompson Muller HG ingrowth PCA TKA
* M.F.H. = Malignant Fibrous Histiocytoma.
interval (yrs)
1 9
10 3 9
0.8 1.2
Tumor type
Chondrosarcoma Rhabdomyosarcoma Osteosarcoma M.F.H.* M.F.H. M.F.H. Osteosarcoma

~ ___________ C_R_I_T_IC_A __ L_A_N_A_L_Y_S_I_S_O_F_T_U_M __ O_R_S ____________ ~I I 537
6 osteosarcomas, 1 chondrosarcoma, 1 angiosarcoma, 1 fibrosarcoma. Direct contact with the underlying tumor was noted in 15 of the 19 cases in which sufficient information is known from which to make such determinations. In three of the cases, particulate metal matter was determined to be present in the tumor including one case of a soft tissue sarcoma that appeared on image and exploration to be remote from the implant but had obvious evidence of nickel present within the tumor cells.
Many of these tumors have not had an appropriate latent interval between implantation and development to be seriously considered implant induced. Given that the interval to tumor induction from bone stimulation should be at least as long as the accepted five year interval from radiation therapy to sarcoma degeneration, 15 of the 28 patients would qualify, all of whom have had tumours around total hip arthroplasties.
Apart from tumors developing at the site of prosthetic replacement, there have been ten known malignant tumors that have developed at the site of previous internal fixation (Table 5.3). To date there have been no malignancies noted around a titanium implant. The vast majority (> 80%) of malignancies both in the prosthetic and internal fixation groups have occurred in the vicinity of Vitallium™ (cobalt-chromium alloy) implants. This is not, however, to exonerate stainless steel because tumors in the proximity of the implants made of this alloy have been reported in the animal literature [52] as well as the human experience utilizing stainless steel as fixation devices for traumatology [42, 44, 50, 51]. It is interesting to note that in 1976 veterinarians were encouraged within their own literature to report similar experiences of tumors around implants nearly eight years before such concern was voiced with the application of these same metallic alloys in humans [52].
Table 5.3 Malignancies Associated with Internal Fixation of Fractures
Time interval
Author Year Implant (yrs) Tumor type
McDougall [42] 1956 Stainless steel 30 Ewings Delgado [43] 1958 Unknown 3 Undifferentiated Dube and Fisher [44] 1972 Stainless steel 36 Angiosarcoma Tayton [45] 1980 Vitallium* 7.5 Ewings McDonald [46] 1981 Vitallium 17 Lymphoma Dodion et al. [47] 1982 Vitallium 1.2 Lymphoma Lee et al. [48] 1984 Vitallium 14 M.F.H.* Hughes et al. [49] 1987 Vitallium 29 M.F.H. Ward et al. [50] 1990 Stainless steel 9 Osteosarcoma Khurana et al. [51] 1991 Stainless steel 13 M.F.H.
* Trademark, Howmedica, Inc. (cobalt-chromium alloy). ** M.F.H. = malignant fibrous histiocytoma.

538 I I~ ________________ C_A_N_C_E_R ________________ ~
5.7 SIGNIFICANCE OF CLINICAL REPORTS
As impressive as these cases may be, they must be put into perspective given the global use of internal fixation and prosthetic devices. Approximately 300000 to 350 000 total hip joint replacements are performed worldwide on a yearly basis [53]. It can be assumed that approximately four million people will have had total hip arthroplasties performed by the end of 1995. To date, there have been 28 reports of malignant tumor arising in close proximity to these implants (25 total hip and three total knee arthroplasties). No direct contact was noted in foUT. If we assume a minimal latency of five years to suggest association between presence of implant and tumor, 15 of the 28 could have association. As such, the incidence of sarcomas in total joint replacement would be approximately 1 in 250 000. There are approximately 3000 new primary bone tumors and 5000 soft-tissue sarcomas in the United States per year. This would give an incidence of approximately 1 in 100000 for the general population to develop a primary bone sarcoma and 1 in 40 000 to develop a soft tissue sarcoma a year. This is obviously not stratified for age given that many primary bone tumors develop in the second and third generation of life, yet it does afford the opportunity of putting this rather unusual event in perspective.
The prevalence of osteosarcoma among the osseous malignancies in this series is not entirely unexpected. Of the total osteosarcoma population 15 percent to 20 percent occur after the age of 50 years. Most of these cases are superimposed on Paget's disease or in previously irradiated tissue, yet de novo cases of osteosarcoma do occur in this age group. Malignant fibrous histiocytoma of bone is somewhat less common. A review of the Mayo Clinic files reveals 71 cases with more than half of these occurring after age 55. Malignant fibrous histiocytoma of soft tissue is the most common soft-tissue sarcoma. It is not surprising, therefore, that two of six soft-tissue tumors in the combined series are of this histogenesis. As such, the distribution of sarcomas in the combined series could have been predicted from general population data given the age of the patients and anatomical distribution.
There have been two separate reports that have critically analyzed the cancer risk after total hip arthroplast [54, 55]. The combined person years of exposure after operation between the two series was 20 015. The overall cancer incidence among total hip replacement procedure in both series did not appear to be any different than what was expected or anticipated. The cancer-observed/expected ratio was especially low for the first two years following surgery in both series, implying that patients undergoing this procedure are otherwise generally healthy. In both series, the observed/expected ratio of developing lymphoma or leukemia was two to three times higher in patients who had total hip arthroplasty. Additionally,

L-____________________ SU_M __ M_A_R_Y ____________________ ~I I 539
there was a two fold decrease in breast carcinoma among patients who had total hip arthroplasty.
Of interest, Gillespie et al. [54] suggested a similar decrease in the incidence of rectal, colon, and lung cancer among total hip arthroplasty patients. The results suggest or are possibly compatible with the hypothesis of chronic stimulation of the immune system, thereby potentially allowing for malignancies to occur within the lymphoreticular system. We have already determined a predilection for particulate metal matter to accumulate in the reticuloendothelial system [12]. This has been further supported by studies in animals sUbjected to metal implants, especially those containing nickel, in which there was an increase in malignancies of the lymphoretinacular systemic [52]. Additionally, due to the added immune surveillance, tumors of the breast, possibly colon, rectal, and lung may be decreased. A hyper immune state is not unexpected given the dissemination of debris locally at implantation sites as well as the wellrecognized and documented capacity of this material to gain access to the systemic and possibly storage sites including the reticuloendothelial system. This trend obviously needs continued surveillance.
A recent extensive analysis of the cancer risk in a cohort of 39 154 patients with at least one hip replacement operation has been performed by the Swedish Nationwide In-Patient Registry [56]. Patients were identified by means of a linkage to the Swedish Cancer Registry. The overall results, although showing a significant 3% increase in cancer, were judged by the authors not to be of clinical significance. Increases of cancer of kidney, skin and brain in women and of prostate in men were found, accompanied by a decrease in gastric cancer for women. The study showed no increase in lymphoreticular cancers as previously reported [54,55] nor a decrease in colon, breast or rectal cancers. The authors' judgement is that the overall cancer risk associated with total hip replacement arthoplasty is negligible and should not distract from the obvious benefits of the procedure.
A similar extensive review of the relationship between metallic implants and cancer in dogs was performed by Li et al. [57]. This case controlled study of 1857 dogs from 22 veterinary medical centers failed to reveal significant association between stainless steel fracture fixation devices and the development of bone and soft tissue sarcomas.
5.8 SUMMARY
In summary, careful examination of the scientific and clinical literature suggests that implant materials commonly used for fixation and joint reconstruction are not entirely inert. Accumulation of particulate debris is to some extent going to occur in all patients who have large prosthetic

540 I I'--________ C_A_NC_E_R ________ ---'
devices. This necessarily includes the distinct possibility of systemic and remote site exposure to these foreign objects that the body attempts to neutralize and excrete. Due to the heightened immunologic surveillance and/or possible storage of particulate metal matter in sites remote from the implantation site, patients with total hip arthroplasty may be at added risk for remote malignancies, particularly of the lymphoreticular system. The incidence of primary mesenchymal tumors in close proximity to implants appears to be consistent with the incidence in the general public. The frequency of occurrence and the associated individual and group risks of systemic and remote site malignancy remains unresolved.
ADDITIONAL READING
Nyren, 0., McLaughlin, 1.K. et al. (1995) Cancer risk after hip replacement with metal implants: A population based study. l. National Can. Inst. 87, 28-33.
An extensive review of risk of cancer in 39 154 total hip replacement patients who appeared in the Swedish National Cancer Registry between 1965 and 1983. A review of 60 cancer-specific sites showed an overall, not clinically significant increase of 3% in incidence, slight increases noted for kidney cancer, prostate cancer (in men) and melanoma accompanied by a continuous decline in gastric cancer for both sexes. This would appear to be the definitive review of the risk for developing cancers after total hip replacement arthroplasty.
Brand, K.G. and Brand, I. (1980) Risk assessment of carcinogenesis at implantation sites. Plastic Reconst. Surg. 66, 591-595.
Review of possible foreign body cancer initiation in humans based upon published case reports. The authors conclude that, since the clinical use of prosthetic implants has been popular for more than twenty years and since, extrapolating from animal experience, at least 25% if not 50% of foreign body tumors should have appeared by the time of their publication, there is little risk of such nonchemically mediated tumors occuring in patients.
Gillespie, W.J., Frampton, C.M.A., Henderson, R.J. et al. (1988) The incidence of cancer following total hip replacement. l. Bone loint Surg., 70B, 539-542.
A New Zealand study of 1358 patients with total hip arthroplasty, for a total of 14286 patient years. A significant increase in tumors of the hemopoetic and lymphatic systems, accompanied by a significant decrease of cancers of breast (in women), colon and bowel was observed. The authors suggest that these data are evidence for increased immune surveillance, allowing or precipitating hemopoetic and lymphatic tumors but at the same time providing better resistance to the development of soft tissue tumors. The first large scale study of this question.
Visuri, T. and Koskenvuo, M. (1991) Cancer risk after McKee-Farrar total hip replacement. Orthopedics, 14, 137-142.
A study similar to that of Gillespie et al. but on a Finnish patient group (433 patients; 5729 patient years) leading to the same general conclusions. Includes a historical discussion of the carcinogenic properties of various trace elements.

REFERENCES I I 541 L-____________________________________________________ ~
Jacobs, J.J., Rosenbaum, D.H., Hay, RM. et at. (1992): Early sarcomatous degeneration near a cementless hip replacement. A case report and review. J. Bone Joint Surg., 74B, 740-744.
A review of a patient who developed a malignant fibrous histiocytoma at the site of a cementless total hip replacement five months after implantation and succumbed of diffuse metastases, as is typical for such patients, within one year of presentation. Includes an extensive review of world literature on sarcomas in the vicinity of total hip replacement and suggest the need for an international registry of such case reports.
REFERENCES
1. Coleman, RR, Herrington, S. and Scales, J.T. (1973) Concentration of wear products in hair, blood, and urine after total hip arthroplasty. Brit. Med. J. 1 1527-1529.
2. Lux, F. and Zeisler, R. (1974) Investigations of the corrosive deposition of components of metal implants and of the behavior of biologic trace elements in metallosis tissue by means of instrumental, multi-element activation analysis. 1. Radial. Anal. Chem., 19,289-297.
3. Rock, M.G. and Hardie, R (1988): Analysis of local tissue response in 50 revision total hip arthroplasty patients. Trans. Soc. Biomater., XI, 43.
4. Agins, H.J., Alcock, N.W., Bansal, M. et al. (1988) Metallic wear in failed titanium alloy total hip replacements. A histological and quantitative analysis. 1. Bone Joint Surg. 70A, 347-356.
5. Buchert, B.K., Vaughn, B.K., Mallory, T.H. et al (1986): Excessive metal release due to loosening and spreading of sintered particles on porous coated hip prosthesis. Report of two cases. J. Bone Joint Surg., 68A, 606-609.
6. Jacobs, J.J., Skipor, A.K., Black, J. et al. (1991), Release in excretion of metal in patients who have a total hip replacement component made of titaniumbase alloy. J. Bone Joint Surg. 73A, 1475-1486.
7. Witt, J.D. and Swann, M. (1991) Metal wear and tissue response in failed titanium alloy total hip replacements. J. Bone Joint Surg. 73B, 559-563.
8. Woodman, J.L., Jacobs, J.J., Galante, J.O., et al. (1984), Metal ion release from titanium-based prosthetic segmental replacements of long bones in baboons. A long term study. J. Orthop. Res., 1, 421-430.
9. Bartolozzi, A and Black, J. (1985) Chromium concentrations in serum, blood clot and urine from patients following total hip arthroplasty. Biomaterials, 6, 2-8.
10. Steineman, S.G. (1985) Corrosion of Titanium and Titanium Alloys For Surgical Implant. in: Lutergering, G., Swicker, U., Bunk, W. (eds), Titanium, Science, and Technology, Volume 2, DG fUr Metal. e.V. Oberuresel, Berlin, 1373-1379.
11. Harvey, AM., Johns, RS., Owens, AH. et al. (1972) The Principles and Practice of Medicine. New York: McGraw-Hill, pp. 68-102.
12. Langkamer, V.G., Case, c.P., Heap, P. et al. (1992) Systemic distribution of wear debris after hip replacement. A cause for concern? J. Bone Joint Surg., 74B, 831-839.
542 I ~I _________________ C_A_N_C_E_R ________________ ~ 13. Doll, R (1958) Cancer of lung and the nose. Nickel workers. Brit. J. lndust.
Med., 15, 217-223. 14. Swanson, S.A.V., Freeman, M.A.R and Heath, J.e. (1973) Laboratory tests
on total joint replacement prosthesis. J. Bone Joint Surg., 55B, 759-773. 15. Laskin, D.M. (1954): Experimental production of sarcomas by methylacrylate
implant. Proc. Soc. Exper. BioI. Med., 87, 329-333. 16. Carter, RL. and Rowe, F.1.C. (1969): Induction of sarcomas in rats by solid
and fragmented polyethylene; Experimental observations and clinical implications. Brit. J. Cancer, 23, 401-407.
17. Harris, W.H., Schiller, A.L., Scholler, J.M. et at. (1976) Extensive localized bone resorption in the femur following total hip replacement. J. Bone Joint Surg. 58 A, 612-618.
18. Castleman, B., McNeely, B.U. (eds) (1965) Case 38-1965, Case records of the Massachusetts General Hospital. New Engl. 1. Med., 273, 494-504.
19. Rushforth, G.F. (1947) Osteosarcoma of the pelvis following radiotherapy for carcinoma of the cervix. Brit. J. Radial. 47, 149-152.
20. Arden, G.P. and Bywaters, E.G.L. (1978), in Surgical Management of Juvenile Chronic Poly Arthritis. Arden, G.P., Ansel, B.M. (eds), Academic Press, London, pp. 269-270.
21. Bago-Granell, J., Aguirre-Canyadell, M., Nardi, J. et al. (1984) Malignant fibrous histiocytoma of bone at the site of a total hip arthroplasty. A case report. J. Bone Joint Surg. 66B, 38-40.
22. Penman, H.G. and Ring, P.A. (1984) Osteosarcoma in association with total hip replacement. J. Bone Joint Surg. 66B,632-634.
23. Swann, M. (1984) Malignant soft tissue tumor at the site of a total hip replacement. J. Bone Joint Surg. 66B,269-231.
24. Hamblen, D.L. and Carter, RL. (1984) Sarcoma and Joint Replacement (Editorial). 1. Bone Joint Surg. 66B, 625-627.
25. Apley, A.G. (1989) Malignancy and joint replacement. The tip of an iceberg? (Editorial). J. Bone Joint Surg. 71B, 1.
26. Weber, P.e. (1986) Epithelioid sarcoma in association with total knee replacement. J. Bone Joint Surg. 68B, 824-826.
27. Ryu, RK.N., Bovill, E.G. Jr, Skinner, H.B. et al. (1987) Soft tissue sarcomas associated with aluminum oxide ceramic total hip arthroplasty. A case report. Clin. Orthop. 216,207-212.
28. Vives, P., Sevestre, H., Grodet, H. et at. (1987) Histiocytome fibreux malin du femur apres prostheses tot ale de hanche (Malignant fibrous histiocytoma of the femur following total hip replacement). Rev. Chir. Orthop. 73, 407-409.
29. Van der list, J.1.1. (1988) Malignant epithelioid hemangioendothelioma at the site of a hip prosthesis. Acta Orthop. Scand. 59,328-330.
30;31. Lamovec, J., Zidar, A., Cucek-Plenicar, M. et al. (1988): Synovial sarcoma associated with total hip replacement. A case report. Addendum: Osteosarcoma associated with a Charnley-Muller hip arthroplasty. J. Bone Joint Surg. 70A, 1558-1560.
32. Tait, N.P., Hacking, P.M. and Malcolm, A.1. (1988) Case report, malignant fibrous histiocytoma occurring at the site of a previous total hip replacement. Brit. 1. Radial., 61, 73-76.

~ ___________________ R_E_F_E_R_E_N_C_E_S __________________ ~I I 543
33. Martin, A., Bauer, T.W., Manley, M.T. et al. (1988) Osteosarcoma at the site of a total hip replacement. J. Bone Joint Surg. 70A, 1561-1567.
34. Haag, M. and Adler, c.P. (1989) Malignant fibrous histiocytoma in association with hip replacement. J. Bone Joint Surg. (Brit), 718, 70l.
35. Mazabraud, A., Florent, J. and Laurent, M. (1989) (A case of epidermoid carcinoma developed in contact with a hip prosthesis)(Fr.)(au. transl.). Bull. Cancer, 76, 573-581.
36. Brien, W.W., Salvati, E.A., Healey, J.H. et at. (1990) Osteogenic sarcoma arising in the area of a total hip replacement. A case report. J. Bone Joint Surg., 72A, 1097-1099.
37. Troop, J.K., Mallory, T.H., Fisher, D.A., et al. (1990) Malignant fibrous histiocytoma after total hip arthroplasty: A case report. Clin. Orthop. Rei. Res., 253, 297-300.
38. Kolstad, K. and Hogstorp, H. (1990): Gastric carcinoma metastasis to a knee with a newly inserted prosthesis: A case report. Acta Orthop. Scand. 61, 369-370.
39. Jacobs, J.1., Rosenbaum, D.H., Hay, RM. et at. (1992): Early sarcomatous degeneration near a cement less hip replacement. A case report and review. J. Bone Joint Surg., 748, 740-744.
40. Solomon, M.1. and Sekel, R. (1992) Total hip arthroplasty complicated by a malignant fibrous histiocytoma. A case report. J. Arthroplasty, 7, 549-550.
41. Goodfellow, J. (1992) Malignancy and joint replacement (Editorial). J. Bone Joint Surg., 74A, 645.
42. McDougall, A. (1956) Malignant tumor at site of bone plating. J. Bone Joint Surg. 388,709-713.
43. Delgado, E.R (1958) Sarcoma following a surgically treated fractured tibia: A case report. Clin. Orthop. 12,315-318.
44. Dube, V.E. and Fisher, D.E. (1972) Hemangioendothelioma of the leg following metallic fixation of the tibia. Cancer 30, 1260-1266.
45. Tayton, K.J.J. (1980) Ewing's sarcoma at the site of a metal plate. Cancer 45, 413-415.
46. McDonald, I. (1981) Malignant lymphoma associated with internal fixation of a fractured tibia. Cancer 48, 1009-1011.
47. Dodion, P., Putz, P., Amiri-Lamraski, M.H. et al. (1983) Immunoblastic lymphoma at the site of an infected vitallium bone plate. Histopathol., 6, 807-813.
48. Lee, Y.S., Pho, RW.H. and Nather, A. (1984) Malignant fibrous histiocytoma at site of metal implant. Cancer 54, 2286-2289
49. Hughes, A.W., Sherlock, D.A., Hamblen, D.L. et at. (1987) Sarcoma at the site of a single hip screw. A case report. J. Bone Joint Surg. 698, 470-472.
50. Ward, J.J., Thornbury, D.D., Lemons, J.E. et al. (1990) Metal-induced sarcoma: A case report and literature review. Clin. Orthop. 252, 299-306.
51. Khurana, J.S., Rosenberg, A.E., Kattapuram, S.V. et at. (1991) Malignancy supervening on an intramedullary nail. Clin. Orthop. 267,251-254.
52. Sinibaldi, K. (1976): Tumors associated with metallic implants in animals. Clin. Orthop. Rei. Res., 118,257-266.

544 I ~I _________________ C_A_N_C_E_R ________________ ~
53. Moss, AJ. (1991) Use of selected medical devices in the United States. Advance Data from Vital and Health Statistics of the National Center for Health Statistics, 191, 1-24.
54. Gillespie, W.1., Frampton, CM., Henderson, R.1. et al. (1988) The incidence of cancer following total hip replacement. J. Bone Joint Surg. 70B, 539-542.
55. Visuri, T. (1992) Cancer risk after McKee-Farrar total hip replacement. Orthopedics, 14, 137-142, 1992.
56. Nyren, 0., McLaughlin, 1.K. et at. (1995) Cancer risk after hip replacement with metal implants: A population based study. J. National Can. Inst. 87,28-33.
57. Li, X.Q., Stevenson, S., Hom, D.L. et al. (1993): Relationship between metallic implants and cancer: A case-control study in a canine population. Vet. Camp. Orthop. Traumatol. 6, 70-74.

Blood-material interactions
S.R. Hanson
6.1 INTRODUCTION
The importance of understanding mechanisms of blood-material interactions is emphasized by the increasingly widespread use of cardiovascular devices; hence, this field has been the subject of intense inquiry as described in several excellent reviews [1-4]. Unfortunately, it is still not possible to simply rank or classify materials with respect to their suitability for particular blood-contacting applications. Nor is it possible to predict in any general way, based on the properties of devices and of their blood-contacting surfaces, the behavior of blood in contact with materials or the propensity of devices to produce clinically adverse events. Despite many attempts to correlate biologic responses to physicochemical property measurements, our success in understanding blood-material interactions, and the clinical application of many blood-contacting devices, has been largely empirical. It is not appropriate to discuss in detail this large and controversial literature, which has been reviewed elsewhere [1,2]. Rather, this section will focus on the available experimental data in humans, or results which may likely be extrapolated to humans from relevant animal studies, that may guide in the development of new designs for bloodcontacting devices. Cardiovascular device applications in humans have also been the subject of an excellent review [5].
6.2 EXPERIMENTAL DIFFICULTIES
Before summarizing relevant experimental findings, it is appropriate to review briefly the theoretical and practical limitations to our understanding of blood-material interactions.
Handbook of Biomaterial Properties. Edited by 1. Black and G. Hastings. Published in 1998 by Chapman & Hall, London. ISBN 0412 60330 6.

546 I ~I ____________ B_L_O_O_D_-_M_A_T_E_R_I_A_L_I_N_T_E_R_A_CT __ I_O_N_S __________ ~
There are several factors which have precluded the rational engineering design of devices based on first principles. While thousands of materials have been put forward as 'biocompatible' or non-thrombogenic, based on in vitro studies and animal testing, the relevance of these tests for outcomes in humans remains uncertain. Device responses in vivo depend upon actual device configuration and resulting flow geometry as well as upon intrinsic materials' properties. In many applications, mechanical and physical property requirements may dominate materials' selection. For example, membranes used in dialyzers and oxygenators must be both solute and gas permeable; chronic vascular grafts and heart valves must be mechanically durable and chemically stable for years; heart assist devices require flexible pumping chambers. Thus, the use of in vitro assays or simplified in vivo flow geometries, as in many animal models, has not proven adequate to predict actual device performance in patients. Furthermore, most animals and humans, as individuals, differ markedly from one another in both blood chemistry and in blood response to foreign materials [6]. It is deemed unethical to perform screening tests in humans, hence relatively few materials have undergone clinical evaluation and only limited human comparative data are available. In the case of chronic implants, devices removed at autopsy provide only a single set of observations which cannot be related to dynamic blood-material interactions prior to explantation.
Another limitation is our recognition that all blood-material interactions of clinical consequence are preceded by complex interactions between the biomaterial surface and circulating blood proteins. Plasma contains more that 100 identified proteins with specific functions and varying biologic properties [7]. These proteins interact with surfaces in a complex, interdependent and time-dependent fashion that remains poorly understood, except in low dilution, simplified model systems [8]. These reactions may vary from individual to individual depending upon coagulation status, the use anti thrombotic or other drug therapies, or the administration of contrast media for fluoroscopic imaging. A partial listing of variables which may affect device outcomes following blood exposure is given in Table 6.1.
Despite these limitations, the design engineer may be guided by previous successful applications of materials in a variety of device configurations, and by certain generalizations which have resulted from these studies. Devices which are commonly used include catheters, cannulae, guide wires, stents, shunts, vascular grafts, heart valves, heart and ventricular assist devices, oxygenators, and dialyzers. With respect to these devices it is important to consider those events which can lead to serious clinical complications. These complications include: (1) thrombosis, (2) thromboembolism, (3) consumption (ongoing destruction) or activation of circulating hemostatic blood elements, and (4) activation of inflammatory

L.~~~~~~_E_X_P_E_R_I_M_E_N_T_A_L~D_I_FF_I_C_U_L_T_I_E_S~~~~~~-----,I I 547 J Table 6.1. Variables influencing blood interactions with cardiovascular devices
Device Properties Size and shape Surface composition Texture or roughness Mechanical properties
Blood Flow Phenomena Shear forces Convection and diffusion of reactants, products, cofactors and inhibitors Disturbed flow and turbulence
Blood Chemistry-related Effects Coagulation status Antithrombotic and other therapies Contrast media
Other Variables Duration of device blood exposure Tissue injury Infection
and immunologic pathways. An appreciation for the biologic mechanisms of these events is essential for understanding the blood-compatibility of devices, and may be briefly described as follows. Thrombus forms as the localized accumulation of blood elements on, within, or associated with a device, and thrombus which is actively deposited can accumulate to the extent of producing device dysfunction or blood vessel occlusion. Interruption of normal blood flow may produce ischemia (relative lack of oxygen) and infarction (tissue death due to total oxygen deprivation) in distal circulatory beds leading to heart attacks and strokes. Thrombus structure may be complex, and is distinguished from that of whole blood clots which are often formed under static flow conditions. Thus, clots are relatively homogeneous structures containing red blood cells and platelets trapped in a mesh of polymerized protein (fibrin), while thrombus formed under arterial flow conditions and high fluid shear rates ('white thrombus') may be composed primarily of layers of fibrin and platelets (small procoagulant cells occupying only about 0.3% of the total blood volume). Under conditions of low fluid shear, as found in veins, thrombus may more closely resemble the structure of whole blood clots ('red thrombus'). Thromboembolism is the dislodgement by blood flow of a thrombus which is then transported downstream, ultimately blocking vessels which are too small for the thrombus to traverse. Thromboembolism is a common cause of stroke (cerebrovascular infarction) and peripheral limb ischemia. Often the balance between dynamic processes of thrombus deposition and its removal by embolic and lytic mechanisms will produce platelet consumption (ongoing destruction) and a net reduction in circulating platelet levels. Other clotting factors may be consumed as well [9]. Finally, certain

548 II L ____________ B_L_O_O_D_-_M_A_T_E_R_I_A_L_I_N_T_E_R_A_CT __ I_O_N_S __________ ~
devices, particularly those having large surface areas, may activate enzyme systems (e.g., complement) leading to inflammatory or immunologic responses [10]. With these issues in mind we will now review the performance of various classes of biomaterials in actual device configurations.
6.3 CONVENTIONAL POLYMERS
Conventional polymers, such as polyethylene (Intramedic™), poly (vinyl chloride )(Tygon TM), polytetrafluoroethylene (Teflon TM), and poly (dimethyl siloxane)(Silastic™), and certain polyurethanes, have been used for many decades in short-term applications including catheters, cannulas, arteriovenous shunts for hemodialysis, and tubing components of extracorporeal circuits. When used for periods of only a few hours, and most often in patients receiving systemic anticoagulation agents, the performance of such materials has usually been clinically acceptable. For example, although thrombus on angiographic catheters can be demonstrated in about half of all cases, most thromboembolic or occlusive events are clinically silent and significant complications occur in less than 1 % of procedures [5]. Even total occlusion of small peripheral veins, by short term catheters used for venous sampling or drug administration, is usually inconsequential. However, longer-term indwelling catheters in a variety of configurations and polymer compositions, particularly in infants and children, are now recognized to produce a significant risk of thrombosis which can ultimately lead to organ or limb damage, and even death [11]. Comparative, quantitative studies with different polymer formulations remain to be performed in humans.
Polyurethanes, due in part to their flexibility and toughness, are perhaps the polymer of choice for ventricular assist devices and blood pumps. Consequently, they have received considerable interest as bloodcontacting materials. In nonhuman primates, those polyurethanes, such as Peliethane™, which exhibit the most hydrophobic surface chemistry produce the least platelet consumption [12]. In dogs, early platelet interactions with polyurethanes vary considerably although relationships to polymer surface chemistry remain unclear [13]. Thus while polyurethanes are chemically versatile and possess many desirable mechanical properties, it is generally not possible to predict their biologic responses in humans.
6.4 HYDROPHILIC POLYMERS
These materials, which preferentially adsorb or absorb water (hydrogels), were initially postulated to be blood compatible based on the view that many naturally occuring phospholipids, comprising the cell membranes of

METALS I I 549 L-~~~~~~~~~~~~~~~~~~~~~~~~~~~~
blood contacting tissues, are also hydrophilic. Thus, water, as a biomaterial, was expected to show minimal interaction with blood proteins and cells [14, 15]. Interestingly, in animal studies highly hydrophilic polymers based on acrylic and methacrylic polymers and copolymers, as well as poly(vinyl alcohol) are all found to consume platelets excessively although they accumulate little deposited thrombus [12, 16]. The materials have variable thrombogenicity, but little capacity to retain adherent thrombus, i.e., they shed deposited platelets as microemboli. Thus, while surfacegrafted hydrogels (which are mechanically weak) are currently used to improve catheter lubricity and as reservoirs for drug delivery, they have not received widespread application for improving blood-compatibility.
Another hydrophilic polymer that has received considerable attention is poly(ethylene oxide) [17, 18]. While poly(ethylene oxide) surfaces have been shown (like hydrogels) to have relatively low interactions with blood proteins and cells in in vitro studies and in some animal models, the suitability of such polymers for actual device applications and long-term implants has not been established.
6.5 METALS
Metals, as a class, tend to be thrombogenic, and are most commonly applied in situations requiring considerable mechanical strength, such as in the struts of mechanical heart valves and as endovascular stents [3, 19] or electrical conductivity, as in pacing electrodes. Stents are metallic mesh devices placed within blood vessels to preserve vessel patency after procedures to expand the vessel lumen diameter (e.g., after balloon angioplasty). Metals most commonly employed are stainless steel (316L type) and tantalum; however, both are thrombogenic [19, 20]. Catheter guide wire thrombogenicity, although readily documented, has been less of a clinical problem because of the usually short period of blood exposure involved in most procedures.
In early canine implant studies, the thrombogenicity of a wide series of metallic implants was seen to be related to the resting electrical potential of the metal which was generated upon blood contact [21]. Metals with negative potentials tend to be antithrombogenic, while stainless steel tends to be neutral. Copper, silver, and platinum are positive and extremely thrombogenic. Indeed, the use of copper coils inserted into canine arteries continues to be a widely used model for inducing a thrombotic response [22].
Theoretically, reduced thrombogenicity of metallic stents and heart valve components might be achieved by thin film polymer coatings, although the clinical effectiveness of this strategy has not been demonstrated. Thus, chronic systemic anticoagulation is generally employed in patients with prosthetic heart valves (with metallic components) and stents.
550 I ~I ____________ B_L_O_O_D_-_M_A_T_E_R_I_A_L_I_N_T_E_R_A_CT __ IO __ N_S __________ ~
6.6 CARBONS
Cardiac valves with components fabricated from low temperature isotropic carbons (pyrolytic carbon) are successfully used clinically [23]. These materials are appropriate for such applications as mechanical valves which require long-term chemical inertness, smoothness, and wear-resistance. The reasons for the marked improvement in the performance (reduced thrombosis and thromboembolic stroke rates) of these newer vs. older style heart valves are not entirely understood, but are undoubtedly multifactorial and related to improved patient management and valve design, as well as to the nature of the carbon surface. The specific benefits conferred by pyrolytic carbons with respect to blood cell and protein interactions, resulting in a very low frequency of clinical complications, remain to be defined. The use of carbon coatings has been proposed for other devices, i.e., vascular grafts, although such devices have not yet been used clinically.
6.7 ULTRA-THIN FILM COATINGS
Polymeric thin films of widely varying chemical compositIOn may be deposited onto polymers, metals, and other surfaces using the method of plasma polymerization (also called 'glow-discharge' polymerization) [24]. This method is advantageous since very thin films (e.g., 100 nm) may selectively modify the surface chemistry of devices, but not their overall mechanical properties or surface texture. Plasma polymers form highly cross-linked, covalent, inert barrier layers which may resist the adsorption of proteins, lipids, and other blood elements. Plasma reacted coatings, based on hydrocarbon monomers such as methane, may produce durable diamond like coatings. Plasma polymer coatings have been proposed for vascular grafts and stents, based on promising animal studies [25], but are not used clinically at the present time.
6.8 MEMBRANES
Blood contacting membranes are used for gas exchange (e.g., blood oxygenators) or solute exchange (e.g., dialyzers). The large membrane surface area, which may exceed 2 m2, and the complexity of cardiopulmonary bypass circuits can produce consumption and dysfunction of circulating blood elements such as platelets, leading to an increased risk of bleeding as well as thromboembolism [26]. The activation of inflammatory and immune response pathways (complement system) by dialysis and oxygenator membranes may also produce significant complications

~ ______________ S_U_RF __ A_C_E_TE __ X_TU __ RE ________________ ~I I 551
[27]. Complement activation by dialysis membranes may be related in part to the availability of surface hydroxyl groups, particularly on cellulosic membranes. Complement activation may be greatly attenuated by the use of other membrane materials such as polysulfone and polycarbonate. Complement activation by biomaterial membranes has been reviewed [27].
6.9 BIOLOGICAL SURFACES
The use of biological and bioactive molecules as device surface coatings may confer thromboresistance. Such coating materials include phospholipids and heparin. Phospholipids such as phosphorylcholine, a normal constituent of cell membranes, may orient polar head groups towards the aqueous phase and locally organize water molecules, much like hydrogel surfaces. These surfaces may minimize protein and complement interactions [28]. In preliminary animal studies, phosphorylcholine coated stents, guide wires, and vascular grafts have shown improved thromboresistance. This approach is being actively developed for clinical applications.
Heparin, a naturally occuring anticoagulant glycosaminoglycan, has been considered an attractive surface coating based on its ability to directly catalyze the inactivation of procoagulant enzymes, and thus suppress thrombus development. Recently, the reduced thrombogenicity and improved biocompatibility of heparinized metallic stents has been demonstrated in animals [29]. In these studies, heparin was covalently attached to a polymer surface coating. This method has also been used clinically for the heparin coating of catheters and other devices, although it remains unclear whether the improved biocompatibility is a function of heparin's anticoagulant activity, nonspecific physicochemical properties, or both.
With biomolecule modified surfaces, there may also be important questions regarding the possible deleterious effects of sterilization procedures required before implantation.
6.10 SURFACE TEXTURE
Surface 'smoothness' is a generally desirable feature of blood contacting surfaces. In this context, a smooth surface is one with irregularities with typical dimensions less than those of cells « 1 J.Lm). However, in certain applications, device incorporation by tissue is desirable, or the texturing of polymers may increase mechanical flexibility and durability. Thus, the sewing ring of mechanical heart valves is typically composed of poly(ethylene terephthalate) (Dacron™) fabric to permit tissue in growth and healing, which is associated with a reduction in thromboembolic

552 I LI ____________ B_L_O_O_D_-_M_A_T_E_R_I_A_L_I_N_T_E_R_A_CT __ IO __ N_S __________ ~
events. Vascular grafts used to replace diseased blood vessels are most commonly fabricated from woven or knitted Dacron™ or textured (expanded) polytetrafluoroethylene (ePTFE) (Goretex™). In tubular form, these textured polymers remain flexible and stable for many years following implantation. Smooth-walled vascular grafts have generally not been considered attractive for long-term applications since smooth surfaces may not permit tissue ingrowth or flow surface healing. Textured flow surfaces are initially thrombogenic upon blood contact, although ePTFE appears less thrombogenic and thromboembolic than fabric Dacron™ prostheses [30]. These grafts perform acceptably in man when the graft diameter exceeds about 6 mm since the layer of thrombus that forms does not significantly restrict blood flow. Interestingly, both smoothwalled and textured ventricular assist devices have also performed successfully in clinical trials [31, 32].
6.11 CONCLUSION
Because the variables affecting cardiovascular device responses are sufficiently numerous and complex, those properties of blood-contacting surfaces which would be desirable to minimize adverse reactions cannot, in most instances, be predicted with confidence. The choice of material is usually constrained by mechanical property considerations and by variable requirements for material durability and chemical stability. Cardiovascular device engineering must therefore be guided by previous experience in successful clinical applications.
ADDITIONAL READING
Colman, R.W., Hirsch, J., Marder, V.J. and Salzman, E.W. (eds)(1994) Hemostasis and Thrombosis: Basic Principles and Clinical Practice, 3rd edn, J.B. Lippincott, Philadelphia.
This book is highly recommended. This state-of-the-art text covers in detail essentially all important hematological aspects of cardiovascular device blood compatibility. In particular, Chapter 76, Interaction of blood with artificial surfaces, which considers many theoretical, experimental, and animal studies, and Chapter 77, Artificial devices in clinical practice, which describes clinical device thromboembolic complications, are of great practical value.
Harker, L.A., Ratner, B.D. and Didisheim, P. (eds)(1993) Cardiovascular Biomaterials and Biocompatibility, Cardiovascular Pathology, 2(3) (suppl.), IS-224S.
In this volume, 20 chapters by expert authors treat all aspects of biomaterials and blood compatibility including pathologic mechanisms, material characterization, blood-material interactions and device performance. This volume updates an excellent earlier book Guidelines for Blood-Material Interactions, National Institutes of Health, Washington, DC, Publication No. 85-2185 (1985).

REFERENCES I I 553 L-__________________________________________________________ ~
Szycher, M. (ed.) (1983) Biocompatible Polymers, Metals, and Composites, Technomic Publishing Co., Lancaster, Pennsylvania.
Many of the same issues of blood-material interactions are broadly covered while selected polymer and device applications are described in additional detail. Of particular interest are Section I (Fundamental Concepts in Blood/Material Interactions) and Section II (Strategies for Hemocompatibility).
ACKNOWLEDGEMENT
This work was supported by Research Grant HL 31469 from the Heart, Lung and Blood Institute, the National Institutes of Health.
REFERENCES
1. Salzman, E.W., Merrill, E.W. and Kent K.c. (1994) Interaction of blood with artificial surfaces, in Hemostasis and Thrombosis: Basic Principles and Clinical Practice, 3rd edn, RW. Colman, J. Hirsch, V.J. Marder, and Salzman, E.W. (eds), J.B. Lippincott, Philadelphia, pp. 1469-85.
2. Harker, L.A, Ratner, B.D. and Didisheim, P. (eds) (1993) Cardiovascular Biomaterials and Biocompatibility, Cardiovascular Pathology 2(3)(supplement), 1S-224S.
3. Szycher, M. (ed.) (1983) Biocompatible Polymers, Metals, and Composites, Technomic Publishing Co., Lancaster, Pennsylvania.
4. Williams, D.F. (ed) (1981) Biocompatibility of Clinical Implant Materials, CRC Press, Boca Raton, Florida.
5. Clagett, G.P. and Eberhart, RC. (1994) Artificial Devices in Clinical Practice, in Hemostasis and Thrombosis: Basic Principles and Clinical Practice, 3rd edn RW. Colman, J. Hirsch, V.J. Marder, and Salzman, E.W. (eds), J.B. Lippincott, Philadelphia, pp. 1486-1505.
6. Grabowski, E.F., Didisheim, P., Lewis, J.e. et at. (1977) Platelet adhesion to foreign surfaces under controlled conditions of whole blood flow: human vs. rabbit, dog, calf, sheep, pig, macaque, and baboon. Transactions - American Society for Artificial Internal Organs, 23, 141-51.
7. Lentner, e. (ed.) (1984) Geigy Scientific Tables (vol. 3): Physical Chemistry, Composition of Blood, Hematology, Somatometric Data, Ciby-Geigy, Basle.
8. Brash, J.L. and Horbett, T.A (eds) (1987) Proteins at Interfaces. Physicochemical and Biochemical Studies, American Chemical Society, Washington, DC.
9. Harker, L.A and Slichter, S.J. (1972) Platelet and fibrinogen consumption in man. New England J Med. 287(20), 999-1005.
10. Bennett, B., Booth, N.A, Ogston D. (1987) Potential interactions between complement, coagulation, fibrinolysis, kinin-forming, and other enzyme systems, in: Haemostasis and Thrombosis (2nd edn), AL. Bloom and D.P. Thomas (eds), Churchill Livingstone, New York, pp. 267-82.

554 I LI ____________ B_L_O_O_D_-_M_A_TE __ R_I_A_L_I_NT __ E_R_A_CT __ IO __ N_S __________ ~
11. Andrew, M. (1995) Developmental hemostasis: relevance to thromboembolic complications in pediatric patients. Thrombosis and Hemostasis, 74(1), 415-25.
12. Hanson, S.R., Harker, L.S., Ratner, B.D. et al. (1980) In vivo evaluation of artificial surfaces using a nonhuman primate model of arterial thrombosis. J Laboratory Clinical Med. 95, 289-304.
13. Silver, J.H., Myers, C.W., Lim, F. et al. (1994) Effect of polyol molecular weight on the physical properties and haemocompatibility of polyurethanes containing polyethylene oxide macroglycols. Biomaterials 15(9),695-704.
14. Hoffman, A.S. (1974) Principles governing biomolecular interactions at foreign surfaces. J. Biomedical Materials Res. (Symp.) 5(1), 77-83.
15. Andrade, J.D., Lee, H.B., Jhon, M.S. et al. (1973) Water as a biomaterial. Transactions - American Society for Artificial Internal Organs 19, 1-7.
16. Strzinar, I. and Sefton, M.V. (1992) Preparation and thrombogenicity of alkylated polyvinyl alcohol coated tubing. J. Biomedical Materials Research 26, 577-92.
17. Merrill, E.W. (1993) Poly(ethylene oxide) star molecules: synthesis, characterization, and applications in medicine and biology. J. Biomaterials Science, Polymer Edition 5(1-2), 1-11.
18. Llanos, G.R. and Sefton, M.V. (1993) Does polyethylene oxide possess a low thrombogenicity? J. Biomaterials Science, Polymer Edition, 4(4), 381-400.
19. Sigwart, D., Puel, J., Mirkovitch, V. et al. (1987) Intravascular stents to prevent occlusion and restenosis after transluminal angioplasty. New England J. Med, 316(12), 701-6.
20. Scott, N.A., Nunes, G.L., King, S.B. et al. (1995) A comparison of the thrombogenicity of stainless steel and tantalum coronary stents. American Heart J., 129, 866-72.
21. Saywer, P.N., Stanczewski, B., Lucas, T.R., et al. (1978) Physical chemistry of the vascular interface, in Vascular Grafts, P.N. Sawyer and M.J. Kaplitt (eds), Appleton-Century-Crofts, New York, pp. 53-75.
22. Rapold, H.J., Stassen, T., Van de Werf, F., et al. (1992) Comparative copper coil-induced thrombogenicity of the internal mammary, left anterior descending coronary, and popliteal arteries in dogs. Arteriosclerosis and Thrombosis, 12(5), 634-44.
23. Schoen, F.J. (1983) Carbons in heart valve prostheses: Foundations and clinical performance, in M. Szycher (ed.), Biocompatible Polymers, Metals, and Composites, Technomic Publishing Co., Lancaster, Pennsylvania, pp. 239-61.
24. Yasuda, H.K. (1985) Plasma Polymerization, Academic Press, Orlando. 25. Yeh, Y.S., Iriyama, T., Matsuzawa, Y., et al. (1988) Blood compatibility of
surfaces modified by plasma polymerization. J. Biomedical Materials Research, 22, 795-818.
26. Harker, L.A., Malpass, T.W., Branson H.E., et al. (1980) Mechanism of abnormal bleeding in patients undergoing cardiopulmonary bypass: acquired transient platelet dysfunction associated with selective alpha-granule release. Blood, 56(5), 824-34.
27. Hakim, R. (1993) Complement activation by biomaterials. Cardiovascular Pathology, 2(3)(suppl), 187S-198S.

I I 555 L-____________________________________________________ ~ REFERENCES
28. Yu, J., Lamba, N.M., Courtney 1.M., et al. (1994) Polymeric biomaterials: Influence of phosphorylcholine polar groups on protein adsorption and complement activation. International Journal of Artificial Organs, 17(9), 499-504.
29. Hardhammer, P.A., van Beusekom H.M., Emanuelsson, H.U., et al. (1996) Reduction in thrombotic events with heparin-coated Palmaz-Schatz stents in normal porcine coronary arteries. Circulation, 93(3), 423-30.
30. Schneider, P.A., Kotze, H.F., Heyns, A. duP., et al. (1989) Thromboembolic potential of synthetic vascular grafts in baboons. J. Vascular Surgery, 10,75-82.
31. Dasse, K.A., Poirier, V.L., Menconi, MJ., et at. (1990) Characterization of TCPS textured blood-contacting materials following long-term clinical LV AD support. In: Cardiovascular Science and Technology: Basic and Applied: II, JC Norman (ed.), Oxymoron Press, Boston, MA, pp. 218-220.
32. Kormos, R.L., Armitage, J.M., Borovetz, H.S., et al. (1990) Univentricular support with the Novocor left ventricular assist system as a bridge to cardiac transplantation: An update in Cardiovascular Science and Technology: Basic and Applied: II, JC Norman (Ed), Oxymoron Press, Boston, MA, pp. 322-324.

7 Soft tissue response to silicones
S.E. Gabriel
7.1 SILICONES USED IN MEDICINE
Although the term 'silicone' refers to a group of organic silicone compounds, the one most commonly used in medicine is composed of a polymer known as dimethypolysiloxane (DMPS). In silicone gel the polymer is cross-linked; the more cross-linking, the more solid is the gel. Liquid silicone consists of glucose-linked DMPS polymer chains. Silicones first became commercially available in 1943, with the first subdermal implantation of silicone occurring in the late 1940s [1-3]. Silicones have since been developed for a wide variety of medical applications, most notably in joint and breast prostheses.
There is a large body of literature attesting to the chemical and physical inertness of silicone [4-12]. Recently, there has been increasing interest in the possible adverse effects of silicones used in implantation. Much of the literature describing the adverse effects of silicone has been in reference to direct silicone injection. The following discussion will review the immunologic effects of prostheses used in breast reconstruction and augmentation.
7.2 LOCAL IMMUNOLOGIC REACTIONS TO SILICONE
Immunologic reactions to silicone can be local, regional due to silicone migration, or systemic. Local cutaneous and subcutaneous reactions to
Handbook of Biomaterial Properties. Edited by J. Black and G. Hastings. Published in 1998 by Chapman & Hall, London. ISBN 0412603306.

L--__ S_y_S_T_E_M_I_C_I_M_M_U_N_O_L_O_G_I_C_R_E_A_CT_I_O_N_S_T_O_SI_L_IC_O_N_E __ -----.JI [ 557
injected silicone or gel have been reported [13-18]; and it has become apparent that these reactions are not due to impurities in the silicone, as was originally suspected. Subcutaneous injection of silicone liquid in experimental animals provokes an acute inflammatory response characterized by a primarily polymorphonuclear reaction, followed by a chronic inflammatory response with lymphocytes, fibroblasts, and plasma cells [19]. The late response is characterized by a small amount of cellular infiltrate and an increase in extracellular material. Macrophages with clear vacuoles have been observed and are suspected to contain silicone. Occasionally, multinucleated foreign body giant cells have also been observed [16, 20-23].
In humans, liquid silicone has been injected subcutaneously for cosmetic reasons. Granulomatous reactions have been reported to occur in some instances [14-17]. Similar reactions have been noted in two case reports following the rupture of silicone gel-filled breast prostheses [24,25]. Clinically, these reactions have the characteristics of an inflammatory response, i.e., redness, swelling, and pain. Histologic examination shows chronic inflammatory reactions, occasionally with the presence of refractile material resembling silicone [24].
Migration of silicone has been documented on numerous occasions in the literature. Following experimental intra-peritoneal injection in mice, silicone was demonstrated to be present in the liver, spleen, ovaries, and kidneys [26]. Other investigators have documented the migration of subcutaneously injected silicone to the lung, associated with an increased incidence of respiratory problems in experimental animals [27]. Pneumonitis was reported in 3 patients several days following liquid silicone injection, and silicone was demonstrated in macro phages obtained by pulmonary lavage from these patients [27]. The presence of silicone was confirmed by atomic absorption and infra-red spectrophotometry. Another case report described a patient with silicone-induced granulomatous hepatitis; analysis of liver biopsy specimens revealed quantifiable amounts of silicone [28]. Subcutaneous masses or nodules, hepatic granulomas have also been reported following injections into humans [23,24,28]. Regional lymphadenopathy is a frequently reported finding [29-35]. In rare cases, this has progressed to malignant lymphoma [29,32,33]. The relevance of these reports to silicone breast implants is uncertain.
7.3 SYSTEMIC IMMUNOLOGIC REACTIONS TO SILICONE
Systemic reactions have been reported following the introduction of silicone into the body. In one instance, a severe systemic reaction consisting of a febrile illness, acute renal insufficiency, respiratory compromise,

558 II ~ __________ S_O_FT ___ T_IS_S_U_E_R_E_S_P_O_N_S_E_T_O __ S_IL_I_C_O_N_E_S __________ ~
pulmonary infiltration, delirium, anemia, and thrombocytopenia has been reported following implantation of a silicone gel envelope prosthesis. Improvement followed implant removal. Silicone was identified by mass spectrophotometry in this case [36]. Another case involved the injection of a large quantity of free silicone under the breasts by an unauthorized individual. The patient expired within 10 hours of injection. Silicone was identified by absorption spectrophotometry in large quantities in the lung, kidney, liver, brain and serum [28].
The mechanism underlying the systemic immunologic reactions to silicone has not been thoroughly investigated. A marked local granulomatous reaction to silicone has been noted in guinea pigs; however, an antibody response to silicone by Ouchterlony gel diffusion or passive cutaneous anaphylaxis was not demonstrated [37]. Other investigators have studied macrophage migration inhibition [38]. In these studies, pigs were sensitized by subcutaneous injection of silicone. Harvested macrophages demonstrated inhibition of migration in the presence of silicone, suggesting specific antigen recognition. In addition, silicone was demonstrated in the cytoplasmic bridges joining macrophages and lymphocytes. Alternatively, it has been suggested that the immune system does not respond with a specific recognition of silicone but that silicone promotes the immune response to other antigens, i.e., acts as an adjuvant. Hypergammaglobulinemia has been noted by some investigators, and silicon dioxide has been reported to have adjuvant effects [39]. A disorder which has been termed, 'human adjuvant disease', was described following injection of paraffin for breast augmentation mammoplasty [40]. In Japan, in 1973, Yoshida reviewed seven cases of human adjuvant disease in Japan following injections of paraffin or silicone for augmentation mammoplasty [41]. The symptoms included arthritis, arthralgia, lymphadenopathy, hypergammaglobulinemia, elevated erythrocyte sedimentation rates and positive rheumatoid factor. Removal of the injected materials resulted in improvement of the condition in some patients [41].
In 1979, Kumagai reported four cases of classical systemic sclerosis following cosmetic surgery [42]. Five years later, the same investigator described a series of 46 patients with signs and symptoms of connective tissue disease following injection of either silicone or paraffin [43]. Definite connective tissue diseases, based on American Rheumatism Association Criteria, were diagnosed in 24 patients. These conditions included systemic lupus erythematosus, mixed connective tissue disease, rheumatoid arthritis, Sjogren's syndrome, and systemic sclerosis. Another group of 22 patients were described as having human adjuvant disease, with signs, symptoms, and laboratory abnormalities suggestive but not diagnostic of a connective tissue disease. In 1984, three patients from Singapore were reported who developed autoimmune disease following injection augmentation mammoplasty [44]. In the same year, a 52-year-old woman who

L-_____________ E_V_I_D_E_N_C_E_F_O_R __ C_A_V_S_A_T_I_O_N ____________ ~I I 559 J developed systemic sclerosis, primary biliary cirrhosis and Sjogren's syndrome following silicone/paraffin injection mammoplasty was reported [45].
In 1982, the first case series describing autoimmune disorders following augmentation mammoplasty with gel-filled prostheses was reported. This was followed by other reports involving both gel-filled implants and salinefilled silicone implants [46-49]. The most frequently reported connective tissue disease associated with silicone breast implants is systemic sclerosis. Table 7.1 summarizes the clinical and laboratory characteristics of 19 cases of systemic sclerosis associated with silicone breast augmentation published in the English language literature. Eleven of these cases received implantation in the United States [35]. Eleven of the 19 patients were ANA positive, 15 had Raynaud's, and 10 had diffuse systemic sclerosis. The interval between augmentation to diagnosis of systemic sclerosis varied from 1 to 25 years, with a mean of 13 years. Fourteen of the 19 patients were exposed to silicone (11 silicone gel and 3 silicone injection), the remainder being exposed to paraffin injection. In two cases, histopathologic demonstration of multinucleated giant cells, vacuoles with refractile droplets, and intracytoplasmic asteroid bodies in lymph nodes draining the prostheses suggested leakage of silicone from the implants and its dissemination in lymphoid tissues. The authors used energy-dispersive X-ray analysis to confirm that the macrophage inclusions in the lymphatic tissue contain silicone.
Although systemic sclerosis is the most commonly reported disorder occurring following silicone breast implantation, there have also been reports of systemic lupus erythematosus [43,44,46,50], Sjogren's syndrome [45], keratoconjunctivitis sicca [45], rheumatoid arthritis [4,34,43], polymyositis [43], overlap syndromes (including human adjuvant disease) [34,43,46,50,51], morphea [35,43], Hashimoto's thyroiditis [43,52], anticardiolipin antibody syndrome [53], primary biliary cirrhosis [45] and toxic shock syndrome [54]. Unfortunately, it is impossible to tell, on the basis of case reports, whether the frequency of these events is greater than might be expected on the basis of chance alone (Table 7.1).
7.4 EVIDENCE FOR CAUSATION
It has been estimated that two million American women have undergone breast augmentation or reconstruction since the introduction of the silicone gel-filled elastomer envelope-type prosthesis in the early 1960s [60,61]. The reported cases of systemic sclerosis among this population raise the important question of whether the association between systemic sclerosis and silicone breast implants is a real one. Unfortunately, almost all of the evidence to date is derived from case reports, which are the

Tab
le 7
.1
Cas
es o
f Sy
stem
ic S
cler
osis
aft
er A
ugm
enta
tion
Mam
mop
last
y R
epor
ted
in t
he E
ngli
sh-L
angu
age
Lit
erat
ure
Ext
ent
of
Age
at
Age
at
Inte
rval
to
Syst
emic
R
ayna
ud
Ant
inuc
lear
P
atie
nt
Dia
gnos
is,
y M
amm
opla
sty,
y
Typ
e o
f Im
plan
t O
nset
, y
Scle
rosi
s P
heno
men
on
Syst
emic
Inv
olve
men
t A
ntib
odie
s* R
efer
ence
1 52
50
Si
licon
e ba
g ge
l 2
Dif
fuse
N
o N
o (5
5)
2 41
20
Si
licon
e ba
g ge
l 21
D
iffu
se
Yes
P
ulm
onar
y, g
astr
oint
esti
nal
+
(55)
3
63
53
Silic
one
bag
gel
10
Lim
ited
Y
es
Pulr
ilOna
ry
+
(55)
4
37
32
Silic
one
bag
gel
5 D
iffu
se
No
Pul
mon
ary
+
(55)
5
45
25
Par
affi
n in
ject
ion
19
Dif
fuse
Y
es
No
(42)
6
49
20
Par
affi
n in
ject
ion
16
Dif
fuse
Y
es
Pul
mon
ary,
gas
troi
ntes
tina
l (4
2)
7 51
25
P
araf
fin
inje
ctio
n 17
L
imit
ed
Yes
N
o (4
3)
8 36
24
P
araf
fin
inje
ctio
n 9
Lim
ited
Y
es
Pul
mon
ary
(43)
9
55
30
Par
affi
n in
ject
ion
25
Lim
ited
Y
es
Pul
mon
ary
(44)
10
50
31
Si
licon
e in
ject
ion
19
Lim
ited
Y
es
Pul
mon
ary,
gas
troi
ntes
tina
l, +
(4
5)
prim
ary
bili
ary
cirr
hosi
s 11
59
34
Si
licon
e in
ject
ion
25
Dif
fuse
Y
es
No
+
(56)
12
38
26
Si
licon
e ba
g ge
l 7
Lim
ited
Y
es
Gas
troi
ntes
tina
l +
(5
6)
13
47
32
Silic
one
bag
gel
15
Dif
fuse
Y
es
Pul
mon
ary
+
(35)
14
59
50
Si
licon
e ge
l 9
Dif
fuse
N
o P
ulm
onar
y, g
astr
oint
esti
nal
+
(35)
15
44
34
Si
licon
e ge
l 10
L
imit
ed
Yes
P
ulm
onar
y, g
astr
oint
esti
nal
+
(35)
16
43
37
Si
licon
e ge
l 6
Dif
fuse
Y
es
Gas
troi
ntes
tina
l +
(3
5)
17
44
43
Silic
one
gel
1 L
imit
ed
Yes
M
alig
nant
hyp
erte
nsio
n +
(5
7)
18
44
19
Silic
one
inje
ctio
n 25
D
iffu
se
Yes
M
alig
nant
hyp
erte
nsio
n/
+
(58)
re
nal
fail
ure
19
46
34
Silic
one
gel
12
Lim
ited
N
o N
o (5
9)
-ne
gati
ve.
+ p
ositi
ve.
* D
eter
min
ed u
sing
im
mun
oflu
ores
cenc
e.

L-_____________ E_V_I_D_E_N_C_E_F_O_R __ C_A_U_S_A_T_I_O_N ____________ ~I I 561
very weakest form of data bearing on the question of causality (Table 7.2). Indeed, the most important evidence for establishing a cause-effect relationship is the strength of the research design used to study that relationship [62]. Randomized control trials provide the strongest evidence but are seldom ethical in studies of causation because they involve randomly assigning individuals to receive or not to receive a potentially harmful intervention. In addition, the long latent periods and large numbers of subjects needed to answer most cause and effect questions in clinical medicine make it impractical to utilize this research design.
Well conducted prospective cohort studies are the next strongest design because they minimize the effects of selection bias, measurement bias, and known confounders. Such a study would involve following a large population of women, preferably for one or more decades, looking for the outcomes of interest (e.g., connective tissue disorders). A relative risk for connective tissue disorders among those women who elect to have breast implantation compared to those who do not can then be calculated. Although this is a powerful research design, it is usually impractical because of the necessary long follow-up period. This problem can be circumvented by a retrospective cohort study, which is similar with the exception that the population and the exposure (breast implantation) is identified in the past, allowing the patients to be followed to the present for the outcomes of interest. Although this is a very attractive research design, it requires that the complete exposed and unexposed populations be identifiable and that follow-up information be available on all individuals.
Case-control studies retrospectively compare the frequency of breast implantation in women with and without the outcomes of interest. If, for example, connective tissue disorders were more likely to occur among women with breast implants, this would constitute some evidence for causation. Case-control studies typically require less time and resources than cohort studies. However, they are susceptible to many more biases than cohort studies [62]. The primary reason not to perform a case-control study here, however, is that a separate case-control study would be required for each of the outcomes of interest, i.e., a case-control study of systemic sclerosis, a case-control study of rheumatoid arthritis, etc. The
Table 7.2 Strength of Research Designs Used to Determine Causation
Strongest .t .t .t
Weakest
Randomized controlled trials Prospective cohort studies Case control studies Ecological survey Case series

562 I ~I __________ S_O_FT ___ T_IS_S_U_E_R_E_S_P_O_N_S_E_T_O __ S_IL_I_C_O_N_E_S __________ ~
retrospective cohort design is much more efficient since it can evaluate multiple outcomes in a single study, as is the need here.
A set of eight criteria has been proposed as a guide to formulate decisions regarding cause and effect relationships (Table 7.3). The relationship between breast implants and connective tissue disorders does fulfill the criterion of temporality since, at least in the published case reports, the connective tissue disorders all followed breast implantation. There is no evidence describing the magnitude of the relative risk in this relationship. There is also no evidence for a dose response relationship, i.e., that women with bilateral implants perhaps have an increased likelihood of connective tissue disorders compared to women with unilateral implants. The evidence regarding the reversibility of these disorders with removal of implants is variable. Although there have been some reports of improvement of connective tissue disorders following removal of the implants, this is not consistent and the number of patients involved is small. The relationship does appear to be consistent, i.e., it has been observed repeatedly by different persons in different places, circumstances, and times, however it has not yet been assessed using adequate study designs. Perhaps the most compelling evidence is the biologic plausibility of this relationship due to the hypothesis of silicone acting as an immune adjuvant. The relationship does not appear specific, as silicone implants have lead to not just one effect, but several, albeit somewhat related, effects. Finally, a cause and effect relationship is strengthened if there are examples of well established causes that are analogous to the one in question. Adjuvant induced arthritis can be considered analogous [63].
In summary, in spite of the anecdotal evidence, until very recently there was a lack of evidence to either support or refute a cause-and-effect relationship between silicone breast implants and connective tissue/ autoimmune disorders.
Table 7.3 Evidence that an Association is Causal[62J
Characteristic
Temporality Strength Dose-response
Reversibility
Consistency
Biologic plausibility Specificity Analogy
Definition
Cause precedes effect Large relative risk Larger exposures to cause associated with higher rates
of disease Reduction in exposure associated with lower rates of
disease Repeatedly observed by different persons, in different
places, circumstances, and times Makes sense, according to biologic knowledge of the time One cause leads to one effect Cause-and-effect relationship already established for a
similar experience

'---__ B_R_E_A_S_T_IM_P_L_A_N_T_S_A_N_D_C_O_NN_E_CT_IV_E_T_IS_S_U_E_D_I_S_E_A_S_E_-----'I I 563
7.5 CONTROLLED STUDIES EXAMINING THE RELATIONSHIP BETWEEN BREAST IMPLANTS AND CONNECTIVE TISSUE DISEASE.
At least seven controlled studies have now been published (Table 7.4), each of which provided a quantitative assessment of the risk of connective tissue diseases among women with breast implants [64-70]. The first of these was a case-control study of augmentation mammoplasty and scleroderma [68]. The aims of this study were to compare the frequency and temporal relationship of augmentation mammoplasty among scleroderma cases and matched controls. Scleroderma patients and age stratified general practice controls were interviewed using a pretested telephone questionnaire. Self-reported dates of augmentation mammoplasty were ascertained as were dates of scleroderma symptoms and diagnoses as relevant. Frequencies of nOIiaugmentation mammoplasty silicone exposure between interviewed cases and controls were expressed in terms of rate ratios and 95% confidence intervals. Rate ratios were also adjusted for socioeconomic status.
A total of 315 cases and 371 controls were interviewed, of whom 251 and 289, respectively, were female. The unadjusted rates for augmentation mammoplasty among interviewed cases and controls were 4/251 (1.59%) and 5/289 (1.73%), respectively. The socioeconomic status adjusted rate of augmentation mammoplasty in scleroderma patients was 1.54% (95% CI: 0.03-3.04) which is very similar to the 1.73% rate in interviewed controls. These results indicate that augmentation mammoplasty rates were comparable in cases and controls. In addition, the rates of exposure to nonmammoplasty silicone mastectomy and breast lumpectomy were comparable in interviewed cases and controls. This study failed to demonstrate an association between silicone breast implantation and the subsequent development of scleroderma to a relative risk as low as 4.5 with 95% statistical power.
In June of 1994, a population-based retrospective cohort study was published which examined the risk of a variety of connective tissue diseases and other disorders after breast implantation [65]. In this study, all women in Olmsted County, Minnesota who received a breast implant between 1 January 1964 and 31 December 1991 (the case subjects) were studied. For each case subject, two women of the same age (within three years) from the same population who had not received a breast implant and who underwent a medical evaluation within two years of the date of the implantation in the case subject were selected as control subjects. Each woman's complete inpatient and outpatient medical records were interviewed for the occurrence of various connective tissue diseases (i.e., rheumatoid arthritis, systemic lupus erythematosus, Sjogren's syndrome, dermatomyositis, polymyositis, systemic sclerosis, ankylosing spondylitis,

Tab
le 7
.4
Sum
mar
y of
con
trol
led
stud
ies
exam
inin
g th
e re
lati
onsh
ip b
etw
een
brea
st i
mpl
ants
(B
I) a
nd c
onne
ctiv
e ti
ssue
dis
ease
s (C
TD
) St
udy
Pop
ulat
ion
Ref
eren
ce
Cas
es
Con
trol
s St
udy
Des
ign
(exp
osed
)(un
expo
sed)
Out
com
e(s)
Exa
min
ed
68
65
67
64
60
70
69
Cas
e co
ntro
l
Ret
rosp
ecti
ve
coho
rt
Cas
e co
ntro
l
Cas
e co
ntro
l
Mul
ti-c
ente
r ca
se c
ontr
ol
Nes
ted
case
co
ntro
l
Cas
e co
ntro
l (p
reli
min
ary
resu
lts)
CI
= c
onfi
denc
e in
terv
al 31
5 37
1
749
1498
195
143
349
1456
869
2061
1217
00
592
1184
Sys
tem
ic s
cler
osis
(S
S, s
cler
oder
ma)
C
onne
ctiv
e ti
ssue
and
ot
her
auto
imm
une
dise
ases
Sys
tem
ic l
upus
er
ythe
mat
osus
(S
LE
)
Rhe
umat
oid
arth
riti
s (R
A)
SS (
scle
rode
rma)
Con
nect
ive
tiss
ue
dise
ase
SS (
scle
rode
rma)
Mai
n R
esul
t
Rat
es o
f B
I am
ong
case
s an
d co
ntro
ls w
ere
1.59
% a
nd 1
.73%
R
elat
ive
risk
(ca
ses:
cont
rols
) of
dev
elop
ing
any
of t
hese
di
seas
es w
as 1
.06
(95%
CI:
0.3
4-2.
97).
O
ne (
0.8%
) of
the
SL
E
case
s an
d 0
(0%
) of
the
co
ntro
ls r
epor
ted
havi
ng
a B
I (p
=0.
57).
R
elat
ive
risk
for
a h
isto
ry o
f B
I (c
ases
:con
trol
s) w
as 0
.41
(95%
CI:
0.0
5-3.
13).
O
dds
rati
o fo
r B
I su
rger
y (c
ases
:con
trol
s) w
as 1
.25
(95%
CI:
0.6
2-2.
53).
Fiv
e ca
ses
wit
h B
I w
ere
iden
tifi
ed
amon
g 30
0 pa
tien
ts w
ith
RA
; o
case
s w
ith B
I am
ong
123
with
S
LE
, 20
pat
ient
s w
ith
SS,
3 w
ith
Sjo
gren
's s
yndr
ome,
13
wit
h de
rma t
o/po
lym
yosi
tis,
and
2 w
ith
mix
ed c
onne
ctiv
e ti
ssue
dis
ease
. O
dds
rati
o fo
r B
I (c
ases
:con
trol
s)
was
0.6
1 (9
5% C
I: 0
.14-
2.68
)
Con
clus
ions
Rat
es o
f B
I w
ere
sim
ilar
in
cas
es a
nd c
ontr
ols.
T
here
was
no
asso
ciat
ion
betw
een
BI
and
the
conn
ecti
ve t
issu
e an
d ot
her
diso
rder
s st
udie
d.
No
asso
ciat
ion
was
sho
wn
betw
een
BI
and
SL
E.
No
incr
ease
d ri
sk f
or R
A
amon
g w
omen
wit
h B
I w
as d
emon
stra
ted.
N
o si
gnif
ican
t ca
usal
re
lati
onsh
ip w
as
dem
onst
rate
d be
twee
n B
I an
d th
e de
velo
pmen
t o
f SS
. N
o as
soci
atio
n w
as
foun
d be
twee
n B
I an
d C
TD
.
No
sign
ific
ant
asso
ciat
ion
betw
een
BI
and
SS w
as f
ound
.

L-__ B_R_E_A_S_T_IM_P_L_A_N_T_S_A_N_D_C_O_N_N_E_CT_IV_E_T_IS_S_U_E_D_I_S_E_A_S_E_--,I I 565
psoriatic arthritis, polymyalgia rheumatica, vasculitis, arthritis associated with inflammatory bowel disease, and polychondritis), certain other disorders thought to have an autoimmune pathogenesis (i.e., Hashimoto's thyroiditis), and cancer other than breast cancer. In addition, this study itemized the results of ten related symptoms and the abnormal results of four related laboratory tests. A total of 749 women who had received a breast implant were followed for a mean of 7.8 years and the corresponding 1498 community controls were followed for a mean of 8.3 years. The relative risk of developing anyone of these specified connective tissue and other diseases among case subjects compared to controls was 1.06 (95% CI: 0.34-2.97). This study, therefore, found no association between breast implants and the connective tissue diseases and other disorders that were studied [65].
In the summer of 1994, Strom and colleagues published a case-control study which addressed the risk of systemic lupus erythematosus among women with breast implants [67]. A total of 219 eligible cases who met the American Rheumatism Association criteria for systemic lupus erythematosus [71] were identified from the medical practices of cooperating rheumatologists in the Philadelphia metropolitan area. One hundred ninety-five (89%) of these were enrolled in the study. Friends of the cases, matched to the cases on sex and age (±5 years), served as controls. Using a short telephone interview, cases and controls were contacted and asked to provide information on any surgery that they had prior to the index date, i.e., the date of diagnosis of systemic lupus erythematosus, in the cases and the same year for the age-matched friend controls. Specific questions were asked about plastic surgery in general and breast implants in particular. One hundred forty-eight (75.9%) of the 195 systemic lupus erythematosus being sought and 111 (77.6%) of the 143 controls agreed to be reinterviewed for this study. Only 1 (0.8%) of the 133 female systemic lupus erythematosus cases reported having a breast implant eight years prior to the diagnosis of systemic lupus erythematosus. This compared to 0 out of the 100 female friend controls (Fisher exact onetailed p-value = 0.57). These authors concluded, based on this very large case-control study of systemic lupus erythematosus, that no association existed between silicone breast implants and the subsequent development of systemic lupus erythematosus. However, the modest statistical power of the study was only able to provide sufficient evidence against a very large association.
Three additional controlled studies have been presented and are published in abstract form [64,66,70]. As part of a prospective case-control study of the risk of rheumatoid arthritis, Dugowson et al. recruited 349 wom!;,!n with new-onset rheumatoid arthritis and 1456 similarly aged control women. Information about breast implants was obtained on both cases and controls and age-adjusted risk for a history of breast implants

566 I ~I __________ S_O_FT ___ T_IS_S_U_E_R_E_S_P_O_N_S_E_T_O __ S_IL_I_C_O_N_E_S __________ ~
among cases was compared to that of controls. The relative risk, i.e., comparing the rate of a history of breast implants among rheumatoid arthritis cases compared to a similar history among controls, was 0.41 (95% CI: 0.05-3.13) [64]. These data did not support an increased risk for rheumatoid arthritis among women with silicone breast implants.
A multi-center, case-controlled study was performed to examine the association between scleroderma and augmentation mammoplasty [66]. A total of 869 women with systemic sclerosis recruited from three university-affiliated rheumatology clinics and 2061 local community controls matched on age in three strata (ages 25-44, 45-64, and 2':65); race and sex were identified by random-digit dialing. Data on exposure and potential confounding variables were collected from cases and controls by selfadministered questionnaires and telephone interviews, respectively. The frequency of breast implant surgery was compared in both groups and the odds ratio and 95% confidence intervals for the association of augmentation mammoplasty with systemic sclerosis, adjusted for age, race, marital status, and site, was 1.25 (95% CI: 0.62-2.53). These data failed to demonstrate a significant causal relationship between augmentation mammoplasty and the development of systemic sclerosis.
Using a nested case-control study, Sanchez-Guerrero et al. examined the association between silicone breast implants and connective tissue diseases among a cohort of 121 700 registered American nurses followed since 1976 [70]. In 1992, a questionnaire was sent to nurses who had reported any rheumatic disease from 1976 to 1990 asking about rheumatic symptoms and silicone exposure. The complete medical records were obtained on all participants who confirmed any rheumatic or musculoskeletal symptoms. Connective tissue disease cases were classified according to the American College of Rheumatology or other published criteria. Ten age-matched controls per case were randomly selected among nurses with no rheumatic or musculoskeletal complaints. Odds ratios and 95% confidence intervals were used as a measure of association. This study identified 448 cases with definite connective tissue diseases and 1209 nurses with silicone breast implants. Five patients had silicone breast implants and any connective tissue disease. The mean time since implantation was 139 ± 95.81 months among these five patients and 119.17 ± 76.64 months among all nurses with silicone breast implants. These five patients were identified among 300 patients with rheumatoid arthritis. No case with a silicone breast implant was identified among 123 patients with systemic lupus erythematosus, 20 patients with scleroderma, three with Sjogren's syndrome, 13 with dermato/polymyositis, and two with mixed connective tissue diseases. In conclusion, this study found no association between silicone breast implants and connective tissue diseases.
Finally, Burns and Schottenfeld are conducting a population-based casecontrol study examining the relationship between this condition and prior

L-_________________ RE_F_E_R_E_N_C_E_S ________________ ~I I 567
history of breast implant surgery [69,72]. The cases and normal population controls are being assembled from the states of Michigan and Ohio. The cases are being identified using several sources: a computerized data base of hospital discharge diagnostic listings during the period 1980-1991; a collaborative network of major medical centers; a postal survey of certified rheumatologists; and from patient members of the United Scleroderma Foundation. Although this study is still underway, preliminary results demonstrate a crude odds ratio of 0.61 (95% CI: 0.14-2.68) for breast implants among cases compared to controls. These results do not support a causal relationship between breast implants and systemic sclerosis.
In summary, although numerous anecdotal case reports have suggested an association between silicone breast implants and connective tissue diseases, all seven controlled epidemiologic studies conducted to date have failed to confirm such an association. Whether silicone breast implants cause a new and previously undescribed condition is yet to be determined.
REFERENCES
1. Williams, D.F. (1981) Biocompatibility of clinical implant materials. Vol 2. Boca Raton: CRC Press, pp. 1-272.
2. Blocksma. R and Braley, S. (1965) The silicone in plastic surgery. Plast. Reconstr. Surg., 35(4), 366-370.
3. Braley, S.A, Jr (1964) The medical silicones. Trans. Am. Soc. Artif Int. Organs, 10, 240-243.
4. Weiner, S.R and Paulus, H.E. (1986) Chronic arthropathy occurring after augmentation mammaplasty. Plast. Reconstr. Surg., 77(2), 185-192.
5. Ward, T.e. and Perry, J.T. (1981) Dynamic mechanical properties of medical grade silicone elastomer stored in simulated body fluids. J. Biomed. Mater. Res., 15 511-525.
6. Homsy, C.A (1970). Bio-compatibility in selection of materials for implantation. J. Biomed. Mater. Res., 4,341-356.
7. Rigdon, RH. and Dricks, A (1975) Reaction associated with a silicone rubber gel: An experimental study. J. Biomed. Mater. Res., 9, 645-659.
8. Robertson, G. and Braley, S. (1973) Toxicologic studies, quality control, and efficacy of the silastic mammary prosthesis. Med. Instrum., 7(2), 100-103.
9. Boone, J.L. and Braley, S.A (1966) Resistance of silicone rubbers to body fluids. Rubber Chem. Technol., 39(4), 1293-1297.
10. Boone, J.L. (1966) Silicone rubber insulation for subdennally implanted devices. Med. Res. Eng., 5, 34-37.
11. Roggendorf, E. (1976) The biostability of silicone rubbers, a polyamide, and a polyester. J. Biomed Mater. Res., 10, 123-143.
12. Speirs, Ae. and Blocksma, R (1963) New implantable silicone rubbers. An experimental evaluation oftissue response. Plast. Reconstr. Surg., 31(2),166-175.

568 I LI __________ S_O_FT ___ T_IS_S_U_E_R_E_S_P_O_N_S_E_T_O __ S_IL_I_C_O_N_E_S __________ ~
13. Symmers, W.Stc. (1968) Silicone mastitis in 'topless' waitresses and some other varieties of foreign-body mastitis. Br. Med J., 3, 19-22.
14. Ortiz-Monasterio, F. and Trigos, I. (1972) Management of patients with complications from injections of foreign materials into the breasts. Plast. Reconstr. Surg., 50(1) 42-47.
15. Parsons, RW. and Thering, H.R (1977) Management of the silcone-injected breast. Plast. Reconstr. Surg., 60(4), 534-538.
16. Wilkie, T.F. (1977) Late development of granuloma after liquid silicone injections. Plast. Reconstr. Surg., 60(2), 179-188.
17. Pearl, R.M., Laub, D.R, and Kaplan, E.N. (1978) Complications following silicone injections for augmentation of the contours of the face. Plast Reconstr Surg, 61(6): 888-891.
18. Kozeny, G.A., Barbato, A.L., Bansal, V.K. et al. (1984) Hypercalcemia associated with silicone-induced granulomas. N. Engl. J. Med., 311(17), 1103-1105.
19. Andrews, J.M. (1966) Cellular behavior to injected silicone fluid: A preliminary report. Plast. Reconstr. Surg, 38(6), 581-583.
20. Ballantyne, D.L., Rees, T.D. and Seidman, I. (1965) Silicone fluid: Response to massive subcutaneous injections of dimethylpolysiloxane fluid in animals. Plast. Reconstr. Surg., 36(3), 330-338.
21. Ben-Hur, N. and Neuman, Z. (1965) Siliconoma - another cutaneous response to dimethylpolysiloxane. Experimental study in mice. Plast. Reconstr. Surg., 36(6), 629-631.
22. Rees, T.D., Platt, J., and Ballantyne, D.L. (1965) An investigation of cutaneous response to dimethylpolysiloxane (silicone liquid) in animals and humans - A preliminary report. Plast. Reconstr. Surg., 35(2), 131-139.
23. Travis, W.O., Balogh, K. and Abraham, J.L. (1985) Silicone granulomas: Report of three cases and review of the literature. Hum. Pathol., 16(1), 19-27.
24. Mason, J. and Apisarnthanarax, P. (1981) Migratory silicone granuloma. Arch. Dermatol., 117, 366-367.
25. Apesos, J. and Pope, T.L., Jr (1985) Silicone granuloma following closed capsulotomy of mammary prosthesis. Ann. Plast. Surg., 14(5),403-406.
26. Rees, T.D., Ballantyne, D.L., Seidman, I. et al. (1967) Visceral response to subcutaneous and intraperitoneal injections of silicone in mice. Plast. Reconstr. Surg., 39(4), 402-410.
27. Chastre, J., Basset, F., Viau, F. et al. (1983) Acute pneumonitis after subcutaneous injections of silicone in transsexual men. N. Engl. J. Med., 308(13), 764-767.
28. Ellenbogen, R. and Rubin, L. (1975) Injectable fluid silicone therapy: Human morbidity and mortality. J. Am. Med. Assoc., 234(3), 308-309.
29. Murakata, L.A. and Rangwala, A.F. (1989) Silicone lymphadenopathy with concomitant malignant lymphoma. J. Rheumatol., 16(11), 1480-1483.
30. Christie, AJ., Weinberger, K.A. and Dietrich, M. (1977) Silicone lymphadenopathy and synovitis. Complications of silicone elastomer finger joint prostheses. J. Am. Med. Assoc., 237(14), 1463-1464.
31. Kircher, T. (1980) Silicone lymphadenopathy. A complication of silicone elastomer finger joint prostheses. Hum. Pathol., 11(3), 240-244.

REFERENCES I I 569 ~------------------------------------------------------~
32. Benjamin, E. and Ahmed, A (1982) Silicone lymphadenopathy: A report of two cases, one with concomitant malignant lymphoma. Diagn. Histopathol., 5, 133-141.
33. Digby, J.M. (1982) Malignant lymphoma with intranodal silicone rubber particles following metacarpophalangeal joint replacements. Hand, 14(3), 326-328.
34. Endo, L.P., Edwards, N.L., Longley, S. et al. (1987) Silicone and rheumatic diseases. Semin. Arthritis Rheum., 17(2), 112-118.
35. Varga, J., Schumacher, H.R. and Jimenez, S.A (1989) Systemic sclerosis after augmentation mammoplasty with silicone implants. Ann. Intern. Med., 111(5), 377-383.
36. Vretsky, B.F., O'Brien, J.J., Courtiss E.H. et al. (1979) Augmentation mammaplasty associated with a severe systemic illness. Ann. Plast. Surg., 3(5), 445-447.
37. Nosanchuk, J.S. (1968) Injected dimethylpolysiloxane fluid: A study of antibody and histologic response. Plast. Reconstr. Surg., 42(6), 562-566.
38. Heggers, J.P., Kossovsky, N. and Parsons, R.W. et al. (1983) Biocompatibility of silicone implants. Ann. Plast. Surg., 11,38--45.
39. Pernis, B. and Paronetto, F. (1962) Adjuvant effect of silica (tridymite) on antibody production. Proc. Soc. Exp. BioI. Med., 110,390-392.
40. Miyoshi, K., Miyamura, T. and Kobayashi, Y. (1964) Hypergammaglobulinemia by prolonged adjuvanticity in man. Disorders developed after augmentation mammaplasty. Jpn Med. J., 2122, 9.
41. Yoshida, K. (1973) Post mammaplasty disorder as an adjuvant disease of man. Shikoku Acta Med., 29, 318.
42. Kumagai, Y., Abe, C. and Shiokawa, Y. (1979) Scleroderma after cosmetic surgery. Four cases of human adjuvant disease. Arthritis Rheum., 22(5), 532-537.
43. Kumagai, Y., Shiokawa, Y. and Medsger, T.A, Jr (1984) Clinical spectrum of connective tissue disease after cosmetic surgery. Arthritis Rheum., 27(1), 1-12.
44. Fock, K.M., Feng, P.H., Tey, B.H. (1984). Autoimmune disease developing after augmentation mammoplasty: Report of 3 cases. J. Rheumatol, 11(1), 98-100.
45. Okano, Y., Nishikai, M. and Sato, A (1984) Scleroderma, primary biliary cirrhosis, and Sjogren's syndrome after cosmetic breast augmentation with silicone injection: A case report of possible human adjuvant disease. Ann. Rheum. Dis., 43, 520-522.
46. van Nunen, S.A, Gatenby, P.A and Basten, A (1982) Post-mammoplasty connective tissue disease. Arthritis Rheum., 25(6), 694-697.
47. Baldwin, C.M., Jr, and Kaplan, E.N. (1983) Silicone-induced human adjuvant disease? Ann. Plast. Surg., 10,270-273.
48. Byron, M.A, Venning, V.A and Mowat, AG. (1984) Post-mammoplasty human adjuvant disease. Br. J. Rheumatot., 23(3), 227-229.
49. Vargas, A (1979) Shedding of silicone particles from inflated breast implants. Plast. Reconstr. Surg., 64(2), 252-253.
50. Walsh, F.W., Solomon, D.A, Espinoza, L.R. et at. (1989) Human adjuvant disease. A new cause of chylous effusions. Arch. Intern. Med., 149, 1194--1196.
51. Ziegler, V.V., Haustein, V.F., Mehlhorn, J. et al. (1986) Quarzinduzierte sklerodermie sklerodermie-ahnliches syndrom oder echte progressive sklerodermie? Dermatol. Mon. Schr., 172(2), 86-90.

570 I ~I __________ S_O_FT ___ T_IS_S_U_E_R_E_S_P_O_N_S_E_T_O __ S_IL_I_C_O_N_E_S __________ ~
52. Taura, N., Usa, T. and Eguchi, K. (1976) A case of human adjuvant disease. l. lap. Soc. Intern. Med., 65, 840-841.
53. Alusik, S., landova, R. and Gebauerova, M. (1989) Anticardiolipin syndrome in plastic surgery of the breast. Cor. Vasa, 31(2), 139-144.
54. Olesen, L.L., Ejlertsen, T. and Nielsen, l. (1991) Toxic shock syndrome following insertion of breast prostheses. Br. l. Surg., 78(5), 585-586.
55. Spiera, H. (1988) Scleroderma after silicone augmentation mammoplasty. l. Am. Med. Assoc., 260(2), 236-238.
56. Brozena, S.l., Fenske, N.A., Cruse, CW. et al. (1988) Human adjuvant disease following augmentation mammoplasty. Arch. Dermatol., 124, 1383-1386.
57. Gutierrez, F.l. and Espinoza, L.R. (1990) Progressive systemic sclerosis complicated by severe hypertension: Reversal after silicone implant removal. Am. l. Med., 89(3), 390-392.
58. Hitoshi, S., Ito, Y., Takehara, K. et al. (1991) A case of malignant hypertension and scleroderma after cosmetic surgery. lpn l. Med., 30(1), 97-100.
59. Sahn, E.E., Garen, P.D., Silver, R.M. et al. (1990) Scleroderma following augmentation mammoplasty. Report of a case and review of the literature. Arch. Dermatol., 126, 1198-1202.
60. Deapen, D.M., Pike, M.C, Casagrande, l.T. et al. (1986) The relationship between breast cancer and augmentation mammaplasty: An epidemiologic study. Plast. Reconstr. Surg., 77(3), 361-367.
61. May, D.S. and Stroup, N.E. (1991) The incidence of sarcomas of the breast among women in the United States, 1973-1986. Plast. Reconstr. Surg., 87(1), 193-194.
62. Fletcher, R.H., Fletcher, S.W. and Wagner, E.H. (1988) Cause. In: Collins, N., Eckhart, e., Chalew, G.N., eds. Clinical Epidemiology: The Essentials. Baltimore: Williams & Wilkens, pp. 208-225.
63. Pearson, CM. (1963) Experimental joint disease. Observations on adjuvantinduced arthritis. l. Chron. Dis., 16, 863-874.
64. Dugowson, CE., Daling, l., Koepsell, T.D. et al. (1992) Silicone breast implants and risk for rheumatoid-arthritis. Arthritis Rheum., 35, S66. (Abstract)
65. Gabriel, S.E., O'Fallon, W.M., Kurland, L.T. et al. (1994) Risk of connectivetissue diseases and other disorders after breast implantation. N. Engl. l. Med., 330, 1697-1702.
66. Hochberg, M.e., Perlmutter, D.L., White, B. et al. (1994) The association of augmentation mammoplasty with systemic sclerosis: Results from a multi-center case-control study. Arthritis Rheum., 37 (Supplement): S369 (Abstract).
67. Strom, B.L., Reidenberg, M.M., Freundlich, B. et al. (1994) Breast silicone implants and risk of systemic lupus erythematosus. l. Clin. Epidemiol. (in press).
68. Englert, H.l., Brooks, P. (1994) Scleroderma and augmentation mammoplasty - a causal relationship? Aust. NZ l. Med., 24, 74-80.
69. Burns, Cl., Laing, T.l., Gillespie, B.W. et al. (1996) The epidemiology of scleroderma among women: Assessment of risk from exposure to silicone and silica. l. Rheumatol., 23(11), 1904-1911.
70. Sanchez-Guerrero, l., Karlson, E.W., Colditz, G.A. et al. (1994) Silicone breast implants (SBI) and connective tissue disease (CTD). Arthritis Rheum, 37 (Supplement): S282 (Abstract).

REFERENCES I I 571 L-______________________________________________________ ~
71. Tan, E.M., Cohen, A.S., Fries, J.P. et at. (1982) The 1982 revised criteria for the classification of systemic lupus erythematosus. Arthritis Rheum, 25 (11), 1271-1277.
72. Schottenfeld, D., Burns, c.J., Gillespie, B.W. et al. (1995) The design of a population-based case-control study of systemic sclerosis (scleroderma): Commentary on the University of Michigan Study. 1. Clin. Epidemiol. 48(4), 583-586.

Index
Page numbers in bold refer to figures; those in italics refer to tables
A-S/3501 graphite/epoxy aging 259 moisture effects 259
Above knee tissues, elastic moduli 67 Adhesion
bioglass 142 titanium alloys 142
Age of donors, cortical bone 5 Al20 3 whisker-nickel, tensile
properties 265 Allografts 62 Alloys 427-9, 428
AgPd 207, 211 galvanic 427
NiCr 212-13, 213 chemical composition 213 corrosion resistance 212 properties 213
Pd 207, 211 precious metal 208-11, 208
bonding with ceramics 209 brazing 209 casting 208 heat treatment 208-9
Alumina 343-5 ceramic hip balls 341 chemical properties 343 clinical performance 345 dental implants 341 engineering properties 344 implants 340-1 physical properties 343
standards 344 wear resistance 343, 345
Aluminum/graphite, tensile strengths 263,264
Aluminum/silicon, tensile data 264 AluminumfThornel, mechanical
properties 263 Amalgamization 202 Amalgams 201-4, 201, 203, 204
chemical composition 201 copper content 202 corrosion 204
and wear 203-4 high copper type 204 mercury vapour release 204 mixed alloys 202 one-component 202 processing 203 properties 201-2, 201,203
Amino plastics, properties 248 Annulus fibrosus 49, 53 Antibiotics, metal interactions 435 Antibodies 514-15
antiserum 516 detecting 515-17, 516
in vivo testing 517 negative results 517 positive results 517
immunoglobins 515 Antigens 513
immobilization 516, 516 processing cell 513

574 I ~I _________________ I_N_D_EX ________________ ~
Antioxidants additives 258 low toxicity 255 synergism 258
Aorta compliance 91-2 hydrodynamic properties 91 morphometric properties 82 pressure/cross-sectional area 91 retraction 91, 92 tapered 82
Apatite parameters dentin 28 enamel 28
Aramid fibers 216-17, 217 disadvantages 216-17
Arc welding 155 filler metals 155
Arterial tissues change with age 83, 87 composition 85
Arterial wall, composition 82-8, 82, 83, 84, 85, 86, 87, 88
Arteries coronary, tensile properties 93 creep 94-6, 95 elastic modulus 90 hypertension 85, 87 mechanical properties 88-96, 89, 90,
91,93-4,94 morphometric properties 82 Reynolds number 82 stress relaxation 94-6, 95 tensile properties 92-3, 93
Articular cartilage 40 composition 41 compression 41-2, 42 lubrication 44-5 mechanical properties 41-5 permeability 44 Poisson's ratio 44 shear properties 43, 43 tensile properties 42-3, 43 tribologic properties 44-5 wear tests 45
Artificial saliva, repassivation rates 195,203
Asceptic loosening 507
Atherosclerosis 85, 88 Austenitic steels
chemical composition 146, 148, 150
machining 152 parameters 153
Autoclave molding 230-1 Autoimmune diseases 524
B/5505 boron/epoxy aging 259 moisture effects 259
Basal ganglia 70 Below knee tissues 68 Bending modulus, osteons 8, 8 Bioactive
bonding 355-7, 356, 357 ceramics, orthopaedics 406-17 compositions 357-8 glasses 355-63
bone bonding 361 clinical uses 362 physical properties 358, 359-60,
362 Bioactivity
definition 355 index 357
Bioceramics 340-52 ASTM standards 349 biocompatibility 348-51 dental applications 351-2 failure loads 357 ISO standards 349 manufacturers 351 orthopaedic applications 351 trade names 351
Biocompatibility 481-8 components 484-8 control of 487 definition 482-4 local host response 486, 487-8 material degradation 484-5
Biological degradation 410-16, 411-12, 416
animal experiments 410-15 calcium phosphate 411-12,
416 clinical applications 410-15

L-.. ________ I_N_D_EX ________ ----'I I 575
properties cobalt/chromium alloys 177, 177 titanium 197,197
Biomaterials, systemic effects 488 Biospan 315 Biospan-D 328 Biospan-S 328 Blastogenic factor 518 Blood 114--22
and cardiovascular devices 547 coagulation, proteins 122 metals in 430 physiochemical properties 115 velocity 82 vessels 81-101
atherosclerosis 99-100 changes with age 99 hypertension 99-100 transport properties 98, 98
Blood/materials interactions 545-52 Bone
cement 500 formation, interfacial 358
Bonelbiomaterial interfaces 507--8, 509
Boron fibers 217-18, 218 application 217 manufacturing technique 218 properties 218
Bovine bone, creep 10-11 Brain tissues 70-8
bulk modulus 72 composition 71 creep modulus 72, 75-fi density 72 diffusion properties 77--8 dimensions 71 elastic modulus 72, 73-4 electrical conductivity 77, 77 mass 71 mechanical stimuli 71 Poisson's ratio 72 shape 71 shear modulus 72, 73-4 stem 70 thermal properties 77, 77
Breast augmentation 558 scleroderma 566
subsequent diseases 558-9 causes 559--62, 562
systemic sclerosis 560 Breast implants
and connective tissue disease 563-7, 564
rheumatoid arthritis 565 silicone 566 systemic lupus erythematosus 565
Brittle fiber.Sic, properties 268 Bulk modulus, brain tissues 72
C-Flex TPE 333 Ca/P molar ratio
dentin 28 enamel 28
Calcium phosphates, and metallic ions 446-9, 44~ 447, 448, 449
Cancellous bone 15-21 Cancer 529-40
and metallic implants 539 Capillaries, morphometrics 82 Carbon fiber
precursors 218 properties 218 trade names 218
Carbon prostheses, mechanical properties of 260
Carbon/silicon nitride, properties 267 Carbons 464--75
atomic arrangement 466 biocompatibility 464 charcoal 465 composites 465, 471-2
filament wound 471 dental applications 472 fibers 465, 470 forms, mechanical properties 473 glassy 465, 469-70 in vivo 472 medical applications 473 orthopaedics 474 polymeric 465 pyrolitic 465, 467, 468
low-temperature 468, 469, 474--5 structures 464--5 vapour phase coatings 465, 470-1 vascular applications 472-4

576 I I~ _________________ I_N_D_EX ________________ ~
Carbo thane 330 Cardiac valves 550 Cardiovascular devices, and blood 547 Cartilage 40-5
articular 40 composition 40, 41 elastic 41
mechanical properties 45 fibrocartilage 41 hyaline 40 water content 40
Catheters 548 Causal association
analogy 562, 562 biologic plausibility 562, 562 consistency 562, 562 dose-response 562, 562 reversibility 562, 562 specificity 562, 562 strength 562, 562 temporality 562, 562
CCRso 139 Cell
adaptation 496 cultures 415
testing 415 mediated
immunity 520 responses 517-21
choice of test 518-19 migration inhibition 518
Cellular necrosis 491 Cement line, cortical bone 4 Cement-free implants 501, 502, 503--4
hip prostheses 503--4 knees 503--4 orthopaedic 503
Cementation 500-3, 501, 502 Centrifugal
casting 229-30 molding 236-8
release agents 236 Ceramics 266-8, 267, 268
calcium phosphate 406 flexural strength 268 fracture toughness 268 glass 267 hip balls 341
physical properties 358, 359....{jO, 362 processing 348
Cerebellum 70 Cerebrospinal fluid 70, 115
inorganic content 117 organic content 118 protein content 119
Cerebrum 70 Chemical vapour deposition 471 Chromium
corrosion 422 immunity 422 passivation 422
ChronoFlex 316 Cluster differentiation markers 514 Co20Cr15W10Ni, cold working 174 Co20Cr35NilOMo, heat treatment 174 Co29Cr5Mo
corrosion formation 176 nitrogen ion implantation 177 pH value 175
Co-based alloys chemical composition 167 international standards 167 physical properties 169 wrought 170
chemical composition 168 Coatings 440-5, 441, 442, 443, 443,
444, 445, 445 corrosion currents 443 HAp 446, 446, 448 hard ceramic 442 metallic 440 niobium 441 tantalum 441 titanium 441 ultra-thin 550
Cobalt/chromium alloys 167-77 arc welding 172-3, 172 biocompatibility 177 biological properties 177, 177 biomedical devices 169 brazing 172 cast
drilling parameters 171 mechanical properties 173 milling parameters 171 turning parameters 171
L--________ I_N_D_EX ________ ----'I I 577
casting temperature 169 classifying 169 corrosion and wear 175-7, 175, 176 drilling 170, 171 fatigue 174-5, 174, 175 grinding 172 lethal concentrations 177, 177 machining 170--2, 171 milling 170, 171 polarization current 176 polarization resistance 176 processing 169-73 repassivation time 176 sawing 170 thermal conductivity 170 turning 170, 171 wrought
drilling parameters 171 milling 171 turning 171
Collagen content, cartilage 40 cortical bone 3 immune response to 522 shrinkage temperature 3
Collagen/elastin ratio 86 Combined loading, cortical bone 9 Composites 214-68
classifying 214 fabrication 229--40 fibrous 214 laminar 214 in medicine 260--2 metal matrix 262-6 particulate 214 radiation resistance 257-8 reinforcements 262-3
Compression articular cartilage 41-2, 42 cortical bone 8 modulus
cortical bone 6--7 osteons 8, 8
Compressive strength dentin 31 enamel 30
Connective tissue disease, and breast implants 563-7, 564
Contact angles 457-8, 458 equilibrium 458 oxidized surfaces 458
Contamination of tissues 429-33 Continuous sheets 238-9
decorative 239 glass reinforcement 238-9
Coremer 316 Corethane 316 Corhesive 316 Corrosion 420--59
contamination of tissues 429-33 detection of ions 421 duration of implantation 428 grading scale 421 incidence of 421 materials purity 423--4 proteins 435, 438 Ti-15Zr-4Nb-2Ta-O.2Pd 425 and wear 194-7, 194, 195, 196, 197
cobalt/chromium alloys 175-7, 175,176
noble metals 211-12 Cortical bone 3-12
age of donors 5 collagen 3 combined loading 9 compression 8 compressive modulus 6--7 constituents 3, 4 creep 10--11 density 4 dry testing 5 elastic moduli 7 electromechanical behaviour 4-5 fatigue 11 health of donors 5 mineral 4 mineralization 6, 10 physical properties 4-5 Poisson's ratios 7 remodelling 11-12, 12 shear moduli 7 small specimens 7 stiffness 6--9 strain rate 8-9, 10
effects 10 strength 9

578 II L--_________ I_N_D_EX ________ --------'
tensile modulus 6-7 time to failure 11 viscoelastic damage 9 Young's modulus 7
cp-titanium, chemical composition 180
Creep bovine bone 10-11 cortical bone 10-11 modulus, brain tissues 72, 75-6
Critical surface tension 458 dentin 35 enamel 35
Curing agents amine 222-3 anhydride 222-3
accelerators 223 epoxide resins 222-4 polyamide 223-4
Cytokines, testing for 519-20
DAP, properties 247 Debris
accumulation 530 metallic 531
Definitions bioactivity 355 biocompatibility 482-4 elastomers 302 ligament 59 osseointegration 504 ply 225 repassivation 138 solubility 407 tendon 59 thermoplastic resins 220 thermoset resins 220 tribosystem 395
Degradation 530-1, 531 Density
brain tissues 72 cortical bone 4
Dental alloys
AgPd 207 composition of 205,206 high gold containing 205, 210 low gold containing 206, 210
Pd 207 precious 208
amalgams 135--6 implants 135, 136, 142 restoration 201-13
Dentin 24-36 apatite in 28 CalP molar ratio 28 constituents 25 elastic moduli 29 elemental composition 25 viscoelastic properties 29
Dentino-enamel junction (DEJ) 24 Diamond 469 Diaphysis, vs. metaphysis 9, 9 Diencephalon 70 Diffusion properties, brain tissues
77-8 Diluents 222
non reactive 222 reactive 222
Dimethypolysiloxane 556 Dissolution, in vitro 407-10 Donor age, soft tissues 61 Doppler results 66-7, 67 Drag coefficients, menisci 51 Drug delivery, implantable 483 Dry testing, cortical bone 5
Ear bones 6 ECDEL 308 Elastic
behaviour blood vessels 81 lymphatic vessels 81
cartilage 41 properties
invertebral discs 51-3, 52 menisci 51-3,52 trabecular bone 18
Elastin/collagen ratio 86 Elastomers 303-39
ASTM standards 338, 337 biocompatibility 302, 325-31, 339 copolyester
manufacturers 305 properties 305 trade names 305

INDEX I I 579 L-__________________________________________________________ ~
crosslinked 319-21 definition 302 dispersions
manufacturers 322-3 properties 322-3 trade names 322-3
equivalent 334 silicone 334, 335
HC silicone manufacturers 320 properties 320 trade names 320
LIM silicone manufacturers 321 properties 321 trade names 321
polypropylene-based manufacturers 309 properties 309 trade names 309
polyurethane 312-5 polyurethane-based 309
manufacturers 306-7 properties 306-7 trade names 306-7
PVC 317-8 silicone 319
high consistency 319 LIM 319
silicone adhesives manufacturers 324 properties 324 trade names 324
sterilization 338 methods 331-2
styrene-based manufacturers 313 properties 313 trade names 313
thermoplastic 305-27 types of 305-35 water absorption 333
Electrical conductivity, brain tissues 77,77
Electromechanical behaviour, cortical bone 4-5
Elemental composition dentin 25
enamel 25 surface enamel 26-7 whole enamel 26-7
Enamel 24-36 apatite in 28 apatite parameters 28 CaJP molar ratio 28 compressive strength 30 critical surface tension 35 elastic moduli 29 elemental composition 25 fracture toughness 32 hardness of fracture 33 mineral density 25 organic density 25 stress 30 surface, elemental composition 26-7 tensile strength 30 toughness 32 water density 25 wettability 34 whole, elemental composition 27 work of fracture 32
Endoprostheses hip 135 knee 135
Environmental stress cracking 273 Epoxy resins
curing agents 221, 222-4 description 250 end uses 250 properties 254
Equivalence 334-5 Experimental problems, trabecular
bone 18,21
Failure strains, trabecular bone 18 Fascia 59-62 Fatigue 189-93, 189, 190, 191, 192, 193
cobalUchromium alloys 174-5, 174, 175
cortical bone 11 porosity 11 stainless steels 161-2, 161, 162 and wear 393-4 Young's modulus 11
Female, fluid volume 120 Femoral articulating surface 48-9

580 I ~I __________________ IN_D_EX ________________ ~
Fiber-reinforced plastic pipe 229-30 Fiberglass, properties 248 Fibrocartilage 41, 48--55
anisotropy 48 composition 48--50, 49, 50 mechanical properties 45 structure 48--50, 49, 50
Fibrosis 494-5 Filament winding 233-4
storage tanks 235 Fillers
brazing temperatures 209 chemical composition 209
Flexural strength, dentin 31 Fluid volume
female 120 male 120
Fracture toughness dentin 32 enamel 32
Fractures, internal fixation, malignancies 537
Friction coefficients, implants 372-9 Furnace brazing, stainless steels 153
Glass ceramics 355-63 clinical uses 362 physical properties 358, 359-60,
362 Glass fibers 215-16,215,216
advantages 215 chemical composition 215 electrical properties 216 grades 215 mechanical properties 216 optical properties 216 physical properties 216 thermal properties 216
Glassy carbons 469-70 fabrication 469 mechanical properties 261 shrinkage 469
Graphite fibers 218, 218 Graphite-fiber-reinforced
thermoplastics, properties 245-6 Graphites 468-9
colloidal 468 manufacturing processes 468
natural 468 synthesized 468
Hand lay-up 229 HAp 407
bioresorption 414 degradation 410-15 dissolution rate 408 from marine coral 413 highly porous 413 precipitation 448 seeds 449
Haptens, immune response to 521 Haversian
remodelling 11-12 systems 4
HDPE, properties 252 Health of donors, cortical bone 5 Heart
pacemakers 137 valves 464, 467
Hip endoprostheses, fatigue strength 162 replacement, accelerated test data
261 Histochemical techniques 520-1 Human
adjuvant disease 558 calf, stress relaxation 67 dentition, structure of 24
Hyaline cartilage 40 Hydraulic
conductivity, blood vessels 81 permeability, menisci 51
Hydrocarbon polymers, stability 258 Hydrophilic polymers 548--9 Hydrothane 312 Hydroxy carbonate apatite 357
rate of formation 357 Hydroxyapatite, see HAp Hydroxyl radical 141 Hypertension 85, 87
Iliac vessels 98 Immune
complex reactions 515 responses 523-4
implants 513-25

L--________ I_N_D_EX ________ ------'I I 581
Implant surgery cold deformation 161 wire, mechanical properties
160 Implants
alumina 340-1 bone, in situ 502-3 calcium deposition 447, 447 cancer 529-40 carcinogenicity 532-3 cement-free 501, 502, 503-4 cemented 501 dental 142 exposure time 142 friction coefficients 372-9 hard tissue response 500-1 immune response 513-25 metallic
corrosion 420-59 surface roughness 142
oral 508 orthopaedic 508 osseointegrated 501, 503, 504-7 penetration rates 394 porous 143 retrieved 430, 431 site repairs 495-6 tribological conditions 372-9,
380-92 tribological properties 395
Inflammation 492-4, 493 characteristics 492, 493 chronic 492
Ingrowth behaviour 141-2 Injection molding 232-3
advantages 232-3 Intraocular lens, see lens Invertebral discs 48
adult shape 50 size 50
annulus fibrosus 49 elastic properties 51-3, 52 nucleus pulposus 49 shape 49, 50 stiffness 53 strength 53 viscoelastic behaviour 53-4, 54
Ion implantation 138 nitrogen in titanium 138
Ischemia 547
Joint replacements associated malignancies 534, 536 coefficient of friction 398 tribological conditions 398 wear factor 398
Kevlar 49 216 electrical properties 252 mechanical properties 217 shear properties 251 thermal properties 217, 252
Kraton 318-9
Laminates angle ply 227 properties 225-9
Large veins, morphometric properties 82
Latex, immune response to 521 LDPE, properties 252 Lead/graphite, properties 266 Length, arteries 82 Lens 106-11
capsule, mechanical properties 111 cataractous 110 chemical composition 107-9,108,
109 composition 106 density 110 dimensions 109-11
changes with age 109 force of contraction 111 inorganic ions content 108 optical properties 109-11 organic content 109 refractive index 110 spring constants 111 thickness of capsule 109 translenticular properties 111
Ligaments 474 Linear low density polyethylene 273 L TI carbon, mechanical properties
261 Lubrication 395

582 I ~I _________________ I_N_D_EX ________________ ~
Lymph inorganic content 117 organic content 118
Lymphocyte 514 proliferation 518 transformation factor 518
Lymphokines, testing for 519
Macrophage migration inhibition 558 Magnesiumlgraphite, mechanical
properties 266 Male, fluid volume 120 Malignancies, osseous 538 Malignant fibrous histiocytoma (MFA)
532, 538 Martensitic steels
chemical composition 146, 147 machining 152
parameters 153 Mass, brain tissues 71 Matched die molding 230-3 Materials
pre-screening 429 and tissue interaction 486
Matrix, materials 219, 262 Measuring, soft tissues 61 Mechanical stimuli, brain tissues 71 Medicaflex 313 Membranes 550-1 Menisci 48-54 Mesencephalon 70 Metal
cations, uptake efficiencies 431 inert gas welding (MIG) 172,172 oxides, physico-chemical properties
449,451 Metallic
biomaterials 135-43 adhesion strength 136 bioadhesion 139 biocompatibility 136, 139 corrosion 140
measurements 137 densities 137 inorganic reaction 140 organic reaction 140 polarization resistance 137 repassivation 138
testing 137 thermodynamic stability 141
dissolution products 445 implants
and cancer 539 corrosion 420-59 passive films 452-7, 453, 454, 455,
456 ions, and calcium phosphates 446-9,
447, 447, 448, 449 materials
alloys 424-6, 425, 426 in biological samples 429
Metals 549 in blood vessels 549 immune response to 523 thrombogenic 549
Metaphysis, vs. diaphysis 9, 9 Mineral
cortical bone 4 density
dentin 25 enamel 25
Mineralization, cortical bone 10 Modulus
soft tissues 60, 60 trabecular bone 16-18, 19, 20
Morphometries pUlmonary arteries 83 systemic circulation 82
Muscle mechanical properties 66-8, 67,
68 preservation 66 and skin 66-8 specimen preparation 66 tissue handling 66
Natural rubber 319 Neoplasia 531-2
malignant 531-2 Neutrophils 492 Ni45Ti, properties 198 Niobium 140 Noble metals 204-12, 205, 206, 207,
208,209,210,211,212 corrosion and wear 211-12 heat treatments 210

'---________ I_N_D_EX ________ -----'I I 583
polarization current 211 polarization resistance 211
Non-collagenous protein (NCP) 3 Nucleus pulposus 49 Nylons, properties 244-5
Organic density dentin 25 enamel 25
Orientation of tissue, soft tissues 61 Orthopaedics 406-17
bioactive ceramics 406-17 Osseointegration 501, 503, 504-7
calcium phosphates 506 ceramics 506 craniofacial skeleton 505-6 definition 504 interfaces 505 oral implants 505 polymers 506 press-fit fixation 506 surface irregularities 505
Ossicles 6 see also ear bones
Osteocalcin 4 Osteolysis 530, 530 Osteonectin 4 Osteons
bending modulus 8, 8 compression modulus 8, 8 secondary 4, 8, 8 strength 10 tension modulus 8, 8 torsional modulus 8, 8
Osteosarcoma 532 Oxide ceramics 341
applications 341 evaluation 341
Oxide formation 455 Co-Cr-Mo alloy 457, 457
PBT, properties 247 PEEK 219-20, 282-3
characteristics 282-3 chemical structure 287 processing conditions 295 properties 241 trade names 299
PEl, properties 242 Pellethane 314 Permeability
articular cartilage 44 dentin 33
PES 220 PET 281-2
chemical structure 287 physical properties 281 processing conditions 294 properties 247 trade names 299
Petrosals 6 see also temporal bones
Phagocytosis 492-3 frustrated 493
Physical properties, cortical bone 4-5
Physiochemical properties blood 115 cerebrospinal fluid 115 plasma 115 synovial fluid 115 tear fluid 115 whole blood 115
PIE 220 Plasma
concentration 121 diffusion coefficient 121 extinction coefficient 121 half-life 121 inorganic content 117 molecular weight 121 organic content 118 proteins
content 119 properties 121
sedimentation constant 121 Ply
definition 225 orientated 226 rotated 226 transverse, failure 228
PMMA, properties 251, 279 Pneumonitis 557 Poisson's ratio
articular cartilage 44 brain tissues 72

INDEX
cortical bone 7 trabecular bone 18
Polamideimides 219 Polarization resistance 194 Polurethane, processing conditions 292 Polyacetal 279-80
chemical structure 286 processing conditions 294 solvents 280 trade names 299
Polyacrylates 278-9 chemical structure 286 processing conditions 293 trade names 298-9
Polyamide-imide, properties 243 Polyamides 219, 277-8
aliphatic 277 chemical structure 286 processing conditions 293 trade names 298
Polyarylate, properties 243 Polyblend, polyurethane 314 Polycarbonate 219, 280-1
chemical resistance 281 chemical structure 286 processing conditions 294 properties 281 sheets, properties of 242 trade names 299
Polyester fiberglass-reinforced, properties 254 properties 249
Polyester resins 224-5 accelerators 224-5 catalysts 224-5
Polyether sulfones, see PES Polyetheretherketones, see PEEK Polyetherimides, see PEl Polyethylene 272-3
chemical structure 285 plastic, carcinogenicity 533 processing conditions 291 trade names 296 wear debris 430
Polyfluorocarbons, properties 251 Polyimides, properties 247 Polymer/carbon, mechanical properties
260
Polymers manufacturers 260 trade names 260
Polymethylmethacrylate carcinogenicity 533 immune response to 522-3
Polyphenylene sulfides, see PPS 220 Polypropylene 273-4
chemical structure 285 processing conditions 291 properties 241 trade names 296-7
Polysiloxane, immune response to 522 Polysulfone 283-4
characteristics 284 chemical structure 287 processing conditions 295 properties 244 trade names 300
Polytetrafluoroethylene see also PTFE chemical structure 285 processing conditions 292 trade names 297
Polyurethane 274-5 chemical structure 285 elastomers 275 polycarbonate-based
manufacturers 308 properties 308 trade names 308
trade names 297 Polyurethanes
blood pumps 548 immune response to 522 ventricular assist devices 548
Polyvinylchloride see also PVC chemical structure 286
Porosity, fatigue 11 Potential-pH diagrams 421-3, 422, 423
limitations 422 PPS
fabric reinforced 231 properties 243
Preservation muscle 66 skin 66

"----________ I_N_D_EX ________ -----ll I 585
Press-fit fixation 506 knee replacement 506
Prostheses, heart valves 261-2, 464 Proteins
adsorption 484 coagulation 122 complement system 122
PTFE 275--6 properties 252
Pulmonary arteries, morphometrics 83 Pultrusion 239-40 PVC 276-7
Elastichem 317 elastomers 317 Ellay 317 Geon 318 Multichem 318 plasticized 277
manufacturers 310--12 properties 310--12 trade names 310--12
processing conditions 293 Teknor Apex 318 trade names 298 unplasticized 277
Rate of loading, soft tissues 61 Reaction bonded silicon nitride, axial
strength 267 Reinforcement filaments
manufacturing techniques 218 properties 218
Remodelling cortical bone 11-12, 12 Haversian 11-12 tensile strength 12 ultimate strain 12 Young's modulus 12
Repassivation, definition 138 Residual compression, UHMWPE 393 Resin system, choice of 236, 239 Resins
cured polyester, properties 249 epoxy 221
description 250 end uses 250
polyester 224-5 properties 248
thermoplastic 220 thermoset 220 vinyl ester 221
Resistance welding 155, 156 Responses
allergic 513 cell mediated 517-21 cellular necrosis 491 chemically induced 490 hard tissue 500--10 hypersensitivity 513 immune 491, 523-4 local host 486, 487-8 minimal 490 neoplastic 491-2 pyhsically induced 491 soft tissue 490--7
silicone 556-67 specific immune 5l3-15
Retrieved implants 430, 431 oral 507
Reynolds number 82 aorta 82 arteries 82 capillaries 82 vena cava 82
Rheumatoid arthritis, breast implants 565
Sand blasting 172 Santoprene 304, 305 Sarlink 317 Secondary, osteons 4, 8, 8 Serum
levels, total hip arthroplasty 530, 530
metal concentrations 433 Shape
brain tissues 71 invertebral discs 49, 50
Shear modulus brain tissues 72, 73-4 cortical bone 7
Shear properties articular cartilage 43, 43 dentin 31
Shielded metal arc welding (SMA W) 172

586 I I~ _________________ I_N_D_EX ________________ ~
Shrinkage temperature, collagen 3 SiC/RBSN, axial strength 267 Silicon nitride, properties 267 Silicones
breast implants 566 cosmetic surgery 557 granulomatous hepatitis 557 immunologic reactions 556--7 migration 557 soft tissue response 556--67 systemic reactions 557-9
Sintering 426--7 Skeletal reconstructions 135 Skin
elastic moduli 66--7 forehead, indentation 67 mechanical properties 66--8, 67, 68 and muscle 66--8 preservation 66 specimen preparation 66 testing 520 tissue handling 66
Sliding materials 176 Soft tissues 59-62
allografts 62 autografts 62 cross-sectional area 59 donor age 61 gauge length 59-60 indentation 67-8 measuring 61 modulus 60, 60 orientation of tissue 61 rate of loading 61 stiffness 67 storage method 61 strain
at UTS 60, 60 energy density 60, 60
stress-strain curve 60 test environment 61 ultimate tensile strength (UTS) 60, 60 viscoelasticity 62
Solubility calcium phosphate 408 definition 407 isotherms 409 product constant 407
Specific immune response 513-15 Specimen preparation
muscle 66 skin 66
Spray-up 229 Stainless steels 145-65
arc welding 155 austenitic
mechanical properties 158 welding 156
brazing 153, 154 corrosion and wear 163-4, 163,
164 descaling 152 fatigue 161-2,161,162 ferritic, welding 156 heat treatment 151, 157, 160
hardness 161 hot working 151 implant surgery 149
mechanical properties 159 international standards 145 machining 152-3, 153
parameters 153 martensitic
mechanical properties 159 welding 156
medical instruments 146, 147, 150 properties 157
physical properties 150 processing 151-7, 153, 154, /55, 156,
157 resistance welding 155 sheet working 151 welding 155-6, 155 X2CrNiMol7133, mechanical
properties 160 Sterilization 455 Stiffness
cortical bone 6--9 invertebral discs 53
Storage method, soft tissues 61 Strain
energy density, soft tissues 60, 60 rate, cortical bone 8-9, 10
Strength cortical bone 9 invertebral discs 53

'---________ I_N_D_EX ________ ----'I I 587
osteons 10 trabecular bone 16-18, 19,20
Stress dentin 31 enamel 30 relaxation
human calf 67 trabecular bone 18
Stress-strain curve, soft tissues 60
Structure, fibrocartilage 48-50, 49, 50
Styrene polymer, properties 246 Superalloy MA956 442
polarization curves 443 Surface treatments 440-5, 441, 442,
443, 443, 444, 445, 445 Surfaces, blood contacting 551-2 Surgery, tissue overheating 507 Sutures
absorbable 483 mechanical properties 262
Sweat corrosion in 434-5, 436 ISO, electrochemical parameters
436 Synovial fluid 115
cellular composition 116 inorganic content 117 metallic concentrations 433 organic content 118 protein content 119
Synthetic polymers, immune response to 522-3
Systemic circulation, canine, morphometric
properties 84 sclerosis 558, 560
T cytoxic cell 514 Ta-oxide 140 Tantalum 140, 425-.Q
corrosion resistance 426 pentoxide, thickness 440
TCP 407 bioresorption 414 degradation 410-15 dissolution rate 408
Tear fluid 115
inorganic content 117 organic content 118
protein content 119 Tecoflex, polyurethane 314-15 Tecothane 315 Teknor Apex 318 Temporal bones 6 Tendons 59-.Q2, 474
definition 59 Tensile
modulus annulus fibrosus 53 cortical bone 6-7 menisci 52
modulus articular cartilage 42-3, 43 strength
dentin 31 enamel 30 menisci 51-2, 52 remodelling 12
Tension, modulus, osteons 8, 8 Test environment, soft tissues 61 Texin 315 Thermal properties, brain tissues 77, 77 Thermoforming 231 Thermoplastics 219-20, 270-300
amorphous 272 biocompatibility 272 branching 271 mechanical properties 288-9 molecular weight 271 physical properties 288 processability 270 states of 271-2 thermal properties 289-90 vulcanizates 304, 305
manufacturers 305 properties 305 trade names 306
Thornel/Kevlar, properties 253 Thromboembolism 547 Thromboresistance 551 Thrombus 546, 547 Ti6A14V
ageing 188 fatigue strength 190, 192

588 I ~I _________________ I_N_D_EX ________________ ~
fretting corrosion 196 notch factor 190 pin-on-disk test 196 plasma nitriding 189, 193 rotating bending failure 193 rotating bending strength 191 solution treatment 188 wear properties 197
Ti-6AI-4V contact angles 458 depassivation 442 dissolution 445 electrochemical characteristics 437 femural components 432 laser surface alloying 441 passivity currents 439, 439 and pure titanium, implants 445
Ti-6AI-4V-28 v/o SiC, tensile properties 265
Ti-6AI-4V-50 v/o BORSIC, properties 265
Ti-15Zr-4Nb-2Ta-0.2Pd 425 Time to failure, cortical bone 11 Tissues
density, trabecular bone 15 granulation 494 handling
muscle 66 skin 66
metals in 430, 433-4 vascularized 494, 494
TiTa30136 thermal coefficient 136
Titanium 140, 179-98 accumulation 430, 430 alloys 179-98
biological properties 197, 197 chemical composition 180 corrosion and wear 194-7, 194,
195, 196, 197 fatigue 189-93, 189, 190, 191, 192,
193 fracture toughness 188 friction data 396-7 hip endoprostheses 190 mechanical properties 187, 188 physical properties 180--1,180,181 wear data 396-7
anodic, electrochemical data 195 anodized, corrosion rate 438-9, 439 biological properties 197, 197 cold deformation 186 corrosion 423
formation 197 resistance 436-40, 437, 437 and wear 194-7, 194, 195, 196,
197 cutting 184 deformation temperatures 182 descaling 183 dissolution 452, 454 fatigue 189-93,189,190,191,192,
193 galvanic corrosion 195 hot working 181-2, 182 immunity 423 implant in bone 453 international standards 179 machining 183-4, 184 mechanical properties 186-9, 186,
187, 188, 189 milling 184 oxide
films 456 sterilization 455 thickness 440
passivation 423 corrosion rate 438-9, 439
physical properties 180--1, 180, 181 plates 141 polarization current 194 processing 181-6, 182, 184 pure
physical properties 180 potential-time curves 437
repassivation time 194, 196 sheet working 183 soldering and brazing 185 surface characteristics 456 thermal heating 444 wear properties 197 welding 185-6
Torsional modulus, osteons 8, 8 Total hip
arthroplasty 393, 530, 530 cancer risk 539

'--________ I_N_D_EX ________ ----'I I 589
endoprosthesis 341 replacements 139
Toughness dentin 32 enamel 32
Toxicity additives 255 plasticizers 255 polymer stabilizers 255
Trabecular bone 15-21 composition 16 elastic properties 18 experimental problems 18,21 failure strains 18 mechanical properties 15 modulus 16-18, 19, 20 Poisson's ratio 18 strength 16-18, 19, 20 stress relaxation 18 tissue density 15 viscoelastic properties 18 volume fraction 15 Young's modulus 16-18, 19,20
Transfer molding 232 Tribologic properties, articular
cartilage 44-5 Tribosystem, definition 395 Trica1cium phosphate, see TCP Tubing 548 Tumorigenesis, solid state 492 Tumors
analysis of 536-7,537 implant-related 533-6, 65346, 65366 prosthetic replacement 537 titanium implant 537
Tungsten inert gas welding (TIG) 172, 172
UHMWPE 273 Ultimate
strain, remodelling 12 stress, annulus fibrosus 53 tensile strength (UTS), soft tissues
60, 60 Ultra high molecular weight
polyethylene, see UHMWPE Urine, metal concentrations 433 Usui process 238
Vanadium 136 Vapor-deposited carbon, mechanical
properties 261 Vapour phase coatings 465, 470--1 Vascular grafts 552 Vascular wall, layers 89 Veins
canine jugular 96 human saphenous 96 mechanical properties 96-8, 96, 97 tensile properties 97-8, 97
Vena cava, morphometric properties 82
Venous tissues changes with age 88, 89 constituents 88, 88
Ventricular system 70 Vinyl ester resins 221 Viscoelastic
behaviour invertebral discs 53-4, 54 menisci 53-4, 54
damage, cortical bone 9 properties, trabecular bone 18
Viscoelasticity quasi-linear 62 soft tissues 62
Vitallium 136, 537 Vitreous body 125-9
age of protein content 128 animal 126 axial length 128 compliance 129 gel and liquid volume 128 inorganic ions content 127 nature of 125 organic content 127 physical properties 126 radiation 129 rheology 129 viscosity 129 water content 125
Vitreous humor, see vitreous body Volume fraction, trabecular bone 15
Wall thickness 82 Water
content, cartilage 40

590 I I~ _________________ I_N_D_EX ________________ ~ density
dentin 25 enamel 25
permeability, blood vessels 81 Wear 364-99
abrasive 365 Rabinowicz model 367 Zum Gahr model 367
adhesive 365 Archard equation 366 Hornbogen equation 366
artificial joints 364 ASTM standards 371 clinical 393 corrosive 365
Quinn model 368 debris, release of 487 delamination 365 fatigue 365, 393--4
Halling model 368 fretting 365 problems 394-5 rates 380-92 testing
in vitro 369-92 machines 371 test apparatus 370
Welding 185-6 diffusion 186 electron beam 186 spot 186
Wet lay-up 234-6 Wettability
dentin 35 enamel 34
Whole blood cellular composition 116 inorganic content 117 organic content 118
Whole enamel, elemental composition 26-7
Work of fracture dentin 32 enamel 32
Wounds, healing 494-5
X2CrNiMo17133 corrosion production 163 electrochemical data 164 fatigue limit 161 heat treatment 165 mechanical properties 160 polarization current 163 polarization resistance 163 repassivation time 164 shear strength 165 wear testing 164
Young's modulus cortical bone 7 fatigue 11 remodelling 12 trabecular bone 16-18, 19, 20
Zinc, mechanical properties 266 Zinc/graphite, mechanical properties
266 Zirconia 345-8, 346, 347
biocompatibility 349 chemical stability 347-8 clinical performance 348 engineering properties 344 fracture toughness 346-7 mechanical properties 342, 346 partially stabilized 345 standards 344 tetragonal polycrystals 345 wear resistance 347-8


