30
HANDBOOK OF PRODUCTION SCHEDULING

HANDBOOK OF PRODUCTION SCHEDULING

Recent titles in the INTERNATIONAL SERIES IN OPERATIONS RESEARCH & MANAGEMENT SCIENCE
Frederick S. Hillier, Series Editor, Stanford University
Maros/ COMPUTATIONAL TECHNIQUES OF THE SIMPLEX METHOD Harrison, Lee & Neale/ THE PRACTICE OF SUPPLY CHAIN MANAGEMENT: Where Theory and
Application Converge Shanthikumar, Yao & ZijnV STOCHASTIC MODELING AND OPTIMIZATION OF
MANUFACTURING SYSTEMS AND SUPPLY CHAINS Nabrzyski, Schopf & W^glarz/ GRID RESOURCE MANAGEMENT: State of the Art and Future
Trends Thissen & Herder/ CRITICAL INFRASTRUCTURES: State of the Art in Research and Application Carlsson, Fedrizzi, & Fuller/ FUZZY LOGIC IN MANAGEMENT Soyer, Mazzuchi & Singpurwalla/ MATHEMATICAL RELIABILITY: An Expository Perspective Chakravarty & Eliashberg/ MANAGING BUSINESS INTERFACES: Marketing, Engineering, and
Manufacturing Perspectives Talluri & van Ryzin/ THE THEORY AND PRACTICE OF REVENUE MANAGEMENT Kavadias & Loch/PROJECT SELECTION UNDER UNCERTAINTY: Dynamically Allocating
Resources to Maximize Value Brandeau, Sainfort & Pierskalla/ OPERATIONS RESEARCH AND HEALTH CARE: A Handbook of
Methods and Applications Cooper, Seiford & Zhu/ HANDBOOK OF DATA ENVELOPMENT ANALYSIS: Models and
Methods Luenberger/ LINEAR AND NONLINEAR PROGRAMMING, 2'"' Ed. Sherbrooke/ OPTIMAL INVENTORY MODELING OF SYSTEMS: Multi-Echelon Techniques,
Second Edition Chu, Leung, Hui & Cheung/ 4th PARTY CYBER LOGISTICS FOR AIR CARGO Simchi-Levi, Wu & Shenl HANDBOOK OF QUANTITATIVE SUPPLY CHAIN ANALYSIS:
Modeling in the E-Business Era Gass & Assad/ AN ANNOTATED TIMELINE OF OPERATIONS RESEARCH: An Informal History Greenberg/ TUTORIALS ON EMERGING METHODOLOGIES AND APPLICATIONS IN
OPERATIONS RESEARCH Weber/ UNCERTAINTY IN THE ELECTRIC POWER INDUSTRY: Methods and Models for
Decision Support Figueira, Greco & Ehrgott/ MULTIPLE CRITERIA DECISION ANALYSIS: State of the Art
Surveys Reveliotis/ REAL-TIME MANAGEMENT OF RESOURCE ALLOCATIONS SYSTEMS: A Discrete
Event Systems Approach Kail & Mayer/ STOCHASTIC LINEAR PROGRAMMING: Models, Theory, and Computation Sethi, Yan & Zhang/ INVENTORY AND SUPPLY CHAIN MANAGEMENT WITH FORECAST
UPDATES Cox/ QUANTITATIVE HEALTH RISK ANALYSIS METHODS: Modeling the Human Health Impacts
of Antibiotics Used in Food Animals Ching & Ng/ MARKOV CHAINS: Models, Algorithms and Applications Li & Sun/NONLINEAR INTEGER PROGRAMMING Kaliszewski/ SOFT COMPUTING FOR COMPLEX MULTIPLE CRITERIA DECISION MAKING Bouyssou et al/ EVALUATION AND DECISION MODELS WITH MULTIPLE CRITERIA:
Stepping stones for the analyst Blecker & Friedrich/ MASS CUSTOMIZATION: Challenges and Solutions Appa, Pitsoulis & Williams/ HANDBOOK ON MODELLING FOR DISCRETE OPTIMIZATION
* A list of the early publications in the series is at the end of the book *

HANDBOOK OF PRODUCTION SCHEDULING
Edited by
JEFFREY W. HERRMANN University of Maryland, College Park
^ Spri ineer g

Jeffrey W. Herrmann (Editor) University of Maryland USA
Library of Congress Control Number: 2006922184
ISBN-10: 0-387-33115-8 (HB) ISBN-10: 0-387-33117-4 (e-book)
ISBN-13: 978-0387-33115-7 (HB) ISBN-13: 978-0387-33117-1 (e-book)
Printed on acid-free paper.
© 2006 by Springer Science+Business Media, Inc. All rights reserved. This work may not be translated or copied in whole or in part without the written permission of the publisher (Springer Science + Business Media, Inc., 233 Spring Street, New York, NY 10013, USA), except for brief excerpts in connection with reviews or scholarly analysis. Use in connection with any form of information storage and retrieval, electronic adaptation, computer software, or by similar or dissimilar methodology now know or hereafter developed is forbidden. The use in this publication of trade names, trademarks, service marks and similar terms, even if the are not identified as such, is not to be taken as an expression of opinion as to whether or not they are subject to proprietary rights. Chapter 10 reprinted by permission, Dawande, M., J. Kalagnanam, H. S. Lee, C. Reddy, S. Siegel, M. Trumbo, The slab-design problem in the steel industry. Interfaces 34(3) 215-225, May-June 2004. Copyright 2004, the Institute for Operations Research and the Management Sciences (INFORMS), 901 Elkridge Landing Road, Suite 400, Linthicum, Maryland 21090-2909 USA
Printed in the United States of America.
9 8 7 6 5 4 3 2 1
springer.com

Dedication
This book is dedicated to my family, especially
my wife Laury and my parents Joseph and Cecelia, Their love and encouragement
are the most wonderful of the many blessings
that God has given to me.

Contents
Dedication v
Contributing Authors ix
Preface xiii
Acknowledgments xvii
A History of Production Scheduling 1 JEFFREY W. HERRMANN
The Human Factor in Planning and Scheduling 23 KENNETH N. MCKAY, VINCENT C.S. WIERS
Organizational, Systems and Human Issues in Production Planning, Scheduling and Control 59 BART MACCARTHY
Decision-Making Systems in Production Scheduling 91 JEFFREY W. HERRMANN
Scheduling and Simulation 109 JOHN W. FOWLER, LARS MONCH, OLIVER ROSE
Rescheduling Strategies, Policies, and Methods 135 JEFFREY W. HERRMANN

viii Handbook of Production Scheduling
A Practical View of the Complexity in Developing Master Production Schedules: Fundamentals, Examples, and Implementation 149 GUILHERME E R N A N I VIEIRA
Coordination Issues in Supply Chain Planning and Scheduling 177 STEPHAN KREIPL, JORG THOMAS DICKERSBACK, MICHAEL PINEDO
Semiconductor Manufacturing Scheduling and Dispatching 213 MiCHELE E. PFUND, SCOTT J. MASON, JOHN W. FOWLER
The Slab Design Problem in the Steel Industry 243 MiLiND DAWANDE, JAY ANT KALAGNANAM, HO SOO LEE, CHANDRA REDDY, STUART SIEGEL, MARK TRUMBO
A Review of Long- and Short-Term Production Scheduling at LKAB's Kiruna Mine 265 ALEXANDRA M. NEWMAN, MICHAEL MARTINEZ, MARK KUCHTA
Scheduling Models for Optimizing Human Performance and Well-being 287 E M M E T T J. LODREE, JR., BRYAN A. NORMAN
Index 315

Contributing Authors
Milind Dawande University of Texas at Dallas
Jorg Thomas Dickersbach SAP AG
John W. Fowler Arizona State University
Jeffrey W. Herrmann University of Maryland, College Park
Jayant Kalagnanam IBM T. J. Watson Research Center
Stephan Kreipl SAP AG
Mark Kuchta Colorado School of Mines
Ho Soo Lee IBM T. J. Watson Research Center
Emmett J. Lodree, Jr. Auburn University

Handbook of Production Scheduling
Bart MacCarthy University of Nottingham
Michael Martinez Colorado School of Mines
Scott J. Mason University of Arkansas
Kenneth N. McKay University of Waterloo
Lars Monch Technical University of Ilmenau
Alexandra Newman Colorado School of Mines
Bryan A. Norman University of Pittsburgh
Michele E. Pfund Arizona State University
Michael Pinedo New York University
Chandra Reddy IBM T. J. Watson Research Center
Oliver Rose Technical University of Dresden
Stuart Siegel IBM T. J. Watson Research Center
Mark Trumbo IBM T. J. Watson Research Center
Guilherme E. Vieira Pontifical Catholic University of Parana

Handbook of Production Scheduling xi
Vincent C.S. Wiers Eindhoven University of Technology

Preface
The purpose of the book is to present scheduHng principles, advanced tools, and examples of innovative scheduling systems to persons who could use this information to improve production scheduling in their own organization.
The intended audience includes the following persons: • Production managers, plant managers, industrial engineers, operations
research practitioners; • Students (advanced undergraduates and graduate students) studying
operations research and industrial engineering; • Faculty teaching and conducting research in operations research and
industrial engineering. The book concentrates on real-world production scheduling in factories
and industrial settings, not airlines, hospitals, classrooms, project scheduling, or other domains. It includes industry case studies that use innovative techniques as well as academic research results that can be used to improve real-world production scheduling.
The sequence of the chapters begins with fundamental concepts of production scheduling, moves to specific techniques, and concludes with examples of advanced scheduling systems.
Chapter 1, "A History of Production Scheduling," covers the tools used to support decision-making in real-world production scheduling and the changes in the production scheduling systems. This story covers the charts developed by Henry Gantt and advanced scheduling systems that rely on sophisticated software. The goal of the chapter is to help production schedulers, engineers, and researchers understand the true nature of production scheduling in dynamic manufacturing systems and to encourage

xiv Handbook of Production Scheduling
them to consider how production scheduling systems can be improved even more.
Chapter 2, "The Human Factor in Planning and Scheduling," focuses on the persons who do production scheduling and reviews some important results about the role of these persons. The chapter presents guidelines for designing decision support mechanisms that incorporate the individual and organizational aspects of planning and scheduling.
Chapter 3, "Organizational, Systems and Human Issues in Production Planning, Scheduling and Control," discusses system-level issues that are relevant to production scheduling and highlights their importance in modem manufacturing organizations.
Chapter 4, "Decision-making Systems in Production Scheduling," looks specifically at the interactions between decision-makers in production scheduling systems. The chapter presents a technique for representing production scheduling processes as complex decision-making systems. The chapter describes a methodology for improving production scheduling systems using this approach.
Chapter 5, "Scheduling and Simulation," discusses four important roles for simulation when improving production scheduling: generating schedules, evaluating parameter settings, emulating a scheduling system, and evaluating deterministic scheduling approaches. The chapter includes a case study in which simulation was used to improve production scheduling in a semiconductor wafer fab.
Chapter 6, "Rescheduling Strategies, Policies, and Methods" reviews basic concepts about rescheduling and briefly reviews a rescheduling framework. Then the chapter discusses considerations involved in choosing between different rescheduling strategies, policies, and methods.
Chapter 7, "Understanding Master Production Scheduling from a Practical Perspective: Fundamentals, Heuristics, and Implementations," is a helpful discussion of the key concepts in master production scheduling and the techniques that are useful for finding better solutions.
Chapter 8, "Coordination Issues in Supply Chain Planning and Scheduling," discusses the scheduling decisions that are relevant to supply chains. The chapter presents practical approaches to important supply chain scheduling problems and describes an application of the techniques.
Chapter 9, "Semiconductor Manufacturing Scheduling and Dispatching," reviews the state-of-the-art in production scheduling of semiconductor wafer fabrication facilities. Scheduling these facilities, which has always been difficult due to the complex process flow, is becoming more critical as they move to automated material handling.
Chapter 10, "The Slab-design Problem in the Steel Industry," discusses an interesting production scheduling problem that adds many unique

Handbook of Production Scheduling xv
constraints to the traditional problem statement. This chapter presents a heuristic solution based on matching and bin packing that a large steel plant uses daily in mill operations.
Chapter 11, "A Review of Long- and Short-Term Production Scheduling at LKAB's Kiruna Mine," discusses the use of mathematical programming to solve large production scheduling problems at one of the world's largest mines. The chapter discusses innovative techniques that successfully reduce solution time with no significant decrease in solution quality.
Chapter 12, "Scheduling Models for Optimizing Human Performance and Well-being," covers how scheduling affects the persons who have to perform the tasks to be done. The chapter includes guidelines on work-rest scheduling, personnel scheduling, job rotation scheduling, cross-training, and group and team work. It also presents a framework for research on sequence-dependent processing times, learning, and rate-modifying activities.
The range of the concepts, techniques, and applications discussed in these chapters should provide practitioners with useful tools to improve production scheduling in their own facilities.
The motivation for this book is the desire to bridge the gap between scheduling theory and practice. I first faced this gap, which is discussed in some of the chapters of this book, when investigating production scheduling problems motivated by semiconductor test operations and developing a job shop scheduling tool for this setting.
It has become clear that solving combinatorial optimization problems is a very small part of improving production scheduling. Dudek, Panwalkar, and Smith {Operations Research, 1992), who concluded that the extensive body of research on flowshop sequencing problems has had "limited real significance," suggest that researchers have to step back frequently from the research and ask: "Will this work have value? Are there applications? Does this help anyone solve a problem?"
More generally, Meredith {Operations Research, 2001) describes a "realist" research philosophy that yields a body of knowledge that is not connected to reality. Unfortunately, this describes scheduling research too well. To avoid this problem, Meredith instructs us to validate models against the real world and with the managers who have the problems.
Therefore, in addition to the practical goal stated above, it is my hope that this book, by highlighting scheduling research that is closely tied to a variety of practical issues, will inspire researchers to focus less on the mathematical theory of sequencing problems and more on the real-world production scheduling systems that still need improvement.
Jeffrey W. Herrmann

Acknowledgments
A book such as this is the result of a team effort. The first to be thanked, of course, must be authors who contributed their valuable time to produce the interesting chapters that comprise this volume. I appreciate their effort to develop chapters, write and revise the text, and format the manuscripts appropriately. Thanks also to Charles Carr, Ken Fordyce, Michael Fu, Chung-Yee Lee, and Vincent Wiers for their useful comments about draft versions of the chapters.
I would like to thank Fred Hillier for inviting me to edit this handbook. It is an honor to be a part of this distinguished series. My thanks also go to Gary Folven and Carolyn Ford, who taught me a great deal about editing and producing a handbook. It has been a pleasure working with them.
In addition to everything else she does to care for our family, my wife Laury provided useftil and timely editorial assistance. I am grateful for her excellent help.
Chung-Yee Lee, my advisor, has been and continues to be an exceptional influence on my development as a researcher, teacher, and scholar. I appreciate his indispensable support and guidance over the last 15 years.
Finally, I am indebted to my family and to the wonderful friends, colleagues, teachers, and students whom I have known. All have added something valuable to my life.

Chapter 1
A HISTORY OF PRODUCTION SCHEDULING
Jeffrey W. Herrmann University of Maryland, College Park
Abstract: This chapter describes the history of production scheduling in manufacturing facilities over the last 100 years. Understanding the ways that production scheduling has been done is critical to analyzing existing production scheduling systems and finding ways to improve them. The chapter covers not only the tools used to support decision-making in real-world production scheduling but also the changes in the production scheduling systems. This story goes from the first charts developed by Henry Gantt to advanced scheduling systems that rely on sophisticated algorithms. The goal of the chapter is to help production schedulers, engineers, and researchers understand the true nature of production scheduling in dynamic manufacturing systems and to encourage them to consider how production scheduling systems can be improved even more. This chapter not only reviews the range of concepts and approaches used to improve production scheduling but also demonstrates their timeless importance.
Key words: Production scheduling, history, Gantt charts, computer-based scheduling
INTRODUCTION
This chapter describes the history of production scheduling in manufacturing facilities over the last 100 years. Understanding the ways that production scheduling has been done is critical to analyzing existing production scheduling systems and finding ways to improve them.
The two key problems in production scheduling are, according to Wight (1984), "priorities" and "capacity." In other words, "What should be done first?" and "Who should do it?" Wight defines scheduling as "establishing the timing for performing a task" and observes that, in a manufacturing firms, there are multiple types of scheduling, including the detailed scheduling of a shop order that shows when each operation must start and

2 Chapter 1
complete. Cox et al. (1992) define detailed scheduling as "the actual assignment of starting and/or completion dates to operations or groups of operations to show when these must be done if the manufacturing order is to be completed on time." They note that this is also known as operations scheduling, order scheduling, and shop scheduling. This chapter is concerned with this type of scheduling.
One type of dynamic scheduling strategy is to use dispatching rules to determine, when a resource becomes available, which task that resource should do next. Such rules are common in facilities where many scheduling decisions must be made in a short period of time, as in semiconductor wafer fabrication facilities (which are discussed in another chapter of this book).
This chapter discusses the history of production scheduling. It covers not only the tools used to support decision-making in real-world production scheduling but also the changes in the production scheduling systems. This story goes from the first charts developed by Henry Gantt to advanced scheduling systems that rely on sophisticated algorithms. The goal of the chapter is to help production schedulers, engineers, and researchers understand the true nature of production scheduling in dynamic manufacturing systems and to encourage them to consider how production scheduling systems can be improved even more. This review demonstrates the timeless importance of production scheduling and the range of approaches taken to improve it.
This chapter does not address the sequencing of parts processed in high-volume, repetitive manufacturing systems. In such settings, one can look to JIT and lean manufacturing principles for how to control production. These approaches generally do not need the same type of production schedules discussed here.
Although project scheduling will be discussed, the chapter is primarily concerned with the scheduling of manufacturing operations, not general project management. Note finally that this chapter is not a review of the production scheduling literature, which would take an entire volume.
For a more general discussion of the history of manufacturing in the United States of America, see Hopp and Spearman (1996), who describe the changes since the First Industrial Revolution. Hounshell (1984) provides a detailed look at the development of manufacturing technology between 1800 and 1932. McKay (2003) provides a historical overview of the key concepts behind the practices that manufacturing firms have adopted in modem times, highlighting, for instance, how the ideas of just-in-time (though not the term) were well-known in the early twentieth century.
The remainder of this chapter is organized as follows: Section 2 discusses production scheduling prior to the advent of scientific management. Section 3 describes the first formal methods for production scheduling.

A History of Production Scheduling 3
many of which are still used today. Section 4 describes the rise of computer-based scheduling systems. Section 5 discusses the algorithms developed to solve scheduling problems. Section 6 describes some advanced real-world production scheduling systems. Section 7 concludes the chapter and includes a discussion of production scheduling research.
2. FOREMEN RULE THE SHOP
Although humans have been creating items for countless years, manufacturing facilities first appeared during the middle of the eighteenth century, when the First Industrial Revolution created centralized power sources that made new organizational structures viable. The mills and workshops and projects of the past were the precursors of modem manufacturing organizations and the management practices that they employed (Wilson, 2000a). In time, manufacturing managers changed over the years from capitalists who developed innovative technologies to custodians who struggle to control a complex system to achieve multiple and conflicting objectives (Skinner, 1985).
The first factories were quite simple and relatively small. They produced a small number of products in large batches. Productivity gains came from using interchangeable parts to eliminate time-consuming fitting operations. Through the late 1800s, manufacturing firms were concerned with maximizing the productivity of the expensive equipment in the factory. Keeping utilization high was an important objective. Foremen ruled their shops, coordinating all of the activities needed for the limited number of products for which they were responsible. They hired operators, purchased materials, managed production, and delivered the product. They were experts with superior technical skills, and they (not a separate staff of clerks) planned production. Even as factories grew, they were just bigger, not more complex.
Production scheduling started simply also. Schedules, when used at all, listed only when work on an order should begin or when the order is due. They didn't provide any information about how long the total order should take or about the time required for individual operations (Roscoe and Freark, 1971). This type of schedule was widely used before usefiil formal methods became available (and can still be found in some small or poorly run shops). Limited cost accounting methods existed. For example, Binsse (1887) described a method for keeping track of time using a form almost like a Gantt chart.
Informal methods, especially expediting, have not disappeared. Wight (1984) stated that "production and inventory management in many

4 Chapter 1
companies today is really just order launching and expediting." This author's observation is that the situation has not changed much in the last 20 years. In some cases, it has become worse as manufacturing organizations have created bureaucracies that collect and process information to create formal schedules that are not used.
3. THE RISE OF FORMAL SYSTEMS
Then, beginning around 1890, everything changed. Manufacturing firms started to make a wider range of products, and this variety led to complexity that was more than the foremen could, by themselves, handle. Factories became even larger as electric motors eliminated the need to locate equipment near a central power source. Cost, not time, was the primary objective. Economies of scale could be achieved by routing parts from one functional department to another, reducing the total number of machines that had to purchased. Large move batches reduced material handling effort. Scientific management was the rational response to gain control of this complexity. As the next section explains, planners took over scheduling and coordination from the foremen, whose empire had fallen.
3.1 The production control office
Frederick Taylor's separation of planning from execution justified the use of formal scheduling methods, which became critical as manufacturing organizations grew in complexity. Taylor proposed the production planning office around the time of World War I. Many individuals were required to create plans, manage inventory, and monitor operations. (Computers would take over many of these functions decades later.) The "production clerk" created a master production schedule based on firm orders and capacity. The "order of work clerk" issued shop orders and released material to the shop (Wilson, 2000b).
Gantt (1916) explicitly discusses scheduling, especially in the job shop environment. He proposes giving to the foreman each day an "order of work" that is an ordered list of jobs to be done that day. Moreover, he discusses the need to coordinate activities to avoid "interferences." However, he also warns that the most elegant schedules created by planning offices are useless if they are ignored, a situation that he observed.
Many firms implemented Taylor's suggestion to create a production planning office, and the production planners adapted and modified Gantt's charts. Mitchell (1939) discusses the role of the production planning department, including routing, dispatching (issuing shop orders) and

A History of Production Scheduling 5
scheduling. Scheduling is defined as "the timing of all operations with a view to insuring their completion when required." The scheduling personnel determined which specific worker and machine does which task. However, foremen remained on the scene. Mitchell emphasizes that, in some shops, the shop foremen, who should have more insight into the qualitative factors that affect production, were responsible for the detailed assignments. Muther (1944) concurs, saying that, in many job shops, foremen both decided which work to do and assigned it to operators.
3.2 Henry Gantt and his charts
The man uniquely identified with production scheduling is, of course, Henry L. Gantt, who created innovative charts for production control. According to Cox et al (1992), a Gantt chart is "the earliest and best known type of control chart especially designed to show graphically the relationship between planned performance and actual performance." However, it is important to note that Gantt created many different types of charts that represented different views of a manufacturing system and measured different quantities (see Table 1-1 for a summary).
Gantt designed his charts so that foremen or other supervisors could quickly know whether production was on schedule, ahead of schedule, or behind schedule. Modem project management software includes this critical function even now. Gantt (1919) gives two principles for his charts: 1. Measure activities by the amount of time needed to complete them; 2. The space on the chart can be used to represent the amount of the activity
that should have been done in that time. Gantt (1903) describes two types of "balances": the man's record, which
shows what each worker should do and did do, and the daily balance of work, which shows the amount of work to be done and the amount that is done. Gantt's examples of these balances apply to orders that will require many days to complete.
The daily balance is "a method of scheduling and recording work," according to Gantt. It has rows for each day and columns for each part or each operation. At the top of each column is the amount needed. The amount entered in the appropriate cell is the number of parts done each day and the cumulative total for that part. Heavy horizontal lines indicate the starting date and the date that the order should be done.
The man's record chart uses the horizontal dimension for time. Each row corresponds to a worker in the shop. Each weekday spans five columns, and these columns have a horizontal line indicating the actual working time for each worker. There is also a thicker line showing the the cumulative working time for a week. On days when the worker did not work, a one-

6 Chapter 1
letter code indicates the reason (e.g., absence, defective work, tooling problem, or holiday).
Table 1-1. Selected Gantt charts used for production scheduling. Chart Type
Daily balance
of work
Man's Record
Machine
Record
Layout chart
Gantt load chart
Gantt progress
chart
Schedule Chart
Progress chart
Order chart
Unit
Part or
operation
Worker
Machine
Machine
Machine type
Order
Tasks in a job
Product
Order
Quantity being
measured
Number
produced
Amount of
work done each
day and week,
measured as
time
Amount of
work done each
day and week,
measured as
time
Progress on
assigned tasks,
measured as
time
Scheduled tasks
and total load to
date
Work
completed to
date, measured
as time
Start and end of
each task
Number
produced each
month
Number
produced each
month
Representation
of time
Rows for each
day; bars
showing start
date and end
date
3 or 5 columns
for each day in
two weeks
3 or 5 columns
for each day in
two weeks
3 or 5 columns
for each day in
two weeks
One column for
each day for
two months
One column for
each day for
two months
Horizontal axis
marked with 45
days
5 columns for
each month for
one year
5 columns for
each month for
one year
Sources
Gantt, 1903;
Rathe, 1961
Gantt, 1981;
Rathe, 1961
Gantt, 1919,
1981;
Rathe, 1961
Clark, 1942
Mitchell, 1939
Mitchell, 1939
Muther, 1944
Gantt, 1919,
1981;
Rathe, 1961
Gantt, 1919,
1981;
Rathe, 1961

A History of Production Scheduling 7
Gantt's machine record is quite similar. Of course, machines are never absent, but they may suffer from a lack of power, a lack of work, or a failure.
McKay and Wiers (2004) point out that Gantt's man record and machine record charts are important because they not only record past performance but also track the reasons for inefficiency and thus hold foremen and managers responsible. They wonder why these types of charts are not more widely used, a fact that Gantt himself lamented (in Gantt, 1916).
David Porter worked with Henry Gantt at Frankford Arsenal in 1917 and created the first progress chart for the artillery ammunition shops there. Porter (1968) describes this chart and a number of similar charts, which were primarily progress charts for end items and their components. The unit of time was one day, and the charts track actual production completed to date and clearly show which items are behind schedule. Highlighting this type of exception in order to get management's attention is one of the key features of Gantt's innovative charts.
Clark (1942) provides an excellent overview of the different types of Gantt charts, including the machine record chart and the man record chart, both of which record past performance. Of most interest to those studying production scheduling is the layout chart, which specifies "when jobs are to be begun, by whom, and how long they will take." Thus, the layout chart is also used for scheduling (or planning). The key features of a layout chart are the set of horizontal lines, one line for each unique resource (e.g., a stenographer or a machine tool), and, going across the chart, vertical lines marking the beginning of each time period. A large "V" at the appropriate point above the chart marks the time when the chart was made. Along each resource's horizontal line are thin lines that show the tasks that the resource is supposed to do, along with each task's scheduled start time and end time. For each task, a thick line shows the amount of work done to date. A box with crossing diagonal lines shows work done on tasks past their scheduled end time. Clark claims that a paper chart, drawn by hand, is better than a board, as the paper chart "does not require any wall space, but can be used on a desk or table, kept in a drawer, and carried around easily." However, this author observes that a chart carried and viewed by only one person is not a useful tool for communication.
As mentioned before, Gantt's charts were adapted in many ways. Mitchell (1939) describes two types of Gantt charts as typical of the graphical devices used to help those involved in scheduling. The Gantt load chart shows (as horizontal lines) the schedule of each machine and the total load on the machine to date. Mitchell's illustration of this doesn't indicate which shop orders are to be produced. The Gantt progress chart shows (as horizontal lines) the progress of different shop orders and their due dates.

8 Chapter 1
For a specific job, a schedule chart was used to plan and track the tasks needed for that job (Muther, 1944). Various horizontal bars show the start and end of subassembly tasks, and vertical bars show when subassemblies should be brought together. Filling in the bars shows the progress of work completed. Different colors are used for different types of parts and subassemblies. This type of chart can be found today in the Gantt chart view used by project management software.
In their discussion of production scheduling, Roscoe and Freark (1971) give an example of a Gantt chart. Their example is a graphical schedule that lists the operations needed to complete an order. Each row corresponds to a different operation. It lists the machine that will perform the operation and the rate at which the machine can produce parts (parts per hour). From this information one can calculate the time required for that operation. Each column in the chart corresponds to a day, and each operation has a horizontal line from the day and time it should start to the day and time it should complete. The chart is used for measuring progress, so a thicker line parallel to the first line shows the progress on that operation to date. The authors state that a "Gantt chart is essentially a series of parallel horizontal graphs which show schedules (or quotas) and accomplishment plotted against time."
For production planning, Gantt used an order chart and a progress chart to keep track of the items that were ordered from contractors. The progress chart is a summary of the order charts for different products. Each chart indicates for each month of the year, using a thin horizontal line, the number of items produced during that month. In addition, a thick horizontal line indicates the number of items produced during the year. Each row in the chart corresponds to an order for parts from a specific contractor, and each row indicates the starting month and ending month of the deliveries.
In conclusion, it can be said that Gantt was a pioneer in developing graphical ways to visualize schedules and shop status. He used time (not just quantity) as a way to measure tasks. He used horizontal bars to represent the number of parts produced (in progress charts) and to record working time (in machine records). His progress (or layout) charts had a feature found in project management software today: the length of the bars (relative to the total time allocated to the task) showed the progress of tasks.
3.3 Loading, boards, and lines of balance: other tools
While Gantt charts remain one of the most common tools for planning and monitoring production, other tools have been developed over the years, including loading, planning boards, and lines of balance.
Loading is a scheduling technique that assigns an operation to a specific day or week when the machine (or machine group) will perform it

A History of Production Scheduling 9
(MacNiece, 1951). Loading is finite when it takes into account the number of machines, shifts per day, working hours per shift, days per week as well as the time needed to complete the order.
MacNiece (1951) also discusses planning boards, which he attributes to Taylor. The board described has one row of spaces for each machine, and each row has a space for each shift. Each space contains one or more cards corresponding to the order(s) that should be produced in that shift, given capacity constraints. A large order will be placed in more than one consecutive space. MacNiece also suggests that one simplify scheduling by controlling the category that has the smallest quantity, either the machines or the products or the workers. Cox et al. (1992) defines a control board as "a visual means of showing machine loading or project planning." This is also called a dispatching board, a planning board, or a schedule board.
The rise of computers to solve large project scheduling problems (discussed in the next section) did not eliminate manual methods. Many manufacturing firms sought better ways to create, update, visualize, and communicate schedules but could not (until much later) afford the computers needed to run sophisticated project scheduling algorithms. Control boards of various types were the solution, and these were once used in many applications. The Planalog control board was a sophisticated version developed in the 1960s. The Planalog was a board (up to six feet wide) that hung on a wall. (See Figure 1-1.) The board had numerous rows into which one could insert gauges of different lengths (from 0.25 to 5 inches long). Each gauge represented a different task (while rows did not necessarily represent resources). The length of each gauge represented the task's expected (or actual) duration. The Planalog included innovative "fences." Each fence was a vertical barrier that spanned multiple rows to show and enforce the precedence constraints between tasks. Moving a fence due to the delay of one task required one to delay all subsequent dependent tasks as well.
Also of interest is the line of balance, used for determining how far ahead (or behind) a shop might be at producing a number of identical assemblies required over time. Given the demand for end items and a bill-of-materials with lead times for making components and completing subassemblies, one can calculate the cumulative number of components, subassemblies, and end items that should be complete at a point in time to meet the demand. This line of balance is used on a progress chart that compares these numbers to the number of components, subassemblies, and end items actually done by that point in time (See Figure 1-2). The underlying logic is similar to that used by MRP systems, though this author is unaware of any scheduling system that use a line of balance chart today. More examples can be found in O'Brien (1969) and Production Scheduling (1973).

10 Chapter 1
Also of interest is the line of balance, used for determining how far ahead (or behind) a shop might be at producing a number of identical assemblies required over time. Given the demand for end items and a bill-of-materials with lead times for making components and completing subassemblies, one can calculate the cumulative number of components, subassemblies, and end items that should be complete at a point in time to meet the demand. This line of balance is used on a progress chart that compares these numbers to the number of components, subassemblies, and end items actually done by that point in time (See Figure 1-2). The underlying logic is similar to that used by MRP systems, though this author is unaware of any scheduling system that use a line of balance chart today. More examples can be found in O'Brien (1969) and Production Scheduling (1973).
Figure 1-1. Detail of a Planalog control board (photograph by Brad Brochtrup).

A History of Production Scheduling 11
Figure 1-2. A line of balance progress chart (based on O'Brien, 1969). The vertical bars show, for each part, the number of units completed to date, and the thick line shows the
number required at this date to meet planned production.
FROM CPM TO MRP: COMPUTERS START SCHEDULING
Unlike production scheduling in a busy factory, planning a large construction or systems development project is a problem that one can formulate and try to optimize. Thus, it is not surprising that large project scheduling was the first type of scheduling to use computer algorithms successfully.
4.1 Pr oj ect scheduling
O'Brien (1969) gives a good overview of the beginnings of the critical path method (CPM) and the Performance Evaluation and Review Technique (PERT). Formal development of CPM began in 1956 at Du Pont, whose research group used a Remington Rand UNIVAC to generate a project schedule automatically from data about project activities.
In 1958, PERT started in the office managing the development of the Polaris missile (the U.S. Navy's first submarine-launched ballistic missile). The program managers wanted to use computers to plan and monitor the Polaris program. By the end of 1958, the Naval Ordnance Research Calculator, the most powerful computer in existence at the time, was

12 Chapter 1
programmed to implement the PERT calculations. Both CPM and PERT are now common tools for project management.
4.2 Production scheduling
Computer-based production scheduling emerged later. Wight (1984) lists three key factors that led to the successful use of computers in manufacturing:
1. IBM developed the Production Information and Control System starting in 1965.
2. The implementation of this and similar systems led to practical knowledge about using computers.
3. Researchers systematically compared these experiences and developed new ideas on production management.
Early computer-based production scheduling systems used input terminals, centralized computers (such as an IBM 1401), magnetic tape units, disk storage units, and remote printers (O'Brien, 1969). Input terminals read punch cards that provided data about the completion of operations or material movement. Based on this status information, the scheduling computer updated its information, including records for each machine and employee, shop order master lists, and workstation queues. From this data, the scheduling computer created, for each workstation, a dispatch list (or "task-to-be-assigned list") with the jobs that were awaiting processing at that workstation. To create the dispatch list, the system used a rule that considered one or more factors, including processing time, due date, slack, number of remaining operations, or dollar value. The dispatcher used these lists to determine what each workstation should do and communicate each list to the appropriate personnel. Typically, these systems created new dispatch lists each day or each shift. Essentially, these systems automated the data collection and processing fiinctions in existence since Taylor's day.
Interactive, computer-based scheduling eventually emerged from various research projects to commercial systems. Godin (1978) describes many prototype systems. An early interactive computer-based scheduling program designed for assembly line production planning could output graphs of monthly production and inventory levels on a computer terminal to help the scheduling personnel make their decisions (Duersch and Wheeler, 1981). The software used standard strategies to generate candidate schedules that the scheduling personnel modified as needed. The software's key benefit was to reduce the time needed to develop a schedule. Adelsberger and Kanet (1991) use the term leitstand to describe an interactive production scheduling decision support system with a graphical display, a database, a schedule generation routine, a schedule editor, and a schedule evaluation

A History of Production Scheduling 13
routine. By that time, commercial leitstands were available, especially in Germany. The emphasis on both creating a schedule and monitoring its progress (planning and control) follows the principles of Henry Gantt. Similar types of systems are now part of modem manufacturing planning and control systems and ERP systems.
Computer-based systems that could make scheduling decisions also appeared. Typically, such systems were closely connected to the shop floor tracking systems (now called manufacturing execution systems) and used dispatching rules to sequence the work waiting at a workstation. Such rules are based on attributes of each job and may use simple sorting or a series of logical rules that separate jobs into different priority classes.
The Logistics Management System (LMS) was an innovative scheduling system developed by IBM for its semiconductor manufacturing facilities. LMS began around 1980 as a tool for modeling manufacturing resources. Modules that captured data from the shop floor, retrieved priorities from the daily optimized production plan (which matched work-in-process to production requirements and reassigned due dates correspondingly), and made dispatching decisions were created and implemented around 1984. When complete, the system provided both passive decision support (by giving users access to up-to-date shop floor information) and proactive dispatching, as well as issuing alerts when critical events occurred. Dispatching decisions were made by combining the scores of different "advocates" (one might call them "agents" today). Each advocate was a procedure that used a distinct set of rules to determine which action should be done next. Fordyce et al. (1992) provide an overview of the system, which was eventually used at six IBM facilities and by some customers (Fordyce, 2005).
Computer-based scheduling systems are now moving towards an approach that combines dispatching rules with finite-capacity production schedules that are created periodically and used to guide the dispatching decisions that must be made in real time.
4.3 Production planning
Meanwhile, computers were being applied to other production planning functions. Material requirements planning (MRP) translates demand for end items into a time-phased schedule to release purchase orders and shop orders for the needed components. This production planning approach perfectly suited the computers in use at the time of its development in the 1970s. MRP affected production scheduling by creating a new method that not only affected the release of orders to the shop floor but also gave schedulers the

14 Chapter 1
ability to see future orders, including their production quantities and release dates. Wight (1984) describes MRP in detail.
The progression of computer-based manufacturing planning and control systems went through five distinct stages each decade from the 1960s until the present time (Rondeau and Litteral, 2001). The earliest systems were reorder point systems that automated the manual systems in place at that time. MRP was next, and it, in turn, led to the rise of manufacturing resources planning (MRP II), manufacturing execution systems (MES), and now enterprise resource planning (ERP) systems. For more details about modem production planning systems, see, for instance, Vollmann, Berry, and Whybark (1997).
4.4 The implementation challenge
Modem computer-based scheduling systems offer numerous features for creating, evaluating, and manipulating production schedules. (Seyed, 1995, provides a discussion on how to choose a system.) The three primary components of a scheduling system are the database, the scheduling engine, and the user interface (Yen and Pinedo, 1994). The scheduling system may share a database with other manufacturing planning and control systems such as MRP or may have its own database, which may be automatically updated from other systems such as the manufacturing execution system. The user interface typically offers numerous ways to view schedules, including Gantt charts, dispatch lists, charts of resource utilization, and load profiles. The scheduling engine generates schedules and may use heuristics, a rule-based approach, optimization, or simulation.
Based on their survey of hundreds of manufacturing facilities, LaForge and Craighead (1998) conclude that computer-based scheduling can be successful if it uses finite scheduling techniques and if it is integrated with the other manufacturing planning systems. Computer-based scheduling can help manufacturers improve on-time delivery, respond quickly to customer orders, and create realistic schedules. Finite scheduling means using actual shop floor conditions, including capacity constraints and the requirements of orders that have already been released. However, only 25% of the firms responding to their survey used finite scheduling for part or all of their operations. Only 48% of the firms said that the computer-based scheduling system received routine automatically from other systems, while 30% said that a "good deal" of the data are entered manually, and 21% said that all data are entered manually. Interestingly, 43% of the firms said that they regenerated their schedules once each day, 14%) said 2 or 3 times each week, and 34% said once each week.

A History of Production Scheduling 15
More generally, the challenge of implementing effective scheduling systems remains, as it did in Gantt's day (see, for instance, Yen and Pinedo, 1994, or Ortiz, 1996). McKay and Wiers (2005) argue that implementation should be based on the amount of uncertainty and the ability of the operators in the shop to recover from (or compensate for) disturbances. These factors should be considered when deciding how the scheduling system should handle uncertainty and what types of procedures it should use.
5. BETTER SCHEDULING ALGORITHMS
Information technology has had a tremendous impact on how production scheduling is done. Among the many benefits of information technology is the ability to execute complex algorithms automatically. The development of better algorithms for creating schedules is thus an important part of the history of production scheduling. This section gives a brief overview that is follows the framework presented by Lenstra (2005). Books such as Pinedo (2005) can provide a more detailed review as well as links to surveys of specific subareas.
5.1 Types of algorithms
Linear programming was developed in the 1940s and applied to production planning problems (though not directly to production scheduling). George Dantzig invented the simplex method, an extremely powerful and general technique for solving linear programming problems, in 1947.
In the 1950s, research into sequencing problems motivated by production scheduling problems led to the creation of some important algorithms, including Johnson's rule for the two-machine flowshop, the earliest due date (EDD) rule for minimizing maximum lateness, and the shortest processing time (SPT) rule for minimizing average flow time (and the ratio variant for minimizing weighted flow time).
Solving more difficult problems required a different approach. Branch-and-bound techniques appeared around 1960. These algorithms implicitly enumerated all the possible solutions and found an optimal solution. Meanwhile, Lagrangean relaxation, column generation techniques for linear programming, and constraint programming were developed to solve integer programming problems.
The advent of complexity theory in the early 1970s showed why some scheduling problems were hard. Algorithms that can find optimal solutions to these hard problems in a reasonable amount of time are unlikely to exist.
16 Chapter 1
Since decision-makers generally need solutions in a reasonable amount of time, search algorithms that could find near-optimal solutions became more important, especially in the 1980s and 1990s. These included local search algorithms such as hillclimbing, simulated annealing, and tabu search. Other innovations included genetic algorithms, ant colony optimization, and other evolutionary computation techniques. Developments in artificial intelligence led to agent-based techniques and rule-based procedures that mimicked the behavior of a human organization.
5.2 The role of representation
Solving a difficult problem is often simplified by representing it in the appropriate way. The representation may be a transformation into another problem that is easy to solve. More typically, the representation helps one to find the essential relationships that form the core of the challenge. For instance, when adding numbers, we place them in a column, and the sum is entered at the bottom. When doing division, however, we use the familiar layout of a long division problem, with the divisor next to the dividend, and the quotient appears above the bar. For more about the importance of representation in problem-solving, see Simon (1981), who discussed the role of representation in design.
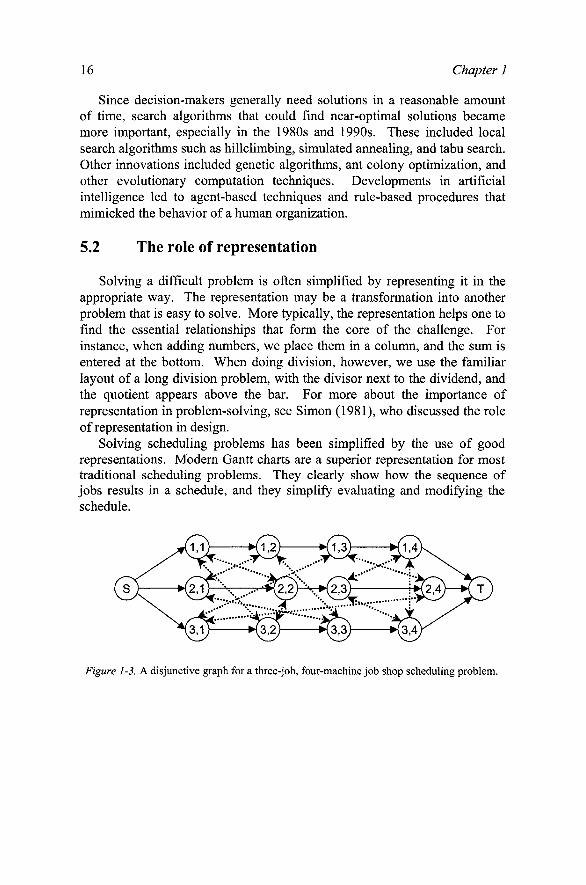
Solving scheduling problems has been simplified by the use of good representations. Modem Gantt charts are a superior representation for most traditional scheduling problems. They clearly show how the sequence of jobs results in a schedule, and they simplify evaluating and modifying the schedule.
Figure 1-3. A disjunctive graph for a three-job, four-machine job shop scheduling problem.


![Design Luenberger Observer for an Electromechanical Actuator · 2018. 12. 21. · Luenberger Observer for Sensor Monitoring in Active Front Steering Systems can be found in [11].](https://static.documents.pub/doc/80x56/60dd732ee1b46834544d5cdf/design-luenberger-observer-for-an-electromechanical-actuator-2018-12-21-luenberger.jpg)


