171
HANDBOOK ON Master Sampling Frames for Agricultural Statistics Frame Development, Sample Design and Estimation

HANDBOOK ON
Master Sampling Frames for Agricultural StatisticsFrame Development, Sample Design and Estimation

Cover photo: ©FAO/Danfung Dennis©FAO/BPS Indonesia©FAO/Munir Uz Zaman
December 2015
HANDBOOK ON
Master Sampling Frames for Agricultural StatisticsFrame Development, Sample Design and Estimation


iii
Contents
Acronyms vii
Glossary of main technical terms ix
Preface xvii
Acknowledgments xix
Overview xxi
1. Defining the Master Sampling Frame for agricultural statistics – basic principles 11.1. Introduction 1
1.2. Core crop items 3
1.3. Core livestock items 5
1.4. Core socioeconomic data 6
1.5. Core land cover items 7
1.6. Defining a sampling frame 8
1.7. Defining Multiple Frame Sampling 11
1.8. The vision for developing the Master Sampling Frame 12
1.9. Defining the integrated survey framework 13
2. Background information required to develop and use the Master Sampling Frame 15
3. Sample design considerations when developing a Master Sampling Frame 193.1. Overview 193.2. Introductory concepts 20
3.2.1. The Gambia’s national agricultural sample survey 21
3.2.2. The US agricultural resource management survey 22
3.3. Sampling variability and probability samples 233.4. Probability sampling designs 26
3.4.1. Simple random sampling 26
3.4.2. Systematic sampling 26
3.4.3. Replicated sampling 27
3.4.4. PPS sampling 27
3.4.5. Multivariate probability-proportional-to-size (MPPS) 28
3.4.6. Cluster sampling 29
3.4.7. Two-stage sampling 29
3.4.8. Stratified sampling 29
4. Summary 31
4. Guidelines on the use of technology for sample frame development 334.1. Geographic Information Systems (GIS) 33
4.2.1. Types of layers in a GIS 33
4.2.2. Projections 34
4.2.3. Geo-referencing elements in a list frame 34
4.2.4. Using GIS-based administrative registers as a basis to define an area sampling frame 354.2.5. Administrative units: 35
4.2. Global Navigation Satellite Systems and Global Positioning Systems 37

iv
4.2.1. Using GPS to define a sampling frame 37
4.2.2. Using GPS to run a survey (field work) 374.3. Remote sensing 39
4.3.1. Main types of satellite images 39
4.3.2. Aerial photographs 405. Summary 41
5. Using list frames to build and use Master Sampling Frames 435.1. Introduction 435.2. Using list frames to build master sampling frames 46
5.2.1. Using population census data to build Master Sampling Frames 46
5.2.2. Using agricultural censuses to build Master Sampling Frames 51
5.2.3. Using business registers of farms to build a Master Sampling Frames 52
5.2.4. Characteristics of list frames 545.3. Main issues arising from the use of list frames to build MSF frames and how to address them 57
5.3.1. Advantages and disadvantages of list frames 57
5.3.2. Association between frame units and population units 58
5.3.3. Inferences made from list frames exhibiting multiplicity. 60
5.3.4. Dealing with imperfections in list frames 61
5.3.5. Non-sampling errors in list frames 635.4. Maintaining and updating list frames 64
6. Guidelines on developing and using an area sampling frame 676.1. Area sampling frames: general concept and main types. 676.2. Types of units in an area sampling frame 69
6.2.1. Segments 69
6.2.2. Points 71
6.2.3. Transects 746.3. Tools to improve the sampling efficiency 76
6.3.1. Stratification 76
6.3.2. Single- and multi-stage sampling 77
6.3.3. Multi-phase sampling 77
6.3.4. Systematic sampling 78
6.4. Observation/reporting mode 796.4.1. Direct observations 79
6.4.2. Sampling farms using an area frame 806.5. Non-sampling errors in an area sampling frame 876.6. Linking area frames with census or administrative information: the use of enumeration areas 88
7. Multiple Frame Sampling 897.1. Overview 897.2. Principles of Multiple Frame Sampling 917.3. Problems in the application of Multiple Frame Surveys 947.4. Estimation of domain parameters 967.5. Dual frame estimator 98
7.5.1. Hartley and the screening estimator 98
7.5.2. The Fuller-Burmeister estimator 99
7.5.3. The Skinner-Rao estimator 100
7.5.4. Single frame-type estimator 102

v
7.5.5. Choosing among dual-frame estimators 1028. Using auxiliary information 1039. Allocation of sample size to frames 10410. Scope and coverage of the list frame 106
8. Summary and general guidelines on implementing a Master Sampling Frame 107
References 111
Annex A: Understanding variance components in two-stage sampling designs 121
Annex B: How do sampling errors and non-sampling errors contribute to total survey variation? 123
Annex C: Country experiences 1271. BRAZIL 1272. CHINA 1313. ETHIOPIA 1334. EU MARS Project 1355. Eurostat Land Use and Cover Survey (LUCAS) 1366. GUATEMALA 1377. LESOTHO 1388. RWANDA 1399. THE UNITED STATES 14110. Summary of country experiences. 143
TABLES1.1: Review of sampling frames 8
1.2: Integrated sample design 14
3.1: Effect of correlation between item and measure of size, and the number of strata, on the relative
efficiency of stratified sampling 30
5.1: Types of area and list frames suitable for agricultural surveys 44
6.1: Observations generated by points sampled in the segment of Figure 6.13 83
FIGURES3.1: Illustration of the concept of sampling error. 23
3.2: Examples of non-sampling errors 24
5.1: Schemes of the four types of associations. 58
6.1: Example of a segment, in Rwanda, with a large number of fields. 69
6.2: PSU subdivided into several segments (USA) 70
6.3: Example of PSU with physical boundaries in Italy, with segments delineated within and the
SSU ultimately selected 70
6.4: Building an area frame with regular cells only requires definition of a regular grid 71
6.5: Example of second-stage sampling: a grid of points is sampled inside a square segment
(first-stage sampling unit) 72
6.6: Two-phase sample of points with incomplete stratification 73
6.7: Example of a sample of stripes in Sudan 74
6.8: Aerial photo in which nomadic livestock can be counted 74

vi
6.9: In landscapes with thin stripes, transects can be used for crop area estimation 75
6.10: Example of a square segment on a land cover map (blue lines) 77
6.11: Example of agricultural landscape with some farm headquarters 81
6.12: Tracts inside a square segment 82
6.13: Sampling farms (tracts) inside a square segment 84
6.14: Sampling farms by points 85
6.15: Example of an “extended segment” 87
7.1: Two overlapping frames that form three domains in a general dual-frame design. 91
7.2: Area and list frames forming two domains in agricultural dual-frame designs 92
7.3: Three overlapping frames forming seven domains in a multiple frame design 96
vii
AcronymsAFS Area Frame SamplingAGRIS Agriculture Integrated Survey AgRISTARS Agriculture and Resources Inventory Surveys through Aerospace Remote SensingCAPI Computer-Assisted Personal Interview CASI Computer-Assisted Self Interviewing CATI Computer-Assisted Telephone Interview CEAG Census of AgricultureEA Enumeration AreaEU European UnionFAO Food and Agriculture Organization of the United NationsGCES General Crop Estimation SurveysGHG Greenhouse Gas GHS General Household SurveyGIS Geographical Information Systems GNSS Global Navigation Satellite SystemGPS Global Positioning Systemha HectareHS Harmonized Commodity Description and Coding System ICC Indicative Crop ClassificationIFPRI International Food Policy Research InstituteIHSN International Household Survey NetworkIIA International Institute of Agriculture ILO International Labour OrganizationISIC International Standard Industrial Classification of All Economic Activities JAS June Agricultural Survey (NASS/USDA)JES June Enumerative Survey (NASS/USDA)LACIE Large Area Crop Inventory ExperimentLF List FrameLUCAS Land Use/Cover Area-frame SurveyLSMS Living Standards Measurement Survey LU Land Use MDG Millennium Development GoalMPPS Multivariate Probability Proportional to SizeMSF Master Sampling Frame NASS National Agricultural Statistics Service, USDANBS National Bureau of Statistics, TanzaniaNSDS National Strategy for the Development of Statistics NDVI Normalized Difference Vegetation IndexOYS Objective Yield SurveysPAPI Paper And Pen Interview PES Post Enumeration SurveyPPS Probability Proportional To SizePSU Primary Sampling UnitSNA System of National AccountsSPARS Strategic Plan for the Development of Agricultural and Rural Statistics

viii
SSU Secondary Sampling UnitUN United NationsUNFPA United Nations Population Fund UNSC United Nations Statistical Commission USDA United States Department of AgricultureUTM Universal Transverse MercatorWCA 2020 FAO World Programme for the Census of Agriculture 2020
ix
Glossary of main technical terms
Agricultural holder: natural person, group of natural persons or legal person who makes the major decisions regarding resource use and exercises management control over the agricultural holding’s operations (FAO WCA 2020). When the holder is a natural person, he/she is usually the head of the household and the person who makes the day-to-day decisions regarding the operation of the holding.
Agricultural holding: economic unit of agricultural production under single management, comprising all livestock kept and all land used wholly or partly for agricultural production purposes, without regard to title, legal form, or size (FAO WCA 2020).If the agricultural holding’s principal economic production activity is agricultural production, the agricultural holding is an establishment within the agricultural industry.
Agricultural land: total of cropland and permanent meadows and pastures (FAO WCA 2020). The scope of the Global Strategy to Improve Agricultural and Rural Statistics also includes land for aquaculture production.
Agro-forestry: sustainable land management system in which forest species of trees and other wooded plants are purposely grown on the same land as agricultural crops or livestock (FAO WCA 2020).
Arable land: land used in most years for growing temporary crops (FAO WCA 2020).
Area Sampling Frame: an area frame is a set of land elements, which may be either points or segments of land. The sampling process may involve single or multiple stages. In most agricultural area frame surveys, the sampling unit is associated with a holding.
Associated crop: a temporary crop grown in a compact plantation of permanent crops (FAO WCA 2020).
Census: statistical collection in which all units are enumerated(large sample-based collections may also be referred to as “sample censuses”). This also means that the relevant data collection includes the entire target population.
Census coverage: the geographical regions of a country covered by census activities. Countries may omit certain areas – for example urban areas, remote areas or those affected by security problems – for operational reasons (FAO WCA 2020). Holdings of less than a given cut-off point in terms of land area or other size-related variables (for example, household plots) may also be excluded.
Census of agriculture: statistical operation for collecting, processing and disseminating data on the structure and output of agriculture, covering the whole or a significant part of the country (FAO WCA 2020).
Census reference day: a point in time used for data collection on livestock numbers and inventory items (FAO WCA 2020).
Census reference year: period of twelve months, either a calendar year or an agricultural year, generally encompassing the various time reference dates or periods of data collection for individual census items (FAO WCA 2020).
Census scope: the types of agricultural production activities included in the agricultural census. The scope of the agricultural production industry can be interpreted very broadly, to cover not only crop and livestock production
x
activities but also forestry and fisheries production activities, as well as other food and agriculture-related activities (FAO WCA 2020).
Closed segment: a method for defining a reporting unit when the sampling unit is a segment of land selected from an area sampling frame. The reporting unit is a tract of land within the segment boundaries comprising all or part of a holding. The data are collected only for the land within the segment boundaries.
Cluster sampling: a sampling method having the aim of reducing frame development and data collection costs. The population is partitioned into primary units (clusters). Each primary unit is comprised of secondary units, which may be listings of farms, segments of land units or points in the case of agricultural surveys. Clusters are land areas which are defined either in administrative terms (villages, counties, etc.), geographical terms (using natural boundaries), or by using geo-referenced boundaries. A sample of clusters is selected, using any sampling method, and is surveyed in its entirety. This is referred to as a “complete cluster”. However, as indicated in FAO SDS 3, “often, the sizes of available and identifiable clusters are both too large and variable for efficient sampling. Subsampling of the primary clusters then becomes necessary if population listing or smaller units are not available. This leads to two-stage sampling of primary selections and of elements from them” (Kish, 1989, p. 74).
Complete enumeration: collection of data from all units, rather than from only a sample of units.
Computer-Assisted Personal Interview (CAPI): an interviewing method in which the enumerator conducts an interview with the respondent using an electronic questionnaire or mobile devices – such as Personal Digital Assistants (PDAs), tablets, laptops, or smartphones – which the enumerator uses to record the responses. When connected to the Internet or a telephone network, the data captured can be transferred and centralized immediately after the interview. The results can be directly arranged in a format that can be read by statistical analysis programs, an aspect that substantially reduces data processing time.
Counting units: primary sampling units in an area frame. Units are randomly selected, and then divided into sample segments for data collection purposes.
Crop area: the physical areas of land on which crops are grown (often referred to as “net cropped area”). The sum of the areas of all temporary crops grown (gross cropped area) may be greater than the net cropped area due to successive cropping (WCA 2020). In hilly regions with abrupt slopes (having an incline greater than 20 percent), the crop area should not be the physical area measured on the slope (the inclined plane), but rather its projection on a horizontal plane (FAO, 1982; para 28).
Cropland: total arable land and land under permanent crops (FAO WCA 2020).
Cut-off threshold: the minimum size limit for inclusion of units in the census (FAO WCA 2020).
Employee: person who holds a paid employment job (FAO WCA 2020).
Employer: person who, working on his or her own account or with one or a few partners, holds a self-employment job and, in this capacity, has engaged on a continuous basis one or more persons to work for him/her as employees (FAO WCA 2020).
Enterprise: economic unit of production, under single management, that independently directs and manages all the functions needed to carry out production activities. An enterprise may engage in more than one type of activity and may have its operations in more than one location. Enterprises may be corporations, government institutions or other units, including households.(FAO WCA 2020).

xi
Enumeration Area: small geographical units defined for census enumeration purposes (FAO WCA 2020).
Establishment: an enterprise or part of an enterprise situated in a single location and primarily engaged in a single type of production activity. An enterprise that is engaged in growing crops as well as processing the crops on a significant scale is considered as two establishments, corresponding to the two types of activities.(FAO WCA 2020).
Field: piece of land in a parcel that is separate from the rest of the parcel by easily recognizable demarcation lines, such as paths, cadastral boundaries, fences, waterways or hedges (FAO WCA 2020). A field may consist of one or more “plots”; a plot is a partor the whole of a field on which a specific crop or crop mixture is cultivated.
Frame: the set of source materials from which the sample is selected (UN, 2005). It is the basis for identifying all statistical units to be enumerated in a statistical collection.
Global Navigation Satellite System (GNSS): satellite navigation system used to determine an object’s ground position. A GNSS device enables identification of the geographic position of a point on the Earth’s surface by longitude and latitude. It can enable the geo-referencing of the holding, the household and the land to the appropriate administrative areas. Since the Global Positioning System (GPS; see below) is the most popular GNSS system, GNSS are often called GPS.
Global Positioning System (GPS): the most popular GNSS in existence today.
Head of Household: the head of household is the member of the household who generally runs the affairs of the household, and is looked upon by the other members of the household as the main decision maker.
Holder: see agricultural holder.
Holding: see agricultural holding.
Household: the concept of household is based on the arrangements made by persons, individually or in groups, for providing themselves with food or other essentials for living. A household may be either (a) a one-person household, that is to say, a person who makes provision for his or her own food or other essentials for living without combining with any other person to form part of a multi-person household or (b) a multi-person household, i.e. a group of two or more persons living together who make common provision for food or other essentials for living. The persons in the group may pool their incomes and may, to a greater or lesser extent, share a common budget; they may be related or unrelated persons or constitute a combination of persons both related and unrelated. A household may be located in a housing unit or in a set of collective living quarters, such as a boarding house, a hotel or a camp, or may comprise the administrative personnel in an institution. The household may also be homeless. [UN, 1998, para. 1.324; FAO, 2020]
Housing census: the overall process of planning, collecting, compiling, evaluating, disseminating and analysing statistical data relating to the number and condition of the housing units and facilities available to the households, concerning, at a specified time, all living quarters and occupants thereof within a country or a well-delimited part of a country.
Joint holder: person making the major decisions regarding resource use and exercising management control over the agricultural holding operations, in conjunction with another person (FAO WCA 2020)
Labour force status: a person may be classified according to one of three mutually exclusive categories of labour force status: in employment, in unemployment, or outside the labour force (FAO WCA 2020).

xii
Land cover: the observed bio-physical coverage of land. Examples are cropland, woodland, shrub land, grassland, artificial land, bare land, water areas or wetlands. A single location may comprise multiple land covers (for example, crops under tree cover).
Land use: the socioeconomic use that is made of land, e.g. agriculture, forestry, aquaculture and fishing, mining and quarrying, industry, commerce, residential or unused. A single location may comprise multiple land uses (for example, woodland used for feeding cattle and forestry).
Land used for agriculture: total of “agricultural land” and “land under farm buildings and farmyards” (FAO WCA 2020).
List sampling frame: in this Handbook, list frames are lists of farms and/or households obtained from agricultural or population censuses and/or administrative data. It is to be noted that the ultimate sampling units are lists of names of holders or households.
Livestock: all animals, birds and insects kept or reared in captivity mainly for agricultural purposes (FAO WCA 2020).
Master Sampling Frame (MSF): a frame that enables selection of different samples (including from different sampling designs) for specific purposes: agricultural surveys, household surveys, and farm management surveys. The MSF’s distinguishing feature is that it enables samples to be drawn for several different surveys or different rounds of the same survey, which makes it possible to avoid building an ad hoc frame for each survey. In the context of the Global Strategy, an MSF is a frame or a combination of frames that covers the population of interest in its entirety, and that enables the linkage of the farm as an economic unit to the household as a social unit, and both of these to the land as an environmental unit. MSFs are designed to enable the integration of agriculture into national statistical system by establishing a closer link between results from different statistical processes and units.
Microdata: data on the characteristics of the units of a population, such as individuals, households, or establishments, which are collected by means of censuses, surveys or experiments. (United States Bureau of the Census, 1998, Section 3.4.4).
Minimum set of core data: set of data that each country should provide to facilitate international comparison. The minimum set is defined by the Global Strategy’s First Pillar.
Mixed crops: two or more different temporary and permanent crops grown simultaneously in the same field or plot (FAO 1982). Each crop is referred to as an associated crop.
Multiple frame survey: a sample survey based on multiple sampling frames. In the context of agriculture, this includes the joint use of area and list sampling frames. The frames are usually not independent of one another; some of the frame units in one frame may be present in another.
Multivariate probability-proportional-to-size: a method for sampling using probabilities proportionate to measures of size for multiple variables or characteristics.
Multi-stage sampling: a sampling method that, for agriculture, uses large geographical areas or clusters as the first stage. The final sample frame is then developed only within the selected clusters in one or more stages of sampling. In a two-stage sampling design, the clusters are sub-sampled and the secondary units sampled are the reporting units. In a three-stage sampling design, sampled selected units are sub-sampled again. Generally, a multi-stage sampling design is the sub-sampling (in two or more stages) of primary sampling units (clusters).

xiii
Multi-phase sampling: in this type of sampling, a large sample is selected in the first phase; from this, subsamples are selected in a second phase. If a given stratification approach is too expensive to be applied to the entire population, it can be applied only to the sample obtained in the first phase (incomplete stratification). The procedure is often used for area frames of points.
Net cropped area: physical area of land on which temporary crops are grown (FAO WCA 2020).
Non-sampling error: any error that may arise in the entire survey process (from frame development to data analysis) that is systematic or random and is not related to a random error in sampling. These errors include over- or under-coverage of the sample frame, errors resulting from poorly worded questionnaires, etc.
Open segment: a method for defining a reporting unit when the sampling unit is a segment of land selected from an area sampling frame. The reporting unit depends on the location of the headquarters or household of the holder. If it falls within a sample segment, data are collected for the holding’s entire operation, regardless of whether it is included in the segment. No data are collected for holdings with land within the segment but whose headquarters are outside the segment.
Ortho-photograph: a photograph that has been modified such that its geometry corresponds to the geometry of a cartographic projection. Traditionally, the ortho-correction process was applied to aerial photographs, by means of analogic procedures; these, however, have been completely replaced with digital procedures. Ortho-correction is also essential to the analysis of satellite images.
Own-account worker: person who, working on his or her own account or with one or a few partners, holds a self-employment job and has not engaged any employees on a continuous basis during the reference period (FAO WCA 2020).
Own-use production work: form of work comprising production of goods and services for own final use (an unpaid form of work) (FAO WCA 2020).
Parcel: any piece of land, of one land tenure type, that is entirely surrounded by other land, water, road, forest or other features not forming part of the holding or forming part of the holding under a different land tenure type. A parcel may consist of one or more fields adjacent to each other (FAO WCA 2020). The concept of “parcel” used in agricultural censuses and surveys may not be consistent with that used in cadastral work. The reference period is a point of time, usually the day of enumeration.
Permanent crops: crops having a growing cycle greater than one year (WCA 2020). They are sown or planted once and need not be replanted after each annual harvest.
Persons in employment: persons of working age who, during the reference period, were engaged in any activity to produce goods or provide services for pay or profit (FAO WCA 2020)
Persons in own-use production work of goods: those of working age who – during a brief reference period – performed any activity to produce goods for own final use, for a cumulative total of at least one hour (FAO WCA 2020).
Plot: part or whole of a field on which a specific crop or crop mixture is cultivated (FAO WCA2020).
Point sampling: the final sampling unit is a point. The reporting unit is the holding associated with the land that covers the point.

xiv
Population: any finite or infinite collection of individuals (ISI Dictionary of Statistical Terms). A population, or target population, is the finite set of all elementary units (sampling units) about which information is sought. Depending on the survey’s goals, the elementary units – or, simply, the elements – of a population may have different forms. Three typical types of elements are holdings or farms, holders or farmers, and households or dwellings. In addition to the nature of its elements, defining a population requires identification of a place and a point in time. Hence, examples of populations are the set of all holders of a province in 2014 or the set of all households of a region in a given year.
Population census: the total process of planning, collecting, compiling, evaluating, disseminating and analysing demographic, economic and social data at the smallest geographical level pertaining, at a specified time, to all persons in a country or in a well-delimited part of a country (http://unstats.un.org/unsd/statcom/doc15/BG-Censuses.pdf).
Primary sampling unit: see cluster.
Production: actual quantity of produce, after drying and processing, ready for sale or consumption (FAO WCA 2020).
Probability proportional to size: a sampling procedure whereby the probability of selection of each unit in the universe is proportional to the size of some known relevant variable (OECD Glossary of statistical terms2004). Measures of size, such as land area or number of animals, associated with each holding are used to select sampling units with probabilities proportional to size. These measures are usually obtained from a previous data collection.
Quality assurance: this covers measurements of the relevance, accuracy, reliability, timeliness and punctuality, accessibility and clarity, comparability and coherence of the data (FAO WCA 2020).
Reference group: the group of holdings to be tabulated for the item. For example, the item “area irrigated” is only meaningful for land holdings (FAO WCA 2020).
Replicated sampling: a sampling method used to simplify the estimation of sampling errors or to facilitate rotating panel surveys. This sampling procedure selects m independent samples of equal size n/m instead of drawing one large sample of size n. It enables variance estimation in systematic sampling.
Rural household: household living in areas designated as rural areas, which are usually defined as such by the population census (FAO WCA 2020).
Sample enumeration: procedure that consists in sampling the whole or part of the target population, as opposed to the complete enumeration that occurs in censuses.
Sample survey: the collection of data from a sample of units, rather than from all the units (as occurs in a census).
Sampling error: any random sampling method can produce several different samples that can produce a set of statistics. The sampling error is the variability in the results that are obtained from the different samples. Suppose that N = 10 farms and a random sample of n =2 is selected. There are 45 different combinations of two that can be selected from the ten farms resulting in different sample estimates. The standard error is a measure of the variability between these different sample estimates.
Sampling frame: see frame.
Segment: final land unit selected from an area sampling frame.

xv
Single-stage sampling: sampling scheme in which the sample is selected directly from a list of units covered by the survey.
Sown or planted area: area that corresponds to the total sown area for producing a specific crop during a given year. Figures for the sown or planted area are required to estimate the quantities used for seeding purposes. The data on the sown area harvested and yield per area provide a measure of production.
Statistical unit: the basic unit for which data are collected (FAO WCA 2020).
Status in employment: classification of the jobs held by persons, or of persons in employment (FAO WCA 2020).
Structural data: data on the basic organizational structure of agricultural holdings that do not change quickly over time. Examples are farm size and land use.
Temporary crops: crops that are both sown and harvested during the same agricultural year, sometimes more than once.
Weighted segment estimator: a method for defining a reporting unit when the sampling unit is a segment of land selected from an area sampling frame. The reporting unit is all the land operated by every holding that also has land within the sample segment. The estimator is based on the ratio of the holder’s land in the segment to the land area in the entire operation.

xvi

xvii
Preface
This Handbook on Master Sampling Frames for Agriculture has been prepared within the framework of the Global Strategy to Improve Agricultural and Rural Statistics (Global Strategy). The Global Strategy is an initiative endorsed in 2010 by the United Nations Statistical Commission. It provides a framework and a blueprint to meet current and emerging data requirements and the needs of policymakers and other data users. Its goal is to contribute to greater food security, reduced food price volatility, higher incomes and greater well-being for rural populations, through evidence-based policies. The Global Strategy is centred upon 3 pillars: (1) establishing a minimum set of core data (2) integrating agriculture into National Statistical Systems (NSSs) and (3) fostering the sustainability of the statistical system through governance and statistical capacity building.
As indicated in the Global Strategy’s foundational document, the implementation of the Second Pillar (integration of agriculture into the national statistical system) “begins with the development of a master sampling frame for agriculture that will be the foundation for all data collection based on sample surveys or censuses”.
Therefore, the Master Sampling Frame (MSF) constitutes the basis for the selection of probability-based samples of farms and households, and enables the characteristics of the farm to be connected with those of the household, and with both the land cover and land use dimensions.
The Action Plan to Implement the Global Strategy prioritized the preparation of this Handbook on Master Sampling Frame for Agriculture –Frame Development, Sample Design and Estimation to provide statisticians in countries with practical guidelines.
This Handbook was prepared by a core team of five senior consultants and experts. Initial drafts of the handbook were reviewed by the Global Strategy’s Scientific Advisory Committee (SAC)1. The draft was also presented and discussed at a dedicated Expert Meeting organized by the Global Office in Rome in November 2014 with international, regional and national experts. Detailed comments were made during and after this meeting, and were taken into account in revising the draft.
This Handbook is intended as a reference document providing technical and operational guidance on various aspects of the development and use of an MSF for agriculture in several different country conditions, with an emphasis on developing countries. The publication addresses a significant gap, since there is very little technical guidance on MSFs for agricultural surveys.
The Handbook recognizes the diversity of country situations and resources, and consequently proposes various options. The Handbook is conceived as a living document to be subject to periodical review.
The Handbook intentionally focuses on the practical aspects of building and using an MSF. Where necessary or considered desirable, it refers readers to alternative more detailed methodological documents. In particular, it must be noted that the Global Strategy’s Research Programme also includes several research activities that are related to the development and use of the MSF, which have led to the publication of the following Technical Reports: (i) Identifying the most appropriate area frame for specific landscape types; (ii) Linking area frames and list frames in agricultural surveys; and (iii) Improving the use of GPS, GIS, Remote sensing for setting up a master sampling frame. These may all be viewed at http://www.gsars.org/category/publications/.
1 The SAC is composed of ten renowned senior experts in various fields relevant to the Global Strategy’s Research Programme. The experts are selected for a term of two years. At the time of developing this Handbook, the SAC’s composition was as follows: Vijay Bhatia, Seghir Bou-zaffour, Ray Chambers, Jacques Delincé, Cristiano Ferraz, Miguel Galmés, Ben Kiregyera, Sarah Nusser, Frederic Vogel, Anders Walgreen.

xviii
xix
Acknowledgments
This Handbook on Master Sampling Frame for Agriculture was prepared by a core team of five senior agricultural statisticians with extensive knowledge and several decades of experience in various regions of the world. The team’s work was coordinated by Naman Keita, Research Coordinator of the Global Strategy’s Global Office, with the assistance of Michael Rahija, Research Officer, Global Office.
The lead expert was Frederic Vogel, who prepared the Handbook’s first outline and is the author or co-author of several chapters. Mr Vogel was also in charge of the technical editing of the work and the harmonization of the inputs from the different experts. Each senior expert of the team authored or co-authored one or more chapters, as follows:• Glossary: Naman Keita• Overview: Frederic Vogel• Chapters 1 and 2: Frederic Vogel• Chapter 3: Cristiano Ferraz and Frederic Vogel • Chapter 4: Javier Gallego• Chapter 5: Miguel Galmés and Naman Keita • Chapter 6: Javier Gallego• Chapter 7: Cristiano Ferraz and Frederic Vogel• Chapter 8: Frederic Vogel• Annex A: Understanding variance components in two-stage sampling designs by Cristiano Ferraz.• Annex B: How sampling error and non-sampling error contribute to total survey variation? By Cristiano Ferraz• Annex C: Country Experiences: Summaries by Naman Keita and Frederic Vogel of country papers provided
by national experts2
This publication is the result of a veritable team effort, all core team members having made substantial contributions to the Handbook as a whole. Valuable inputs and comments were also provided at various stages by the SAC members; by other international experts during Peer Review3; and by country statisticians during and after a dedicated high-level expert meeting organized by the Global Office at FAO headquarters in November 20144.
This publication was prepared with the support of the Trust Fund of the Global Strategy, funded by the UK’s Department for International Development (DfID) and the Bill & Melinda Gates Foundation (BMGF). The World Bank and the Joint Research Center of the European Union also provided financial and technical support towards preparing the publication.
2 Flavio Bolliger, Brazil; Yu Xinhua, China; Javier Galego, EC; Aberash Tariku Abaye, Ethiopia; Marino Barientos, Guatemala; Ambika Bashyal, Nepal; Nomzwakhe Sephoko, Lesotho; Sebastien Manzi, Rwanda;Michael Steiner and Sarah Hoffman, US.
3 Invaluable comments and feedback were received from the following Peer Reviewers: Luis Ambrosio, Veronica Boero, Flavio Bolliger, Seghir Bouzaffour, Ray Chambers, Jacques Delincé, Loredana Di Consiglio, Christophe Duhamel, John Latham, Giovanna Ranalli, Sarah Nusser,Arun Srivastava, Mukesh Srivastava, Anders Walgreen.
4 Participants in the expert meeting: Luis Ambrosio, University of Madrid; Robert Arcaraz, Ministry of Agriculture - France; Marino Bar-rientos, University of San Carlos – Guatemala; Ambika Bashyal, Central Bureau of Statistics – Nepal; Roberto Benedetti, Università degli Studi G. d'Annunzio Chieti e Pescara – Italy; Flavio Bolliger, Instituto Brasiliero de Geografia e Estatistica – Brazil; Loredana di Consiglio, ISTAT – Italy; Javier Gallego, EU/JRC; Luis Iglesias, University of Madrid – Spain; Dalisay (Dax) Maligalig, Asian Development Bank; Sebastien Manzi, Institut National des Statistiques Rwanda; Giovanna Ranalli, University of Perugia – Italy; Michael Steiner, USDA/NASS; Aberash Tariku, Central Statistical Bureau of Ethiopia; Xinhua Yu, National Bureau of Statistics China. The participating FAO experts were Nancy Chin, John Latham, Naman Keita, Eloi Ouedraogo and Mukesh Srivastava.

xx
xxi
OverviewBy Frederic A. Vogel
The purpose of this Handbook on Master Sampling Frames for Agriculture is to provide guidelines for the construction and use of Master Sampling Frames (MSFs) in agricultural statistics. One of the main pillars of the Global Strategy to Improve Agricultural and Rural Statistics (World Bank, 2011) is the integration of agriculture into national statistical systems (NSSs), and that this integration be achieved by the development of an MSF for agricultural and rural statistics. Integration can be considered successful if the use of the same concepts and sampling frame in multiple surveys and survey rounds offers gains in efficiency and quality, with respect to separate survey systems. The Action Plan to Implement the Global Strategy (FAO, 2012) establishes a research program to develop best methods for integrating agriculture into NSSs and implementing MSFs. The Action Plan also suggests that guidelines be prepared for the development and use of the MSF.
An extensive body of literature forms the foundation for the implementation of concepts requiring an MSF and its use in integrated survey programs5. This Handbook presents recent developments of new statistical methods and of satellite and computing technology that supports the the development and use of the MSF.
BackgroundThere are three main requirements for agricultural statistics: enabling sound policy decisions, ensuring the efficient operation of markets, and fostering investments. While the first of these purposes/applications may be well known, it must be noted that statistics are also necessary to ensure the smooth operation of markets, for which timely and up-to-date information is crucial. Many developing countries suffer adverse consequences due to the absence of an early warning system of food security problems. Census data that are several years old are of little use in understanding current situations. Policymakers need information on many issues, including the well-being of the farm population and the impact of previous policy decisions upon the economy and the environment. Flawed data – or a lack of data – lead to undesirable policy decisions, which in turn reduce general support for statistics. A third application of statistics is to support the investment-related decisions made by all levels of government, industries servicing agriculture, and farm operators. All uses require timely and accurate data that can be provided effectively by sample surveys. Cost is a limiting factor; however, the use of a well-designed MSF will reduce data collection costs, compared to ad hoc data collection methods.
For many countries, a main source of agricultural statistics is the agricultural census, which is usually conducted every ten years. Where no agricultural census is held, the population and household censuses may provide information on the agriculture sub-population. Boththe population and the household censuses provide data for local administrative areas, such as counties; they also provide listings of farms and/or households that may be used as sampling frames. However, a problem affecting these censuses is that the data and farms/households listings become obsolete, due to the long times pan between collection periods. In some cases, several years may elapse before the census data and listings become available, which means that they are obsolete from the very beginning.These censuses are often conducted by the country’s National Statistical Office or Ministry of Agriculture.
Information on agricultural production must be made available expeditiously, beginning with the advance estimates of pending production. In many countries, agricultural statistics are compiled by means of administrative reporting systems, the data of which are based on the subjective assessment of field agents who work under the auspices of the ministries of agriculture. The accuracy and reliability of these data depend on the knowledge of each field agent. The data are usually aggregates for administrative areas – often villages, where the production area is not
5 The FAO publication: titled “Multiple Frame Agricultural Surveys – Volume 2 provides an extensive bibliography up to 1998.
xxii
defined by clear boundaries. Usually, it is not possible to describe the characteristics of farms and households that are necessary for the purposes of food security analysis and policy decisions. These data cannot be used to draw inferences on the population at large; they do not enable precision of the estimates.In addition, they do not provide links to the environmental situation.
A well-designed sample survey can be completed quickly and with the capability of drawing inferences upon the population, with known probabilities and measures of sampling variability. A well-designed sample for national estimates will require an unexpectedly small number of agricultural holdings or households.
However, administrative reporting systems can usefully provide early warnings of rapid changes in crop conditions and information on important but relatively rare commodities. The World Bank (2008) describes a Windscreen Survey and other rapid appraisal methods based on expert judgment. While these methods may not meet the requirements of the future agricultural statistical system, they must nevertheless be considered when developing the MSF. Indeed, in certain situations, subjective reports by local experts can also be useful as auxiliary variables, to be combined with more objective surveys. The reports may also be useful in small area estimation.
One of the Global Strategy’s major findings is that emerging data requirements exceed that which can be provided by periodic censuses and administrative reporting systems that focus mainly on agricultural production and the farm or agricultural holding as the unit of interest. Emerging data requirements include the well-being of the farm and rural households, and agriculture’s impact on the environment. FAO’s World Program for the Census of Agriculture (FAO, 2005b) recommends that censuses consider the agricultural holding or farm as the basic unit for production and other economic statistics. However, this report also emphasizes the use of population censuses and the collection of agricultural data for households that are not agricultural producers. On the other hand, the increasing demand for agri-environmental information requires that both the farm and the households be linked with the land.
The challenge in developing MSFs for agriculture is that they must satisfy the needs of three statistical units6: the farm or agricultural holding, the household, and the land. In addition, these three units must be linked – for example, such that household income, health, and other factors may be compared to the farm’s economic situation; and all of these to their general environmental impact. Often, there is a one-to-one relationship between the agricultural holding, the household, and the land parcel. In these cases, it will be feasible to collect economic, social, and environmental information from a single unit. If these units are geo-referenced, the three units can also be associated with land cover. A challenge facing the development of MSFs occurs when there is not always a one-to-one link between the agricultural holding and a household.
The Global Strategy broadens the scope of agriculture to include aspects of forestry and fisheries. However, this Handbook on Master Sampling Frames is limited to agroforestry and aquaculture, which are considered agricultural activities.
The Master Sampling FrameThe development of an MSF begins by defining the data items to be measured. Examples are the total production of maize in a country, the number of beef cattle, the average education levels by gender, or changes in land cover. Possible sampling frames are listings of maize fields, animals, people by gender, or of land parcels. It would not be practical – or even possible – to develop a sampling frame for each data item. Instead, the population for each can be defined indirectly, as listings of farms or agricultural holdings, households, or parcels of land. In all cases, sampling units and the reporting units associated with each must be defined.
6 The Research Programme of the Global Strategy also includes a topic on the Integrated Survey Framework (ISF), in which indirect sam-pling methodology was applied to integrated household surveys for a wide range of topics, on the basis of the correspondence between households and the holding; the Global Strategy’s ‘Guidelines for the Integrated Survey Framework’ are available at http://www.gsars.org/guidelines-for-the-integrated-survey-framework/.

xxiii
The MSF for agriculture is a listing of sampling units that, when associated with reporting units, provides complete coverage of the populations of interest, as well as a linking of the agricultural holding to the household and land dimensions. This listing of sampling units may consist of a list of the names of farm operators obtained through an agricultural census, of households (derived from a population and housing census), a list of commercial agricultural enterprises that are not associated with a household, or a list of area units that are defined geographically. Multiple frame sampling is the joint use of two or more of these listings; it will be defined in further detail below.
If the final sampling units for the listing are farm operators (by name), the reporting unit is the holding associated with the name, and the items of interest are the land that it operates and the crops and livestock on that land, the households associated with that land, and the geo-referenced land. This listing may include commercial agricultural enterprises that are not associated with a household as well as households with livestock but no land. Households that provide agricultural labour but do not operate a farm would be excluded, as also households with small plots for food consumption but the production of which falls short of a given threshold. This frame will provide a linkage between the agricultural holding and the household associated with it, but not with other types of rural households. This listing is a sampling frame – more specifically, a list frame. However, it is not a complete MSF because it excludes rural households.
If the final sampling unit is a household, the reporting unit is the agricultural holding and the items of interest include the land to which it is associated, the crops and livestock on that land, and the geo-referenced land. If the listing derives from a population census, it will include all rural households, as well as those that are not linked to land but that may have livestock, contribute to the agricultural labour force, or are simply rural non-farm households. This listing is a sampling frame – more specifically, a list frame. While this meets a sample frame’s basic requirements, it may lack statistical efficiency if the first stage of sampling is a selection of Primary Sampling Units (PSUs), because the number of households used as an indicator of size when selecting PSUs may not be sufficiently correlated to the items of interest relating to crop areas or livestock inventories. This can become an MSF if a listing of commercial agricultural enterprises is included, to ensure complete coverage of the items to be measured. The agricultural enterprises may be added to the list of households to become part of the same list, or be used as a separate sampling frame in the multiple frame sampling context. Chapter 7 provides further details on multiple frame sampling.
If the final sampling unit is a segment or a parcel of land, the reporting unit can be the holding associated with the land, the household(s) associated with the land and with items of interest (which include all crops and livestock on the land), and all holding and household characteristics. All rural non-farm households within the land parcel are also reporting units. Commercial agricultural enterprises are also reporting units. This listing is an area sampling frame, as well as an MSF. Chapters 4 and 6 provide details on area frame sampling, including on the use of points rather than land parcels as the final sampling units.
The listings of households and parcels of land described above meet the requirements for becoming an MSF. This does not mean that they are the most statistically efficient elements; this Handbook addresses these issues. The Handbook will also illustrate how a listing of farms or agricultural holdings can become an MSF by including a sampling frame of land parcels or points and thus be developed into an MSF based on multiple frame sampling.
The HandbookChapter 1 defines sampling frames in general and the concept of an MSF. The basic concepts underlying the use of list and area frames are defined. The chapter also describes the concepts of multiple frame sampling and concludes with the concepts and principles underlying the integrated survey design.
Chapter 2 examines the information that must be gathered on each core data item when deciding which methodology to adopt in constructing and using the MSF. While an extensive body of literature on sampling and estimation methods exists, much of this fails to address the reality that the agricultural sector of each nation includes a wide range of items, with different sizes and geographic distributions.

xxiv
Chapter 3 provides guidelines on aspects of sampling design that are related to the design and implementation of the MSF.
Chapter 4 provides guidance on the development of sampling frames using Geographic Information Systems (GISs) and various forms of satellite imagery, and how they can be used with the population and agricultural census materials. Chapter 5 describes methods for developing a master frame from population or agricultural censuses. Chapter 6 contains guidelines for determining whether an area frame would be appropriate and, if so, how to choose from the alternatives available. In most countries, agriculture includes a large number of small farms and a much smaller number of specialty farms; for this reason, it may be appropriate to use more than one sampling frame. Chapter 7 provides the basic concepts of multiple frame sampling that enables the joint use of area and list sampling frames to define the MSF. These chapters also provide guidelines on choosing sampling and estimation methods.
Annex A outlines the variance components when two-stage sampling designs are used. Two-stage methods are used to save time and reduce costs. However, the contributions of each stage to the total sampling variability when determining the size of clusters, the method of selecting clusters, and the sampling method within clusters, must be noted.
Annex B discusses how sampling and non-sampling errors contribute to total survey variation.
Annex C provides an overview of the experiences of several countries, illustrating the lessons learned for the preparation of guidelines to develop and use the MSF. Developing countries and countries in transition are similar, in that the structure of their agricultural systems are usually mostly comprised of small farms engaged in subsistence agriculture and a much smaller number of commercial farms and farms producing specialized or rare commodities. For this reason, the MSF is most likely to be constructed in accordance with principles of multiple frame sampling.
SUMMARYCountries follow a variety of practices when building sampling frames for agriculture and in using these as MSFs. Census enumeration areas (EAs) used as PSUs or grouped into PSUs constitute the main basis for MSFs in several developing countries that have conducted population censuses. One of the main problems affecting this type of frame is that no auxiliary data for stratification or sampling purposes are available. The addition of agricultural modules to population censuses, as recommended by FAO, can yield information that is very useful for building a sampling frame for agriculture. A growing number of countries geo-reference these PSUs, which enables conversion of the census PSUs into an area frame as they may be overlaid onto land cover databases. The secondary sampling units (SSUs) derived from the PSUs are listings of households or farms. All experiences were affected by the problem that these listings rapidly became obsolete.
Country experiences have provided a wealth of knowledge on area frame sampling. The two main approaches – sampling square segments and points therein, and sampling segments with identifiable boundaries – are compared. The use of segments with identifiable boundaries is best suited to large field sizes, such as in the United States; however, this is expensive and difficult to implement in developing countries because of the small field sizes. The use of square segments and subsampling of points is a valid alternative.
Country practices also indicate that a careful analysis of the country situation is needed, in terms of resources, material available, institutional support, the scope of the statistical system and objectives of the surveys to ensure that the options selected are suitable and sustainable.

xxv
1
1Defining the Master Sampling Frame for agricultural statistics – basic principlesby Frederic Vogel
1.1. INTRODUCTIONThe process of defining the MSF for agricultural statistics begins with describing the data required to obtain the necessary indicators or estimates for a set of data items.
The Global Strategy to Improve Agricultural and Rural Statistics (World Bank 2011) describes a minimum set of core data that countries should collect to meet current and emerging demands of policymakers and other data users. These data needs are best met by different surveys or data collections, such as annual crop production surveys and intra-year livestock production surveys. Other data requirements can be met by multi-year structure and economic surveys. Some of these requirements are based on the farm as the economic unit, and others on the household as the social unit. Each set of core data items can be represented by different populations from which data can be collected. These populations can be defined as listings of agricultural holdings, households, or blocks of land from which data are collected by means of a census or sample survey, to provide measures that represent the core data items. Each population listing is capable of meeting the requirements for becoming a sampling frame and – in some cases – an MSF.
Sampling is an application of statistical theory that relies on basic laws of probability to make inferences about a population, on the basis of a subgroup of that same population. Sampling theory involves more than a selection process. The overall sampling framework includes defining the target population, the frame (or frames), choosing the sampling unit and associated reporting units, determining the sample size, developing a selection procedure, preparing the estimators and sampling error measures consistent with the sample design, and implementing statistical controls for detecting and correcting non-sampling errors. Each of these design elements is dependent on other choices made”. Over time, this can become an iterative process of repeating the analysis of these design elements to evaluate the choices made.

2
While statistical theory will guide the choice of estimators and most other design elements, in practice, the choice of the sample frame for agricultural statistics also depends on expert judgement based on a thorough knowledge of the structure of agriculture within the country.
The following paragraphs provide an overview of the basic core data items and how this relates to the populations and subsequent sampling frames, sampling units, and respective reporting units and items of interest as they relate to an MSF. Multiple frame sampling is then defined. The chapter concludes with the concepts relating to an integrated survey system.

3
1.2. CORE CROP ITEMS The Global Strategy identifies eight core crop items – including wheat, maize, and rice – that account for major food supplies, a large proportion of land use, and value added to the economy’s GDP. Each country must identify these and other items important to their economy as core data items. The data required for these core items include area planted and harvested, yield, and production. In some cases, the data requirements include early season forecasts of production and final end-of-season estimates of area harvested and amounts produced. Other core items include agricultural inputs, such as use of fertilizer, improved seeds, water, etc. The scope of core data items also comprises periodic information on farms’ economic situation, costs of production, and changes in structure. In some countries, aquaculture products are also included. The populations that may constitute these core items include:• A list of the names of farm operators or of agricultural holdings. This can be a register formed with
information from a recent agricultural or population census or from administrative sources within the country. It is assumed that the sum of the land area operated by each farm operator adds up to the population total for all farmland; and that the sum of the areas planted and harvested for each crop adds up to those population totals. In this case, the sampling unit is the farm operator, the reporting unit is the farm operator or holding and the item of interest is the land operated by the farm operator and all other data variables associated with the holding. The sampling frame is the list of farms- or landholders and associated data, depending on the source of the list. The data can be information provided by the most recent census or administrative sources. Thisis a list frame.
• A list of rural households. The sampling unit is the household, the reporting unit is the agricultural holding associated with the household and the item of interest is the land operated by the holding, including the area planted and harvested for each crop on the land. It is assumed that the aggregation of the land and crop areas is equivalent to the population totals for the country. In most developing countries, there is one-to-one correspondence between the farm, the farm operator, and the household. An exception is posed by large commercial agricultural enterprises, which generally have business names. The sampling frame is the list of households and associated data depending on the source of the list. This is a list frame.
• A list of census enumeration areas or small administrative areas such as villages and associated land. The scheme is a two-stage or multiple-stage sample design. The sample units of the first stage are referred to as primary sampling units (PSUs). A sample of PSUs can be selected in a number of ways, such as by stratification and/or PPS sampling. For the first stage of sampling, the frame consists of a complete listing of the enumeration or administrative areas as PSUs. Accompanying information – such as the population, the number of farms, and land areas – can be used for sampling purposes. If the enumeration or administrative areas are geo-referenced, quantitative land cover indicators can be derived from satellite imagery or aerial photographs and used as a sampling tool. The first stage consists inthe selection of a sample of census enumeration or administrative areas as PSUs. The selected PSUs are screened to identify or update the names of farm operators and their linkage to a household. The PSUs can also be screened for rural non-farm households. Within each sample PSU, a subsample is then selected from these listings. At this stage, the sampling unit is a name or a household address, the reporting unit is the agricultural holding associated with the household and the items of interest are the land, crops, livestock, etc. associated with the holding. This subsample can be based on stratification and/or PPS sampling methods (which will be described further detail in later chapters). The sampling frame is the list of names of farms or the list of households and associated data depending on the source of the lists. However, these are list frames. The linkage to the selected PSU must be maintained for estimation purposes. The frame is complete if all PSUs have a chance of being selected and the listings within the selected PSUs are complete.
• Area sampling frames. The sampling units are territorial elements and it is not necessary to build an explicit list of units. If crop area and yield are directly observed, the knowledge of the boundaries of the region of interest is sufficientto ensure that the sampling frame is complete. However, if the reporting units are households or farms, area frames must usually be combined with list frames of large farms or farms producing rare items.
• Segments with natural (or physical) boundaries. These are usually sampled in two steps. First, the territory is divided into blocks that are larger than the intended size of sample segments. These blocks are usually called PSUs and can be stratified by type of land cover and can be sampled. The selected PSUs are divided into smaller

4
units (segments) and one or more of them are sampled. If only one PSU is selected, it is difficult to estimate the sampling errors unless replicated sampling is used as described in Davies (2009). The reporting unit can be the land segment or the farms or households that can be linked to the segment (see Chapter 6 for further details). Crop areas can be directly measured by observation on the ground. Yields may be measured on a small sample of points inside the segment (crop cutting experiment). In this case, there is a proper two-stage sampling process, in which the segment is the PSU.
• Segments defined by a geometric grid (usually a square grid). The sampling concepts are the same as those that apply tosegments with physical boundaries.
• Points. In area sampling frames, points are usually not considered as dimensionless geometric units: a certain size (for example, 3 m) is attributed to them for the application of the observation rules in the field. Points can be considered as small segments that contain a single land cover type, except in the case of mixed crops. The reporting unit can be the point, but it can also be the household or farm that operates the field in which the point falls. Points can also be sampled within EAs or small administrative units (PSUs). In this case, a mixed two-stage sampling frame would exist: one list frame of small administrative units, and an area frame therein.
Other core crop data requirements include producer and consumer prices, and early warning indicators of conditions adversely affecting crop production.While these items are important, they are beyond the scope of the MSF. In some countries, production from household plots constitutes a significant part of the nation’s production. Each country will need to determine the scope and coverage of household plots when determining the choice of sampling frame.
5
1.3. CORE LIVESTOCK ITEMSCore livestock items include cattle, sheep, pigs, sheep, poultry and other species that are important to the country. The data required for the livestock items include inventories at a point in time, annual births, and the production of milk, eggs, and wool for a reference period. The populations representing these core items include meat, milk, eggs, and wool. These products are major sources of food supply and agricultural income. Livestock are also sources of methane emissions and water pollutants.
As described above, the populations representing the core livestock items can include those defined above for core crop items. Ideally, the source of the names and addresses of farms/households forming the list frame(s) for crop items also contains information on the presence of livestock; in this case, both are represented by the same frame. While the sampling units are farms, households, or blocks of land, the reporting unit is the holding and the items of interest are the land parcels operated by the farm/household and the number of livestock on the land parcels making up the farm. However, livestock inventories are difficult to measure for several reasons.• The farm or household may not wish to report the number of livestock on their land if they do not own the
animals. The person or household owning the livestock may not have any land holdings; therefore, these animals will not be counted, which will cause a downward bias in the estimates unless the method of data collection or the scope of the MSF ensures that they will be included.
• If data collection methods are used to capture the livestock associated with households that do not hold land, the data collection process must ascertain the presence of such animals and obtain the owner’s name to conduct a follow-up interview. The probability of selecting households with no land is the probability of selecting the households with land occupied by the livestock. The reporting unit is the holding/household, and the item of interest consists of the animals, regardless of ownership on the land.
• Alternatively, households that have no land but own livestock could be included in the sampling frame. In this case, the reporting unit becomes the household having ownership of the animals, and the item of interest is the animals that it owns.
• In some countries, nomadic pastoralism is practised: livestock are herded to find fresh pastures for grazing. The livestock herders or owners may sometimes be associated with a village and follow a nomadic pattern of grazing that remains the same over time. This situation too can be addressed during the data collection or the design stages of the MSF. Since the animals move from one place to another, data collection methods to minimize double counting must be implemented. The sampling and reporting units described above can also be used for nomadic livestock, with special attention being paid to data collection methods.
• Some livestock operations – such as the rearing of poultry for meat or eggs,or of swine for meat – maybe large in terms of the number of animals but, at the same time, use only small areas of land. The probability of finding these by means of an area frame sample or a general-purpose list frame sample of farms or households is very low. A frame of rural households may not identify these operations; consequently, they would not have a chance of being selected. Since these commercial business entities are few in number, a practical method is to create a separate list of these units. Chapter7 discusses this issue further. These lists can be added to the choice of frame used for other livestock, or used in the multiple frame context.
The issues relating to the inclusion of household plots in measuring crop production also arise when choosing the frame(s) for measuring livestock inventories and production.

6
1.4. CORE SOCIOECONOMIC DATAA periodic measure of household income by source is a key measure of the well-being of rural and farm households. Periodic data on income, considered with the number of households and people living therein (differentiated by gender and by education levels), guides policy decisions on the development sector’s efforts to reduce poverty. In sample frame construction, it is crucial to recall the need for cross-cutting analysis. For example, household income by type of agriculture (crop/livestock) and by use of inputs (fertilizer, improved seeds, improved livestock breeds) provides important guidance on policy decisions ranging from improving agricultural production to improving health and raising education levels.
The desired sample frame is a list of all rural households, each identified by the name of the head of the household and its address or location. Policy makers need to compare the well-being of farm households and that of rural non-farm households. The population is the list of all rural farm and non-farm households. This affects the choice of frame for crop and livestock items:• If the frame is a list of farm operators/farms, the data collection methods must enable linkage of the farm to a
household. However, this will only identify farm households. • If the frame is a listing of land areas or points, these also become the sampling units. The reporting unit maybe
the rural household or holding associated with the land parcel. To identify households with livestock but no land, the listings of land areas must also include villages. An area frame sample could be used to screen for rural households, instead of only farm households. If the sampling unit is a segment of land or a point, the reporting unit could be the household associated with the land segment or point. The reporting unit provides data for the items of interest, such as the economic or social attributes of the household or household members.
• The two-stage sampling steps described above for core crop items provide a means to identify non-farm households in the selected PSUs. Alternatively, an area frame sample of PSUs could be used to screen for rural households, instead of only farm households. The sampling unit is the household if the first stage was a sample of PSUs based on EAs or administrative areas. The reporting unit can be the household, the family, or individual members of the household. If the second-stage sample units are segments of land or points, then the segments or points are the sampling units. The reporting unit is the holding or household associated with the segment or point.
Each country must define what constitutes a farm, a farm household, and a rural household. The issues relating to household plots are the same as those arising with regard to crop and livestock core items.

7
1.5. CORE LAND COVER ITEMSThe basic way to monitor the effect of agriculture on the environment is to monitor changes in land cover and use. Land cover does not change rapidly; therefore, data are not required on an annual basis. However, changes in land cover – due to for example, pollution, deforestation, urbanization, droughts – and changes in crop production methods must be monitored for their impact on people and on the economy.
The population is the land mass of the country. The sampling unit can be a farm, a household, or a parcel of land. The reporting unit is the land parcel, geo-referenced to its location in the land base. In other words, the sampling frames described above satisfy the need to monitor changes in land cover as long as the reporting units are geo-referenced. Rules on geo-referencing must be established on geo-referencing when farms can contain several land parcels at different locations.
8
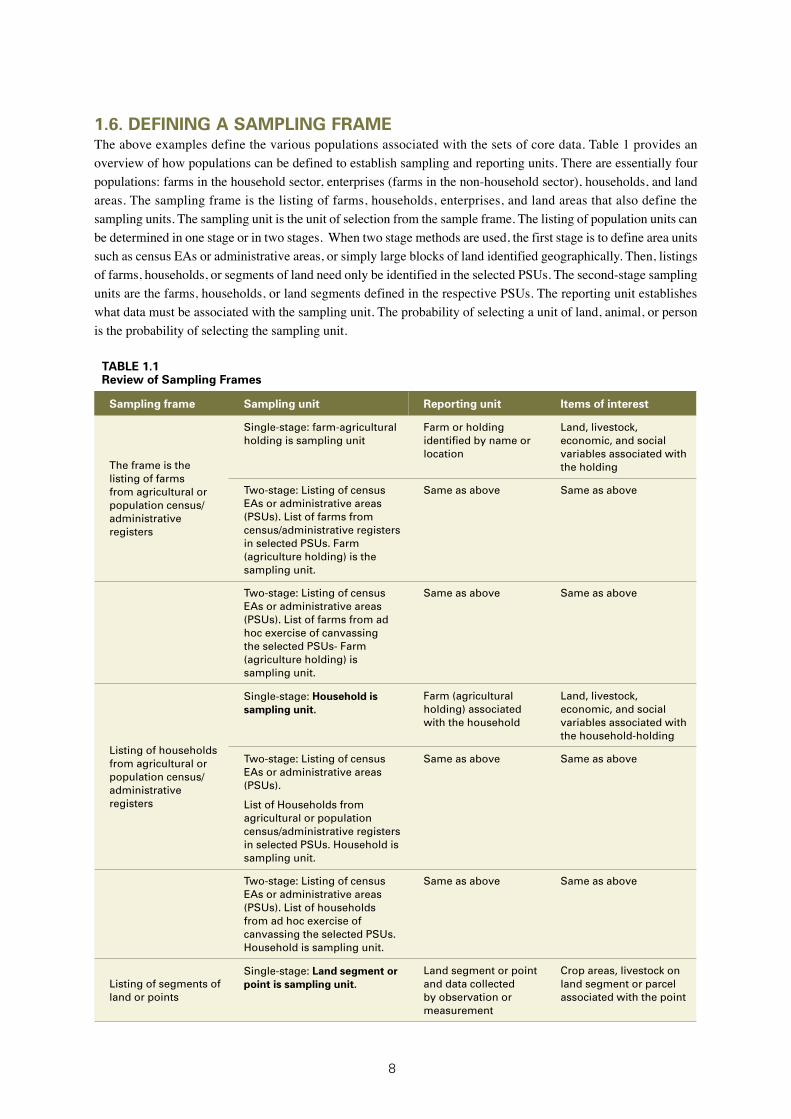
1.6. DEFINING A SAMPLING FRAMEThe above examples define the various populations associated with the sets of core data. Table 1 provides an overview of how populations can be defined to establish sampling and reporting units. There are essentially four populations: farms in the household sector, enterprises (farms in the non-household sector), households, and land areas. The sampling frame is the listing of farms, households, enterprises, and land areas that also define the sampling units. The sampling unit is the unit of selection from the sample frame. The listing of population units can be determined in one stage or in two stages. When two stage methods are used, the first stage is to define area units such as census EAs or administrative areas, or simply large blocks of land identified geographically. Then, listings of farms, households, or segments of land need only be identified in the selected PSUs. The second-stage sampling units are the farms, households, or land segments defined in the respective PSUs. The reporting unit establishes what data must be associated with the sampling unit. The probability of selecting a unit of land, animal, or person is the probability of selecting the sampling unit.
TABLE 1.1Review of Sampling Frames
Sampling frame Sampling unit Reporting unit Items of interest
The frame is the listing of farms from agricultural or population census/administrative registers
Single-stage: farm-agricultural holding is sampling unit
Farm or holding identified by name or location
Land, livestock, economic, and social variables associated with the holding
Two-stage: Listing of census EAs or administrative areas (PSUs). List of farms from census/administrative registers in selected PSUs. Farm (agriculture holding) is the sampling unit.
Same as above Same as above
Two-stage: Listing of census EAs or administrative areas (PSUs). List of farms from ad hoc exercise of canvassing the selected PSUs- Farm (agriculture holding) is sampling unit.
Same as above Same as above
Listing of households from agricultural or population census/administrative registers
Single-stage: Household is sampling unit.
Farm (agricultural holding) associated with the household
Land, livestock, economic, and social variables associated with the household-holding
Two-stage: Listing of census EAs or administrative areas (PSUs).
List of Households from agricultural or population census/administrative registers in selected PSUs. Household is sampling unit.
Same as above Same as above
Two-stage: Listing of census EAs or administrative areas (PSUs). List of households from ad hoc exercise of canvassing the selected PSUs. Household is sampling unit.
Same as above Same as above
Listing of segments of land or points
Single-stage: Land segment or point is sampling unit.
Land segment or point and data collected by observation or measurement
Crop areas, livestock on land segment or parcel associated with the point
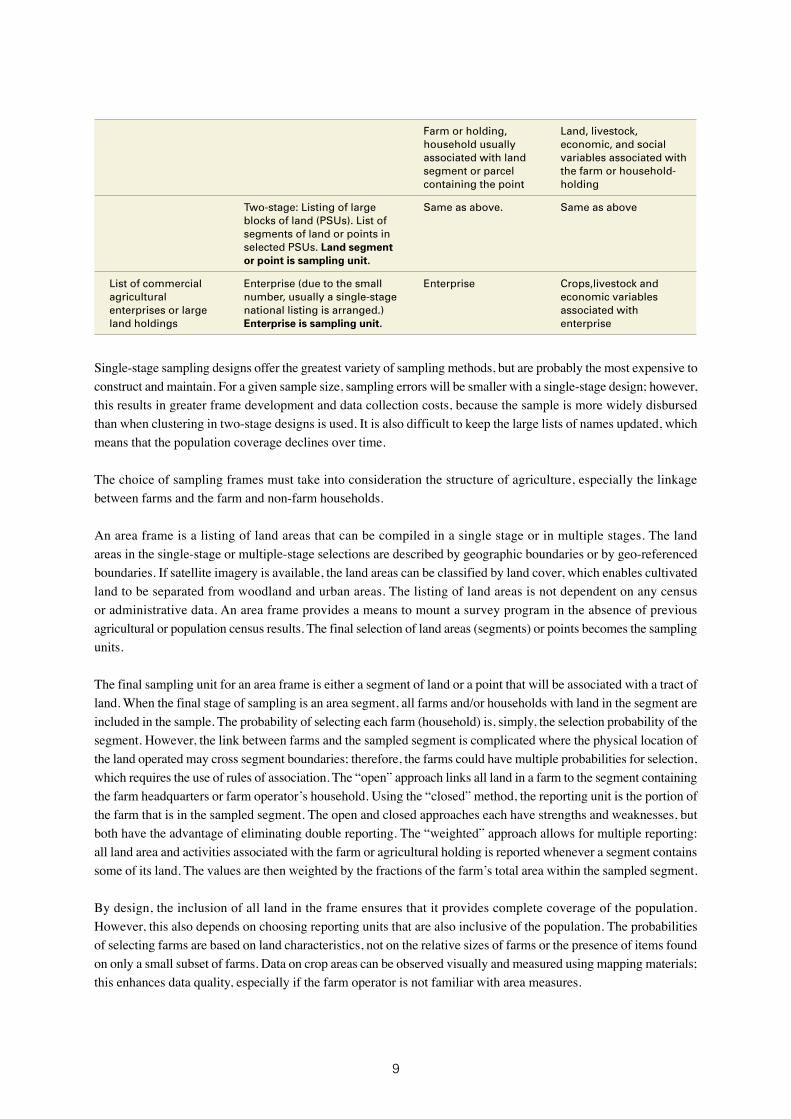
9
Farm or holding, household usually associated with land segment or parcel containing the point
Land, livestock, economic, and social variables associated with the farm or household-holding
Two-stage: Listing of large blocks of land (PSUs). List of segments of land or points in selected PSUs. Land segment or point is sampling unit.
Same as above. Same as above
List of commercial agricultural enterprises or large land holdings
Enterprise (due to the small number, usually a single-stage national listing is arranged.) Enterprise is sampling unit.
Enterprise Crops,livestock and economic variables associated with enterprise
Single-stage sampling designs offer the greatest variety of sampling methods, but are probably the most expensive to construct and maintain. For a given sample size, sampling errors will be smaller with a single-stage design; however, this results in greater frame development and data collection costs, because the sample is more widely disbursed than when clustering in two-stage designs is used. It is also difficult to keep the large lists of names updated, which means that the population coverage declines over time.
The choice of sampling frames must take into consideration the structure of agriculture, especially the linkage between farms and the farm and non-farm households.
An area frame is a listing of land areas that can be compiled in a single stage or in multiple stages. The land areas in the single-stage or multiple-stage selections are described by geographic boundaries or by geo-referenced boundaries. If satellite imagery is available, the land areas can be classified by land cover, which enables cultivated land to be separated from woodland and urban areas. The listing of land areas is not dependent on any census or administrative data. An area frame provides a means to mount a survey program in the absence of previous agricultural or population census results. The final selection of land areas (segments) or points becomes the sampling units.
The final sampling unit for an area frame is either a segment of land or a point that will be associated with a tract of land. When the final stage of sampling is an area segment, all farms and/or households with land in the segment are included in the sample. The probability of selecting each farm (household) is, simply, the selection probability of the segment. However, the link between farms and the sampled segment is complicated where the physical location of the land operated may cross segment boundaries; therefore, the farms could have multiple probabilities for selection, which requires the use of rules of association. The “open” approach links all land in a farm to the segment containing the farm headquarters or farm operator’s household. Using the “closed” method, the reporting unit is the portion of the farm that is in the sampled segment. The open and closed approaches each have strengths and weaknesses, but both have the advantage of eliminating double reporting. The “weighted” approach allows for multiple reporting: all land area and activities associated with the farm or agricultural holding is reported whenever a segment contains some of its land. The values are then weighted by the fractions of the farm’s total area within the sampled segment.
By design, the inclusion of all land in the frame ensures that it provides complete coverage of the population. However, this also depends on choosing reporting units that are also inclusive of the population. The probabilities of selecting farms are based on land characteristics, not on the relative sizes of farms or the presence of items found on only a small subset of farms. Data on crop areas can be observed visually and measured using mapping materials; this enhances data quality, especially if the farm operator is not familiar with area measures.

10
List frames are lists of farms and/or households obtained from agricultural or population censuses and/or administrative data. It is possible to compile a complete register for the entire country. More often, samples of EAs are first selected, and listings of farms/households are then derived from these sampled units. The frame is complete at the first stage of selection if all EAs have a known probability of being selected. The frame is also complete at the second stage if the name registers are frequently updated in the selected PSUs. However, it is difficult to maintain and update the registers over time, which eventually results in the incompleteness of the list frame coverage. The ideal list frame listing of farms and households will also include information on crop areas and livestock inventories. These measures provide valuable information that can be used for stratification and other types of sample selection. This is especially valuable if the population includes farms that vary widely in terms of the size and coverage of the various crops or livestock.
11
1.7. DEFINING MULTIPLE FRAME SAMPLINGMultiple frame sampling is essentially the joint use of two or more sampling frames. The frames are usually not independent: indeed, some of the frame units in one frame will be present in the other(s). Some examples will now be provided to illustrate this point.
Suppose that there are two listings of farms or households. One derives from a population or agricultural census (Frame A) and another from administrative sources such as records of livestock ownership (Frame B). These two lists are not mutually exclusive: some of the units in Frame A may also be present in Frame B. There are two ways to use these lists for the survey framework.1. The two lists can be combined into a single list. This requires all the names in Frame A to be compared with all
those in Frame B to identify and remove overlaps or duplicates between the two lists. This may be relatively easy if one of the lists is small, such as a list of large commercial farms, and the other is a list of households. In this case, the lists are merged into one – Frame A – and a single sample is selected using the usual methods. If the lists are large, this overlap can be determined using record linkage models. However, these are difficult to use, because the models are affected by a measure of error regarding linkage. The need to compare the lists can become expensive and time-consuming. Also, some names are easily misspelled (such as “Olson”and“Olsen”), which would prevent the identification of duplicates. The unknown degree of duplication could therefore introduce bias into the survey results.
2. Independent samples could be selected from both lists using multiple frame sampling methods. A simple form of the multiple frame estimator provided in Chapter 7 is
Y = Ya + Yb + Yab
where Ya is the estimator of the population defined by Frame A, Yb is the estimator of the population defined by Frame B, and Yab is the estimator for farms that could be selected from either Frame A or Frame B. In other words, the estimator is based on three domains: the domain of farms present only in Frame A, that of farms only in Frame B, and that of farms in both Frames A and B. The estimator for Yab can be derived from either frame or both (further details are available in Chapter 7).The main concept underlying the multiple frame estimators is that the overlap between the two frames must be identified. However, this must be done only for the respective samples, and not for the entire frames. The trade-off is the possible impact on the overall sampling errors.
Multiple frame sampling is most commonly used when one frame is an area frame and the other is a list of farms or households. This is most efficient when the list frame includes mainly large or specialized farms. The list may be complete for large commercial farms, but is likely to be incomplete for the smaller farms. The strength of the area frame lies in the fact that it provides complete coverage of the population and is relatively efficient for small farms; the strength of the list frame emerges when measures of size are available for sample design purposes. In this case, the overlap domain Yab is a small part of the population total and adds little to the sampling variability.
As will be seen in Chapter 7, the use of multiple frames – especially if one is an area frame – brings a great degree of flexibility because the sampling methods can be unique to each frame. The only requirement is that the overlap between the two must be identified.

12
1.8. THE VISION FOR DEVELOPING THE MASTER SAMPLING FRAMEThe Global Strategy provides a long-term vision for how the MSF should be developed. It recognizes that countries possess different levels of capacity, and accordingly proposes several alternative methods. The Global Strategy also recognizes the need to link economic and social dimensions to those relating to land cover and the environment. Therefore, the vision begins by recommending that satellite imagery of the country’s land mass be obtained that provides land cover by broad classifications such as cropland, grasslands, etc.
Once the land cover mapping is complete, the next step is to geo-reference (or digitize) the EAs used by the population and agricultural censuses. Administrative areas such as villages, counties, districts, etc. should also be geo-referenced to the land cover images. These geo-referenced boundaries can then become data layers on the land cover classified layer.
The discussions above provide examples of sample frames and how they can become MSFs. The Global Strategy endorses the coordination of population and agricultural censuses to identify the households associated with farms, along with indicators of size. This information can be used to create a register of households and farms with their land and location linked to geo-referenced enumeration or administrative areas. Chapter 4 below develops the notion of how Geographic Information Systems (GISs) and various sources of satellite imagery can be used to develop both list and area sampling frames. The Global Strategy provides several different methods that can be adopted to construct an MSF, which will be developed in further detail in Chapters 5, 6, and 7 of this Handbook.

13
1.9. DEFINING THE INTEGRATED SURVEY FRAMEWORK7
This Handbook notes that development of an integrated survey framework is one of the reasons for developing an MSF. The purpose of this section is to provide a brief overview of an integrated survey framework in the context of an MSF.
Chapter 2 provides guidelines for countries to follow in identifying their set of core data requirements and determining, for each, the frequency of coverage and geographic detail. These data requirements include crop production, livestock inventories and production, and economic measures relating to both farms and households. Usually, the optimum sample design would lead to the selection of independent samples for separate crop surveys, separate livestock surveys, etc. However, the use of independent surveys creates two problems:• The costs of data collection become excessive; this suggests that some or all data collections be combined,
depending on the choice of MSF and the characteristics of the country’s agriculture and rural demographics.• The selection of independent samples limits data analysis across the specific categories. For example, it may
limit the capacity to evaluate the economic situation of farms and households as regards their cropping and livestock situations.
The integrated survey framework provides a linkage of all data collections, to enable cross cutting analysis of for example, agricultural production, use of inputs, household well-being, etc. as these relate to the environment
Table 2 in the Global Strategy’s foundational document (World Bank, 2011; replicated below) illustrates an example of an integrated survey framework. This could be used for surveys based on a questionnaire that contains the same set of core items every year and rotating sets of supplemental questions each year. The design is based on the premise that data is to be collected for some items at least annually, while data collections for other items are only needed on a periodical basis. The table shows how a design that uses replication across time allows the survey to include different items over time. The top row indicates replicates; the first column indicates the survey year. The letter in each box that intersects with the replicate and year indicates the set of items to be included each year with the annual set of core items. Each country will need to independently determine the content of each of the components.
7 As indicated above (see footnote 6), the Global Strategy publication titled ‘Guidelines for the Integrated Survey Framework’ uses indirect sampling methodology to address linkages between different survey units (households, holdings, and parcels) in integrated household sur-veys for a wide range of topics, on the basis of the correspondence between households and holdings.
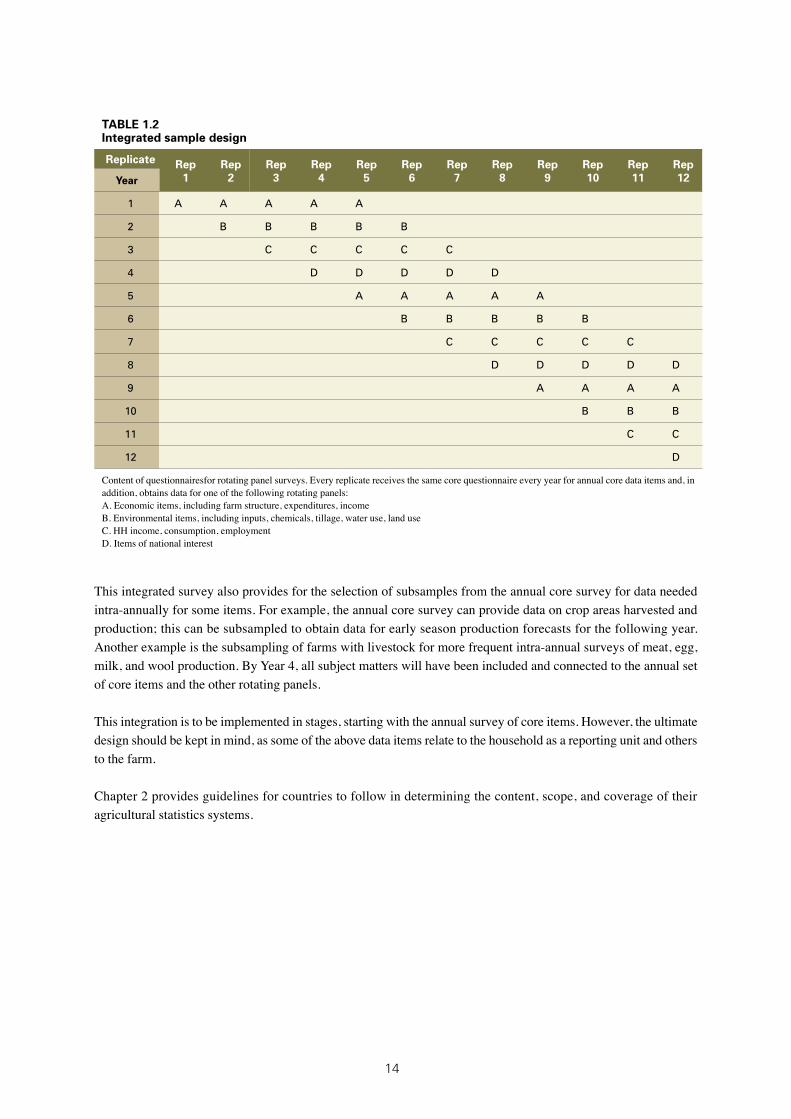
14
TABLE 1.2Integrated sample design
Replicate Rep1
Rep2
Rep3
Rep4
Rep5
Rep6
Rep7
Rep8
Rep9
Rep10
Rep11
Rep12Year
1 A A A A A
2 B B B B B
3 C C C C C
4 D D D D D
5 A A A A A
6 B B B B B
7 C C C C C
8 D D D D D
9 A A A A
10 B B B
11 C C
12 D
Content of questionnairesfor rotating panel surveys. Every replicate receives the same core questionnaire every year for annual core data items and, in addition, obtains data for one of the following rotating panels:A. Economic items, including farm structure, expenditures, incomeB. Environmental items, including inputs, chemicals, tillage, water use, land useC. HH income, consumption, employmentD. Items of national interest
This integrated survey also provides for the selection of subsamples from the annual core survey for data needed intra-annually for some items. For example, the annual core survey can provide data on crop areas harvested and production; this can be subsampled to obtain data for early season production forecasts for the following year. Another example is the subsampling of farms with livestock for more frequent intra-annual surveys of meat, egg, milk, and wool production. By Year 4, all subject matters will have been included and connected to the annual set of core items and the other rotating panels.
This integration is to be implemented in stages, starting with the annual survey of core items. However, the ultimate design should be kept in mind, as some of the above data items relate to the household as a reporting unit and others to the farm.
Chapter 2 provides guidelines for countries to follow in determining the content, scope, and coverage of their agricultural statistics systems.
15
2Background information required to develop and use the Master Sampling Frameby Frederic Vogel
The previous chapters illustrated the statistical principles and definitions that constitute the foundation of the MSF. While statistical theory is the basic guide, considerable expert judgement is also necessary to determine the frame (area, list, or multiple) and the stages of sample selection (single- or multiple-stage).
The purpose of this chapter is to define the characteristics of the underlying population of farms, households, and land parcels required to determine the methodology for developing the MSF. Briefly, several factors must be considered when choosing a method to adopt in developing the MSF.
The first step is to determine – from consultations with policymakers and other stakeholders – the statistics needed. The minimum set of core data provided by the Global Strategy is a starting point, and countries can tailor it to suit their own needs. For each data item, it will also be necessary to obtain the coverage, level of detail, frequency, and scope for which data are required. The same information will also be necessary when determining how to use the MSF. A summary of the information required for each data item follows.• Coverage. Are estimates needed only at the national level, or also by production area or administrative regions
such as provinces or counties?• Level of detail. For crops, are forecasts necessary, in addition to final estimates of production? As well as data
on area and yield, are data on the use of irrigation and other cultural practices also required? For livestock, are data on meat, milk, and egg production also needed in addition to inventories? Are estimates of economic and environmental items needed by type of farm/household?
• Frequency. Estimates for some data items may be needed more than once during the year; some once a year; and others only periodically.
• Scope. In some countries, household plots make a significant contribution to food supplies. The coverage of own production must be defined for each item. A major decision, however, is whether household plots should also be included.

16
• Availability of auxiliary data. Are there other data sources, such as a population or agricultural census, or data from administrative reporting systems for each item that could be used to develop the MSF?
While the above characteristics are based on information supplied by the data users, other characteristics –such as the country’s geography, the distribution of agriculture across its landmass and cultural practices – should be considered in developing an MSF. An expert review of the following characteristics should be undertaken.• Geographic distribution. Are agricultural activities distributed generally across the country, or are they
concentrated in major production or administrative regions? For example, if vegetable production is concentrated where irrigation is used or livestock are mostly found in hilly areas, then steps need to be taken to stratify by land cover if an area frame is to be used, or to stratify farms by location and type of agriculture using census or administrative information.
• Size distribution. If one were to delineate the frequency distribution of, for example, the area of maize or the number of livestock by farm or household, the result would typically resemble the shape of a right triangle, reflecting the presence of many small farms and fewer large farms. In some cases, the distribution may be skewed to the right by a small number of very large farms. If this is the case, an area frame would provide efficient estimates for the majority of the items, but the presence or absence of the largest farms in the sample would result in large sampling errors. It is possible to approximate the mean and standard deviation of a right triangle using the following range:
h = Ymax - Ymin,
where the minimum value approaches zero. The mean of the distribution equals h/3 and the standard deviation is 0.24 h. (Deming, 1960)Using census results (or expert judgement), the mean and standard deviation for items of interest can be estimated, after eliminating the units with the largest values and using the recomputed values to determine the probability that the largest values were part of the population. This can be an iterative process, to determine a cut-off value for those sampling units requiring special attention in the choice of MSF.
• Percentage of holdings with the item of interest. Sampling theory establishes that the estimated variance of the sample mean for each item of interest is approximated by the relative variance, based on the sampling units that report the item of interest plus the relative variance of the proportion of the population that reports the item. This can be derived by expressing the population mean in terms of the mean of positive reports:
Ῡ = P Ῡp
and
CV2 Ῡ = (CV2 Yp + (1-P))/NP
where Ῡp is the mean of positive responses and P is the proportion of population sampling units with the item of interest. An analysis of the relationship of the proportion positive and the variability of the positive sample units shows that if only 10 percent of the sample units have the item of interest, sample sizes must be increased by 12 times the sample size necessary if three-quarters of the population has the item of interest, to maintain the same level of precision. The conclusion is that minor or rare data items need to be be treated separately when developing the MSF, either by stratification in the area frame or by using a list frame. The list frame for rare items will be more efficient than the area frame only if auxiliary data showing the presence of the item and relative size is available.
• The average number of parcels per holding, average parcel sizes, average field sizes, and the usual distance from the holder’s location to the land that he or she operates are necessary to determine the choice of sampling unit for the area frame, and to determine the cost function for either area frame or list frame surveys.
17
• Requirements for data analysis. It is important to be aware of the requirements for data analysis. For example, is it important to understand the characteristics of food-secure households, compared to those of households that are not food-secure? A similar question would be to relate food security with the use of fertilizers and modern seeds and small farm productivity, to seek an understanding of what drives the incidence of food security. This is only one example of an analysis that could be performed when the farm as a production unit is connected to the household as a social unit.
• Use of multi-stage sampling. Chapters 4 through 7 provide guidelines on the development of area and list sampling frames and on their joint use when applying multiple frame sampling. An underlying issue in the development of these sampling frames is the use of multi-stage sampling, which consists in first sampling PSUs as described in Chapter 1 above, and then selecting samples only from the selected PSUs. While this Handbook illustrates the methodology for developing sampling frames, it is not intended to be a handbook on sampling methods. However, a basic understanding of sampling variability is necessary when deciding whether to use multi-stage sampling.The variance of a mean or total contains two components: variability between PSUs and variability within PSUs.
V2 Ῡ = V2 (between PSUs) + V2(within PSUs)
Census data or data from administrative reporting systems can be used to examine these sources of variability. If these data are not available, then expert judgement on the distributions can be used as described above. However, the relative costs of developing a single-stage sample as opposed to those from two-stage sampling may indicate that multi-sampling is preferable. Annex A provides a more detailed view of the variance components. Note, for example, that the variances within PSUs are additive across PSUs and weighted by the PSU probabilities of selection. This indicates two points. First, highly variable PSUs capture population heterogeneity better than those that are more homogeneous. Second, PSUs should be selected with probabilities proportionate to measures of size, so that the PSUs with the greatest variability have the greatest probability of selection (perhaps even equivalent to one).
The process of determining the content, scope, and coverage of the items to be included in the survey system, and their distribution by size and geography is a crucial step in the development of the MSF. This must be done for each of the major items for which statistics will be provided. Much of the research and analysis mainly focuses on methods to produce crop statistics; the reality is that the integration of the survey system brings in the need for livestock statistics, household and farm income, and food security measures.
Chapter 3 provides a review of important sample design issues that are relevant to the development of the MSF

18

19
3Sample design considerations when developing a Master Sampling Frameby Cristiano Ferraz and Frederic Vogel
3.1. OVERVIEWSelecting a useful and efficient sample requires a background in sampling statistics and a sampling frame designed to meet the country’s needs in terms of agricultural statistics. Although it is not within the scope of this Handbook to provide an extensive account of sampling theory, some relevant elements of sampling design are introduced in this Chapter, to guide the appropriate development and use of an MSF.
The entire sample survey process is more than a mere sample selection procedure. It involves a series of steps, many of which are related to the choice and definition of fundamental concepts in sampling – such as target population, frame, sampling and reporting units – which must also be considered in developing the sample frame. These concepts and the basic methods of probability sampling required to understand the inference problem in agricultural sample surveys are presented. A listing of relevant sample selection schemes is given. Finally, attention is drawn to some practical aspects of designing a sample that should be considered when developing the sample frame.

20
3.2. INTRODUCTORY CONCEPTSSurvey sampling is the selection of a subset of units from a finite population, from which information may be obtained such as information on crop production, livestock inventories, and other economic, environmental and social measures . Estimators based on the sample design convert the sample data to the universe being measured. The method applied in selecting a sample of units to measure items of interest is relevant to the survey’s inference capabilities. Before the sample selection procedure can be performed, several choices pertaining to methodology and definitions require knowledge of certain basic concepts. These are introduced below:• Population or target population
A population, or target-population, is the finite set of all elementary units [sampling units] about which information is sought. Depending on the survey’s goals, the elementary units, or simply the elements of a population, may assume different forms. Three typical elements are: holdings or farms, holders or farmers, and households or dwellings. In addition to the nature of its elements, defining a population requires identification of a place and a point in time. The set of all holders of a province in 2014, and the set of all households of a region in a given year are examples of populations.
• SubpopulationMulti-purpose aspects of agricultural surveys may require estimates for subpopulations of interest. These are specific subsets of elementary units for which inferences are required. For example, if maize production is an item of interest, then inferences for the subpopulation of holdings with maize production from irrigated lands may be necessary.
• Frame or sampling frameA frame is the set of source materials from which the sample is selected (UN, 2005). In this Handbook, two types of frames are commonly cited: area frames and list frames. A good frame should provide full coverage of the population of elements [sampling units], enabling the identification and accessibility for each of them. In a survey in which the set of all farmers of a country is the target population, a frame listing each farmer and his or her address is an example of a LIST FRAME that provides direct access to each item of interest. On the other hand, an area frame for this same population, for which a segment of area would be the sample unit, can provide direct access to a land parcel and the capability to measure the items of interest by observation, or an indirect type of access by interviewing the operator of the parcel in the segment. To obtain information on items of interest such as income, each selected segment of area must be linked to a farmer (or a set of farmers). This is often feasible only after a visit to the field.
• Sampled populationThe frame definition clearly states that the sample is effectively selected from the frame. If the frame is complete, unique and up-to-date, the process of sampling from it coincides with the process of sampling from the target population. In this case, the sampled population, also called frame population, is the same as the target population. Frame limitations, however, may lead to discrepancies between the sampled and target populations. This may happen for a variety of reasons: it may be known that the best available list frame is incapable of covering the population; or a listing of households or holders may change in the time between sample selection and data collection. Because lists change over time, rules of association must be established to determine when new households/holdings should be substituted for those no longer in existence, so that the sampled and target populations may be brought together. In any case, the inference is valid for the sampled (frame) population.
• Variables of interestThe variables of interest are characteristics that relate to each item of interest and are measured for each element of the population. If maize is an item of interest, then the area, yield, and production of maize are examples of variables of interest that would be measured for each farmer of a population. If income is an item of interest, then income from crops and livestock are examples of variables of interest that would also be measured from each farmer or household.
• Parameters Parameters are numerical characteristics relating to each item of interest that are aggregated over the population’s elements. Usually, they are summaries of the values of the variables of interest, taken over all the population
21
elements. The average crop yields, the total area cultivated for a specific crop, or the percentage of farms using a certain type of transportation are all examples of parameters of interest for a survey.The concepts of variables of interest and parameters of interest are related. A variable of interest is a specific data item to be collected for each population element. For example, if a census is carried out, the aggregated values of the variables of interest for the whole population are parameters.
• Sampling unitSampling units can be an element or a set of elements from the target population, identified through the frame. The sample unit is the basic frame unit component that can be directly selected by a randomization process, leading to the sample selection. If multiple stages of sampling are necessary, a sample unit will be associated to each sample stage. Sampling units defined for the first stage are the PSUs; sampling units of the second stage are called SSUs, and so forth.
• Observation unitWhile sampling units are randomly selected frame component units, observation units are the units on which the measurement procedure is applied. Sometimes, sampling and observation units are the same. In area sampling, for example, sampling units can be segments of land, while observation units can be: i) the segment of land if objective measurements are to be taken; or ii) the holder or holders responsible for making use of the sampled area if they are to be interviewed to provide the information required. In list frame surveys, the sampling unit may be a name, while the observation unit can be the holding and/or the parcel of land being operated.
• Reporting unitReporting units can be defined as the units that report the required data concerning population elements. If such data come from direct measurements, the reporting and observation units are the same. However, they commonly differ from each other when, for example, a farmer is asked for a subjective estimate of his production on a certain type of crop. In this case, the farmer is the reporting unit that provides information about the farm (observation unit).To understand the relationship between these concepts within an agricultural survey, an overview of each is given in two country examples below:
3.2.1. The Gambia’s national agricultural sample survey The Gambia’s National Agricultural Sample Survey8 is a national-level survey from which the following concepts can be identified.
Target population: The set of all households in the country engaged in growing crops and/or breeding and raising livestock in private or in partnership with others, for a given period or point in time.
Subpopulation of interest: Given the population description, an example of subpopulation of interest for Gambia’s survey could be the set of livestock producers.
Frame: The survey used a list of EAs available from the last population census. Once an EA was selected, a list of household clusters (called dabadas) was built; from these, the households that were mainly agricultural were identified to enable the selection of agricultural dabadas. Then, all households of each agricultural dabada selected were listed to enable selection of the household sample.
Sampled population: In this survey, the sampled population is consistent with the target population to the extent that the list of EAs from the last census is still up-to-date and the list of households on each selected dabada are also up-to-date.
8 http://www.gbos.gov.gm/nada/index.php/catalog/6#page=overview&tab=study-desc.

22
Variables of interest: For this survey, the variables of interest are the answers to a series of questions asked to each householder. It includes, for example, the total number of cattle that are less than one year old, the area of maize planted in a specific year, yield, production, etc.
Parameters of interest: Examples based on the variables of interest mentioned above are the quantity of seeds (in Kg) used from own production; the total number of cattle less than one year old in the country; and the area planted and harvested to a given crop. Estimates of these parameters can be obtained by applying estimators based on the sample design to the quantity of grain (in Kg) and to the area of maize fields planted in a given year, respectively.
Sampling unit: Three stages were necessary to select the sample. In each one, a sampling unit was identified. The primary sampling unit was the EA; the Sub-Sampling Unit is a dabada; and the final sampling unit is a household.Survey rules are necessary to link the sampling unit to the target population if the frame becomes out of date.
Reporting unit: The holding and all activities associated with it is the reporting unit.
3.2.2. The US agricultural resource management surveyThe United States National Agricultural Sample Survey9 is a national-level survey from which the following concepts can be identified.
Target population: The target population comprises “all establishments that sold or would normally have sold at least $1,000 of agricultural products during the year, excluding abnormal or institutional farms” for a reference year.
Subpopulation of interest: Given the population description, an example of subpopulation of interest is the set of establishments from the population that received government subsidies.
Frame: The survey uses a list frame of farms from the USDA-NASS, accounting for 90 percent of the country’s land in farms.
Sampled population: In this survey, the sampled population corresponds to the set of farms described in the definition of the target population that is included in the 90 percent of farmland covered by the frame. For the purposes of the survey, the remaining 10 percent is supposed to have a negligible impact on estimates.
Variables of interest: The percent of total planted acres that received one or more applications of a specific fertilizer nutrient or pesticide active ingredient is an example of variable of interest, for this survey.
Parameters of interest: The percentage of total planted acres that received one or more applications of a specific fertilizer nutrient or pesticide active ingredient is an example of parameter of interest for this survey. Note that this corresponds to taking an average of the variables of interest mentioned above.
Sampling unit: In this survey, the sampling unit is the name of the farm operator or the name of the enterprise.
Reporting unit: The reporting unit is the land operated by the selected name and all agricultural activities associated with that holding.
9 http://www.nass.usda.gov/Surveys/Guide_to_NASS_Surveys/Chemical_Use/ChemUse FieldCropsStatisticalMethodology.pdf.
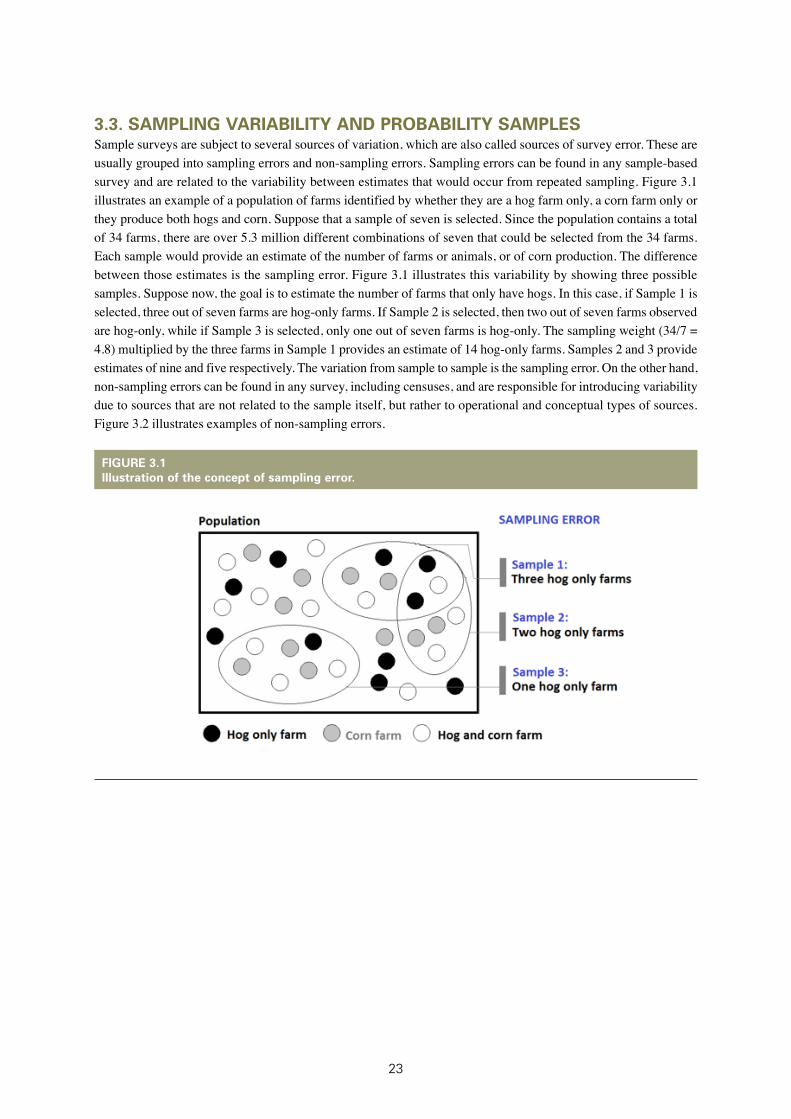
23
3.3. SAMPLING VARIABILITY AND PROBABILITY SAMPLESSample surveys are subject to several sources of variation, which are also called sources of survey error. These are usually grouped into sampling errors and non-sampling errors. Sampling errors can be found in any sample-based survey and are related to the variability between estimates that would occur from repeated sampling. Figure 3.1 illustrates an example of a population of farms identified by whether they are a hog farm only, a corn farm only or they produce both hogs and corn. Suppose that a sample of seven is selected. Since the population contains a total of 34 farms, there are over 5.3 million different combinations of seven that could be selected from the 34 farms. Each sample would provide an estimate of the number of farms or animals, or of corn production. The difference between those estimates is the sampling error. Figure 3.1 illustrates this variability by showing three possible samples. Suppose now, the goal is to estimate the number of farms that only have hogs. In this case, if Sample 1 is selected, three out of seven farms are hog-only farms. If Sample 2 is selected, then two out of seven farms observed are hog-only, while if Sample 3 is selected, only one out of seven farms is hog-only. The sampling weight (34/7 = 4.8) multiplied by the three farms in Sample 1 provides an estimate of 14 hog-only farms. Samples 2 and 3 provide estimates of nine and five respectively. The variation from sample to sample is the sampling error. On the other hand, non-sampling errors can be found in any survey, including censuses, and are responsible for introducing variability due to sources that are not related to the sample itself, but rather to operational and conceptual types of sources. Figure 3.2 illustrates examples of non-sampling errors.
FIGURE 3.1Illustration of the concept of sampling error.
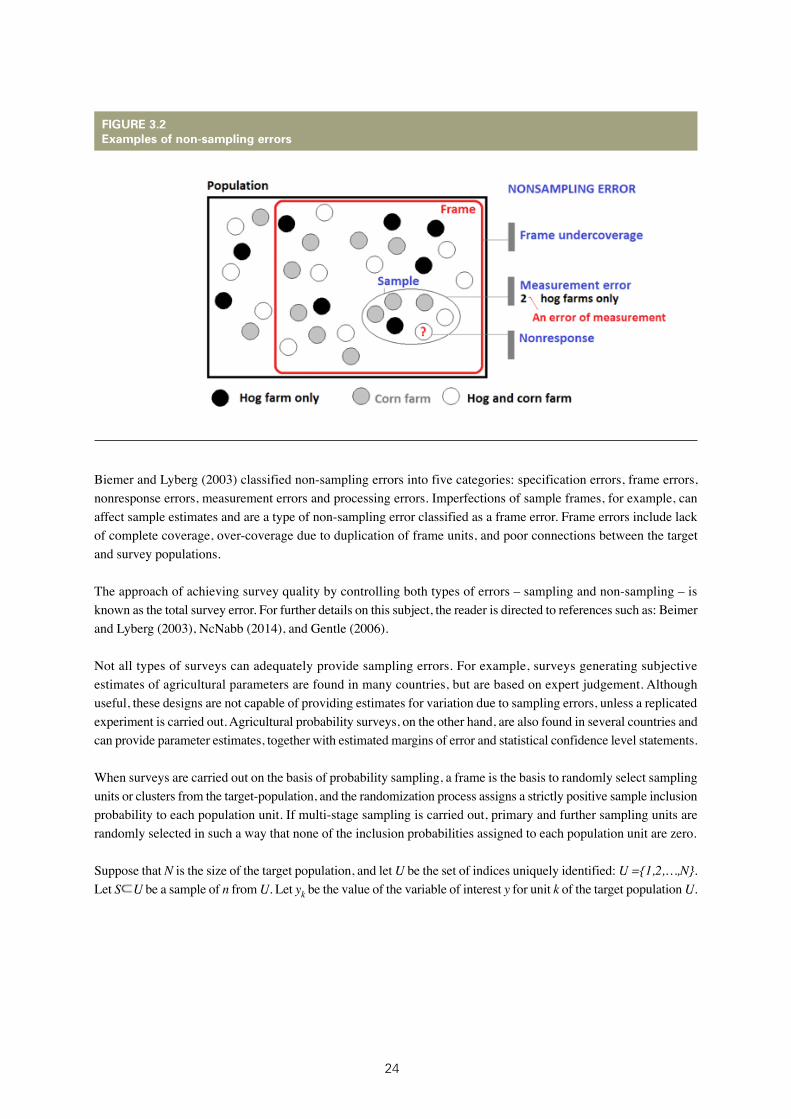
24
Biemer and Lyberg (2003) classified non-sampling errors into five categories: specification errors, frame errors, nonresponse errors, measurement errors and processing errors. Imperfections of sample frames, for example, can affect sample estimates and are a type of non-sampling error classified as a frame error. Frame errors include lack of complete coverage, over-coverage due to duplication of frame units, and poor connections between the target and survey populations.
The approach of achieving survey quality by controlling both types of errors – sampling and non-sampling – is known as the total survey error. For further details on this subject, the reader is directed to references such as: Beimer and Lyberg (2003), NcNabb (2014), and Gentle (2006).
Not all types of surveys can adequately provide sampling errors. For example, surveys generating subjective estimates of agricultural parameters are found in many countries, but are based on expert judgement. Although useful, these designs are not capable of providing estimates for variation due to sampling errors, unless a replicated experiment is carried out. Agricultural probability surveys, on the other hand, are also found in several countries and can provide parameter estimates, together with estimated margins of error and statistical confidence level statements.
When surveys are carried out on the basis of probability sampling, a frame is the basis to randomly select sampling units or clusters from the target-population, and the randomization process assigns a strictly positive sample inclusion probability to each population unit. If multi-stage sampling is carried out, primary and further sampling units are randomly selected in such a way that none of the inclusion probabilities assigned to each population unit are zero.
Suppose that N is the size of the target population, and let U be the set of indices uniquely identified: U ={1,2,…,N}. Let S U be a sample of n from U. Let yk be the value of the variable of interest y for unit k of the target population U.
FIGURE 3.2Examples of non-sampling errors

25
The inclusion of k in the sample is indicated by the following random variable:
Probability sampling designs introduced in the next section determine the exact distribution of Ik, providing the sample inclusion probabilities:
Given a probability sampling design, a unifying result, due to Horvitz and Thompson (1952) ensures the unbiased estimation of parameters such as means, totals and percentages.
Consider, from now on, the problem of estimating a population total:
Thus, the Horvitz-Thompson estimator is given by
It can be seen that the estimator cannot be applied to non probability samples, where the values of πk are not known and some are zero.
A general form for the Horvitz-Thompson variance estimator can be written as
In addition, an unbiased estimate of the variance may be obtained using
Observing the estimator of the variance formula above, itcan be seen that unbiased variance estimation based on the Horvitz-Thompson approach requires not only a probability sample (with πk > 0 for every k in the population), but also that πkl > 0 for every k and l. In other words, the frame must be designed in such a way that through the sample design, the probability of selecting each animal, crop area unit, or measure of income can be defined.
26
3.4. PROBABILITY SAMPLING DESIGNSSeveral authors have addressed the subject of probability sampling. Relevant examples may befound in Cochran, W.G. (1977), Lohr, S. (2009) and Barnett, V. (2002).
In the following paragraphs, a list of major sampling designs is provided, along with descriptions of their main statistical properties.
3.4.1. Simple random samplingSamples selected from a population of size N according to a simple random sampling design have a pre-assigned size n, and are such that the probability of selecting a given sample s is
In a simple random sample, the inclusion probabilities are
.
Therefore, when simple random sampling is used, it guarantees that each element identified by the frame has the same probability of being included in the sample.
However, use of this procedure does not guarantee the geographic spread of sampled points. For example, when selecting ten farms out of 50, it is possible that all farms selected are in one corner of the state or county. Hence, pure simple random sampling is seldom used, because it is preferred to retain more control over the sampling process. However, an understanding of the concepts is necessary, as these constitute the theoretical foundation of all other sampling methods.
3.4.2. Systematic samplingSuppose that a sample of size n is to be selected from a population of size N using a systematic sampling design. First, a sample interval, given by
is calculated. Suppose that a is an integer number. Then, a sample of one is randomly selected from the first a elements identified by the frame. Thereafter, every a-th element of the frame is also included in the sample. If a is not an integer, then a fractional interval method can be carried out as explained below:
Step 1. Randomly select a real number b from a uniform distribution in the range of (0, a];
Step 2. The first element of the sample is the small integer that is greater than or equal to b;
Step 3. Thereafter, choose the small integer thatis greater than or equal to b+a, b+2a,…, b+(n-1)a
Example: To select a systematic sample of size n=5 from a population of size N=21, we calculate a=4.2 and proceed to the following steps:

27
Step 1. Randomly select a real number greater than 0 and smaller than or equal to 4.2. Suppose that this number was b=2.1.Step 2. The smallest integer greater than or equal to b is 3. Element 3 is the first element of the sample.
Step 3. The next elements will be the smallest integers greater than or equal to b+a=6.3, b+2a=10.5, b+3a=14.7 and b+4a=18.9. Therefore, the corresponding elements in the sample are: 7, 11, 15 and 19.
In systematic sampling, the inclusion probabilities are
Systematic sampling has the desired property of ensuring geographical spread. In addition, its implementation is very straightforward. It is even possible to select a sample in the field, if necessary. For example, suppose that the first stage is a sample of villages and a listing of farms in the sampled villages is prepared. A simple systematic sample could be collected on the spot. However, this sampling method also presents some disadvantages.
Compared to simple random sampling, systematic sampling selects a sample from a very limited number of possibilities. Although it is a probability sample, it leads to an assignment of probabilities of zero to some πkl. Therefore, it is not possible to provide an unbiased estimate for the variance – based on the Horvitz-Thompson variance estimator – when using such sampling. To overcome variance estimation limitations, a systematic sampling is often selected within a replicated sampling design. Systematic sampling improves the traceability of the sampling process. It also makes it easier to prove that the sampling process has not been manipulated.
3.4.3. Replicated samplingIn replicated sampling, the sample procedure involves selecting several small samples, instead of a single large one. For example, to select a sample of ten from a population of 50, replicated sampling could involve selecting two samples of five. The two samples can be selected by simple random sampling or by systematic sampling. The primary reason for using replicated sampling is to retain the advantage of systematic sampling but to allow sufficient randomization to estimate sampling errors correctly. Replicated sampling also makes it easier to rotate samples and make adjustments in sample allocations, when necessary.
3.4.4. PPS samplingIn the previous examples, each population unit had the same chance of being selected, regardless of the method of selection or the population unit’s actual size. If a measure of size can be attached to each unit, a probability-proportional-to-size (PPS) sample can be drawn. The following example is used to illustrate:
Name Measure of Size Accumulated Measure
1 10 10
2 1 11
3 4 15
4 15 30
5 5 35
28
A PPS sample can be selected using either simple random, systematic orreplicated sampling. For example, if a simple random sample of 2 is to be selected, two random numbers between 1 and 35 will be chosen. Any random number between 1 and 10 will select Name 1. Only random number 11 will select Name 2. To make sure that two unique names are drawn, random numbers are selected until two unique names have been selected. Procedures as described above for systematic and replicated sampling can also be used to select samples proportionate to the measure of size. To select a sample of two using systematic sampling, first determine the interval 35/2 = 17.5. Then, select a random number between 1.0 and 17.5. Again, any random number between 1.0 and 10.0 will select the first sample unit. Next, add the interval to the first random number to determine the second sample unit.
3.4.5. Multivariate probability-proportional-to-size (MPPS)In PPS sampling, the measure of size comes from a single variable. For example, in area sampling, the area of a segment can be used as a measure of size to select a PPS sample. The efficiency of PPS sampling lies in the level of correlation between the variable of interest and the variable used as a measurement of size. If there are several variables of interest, however, a single measure of size will not properly represent all items. If a series of potential size measures can be identified in the frame, a multivariate probability-proportional-to-size (MPPS) sampling can be carried out, to use all of them in the process of generating an improved size measurement. The accumulated measures of size can be used as the selection variable.
The same example as that described for the PPS, with two available measurements of size, follows:
Name Measure 1 Measure 2 Improved Accumulated of Size of Size Measure of Size Measure
1 10 8 10 10
2 1 2 2 12
3 3 4 4 16
4 15 10 15 31
5 5 19 19 50
Suppose that there are J≥ 2 variables of interest (items), each having at least one auxiliary variable that can be used as a measurement of size. Let xjk be the value of the size measure j for element k in a given f frame. Let also
be the total of the auxiliary variable j over frame f. In addition, let nj be the sample size needed for the variable of interest j. Then, the inclusion probability under an MPPS design is given by
The remaining steps for selecting the sample are identical to PPS sampling.

29
3.4.6. Cluster samplingThe main characteristic of cluster sampling is that the sampling unit is a cluster of units. To select a cluster sample, a simple random sample of clusters is taken and each unit in the selected clusters is investigated. Systematic or replicated sampling can also be used to select a cluster sample.
The efficiency of cluster sampling improves when the variability of the sampling units within clusters is large.However, since clusters for agriculture are defined geographically, they tend to be homogeneous. In these cases, more clusters will have to be selected and then subsampled, using measures of size. However, cluster sampling for agriculture is a powerful tool – in terms of time and cost – for developing a sampling frame and using it as a basis for sample surveys.
3.4.7. Two-stage samplingTwo-stage sampling is the sampling procedure that results when an extra stage is added to cluster sampling. Suppose that 50 farms clustered into 15 villages are to be surveyed. Suppose further that it is decided to select five villages at random, obtain a listing of all farms within each selected village, and then select two farms from within each village. In this case, each farm has a chance of appearing in the sample at least once with each of the other farms, and the overall sample size and survey workload can thus be controlled.
Compared to (single-stage) simple random sampling, sampling variability in two-stage sampling is usually larger because two sources of variability are present: variability between PSUs (villages) and variability between SSUs (farms within villages). Annex A illustrates the variance estimator for two-stage sampling to comprehend the variance components. If two-stage sampling is used, it is important that auxiliary information be obtained to guide the first- and second-stage selections. In addition, cost factors must be considered, that is the cost of building a complete frame as opposed to the additional survey costs deriving from a larger sample using two stages of sampling. The main reason for two-stage sampling is the reduction in survey and frame-building costs.
In two-stage sampling, PPS or MPPS can also be used.
3.4.8. Stratified samplingIn stratified sampling, the population is first divided into subgroups called strata, in a process called stratification. Then, elements are sampled from each stratum (subgroup) on the basis of a given probability sample design, such as simple random sampling.
Stratification can be used for several purposes, but each requires some information on the sample units. Sometimes, stratification is used when estimates are to be made for subpopulations of interest, such as geographic or administrative areas or rare items.
In these cases, to stratify the population, only an indication of physical location, or presence or absence, is sufficient.
Stratification is also used when the size of sample units varies considerably. The measure of size does not have to be accurate, but rather simply provide a means to group similar sampling units. It is only necessary that like sample units remain in the same stratum. For example, size codes are satisfactory if each defines “like” units.
It is often necessary to define the number of strata.
Generally, only a few – four or five, for example – are required. More strata will be necessary if the stratification is performed to separate sample units by relative size and by type (for example, the number of cattle by meat or milk).

30
Table 3.1 below illustrates the relative efficiency of stratified sampling compared to simple random sampling. Note that even with good measures of size, little efficiency is gained with more than four to six strata.
TABLE 3.1Effect of correlation between item and measure of size, and the number of strata, on the relative efficiency of stratified sampling
Number ofstrata
Correlation between survey item and measure of size
.20 .40 .60 .80 .90
Variance ratio between stratified and simple random sampling
2 .85 .70 .55 .40 .32
4 .81 .63 .43 .25 .16
6 .80 .61 .42 .22 .11
8 .80 .60 .41 .21 .11
If the stratification is performed for geographical or type-of-farm reasons, the desired breakdown will determine the boundaries. If stratification is by size, some general rules of thumb are:1. The total of the item being estimated across the strata should be equalized.2. The means should be as different as possible between strata.3. Large, unusual farms or those producing rare items can be placed in separate strata.4. Some strata can be called “pre-select” that is, to be included with certainty if they contain units so large that they
would excessively influence the variance.
If the frequency distribution of the population is considered as a whole, these operations will be in the skewed tail of the distribution. A rule of thumb is to include those more than two standard deviations from the “nearest neighbour”.

31
4. SUMMARYThere is a close relationship between the development of the MSF and the sampling methods to be used. Due to the variability associated with agriculture in terms of the items of interest and of the farms and households, both must be considered in developing the frame.
The following chapters of this Handbook provide guidelines for the use of technology in developing frames, area and list frame methods, and multiple frame sampling.

32

33
4Guidelines on the use of technology for sample frame developmentby Javier Gallego
This chapter provides guidelines on the use of technology for developing area sampling frames and list sampling frames. The tools to be discussed are related to the geolocation of sampling units, and are Global Navigation Satellite Systems (GNSS; better known as GPS), Geographic Information Systems (GIS) and Remote Sensing (RS).
4.1. GEOGRAPHIC INFORMATION SYSTEMS (GIS)GIS are tools for collecting, storing, retrieving, transforming and displaying spatial data. These tools are used to manipulate, and operate on, geographical elements such as points, lines, polygons and continuously varying surfaces. In a broader sense, the concept of GIS can also include the different sets of information stored, often known as layers.
A GIS provides a framework for storing and combining different information layers. This may be information required to build the sampling frame, select the sample and compute extrapolation coefficients, as well as information generated while carrying out the survey.
A wide range of GIS software tools exists. Many packages are available free-of-charge and most are open-source; other tools are commercial, with very heterogeneous prices. The software environment must be chosen very carefully, taking into consideration the price, flexibility, available training opportunities, and support provided (including the community of users and developers). Among the commercial GIS tools, Arc-GIS is probably the most widely used. It is rather complete but expensive. The most popular free GIS systems are GRASS and QGIS. Image analysis systems such as ERDAS have a number of GIS analysis capabilities.
4.2.1. Types of layers in a GISThe elements to be stacked in a GIS may be points, lines, polygons or nearly-continuous surfaces. A polygon can be visualized as a polyline that finishes in the starting point, but if we do so in a GIS, the system will not be capable of understanding the topology, i.e. concepts such as “inside” or “outside”. Nearly-continuous surfaces are represented as “rasters”, i.e. bi-dimensional arrays of square cells (pixels) of constant size. Many spatial analysis operations,

34
such as an intersection of maps, may be carried out both as polygon layers and as raster layers, but operations in raster mode are often faster and require less computational power.
4.2.2. Projections The general problem of cartographic projections will not be discussed in detail here. Rather, a few recommendations will be given on issues that can lead to anomalies, if not managed with sufficient care when building a sampling frame in a GIS environment. • All combined layers for a given analysis should be in the same projection. • Some GIS tools make an automatic “on the fly” re-projection of each layer added to a specific map. For example,
an analyst may be working in UTM (Universal Transversal Mercator) projection and add a layer in geographic coordinates. The system will display it in UTM even if the corresponding files have the information in geographic coordinates. However, the accuracy of such “on the fly” projections is not always optimal (at least at the current state of technology). Therefore, it is recommended to use an explicit tool for re-projection before combining different layers.
• Among the desired properties of a projection, the most important property for applications dealing with area estimation is preservation of the proportion between areas (equal-area projections). A given projection cannot be conformal (preserving angles) and equal-area at the same time. Some commonly used projections – such as UTM – are not equal-area, but the area distortion of an UTM projection is extremely low; also, in practice, there is no major objection to using an UTM projection. The most important rule is to avoid the direct use of latitude and longitude, especially for large regions that are not close to the Equator. Other projection systems present distortions if they are used far from the area for which they were conceived. Generally, it is best to respect the choice made by the relevant National Geographical Institution.
4.2.3. Geo-referencing elements in a list frameList frames are often built on the basis of population or agricultural censuses, or administrative records. Traditional list frames do not contain precise location (geo-referenced) information on their constituent elements. The information on the location of a household or a farm is limited to linking them to a given small administrative unit.
List frames can be enriched with the precise location of their units in a digital format. If the units are administrative units, the list frame may already exist or be easy to produce; however, this is not always true for small administrative units, which are often used in the first sampling stage. The units may be communes, villages or EAs that were specifically defined for a census. Building or updating a digital layer of EA boundaries may require a significant investment, but it is usually cost-efficient in the medium term because it can be used for multiple purposes. In the case of agricultural surveys, it enables EAs to be characterized on the basis of land cover maps as an intermediate step towards stratification,or for an expost correction of estimates. It also facilitates the integration of list frames and area frames to build a multiple frame. • Geo-referencing plots: Some administrative record systems envisage an obligation to geo-reference their
elements, such as parcels or buildings. This is the case with many cadasters for taxing purposes. However, using a cadaster as a basis for a sampling frame is not always a good solution, because the owner often is not the person operating the holding and the physical cultivated plots may be very different from the cadastral plots. The potential usefulness of a digital cadaster for a sampling frame should be carefully considered on a case-by-case basis.
• Geo-referencing a household by reference to the dwelling’s coordinates is relatively easy in principle, but may not always be a good geographic reference of its agricultural activity, since the fields managed by the household may be located far from the dwelling. The question becomes even more complicated if we consider geo-referencing farms that do not have a 1-to-1 correspondence with households. In this case, a possible criterion could be the location of the farm headquarters (where most of the machinery or stocking facilities are located).

35
When building a two-stage sampling frame with EAs as PSUs and households or farms as SSUs, the list of households or farms in the selected EAs is built or updated. Recording dwelling or headquarters coordinates provides a useful quality assurance tool, especially in landscapes dominated by scattered houses or huts. The usefulness of dwelling coordinates is more debatable when the livelihood is concentrated in villages or towns.
4.2.4. Using GIS-based administrative registers as a basis to define an area sampling frameSome countries have GIS layers of single agricultural plots coming from administrative registers. The modality of data collection may be photo-interpretation of ortho-photographic products combined with field observations or farmers’ declarations. GPS-based coordinate measurement on the ground usually generates a large amount of boundary anomalies, which requires heavy GIS editing. Therefore, this task is generally not recommended if the result is only used to build a sampling frame. However, if such a layer has been elaborated for other purposes and is available, it provides an excellent information source for an area frame, even though it may not be very recent. As stated above, its potential usefulness must be assessed in the case of GIS layers provided by cadastral databases for taxing purposes. In this context, experience suggests that the difference between property and management is often so great that the expediency of building a sampling frame is questionable, and should be assessed on a case-by-case basis.
4.2.5. Administrative unitsMost countries have good GIS layers with the boundaries of large or intermediate administrative units; however, there may be changes in administrative boundaries. The suitable approach towards updating the GIS boundaries depends on how the units are legally defined. If physical boundaries (e.g. a river, a sequence of mountain peaks) are used for the legal definition, the best way to update boundaries will be the photo-interpretation of ortho-photographic products. If the boundaries have been graphically defined on hardcopy topographic maps, a suitable procedure may involve digitizing these maps, geometrically correcting them with the help of reference points (at least 10-20 points per map sheet should be considered) and editing boundaries with the digitized map on the screen background. If the background map is of good quality, intersection points of x-y (longitude-latitude) lines will be valid reference points and GPS coordinate capture may not be necessary.
The situation is more complex for the small units (which may not necessarily have a clear administrative meaning): EAs, communes, villages, etc. In some countries, the legal geographical definition may be unclear. This can lead to bias that is difficult to address if the units are used as PSUs, regardless of the approach selected to build the sampling frame.
A GIS layer of small units may be useful for several reasons, including the following: • A clear delimitation of small units is available for the implementation and assessment of any type of rural policy. • Data for these units will be easier to structure. These data can come from different sources, such as the census,
classified satellite images or subjective expert estimates. If these data are exhaustive or available for a very large sample, they can be used as covariates in a regression estimator. If extension workers are associated to EAs for which they regularly provide expert estimates, the units attributed to extension workers are likely to be the most relevant ones.
For the usefulness of these units in both the sample design phase and the estimation procedure, their size should be suitable for use as PSUs in the context of a two-stage sample.
Notice that the term “PSU” is sometimes used for units in which only one SSU is selected (Cotter and Tomczac, 1994). In this case, exhaustive covariates over the PSUs are not very useful as covariates in the estimation process,
36
because the single SSU observed in the PSU does not provide a “consistent” estimate for the PSU that can correlate well with the covariate.
If these units are too large, they may be affected by limitations in terms of efficiency. For example, if a country has 400 large communes, using them as PSUs may lead to a sample of e.g. 40 communes; this may be too small to ensure good sampling efficiency.
An excessively heterogeneous size of the PSUs (geographical area, number of farms or households, agricultural area) may also have a negative effect on efficiency, even if heterogeneity can be managed to some extent with PPS sampling or Horwitz-Thomson estimators. Strong heterogeneity can appear for communes and for census sections or EAs. Heterogeneity in terms of size for communes may be due to geographical or to historical reasons. If it is due to geographical reasons (with, for example, larger units in mountainous or very arid areas), it may be manageable with stratification. Heterogeneous size in census sections or EAs is generally linked to population density, and is therefore significantly reduced if stratification separates urban and semi-urban areas. The remaining heterogeneity need not necessarily be removed. In some cases, it may be advisable to combine PSUs, to reduce variability in the ultimate PSU sizes.

37
4.2. GLOBAL NAVIGATION SATELLITE SYSTEMS AND GLOBAL POSITIONING SYSTEMSA GNSS is a system based on a network of navigation satellites that is controlled by ground stations on Earth which continuously transmit radio signals – captured by receivers – to determine the receiver’s geolocation (longitude, latitude, and elevation) on the Earth’s surface. The oldest and most popular GNSS system is the US’s GPS. For this reason, GNSS systems are generally known as GPS. Another GNSS system is the Russian GLONASS. Two other GNSS systems are being developed: the Chinese BeiDou Navigation System (BDS), which is already operational in China and neighbouring areas; and the European Union GALILEO system. Although it is technically more correct to speak about GNSS, in this text the acronym “GPS” shall be used, as it is far more frequently used.
Generally, a GPS provides support to field activities: geo-referencing plots, household or farm headquarters; locating sample units the coordinates of which are known; or measuring the area of a plot or landscape patch. At the stage of definition of a master frame, their use is rather limited.
4.2.1. Using GPS to define a sampling frameThe construction of a layer of agricultural plots is a costly operation. It is often performed for taxing or subsidy purposes (cadasters or administrative registers) by computer-assisted photo-interpretation of ortho-images, but additional field visits with GPS observations may be required. If many field visits are required, the cost may soar very quickly. Generally, the cost is difficult to justify for the specific purpose of building a sampling frame.
Another (more reasonable) use of GPS to build an area frame is collecting coordinates of reference points for the geometric correction of images or of maps that have not been geo-referenced adequately.
4.2.2. Using GPS to run a survey (field work)This is the most important application of GPS for agricultural statistics. When the sampling frame and sample selection has been defined on the basis of coordinates (possibly in a GIS environment), points with given coordinates in the field must be located. The two main tools for locating a point are ortho-photographic documents and GPS. If the ortho-photographic documents are of good quality, they should be given priority if there are inconsistencies within the range of accuracy of the GPS device and the ortho-photographic documents. Relatively often, field boundaries change after the date of the ortho-image. In this case, GPS usually provides a warning signal, but an additional check of the distances is a wise precaution to take.
Measuring plots with GPS. GPS is very useful to measure the area of single plots on the field. For small fields, at the end of the twentieth century and beginning of the twenty-first century, area measurement with GPS was considered insufficiently accurate for small plots. GPS measurements used to be less precise but faster than traditional measurement by tape and compass. In an FAO pilot project, a small negative bias of GPS measurement was observed (Keita and Carfagna, 2009). However, more recent studies (Carletto et al., 2015) strongly suggest that technological advancements in more recent years with moderate-priced GPS have led to significant improvements, especially when signals of more than one satellite constellation can be combined (GPS and GLONASS currently; Galileo and BeiDou should follow).
GPS as a tool for quality control. In some area frame surveys, surveyors will sometimes make observations from unsuitable points due to location errors or to a certain level of negligence, especially if weather conditions are bad. This type of error can be controlled if surveyors are required to record the point from which the observation is made with a protected GPS device.

38
GPS for point location control in objective measurement yield surveys. A possible source of bias in yield surveys with objective measurements on a sample of points relates to the determination of the point in which the crop sample will be collected. The traditional approach consists in providing rules on the number of steps that the surveyor should take in certain directions. The movements are determined with the help of a random number table. In some pilot projects (Taylor et al, 1997) it has been observed that surveyors are not very rigorous on applying the rules when their supervisors are not present. The sampling process is more rigorous if coordinates are sampled before the field work and then recorded in the field with a GPS device, with a picture of the location being taken.

39
4.3. REMOTE SENSING In this Handbook, RS refers to images acquired with a conventional camera or electronic sensors from aircraft or satellites. The scenes record radiation in several ranges of the electromagnetic spectrum, including the normal visual range, microwave radar, infrared, and ultraviolet. The techniques applied to process and interpret remote sensing imagery include visual photo-interpretation and a wide range of numeric algorithms. This section provides guidance on the use and choice of technology to develop a sampling frame and later in the estimation process.
4.3.1. Main types of satellite imagesMost satellite images are produced by optical sensors that measure earth reflectance. To date, other types of images, such as Synthetic Aperture Radar (SAR) or Laser Imaging, Detection and Ranging (LIDAR) have had little impact on agricultural statistics. SAR images are linked with the roughness of the land cover, and LIDAR provides very accurate measures of distance. SAR images have the advantage of measuring through clouds. This should be a major advantage in areas with persistent cloud cover, but the high noise/signal ratio has limited their usability thusfar, except for the delineation of areas cultivated with paddy rice. It appears that the SAR images recently made available from the Sentinel 1 satellite present a major improvement, and pre-operational applications may be soon available.
Currently, the most popular optical images are very high resolution (VHR) images, with a pixel size between 0.5 and 2.5 m. However, these images are often affected by strong limitations, for the purposes of agricultural statistics: full coverage of a given country tends to be too expensive and complex to manage, if built specifically to define a sampling frame or to produce estimates in a given year. However, if a full ortho-photographic coverage has been produced for other purposes and is available, it can be an excellent basis for stratifying an area sampling frame. An alternative that could be considered, in theory, is to construct an area sampling frame on the basis of a sample of VHR images. This option would requireusing PSUs of a size and shape similar to the VHR images and would lead to inefficient sampling schemes (Gallego, 2012; Gallego and Stibig, 2013).
Some leading companies in the information technology sector produce public-access image mosaics with global coverage (Google Earth, Bing). There are potential uses of these images for agricultural statistics. A major advantage is that they are available and easily accessible, with an efficient interface. Most agricultural areas of the world are covered byVHR images; this is a significant asset, especially for countries that seldom have recent homogeneous ortho-image coverage. However, these public image layers have some limitations: • Image geometry. For example, the so-called Google projection is not an equal-area projection. It was conceived
to optimize display speed at variable scales, but it is not optimal to provide comparable area measurements in different locations. In any case, the distortion introduced by the projection is likely to have a minor impact, for the purposes of agricultural statistics.
• Image overlay: when an older image is substituted with a recent one, the overlay between the two images displays a shift of up to 20m. This may introduce inconsistencies, if an older image is used to define a master frame and a different image is used to produce support documents to locate a given point or plot in a specific survey.
• Heterogeneous image dates. Neighbouring areas may be covered by images that have been taken from five to eight years apart. The impact of using images with such heterogeneous dates to define a master frame could be moderate if the field boundaries are relatively stable, but may be difficult to assess otherwise. Image viewing tools (Google Earth, Bing) report a date for the image on the screen, but this does not always coincide with the date on which the image was acquired.
Images with a resolution of 10-50m were called “high-resolution images” until the 1990s. At the time of writing, they are referred to as medium-resolution images. The most popular satellite series that provides medium-resolution images is Landsat. The Landsat-TM images have a resolution of 30 m, which since Landsat-7 has been complemented with a panchromatic (black-and-white) band with a resolution of 15 m. Traditionally, these are the most widely used for land cover mapping at national or subnational level, and especially for cropland identification. An important characteristic of satellite images is the swath, i.e. the width of the area covered by each pass of the

40
satellite. TM images have a swath of 180 km, compared to the 60 km of SPOT, another widely used earth observation series of satellites. A non-negligible difference between Landsat and SPOT is the distribution policy, since Landsat images can be distributed free of charge. There is a large number of satellites and sensors of the medium-resolution type, the availability of which is generally more heterogeneous. Hopefully, the June 2015 launch of Sentinel 2 with 10 m resolution and a 290 km swath will bring significant improvements.
Coarse resolution images with a pixel size between 250 m and several km generally do not enable single agricultural fields to be distinguished, except in countries with very large plots. They have the advantage of high frequency (usually, new images are available on a daily basis) and are a major tool in monitoring the status of vegetation, yield forecasting, and early warning; however, they are of limited interest in defining an MSF.
4.3.2. Aerial photographsSince a wide range of satellite images is now available, the more traditional aerial photographs are receiving less attention by users, even though the popular Bing image database is mainly based on aerial ortho-photographs,which are usually clearer than satellite images.
In many cases, aerial photographs still present substantial advantages over satellite images. When a photogrammetric flight over a country is carried out, the entire area is usually covered in a relatively short period, with fewer problems due to cloudy areas. When a large area must be covered, they are often cheaper than equivalent VHR satellite images. Over the last few decades, ortho-correction algorithms have dramatically improved, which has enabled reductions in cost.
For the purpose of agricultural area frame surveys, aerial ortho-photographs generally provide the best field survey documents (even when the photographs are not recent), unless the landscape has undergone significant changes since the date when the images were acquired. For the purposes of stratification, they can constitute an excellent alternative to satellite images; however, the advantage of aerial photographyis not very clear, because very high resolution is usually not essential for stratification.
In recent years, the potential use of drones (unmanned aerial vehicles) is being widely discussed. The ortho-rectification and mosaicking technique is sufficiently developed to produce documents with acceptable accuracy, and the dates for image acquisition can be chosen with a flexibility similar to that presented by a field survey. A limitation of drones in many countries comes from flight regulations, that often forbid the flight beyond the sight of the operator. This limits the size and the shape of the area that can be covered by a single flight, preventing in particular the acquisition of long and thin stripes of images that would be much more efficient than compact areas. Thus, the limitation on the efficiency of drones may be similar to that of VHR images. The area covered by a drone during a flight can be seen as a surrogate of a segment. Drones are capable of providing images with a spatial resolution of approximately 5 cm. If the great majority of crops cultivated in a region can be identified with images having a resolution of 5 cm, drones could substitute field surveys. In areas with a complex crop pattern – in particular, with a significant amount of mixed crops – this is unlikely to happen.
Small low-altitude piloted aircraft provide images with a similar resolution (approximately 5 cm). They have the advantage of being more frequently authorized to fly long stripes (around 100 km by 100 m), much more efficient in terms of variance than approximately square units with the same area. Efficient stripe-based sampling plans can be defined for small aircrafts, especially for the estimation of nomadic livestock.

41
5. SUMMARYThis chapter provides an overview of the technology available for agricultural statistics and indicates those that are most effective for developing sample frames. Most of this technology supports the development of sample frames; however, it can also be used effectively for land cover classifications that can be linked to census or administrative areas.

42

43
5Using list frames to build and use Master Sampling Frameswith information from population and housing censuses, agricultural censuses and farm registers
By Miguel Galmés and Naman Keita
5.1. INTRODUCTIONAs stated in Chapter 1, “[a] basic sample frame for agricultural statistics is a listing of the units from which the sample is to be selected at any stage of sampling”. This list is the sampling frame.
The sampling frame seeks to reproduce the target population. However, due to imperfections in the frame, the two sets (“target population”and “sampling frame”) are rarely the same.10 There are two main types of frames for agriculture: a) area frames and b) list frames. Both types are precisely defined in Chapter 1.
As specified in Chapter 1 and following the definition given by FAO (1996), the main difference between the two types of frames is “whether the final stage of sample selection is land based, or based on a listing of farms or households. The final sampling unit for a list frame is either a name of a farm, the farm operator, or the head of the farm household”. Upon this definition, “the final sampling unit for an area frame is either a segment of land or a point that will be associated with a tract of land. When the final stage of sampling is an area segment, all farms with land in the segment are included in the sample. The probability of selecting each farm is simply the selection probability of the segment”.
An MSF often combines both types of frames.
As seen above, in an area frame, the sampling units are pieces of land. In a list frame, the sampling units can be holdings, households, persons, etc. The list is compiled either by reference to complete enumeration operations, such as censuses, or from administrative records.
10 FAO (1989) distinguishes four levels of populations: “survey population” (population represented by the sample); “frame population” (population that covers the elements from which the sample was actually selected but it is larger than the survey population by the amount of total non-responses); “target population” (which differs from the frame population by the number of coverage errors); and “inferential population” (using implicit or explicit models, sometimes, inferences are made from the target populations to other populations).
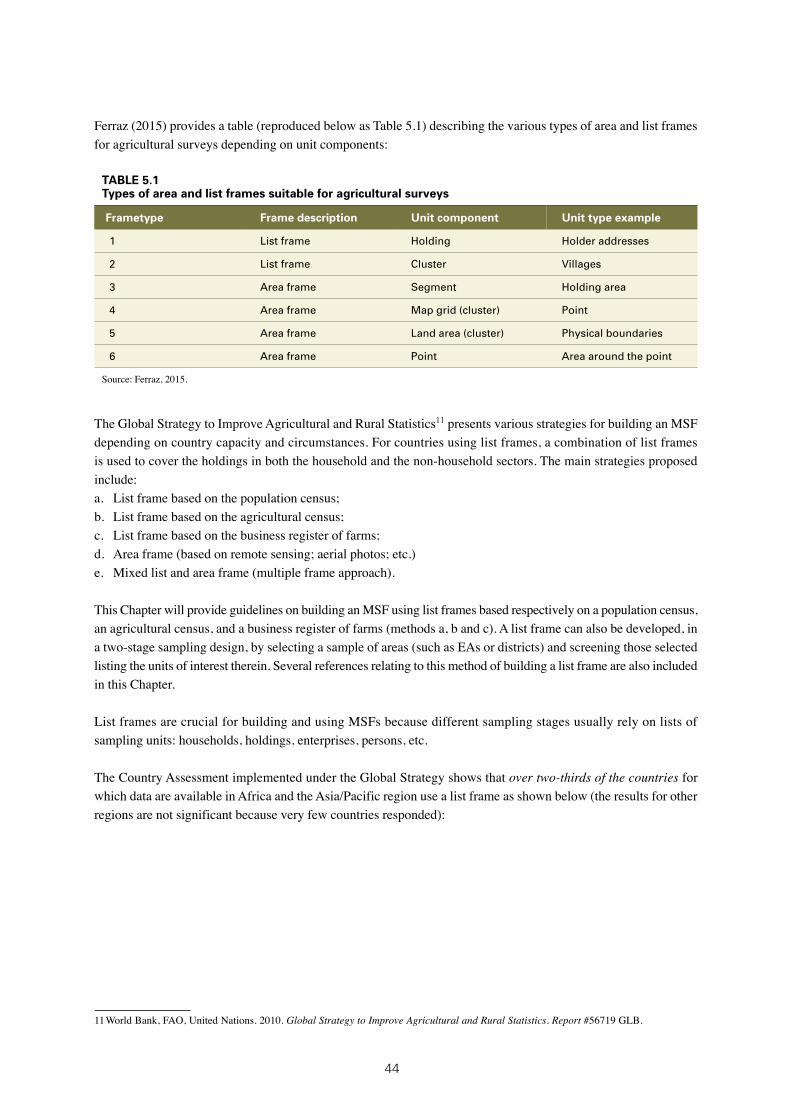
44
Ferraz (2015) provides a table (reproduced below as Table 5.1) describing the various types of area and list frames for agricultural surveys depending on unit components:
TABLE 5.1Types of area and list frames suitable for agricultural surveys
Frametype Frame description Unit component Unit type example
1 List frame Holding Holder addresses
2 List frame Cluster Villages
3 Area frame Segment Holding area
4 Area frame Map grid (cluster) Point
5 Area frame Land area (cluster) Physical boundaries
6 Area frame Point Area around the point
Source: Ferraz, 2015.
The Global Strategy to Improve Agricultural and Rural Statistics11 presents various strategies for building an MSF depending on country capacity and circumstances. For countries using list frames, a combination of list frames is used to cover the holdings in both the household and the non-household sectors. The main strategies proposed include: a. List frame based on the population census;b. List frame based on the agricultural census; c. List frame based on the business register of farms; d. Area frame (based on remote sensing; aerial photos; etc.)e. Mixed list and area frame (multiple frame approach).
This Chapter will provide guidelines on building an MSF using list frames based respectively on a population census, an agricultural census, and a business register of farms (methods a, b and c). A list frame can also be developed, in a two-stage sampling design, by selecting a sample of areas (such as EAs or districts) and screening those selected listing the units of interest therein. Several references relating to this method of building a list frame are also included in this Chapter.
List frames are crucial for building and using MSFs because different sampling stages usually rely on lists of sampling units: households, holdings, enterprises, persons, etc.
The Country Assessment implemented under the Global Strategy shows that over two-thirds of the countries for which data are available in Africa and the Asia/Pacific region use a list frame as shown below (the results for other regions are not significant because very few countries responded):
11 World Bank, FAO, United Nations. 2010. Global Strategy to Improve Agricultural and Rural Statistics. Report #56719 GLB.

45
AP: Asia and Pacific; LAC: Latin America and Caribbean; SSA: South Saharan Africa.
In most of these countries, information from population censuses remains the primary source for building frames for household surveys (demographic households or farm households). For countries conducting agricultural censuses through complete enumeration, sampling frames for the holdings in the household sector can be built using that information. Business registers are mainly used to cover non-household holdings (registered corporations, special holdings, large commercial holdings, etc.).
While these sources are widely used in developing countries, certain issues must be addressed when actually building, using and maintaining an MSF. Some of these issues are highlighted in Chapter 1 of this Handbook.
46
5.2. USING LIST FRAMES TO BUILD MASTER SAMPLING FRAMES
5.2.1. Using population census data to build Master Sampling FramesAs specified in Chapter 1, the main challenge in building a sampling frame is to obtain a listing of units from which the sample is selected. In the case of list frames, the ultimate sampling unit is the farm12 or farm household. Therefore, identification of farm households is a critical step. Since the Population and Housing Census (PHC) provides a complete enumeration of all households and population in a country, it is a unique source for building list frames in most countries.
Traditional Population and Housing Census (PHC)In all countries, the PHC usually includes items on labour that can be useful in identifying own-account agricultural production. Own-account agricultural production covers both households producing mainly for final use by the household or primarily for sale. These data enable “farm households” to be identified as households if some member or members manage an agricultural holding.
There are severe limitations upon the use of such limited items (FAO/UNFPA, 2011). However, they can be useful when it is not possible to include dedicated agricultural items in the PHC. This approach is usually not recommended, since it is difficult to produce an accurate or complete list of farm households. Nevertheless, it may still be useful as a starting point for the listing exercise of the agriculture census.
The labour data items included in traditional PHCs are: (i) economic activity status (ii) main occupation and (iii) industry of main occupation. To identify farm households, the economic activity status must be considered together with occupation and industry. Those who also have a main occupation or industry involving agriculture production activities would be farm households.
1. Economic activity status To distinguish between farm households and households with agricultural labourers, the item status in employment is necessary. Economic activity status provides information on the type of economic activity engaged in by the person, and covers those who are employed, unemployed and outside the labour force.
Typically, response categories for economic activity status include the following:1. Employer2. Employee3. Self-employed/own-account worker4. Unpaid family worker/contributing family worker5. Unemployed/looking for work6. Homemaker/housewife7. (Full time) Student8. Retired9. Disabled
In some countries, employers and own-account workers are grouped together, because it is difficult to distinguish between the two groups (http://laborsta.ilo.org/applv8/data/c2e.html#n1). Households engaged in own-account agricultural production activities should have at least one member who is a self-employed worker or own-account worker; or employer. Farm households will also include members who are unpaid family workers. However, it is sufficient that the members who are self-employed/own-account workers or employers be identified.
12 In this document, the terms “farm” and “holding” are used interchangeably.

47
It must be noted that none of the above categories define the sector of work. Indeed, the primary objective of these categories is to establish a person’s status in terms of whether he or she is or is not part of the labour force. For the purposes of identifying persons and households engaged in own-account agriculture production, these categories are to be matched with the appropriate combination of occupation and industry.
2. Main occupation and industry of main occupationThis item is collected for each economically active person in the household, and can be used to identify persons doing agricultural work. As defined by the United Nations Principles and Recommendations for the Population and Housing Censuses, “occupation” refers to the type of work done in a job by the person (or the type of work done in the last job held, if the person is unemployed), irrespective of the industry or the status in employment in which the person should be classified. The “type of work” is described by the main tasks and duties of the work. In some countries, the occupation is only asked of those who have actually worked during the reference week.
Occupation classifications tend to follow international standard coding, as defined by ILO’s International Standard Classification of Occupations 08. However, most countries add a number of additional codes for occupations that are unique to that country or that are not adequately captured under the standard coding system. When encountering these categories, it may be helpful to refer to the industry classification, as this tends to be more straight forward.
The “industry” (branch of economic activity) refers to the kind of production or activity of the establishment or similar unit in which the job(s) of the economically active person (whether employed or unemployed) was located during the reference period established or the data on economic characteristics collected.
The industrial groupings that cover the scope of the agricultural census under International Standard Industrial Classification 4.0 are: • Group 011: Growing of non-perennial crops;• Group 012: Growing of perennial crops• Group 013: Plant propagation• Group 014: Animal production • Group 015: Mixed farming
Some countries expand the scope of the agricultural census beyond that listed in the World Census of Agriculture Programme, to collect data on aquaculture, forestry and household capture fisheries. For such countries, these activities should also be considered for main occupation and industry. Guidance on meeting additional data needs through a wider census of agriculture is covered in the World Census of Agriculture 2020 Programme.
The “main occupation or industry of main occupation” (point 2 above) will identify whether a household member is involved in agriculture by identifying individuals engaged in agricultural occupations. This must be considered together with economic activity status.Some individuals with a main occupation in the agriculture sector could belong to households that are not engaged in own-account agricultural production but where the members are only agricultural labourers. Households with only agricultural labourers are not within the scope of interest, because the aim is to identify own-account agricultural production or farm households.
Examples of main occupations in agriculture of individuals belonging to farm householdsEach country has its own occupational classification, such that exact occupation titles or groups differ. However, examples of relevant occupations are:

48
Field crop and vegetable growers; tree and shrub crop growers; gardeners; horticultural and nursery growers; mixed crop growers; livestock and dairy producers; poultry producers; apiarists and sericulturists; mixed crop and animal producers; subsistence crop farmers; subsistence livestock farmers; subsistence mixed crop and livestock farmers.
For countries that wish to expand the scope of the census to collect data on topics beyond the scope of agriculture, aquaculture workers and household fishers may also be of interest. The conceptual framework established by the Global Strategy includes aquaculture within the scope of agriculture.
DECISION SEQUENCE
Economic Activity Status. At least one member is:
Own-account worker or self employed or employer NO >[stop]
Occupation related to agriculture OR Industry in agriculture falls under ISIC >NO [stop]work OR
for countries with a broader census Group 011: Growing of non-perennial crops;beyond the scope of agriculture: Group 012: Growing of perennial cropsfisheries or aquaculture Group 013: Plant propagation Group 014: Animal production Group 015: Mixed farming
OR for countries with a broader census beyond the scope of agriculture Group 032 :Aquaculture Group 031: Fishing
FARM HOUSEHOLD or HOUSEHOLD WITH FISHING OR AQUACULTURE
Population and Housing Census with an agricultural moduleGiven the limitations of the approach described above, a growing number of countries are collecting agricultural data during the PHC that can be used to better identify farm households and provide a list of EAs with information on the number of farm households.
During the PHC, the country is divided into EAs in which a complete enumeration of all households is conducted. A considerable amount of preparatory work is dedicated to preparing EA maps with precise boundaries; in many countries, these maps are produced in digital format. Many countries also use handheld GPS devices to create these maps. GPS can also be used to geo-reference households; thus providing additional information for the frame.
When relevant agricultural data are collected and processed, as explained above, a complete list of all farm households (with their geo-referencing coordinates, if included in the PHC questionnaire) will be available. Given the complete coverage of all households during the PHC, both the farm households located in rural areas and those in urban areas will be identified.
The farm households are identified by inquiring whether they are engaged in own-account agricultural production activities. This can be done by including two basic items:

49
Basic Item 1: Own-account agricultural production. Own-account agricultural production identifies those households engaged in agricultural production for own final use by the household, whether for sale or ownconsumption. This will identify whether the household is a farm household. To cover the areas recommended by the WCA, this should comprise agriculture (which covers crops and livestock). The areas of aquaculture and on-farm forestry activities can also be included. Some countries, such as those in the Pacific region, have identified fisheries activities of the household in past PHCs, as these are key activities in the region.
Basic Item 2: Measure of farm size. This item gives an indication of the size of the holding. It usually refers to the area of the land or to the number of plots used for agricultural purposes; or number of livestock of different types. In some countries, the measures of area and size are not well known to farm householders. In these cases, it is better to refrain from including an item on measure or farm size, as the data may be inaccurate and may cause difficulties for respondents. The item is more suited to countries where the information is well known to respondents.
FAO/UNFPA (2011) discusses in detail the conceptual and operational issues relating to the different statistical units in a PHC (demographic household) and an Agricultural Census or Survey (Agricultural Household and Holding) is provided. Different scenarios are discussed, including one-to-one correspondence and all other cases.
The list of all farm households thus obtained from PHCs can be used directly to build an MSF in the household sector, if there is a one-to-one correspondence between agricultural households and holdings. A list of farm households can be established, including details on their production. Having this detail allows for very efficient sample designs for targeted surveys which cover a very specific population. For example, farm households with livestock (for a livestock surveys) or farm households that grow rice (for a rice production survey).
In most countries, where a multistage survey design is used, an MSF as a list of EAs should be considered. In this case, the list of all EAs and associated agricultural data (number and size of farm households) can be used to build an MSF for selecting the PSUs. Sometimes, it may be necessary to combine the EAs from PHCs in which the number of farm households is too small, to form a new unit; some EAs can be deleted if they do not contain farm households. This list can then be used for selecting samples for agriculture surveys.
Guidelines for choosing PSUs in a multiple-stage sampling design.In a multi-stage sampling design (which is usually used in agricultural surveys), the identification of the clusters that will constitute the primary stage (or sampling) units (PSUs) is paramount regarding the design’s efficiency. Theory establishes that PSUs should be as internally heterogeneousas possible – with respect to the variables of interest – to capture the variability of the entire population with relatively small PSU sample sizes. In this respect, a previous stratification of PSUs is often necessary to build groups of PSUs as similar as possible (see Chapter 3). Then, the PSUs should strive to capture the variability of the population within each stratum.
In defining the PSUs in a multi-stage sampling design, the practitioner may choose from various “candidates”, such as: EAs from the population census; EAs from the agricultural census; and administrative divisions such as Municipalities, Districts or Settlements. Also, adhoc PSUs could be constructed, as in the case of area sampling.
Therefore, the question is: which of the possible clusters of sampling units should be used as PSUs? Some general guidelines follow:1. The first question relates to costs, and field costs in particular. The decision to use a multiple-stage sampling
design is usually based on the fact that the main component of the survey cost consists of the cost of traveling to the PSU. Once in the area of the PSU, the sampled reporting units in the PSU (SSUs) are more or less close to one another, and the collection of information is cheaper. In such cases, it would be desirable to have a “small” sample size of PSUs and a “bigger” sample of SSUs. If this is the case, it is advised to attempt to select attempt to select, as PSUs, the subdivisions of the population that best reproduce the characteristics of the variables in the
50
population. For example: in mountainous (or hilly) landscapes, agriculture practices and crop varieties depend, to a large extent, on the height above sea level. Therefore, if the PSU does not feature significant differences in height (for example, the lands within the PSU only vary between 3,000 and 3,500 feet above sea level), the PSU does not capture the population’s variability, because the same crops and practices are likely to be cultivated or used throughout the PSU. However, if the PSU is defined “from bottom to top” for example, as a strip of land between 500 and 4,000 feet above sea level – it will better represent the variability of the entire population. In terms of theory: the correlation coefficient for the variables of interest among units within the PSU is lower in the second case than in the first case; and the variances of the estimators are linear functions of the correlation coefficient (see Cochran, 1953, Chapter 9.4).The selection of PSUs as outlined in the previous point leads to greater SSU sampling sizes. Naturally, if the PSUs are more homogenous internally, a small sample of SSUs and a bigger sample of PSUs will be required and, again, costs should be considered carefully. Indeed, when defining the PSUs, it must be noted that the variance of any item in a two-stage sampling design is equivalent to the variance “between” plus the variance “within” the PSUs. The variance for Item Y “between” is simply the variance among the PSUs’ totals of variable Y; the variance “within” is the variance of Y between sampling units (SSUs) in the selected PSUs. Chapter 2 and Annex A illustrate the variance components in detail. Due to the above mentioned cost considerations, it is desirable to sample “not too many” PSUs or, in other words, seek to ensure that the variance “between” contributes less than the “within” in the total variance. This reasoning leads to PSUs that are as similar as possible between them, in terms of the totals of the variables. This is not a straightforward outcome, because the surveys are multi-purpose in nature and several variables displaying different behaviours are involved. Sometimes, PSUs must be combined to ensure that all are almost equal, in terms of the item to be measured. Usually, some compromise is ultimately necessary.
2. The pre-stratification of existing PSUs can make a great contribution to the accuracy of final estimates. Within each stratum, different sampling schemes can be applied depending on the variables’ characteristics.
3. The analysis must also take into consideration the “overall picture” of the items of interest in the country. For example, if a particular crop is concentrated in a small area, it would very efficient – for estimating parameters related to that crop – to define that area as one PSU to be selected with probability equal to 1. The same idea may be applied to remote areas with few farms, which can also be selected with probability equal to 1. In this case, due to the difficulty of access, special handling of the SSUs – including the use of previous data or satellite imagery – is necessary.
4. Another point that deserves analysis is the size of the PSU. The literature provides criteria for determining the PSU’s “optimal size” (seefor example, FAO, 1989; Cochran, 1953; or Sukhatme & Sukhatme, 1970). In practice, however, statisticians should use the existing lists of PSUs (administrative lists of villages or districts, or of EAs, from the population or the agricultural census). In addition, agricultural surveys are multipurpose in nature, such that a compromise among different “optimal sizes of PSU” is usually needed.
5. PSU boundaries must be well-defined and identifiable in the field. This point is paramount, for both sample selection and field work. The sampled PSU must be unambiguously identified and field enumerators must thoroughly know the land that they are to survey. Clear and up-to-date maps, along with the geo-referencing of at least four points in the PSU boundary, greatly contribute to the identification of the appropriate PSU.
The costs of the field work must also be considered when deciding the size of PSUs. Landscape characteristics, the distance between units in the field, and the means of access to the PSU and to the units inside the PSU are elements that influence the survey cost. Most countries observe the following rule in defining the size of EAs for population or agricultural censuses: the size of the EA should be approximately the number of units that one enumerator would be able to visit during the period of the field work. For example, if an enumerator can visit

51
about five farms each day, and the total time for the census is estimated to be 20 working days, the EA should include approximately 100 farms. Country practices show that population and housing censuses have EAs of about 120-150 households, while agricultural census EAs contain approximately 80-100 farms. It is desirable that the PSUs in an MSF be the same EAs; this means that agricultural census EAs should be the same as those of population censuses (it reasonable for120-150 households in rural areas tocontain 80-100 farms…) and these EAs would be the PSUs in the MSF.
Example of criteria for combining enumeration areas to form a primary sampling unitIn the case of Bangladesh, the threshold was set at 40 households per PSU. Of the 259,828 EAs, 12,273 had fewer than 40 households. These small EAs were considered as candidates for merging. When combining small EAs to form PSUs, the main consideration was that the EAs to be combined be contiguous. However, due to the lack of reliable (geographic) maps for these EAs, it was decided to combine the small EAs based on the criteria provided below. In addition, due to the conceptual and logistical problems in the classification of statistical metropolitan areas (SMAs) and other urban areas, it was decided that they would both be classified more generally, as urban.1. An EA with more than 40 households is directly considered as a PSU.2. A small EA is attached to an adjacent EA that belongs to the same urban/rural classification and mauza13.3. A small single EA in a mauza can be combined with an EA of another mauza, provided that both mauzas belong
to the same union and the EAs to be combined belong to the same urban/rural category.Following these criteria, a total of 248,904 PSUs were constructed from the 259,828 original EAs.Source: Maligalig & Martinez, 2013
In most countries, two-stage sample designs are used. The MSF for the first stage is the list of all EAs, adjusted as indicated above with the number of agricultural households (as an indication of size). Each EA may also contain additional auxiliary variables on agriculture. These EAs are now geo-referenced and digitized in a growing number of countries, and can be inserted into a GIS.
A random sample of EAs is selected (usually with PPS) and screened to obtain the second stage frame, which is an updated list of agricultural holdings and used as the frame from which the sample of farm households for agricultural surveys is selected. Data collected on agriculture can be used as an auxiliary variable to improve survey design (create strata, determine sample size, allocation to strata, and choice of method of selection).
5.2.2. Using agricultural censuses to build Master Sampling FramesThe process of building an MSF based on an agricultural census applies when the census is conducted as a complete enumeration. The approach is very similar to the case of the population census featuring additional items on agriculture. When the census is taken on a sampling base, the list of areas in which the sample was taken is the only available frame that covers the whole country. In these cases, only the areas sampled for the census have auxiliary information that can be used for designing samples for agricultural surveys that will be based on a sub-sample of the census (sample-based).
However, more relevant auxiliary information can be obtained and used when two-stage sample designs are applied; data from agricultural censuses can significantly improve sample design. In particular, better account can be taken of rare items or geographically concentrated activities. Master samples can be developed which can be used to select subsamples for other surveys. Census data can also be used as benchmarks for forthcoming surveys.
Lists from an agricultural census provide excellent auxiliary information for the sampling design purposes: ratio and regression estimators can be used, because there is enough information on variables at the population level
13 A mouza or mauza is a type of administrative district that corresponds to a specific land area within one or more settlements may exist.

52
to proportionate or make regressions between sampling observations and population values; stratification or PPS sampling is also facilitated. The same is true of directories of households involved in agriculture from population censuses containing an agricultural module. The problem with both types of census is that the data become obsolete, due to the long time between collection periods. In some cases, several years may pass before the census data become available, which makes them obsolete before they were even disseminated.
Section 5.4 provides some guidance on updating MSFs based on lists from population or agricultural censuses.
5.2.3. Using business registers of farms to build a Master Sampling FrameAs specified earlier, “a basic sample frame for agricultural statistics is a listing of the units from which the sample is to be selected at any stage of sampling”. Therefore, the quality of the frame will depend on how well it covers all population units; the goal of the statistician is to maximize coverage and, if possible, provide measurements of under-coverage.
FAO (2005) distinguishes two categories of agricultural holdings: (i) holdings in the household sector and (ii) holdings in the non-household sector.
A distinctive feature of agriculture in developing and developed countries is the respective importance of these two categories in the agriculture sector. In developed countries, the non-household sector tends to be the most important; in most developing countries, the contrary is true: the household sector is the most important sector for agriculture, with a limited number of non-household holdings. However, as economies develop, the non-household sector becomes increasingly important.
Population and agricultural censuses should provide information on both the household and non-household sectors, to include agricultural production on farms or holdings that are not associated with a household.
When the information available from censuses cannot provide accurate registers of the existence of farms in the non-household sector, other sources of information must be found to identify these units and complement the household-based holding, if complete coverage of the agricultural sector is to be achieved.
In some developed countries, particularly those of the Nordic region, farm registers play an important part in agricultural statistics. InBenedetti etal. (2010), Anders and Wallgreen provide a detailed description of how administrative registers can be used to create farm registers for multiple purposes in agricultural statistics, including (i) direct tabulation to provide estimates and (ii) contribute to building sampling frames for sample surveys. More generally, a review of the use of administrative data to improve official statistics in developed countries identifies the following four areas:• direct tabulation of statistical registers• reduce data collection costs• enable use of improved estimators• input for frame construction and sampling design.
The literature provides detailed explanations of the advantages and weaknesses and limitations of using farm registers in agricultural statistics, but these focus mainly on developed countries.
In most developing countries, the non-household sector is composed of several types of units including large corporations, government-operated holdings, cooperatives, large plantations, large livestock units, etc. There is no standard method for approaching all these units and obtaining a perfect list. In practice, all relevant registers should
53
be considered when building a master list of all holdings in the non-household sector. This may include:• administrative registers of corporations operating agricultural holdings (business registration/licensing registers)
land registration/cadastral records• lists of members of agricultural cooperatives, • lists of members of farmers’ associations or special commodity boards (for coffee, cocoa, tea etc.) • local knowledge and information from extension agents and local authorities about large specialty-type farms.
Most of these individual lists are likely to be affected by frame imperfections. These imperfections are not limited to the case of business registers, but they could be exacerbated in this context. The major risks are:a. Coverage errors
When analysing and integrating individual lists, care should be taken to ensure that all units of interest are included, and that only these units are included to minimize under-coverage and over-coverage. In practice, there tends to be a limited number of units in most developing countries, and they are usually visible and well known.Coverage may be an important issue when using frames based on farm registers. For example, farmers’ associations generally include farmers that produce particular crops, such as “rice producers association”, “banana producers’ association” or “association of dairy producers”. As group membership is voluntary, lists from such sources are usually not exhaustive, and other sources are required to complete the frame. Their use as (partial) sampling frames is preferable because, the associations tend to update their lists frequently; in addition, linking the actual farm to the farmer in the list is a straightforward operation. The main handicap of lists from farmers’ associations is their incompleteness, and the need to complement them with other sources. When combining lists from separate sources, caution must be taken, to avoid adding duplicates to the subsequent combined list.In broad terms, the use of land records (cadastral registers) is favoured: these provide a complete coverage of land maps (usually in digital form within GISs) that facilitates identification of the piece of land on which the unit is located. Ancillary information usually only refers to the total area of the cadastral parcel.
b. Errors due to misclassification Another risk concerns the accurate classification of the frame units, that is, whether the units are effectively members of the target population. This issue is related to the definition of the unit as adopted in agricultural censuses and surveys, which may differ from the definition adopted in various registers. Corporations and government institutions may have complex structures, in which different activities are undertaken by different parts of the organization with a varying degree of autonomy regarding management decisions. FAO (2005) recommends that the National Account concept of establishment should be used, where “an establishment is an economic unit engaged in one main production activity operation in a single location”. Land registry may be based on land ownership instead of the name of the holder effectively operating the holding. In addition, cadastral parcels are defined differently from agricultural land parcels, and linking the two may be difficult. Every effort should be made to ensure that the units in the registers correspond to the agricultural holding.
c. DuplicationThe other risk is that of duplication, “when a population unit is represented by more than one frame unit ”14 Here, too, every effort should be made to identify and reduce duplication.Therefore, the master list of holdings in registers should be prepared by crossing the information from various registers and by triangulation, to minimize these main risks and provide an acceptable complement to the household sector frame, to build a Master Frame with good coverage.In the case of registers from farmers’ associations, the same individual may (and usually does) appear with different names in different lists. Experience shows that the matching of names from different lists is extremely difficult. Another disadvantage of lists from farmers’ associations is that they do not contain enough ancillary information to improve the sampling estimates.
14 See House, C.C.’s contribution in Benedetti et al. (2010).

54
d. Other issuesIt is important to note that confidentiality is crucial in all statistical operations. Therefore, if tax records are used to obtain a list of farm operators, special care should taken to ensure the confidentiality of individual information. In many regions, local authorities maintain records of farm operators and the land operated in their respective areas. Their use as a source for building sampling frames requires a detailed and in-depth analysis to assess their quality. In particular, one must assess whether the source is up-to-date, complete and possesses the rules of identification, as well as other desirable properties.
5.2.4. Characteristics of list framesThe directory of units that constitutes the list frame should ideally exhibit at least the following characteristics:a. The list frame must contain well-defined units
The first requisite is that the units are precisely defined. Ambiguous definitions of holdings or parcels can lead to lists that are inadequate for survey purposes.
b. Each unit in the frame should have a unique identifierThe names of administrative units, such as villages, are not necessarily unique within a country. To ensure uniqueness and to facilitate sample selection and control operations, a carefully designed system of numerical identifiers (coding system) is necessary. The list frame contains a record for each frame unit. The only absolutely indispensable item is a unique identifier for each unit. If a unit is selected, the identifier provides the means of access to the population element for performing the survey or, eventually, subsequent sampling operations. The numerical identifiers (primary identifiers) will of course be linked with other identifiers (secondary identifiers), such as place names or coordinates of holdings sites, either within the frame itself or on maps or other auxiliary materials. The primary identifiers are used to select samples;they may also be used to link area units in a frame to the maps and sketches. For all purposes, the use of a hierarchical system is advisable: the first group of digits identifies the highest-level administrative division in which the frame unit is located; the next group identifies the second-level administrative subdivision, and so on, down to the individual frame units. Some provision for distinguishing urban and rural units may also be helpful. Secondary identifiers are used primarily to aid in locating frame units. Typical secondary identifiers are: names, address, coordinates (if GPS was previously used), and instructions on how to locate the unit. For agricultural holdings, the holder’s name is the key identifier. When building the frame from a field operation such as a census, the full name and alias (if any) should be recorded. It is very important to record the holding address as precisely defined in the enumeration manuals. For example:

55
ADMINISTRATIVE DIVISION PRIMARY IDENTIFIER (code)
SECONDARY IDENTIFIER
Region R
Department/State/Province R D
District/Municipality R D M
Community/Settlement R D M C
CENSUS DIVISION
Enumeration Area R D M C E
HOLDING
Holding number in the census cartography R D M C E H
Names and addresses of holding (if any), and holder or coordinates of main buildings or main parcel.
Not coded, onlyfor identification in field work
c. CompletenessThe third aspect refers to completeness. The concept of “completeness” involves two aspects: coverage and information provided for each frame unit. For frames that cover 100 percent of the target population, completeness of coverage can be verified by cumulating measures of size (such as land area of the census holdings) of the frame units and comparing the totals for administrative areas, such as states, provinces or districts, against available measures taken independently (such as cadastral registers, maps or satellite images). For frames containing a list of names or other units that are not necessarily related to land areas, checking for completeness is more complicated. Several lists can be used for comparison: farmers’ association lists, administrative registers at field level, etc. Frame completeness also requires that specific items of information, such as stratification variables and measures of size, be included in the record for each frame unit.
d. Rules of associationClear rules of association must be established between frame units, the target population, the associated reporting unit, and the data for the items of interest to be collected. The rules of association ensure that the probability of selecting every hectare of a given crop, every animal, every source of income, etc. is known and based on the probability of selecting the sample unit. In other words, the basic requirement of a rule of association is that it must assign to every sampling unit and item of interest a non-zero probability of selection that can be accurately determined. However, the association rules linking items of interest with frame units may not be clear. For example, the frame may list three units that appear as three different holdings. However, these may actually be three parcels of a unique holding. For the same reason, holdings operated in partnership by several persons also pose problems for list frames. It is common for the same holding to appear with different names in different directories or lists, and it is sometimes difficult to determine the identity. Therefore, it is not unusual for list frames to contain duplications.

56
e. Frames must be up-to dateList frames easily become obsolete. Populations are dynamic: some holdings disappear and new ones replace them. Holding operators change, new holdings appear, and urban expansion and new infrastructure result as farm land disappears, etc. In Section 5.8, the issue of maintaining and updating list frames is analysed.
f. Existence of auxiliary informationThe final requisite is that frames must contain auxiliary information to improve the sampling designs and estimators. The frame should include accurate and up-to-date supplemental data for each frame unit. Measures of size, such as total area, number of household members or number of land parcels are especially useful for stratification or sampling designs based on PPS selection methods. These auxiliary variables are necessary when using ratio or regression estimators. They are also important in the planning stage of the survey, to distribute the workload among interviewers. Errors in supplemental data do not necessarily lead to biases in survey results. They can, however, limit the efficiencies that can be gained from using better supplemental data for sample design or estimation. In other words, sampling errors are increased.

57
5.3. MAIN ISSUES ARISING FROM THE USE OF LIST FRAMES TO BUILD MSF FRAMES AND HOW TO ADDRESS THEMThe list component of an MSF can be built in several ways, such as by reference to the following: a. list of holdings from the latest agricultural census; b. list of holdings and/or farm households detected during the latest population census;c. directory of farms from administrative records, such as lists from farmers’ associations, cadastral registers,
property tax records, or registers from local authorities; d. list of holdings from an adhoc operation conducted prior to sample selection (for example, the listing of census
EAs selected from the area frame during the first sampling stage).
Usually, many directories are available, and no single one is complete or dependable; the main issue is how to combine these directoris to produce a unique and reliable list frame.
5.3.1. Advantages and disadvantages of list framesUnfortunately, list frames often fail to possess one or several of the above mentioned desired characteristics.
If adequate list frames are available, they are easy to use, they enable in-depth analysis of alternative sampling designs and their use in sampling is usually cheaper than building area frames. As mentioned above, a great advantage of list frames lies in the existence of ancillary information for improving sampling designs and estimators.
The main issue is to analyse the list frames available and establish their usability for the particular survey design under consideration. For example, in countries with well-developed statistical systems and where dependable administrative registers exist, directories from these registers are very good candidates as list frames, providing that they contain auxiliary data for sampling purposes.
Likewise, when the sampling design implies some type of combination of area and lists, the part of list within the frames are easier and cheaper to build than the area frames. Basically, the combination of area and list frames can take one of two forms:a. In a multiple-frame sampling scheme15, the list of “special holdings” complements the part of the population
covered by the area frame. Usually, these are commercial holdings that are included in farm registers (see Section 5.2.3 above). This list is easily updated, because those holdings are usually well known and visible. The information necessary for building and maintaining the list can be obtained from field extension officers, local authorities, farm associations, banks, local traders, etc. Ancillary information onholding size, type of crops, type of livestock etc. should also be compiled if the list frame is to be used for sampling purposes.
b. In a multi-stage sampling design, when PSUs are land areas (such as census EAs), and at subsequent stages the sampling units are holdings, households or parcels, the list must be constructed only for selected PSUs. It is possible (and usually efficient) to build a list frame of SSUs at a later stage, after the first-stage sample is selected, by collecting information on the population elements belonging to the sampled areas. Frames built in this way are up-to-date because they are compiled immediately before the sample selection. Usually, the listing of units within the first-stage sampling unit collects only operators’ names and land areas. Sometimes, the listing of units within the first-stage sampling units only includes the holders’ names and/or land areas. This is the case with traditional population censuses. On the other hand, when agricultural questions are added to PHCs, more ancillary information can be obtained (see Section 5.2.1 above). If the ancillary information is poor, it should be complemented with external data, such as information from satellite images (See Chapter 6).
In both cases, list frames can be relatively dependable and up-to-date. The main problems arise when list frames are not complete and/or they are obsolete, or contain erroneous units.
15 Multiple-frame sampling designs are analysed extensively in Chapter 7.
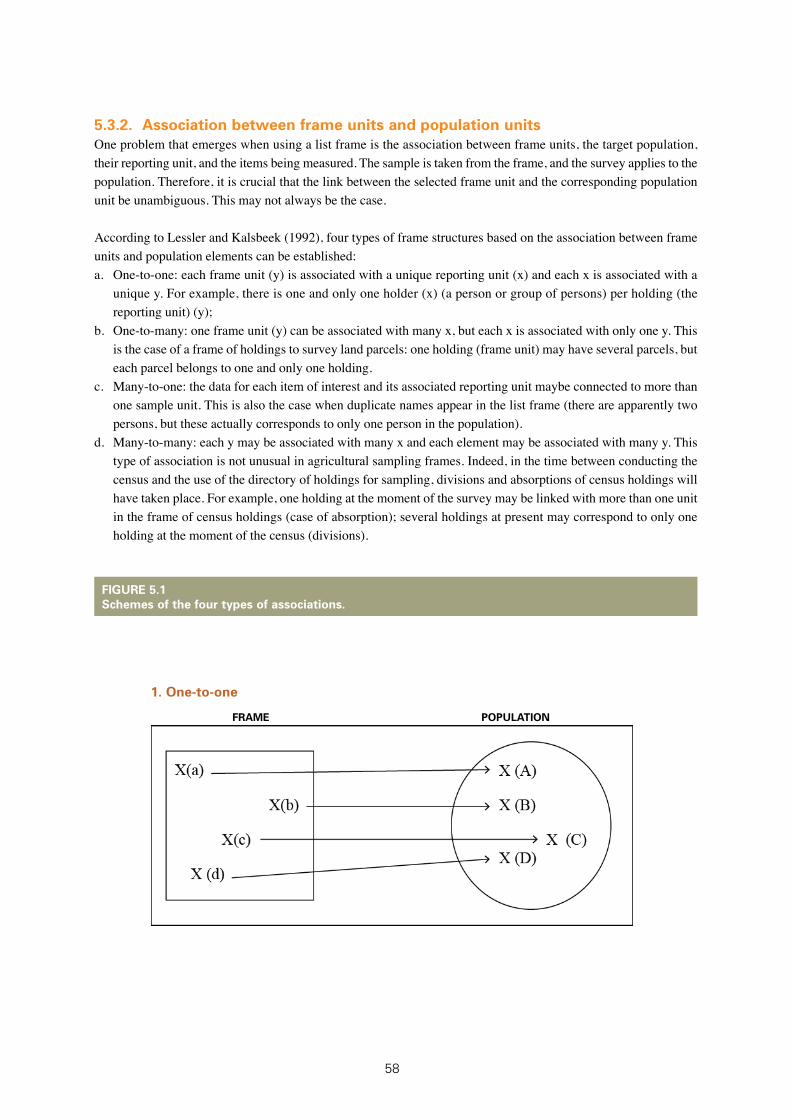
58
5.3.2. Association between frame units and population unitsOne problem that emerges when using a list frame is the association between frame units, the target population, their reporting unit, and the items being measured. The sample is taken from the frame, and the survey applies to the population. Therefore, it is crucial that the link between the selected frame unit and the corresponding population unit be unambiguous. This may not always be the case.
According to Lessler and Kalsbeek (1992), four types of frame structures based on the association between frame units and population elements can be established: a. One-to-one: each frame unit (y) is associated with a unique reporting unit (x) and each x is associated with a
unique y. For example, there is one and only one holder (x) (a person or group of persons) per holding (the reporting unit) (y);
b. One-to-many: one frame unit (y) can be associated with many x, but each x is associated with only one y. This is the case of a frame of holdings to survey land parcels: one holding (frame unit) may have several parcels, but each parcel belongs to one and only one holding.
c. Many-to-one: the data for each item of interest and its associated reporting unit maybe connected to more than one sample unit. This is also the case when duplicate names appear in the list frame (there are apparently two persons, but these actually corresponds to only one person in the population).
d. Many-to-many: each y may be associated with many x and each element may be associated with many y. This type of association is not unusual in agricultural sampling frames. Indeed, in the time between conducting the census and the use of the directory of holdings for sampling, divisions and absorptions of census holdings will have taken place. For example, one holding at the moment of the survey may be linked with more than one unit in the frame of census holdings (case of absorption); several holdings at present may correspond to only one holding at the moment of the census (divisions).
FIGURE 5.1Schemes of the four types of associations.
1. One-to-one
FRAME POPULATION

59
It is important to note that in the previous schemes, every unit and every element are linked. Cases of under-coverage and over-coverage are considered in the section on “frame imperfections”.
Determining the frame structure is crucial for making appropriate inferences from the sample survey to the target population, because the probability of selection of sample units depends on the frame structure. In the case of one-to-one or one-to-many associations, the probability that data are selected for each item of interest is the same as the
2. One-to-many
FRAME POPULATION
3. Many-to-one
FRAME POPULATION
4. Many-to-many
FRAME POPULATION
60
probability of selecting each frame unit. In the other cases, it is necessary to know the number of frame units that the items within the reporting unit are associated with, to produce unbiased estimators. The number of sampling units that would lead to the collection of data from the same reporting unit is referred to as “multiplicity”. Multiplicity arises if a holding has absorbed another holding after the list was created, and in the case of “over-coverage” of the frame (for example, two parcels of the same holding were mistakenly listed during the census as two different holdings). Alternatively, two or more people may jointly operate the holding and be listed separately in the list frame.
In the usual sampling designs used in agriculture, several frames with different types of association are used. For example, let us assume that a two-stage sampling design implies the following: a) in the first stage, census EAs are selected; b) in the second stage, holdings detected during the census are sampled. The frame of EAs for the first-stage sampling is a one-to-one sampling frame in which the list of EAs corresponds to the population of pieces of land. They were identified during the census and they do not feature any multiplicity. The frame for the second stage is the list of holdings coming from the census. Each holding must have a clear identifier so that in an ideal situation, without errors and with a perfect correspondence between listed holdings and actual holdings, this frame would exhibit a one-to-one correspondence with the population of holdings. Nevertheless, such correspondence is usually of the “many-to-many” variety. This is due to errors during enumeration (for example, the frame may contain one holding with two parcels, but they are actually different holdings, or during the census, two parcels of the same holding were taken as two different holdings. In the first example, one unit in the frame is linked with two population units, while in the second, two frame units are linked with only one holding in the population). A similar situation occurs when the frame becomes outdated (if, for example, a census holding was subdivided into three or two holdings). These situations occur simultaneously, such that the correspondence between the units in the list and the actual holdings are most likely of the “many-to-many” type.
The following sub-section analyses the implications of multiplicity in inferences.
5.3.3. Inferences made from list frames exhibiting multiplicity.The sample is obtained from the frame. Therefore, inferences refer to the “universe” of the frame. However, as seen, the target population does not necessarily coincide with the list frame. The question is: how valid are inferences made from the list frame to the target population?
Two different scenarios may exist: a) frames exhibiting multiplicity but no other imperfections; or b) imperfect frames. In this section, inferences in the case of multiplicity are analysed. The following section describes how to address frame imperfections.
Multiplicity is defined as “the number of sample units that have the same reporting unit”. What effects does multiplicity have upon the estimates? As already seen in chapter 3 the usual unbiased Horvitz-Thompson type estimate for the population total (Ŷ) is
where the summation is taken on the sample elements (k), yk is the observed value at the k-th sampled element and πk represents the probability of inclusion in the sample for the k-th sample unit.16
16 When a simple random sample of size “n” is taken from a population of N elements (and therefore from a frame with N units without multiplicity), πk equals n/N for all k and 1/πk = N/n the usual “expansion factor”.

61
When multiplicity is not present, the calculation of inclusion probabilities (πk) provides unbiased estimates. For example, in a one-to-one or in a one-to-many link, the probability of selection for the k-th reporting unit is the same as the probability of selection of the corresponding frame unit. When multiplicity appears, the probability that a particular reporting unit is selected depends on the number of links of the unit with the same frame unit. The number of links is called the “multiplicity order”, and leads to bias if ignored.
Various criteria have been proposed to solve this problem17. In agricultural surveys, the most appropriate solutions are the following:
Solution 1: to “break” the cluster during the enumeration, for example, if Holdings A, B and C appear in the census (i.e. they are three units in the frame) and after the census they were combined into only one holding (A). Suppose that Holding B is selected – if it reports for the combined holding, the multiplicity factor is 3. The solution is to enumerate only the land area that Holding B conducted at the time of the census. This solution of breaking the cluster and attempting to trace the situation of the holdings when the frame was built is not always easy, because the land of each original holding may currently be unidentifiable. If this information can be retrieved, it can provide a good solution, because it preserves the original probabilities of inclusion. This rule is usually called “follow the land”, meaning that the land originally operated by the selected holding is the area that is to be enumerated.
Solution 2: another solution that leads to unbiased estimatorsis to divide the value of the variable by the order of the multiplicity of the unit as many times as the number of merged units selected from the frame. In the example above, if yA is the value of the variable of interest in the sampled holding A (sampled because Unit B was selected), replace yA in the formula with yA/3, because Holding A has a multiplicity of 3. If holding A appears in the sample because Units B and C were both selected, instead of yA, yA/3 must appear in the formula twice, to preserve the probability of selection. This solution is straightforward to implement, because multiplicity is detected during the enumeration. The main point is that the questionnaire must be designed to capture this information. If A is selected and states that the holding is now combined with B and C, it is necessary to obtain the names of B and C to determine whether they were also on the list and had a chance of being selected. The difficulty increases when the frame is built in multiple stages.
Any of the solutions proposed above (as well as others) is applicable, as long as multiplicity is not ignored.
In the case of a one-to-many link, no multiplicity issues arise, because the inclusion probability of any population unit is the same as the corresponding frame unit. In this case, the “re-composition” of the original unit only requires taking the information in all holdings linked to the sampled unit (and applying the same probability of inclusion).
5.3.4. Dealing with imperfections in list framesFrame imperfections (aside from those relating to multiplicity) can be divided into two categories: a) under-coverage and b) over-coverage.a. Under-coverage. This exists when some units were omitted or were created after the frame was developed.
These units were “erroneously excluded from the frame”. For example, during an agricultural census, some holdings may have been omitted by the enumerators. As a result, actual holdings in the field do not appear in the frame, and thus can never be selected in a sample taken from the frame. This type of omission is very common in large-scale operations such as censuses. Strict field supervision, adequate training, precise definitions and careful writing of manuals, along with quality control of all census operations, can minimize under-coverage. Post-enumeration surveys and controls with external data are usually employed to quantify the extent of under-coverage in censuses. When PHCs are used, the exhaustive coverage of all farm households will depend crucially on the quality of the field operations (questionnaire compilation and supervisor control).
17 See e.g. Kish (1965) or Lessler and Kalsbeek (1992).

62
Another reason for the incomplete coverage of farms in the MSF is due to the fact that PHCs only include holdings of the household sector. Therefore, an additional list of holdings in the non-household sector must be established using information from government regulatory agencies, producers’ associations, telephone directories, or other administrative sources.
How to deal with under-coverage? Unfortunately, the issue is difficult to solve: it cannot be detected from the sample, because the omitted elements have zero chances of being selected. Therefore, if the “omitted” elements behave like the “included” ones, they are already represented by the sample (and the estimation of means would not be affected; the estimation of totals is biased downward); however, it is impossible to understand their behaviour, because the sample is selected from the list of units that have been “included” in the frame. If a list frame is affected by under-coverage, the complete enumeration can be conducted in some areas (selected by sampling) to estimate the extent of the omissions to analyse their behaviour with respect to the included elements. It can be very useful (but costly) to determine if an update of the list frame is necessary.
b. Over-coverage. There is over-coverage when the frame includes units that are not linked to population units.
An example of over-coverage occurs when households that are not connected to an agricultural holding are included in the sample frame. This does not lead to bias, but adds to data collection costs and sampling variability because the data for the items of interest are zero.
Over-coverage is not as serious as under-coverage, because it can be detected and corrected when the sample is selected by screening the sample prior to the survey. The correction for over-coverage must be done carefully to preserve the inclusion probabilities. Let us assume that the sampling frame has N units and a simple random sample of n is selected. Each unit has an n/N probability of being selected. However, out of the n selected, it is found that only m (m<n) are correctly included. Therefore, the sample size to be taken should be m instead of n. The problem is that thesample size (m) is not known in advance, because it depends on each particular sample of (fixed) size n. Thus, m is a random variable, and it can be shown that its “expected value” is E(m)=n(M/N)18. The reasoning is the following: if the m would have been drawn by simple random sampling from the M (which is impossible, because the elements that have been rightfully included are unknown), the probability would be: m/M and the expansion factor: M/m. If m (a random variable) is substituted by its expected value (n(M/N)): the expansion factor is
Another way to consider the above example is the following: from the sample, the number of units correctly
included can be estimated as and the over-coverage as: (Horvitz-Thompson estimator).
Therefore, the new expansion factor is computed as
Therefore, the expansion factor is equal to the original one.
18 In fact, “m” is the “number of successes” in n independent trials; thus, “m” is distributed hyper-geometrically and the expected value of a hyper-geometric variable is the number of trials times the proportion of “successes” in the population...
63
5.3.5. Non-sampling errors in list framesStatistical literature recognizes two broad types of errors in sampling surveys: a) sampling errors and b) non-sampling errors. As indicated in Chapter 3, the former refer to the errors implicit in the inference process: observation of only a part of the population leads to estimates that differ from the population values. Sampling errors are usually presented with point estimates in the results of sampling surveys, in the form of confidence intervals or coefficients of variation. The treatment of non-sampling errors is different and more complex.
Some sources of non-sampling errors can also contribute to sampling errors. For example, the methods adopted to adjust for multiplicity may increase sampling variability.
Common list frame problems that are similar to those indicated in Section 5.2.3 can be summarized as the following:a. Duplicate names in lists. This issue commonly arises when building sampling frames. Usually, a list frame
is constructed using different directories (such as a farmers’ association lists together with registers from the Department of Plant Health, complemented by a directory from the latest agricultural census).The same holder may appear with different names. In many cases, the identification of these duplications is difficult, if not impossible. List frames with duplicated names are a special case of frames requiring multiplicity adjustments, because more than one frame unit corresponds to only one population element;
b. Inclusion of elements from other populations. For example, due to problems in census-taking, a non-agricultural household is included as an agricultural holding. This is a case of over-coverage;
c. Missing population elements. If the frame does not cover the items of interest, a case of under-coverage arises. This situation commonly occurs when holders are omitted from the frame.
A different situation takes place when the list frame contains erroneous ancillary information, even if the list is well constructed. Ancillary information is used to improve sampling designs: stratification, clustering, selection with probability proportional to some measure of size, etc. Therefore, if this information within the list frame contains errors, the precision of sampling estimates decreases (Szameitat and Schäffer, 1963).
An adequate sampling frame may be corrupted as a consequence of improper survey-taking. For example, interviewers who substitute adjacent occupied dwellings for sampled vacant units will introduce over-coverage even in a well-built frame, because it increases the probability of selection of units with precedent units not contacted. Another example of corruption of a well-constructed frame is when multiplicity is not taken into account in the inference process (for example, the elements are land parcels and the expansion factor used in a Horvitz-Thompson type estimator corresponds to selected holdings).
Quoting Lessler and Kalsbeek (1992), “[s]everal points should be noted about the classification of frame errors. First, some of the errors arise because of poor composition of the frame and others come from inadequate use of the frame. Under-coverage generally arises from poor constructed frames, those without linkage to all members of the target population. In other cases the frame may provide linkage to all members of the target population but mistakes in its use may induce error”.

64
5.4. MAINTAINING AND UPDATING LIST FRAMES
Updating the MSFThe MSF derived from the PHC or agricultural census can become rapidly obsolete, and a growing coverage problem will emerge as the period between the census and agricultural surveys increases. Unless there are effective mechanisms in place for updating and maintaining the register, it can quickly become irrelevant.
The sampling frame can be updated at different sampling stages. For the first stage, an updated list of all EAs in the country is required. In the past, with regard to PHCs, a difficult and costly cartography exercise had to be undertaken prior to each round of the PHC to update the EA maps. In recent years, many countries have shifted towards preparing geo-referenced and digitized EA maps (with extensive use of GPS) as part of the PHC process. A database of all EAs in the country will thus be available, with data relating to agriculture collected during the PHC.
The availability of geo-referenced and digitized EA maps will facilitate the maintenance and updating of the EA maps. Indeed, this information can be combined with satellite images (with land cover and use information) to build an area frame that is much easier to update.
The sampling frames for the second stage can be updated by using a rotating sample selection of PSUs and performing a complete enumeration of selected PSUs.
As mentioned above, list frames are prone to rapid obsolescence, mainly due to population dynamics. The use of a sampling frame that is not current can lead to bias in coverage. As more time elapses without any action to take the changes into account, the magnitude of this bias increases. Therefore, the maintenance and updating of list frames becomes an exercise of the utmost importance for any statistical office.
MSFs are designed to be used over long periods of time (ten or more years); therefore, procedures for periodic updating must be developed, to ensure that they are as up-to-date as possible. Frame obsolescence affects the number of frame units that are linked to population elements, because population dynamics lead to absorptions and divisions of elements (such as holdings or parcels) or to their disappearance. Other times, rural areas become urban areas and parts of agricultural land become residential areas. On the other hand, the advancement of the agricultural frontier results from the appearance of new elements that do not derive from the division of old ones. Natural disasters may result in the destruction of large areas of agriculture, resulting in the disappearance of agricultural holdings from the target population.
Listings and samples of units (holdings, households, parcels, persons) should not be used over extended periods without updating or adjustment. The useful life of a listing can be extended by the application of suitable rules of association, in conjunction with a procedure for identifying new units and deleting the units that have disappeared. The problem with many of the existing registers in developing countries is that while they easily incorporate new units, they are not as efficient in detecting units that ceased operations. Therefore, the interval between the preparation or updating of the lists and their use for sampling and data collection should be as brief as possible. Procedures for the early detection of the obsolescence of existing lists must be established. For example, in each survey a careful analysis of empty or out-of-scope questionnaires is paramount, to detect the extent of the list’s obsolete content. Another possibility could be to regularly send the lists to the field staff, asking for updating according to their knowledge of the area. The selection of certain areas to be swept for a new list of farms to be compared with existing ones also provides a good indication of the extent of the obsolescence, although it is costly.
Well-developed registers exist in the majority of European countries where there are established norms to ensure the updating of the registers. Holders are obliged to register to receive subsidies or other government benefits, governmental offices maintain a precise record of active holders that are obliged to pay taxes, and holders must

65
immediately notify stoppage if they wish to avoid taxation. This updated list of agricultural holders makes it possible to achieve up-to-date frames, not only for sampling purposes but also for census-taking. The maintenance of these registers is not an issue for statistical offices, and its cost is distributed among different government organizations.
Procedures for dealing with changes in frame units tend to be costly and complex; therefore, in frame development, minimizing the need for these procedures should be a major objective. As area frames are more stable19 than list frames, when deciding the combination of area and list frames in an MSF design, some compromise between the costs of elaborating an area frame against the cost of updating the list frame must be considered.
The costs of maintaining MSFs depend primarily on the stability of the frame units. Many sampling designs in agriculture are “multi-stage” using census EAs as primary sampling units (PSUs) and holdings or households in a second or subsequent sampling stage. In these cases, there are two frames, as seen in Section 5.2 above: a frame of land areas constituted by the EAs (area frame) and a list frame of holdings or households within the selected PSU. First, it is important to note that the number of units of interest in the list frame is random, because it depends on the sampling selection of EAs. If the sample is to be used in several surveys, the updating of the list frame must only refer to the elements in the selected PSU. As far as the updating of the area frame of PSUs is concerned, this usually does not present major problems, due to their stability.
Thus, for such designs, the cost of maintaining the frame of secondary units (for the selected PSUs) is an important consideration. As pointed out in Section 5.2. above, the sweeping of the selected EAs immediately after the sample selection to obtain names and addresses of farm operators is a good practice, to obtain updated lists of units to be sampled in later stages. This is of course costly, and an evaluation of the degree of frame obsolescence is certainly necessary. Another point to consider in the overall survey costs is that the enumeration in multi-stage sampling designs is cheaper than in one-stage designs because the units ultimately selected are concentrated in selected areas, rather than being spread across the entire country. However, it has the disadvantage of higher sampling errors due to clustering; for this reason, a common sampling design combines multi- and single-stage sampling using two list frames: the list of sampling units in the selected PSU and, independently, the list frame of large and commercial farms (FAO, 2005).
Another noteworthy point is that all censuses need a census frame (FAO, 2005); this preliminarily built frame should be updated with the census outputs. Therefore, an ideal process for developing the MSF as described by the United Nations (1986) would be: (1) develop the frame needed for the agricultural census; (2) enhance the census frame with the census outputs and (3) structure these materials in a form that is suitable to the sample selection operation anticipated. According to the United Nations (1986), “[t]o follow this ideal sequence, one must start with a reasonably clear picture of the purposes for which MSF will be used. Once these requirements are established, the steps necessary to meet them can be incorporated in the census plan. This process can also work in the opposite direction. If a Master Sampling Frame is developed from a census and is updated appropriately during the subsequent 5- or 10-year period, the job of developing the frame for the next census is likely to be considerably easier.”
In Annex A, the experiences of Brazil, Ethiopia and Lesotho in using list frames are described.
19 Area frames are also subject to change,to some degree. This is also true for areas that are defined entirely by physically identifiable bounda-ries; however, in any case, they are more stable than frames based in units subject to population changes. See Chapter 6 of this Handbook.

66
67
6Guidelines on developing and using an area sampling frame by Javier Gallego
6.1. AREA SAMPLING FRAMES: GENERAL CONCEPT AND MAIN TYPES In the agricultural sector, the population of production units can change very rapidly. This makes it particularly difficult to keep list sampling frames up-to-date and ensure that they correspond to the real population. An alternative to the use of outdated list sampling frames is to use the territory as a basis to define an area sampling frame. The territory is more stable than the population of farms or of agricultural households. Its boundaries are usually constant, and significant landscape changes are generally easier to address than changes in the population of farms, as the stratification can simply be updated. At worst, an outdated stratification will have less efficiency in terms of the variance of estimators; however, it will not introduce bias on area or yield estimation unless “non-agricultural” strata excluded from sampling contain a significant share of the agricultural activity.
This Chapter first presents the main types of sampling units in an area frame: areal units, often named segments, points or transects. The next section discusses tools or options relating to the sampling technique: stratification, single- or multi-stage sampling, multi-phase sampling and systematic sampling. The observation mode and the possible approaches to linking sampling units with reporting or observation units are then discussed. The Chapter concludes with two additional sections that address some sources of non-sampling errors and the role of EAs in linking area frames with list frames, census data or administrative information.
The first element in defining an area sampling frame is the geographic delimitation of the region of interest. If the boundaries of a country are known and a rule exists to divide it into non-overlapping units, a solid starting point to ensure the completeness and non-redundancy of the frame is available. An area frame can be considered a list of area units, even though the list is often implicit or infinite. The units may be defined by a geometric grid.
The specification of the sampling frame includes the cartographic projection – which is preferably an equal-area projection. Most cartographic projections are approximately equal-area and are perfectly acceptable for defining an area sampling frame. However, latitude-longitude coordinates should be avoided, as these may introduce a significant distortion, especially in large countries. The main elements of an area sampling frame are the definition

68
of the sampling and reporting units and the stratification. Strictly speaking, stratification is not indispensable to define a sampling frame, but an efficient stratification can make the difference between strong and weak sampling frames (this is true for both list frames and area frames). Area frames are well protected against undercoverage, but this source of bias can appear if the perimeter of the region excludes some agricultural areas (minor islands) or more often if some strata are excluded from sampling because they are supposed to be non-agricultural, but they contain some agriculture.
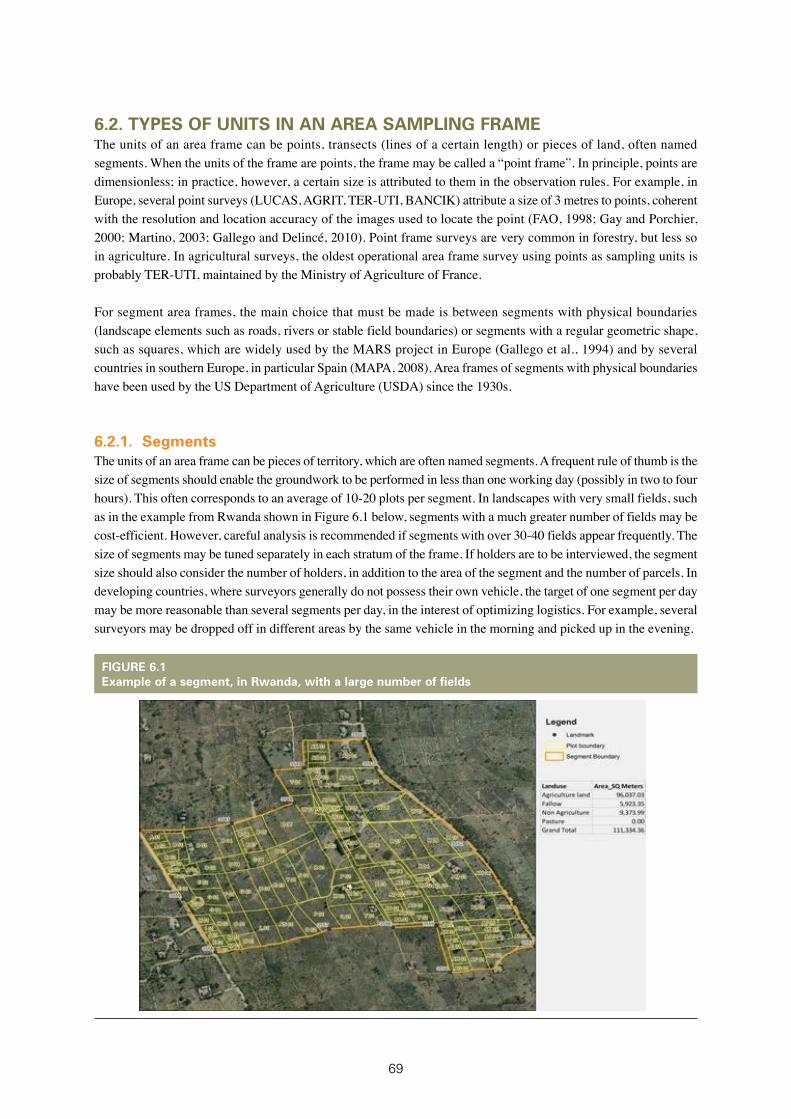
69
6.2. TYPES OF UNITS IN AN AREA SAMPLING FRAMEThe units of an area frame can be points, transects (lines of a certain length) or pieces of land, often named segments. When the units of the frame are points, the frame may be called a “point frame”. In principle, points are dimensionless; in practice, however, a certain size is attributed to them in the observation rules. For example, in Europe, several point surveys (LUCAS, AGRIT, TER-UTI, BANCIK) attribute a size of 3 metres to points, coherent with the resolution and location accuracy of the images used to locate the point (FAO, 1998; Gay and Porchier, 2000; Martino, 2003; Gallego and Delincé, 2010). Point frame surveys are very common in forestry, but less so in agriculture. In agricultural surveys, the oldest operational area frame survey using points as sampling units is probably TER-UTI, maintained by the Ministry of Agriculture of France.
For segment area frames, the main choice that must be made is between segments with physical boundaries (landscape elements such as roads, rivers or stable field boundaries) or segments with a regular geometric shape, such as squares, which are widely used by the MARS project in Europe (Gallego et al., 1994) and by several countries in southern Europe, in particular Spain (MAPA, 2008). Area frames of segments with physical boundaries have been used by the US Department of Agriculture (USDA) since the 1930s.
6.2.1. Segments The units of an area frame can be pieces of territory, which are often named segments. A frequent rule of thumb is the size of segments should enable the groundwork to be performed in less than one working day (possibly in two to four hours). This often corresponds to an average of 10-20 plots per segment. In landscapes with very small fields, such as in the example from Rwanda shown in Figure 6.1 below, segments with a much greater number of fields may be cost-efficient. However, careful analysis is recommended if segments with over 30-40 fields appear frequently. The size of segments may be tuned separately in each stratum of the frame. If holders are to be interviewed, the segment size should also consider the number of holders, in addition to the area of the segment and the number of parcels. In developing countries, where surveyors generally do not possess their own vehicle, the target of one segment per day may be more reasonable than several segments per day, in the interest of optimizing logistics. For example, several surveyors may be dropped off in different areas by the same vehicle in the morning and picked up in the evening.
FIGURE 6.1Example of a segment, in Rwanda, with a large number of fields

70
Segments can be delimited by physical elements, such as roads, rivers or permanent field boundaries. This was the choice of the USDA for the June Area-frame Survey (JAS; see Cotter and Tomczac, 1994; Davies, 2009; Boryan and Yang, 2012). The same approach has been applied in several countries, many of which have developed their area frames with the support of the USDA. FAO (1998, vol. 2) describes several examples. Defining an area frame with this approach requires a significant initial investment, which may be lower if PSUs are used and subdivided into SSUs or segments only if they are selected in the first sampling step. In this type of area frame, the concept of PSU does not fully match the usual definition of PSUs given in survey sampling textbooks, which generally refer to large units from which a sample of several SSUs is selected. The selection of only one SSU from each sampled PSU is a special case; the traditional variance computation formulas for two-stage sampling do not apply, because the variance component for the second stage requires the sampling of more than one SSU in each PSU (Cochran, 1977). The Italian AGRIT project followed this approach between 1992 and 2001.
FIGURE 6.2PSU subdivided into several segments (USA)
FIGURE 6.3Example of PSU with physical boundaries in Italy, with segments delineated within and the SSU ultimately selected

71
Segments are cheaper to define with reference to a regular grid (which is often square) in the selected cartographic projection (Gallego, 1995). This was chosen in the Spanish Marco de Areas de Segmentos Territoriales (MAST), also described in FAO (1998). Some comparisons between square segments and segments with physical boundaries have been made: González et al. (1991) conclude that the standard errors are very similar, and therefore that square segments are preferable because they are cheaper to define. Other statisticians maintain that segments with physical boundaries reduce ground survey mistakes from the segment being identified in the wrong location. However, these concerns may be greatly reduced if GPS is used for the field survey.
6.2.2. PointsArea frames of points have been widely used for forest inventories. For agricultural and land cover surveys, there are several important examples in Europe: the French TER-UTI survey (FAO, 1998), operational since the 1960s, BANCIK in Bulgaria (Hristoskova, 2003; Eiden et al., 2002) and the EU’s LUCAS survey, with the sampling scheme applied in 2001 and 2003. All of these use a two-stage sampling scheme with 10 to 36 points (SSUs) per PSU or cluster. The area covered by a PSU may roughly correspond to the size of a segment (a cluster of points may be considered as an incomplete observation of a segment). Nevertheless, covering a larger area may be more efficient for clusters of points rather than for segments with complete observation, including delineating fields. For example, the clusters of 36 points used in TER-UTI and BANCIK are an incomplete observation of a square segment of 324 ha with a distance of 300 m between points. Complete observation of the segment would have been extremely cumbersome; however, the effort of walking the distance of 300 m between two points is reasonable in the average French or Bulgarian agricultural landscape.
FIGURE 6.4Building an area frame with regular cells only requires definition of a regular grid

72
Since 2002, the Italian AGRIT project has decided to depart from the use of segments with physical boundaries to adopt a sample setup of unclustered points. Readers are referred to TER-UTI, mentioned above, for an example of clustered sample (two-stage) layout. Figure 6.5 illustrates a similar example of a cluster of points in a square segment. Figure 6.6 describes an example of a sample of unclustered points (single stage).
The operational costs of the new AGRIT prompted the need to review the cost functions that had been used to optimize cluster size in previous studies (Gallego et al. 1999; Carfagna and Gallego, 1994). The comparison of results between the old and the new versions of AGRIT with similar costs (Martino, 2003) indicates that unclustered points can provide an adequate cost-efficiency ratio for area frame surveys with the conditions existing in Europe. This led to a new setup for Eurostat’s LUCAS survey since 2006. The availability of cheap and accurate GPS has greatly improved the feasibility of area frames, especially when the sampling units are points.
In the European conditions, unclustered points in a two-phase sampling appear to be more efficient than clustered points in a two-stage sampling scheme in which the first stage is defined by clusters of five-by-two points that are 300 metres apart (Gallego and Delincé, 2010). However, this does not necessarily apply to developing countries. In Europe, each surveyor has a personal vehicle, and driving 4-6 km between points is not a major problem. When surveyors do not have a personal vehicle and the road network is of a lower density and quality, clustered points are likely to be more efficient.
Data collection and processing is easier for points than for area segments and the cost efficiency is generally superior, although rigorously comparing operational costs is difficult: this would require the coexistence of both approaches in the same country, the same institutional context and the same degree of experience. Groundwork with segments involves determining field areas (reported by the holder, or measured in the field or by delineating plots on an ortho-image). This may require a certain amount of time (ranging from a few weeks to several months) for large samples, and consequently delays the production of estimates, although the introduction of GPS devices that record coordinates in the field reduces processing time. On the other hand, area segments provide better information on the plot structure for landscape indicators or for co-registration, if ground data are combined with satellite images for regression estimators (Gallego, 2004).
FIGURE 6.5Example of second-stage sampling: a grid of points is sampled inside a square segment (first-stage sampling unit)

73
FIGURE 6.6Two-phase sample of points with incomplete stratification
A: First-phase sample
B: Second-phase sample. All points in the agricultural strata have been kept, and other strata are subsampled.

74
6.2.3. TransectsTransect surveys are often used for environmental and forest surveys, e.g. to estimate the total length of linear landscape elements such as hedges or stone walls; variables not usually measured in the agricultural domain. Some experiments have been performed in the agricultural context, with samples of long and relatively thin stripes of which aerial photographs are acquired (Jolly and Watson, 1979; Dancy et al., 1986; Reinecke et al, 1992). These sampling units should be considered as thin-shaped segments or PSUs rather than real transects. The number of operational examples is limited, but application of the scheme in the context of the estimation of agricultural land and nomadic livestock merits further attention (Watson et al., 2007). A (possibly stratified) sample of stripes would be selected (Figure 6.7) and observed with aerial photographs, in which livestock can be identified and counted (Figure 6.8).
FIGURE 6.7Example of a sample of stripes in Sudan
FIGURE 6.8Aerial photo in which nomadic livestock can be counted

75
For specific landscapes with blocks of thin stripes, point sampling can be combined with transects perpendicular to the stripes for crop area estimation by means of direct observations. An example is given in Figure 6.9 below (Kerdiles et al., 2013).
FIGURE 6.9In landscapes with thin stripes, transects can be used for crop area estimation
76
6.3. TOOLS TO IMPROVE THE SAMPLING EFFICIENCY
6.3.1. Stratification The stratification of an area frame is generally based on the geo-referenced features that can be observed on the land, possibly by means of image analysis or photo-interpretation. In an agricultural area frame, typical definitions of strata can be “agricultural land > 60 percent”, “agricultural land between 30 and 60 percent”, etc. Additional strata may be defined for specific crops or crop groups that are usually stable on the land. For example, a stratum can be defined with conditions of the type “irrigated crops > 50 percent”, “permanent crops dominant” or “grassland mixed with cropland”. The range of conceivable strata labels is very wide. Therefore, if a division of the territory into geographic units is used as the basis for an MSF, the unit should be characterized by a set of variables, e.g. proportion of arable land, of irrigated land, permanent crops, grassland, etc. For each specific survey, statisticians must define a suitable stratification on the basis of the information available. When EAs are used as PSUs, a very efficient stratification can be defined on the basis of information derived from the most recent agricultural census. Each sampling unit must belong to one and only one stratum. Tests have been conducted on splitting segments with strata boundaries. A part of a segment would belong to stratum h and another part to stratum h’ (Gallego et al., 1994). Thus far, however, this approach has not yielded good results.
In practice, the information on the variables that characterize the frame units is likely to be far from perfect, but this does not mean that the stratification will be inefficient. If a land cover map is available and an area frame of segments is being constructed, it must be adapted if a stratification is to be built from it: First, the legend of the land cover map should be simplified, such that only the classes that are truly meaningful for the survey’s purposes are retained (e.g. rain-fed arable, irrigated arable, permanent crops, complex semi-agricultural landscape and non-agricultural). The strata boundaries should follow the geometry of the segments, in particular for segments with a regular (square) shape. Segments with physical boundaries can be delineated at a later stage, respecting the strata boundaries. For each segment, the area of each land cover class must be computed. In Figure 6.10, a square segment is overlaid on a land cover map. According to the map, the segment contains two land cover classes: forest and rain-fed arable land. In this example, the map and the background image show significant differences, partly due to the minimum mapping unit of the land cover map. For stratification purposes, the area of each class must be computed from the land cover map and reported in the attribute table of the list of segments. This table will enable analysts to define the stratification for each specific survey.
The situation is slightly different for point sampling: each point belongs to a land cover class and the stratification can be defined directly, by simplifying the nomenclature of the land cover map. There can be strata such as “rice”, “other irrigated arable land”, “rain-fed arable land”, “permanent crops”, “heterogeneous agricultural areas”, etc.

77
6.3.2. Single- and multi-stage samplingA two-stage point sample survey can be seen as a segment survey with an incomplete observation of segments. In the first stage, a sample of area units (PSUs) is selected. In the second stage, a sample of points is drawn in each PSU selected in the first stage. In this case, the PSUs will be segments, but small administrative units (EAs) can be also used. A range of techniques may be applied for the second sampling stage, including stratified random sampling and different types of (possibly stratified) systematic sampling.
As noted above, the term “PSU” is not always linked to a proper two-stage sampling scheme. In particular, the segment sampling approach used by USDA-NASS is an improper two-stage sampling process, because only one SSU is selected in each PSU. In this case, the PSUs are a tool to reduce the amount of GIS work, and the two-stage sampling formulas for variance estimation need not be used.
6.3.3. Multi-phase samplingThe idea of multi-phase (most often, two-phase sampling) sampling is linked with the principle of the MSF. In two-phase sampling, a large sample is selected in the first phase; this first-phase sample or pre-sample is generally stratified by means of a procedure that is more statistically efficient than a stratification system applied to the full area frame. If this happens, and the first-phase sample is sufficiently large, this large sample can be a good master sample, or a basis for one.
Two-phase sampling is particularly useful for non-clustered point sampling. Typical examples are the Italian AGRIT survey (since 2002) and the Eurostat LUCAS survey (since 2006). The method has also become operational in Haiti, and pilot tests are being conducted in several sub-Saharan countries. In both AGRIT and LUCAS, the first-phase sample is a systematic grid over the targeted region’s entire area. The grid has a 500 m step in AGRIT and a 2 km step in LUCAS (Figure 6.6). The points in the grid are photo-interpreted on aerial ortho-photos or VHR satellite images with a simplified nomenclature, such as “arable land”, “permanent crops”, “pastures” and “non-agricultural”.
FIGURE 6.10Example of a square segment on a land cover map (blue lines)
78
Photo-interpretation of a point is usually more accurate than polygon photo-interpretation in producing a land cover map, because the photo-interpreters focus their attention upon a single point. The better quality of photo-interpretation largely makes up for the loss of efficiency deriving from the incompleteness of the stratification (only the first-phase sample of points is stratified). The first-phase sample (which usually comprises a very large number of points) is subsampled in the second phase with a rate that depends on the strata, such that most of the final sample is concentrated on the strata with the highest priority.
6.3.4. Systematic samplingSystematic sampling is often applied in list frames: the elements of the frame are sorted in accordance with a given criterion and the sample contains the elements i, i+k, i+2k, etc., where i is random and the step k is adjusted to obtain the targeted sample size (see Chapter 3 of this Handbook). The efficiency of systematic sampling depends on the degree of auto-correlation between neighbouring elements: it avoids elements that are excessively close to each other and the corresponding redundancy of information, measured by auto-correlation.
In area frames of segments with physical boundaries, systematic sampling is sometimes applied by ordering PSUs in a serpentine arrangement; however, this does not necessarily avoid neighbouring elements from being present in the sample. Systematic sampling in an area frame uses jumps of amplitude kx and ky along both X and Y axes (possibly with the same horizontal amplitude kx=ky), and is a better guarantee of homogeneous geographic distribution.
The main disadvantage of systematic sampling is that there is no unbiased estimator of the variance; however, the ensuing practical implications are limited. The usual formulas for random sampling overestimate the variance under systematic sampling; however, alternative formulas based on local variances have been proposed to substantially reduce the bias (Wolter, 1984). A more significant drawback of straightforward systematic sampling is the difficulty of revising the sample size to the available budget, without rerunning the entire process (Stehman, 2009). Systematic sampling with multiple replicates maintains good spatial distribution and subsequent standard error reduction, and is flexible enough to accommodate sample size changes and the unbiased estimation of sampling errors (Gallego and Delincé, 2010).
When the results of a sampling survey are politically sensitive and there is a risk that stakeholders may not accept them, wishing rather to verify each step, systematic sampling has the advantage of being more easily traceable. In random sampling, it is more difficult to prove that the sample is truly the outcome of the first attempt at extracting random numbers.
79
6.4. OBSERVATION/REPORTING MODE
6.4.1. Direct observationsIn a survey, direct observation in the field may be employed to collect part of the required information, in particular crop area and yield; other information items, such as the amount of fertilizers or pesticides used, require personal interviews. Direct observations protect against subjectivity, but limit the types of data that can be collected.
Direct observations are relatively easily performed for crop area estimation if appropriate graphic material (ortho-rectified aerial photographs or satellite images) and GPS devices are provided to the enumerators. However, the points or segments may have to be visited several times during the year if the crop calendar is complex.
In several studies, it has been experienced that the plot area reported by holders is often affected by a strong positive bias (overestimation), especially for very small fields. A recent study conducted in Zanzibar by the World Bank observes that holders usually report one-quarter of an acre or half an acre for cassava fields of less than 450 m2, with an average overestimation of over 300 percent. This is an extreme example; however, the conclusion that area estimates for small fields based on self-reporting present a strong risk of overestimation is generally valid. Thus it is strongly recommended to measure the area of small plots when conducting list frame surveys.
Area frame surveys with a sample of segments require plot area data. This can be the area reported by the holder, if it is collected and deemed reliable. In direct observation mode, the survey usually involves delineating fields using an ortho-photo or satellite image as a background; therefore, digitizing the plot in a GIS environment is the most obvious way to measure the plot. If the background images are not very recent or the plot boundaries are not clearly visible, GPS is a precious tool for determining the boundaries and thus for measuring the plot. Covering the plot on foot with a GPS device is an alternative way to delineate the plots in a segment, but this approach requires an additional editing process to ensure a coherent (seamless and non-overlapping) set of boundaries of the segment’s components: fields, roads, or other landscape elements.
In the case of point sampling, measurement of the field or plot area is not necessary for crop area estimation. For this purpose, only the area of the stratum and the proportion of points that fall in a certain crop are needed. However, if the direct observations are combined with an interview with the holder to estimate the other parameters, it is recommended that the plot in which the point falls be measured to compare the area with self-reported data.
Direct observation is more problematic for yield estimation, especially when the yield is heterogeneous within a given field. Authorization by the farmer may be necessary to collect a crop sample, which requires an investment of time to locate the farmer. Several authors have noted a presence of upward bias in yield estimation with crop-cutting experiments (CCE); see Murphy (1991), Casley and Kumar (1988) and Poate (1988). Another source of bias that has been occasionally observed derives from enumerators’ tendency to avoid, for the crop-cutting sample, points in which the state of the crop is very poor. Taking pictures and recording coordinates can be a good practice to follow, to ensure that the point at which the crop sample was collected is the point that was sampled. Another source of overestimation derives from how surveyors tend to use the frames to delimit the area to be harvested in the CCE: indeed, the plants on the border are included more often than they are excluded.
In some countries, direct observations without previous contact with the farmer may be perceived negatively by the population. These observations may even be unwise for the enumerator’s security. In these cases, the advantages of direct observations may be debatable, but combining and comparing results from direct observations and farm surveys improves the quality control of both surveys.
Direct observations in an area frame substantially eliminate some sources of bias relating to the reliability of farmers’ replies on cultivated area or yield. Still, caution is necessary when applying coefficients that take into account yield losses incurred between the moment of the observation and harvest and stocking.

80
For crop areas, other potential biases that derive from direct observation and require attention in survey design or execution are the following: • Wrong location of the enumerators on the ground. This may happen, for example, when the boundaries between
cultivated fields do not coincide with those visible in the support image (which may be from a previous year). Location error can introduce bias if it is correlated with land cover/use; otherwise, it does not introduce bias in the area estimates. This type of error has become less significant as GPS has improved in accuracy.
• Wrong identification of crops. This may be a serious problem for unusual crops that enumerators are unable to identify; however, it is a minor issue for major crops if the dates for the survey are organized properly.
• Unsuitable observation date. The enumerator visits the field too early (when the crop has not yet emerged or is in a very early stage of development) or too late (the crop has been harvested and no visible traces are left on the ground). When the crop calendar displays considerable variability, several visits may be necessary.
• A major bias can also be introduced if only one visit per year is made in areas where the proportion of double or multiple cropping is significant.
• In some countries, enumerators face difficulties in reaching the fields or even a point from which the field can be seen (e.g. in the case of large properties with restricted access).
• Width of linear elements. In segment surveys, enumerators must generally delineate fields or other landscape elements in the segment. To avoid gross inaccuracies in the delineation of thin elements (such as a narrow road), a width threshold is applied. For example, elements thinner than 10 m are delineated as a single line with no area. Thus, the area of the thin element is systematically attributed to the contiguous patches (fields) and generates an overestimation of crop area. However, this bias can be estimated (and thus corrected) by measuring the area of linear elements in a small subsample of segments. In Western Europe, this is often of approximately 2-3 percent. It is therefore wise to apply a coefficient of 0.97-0.98 to the crop area estimations to compensate for this source of over-estimation. For other landscapes, the proportion must be estimated. For point surveys, the threshold for considering linear elements to have no area is often approximately 3 m; the proportion of neglected area to compensate for is much lower.
• Improper modifications of the sampling scheme. Some examples of risky strategies are described further below in this Chapter. When possible, a sampling strategy should be tested on a pseudo-population, i.e. on a set of data that behaves approximately like the real world.
To estimate livestock units, direct observations are problematic for at least two reasons: • Double counting (positive bias) or failure to count units (negative bias) may occur, because livestock move from
one area to another. Compensation between positive and negative bias is not certain. • Livestock are often concentrated in herds or in stalls, and there will be a large number of zeroes and a small
number of sampling units with very large values. This will result in large variances.
6.4.2. Sampling farms using an area frame Farms can be sampled through an area frame (FAO, 1996 and 1998; Gallego et al., 1994); however, the identification of farmers linked with the points or segments sampled may be costly. Therefore, this approach is recommended only when there are doubts as to the completeness and reliability of a list frame (e.g. an agricultural census) or data are necessary for the entire farm. There are alternative approaches and estimators for designing area frames for farm surveys. Hendricks et al. (1965) and FAO (1996) analyse three classical options linked to segment sampling: the so-called open, closed and weighted segments. The farm sampling approach through points is described by Gallego et al. (1994 and 2013) and can be seen as a variant of the weighted segment, although there are some significant differences. In particular, there is no need to compute the area of the “tract”, the part of the segment that belongs to a particular farm. The main advantage of an area frame compared to list frames is that it is easy to ensure the completeness of the area frame and the non-overlapping units; also, extrapolation factors are reliable and relatively straightforward to compute.

81
Farms that have livestock but do not have their own land are difficult to find with an area frame. In most cases, list frames are more efficient when stratification captures the different types of production in greater detail than can be used for area frames. This happens especially for large or specialized commercial farms (FAO, 1996 and 1998). A dual frame combining a list frame of commercial farms and an area frame is often a good solution.
The sampling units may be segments or points. The reporting units may be farms or tracts, i.e. the part of the cropland (or the agricultural land, if grassland is included) of the farm within the segment. The main reporting units are described in the following paragraphs.
6.4.2.1. The open segmentAccording to this approach, a farm is selected if its headquarters is within a sampled segment. The term “headquarters” must be defined carefully. For agricultural households, the dwelling is a possible criterion; however, the question is more difficult to address for agricultural enterprises or farms that are managed by several families. The selection probability of the farm is the selection probability of the associated segment. In some countries, farm operators reside in villages or urban areas that must also be within the scope of the area frame. The number of farms per segment can be very heterogeneous. For many types of landscapes, many segments may not contain the headquarters for any farms (Figure 6.11). When area frames are based on a geometric grid, the open segment approach requires adoption of a particularly precise rule on the reference point in locating the dwelling (e.g. the main entrance door). Otherwise, the headquarters may be split by the boundaries of two segments (e.g. Farm 1 in Figure 6.11). A modified version of the open segment would entail subsampling farms within each sampled segment. This would be a two-stage sampling scheme, and the sampling probability would be the probability of the segment multiplied by the subsampling rate within the segment.
FIGURE 6.11Example of agricultural landscape with some farm headquarters

82
Many segments do not contain any farm headquarters. In some cases, the farm headquarters may fall into more than one segment, as shown for Farm 1 in the example above. Sampling variability is greater using the open approach than for alternative methods, because only segment data for those containing a farm headquarters are collected.
6.4.2.2. The closed segment In the closed segment, the reporting unit is the tract, the part of the farm’s fields within the segment. This approach is problematic because the farmer does not always have precise information on the target variables referring to the field(s) inside the segment. If the segment is defined by means of a geometric grid, the farmer’s answers become more difficult. The closed segment is not recommended for surveys that involve an interview with the farmer. In the example depicted in Figure 6.12 below, the square segment sampled contains five tracts, i.e. the parts of farms identified by colours. The sampling probability of each tract coincides with the sampling probability of the segment. The area of each tract and the area of each crop in each tract are easily computed in a GIS environment if the boundaries within the segment were delineated during the segment enumeration. Still, the farmer may find it difficult to report the average yield or the amount of fertilizer used in the tract.
Plots of the same colour correspond to the same farm.
6.4.2.3. The weighted segment When there is insufficient information on how an additive variable Y is distributed in a farm, the difficulty of reporting Y for a tract can be bypassed using the weighted segment approach. The area under a given crop, the production, the amount of fertilizer used, etc. are examples of additive variables. Yield is not an additive variable.
FIGURE 6.12Tracts inside a square segment
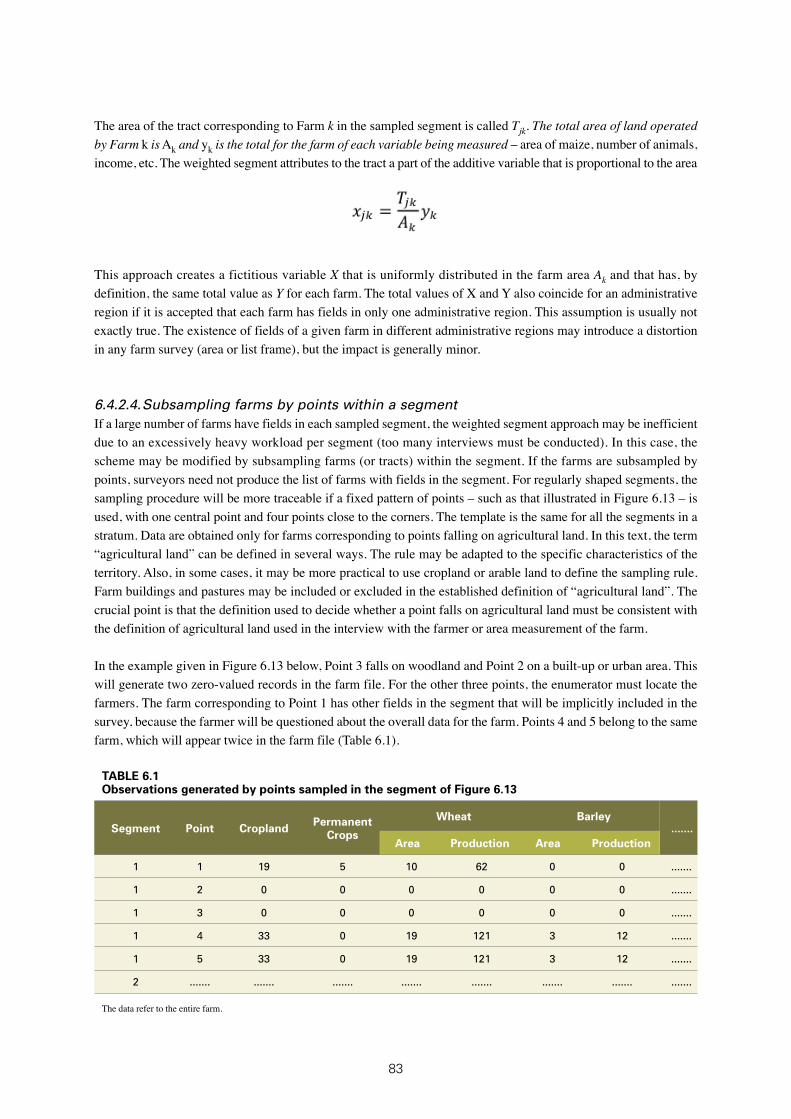
83
The area of the tract corresponding to Farm k in the sampled segment is called Tjk. The total area of land operated by Farm k is Ak and yk is the total for the farm of each variable being measured – area of maize, number of animals, income, etc. The weighted segment attributes to the tract a part of the additive variable that is proportional to the area
This approach creates a fictitious variable X that is uniformly distributed in the farm area Ak and that has, by definition, the same total value as Y for each farm. The total values of X and Y also coincide for an administrative region if it is accepted that each farm has fields in only one administrative region. This assumption is usually not exactly true. The existence of fields of a given farm in different administrative regions may introduce a distortion in any farm survey (area or list frame), but the impact is generally minor.
6.4.2.4. Subsampling farms by points within a segment If a large number of farms have fields in each sampled segment, the weighted segment approach may be inefficient due to an excessively heavy workload per segment (too many interviews must be conducted). In this case, the scheme may be modified by subsampling farms (or tracts) within the segment. If the farms are subsampled by points, surveyors need not produce the list of farms with fields in the segment. For regularly shaped segments, the sampling procedure will be more traceable if a fixed pattern of points – such as that illustrated in Figure 6.13 – is used, with one central point and four points close to the corners. The template is the same for all the segments in a stratum. Data are obtained only for farms corresponding to points falling on agricultural land. In this text, the term “agricultural land” can be defined in several ways. The rule may be adapted to the specific characteristics of the territory. Also, in some cases, it may be more practical to use cropland or arable land to define the sampling rule. Farm buildings and pastures may be included or excluded in the established definition of “agricultural land”. The crucial point is that the definition used to decide whether a point falls on agricultural land must be consistent with the definition of agricultural land used in the interview with the farmer or area measurement of the farm.
In the example given in Figure 6.13 below, Point 3 falls on woodland and Point 2 on a built-up or urban area. This will generate two zero-valued records in the farm file. For the other three points, the enumerator must locate the farmers. The farm corresponding to Point 1 has other fields in the segment that will be implicitly included in the survey, because the farmer will be questioned about the overall data for the farm. Points 4 and 5 belong to the same farm, which will appear twice in the farm file (Table 6.1).
TABLE 6.1Observations generated by points sampled in the segment of Figure 6.13
Segment Point Cropland Permanent Crops
Wheat Barley.......
Area Production Area Production
1 1 19 5 10 62 0 0 .......
1 2 0 0 0 0 0 0 .......
1 3 0 0 0 0 0 0 .......
1 4 33 0 19 121 3 12 .......
1 5 33 0 19 121 3 12 .......
2 ....... ....... ....... ....... ....... ....... ....... .......
The data refer to the entire farm.

84
The farmers are located and asked to provide global data for the farm, including the total area and production of each target crop. No questions about the production of each field or on the parts of fields inside the segment are asked. This is not necessary, because the final formulae to compute the estimates do not use the tract area or the value of Y in the tract.
The Horvitz-Thompson estimator for the total of X in segment j is
where Tjk is the area of farm k in segment j (tract), Uj is the total area of segment j and Ak is the total area of farm k. The probability of selecting segment j is Fj. The result is later extrapolated to estimate the total for the stratum and for the region of interest. According to the formula above, the area of the tract need not be computed; however, this approach requires the total agricultural land in the segment. This is easy to compute in a GIS environment, in particular if the field observations are recorded with a tablet with GPS capability. A variant of this approach uses only points that fall on agricultural land, instead of all points in the segment. For this approach and additional issues, such as the computation of variances, see Gallego et al. (1994).
FIGURE 6.13Sampling farms (tracts) inside a square segment

85
6.4.2.5. Sampling farms directly by points (single-stage) Farms can be sampled with an area frame without using segments, but rather a sample of points (Figure 6.14). The sampling rule is the following: points that fall on agricultural land generate an element of the sample of farms. Farm k is selected with a probability proportional to its area Ak.
As in the previous section, the definition of agricultural land may be flexible, to meet the specific characteristics of local agriculture, but it must be consistent throughout the process. The concept of agricultural land used to decide whether the point generates a sample unit should be the same as that considered when the total area of the farm is recorded. Farm buildings and rough pastures may (or may not) be included in the agricultural land, if this is considered useful for the completeness of the frame. In any case, the choice must be consistent in all steps. An additional uncertainty is whether the farmer has good knowledge of the farm area. In many countries, it is necessary to proceed to the objective measurement of plots because the area declared by farmers is often unreliable.
Other additive variables, such as the production of each crop or inputs such as fertilizers or pesticides, are recorded, generally using Computed-Assisted Personal Interviews (CAPIs). It is not necessary to ask questions on production in each field. If several points fall on fields of the same farm, the farm will have a sampling weight in the computations proportional to the number of points. The area of each crop can be estimated separately from direct field observations and compared with the data from interviews with farmers. This will provide a cross-checking tool in a quality control process to be run on a subsample (which could comprise 5-10 percent of the total sample).
Depending on the livelihood structure, it may be difficult to locate the farmer. The involvement of staff with good knowledge of the local population (extension workers) is essential. This task is more time-consuming in regions where people live in concentrated towns rather than in scattered houses close to the fields. In some cases, the owner
FIGURE 6.14Sampling farms by points
Plots highlighted with the same colour correspond to the same farm.

86
or manager of the farm may live in a city that is very far from the fields. The first time that the survey is run, it is worthwhile to invest in drafting a look-up table that links points with farmers. Keeping a basically constant sample of points (with a small proportion of rotating points) is recommended: updating a database with the link point-farm is simpler than updating a census.
Assume that Wk is an additive variable for Farm k, e.g. the area under a given crop, the production, the amount of fertilizer, etc. (as mentioned above, yield is not an additive variable). The farm’s agricultural land will be called Ak. The total area of the region under study is D and the area of each stratum Dh, in which we have selected a sample of nh points. Farm k is selected with a probability proportional to the area Ak:
The Horwitz-Thompson estimator for unequal probability sampling, also called π-estimator (Särndal et al., 1992), for the total of X in stratum h is
where yk is the total, for Farm k, of the additive variable being estimated (area or production of a given crop, amount of fertilizer used, etc). Sample points that do not fall on agricultural land do not generate an element in the sample of farms (e.g. Point 3 in Figure 6.14). To deal with such points, it is possible to define a fictitious farm that corresponds to all non-agricultural land and has a value of yk = 0. A simple stratification into two strata (agriculture and non-agriculture) minimizes the occurrence of this type of event. The stratification is more precise if it is carried out on a sample of points. This will involve a multi-phase sampling scheme: a large first-phase sample that can be examined as a master sample is stratified, and a subsample is selected at a later stage to build a sample of farms (Gallego, 2013).
A major limitation of sampling farms through points is that covering farms that have livestock but no agricultural land is problematic. A possible solution is to consider a dense sample of points in the built-up areas of rural regions, in search of dwellings of livestock owners without agricultural land.

87
6.5. NON-SAMPLING ERRORS IN AN AREA SAMPLING FRAME As stated above, an area sampling frame usually has a negligible undercoverage of farms that cultivate land or manage pastures (owned or rented). In a GIS environment, it is also easy to prevent double-counting. The main source of bias is linked to farms with livestock that use common pastures – in particular nomadic livestock – although this is not the only source of bias.
However, an insufficiently careful management of the frame can introduce significant bias. The most important source of bias is probably the exclusion, from the sampling process, of strata labelled as purely non-agricultural. For example, although the EU’s CORINE has a good quality land cover map, between 2 and 3 percent of the agricultural land is located in polygons that are labelled as being purely non-agricultural. This percentage is likely to be higher for comparable maps (Africover) in developing countries with a more complex landscape and smaller fields. Excluding theoretically pure non-agricultural areas leads to an underestimation that could be considered moderate, but that should definitely be taken into account. The bias may be greater if certain criteria – such as excluding segments in which the agricultural proportion is minor, according to the land cover map – are applied.
Another example of risky management practice that can introduce significant bias is illustrated in Figure 6.15; this can be called an “extended segment”. A regular grid (in this case, square segments) is used to define sampling units, but when a segment is sampled, the observation unit is defined considering the full parcels for all plots that intersect the square segment. The overestimation is obvious when an expansion factor of the type (N/n) is used. The bias is less obvious but still significant if correction factors are applied to compensate for the increase in segment size. This type of modification should be avoided; if this is not possible, their impact should at least be assessed by simulation, if sufficient real data are available.
FIGURE 6.15Example of an “extended segment”
88
6.6. LINKING AREA FRAMES WITH CENSUS OR ADMINISTRATIVE INFORMATION: THE USE OF ENUMERATION AREAS EAs are generally associated with a delimited territory and can thus be considered to define an area sampling frame. However, if the specific characteristics of an area frame are not used, the set of EAs can be considered as a list frame (see Chapter 5). This Chapter will only deal with the use of EAs with an area frame technique. This presumes that EAs have well-defined geographic boundaries and are not only defined as a list of dwellings or built-up areas.
A sample of n EAs is selected in the first stage, usually with some type of PPS where size does not necessarily refer to the EA’s geographical area. In this context, size may refer to the number of farms or to the agricultural area. If it is desired to sample EAs with a probability proportional to the geographic area or to the agricultural land, an area frame approach can be used. For example, a systematic sample of points (a square grid with a 10 km or a 20 km step may be an option) can be chosen; this will ensure a relatively homogeneous geographic distribution. Several sampling rules are available: • All the EAs on which a grid point falls are selected. In this case, the sampling occurs with a probability
proportional to the geographical area. • A more reasonable criterion may be sampling with a probability proportional to the agricultural land. EAs are
selected if the grid point falls on agricultural land.• It may be preferred to assign a higher probability to EAs with a greater share of high-value agricultural products,
e.g. irrigated land or permanent crops. In this case, we can define two replicates as systematic grids that are suitably shifted from each other. A point of the first replicate will generate a sample EA if it falls on any agricultural land, while a point of the second replicate will only lead to selection of the corresponding EA if it falls on high-value agricultural land. This type of area frame approach can be adapted to several types of land, but it requires that the different typologies of agricultural land be recognizable in an efficient way, ideally by photo-interpretation of the available images.
An EA can be considered as a large segment of an area frame. However, due to the EA’s large size, the use of the traditional open, closed, and weighted segment methods without subsampling of farms is likely to be very inefficient. Subsampling farms thus becomes necessary. This operation can be performed by building a list of farms that have most of their activity in the EA, or sampling farms by points, as described previously in this Chapter.
EAs can be also used as sampling units in surveys with direct observation (no farmer interviews) that focus only on area and production estimation or on environmental issues. In these cases, ensuring the exhaustive observation of all fields can be very inefficient. This issue could be addressed by subsampling points for direct observation. However, there appears to be little or no experience with this type of technique.
One of the advantages of using EAs as PSUs both as list frames and as area frames is the frequent existence of relevant data for all EAs in the country, such as expert reports on crop area. These figures may be subjective, to a certain extent; however, they constitute a valuable source of covariates that can be used with more objective data estimated for a sample of EAs.
The US was one of the first countries to successfully use an area frame in agricultural surveys. Its experience is briefly described in Annex C, along with those of Brazil, China, Ethiopia, Guatemala, and the EU’s Joint Research Centre MARS and LUCAS projects.

89
7Multiple Frame SamplingBy Cristiano Ferraz and Frederic Vogel
7.1. OVERVIEWMultiple frame sampling involves the joint use of two or more sample frames. For agricultural purposes, this usually involves the joint use of area and list frames. Previous chapters of this Handbook have provided guidelines on developing each of these types of frames and described their respective strengths and weaknesses.
Farm surveys are usually designed to provide estimates of crop areas, yield, livestock inventories, total sales, etc. Surveys of farm and rural households obtain information on a wide range of issues, such as income, education, and measures of well-being. Common characteristics affecting the choice of sampling frame and overall sample design are skewed distributions, items appearing on very few farms, and the diversity of agriculture covering dozens of different crops and types of livestock.
The basic principles underlying multiple frame sampling are the same as those which apply to single frame sampling. The basic principles of finite population sampling theory apply. The population of sampling units and associated reporting units must be defined. A sampling frame must be constructed, and from this the sample must be selected. The sampling unit for an area frame is a segment of land or a point for which a reporting unit is formed. Rules of association are used to link the area sampling unit to the reporting unit, which is the farm or a portion of the farm. The sampling unit from the list frame is the name of the farm or – as common in most developing countries – the name of the landholder or the farm operator. The reporting unit is the holding associated with the name.
In many developing countries, there is usually a large number of farms that have small land areas but cover a wide range of items, with an even geographic distribution. A common problem in designing samples for agriculture is that there is a small number of commercial farms producing large amounts of some items or producing rare items. The resulting skewed distributions present problems for area frames; these are best resolved by using a list frame for the large farms. While the area frame covers the entire farm population and land, and is statistically efficient for small farms, large sample sizes are necessary for populations with rare items and with skewed distributions.
Farm populations have skewed distributions for several items. For this reason, list frames that contain (for each farm) known or estimated measures of size for many items or characteristics are used. A main reason for using a list frame is that auxiliary information enables the use of efficient sampling methods, including stratified sampling

90
or selecting samples using PPS with or without stratification and in single or multiple stages. Recent advances in sampling theory include the use of calibration and regression-type estimators. Farm registers may be compiled from agricultural censuses or from multiple stage sampling, in which a sample of area PSUs is screened for farms and their characteristics. Given the changing nature of the farm population, the list frames can become obsolete rapidly – and thus incomplete in their coverage of the farm population – when data collection actually takes place.
The area frame is used to ensure the completeness of the master frame because it is capable of covering all farms and their land. An area frame has a long lifespan; this means that it is to be updated only if geographical features have changed to the point that it is difficult to link farms to the area segment or point. Improvements in satellite data and imagery (both in terms of technological improvements and availability of free images) may introduce further reasons to update the area sampling frame. The area frame is ideally suited to estimating parameters relating to land areas – such as total cultivated area – that can be used to monitor the quality of the data collection.
Cost comparisons are essential when choosing sampling frames and in their joint use in multiple frame sample designs. The choice of sampling frame must consider the costs of frame development and data collection. The development costs relating to the list frame must include not only the development, but also the costs entailed by the frequent updates required. In developed countries, a main advantage of list frames lies in the fact that the sample of farms can be enumerated by mail or telephone, rather than personally. However, personal enumeration of the list sample may be necessary in developing countries; this ultimately makes data collection costs comparable to those of the area frame.
The area frame sampling unit is by design a segment of land or a point. In both cases, it is necessary to first find the sampling unit, and then to identify the operator of that land. The operator may be located at some distance from the land that he or she operates. The choice of the rules of association must be based on the cost of linking the reporting unit to the sampling unit.
It would be mistaken to assume that the cost of constructing a list from a census entails no costs for the development of the MSF. As will be shown below, detailed information on the complete name and address of the farm operator, as well as on the names of other people associated with the farm, is required when used in a multiple frame context. A list of households with only the address as the identifying information is inadequate.
Section 2 reviews the principles of multiple frame sampling. While straightforward in theory, challenges in application do arise; these will be discussed in Section 3. Sections 4 and 5 provide the basis for statistical inference when multiple frames are used. Sections 6 and 7 deal with determining the scope and coverage of the list frame and the sample allocation to the two frames, respectively. The Chapter concludes with a set of guidelines on the use of multiple frame sampling.
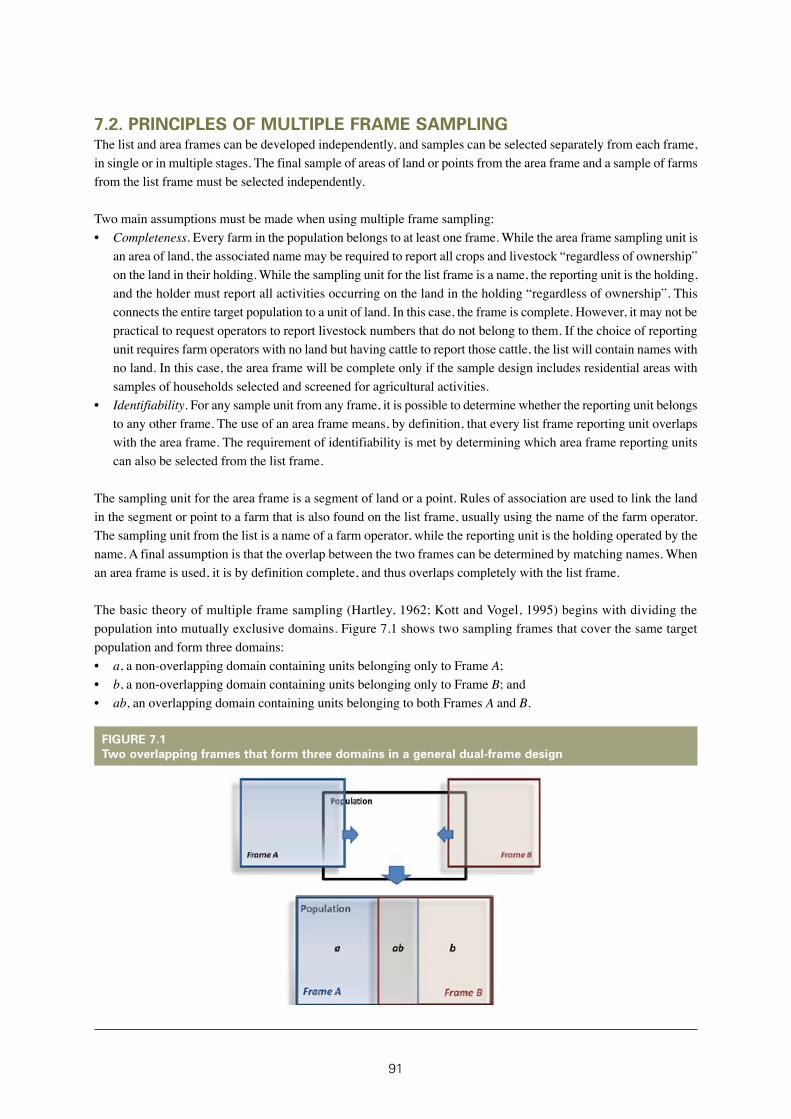
91
7.2. PRINCIPLES OF MULTIPLE FRAME SAMPLINGThe list and area frames can be developed independently, and samples can be selected separately from each frame, in single or in multiple stages. The final sample of areas of land or points from the area frame and a sample of farms from the list frame must be selected independently.
Two main assumptions must be made when using multiple frame sampling:• Completeness. Every farm in the population belongs to at least one frame. While the area frame sampling unit is
an area of land, the associated name may be required to report all crops and livestock “regardless of ownership” on the land in their holding. While the sampling unit for the list frame is a name, the reporting unit is the holding, and the holder must report all activities occurring on the land in the holding “regardless of ownership”. This connects the entire target population to a unit of land. In this case, the frame is complete. However, it may not be practical to request operators to report livestock numbers that do not belong to them. If the choice of reporting unit requires farm operators with no land but having cattle to report those cattle, the list will contain names with no land. In this case, the area frame will be complete only if the sample design includes residential areas with samples of households selected and screened for agricultural activities.
• Identifiability. For any sample unit from any frame, it is possible to determine whether the reporting unit belongs to any other frame. The use of an area frame means, by definition, that every list frame reporting unit overlaps with the area frame. The requirement of identifiability is met by determining which area frame reporting units can also be selected from the list frame.
The sampling unit for the area frame is a segment of land or a point. Rules of association are used to link the land in the segment or point to a farm that is also found on the list frame, usually using the name of the farm operator. The sampling unit from the list is a name of a farm operator, while the reporting unit is the holding operated by the name. A final assumption is that the overlap between the two frames can be determined by matching names. When an area frame is used, it is by definition complete, and thus overlaps completely with the list frame.
The basic theory of multiple frame sampling (Hartley, 1962; Kott and Vogel, 1995) begins with dividing the population into mutually exclusive domains. Figure 7.1 shows two sampling frames that cover the same target population and form three domains:• a, a non-overlapping domain containing units belonging only to Frame A;• b, a non-overlapping domain containing units belonging only to Frame B; and• ab, an overlapping domain containing units belonging to both Frames A and B.
FIGURE 7.1Two overlapping frames that form three domains in a general dual-frame design
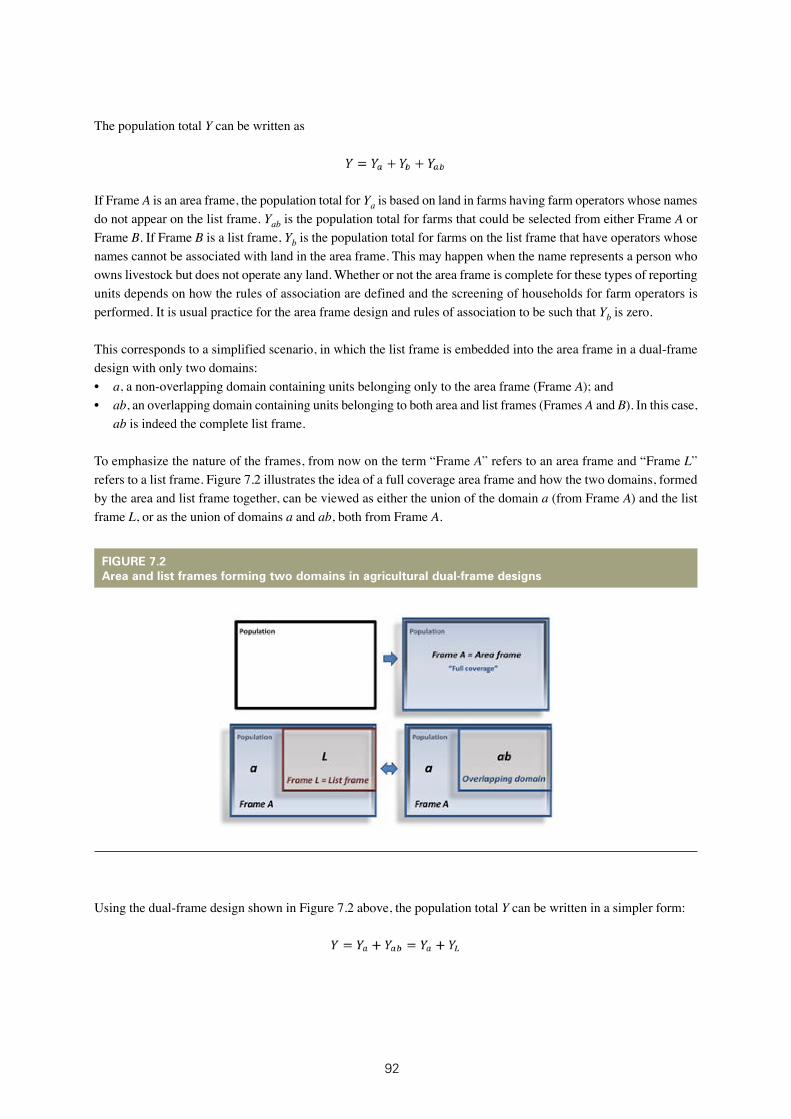
92
The population total Y can be written as
If Frame A is an area frame, the population total for Ya is based on land in farms having farm operators whose names do not appear on the list frame. Yab is the population total for farms that could be selected from either Frame A or Frame B. If Frame B is a list frame, Yb is the population total for farms on the list frame that have operators whose names cannot be associated with land in the area frame. This may happen when the name represents a person who owns livestock but does not operate any land. Whether or not the area frame is complete for these types of reporting units depends on how the rules of association are defined and the screening of households for farm operators is performed. It is usual practice for the area frame design and rules of association to be such that Yb is zero.
This corresponds to a simplified scenario, in which the list frame is embedded into the area frame in a dual-frame design with only two domains:• a, a non-overlapping domain containing units belonging only to the area frame (Frame A); and• ab, an overlapping domain containing units belonging to both area and list frames (Frames A and B). In this case,
ab is indeed the complete list frame.
To emphasize the nature of the frames, from now on the term “Frame A” refers to an area frame and “Frame L” refers to a list frame. Figure 7.2 illustrates the idea of a full coverage area frame and how the two domains, formed by the area and list frame together, can be viewed as either the union of the domain a (from Frame A) and the list frame L, or as the union of domains a and ab, both from Frame A.
Using the dual-frame design shown in Figure 7.2 above, the population total Y can be written in a simpler form:
FIGURE 7.2Area and list frames forming two domains in agricultural dual-frame designs

93
This expression shows that estimates for the population total Y can be produced by adding estimates for the total of each domain:
Although the overlapping domain can be represented by either ab or L, the estimators Ŷab and ŶL use data and sample design information from different frames. Therefore, Hartley (1962) proposed using both in the same expression to define a general class of estimators, as follows:
where• ŶH is Hartley’s general estimator, also referred to as the full population total estimator, making use of data from
both frames;• Ŷa is the domain a estimator, based only on the area frame sample data;• Ŷab is the domain ab estimator, based only on the area frame sample data; • ŶL is the estimator for the list frame total, based only on the list frame sample data; and• p is an arbitrary constant, such that 0 ≤ p ≤ 1.
Indeed, each choice of p defines an estimator. The so-called screening estimator, that corresponds to choosing p = 0, is very convenient. In this case,
To apply this estimator, the sampled units from the area frame that are listed in the list frame are eliminated. In practice, a screening procedure is applied to the area frame sampled units to identify area reporting units that are also present in the list frame; hence the name “screening estimator”. In some cases, the domains can be determined from a large-scale area frame survey, and then only the non-overlap domain sampled for subsequent surveys.
Since the area and list frames were developed and sampled independently, the design-based estimators for Ya and Yab are used to estimate the corresponding population values. However, the population total for farms found in both frames Yab can be estimated using design-based estimators from either Frame A or B or from a combination of both frames. A large proportion of the literature on multiple frame sampling concerns estimation when the sampling units are represented by both frames.
Another feature of multiple frame sample designs is that each frame can be designed independently of the other. The optimal use of multi-stage sampling, stratification, the use of PPSs, and calibration estimators can be applied separately to each frame. It remains necessary to determine, for each area frame sampling or reporting unit, whether or not it could also have been selected from the list frame. This requirement complicates the use of multiple frames. Section 3 below outlines problems in the application of multiple frame surveys.

94
7.3. PROBLEMS IN THE APPLICATION OF MULTIPLE FRAME SURVEYSMultiple frame surveys include all the complexities of single frame surveys, as well as the additional requirement that the overlap between frames be determined (Vogel, 1975).
All farms in the list frame must be completely identified by name, address, and any other name forms that can identify the farming unit. The data collection for the area frame must also obtain detailed information on names and addresses, because the overlap is based on a name-matching exercise. A list of farms from a census identified only by an address will be difficult to use in a multiple frame context.
Another issue is that when developing a list of farms, more than one source of names may be available. For example, one list of names may derive from the agricultural census and another from an administrative source. The choice is between using the two lists in the multiple frame design or combining them. If the two lists are used in a multiple frame design as well as with an area frame, the population can be divided into four mutually exclusive domains. The need to identify all domains when there are two or more list frames greatly complicates the survey and estimation process. For this reason, it is more practical to combine all lists and remove duplicates prior to sampling. While record linkage methodologies can assist in removing duplicates, the process is subject to errors in the linkage.
The need to match names from the area frame sample to names on the list frame complicates the survey process and is subject to non-sampling errors. The area frame sampling unit must be mapped onto a reporting unit, as does the list frame name. A further complexity arises from the fact that the list frame represents farms or households for a previous point in time. Some may no longer exist when the survey is conducted, possibly having been replaced with other farms included elsewhere in the list or that are new to the country’s agriculture. The following example illustrates the situations that may be encountered.
Suppose that when the census was conducted and used to develop the list frame, the name associated with Farm/Household 1 was “Mr. A”. Mr. A was thus selected for the list sample. However, when the enumerator visited the selected household, it was learned that Mr A no longer lived there and that there was now a “Mr. B”. The enumerator collects data for the land operated by Mr. B. Rules of association are used to determine whether the statistical office can use the data reported by Mr. B, according to the following steps:• Determine whether Mr. B may also be found elsewhere on the list. If yes, Mr. B already had a chance of being
selected, such that either a multiplicity estimator can be used or the data for Farm 1 set to zero.• Mr. B does not appear elsewhere on the list. Does the statistical office use Mr. B’s data for Farm 1? Suppose that
the area frame sample contains land operated by Mr. B. Data for Mr. B will be collected from the area frame. The name-matching exercise will show that Mr. B is not on the list; therefore, Farm 1 falls within the domain belonging only to the area frame. The data for Mr. B from the list sample should not be substituted for Mr. A in the list sample, because it would result in an upward bias.
The need to match area frame reporting units with the list frame requires taking extreme care when recording names and addresses, to avoid errors. A misspelled name may result in an area reporting unit being assigned to the wrong name, or require a follow-up interview.
Non-response is especially acute when used in a multiple frame design, especially for the area frame. Because the area frame tract or area surrounding a data point can be observed and measured, the results for non-response are robust. However, in multiple frame design, it is essential that a name be associated with the area tract. The difficulty of assigning names where there is non-response is a major source of non-sampling error in multiple frame sample surveys.
A list and area multiple frame sampling design should yield more efficient and robust estimators than use of an area frame alone. If the list frame is not constructed carefully or is not updated, outliers can occur if rare or large farms are missing from the list and appear in the area non-overlap domain. If the large farms were on the list frame,

95
its design-based expansion factor would be very small; however, a large expansion factor would arise in the area frame’s non-overlap domain.
A common problem is the temptation to make the list as large as possible to avoid the occurrence of outliers. However, the larger the list, the more subject it is to duplication. The smaller the list, the easier it is to avoid duplication and to determine the non-overlap domain.
Another common problem is the temptation to add names found in the area frame survey to the list frame. These additions introduce a downward bias, because the estimation probabilities have been changed (reduced) when added to the list.
To determine the domains, it must first be assumed that every farm or household included in the list frame has a chance of being selected in the area frame sample. The area frame sample then includes two domains: those that are not on the list (non-overlap) and those that are on the list (overlap). An essential point is that the identification of the two area frame domains must be based on the area frame sampled units, and not on the entire area frame.
As stated before, the area frame sampling unit is land-based. The survey process must associate names of farm operators and/or households with each sampled unit of land. This provides a listing of names associated with the area frame sample that is to be matched with the entire list frame (not the list sample, but the entire list frame). The accuracy of this matching process depends on the quality of the data collection effort from the area frame side, and the quality of the list frame development process. If the name associated with an area frame reporting unit is also on the list frame, then the area frame unit is on the overlap domain. This requires assuming that the name on the list would report for the same unit of land selected in the area frame sample. If the name associated with the area frame reporting unit cannot be found on the list frame, then that area frame reporting unit is in the non-overlap domain. If a name from the area frame does not match a list frame name exactly, but is close, then it may be possible to compare addresses or secondary names associated with the reporting units. In some cases, it may be necessary to return to the area frame reporting unit to obtain additional information to determine the overlap status. This is an exacting process, in which errors in classification add error and/or bias to the estimators.
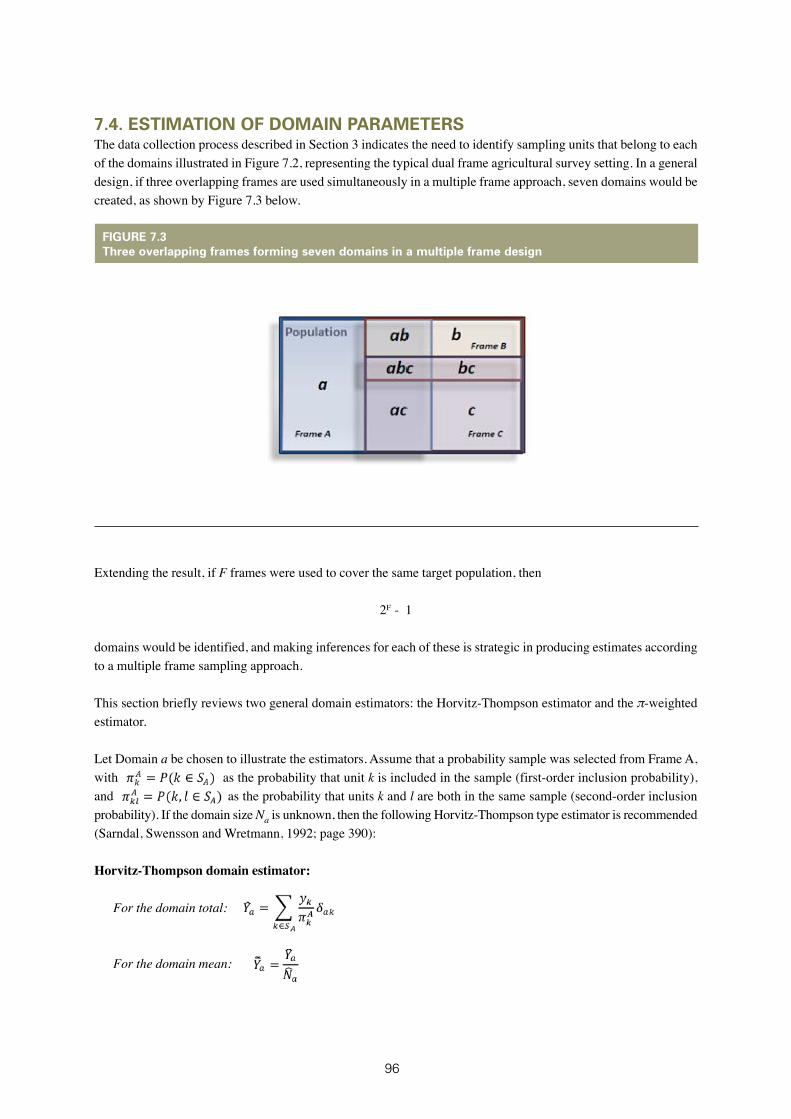
96
7.4. ESTIMATION OF DOMAIN PARAMETERS The data collection process described in Section 3 indicates the need to identify sampling units that belong to each of the domains illustrated in Figure 7.2, representing the typical dual frame agricultural survey setting. In a general design, if three overlapping frames are used simultaneously in a multiple frame approach, seven domains would be created, as shown by Figure 7.3 below.
Extending the result, if F frames were used to cover the same target population, then
2F - 1
domains would be identified, and making inferences for each of these is strategic in producing estimates according to a multiple frame sampling approach.
This section briefly reviews two general domain estimators: the Horvitz-Thompson estimator and the π-weighted estimator.
Let Domain a be chosen to illustrate the estimators. Assume that a probability sample was selected from Frame A, with as the probability that unit k is included in the sample (first-order inclusion probability), and as the probability that units k and l are both in the same sample (second-order inclusion probability). If the domain size Na is unknown, then the following Horvitz-Thompson type estimator is recommended (Sarndal, Swensson and Wretmann, 1992; page 390):
Horvitz-Thompson domain estimator:
For the domain total:
For the domain mean:
FIGURE 7.3Three overlapping frames forming seven domains in a multiple frame design
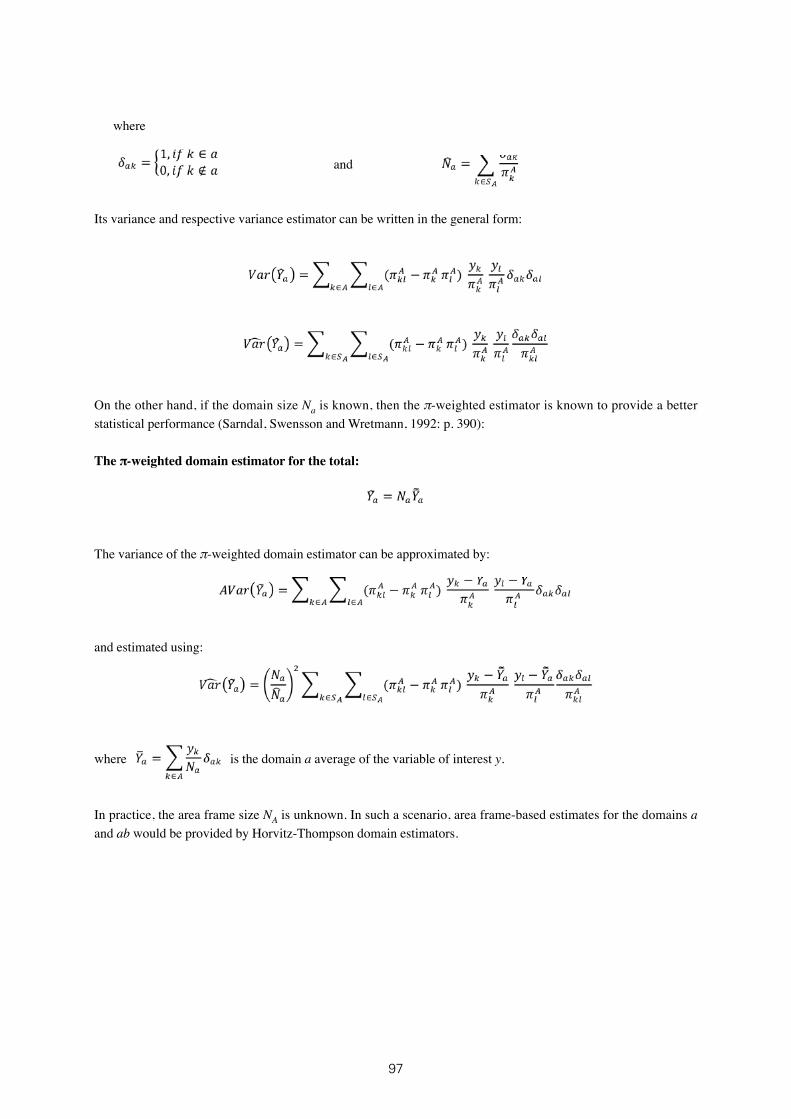
97
where
and
Its variance and respective variance estimator can be written in the general form:
On the other hand, if the domain size Na is known, then the π-weighted estimator is known to provide a better statistical performance (Sarndal, Swensson and Wretmann, 1992: p. 390):
The π-weighted domain estimator for the total:
The variance of the π-weighted domain estimator can be approximated by:
and estimated using:
where is the domain a average of the variable of interest y.
In practice, the area frame size NA is unknown. In such a scenario, area frame-based estimates for the domains a and ab would be provided by Horvitz-Thompson domain estimators.

98
7.5. DUAL FRAME ESTIMATORDual frame estimators combine estimates for the domains generated by the two frames covering the target population. Since independent probability sampling schemes are applied to each frame, to introduce the estimators, it is necessary to distinguish the inclusion probabilities related to each frame.
Let SA denote the sample selected from the area frame and SL be the sample selected from the list frame.
Define as the probability that sample unit k is included in the area frame sample, and as the probability that both k and l are in SA.
Similarly, define as the probability that k is included in the list frame sample and as the probability of both k and l being in SL.
In the following subsections, the main dual frame estimators proposed in the literature are presented.
7.5.1. Hartley and the screening estimatorAs mentioned previously, Hartley’s general class of dual frame estimators is given by:
Although independent samples are taken from each frame, the general variance form must take into account the area frame-related covariance between estimators for non-overlapping and overlapping domains a and ab respectively, resulting in the expression below:
(1)
Any value for p such that 0 ≤ p ≤ 1 can be used. One of these is an optimal choice, in the sense that it minimizes the variance Var(ŶH). Note that Expression (1) above can also be written as
Therefore,
Setting the above derivative to zero and solving for p provides the desired optimum value:
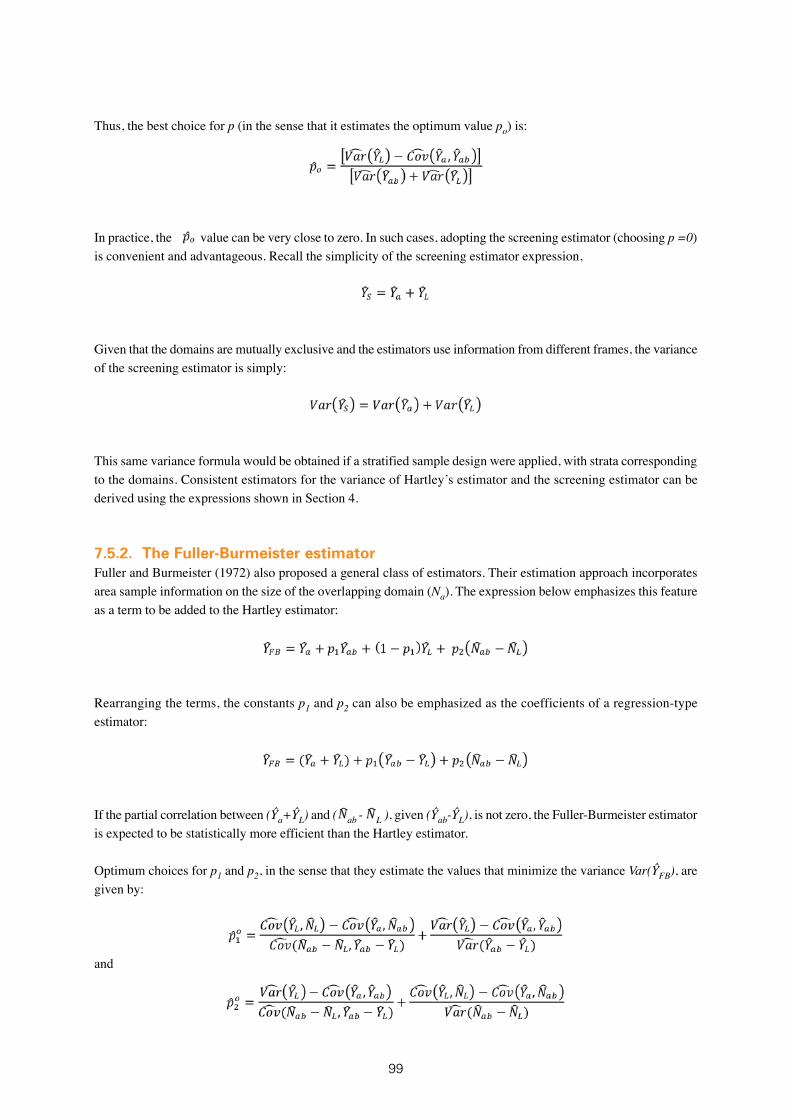
99
Thus, the best choice for p (in the sense that it estimates the optimum value po) is:
In practice, the value can be very close to zero. In such cases, adopting the screening estimator (choosing p =0) is convenient and advantageous. Recall the simplicity of the screening estimator expression,
Given that the domains are mutually exclusive and the estimators use information from different frames, the variance of the screening estimator is simply:
This same variance formula would be obtained if a stratified sample design were applied, with strata corresponding to the domains. Consistent estimators for the variance of Hartley’s estimator and the screening estimator can be derived using the expressions shown in Section 4.
7.5.2. The Fuller-Burmeister estimatorFuller and Burmeister (1972) also proposed a general class of estimators. Their estimation approach incorporates area sample information on the size of the overlapping domain (Na). The expression below emphasizes this feature as a term to be added to the Hartley estimator:
Rearranging the terms, the constants p1 and p2 can also be emphasized as the coefficients of a regression-type estimator:
If the partial correlation between (Ŷa+ŶL) and ( ab - L ), given (Ŷab-ŶL), is not zero, the Fuller-Burmeister estimator is expected to be statistically more efficient than the Hartley estimator.
Optimum choices for p1 and p2, in the sense that they estimate the values that minimize the variance Var(ŶFB), are given by:
and
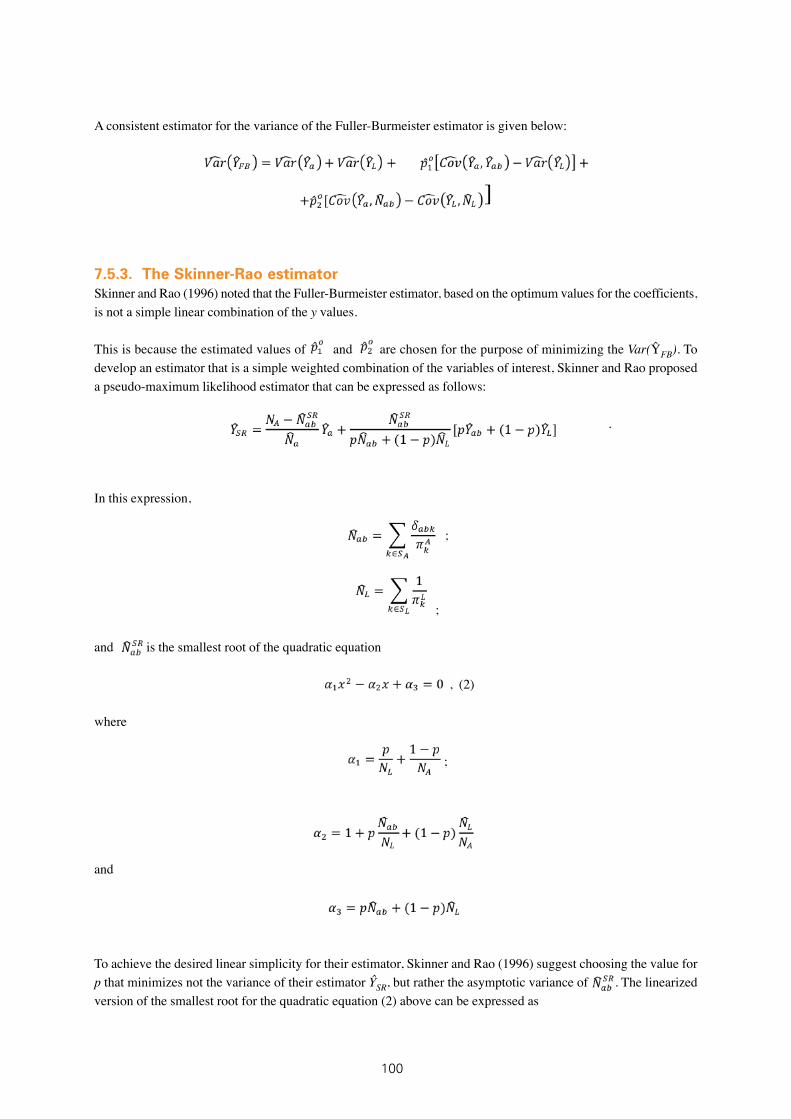
100
A consistent estimator for the variance of the Fuller-Burmeister estimator is given below:
]
7.5.3. The Skinner-Rao estimatorSkinner and Rao (1996) noted that the Fuller-Burmeister estimator, based on the optimum values for the coefficients, is not a simple linear combination of the y values.
This is because the estimated values of and are chosen for the purpose of minimizing the Var(ŶFB). To develop an estimator that is a simple weighted combination of the variables of interest, Skinner and Rao proposed a pseudo-maximum likelihood estimator that can be expressed as follows:
.
In this expression,
;
;
and is the smallest root of the quadratic equation
, (2)
where
;
and
To achieve the desired linear simplicity for their estimator, Skinner and Rao (1996) suggest choosing the value for p that minimizes not the variance of their estimator ŶSR, but rather the asymptotic variance of . The linearized version of the smallest root for the quadratic equation (2) above can be expressed as
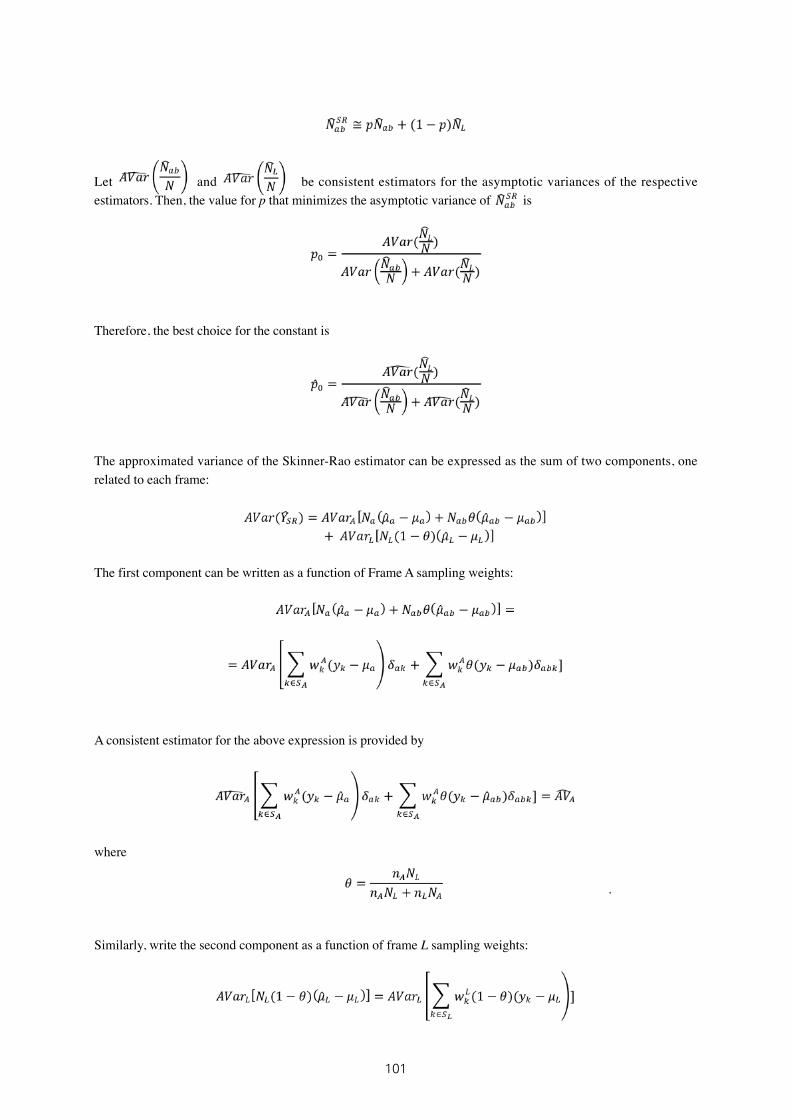
101
Let and be consistent estimators for the asymptotic variances of the respective estimators. Then, the value for p that minimizes the asymptotic variance of is
Therefore, the best choice for the constant is
The approximated variance of the Skinner-Rao estimator can be expressed as the sum of two components, one related to each frame:
The first component can be written as a function of Frame A sampling weights:
A consistent estimator for the above expression is provided by
where
.
Similarly, write the second component as a function of frame L sampling weights:

102
Then, a consistent estimator for the variance approximated above is given by
.
Therefore,
7.5.4. Single frame-type estimatorThe Skinner-Rao estimator is one example of estimator that can be expressed as a single frame-type estimator. Previously, Bankier (1986), Kalton and Anderson (1986) and Skinner (1991) had proposed types of estimators that fit into a class with the feature of producing estimates based on the sum of estimates to each frame. Let ŸA be the estimator used in the area frame data and ŸL be the estimator used in the list frame data. Then, the general form of this class of estimators is given by:
where
; and
Since the samples are taken independently from each frame, the variance and variance estimation of the estimators in this class can be assessed separately and their components summated over, to provide the respective dual-frame measure.
7.5.5. Choosing among dual-frame estimatorsThe estimators introduced above display differing levels of complexity, depending on how they provide estimates for the overlapping domain Yab. All estimators can be extended to more than two frames, and they are also able to accommodate complex sample designs (Ferraz, 2015). Considering the level of complexity involved in the data collection and matching sampled units between the frames (Vogel 1975), it is recommended that the estimator be chosen on the basis of simplicity. Screening estimators are the simplest to understand and apply in practice, leaving the more complex aspects to the data collection and matching process. Therefore, it is recommended that these be used as a valid starting point. The precision of estimates can be improved by investigating the feasibility and efficiency of other estimators based on simulation studies at a later stage. These studies seeking to compare the statistical performances of dual-frame estimators should take into account the peculiarities of each country and specific probability sample designs.
To improve precision, one should not only search for competitive dual-frame estimators, but also ascertain how to incorporate auxiliary variables – that may be available through at least one of the frames – into the inference process.

103
8. USING AUXILIARY INFORMATIONIt should be noted that the Fuller-Burmeister estimator takes advantage of auxiliary information provided by the sample. Often, other types of information are also available from the frames. Given the availability of (external) auxiliary information from at least one of the frames, it is desirable to take advantage of these either by incorporating this information into the sampling scheme, using PPS or MPPS designs, or by using it to assist in the construction of a more appropriate regression-type estimator.
Ferraz and Coelho (2007) investigated ratio-type dual-frame estimators, building upon the Hartley estimator class.

104
9. ALLOCATION OF SAMPLE SIZE TO FRAMESIn dual-frame surveys, given an estimated sample size, the problem of sample size allocation to the frames must still be addressed. Suppose that the screening estimator is used and a simple random sample (without replacement) is taken in both Frames A and L. Then,
where
; and ;
The variance components are:
; and
;
where
; and
are the domain variance and domain square average of the variable of
interest, respectively.
Let . Then,
Now, the problem of dual frame allocation is the same as the problem of determining the values for nA and nL that will minimize Var(ŶS) subject to cost constraints. Suppose that a linear cost function reasonably represents the costs of a given agricultural dual-frame survey. This means that the total cost C involved in the survey is such that
,
where c0 is a fixed overhead cost and cA and cL represent the cost of sampling and observing one element of Frames A and L respectively. In these conditions, it is known that the optimum allocation is to choose
; and

105
This result can be extended for the general probability sample designs applied to each frame, such that
where• VA is a variance component related to Var(Ŷa) that does not depend on nA;• VL is a variance component related to Var(ŶL) that does not depend on nL; and• R is the remaining term that does not depend on nA nor on nL, and the cost function is given by Equation above
(in bold). In this case, the optimum allocation is to choose
; and .
106
10. SCOPE AND COVERAGE OF THE LIST FRAMEPrevious chapters have described the strengths and weaknesses of area and list sampling frames in detail. Here, the assumption will be that an area frame is to be developed as a main component of the MSF. The purpose of this Section is to provide guidelines on determining the scope and coverage of the list frame to be used in conjunction with the area frame. It is further assumed that for cost function purposes, the data collection from the list and area frames will take place by personal enumeration. In some cases, list frame data collection costs may be lower than area frame collection costs if the land operated by the list frame reporting unit need not be observed.
Some guidelines follow:• Section 3 of this Chapter details the problems that arise when multiple frame sampling is performed. These
suggest that the list frame should be kept as small as possible, to ensure that the names and addresses for matching purposes with the list frame are prepared as carefully as possible.
• A list of names without any identifying information on the characteristics of the farm and its relative size in terms of land area and number of livestock will be no more statistically efficient than a list of segments or points from the area frame. The primary reason for adopting a list frame is to use its auxiliary information for sampling purposes. Names without supporting auxiliary information should not be included in the list frame.
• Special attention should be given to large commercial farms to ensure that they are included in the list frame and appropriately identified to guarantee that they are in the overlap domain, if found in an area frame sample.
• Special attention should also be given to ensure that farms that produce crops or have livestock that appear on less than 10-15 percent of the farms are in the list frame.
• Names from the area frame sample should not be added to the list frame. The overlap is determined from the area frame sample, not from the entire frame. A downward bias results if area frame names are added to the list frame.
The use of multiple frame sampling is optimal when the area frame is the primary frame and the list frame only includes large commercial farms and farms with rare items. A rare item is one that may be found on fewer than 20 percent of the farms. The need to identify overlap between the frames is the greatest source of non-sampling errors and will be minimized when a small list is used.
Area frames require less frequent updating than list frames – this is another reason in favour of keeping the list frame small.
Samples within frames can be selected independently, thus allowing use of the many alternatives offered by multi-stage and multi-phase sampling. The only limiting factor is that the overlap between frames must be identified during the estimation process.
The United States has been successfully using dual-frame designs in agricultural surveys. Annex C contains a brief description of its experience, as well as those of Ethiopia, China and Brazil.

107
8Summary and general guidelines on implementing a Master Sampling Frame by Frederic Vogel
The Global Strategy begins with a long-term vision to integrate agriculture into the national statistical system on the basis of an MSF. The Global Strategy introduces a bold concept: the economic and social dimensions of agriculture are linked to land cover and to the environmental impact of agriculture. To support this concept, the Global Strategy calls for the use of geo-referenced information on holdings, households and enterprises, including satellite and airborne imagery.
This Handbook relies on the existing large body of statistical theory on sampling and survey methods; no new theory is presented. Instead, the goal was to translate this theory into a common language related to agricultural statistics. For this reason, this Handbook is considered to be a living document, which can be updated as new theories and methods are developed and new problems emerge.
The goals set by the Global Strategy may appear daunting to developing countries; for this reason, it is suggested that the MSF be developed in stages. It should also be recognized that the development will require multiple years.
This Handbook first provides basic principles on the definitions of sampling frames, sampling units, reporting units, variables of interest, and their application in the use of area and list sampling frames. Multiple frame sampling is also defined.
Statistical organizations often develop sampling frames for specific purposes, without considering the overall data needs of policymakers and other data users. Chapter 2 provides a detailed review of the background information necessary to develop and use the MSF. This is an essential exercise, which must be carried out with full input from policymakers and the data user community. It should be an iterative process, in which the first set of requirements is reviewed together with the statistical requirements for providing the data. This first review, applied against the frame development methods provided in this Handbook, may require more than one round, because the demand may exceed the country’s initial capabilities by far.
108
While this Handbook focuses on the development of the MSF, it also reviews the properties of the estimators for the various sampling designs available, because these may affect the choice of sample frame. Chapter 3 outlines these sampling methods, which range from simple random and systematic to the use of sampling using PPS. All of these can be applied in a single stage design or in one or more stages, in which the first stage may be a large land cluster or an administrative unit (such as a county). A common mistake is that, in the effort to achieve cost efficiencies, multiple stage sampling is implemented without considering the impact on the resulting sampling variability. Chapter 2 and Annex A provide an overview of the variance components inherent in two-stage sample designs. Multi-stage sampling provides a valuable tool for developing countries, but its strengths and weaknesses must be understood. A related issue is how sampling and non-sampling errors contribute to total survey variability.
In recent years, there have been rapid advancements in the availability and quality of technical tools that support the development of MSFs, ranging from developments in computer processing capabilities and software to the availability and quality of satellite imagery. Chapter 4 provides guidelines on the use of GIS and their data layers as they apply to both area and list frames. Another valuable instrument is GPS, which supports frame development and data collection. The Chapter concludes with a review of the use of remote sensing for developing sampling frames.
Chapter 5 provides a thorough review of the different methods of using list frames to build and use MSFs. Methods based on the use of population censuses and agricultural censuses are described in detail. Two-stage sampling is also illustrated, together with methods to determine the size and scope of PSUs. The chapter distinguishes between list frames of rural households (population censuses), agricultural holdings (agricultural censuses) and farms that are commercial entities (business registers). While countries are encouraged to implement an agricultural census in such a manner that it can also be used to build a sampling frame, they are not always aware of the coverage errors, misclassification errors and duplication that may be inherent in list frames. A common problem affecting list frames is their rapid obsolescence as individuals or households change location or composition, with additions or deletions of units leading to problems in estimation due to multiplicity. The Chapter examines the impact of different types of multiplicity in detail. Issues of under- and over-coverage are presented, with a review of non-sampling errors. The Chapter concludes with a discussion of the need to maintain and update list frames.
One of the earliest forms of probability sampling for agriculture was the area frame that was developed in the US and known as the MSF for agriculture. Chapter 6 provides guidance on developing and using an area sampling frame and builds on the technology described in Chapter 4. Several different types of area frames are defined; these differ in terms of the choice of the basic sampling unit and respective reporting units, the use of single or multi-stage sampling and the use of stratification. The Chapter also outlines the strengths and weaknesses of the data collection methods associated with area sampling frames, mainly the use of direct observation as opposed to farmer interviews. The Chapter concludes with methods to link area frames with census or administrative information using EAs.
Chapters 5 and 6 review in detail the available methodology for the development and use of list and area frames. Both have strengths and weaknesses. Lists of farms with associated auxiliary data on size measures can be more statistically efficient for sample survey purposes than other forms of sampling. However, they rapidly become out-of-date and are prone to under-coverage. Area frames may be complete, but are better suited to measurement of small farms and commodities that are widely distributed in the population. Sample sizes must be sufficiently large to control sampling variability, if there are large farms in the population. Multiple frame sampling was introduced as a method that exploits the strengths of individual frames, while allowing sampling flexibility for each frame.
Chapter 7 provides the principles of multiple frame sampling and an in-depth review of the estimators. One conclusion drawn is that the choice of estimator should be based on simplicity. The Chapter gives an overview of common problems in the application of multiple frame sampling due to the requirement of identifying the overlap between frames. While the term “multiple frame sampling” implies that more than two frames can be used, the complexities in determining the overlap between frames appears to favour limiting the choice to two frames. The

109
general conclusion is that the list frame containing mostly large commercial farms and farms producing important but rare items should be kept as small as possible. Annex C summarizes a number of country experiences; several countries have stated that they are gradually adopting multiple frame sampling.
In deciding which master sampling frame to use in a given country situation, it is essential to perform a careful analysis, in terms of availability of resources, material available, institutional support, the scope of the statistical system and objectives of the surveys to ensure that the options selected are suitable and sustainable. The guidelines are provided for the use of the Handbook and the implementation of the MSF.1. Conduct a thorough review of the statistical methods, including censuses and surveys, used for agriculture in your
country. Where relevant, separate reviews should undertaken by/for the relevant National Statistical Office and by/for the statistical unit within the Ministry of Agriculture. Both the methodology used and the data provided must be reviewed.
2. Review other censuses and surveys in your country with a focus on sample frames. Examples are the population census, national household surveys, and price collections for the Consumer Price Index.
3. Review administrative data and other possible sources for building and/or updating a list of farms or agricultural holders.
4. Obtain information on census or survey systems in countries of similar size, form of agriculture, and capabilities.5. Compare findings from steps 1, 2, 3 and 4 above with the methods described in this Handbook to find out where
similar methods are used and build off their experiences.6. Follow the guidelines on obtaining background information on your country’s requirements for data on
agriculture, as described in Chapter 2. This information should then be contrasted with data currently available.7. Identify overlaps in the statistical systems where resources can be combined to build an MSF. 8. Determine the requirements for geo-referencing agricultural and/or population census EAs. Identify how this
can assist other parties in the national statistical system.
Following steps 1-8 above, there should be enough information to make a first recommendation on the choice of frame (list or area) or on a form of multiple frame sampling. Seek a peer review; revise as necessary. Begin implementation in a portion of the country.
The final choice of MSF should take into consideration not only the costs of frame development and data collection, but also the costs required for maintenance and updating. The proposals should be realistic and reflect national capabilities, and include an indicative budget and timeframe for implementation. An effective MSF will facilitate the integration of agriculture into the national statistical system and will benefit the entire statistical system.

110

111
References
Chapters 1-2 and Annex B
Abaye, A.T. 2013. Master Sampling Frames for Agricultural and Rural Statistics in Ethiopia. Paper presented at the Sixth International Conference on Agricultural Statistics, 23-25 October 2013. Rio de Janeiro, Brazil.
Ambrosio, L. 2014. Identifying the Most Appropriate Sampling Frame for Specific Landscape Types. Global Strategy Technical Report: Rome.
Bailey, J.T. & Kott, P.S. 1997. An Application of Multiple List Frame Sampling for Multi-purpose Surveys (pp 496-500). In Proceedings of the Section on Survey Research Methods, American Statistical Association publication.
Benedetti, R. 2014. Developing more efficient and accurate methods for using remote sensing. Global Strategy Technical Report: Rome.
Benedetti, R.. Bee, M., Espa, G. & Piersimoni, F. 2010. Agricultural Survey Methods. John Wiley & Sons, Ltd: Chichester, UK.
Bolliger, F.P., Soares de Freitas, M.P., de Abreu Antonaci, G. & Borges Cabrat, M.D. 2012. Master Sampling Frames for Agricultural Surveys: Brazil Overview. Paper prepared for the High Level Stakeholders Meeting on the Global Strategy, 3-5 December 2012, Rome.
Davis, C. 2009. Area Frame Design for Agricultural Surveys. US Department of Agriculture, National Agricultural Statistics Service, Research Report Number RDD-09-xx.
Deming, W.E. 1960. Sample Design in Business Research. John Wiley and Sons: New York, US.
FAO. 1996. Conducting Agricultural Censuses and Surveys. FAO Statistical Development Series n. 6. FAO Publication, Rome.
___ 1996. Multiple Frame Agricultural Surveys: Volume I: Current Surveys based on area and list sampling methods. FAO Statistical Development Series n. 7, Rome, Italy
___ 1998. Multiple Frame Agricultural Surveys. Volume 2: Agricultural Survey Programs based on areal frame or dual frame sample designs. FAO Statistical Development Series n. 10. FAO Publication, Rome.
___ 2005. A system of Integrated Agricultural Censuses and Surveys: Volume 1: World Programme for the Census of Agriculture 2010. FAO Statistical Development Series n. 11. FAO Publication, Rome.
Ferraz, C. 2015. Linking Area Frames and List Frames in Agricultural Surveys. Global Strategy Technical Report: Rome.
Fuller, W.A. & Breidt, F.J. 1998. Estimation for Supplemental Panels. Sankhya: The Indian Journal of Statistics, 61: 58-70.

112
Gallego, F.J. 1995. Sampling Frames of Square Segments. Report EUR 16317. European Commission Joint Research Centre Publication, Ispra, Italy.
___________ 2012. “LUCAS: a possible scheme for a master sampling frame. Presentation prepared for the High Level Stakeholders Meeting on the Global Strategy, 3-5 December 2012, Rome.
___________ 2013. The use of a Point Sample as a Master Frame for Agricultural Statistics. Paper prepared for the Sixth International Conference on Agricultural Statistics, 23-25 October 2013. Rio de Janeiro, Brazil.
Gallego F.J., Carfagna E. & Fuenette I. 1998. Geographic Sampling Strategies and Remote Sensing. Report to EUROSTAT, F2, Agricultural Products and Fisheries.
Gallego F.J., Delincé J., & Carfagna E. 1994. Two-Stage Area Frame Sampling on Square Segments for Farm Surveys. Survey Methodology, 20(2): 107-115.
Goebel, J.J. 1998. The National Resources Inventory and Its Role in U.S. Agriculture. Agricultural Statistics 2000 . In Holland, T.E. and van den Broecke, M.P.R. (eds), Proceedings of the International Conference on Agricultural Statistics (pp. 181-192). International Statistical Institute, Voorburg, The Netherlands.
Iglesias, L. 2014. Improving the use of GPS, GIS, and RS for setting up a Master Sampling Frame. Paper prepared for the FAO Scientific Advisory Committee. FAO Publication, Rome.
Jinguji, I. 2012. How to Develop Master Sampling Frames using Dot Sampling Method and Google Earth. Presentation prepared for the High Level Stakeholders Meeting on the Global Strategy, 3-5 December 2012, Rome.
Kott, P.S. & Bailey, J. 2000. The Theory and Practice of Maximal Brewer Selection with Poisson PRN Sampling. Paper prepared for the Second International Conference on Establishment Surveys, 17-21 June 2000. Buffalo, New York, US.
Kott, P.S. & Vogel, F. 1995. Multiple Frame Business Surveys. In Cox, B.G., Binder, D.A., Chinnappa, B., Christianson, A. Colledge, M.J. and Kott, P.S. (eds). Business Survey Methods. John Wiley & Sons: New York, US.
Nusser, S.M. & Goebel, J.J. 1997. The National Resources Inventory: A Long-Term Multi-Resource Monitoring Programme. Environmental and Ecological Statistics, 4(3):181-204.
Pettersson, H. 2005. Design of Master Sampling Frames and Master Samples for Household Surveys in Developing Countries, in United Nations Department of Economic and Social Affairs, Household Sample Surveys in Developing and Transition Countries. United Nations Publication: New York, US.
Sephoko, N., Matsoso, L. & Raphoto M. 2013. Master Sampling Frames for Agricultural and Rural Statistics - Experience of Lesotho. Paper presented at the Sixth International Conference on Agricultural Statistics, 23-25 October 2013. Rio de Janeiro, Brazil.
Steiner, M. 2005. Sample Design for Agricultural Surveys in China. Proceedings of the 55th Conference of the International Statistical Institute, 5-12 April 2005. Sydney, Australia.
UNSD. 1986. National Household Survey Capability Programme: Sampling Frames and Sample Designs for Integrated Household Survey Programmes. United Nations Publication: New York, US.

113
______ 2005. Household Sample Surveys in Developing and Transition Countries. United Nations Publication: New York, US.
USDA. 2013. Summary report: 2010 National Resources Inventory. Publication of the Natural Resources Conservation Service, Washington, DC and Center for Survey Statistics and Methodology, Iowa State University, Ames, Iowa.
____ 2009. Census of Agriculture: Volume 1 U.S. Summary and State Reports. National Agricultural Statistics Service, Washington, DC.
Vogel, F. 1973. An Application of a Two-Stage Multiple Frame Sample Design. In Proceedings of the Social Statistics Section (pp. 617-622), American Statistical Association Publication.
________ 1975, Surveys with Overlapping Frames – Problems in Application. In Proceedings of the Social Statistics Section (pp. 694-699), American Statistical Association Publication.
World Bank & FAO. 2008. Tracking Results in Agriculture and Rural Development in Less-than-Ideal Conditions. Publication of Global Donor Platform for Rural Development, Food and Agriculture Organization of the United Nations and the World Bank.
World Bank, FAO & UNSC. 2011. Global Strategy to Improve Agricultural and Rural Statistics. Report Number 56719-GLB, Washington, DC, World Bank.
Chapter 3
Barnett, V. 2002. Sample Survey: Principles and Methods. John Wiley and Sons: Chichester, UK.
Biemer, P.P. & Lyberg, L.E. 2003. Introduction to Survey Quality. John Wiley & Sons, Inc.: Hoboken, NJ, US.
Cochran, W.G. 1977. Sampling Techniques. 3rd edition. John Wiley & Sons: New York, US.
Fan, C.T., Muller, M.E. & Rezucha, I. 1962. Development of sampling plans by using sequential (item by item) selection techniques and digital computers. Journal of The American Statistical Society, 57: 387-402.
Gentle, J., Perry, C. & Wigton, W. 2006. Modeling nonsampling errors in agricultural surveys. In Proceedings of the JSM Survey Research Methods (pp. 3035-3041).
Horvitz, D.G. & Thompson, D.J. 1952. A generalization of sampling from a finite universe. Journal of The American Statistical Society, 47: 663-685.
Lohr, S. 2009. Sampling: Design and Analysis. 2nd edition. Duxbrury Press: Pacific Grove, CA; US.
McNabb, D. 2014. Nonsampling error in social surveys. Sage: Thousand Oaks, US.
UNSD. 2005. Designing Household Survey Samples: Practical Guidelines, United Nations Publication: New York, US.
114
Chapter 4
Carletto C., Gourlay, S., Murray, S. & Zezza, A. 2015. Welcome to Fantasyland: Comparing approaches to land area measurement in household surveys. Paper prepared for the World Bank Conference on Land and Poverty, 23-27 March 2015. Washington DC. Available at: https://www.conftool.com/landandpoverty2015/index.php/Carletto-523-523_paper.pdf?page=downloadPaper&filename=Carletto-523-523_paper.pdf&form_id=523. Accessed on 27 November 2015.
Gallego, F.J. 2012. The efficiency of sampling very high resolution images for area estimation in the European Union. International Journal of Remote Sensing 33(6): 1868-1880.
Gallego F.J. & Stibig, H.J. 2013. Area estimation from a sample of satellite images: the impact of stratification on the clustering efficiency. Journal of Applied Earth Observation and Geoinformation, 22: 139-146
Keita, N. & Carfagna, E. 2009. Use of Modern Geo-Positioning Devices in Agricultural Censuses and. Surveys: Use of GPS for Crop Area Measurement. Paper prepared for the 57th ISI session, 16-22 August 2009. Durban, South Africa. Available at: https://www.statssa.gov.za/isi2009/ScientificProgramme/IPMS/0617.pdf. Accessed on 27 November 2015.
Taylor, J., Sannier, C., Delincé, J., & Gallego, F.J. 1997. Regional Crop Inventories in Europe Assisted by Remote Sensing: 1988-1993. Synthesis Report. EUR 17319 EN. European Communities publication: Luxembourg. Available at: http://mars.jrc.ec.europa.eu/mars/Bulletins-Publications/Regional-Crop-Inventories-in-Europe-Assisted-by-Remote-Sensing-1988-1993. Accessed on 27 November 2015 [ok?].
Chapter 5
Ambrosio, L. 2014. Identifying the Most Appropriate Sampling Frame for Specific Landscape Types. Paper prepared for the Global Strategy Scientific Advisory Committee. Global Strategy Publication: Rome.
Benedetti, R., Bee, M., Espa, G. & Piersimoni, F. 2010. Agricultural Survey Methods. John Wiley & Sons Inc.: Chichester, UK.
Chin, N. 2014. E-learning guidelines on linking Population and housing Censuses with Agricultural Censuses. Global Strategy Publication: Rome.
FAO. 1996. Multiple Frame Agricultural Surveys: Volume I: Current Surveys based on area and list sampling methods. FAO Statistical Development Series n.7. FAO Publication: Rome.
____ 1996. Conducting Agricultural Censuses and Surveys. FAO Statistical Development Series n. 6. FAO Publication: Rome.
____ 2005. A system of integrated agricultural censuses and surveys. Vol 1, World Programme for the Census of Agriculture 2010. FAO Statistical Development Series n. 11. FAO Publication: Rome.
FAO & UNFPA. 2012. Guidelines for Linking Population and Housing Censuses with Agricultural Censuses: with selected country practices. FAO Publication: Rome.
Ferraz, C. 2015. Linking Area Frames and List Frames in Agricultural Surveys. Global Strategy Technical Report. Global Strategy Publication: Rome.
115
Groves, R.M. 1989. Survey errors and survey costs. John Wiley & Sons Inc.: Hoboken, NJ, US.
Iglesias, L. 2014. Improving the use of GPS, GIS, and RS for setting up a Master Sampling Frame. Paper prepared for the Global Strategy Scientific Advisory Committee. Global Strategy Publication: Rome.
Keita, N. & Gennari, P. 2014. Building a master sampling frame by linking the population and housing census with the agricultural census. Statistical Journal of the United Nations, 30(1): 21-27.
Kish, L. 1989. Sampling Methods for Agricultural Surveys. FAO Statistical Development Series n. 3. FAO Publication: Rome.
Lessler, J.T. & Kalsbeek, W.D. 1992. Nonsampling errors in surveys. John Wiley & Sons Inc.: New York, US.
Maligalig, D. S. & Martinez, A. Jr. 2013. Developing a Master Sample Design for Households Surveys in Developing Countries: A Case Study In Bangladesh. Survey Methods: Insights from the Field. Available at: http://surveyinsights.org/?p=2151. Accessed on 27 November 2015.
Murthy, M.N. 1967. Sampling Theory and Methods. Statistical Publishing Society publication: Calcutta, India.
Särndal, C.-E., Swensson, B & Wretman. J. 1992. Model Assisted Survey Sampling. Springer-Verlag: New York, US.
Stoll, R.R. 1979. Set Theory and Logic. Dover Publications: Mineola, NY, US.
Szameitat, K. & Schäffer, K.-A. 1963. Imperfect Frames in Statistics and the Consequences of Their Use in Sampling. Bulletin of the International Statistical Institute, 40: 517-544.
Turner, A.G. 2003. Sampling frames and master samples. United Nations Publication: New York, US.
UNSD. 1986. National Household Survey Capability Programme: Sampling Frames and Sample Designs for Integrated Household Survey Programmes” United Nations Publication: New York, US.
______ 2005. Household Sample Surveys in Developing and Transition Countries. United Nations Publication: New York
World Bank, FAO & UNSC. 2011. Global Strategy to Improve Agricultural and Rural Statistics. Report Number 56719-GLB, Washington, DC, World Bank.
Chapter 6
Boryan, C.G. & Yang, Z. A new land cover classification based stratification method for area sampling frame construction. In Proceedings. First International Conference on Agro-Geoinformatics, 2-4 August 2012. Shanghai, China. Available at: http://ieeexplore.ieee.org/xpl/articleDetails.jsp?tp=&arnumber=6311727&queryText%3DBoryan. Accessed on 27 November 2015.
Carfagna, E. & Gallego, F.J. 1994. On the optimum size of segments in a two-step survey on area frame: Possible improvements for rapid European estimates. Paper prepared for the Conference on the MARS Project: overview and perspectives. Publication n. 15599. European Communities Publication: Luxembourg.
116
Casley, D.J. & Kumar, K. 1988. The collection, analysis and use of monitoring and evaluation data. Johns Hopkins University Press for the World Bank: Baltimore, MD, US.
Davies, C. 2009. Area frame design for agricultural surveys. RDD Research Report N. RDD-09-xx. USDA-NASS Publication: Washington, DC. http://www.nass.usda.gov/Publications/Methodology_and_Data_Quality/Advanced_Topics/AREA%20FRAME%20DESIGN.pdf
Dancy, K.J., Webster, R., & Abel, N.O.J. 1986. Estimating and mapping grass cover and biomass from low-level photographic sampling. International Journal of Remote Sensing, 7(12): 1679-1704.
Delincé, J. 2015. Cost-Effectiveness of Remote Sensing for Agricultural Statistics in Developing and Transition Countries. Global Strategy Technical Report. Global Strategy Publication: Rome.
_________ 2001. A European approach to area frame survey. In Proceedings of the Conference on Agricultural and Environmental Statistical Applications in Rome (CAESAR), 5-7 June 2001, Rome, Italy. Vol. 2, pp. 463-472. Available at: http://www.ec-gis.org. Accessed on 27 November 2015.
Eiden, G., Vidal, C. & Georgieva, N. 2002. Land Cover/Land Use change detection using point area frame survey data; Application of TERUTI, BANCIK and LUCAS Data. In Building agri-environmental indicators: focussing on the European area frame survey LUCAS. EUR Report 20521 (pp 55-74). European Communities Publication: Luxembourg. Available at: http://agrienv.jrc.it/publications/ECpubs/agri-ind/. Accessed on 27 November 2015.
FAO. 1996. Multiple frame agricultural surveys. FAO Statistical Development Series, n.7. FAO Publication: Rome.
_____ 1998. Multiple frame agricultural surveys, Volume 2: Agricultural survey programmes based on area frame or dual frame sample designs. FAO Statistical Development Series, n. 10. FAO Publication: Rome.
Gallego, F.J. 2004. Remote sensing and land cover area estimation. International Journal of Remote Sensing 25(15): 3019-3047.
Gallego, F.J., Delincé, J. & Carfagna, E. 1994. Two-Stage Area Frame Sampling on Square Segments for Farm Surveys. Survey Methodology 20(2): 107-115.
Gallego, F.J., Feunette, I. & Carfagna, E. 1999. Optimising the size of sampling units in an area frame. In Gómez -Hernández J. et al. (eds), GeoENV II - Geostatistics for Environmental applications (pp. 393-404). Quantitative Geology and Geostatistics Series, vol.10. Kluwer: Dordrecht, The Netherlands.
Gallego, F.J. & Delincé J. 2010. The European Land Use and Cover Area-frame statistical Survey (LUCAS), in Benedetti, R., Bee, M., Espa, G. & Piersimoni, F., Agricultural Survey Methods (pp. 151-168), John Wiley & Sons: Chichester, UK.
Gay, C. & Porchier, J.P. 1998. Land Cover and Land Use Classification using TER-UTI. In Proceedings, Agricultural Statistics 2000, An International Conference on Agricultural Statistics, 18-20 March 1998. Washington, DC. pp. 193-201. Available at: http://www.nass.usda.gov/as2000/proceedings/page-193.pdf. Accessed on 27 November 2015.
González, F., López, S. & Cuevas, J.M. 1991. Comparing Two Methodologies for Crop Area Estimation in Spain Using Landsat TM Images and Ground Gathered Data. Remote sensing of the environment, 35:29-36.

117
Hendricks, W.A., Searls, D.T. & Horvitz, D.G. 1965. A comparison of three rules for associating farms and farmland with sample area segments in agricultural surveys. In Zarkovich, S.S., Estimation of areas in Agricultural Statistics (pp. 191-198), FAO Publication: Rome.
Hristoskova, N. 2003. Bancik: Bulgarian Area Frame Survey. Paper prepared for the Polish Seminar: Information Systems in Agriculture, 9-11 July 2003. Krakow, Poland.
Jacques, P. & Gallego, F.J. 2005. The LUCAS project – The new methodology in the 2005/2006 surveys. Paper prepared for the Workshop on Integrating agriculture and environment: CAP-driven land use scenarios, 26-27 September 2005. Belgirate, Italy. Available at: http://forum.europa.eu.int/irc/dsis/landstat/info/data/index.htm. Accessed on 27 November 2015.
Jolly, G.M. & Watson, R.M. 1979. Aerial sample survey methods in the quantitative assessment of ecological resources. In Cormack, R.M., Patil, G.P. & Robson, D.S. (eds), Sampling Biological Populations (pp. 203-216). International Co-Operative Publishing House: Fairland, US.
Kerdiles, H., Spyratos, S., Gallego, J., & Dong, Q. 2013. Assessing the crop acreage in Mengcheng county on the North China plain using adapted regression estimator method. Paper prepared for the 2nd International Conference on Agro-Geoinformatics: Information for Sustainable Agriculture, Agro-Geoinformatics 2013. http://iopscience.iop.org/1755-1315/17/1/012057 [this links to another article]
MAPA. 2008. Encuesta de Superficies y Rendimientos de Cultivos. Resultados 2008. MAPA Publication: Madrid, Spain. Available at: http://www.mapa.es/estadistica/pags/encuestacultivos/boletin2008.pdf. Accessed on 27 November 2015.
Martino, L. 2003. The Agrit system for short-term estimates in agriculture: A project for 2004. Paper prepared for Polish Seminar: Information Systems in Agriculture, 9-11 July 2003. Krakow, Poland.
Murphy, J., Casley, D.J. & Curry, J.J. 1991. Farmers’ estimations as a source of production data. World Bank Technical Paper 132. World Bank Publication: Washington, DC.
Poate, C.D. 1988. A review of methods for measuring crop production from smallholder producers. Experimental Agriculture, 24: 1-14
Reinecke, K.J., Brown, M.W. & Nassar, J.R. 1992. Evaluation of aerial transects for counting wintering mallards. Journal of Wildlife Management 56(3): 515-525.
Stehman, S.V. 2009. Sampling designs for accuracy assessment of land cover. International Journal of Remote Sensing, 30(20): 5243-5272.
UNSD. 2005. Designing Household Survey Samples: Practical Guidelines. United Nations Publication: New York, US.
Wolter, K.M. 1984. An investigation of some estimators of variance for systematic sampling. Journal of the American Statistical Association, 79(388): 781-790.

118
Chapter 7
Bankier, M.D. 1986. Estimators based on several stratified samples with applications to multiple frame surveys. Journal of the American Statistical Association, 81: 1074-1079.
Ferraz, C. 2015. Linking Area Frames and List Frames in Agricultural Surveys. Global Strategy Technical Report. Global Strategy Publication: Rome.
Ferraz, C. & Coelho, H.F.C. 2007. Ratio estimators for a stratified dual frame design. In Proceedings of the 56th session of the International Statistical Institute, 22-29 August 2007, Lisbon. International Statistical Institute Publication: The Hague, the Netherlands.
Fuller, W.A. & Burmeister, L.F. 1972. Estimators for samples selected from two overlapping frames. In ASA Proceedings of the Social Statistics Section (pp. 245-249). American Statistical Association Publication.
Hartley, H.O. 1962. Multiple frame surveys. In ASA Proceedings of the Social Statistics Section (pp. 203-206). American Statistical Association Publication.
Kalton, G. & Anderson, D.W. 1986. Sampling rare populations. Journal of The Royal Statistical Society, Serises A, 14: 65-82.
Kott, P.S. & Vogel, F. 1995. Multiple Frame Business Surveys. In Cox, B.G., Binder, D.A., Chinnappa, B., Christianson, A. Colledge, M.J. and Kott, P.S. (eds). Business Survey Methods. John Wiley & Sons: New York, US.
Skinner, C.J. & Rao, J.N.K. 1996. Estimation in dual frame surveys with complex designs. Journal of the American Statistical Association, 91: 349-356.
Skinner, C.J. 1991. On the efficiency of raking ratio estimation for multiple frame surveys. Journal of the American Statistical Association, 86: 779-784.
Vogel, F. 1975. Surveys with overlapping frames – problems in applications. In ASA Proceedings of the Social Statistics Section (pp. 694-699).
ANNEX C
Main texts consulted1. BRAZIL
Bolliger, F.P. 2014. PREVS: Brazilian experience on agricultural master sampling framesPaper prepared for the Expert Meeting on Master Sampling Frame, 5-6 November 2014, Rome.
Bolliger, F.P., Soares de Freitas, M.P., de Abreu Antonaci, G. & Borges Cabrat, M.D. 2012. Master Sampling Frames for Agricultural Surveys: Brazil Overview. Paper prepared for the High Level Stakeholders Meeting on the Global Strategy, 3-5 December 2012, Rome.
2. CHINADelincé J. 2015. Cost-Effectiveness of Remote Sensing for Agricultural Statistics in Developing and Emerging Economies. Global Strategy Technical Report. Global Strategy Publication: Rome.

119
Yu X. 2014. Remote Sensing Applications in Agriculture Statistical Surveys at China NBS.Paper prepared for the Expert Meeting on Master Sampling Frame, 5-6 November 2014, Rome.
Vogel F. 1999. Review of China Crop Production Forecasting and Estimation Methodology. Miscellaneous Publication No. 1556, National Agricultural Statistics Service, U.S. Department of Agriculture.
3. ETHIOPIAAbaye, A.T. 2013. Master Sampling Frames for Agricultural and Rural Statistics in Ethiopia. Paper presented at the Sixth International Conference on Agricultural Statistics, 23-25 October 2013. Rio de Janeiro, Brazil.
Abaye A.T. 2014. Building and using master sampling frames, the case of Ethiopia. Paper prepared for the Expert Meeting on Master Sampling Frame, 5-6 November 2014, Rome.
4. EU/MARSGallego, F.J. 1995. Sampling Frames of Square Segments. Report EUR 16317. European Commission Joint Research Centre Publication, Ispra, Italy.
5. EU/LUCASGallego, F.J. 2013. The use of a Point Sample as a Master Frame for Agricultural Statistics. Paper prepared for the Sixth International Conference on Agricultural Statistics, 23-25 October 2013. Rio de Janeiro, Brazil.
6. GUATEMALA Barrientos M. 2014. Building and using Master frame for Agricultural Statistics: Guatemala’s experience. Paper prepared for the Expert Meeting on Master Sampling Frame, 5-6 November 2014, Rome.
7. LESOTHOSephoko, N., Matsoso, L. & Raphoto M. 2013. Master Sampling Frames for Agricultural and Rural Statistics. - Experience of Lesotho. Paper presented at the Sixth International Conference on Agricultural Statistics, 23-25 October 2013. Rio de Janeiro, Brazil.
8. RWANDAManzi, S. 2014. Seasonal Agricultural Surveys in Rwanda (SAS). Paper prepared for the Expert Meeting on Master Sampling Frame, 5-6 November 2014, Rome.
9. USAHoffman, S. 2014. Overview of Sampling Frames within the USA by USDA/NASS. Paper prepared for the Expert Meeting on Master Sampling Frame, 5-6 November 2014, Rome.

120

121
AAnnexUnderstanding variance components in two-stage sampling designsCristiano Ferraz
When computing variances of the estimators, care must be taken to consider the survey sample design. One example of such care required is in the context of multiple-stage sampling schemes. For example, consider a two-stage sampling design, which is often adopted as a probability scheme for cluster component frames. Suppose that Ŷ is the Horvitz-Thompson estimator for a population total based on such a sampling design, with a sample S1 of clusters selected according to a probability design p1 in the first stage, and with a sample Si selected from the first-stage sampled cluster i according to a probability design p2 in the second stage. The variance of Ŷ has two components:
(1)
In this expression, denotes the variance with respect to the two-stage sample design, and its variances and expectations components are taken on the basis of the respective index reference probability designs, such that:• is the expectation with respect to the first-stage probability design p1;• is the variance with respect to the first-stage probability design p1;• represents the conditional expectation with respect to the second-stage probability design p2, given
the first-stage sample S1; and• represents the conditional variance with respect to the second-stage probability design p2, given
the first-stage sample S1.

122
The first variance component, , is due to the first stage of the sampling process, while the second, represents variation due to the second stage. Care must be taken because an unbiased estimator for has the following form:
+
where:
π1i= Prob(cluster i ), and π1ij= Prob(clusters i and j ) are defined according to the first-stage probability sample design p1;
π2k|i= Prob(element k given cluster i ), and π2k|i=Prob(k and l given cluster i ) are given by the second-stage probability sample design p2;
Ŷi is the Horvitz-Thompson estimator for the total of variable y in cluster i; and
.
An unbiased estimator for V1 is given by
,
while an unbiased estimator for V2 is given by
.
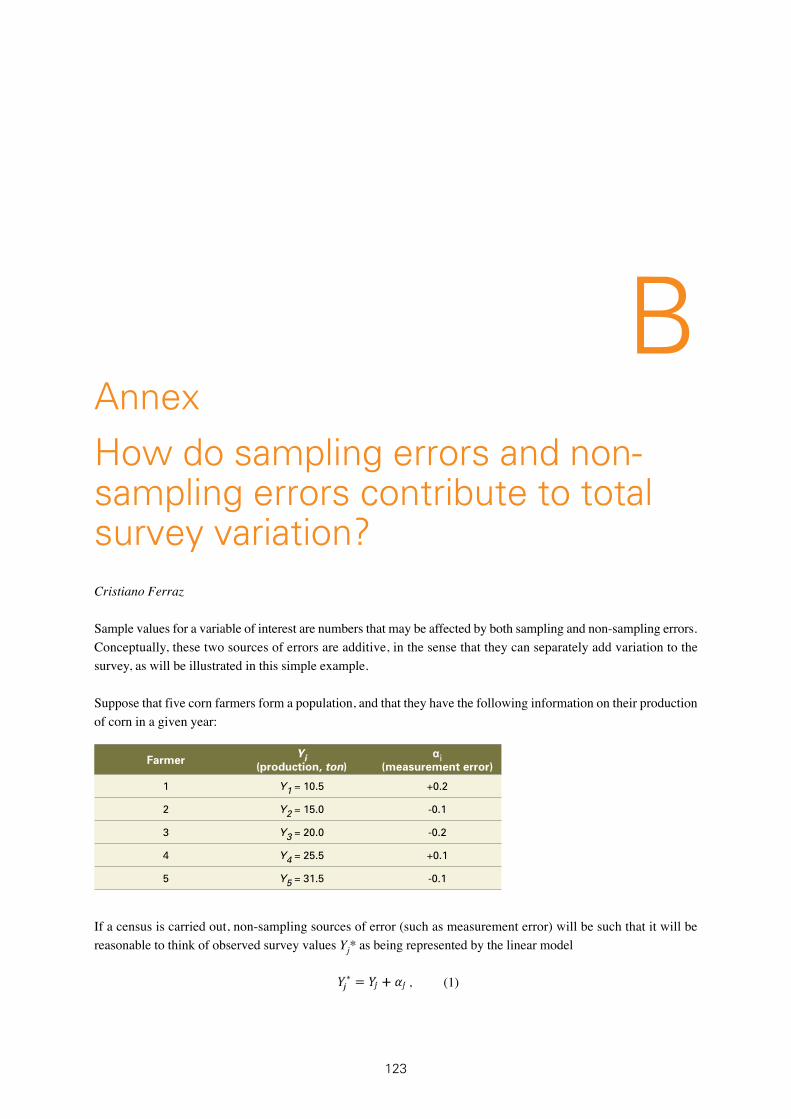
123
BAnnexHow do sampling errors and non-sampling errors contribute to total survey variation?Cristiano Ferraz
Sample values for a variable of interest are numbers that may be affected by both sampling and non-sampling errors. Conceptually, these two sources of errors are additive, in the sense that they can separately add variation to the survey, as will be illustrated in this simple example.
Suppose that five corn farmers form a population, and that they have the following information on their production of corn in a given year:
Farmer Yi (production, ton)
αi(measurement error)
1 Y1 = 10.5 +0.2
2 Y2 = 15.0 -0.1
3 Y3 = 20.0 -0.2
4 Y4 = 25.5 +0.1
5 Y5 = 31.5 -0.1
If a census is carried out, non-sampling sources of error (such as measurement error) will be such that it will be reasonable to think of observed survey values Yj* as being represented by the linear model
, (1)

124
where • Yj is the actual corn production of farmer j, in tons;• αj is a random term due to measurement error, with the assumptions that its expected value is zero and the
variance is .
According to Model 1 above, the variance of the observed survey values is affected by the variance of the measurement error. Therefore, the greater the value of the larger the extra variation introduced into the survey, due to this particular non-sampling source of error. Influences from other types of non-sampling error can also be represented by a model similar to Model 1, with only the statistical properties of the αj random term varying.
Suppose now that a simple random sample of size two is to be selected from this population and that, say, Farmers 2 and 4 were selected. Then, the observed survey productions (subject to measurement error) would be =14.9 and =25.6, respectively.
According to the simple random sample design, these observed sample values can be considered as being generated by the following simple linear model:
(2)
In Model 2, yi represents Farmer i’s observed production of corn in the sample; μ* is the population average production of corn subjected to measurement error, and εi is a random variable related to the sample selection randomization process. If all farmers were in the sample (in that case, a census), the value of μ* would be known to be
.
Usually this is not the case. We want to have an estimate of what is the value of the population average (even with measurement error), observing only a sample of two farmers.
The random variable εi is a random residual term with statistical properties that can be derived because a simple random sampling design was used to draw the sample. In these cases, it is known that εi has a mean of zero and also that
,
and
,
with
.
Note that due to the sampling design, the variance component depends only on the production values Yj, which are free of measurement error and any non-sampling source of error in general.

125
On the other hand, the values that we observe are the survey values subjected to non-sampling errors. Thus, the first and the second values in the sample are:
and
.
In general, Model 2 can be rewritten as
with
Let be the observed sample mean. The sample mean variance is given by
.
In this variance formula, it is clear that represents the extra amount of variance added to the survey due to
measurement error, while represents the effect of variation due to sampling error.
This illustrates how the two types of error (sampling and non-sampling) together affect, additively, the survey variation.

126

127
CAnnexCountry experiencesby Naman Keita and Frederic Vogel
Selected country practices are summarized in the following sections to illustrate the diversity of country situations and national factors that guided the choice of particular options for building sampling frames for agriculture and using it as master sampling frame. The summaries are mainly based on country papers that were prepared by national experts for expert meetings organized within the framework of the Global Strategy or ICAS meetings. A separate and more detailed document on country practices will be published under the Global Strategy on the basis of the papers presented at the Expert Meeting on the Master Sampling Frame held in November 2014.
1. BRAZIL
Use of list frame and area frame to build a Master Sampling Frame.IBGE (Bolliger et al., 2012) has adopted the concept of the MSF for the household survey system, which is based on census EAs. This MSF is being used for the System of Integrated Household Surveys, in which all individual household surveys use the same frame.
IBGE later initiated a National System of Agricultural Establishment Sampling Surveys (Sistema Nacional de Pesquisas por Amostragem de Estabelecimentos Agropecuarios - SNPA in Portuguese) with a view to also develop an MSF for agricultural surveys, using the multiple frame approach by combining census EAs as the area frame and a register of farms. The MSF was designed to be based on the 2006 agricultural census, but also uses information from the 2010 population census. The 2006 agricultural census enumerated 5.2 million agricultural holdings, while the 2010 population census enumerated only 2.6 million. It is plausible that many small holdings were identified as households but not as farm establishments in the population census. To build the area frame, it was decided to map the EAs from the 2006 agricultural census into those used for the 2010 population census. Attempts were also made to develop a list of agricultural establishments, by combining agricultural census records with those from the Central Registry of Enterprises and administrative records provided by employers to the Ministry of Labor and Welfare. This turned out to be difficult; it was not possible to identify a large number of units that were present in more than one register, despite the use of advanced linkage methods.
128
Finally, given the above discrepancies between the 2006 agricultural census data and the 2010 population census data, and the other difficulties mentioned, in 2013 IBGE decided to postpone the implementation of the National System of Agricultural Surveys and wait for the next agricultural census, that was planned for 2016 (Bolliger, 2014). However, the uncertainty regarding the date of the Agricultural Census because of budgetary reasons, led IBGE to study alternative methodologies for building a master sampling frame for implementing SNPA.
One of the alternatives currently under consideration is to use administrative records and build the MSF by developing a list frame. This will restrict the SNPA’s target population to the set of units of the agricultural establishments that are formally registered by the public federal or state administration; this will be possible thanks to the advancements observed in the country’s administrative records. This list will exclude agricultural establishments whose primary function is leisure, housing or livelihood. It will also exclude producers for whom agriculture is a secondary activity, one for which the holders do not deal with the government for funding or technical assistance, nor do they engage in marketing products to the point of seeking to observe the provisions of movement of goods. It is assumed that the impact of excluding those units will be limited since the current scope of the administrative records – in particular, the Pronaf register, which is directed towards family farms and now has almost five million active records.
In this scenario, the SNPA’s sample frame would be a list of rural producers. The Agricultural Sample Frame formed by the union of the main sample frames maintained by the federal and state governments that register agricultural producers, updated periodically, would form a List Frame, focused on SNPA’s ordinary surveys.
This approach is expected to present some advantages, including the possibility of annual updating of the system, independence from the agricultural census, and a low implementation cost. On the other hand, the target population will be more restricted in its scope and coverage. It will not be possible to integrate it with the agricultural census, and the data quality will depend on the quality of external registers, with all the risks relating to the difficulty of accessing these registers as their content changes over time.
Another possibility under consideration is to use the results of the new Project of Land Use and Coverage developed by IBGE’s Geosciences Directorate. The project’s main goal is to monitor the changes in the use and coverage of land for the entire national territory, at regular intervals (every 2 years), from the acquisition and processing of MODIS images. In the Project, six categories and classes of land use and coverage are included, with the information provided through a territorial grid for statistical purposes. The incorporation of land use and coverage data in the territorial grid for statistical purposes makes it possible to obtain area data on the categories of land use and coverage for each square. The use of an area frame with land use and coverage information for stratifying and selecting squares requires the use of mobile devices and GPS to identify the field limits. This option also presents some advantages, including the possibility of defining segments with the same size, selecting segments that are multiples of 1 x 1 km2, and the opportunity for biannual updates independent of census data. Limitations include a lack of visually identifiable boundaries, a greater variability of the number of establishments in each segment, and less detailed information than that provided by the census20.
The use of both alternatives require surveys, studies and field experiments to evaluate their viability and efficiency. At the time of writing, the review is still underway; therefore, the concept of master frame for agriculture is not yet operational in Brazil.
20 The information from images (on the use of land alone) are usually more aggregated, divided into few categories. These may provide only a more general view of the land use. On the other hand, census results can provide much more detailed and specific information on land use, thus enabling a better distinction between different crops, forest plantations and pastures. Furthermore, census information can go beyond land use. An area frame stratification based on census data can take into account activities such as small livestock, and adopt different measures such as production value, sales and others.
129
However, IBGE has experience with building a sampling frame for agriculture. This experience derives essentially from the Harvest Forecasting and Monitoring Survey (PREVS in Portuguese), initiated by IBGE in the mid-1980s and implemented up to 1993 with the financial support of the Banco International por la Reconstruction et lo Desenvolvimento (BIRD) (Bolliger, 2014). The PREVS basically followed the methodology then adopted by NASS/USDA in its June Survey and December Survey. Its main objectives were to provide statistical information on harvests through objective data collection and use of probability sampling methods that allow confidence intervals to be computed for the final results.
The survey followed an area sampling frame design, stratified according to land use and systematically selected in a single stage, with equal probability and with no substitutions.
The area sample frame was constituted by strata of land use, established according to the rate of cultivated land or by the predominance of crops, divided in Counting Units (CUs); these were subdivided in Area Segments, the survey’s sampling unit.
The main material used included (i) Statistical municipal maps generally at a scale of 1:100,000, prepared for census purposes and showing each municipally divided into EAs, (ii) Political maps and Land use maps; (iii) Topographic maps, generally at scales 1:50,000 and 1:100,000, established using information from IBGE’s agricultural census, the Agricultural Production Systematic Survey, Municipal Agricultural Survey, and the Municipal Livestock Survey; (iv) Satellite imagery TM/Landsat-V on paper, at scales 1:100,000 and 1:250,000; (v) Planimetric coordinates, produced at the same scale as the TM/Landsat images, used for visualization and geographical location of the interpreted patterns and (vi) Aerial photographs, covering the selected segments with photo enlargements to 1:10,000 used for the annual field data collection.
The field data collection for each survey round was undertaken by a total of 20 supervisors and 200 enumerators. Common difficulties on conducting the fieldwork were reported, including: problems in locating the selected segments; deficient roads and paths which hindered access in several cases; difficulties in locating respondents; difficulties in determining the existence of the household/headquarters or, alternatively, verifying whether the largest part of the establishment was within the segment, if the producer lived in the city.
This area frame was complemented by a list frame, that consisted of a relatively small number of Special Holdings based on the 1985 agricultural census information and that accounted for a large percentage of the total variable. This was updated every year, making it a multiple frame.
Despite the reported challenges encountered in the field work, this survey was successful, since it produced acceptable results (66 percent of crop estimates had a CV between 15 and 25 percent). However, it was ultimately discontinued. It is interesting to analyse the reasons why this technically sound survey was discontinued. Among these, a shortage of financial resources, personnel and institutional support are mentioned. However, beyond these, key additional factors were the lack of national coverage of the survey, the lack of timeliness in providing results (a crucial factor for forecasting) and the country’s longstanding tradition of agricultural statistics production based on subjective surveys As in many countries, a survey using sound statistical methods was abandoned for the Agricultural Production Systematic Survey, which with much less effort and cost, has been providing for over 40 years monthly estimates of planted area, harvested area, medium yield and production for over 30 products and for all the Federation Units, even with the generation of such quantitative information through subjective surveys being methodologically condemned21. In normal years, when the Harvest Forecasting and Monitoring Survey results were being launched, the estimates from the Systematic survey were already found to be consolidated and agreed between users and producers (Bolliger, 2014).
21 On the theme see Oliveira and Guedes (2013); Keita and Chin (2013); and Galmés, M. (2013).
130
Among the lessons learned are the following:• The population census did not contribute to the development of the master frame.• Despite the use of advanced record linkage methods, the linkage of administrative records with other list frame
records was not satisfactory. This also holds true for the US.• When designing a survey, care should be taken to ensure that the methods used are in line with its objectives.• Building a master frame for agriculture is much more challenging than for household surveys.
In summary, the lessons learnt from Brazil indicate that when selecting a viable option for building an MSF for agriculture, all relevant factors should be considered, including cost and resources, material and information available, institutional support and correspondence between the methods adopted and the survey objectives. This reinforces the need for guidelines on building and using an MSF to take into account factors beyond sampling and frame construction, such as measurement methods, timeliness and resource requirement.

131
2. CHINA
Use of area frame to build a master sampling frame.China (Vogel, 1999) implemented a complete reporting system in the 1950s. The method adopted is described below, because it illustrates an administrative data system. The administrative system for China begins with provinces and autonomous regions. These are further divided into over 2,400 counties; within these counties, a total of 43,000 townships exist. The townships are then divided into 740,000 villages. Each village compiles data on the number of households, the labour force, the crop acres planted, crop yields, and livestock numbers. Each village sends its data to the township level, where village data are aggregated to the township total. These are sent to the county, where township data are aggregated and sent to the provincial level. This step-by-step aggregation requires a considerable amount of time, and the data are subject to manipulation at each stage.
In 1984, a sample survey was implemented to provide more timely and accurate data. A random sample of 857 counties was selected as the PSU. Counties were selected with PPS in terms of their grain production. From these sample counties, approximately 18,000 villages were selected. Within sampled villages, a sample of fields is selected annually and crop-cutting samples are taken. Data from the complete reporting system was used at each stage of sample selection. A sample of villages was also selected for an annual rural household survey.
A permanent survey staff was located to each sample county and administered the surveys conducted in the sample villages, households, and fields. At the time, this method was considered cost-effective as well as more statistically efficient. Steiner (2005) describes how this survey has since been updated.
However, a more recent analysis of the current Chinese agricultural statistics system highlighted certain weaknesses and issues that were considered to negatively affect the accuracy of agricultural production statistics due to the rapid development of China’s economy and society, especially as a new rural construction strategy concerning the transfer of rural land operation rights and agricultural market fluctuations was being implemented (Yu, 2014). The fact that the system is based on sampling surveys for major crop production statistics and on a comprehensive reporting from the administrative system for other crop production statistics (oil seeds, sugarcanes, fruits, vegetables and other crops) raises the issue of how to integrate the results from the sample estimation of overall crop area and major crops area with comprehensive reporting results. Second, there is a rapidly changing panorama of Chinese agriculture, with the growing flux of migration of rural households away from rural areas; in these cases, holdings cannot be easily surveyed – which could lead to estimation bias and poor sample stability. Finally, survey tools for current agricultural surveys are mainly traditional tools, such as compasses and rope. Modern tools for measurement, positioning and data acquisition such as GPS or PDAs are rarely used. The means for information transmission are relatively primitive, consisting mainly of paper and pens. Survey methods do not match survey tasks and the lack of the necessary technical means for effective supervision and management make the results dependent on human factors.
The degree of the impact of these constraints on agricultural statistics, such as those for crop production, is considered to be very high. Therefore, it was determined that the existing survey system must be reformed and innovated. To do so, it was decided to build a new survey framework with mainly area frame surveys, supplemented with satellite/remote sensing measurements, integrated space-air-ground surveys and monitoring methods. The area frame is being developed by the National Bureau of Statistics in ten provinces (three are to be operational in 2015), covering 17 percent of national land area (Delincé, 2015).
To build the sampling frame, the first source of information is the second national agricultural census for 2006, which includes an enumeration of planted crop areas. The scope of these data is aligned with the basic amount of cultivated land registered as farmer’s land contract certificate (although some data are obsolete). Another source is the second national land use survey (maps), which provides geospatial data on the cropland but lacks specific crop
132
information. The third source is remote sensing imagery; this can be processed to obtain more recent agricultural spatial information, such as planting information for the main crops. However, the accuracy of planted area estimates depends on the accuracy of crop classification. Further details on combining information from various sources are given in Delincé, 201522.
The most basic unit of the crop area frame survey is the cultivated land area, which can be observed directly. When selecting a suitable segment size, consideration was given to the sampling variance of different segment sizes, the proportion of non-zero crop area value, survey cost, surveyors’ daily workload, accessibility of segment physical boundaries on the images, etc. Therefore, the selected segment sizes are 2 hectares (approximately 30 mu) for Jiangsu and Hubei provinces and 5 hectares (75 acres) for Jilin, Henan and Liaoning. Multi-stage sampling is used; thus, the frame is also compiled on a stage-by-stage basis.
Within the target population’s spatial area, the administrative boundaries are used to define the village space. The crop planting area measures come mainly from the second national agricultural census, combined with the remote sensing measures and the second national land use maps data for calibration and matching. Finally, the sampling frame of administrative villages as the PSU was compiled. PSUs are selected with PPS, the auxiliary variable being cropping intensity (Delincé, 2015).
Within the spatial area of the sampled PSUs, the cultivated land is split or combined with the natural boundary to create the frame of segments.
A two-stage sampling method was adopted to select samples for the crop planting area. In the first stage, PSUs were stratified and the sample selected, using probabilities proportional to cultivated land. The precision requirements on major crops (total planting area of crops, grain planting area, major grain crops planting area) are expected to to have Coefficients of Variation (CVs) within 5 percent. With this limit, the sample size was determined by trade-off between workload, cost and accuracy. In the second stage, within the sample village, sample segments were selected by simple random sampling. In particular, within the villages, the list of all cultivated land segments was created and ordered. The random number table was used to generate random numbers and five segments were selected as the sample. The process results in a stratified two-stage sampling design with PPS selection at the first stage and simple random section with equal probability at the second stage (Delincé, 2015).
An MSF based on multiple frame sampling may be envisaged with an intensive use of satellite or RS imagery.
22 Delincé (2015) indicates that ArcGIS and Exelis Visual Information Solution (ENVI) are used to merge administrative limits of villages and land use maps within GIS tools; then, remote sensing imagery is used to update the land use maps by photo-interpretation and automatic classification. Stratification is carried out at village level to identify the PSUs, using the total crop area at village level classified by remote sensing.

133
3. ETHIOPIAEthiopia (Abaye 2013, 2014) has two interesting experiences in building master frames.
Use of list frame to build a Master Sampling Frame. Ethiopia has extensive experience with collecting data through an annual agricultural survey based on a sample of PSUs (census EAs), from which households are listed and selected. A listing questionnaire was used at the beginning of the census to collect data for use in developing the master frame. The PSUs sampled are also used for household income and consumption surveys. The survey integration reduces the cost and enables data to be linked for in-depth analysis.
One frame is the list of EAs with the number of households compiled directly from the census. In addition, a commercial frame of large-scale farms is compiled and updated every year. Together, these form the MSF. Thus, multiple frame sampling is used. The PSUs were selected by PPS, the size being the number of households in the PSU. Then, households will be listed in the sampled PSU at the beginning of the survey and sample households will be selected.
Among the lessons learned:• The list frame approach facilitates integration between different household surveys.• Data collection can be time-consuming, as households are distributed across the PSU. • Some holdings may be missed and not all parcels associated with a holding may be identifiable.• It is difficult to update the master frame due to boundary changes in administrative areas such as districts; a more
simplified method to update the frame must be developed
The list frame facilitates integration between different household surveys, adequately collects socioeconomic data, and provides a well-distributed sample. This method does not require imagery. The list frame system is well-established, because it has been used for several years. The difficulty with list frames is that the data collection is time-consuming, as the households are distributed in the EA. Some holdings may be missed, as their holding may be dispersed. This makes supervision difficult. The difficulty of updating the master frame due to frequent administrative boundary changes also poses a challenge.
Use of area frame to build a Master Sampling FrameEthiopia has also conducted pilot studies on area frame development. In the area frame approach, EAs are used as the PSU and segments of 40 hectares in size are used as SSUs. Two main inputs are used to develop the area frame: (i) enumeration area maps and (ii) land cover maps.
The first step was to use enumeration area maps and a land cover map to develop the frame. The census EAs were geo-referenced. Then, satellite imagery was used to produce a land cover database. The Central Statistical Agency (CSA) of Ethiopia used Spot-5 satellite imagery, ARC GIS and MADCAT software for land cover classification. The digitized EA maps were overlaid on the land cover map; this became the area frame. PSUs (EAs) were classified into strata based on crop intensity. A sample of PSUs was selected; within each, segments of 40 hectares in size were used as SSUs. The closed segment approach was used – all fields within the segment were listed and a questionnaire obtained for each. Commercial farms were treated separately; thus, multiple frame sampling was used.
Some of the advantages of the area frame survey include the completeness of its coverage, savings in terms of time (as the holdings are close to each other), the possibility of cross-checking data with the segment’s total area. The area frame approach also facilitates supervision. On the other hand, identifying the field’s owner may require some time. In addition, for area frame development, satellite imagery and land cover classification are necessary, and these require a large budget. All aspects of the method should be examined carefully, as the area frame system is
134
not yet well-established. In the area frame approach, selecting the appropriate approach for area, production and other socioeconomic surveys should also be considered in depth.
Collecting socioeconomic data – including on livestock and integration with other socioeconomic surveys that use list frames – is one of the major issues to consider in area frame applications. The nomadic areas for including livestock pose an additional issue that must be examined.
The estimates at regional level for area frames and list frames showed that estimates for major crops (except sorghum, coffee and chat) compare reasonably well between area frame and list frame estimates. In comparing CVs for area frames and list frames at regional level, it was found that CVs are higher for area frames, with stratum 4 contributing more towards CVs.
The CSA will conduct the fourth population and housing census in 2017, and it is planned to use GPS-enabled PDAs for the cartographic work. This will automatically provide the CSA with electronic copies of the EA maps, and will also enable GPS readings for each household. This method is expected to facilitate the building of the MSF.
Some lessons learned are:• The stratum for crop intensity of less than 25 percent contributes to large sampling errors. This may require
further stratification of the stratum or may require some rare crops to be handled specially.• Holdings are clustered; this saves data collection time, except where it is difficult to identify the owner of the
fields.• Satellite imagery and land cover classification are expensive.
In summary, it was shown that an area frame can be constructed using population/agricultural census information, by geo-referencing EAs and overlaying them on a land cover database, produced from satellite information. It was also shown that large commercial farms are best handled by creating a special frame and using multiple frame methods for estimation.

135
4. EU MARS PROJECT
Use of square segments to build an area frame for agricultural surveys.The EU’s MARS project was launched in the late 1980s, with two major activities on crop area estimation. The Project’s “rapid estimates of crop area changes” (called Activity B or Action 4) constituted an attempt to produce crop area estimates based on classified satellite images without a ground survey in the current year. The system was based on a sample of 60 sites of 40 km × 40 km. An assessment of the method (JRC, 1994) indicated that the margin for subjectivity could be of the order of ±10 percent to ±30 percent for major crops. The contribution of satellite images to the final results was debatable and the system was abandoned in 1997 (Gallego, 2006).
The other activity, named “Regional crop inventories” (Taylor et al., 1997) borrowed the USDA-NASS scheme: the area frame ground survey was the main variable and classified images the covariable. The main difference with the NASS method was the use of area frames of square segments instead of the USDA segments with identifiable physical boundaries (Gallego, 1995). Gallego also describes estimating methods, stratification of the area frame with remote sensing, expected precision and several data collection issues. Some of the conclusions drawn were:• Area frames of square segments were much cheaper to implement than area frames with physical boundaries,
and gave similar accuracy levels. Thus, they were better adapted to complex agricultural landscapes. Further work showed that location errors do not introduce any bias in the final results if the errors are independent of the land cover type.
• Point sampling is a feasible way to build frames for farm sampling.• Area frames provide poor results for livestock, especially if these are not widely distributed across the population;
this would suggest that list frames should also be used.• If a grid of points is sampled within the segment, the computation is easier because the field boundaries need
not be digitized; in addition, the level of accuracy is similar.
The MARS Project also developed a system of crop yield forecasting that has led to an operational series of agrometeorological bulletins (see http://mars.jrc.ec.europa.eu/mars/Bulletins-Publications).
136
5. EUROSTAT LAND USE AND COVER SURVEY (LUCAS)
Use of point frame to build an area frame for agricultural surveysGallego (2013) describes the Eurostat LUCAS survey and its use for sampling farms through points. The two phases of the sampling procedure are:• Selecting a systematic grid of points. The points are photo-interpreted with aerial photos or satellite imagery
for stratification purposes.• Points are subsampled in the second stage, using sampling rates by stratum that are tuned to the survey’s main
objectives.
Estimators and their variances are provided.
Area frame surveys are suited to crop area estimation, especially when direct observation can be used if farmer reporting is not accurate. A main purpose of the paper was to explore the use of the point sample to sample farms for information on variables such as fertilizer use, cropping intentions, and socioeconomic information that cannot be observed. The sampling rules to connect a farm to a field or point were described, as were the estimators. Basically, if a point of the sample falls on utilized agricultural area, the farmer managing that field is located and is asked to provide global data for the farm. No field-specific data are provided.
The systematic nature of the sampling method means that there is no unbiased estimator of variance, which suggests that additional work in this area is necessary. However, the method does provide a viable method for sampling farms with the major limitation of covering farms with livestock but that do not have agricultural land.
The paper also explores the use of data obtained by observation “along the road”, where it is difficult to obtain reported data. The approach is based on an estimation of cropland based on photo interpretation, and on estimation of the proportion of a given crop compared with total agricultural land. An analysis compared the results for points near roads with distant points. The results suggest that this could be a low-cost alternative to estimating crop areas in situations that are difficult to survey.

137
6. GUATEMALA
Building an area sampling frame for agricultural surveysIn 2003, the National Institute of Statistics of Guatemala conducted the Fourth National Farming Census. A System of Continuous Farming Statistics was designed, starting from the construction of an Area Sampling Frame (Barrientos, 2014). The area frame was built using satellite images and aerial photographs. This frame was combined with the list of big farms identified by the census, to make it a multiple frame survey. The sample design was stratified two-stage sampling, with PSUs selected in the first stage and a sample of segments selected within the PSU in the second stage. This frame was used during the 2005, 2006, 2007 and 2008 surveys.
In 2013, a survey was designed to obtain accurate national estimates for priority crops in the period from May to December of that same year (area, yield and production). The survey was to cover all area used for agricultural production or that had the potential to be used for that purpose. The non-agricultural categories excluded were urban centres; educational, recreational and military facilities; jails; industrial estates; airports; shores; cemeteries; water sources, wetlands with forest and other vegetation, swamps, arid and mining areas, beaches, volcanic cones, national parks and protected areas.
The 2013 survey was conducted using an area frame that was built in the following main steps:• Using the ARC-GIS 9.3, the whole national territory was divided into squares of 100 hectares, generating
110,128 segments. • Based on the 2010 land cover and land use map, the percentage of the area with agricultural use (including
pastures) was determined within each segment and was stratified according to the percentage of the agricultural area within each square. Four strata were defined.
• A sample of 1,500 segments was selected and distributed to the strata according to Neyman’s criteria (Cochran, 1977).
A map by department23 with the location of the sample segments identified was prepared. For each segment, two images were edited with the ARC-GIS: one with the localization at scale 1:40,000 and another with an ortho-photographic background for a location and identification to guide field work. The field staff went to the selected segments using GPS to locate them; then, they updated the land use within each segment, drawing the polygons of each field on the aerial photograph and classifying them according to use codes using the corresponding questionnaire. For this phase, 60 enumerators, 15 supervisors and 4 instructors worked for two months.
The problems reported include: the lack of trained and permanent personnel; bad conditions of access roads during the raining season (which sometimes prevented access to certain segments); reluctance of the population in some segments; lack of equipment (mainly GPSs and vehicles); communication difficulties; different dates of cultivation according to agro-ecological zones, that could not be captured in only one visit.
23 The country is politically and administratively divided into 22 departments, each of which subdivides into municipios or municipalities.

138
7. LESOTHO
Use of list frame to build a Master Sampling FrameThe experience of Lesotho is described in Sephoko (2013). The Bureau of Statistics conducts annual agricultural production surveys and a sample census every 10 years. Data are collected for both rural and urban domains. Most of the agriculture in Lesotho is subsistence, with minimal commercial farming.
Lesotho has integrated non-agricultural and agricultural surveys that share the same MSF. The MSF becomes the basis for the sample selection for all surveys conducted by the Bureau of Statistics. The current MSF was constructed from the 2006 census of Population and Housing. Census EAs or groups of EAs were the PSUs for the first stage of sampling. The EAs are well-defined and cover the country’s total area, with no duplication or overlapping of units; hence, complete coverage is ensured. All PSUs and EAs are geo-referenced. The PSUs are stratified by major district and urban/rural.
PSUs are selected with probability proportionate to numbers of households. All households in the PSUs selected are listed and classified as urban or rural, and with categories such as “operating at least one field” or “presence of livestock”. One finding is that household characteristics change over time, which means that the PSU listings must be updated every two-three years.
The annual agricultural survey also provides estimations of crop yields; a maximum of fifteen fields under each principal crop are selected, with equal probability for each crop.
The selected PSUs are also subsampled for the Continuous Multi-Purpose Household Survey, which is conducted in parallel with the annual agricultural survey and with the same demographic information collected from both surveys.
The annual agricultural survey provides estimates of crop yields after harvest. However, there is a need for early season forecasts. These crop forecasts are compiled by the Division of Agriculture and Food Security by the end of May each year, using subjective methods. Efforts are under way to implement an area frame to improve area estimates under each crop and forecast yield.
In summary, the Lesotho master frame developed using census EAs could become an area frame if the geo-referenced PSUs were overlaid onto a land cover map database.

139
8. RWANDARwanda has conducted the Seasonal Agricultural Surveys (SAS) Programme based on probability sampling and estimation methods since 2013. The agricultural surveys implemented are based on Multiple Frame agricultural Surveys (MFS) that consist of an area sample survey combined with data from a list of special farms. The MFS takes into account the country’s relative advantages and the constraints (mainly in terms of permanent specialized staff, training and resources).
Rwanda had a wealth of sound materials which could serve as the basis to establish the SAS Programme, including excellent cartography material – in particular, two sets of digital cartography (ortho-photos with a resolution of 2 m and ortho-photos with a resolution of 25 cm) that would allow for the measurement of areas on the photos. Also, the availability of computer programs and instruments such as GISs, PDAs and GPS, satellite imagery, and powerful software for data entry, processing, analysis and dissemination provided valuable inputs. Another characteristic of Rwanda was the country’s relatively small total agricultural area.
The multiple frame sampling methods applied combined a sample of segments, selected from an area frame, with a complementary short list of special farms. The multiple frame estimates combine estimates from the area sample with estimates obtained from the list of special farms.
The area sample design consisted of a stratified probability sample of segments, with a replicated selection procedure. From the improved stratification, the total land of Rwanda was subdivided into 12 non-overlapping strata.
Among the 12 strata, only five were sampled, covering 17,596.20 km2; the other strata did not contain information that was relevant to the survey program. 84 percent of the intensive agriculture is found in the first and second strata. These are key strata for the purposes of area frame construction and sample selection.
The strata, PSUs, zones, and sample segments have identifiable physical boundaries (roads, paths, rivers, etc.) that can be located both in the field and on the cartographic materials used for their identification. For 2014, Seasons A, B, and C, the PSUs were delineated to have a total size between 100 and 200 hectares.
The sample design has segments of equal target size in each stratum. As a result of experience in data collection, it was concluded that segments of approximately 10 hectares in the sampling universe should be delineated (originally, segments of 20 hectares were constructed). This was done to reduce the size of the cluster in the survey design. However, for the Rangelands, due to the lack of physical boundaries for small areas, the segments selected are of 50 hectares.
The number of sample segments is determined by a large number of factors, e.g. the resources available, the precision of data required and the enumerator’s workload, and the required frequency of data collection. Five field data collection operations must be conducted for each agricultural year, to cover area and the yield of three seasons. Therefore, in view of the experience gained, it has been also concluded that the largest possible sample size should be less than 600 segments. Based on previous work, the total sample size was determined to be n = 540 segments.
The complementary list of special farms ensures the inclusion of farms that make a significant contribution to the total estimate of certain important survey variables.
The special farms were defined as follows: growing crops on at least 10 hectares of land or any farmer raising 70 or more cattle, 350 goats and sheep, 140 pigs, 1,500 chicken or managing 50 beehives. The list of special farms is updated once a year and the updated list used for Season A. Then a total of 499 special farms was considered for the Phase 1 survey for survey season A; of these, only 20 had intersections with sample segments. The special farms are

140
treated separately in the survey design, because the data from listed farms is at the farm level, while the data from the farms selected in area frame segments is for the farm tract (land within the segment).
The multiple frame methods are considered to result in greater precision of the estimates of agricultural areas, main crop areas and other key variables of all multiple-purpose agricultural surveys, since the area sample component involves a practical procedure for the objective measurement of agricultural areas on the GIS. In addition, the area sample component may provide the means for selecting probability samples of fields necessary for the yield surveys that provide objective crop production and crop forecasting estimates.

141
9. THE UNITED STATES
Use of area frame for agricultural surveysTwo USDA agencies have developed sampling frames for agriculture; in particular, the Natural Resource Conservation Service (NRCS) and the National Agricultural Statistics Service (NASS) have each developed area sampling frames. The NASS also has a list sampling frame, which is used in the multiple frame context.
Nusser and Goebel (1997) and Goebel (1998) describe the area frame design developed by the NRCS for the National Resources Inventory Survey (NRI). The results of these surveys are found in USDA (2013), which shows the extensive use of the survey results. The universe for the sample design consists of the surface area of the US. The NRI sample was selected using a stratified, two-stage, area sampling scheme. The two-stage sampling units are nominally square segments of land, and points within the segments. The segments are typically 160 acres in size. The first survey was conducted in 1977, with a sample of 300,000 sample segments and 800,000 sample points. The survey was conducted at five-year intervals, from 1977 through 1997. Starting in 2000, an annual approach was implemented. Each year, a subset of approximately 71,000 segments from the 1997 sample is selected for observation. Fuller and Breidt (1998) describe the selection of the subset using a supplemental panel rotation design, which means that a core panel of approximately 40,000 segments is observed each year, along with a different supplemental or rotation panel selected each year. Starting in 2000, special high-resolution imagery was acquired for each NRI sample site selected for that year’s annual sample. A special feature of the NRI is its true longitudinal nature.
Davis (2009) describes the methods for developing and sampling from an area frame established by the NASS. The NASS area frame covers all land in the US. The land is stratified by land characteristics. Segments of approximately equal size and identifiable boundaries are delineated within each stratum and designated on aerial photographs. A probability sample of segments is selected within each stratum. The main survey using this frame is conducted in June each year and obtains data on crop areas and livestock inventories. The data collection effort involves drawing off the detailed boundaries of every field in each sample segment. In major producing areas, subsamples of corn, soybean, cotton and wheat fields are selected for objective measurement surveys for yield forecasts. The cropland and land use boundaries drawn on the photos are digitized and used as “ground truth” for the crop land data layers prepared using remote sensing data. The area frame is used to measure the incompleteness of the list frames that are also used by NASS.
The use of segments with identifiable boundaries affects all stages of frame development and sample selection. Satellite imagery and other topographic mapping materials are used to determine the stratum and PSU boundaries. The most permanent boundaries, such as paved roads, railroads, canals, rivers, etc are used. The area frames are expected to remain in use for 15-20 years and represent a major investment.
Agricultural production in the US is highly diverse. Major crops such as corn are widely produced, but most fruits and vegetables are produced mainly on a small number of farms. While there are over 2 million farms in the US, only about 100,000 farms account for almost three-quarters of the market value of products sold. About a million farms have cattle, but only 10,000 account for over one-third of the total inventory. The dilemma is that the area frame provides unbiased estimates with reasonable sampling variability at the US level for major crop and livestock items; the sample sizes would have to be unreasonably large to provide state estimates.
For this reason, NASS has developed a list frame with an emphasis on including large farms, farms that produce rare items, and knowledge of the farms characteristics that are used for stratification or other sampling methods. For the five-year census of agriculture, NASS attempts to build a list that is as complete as possible. It then uses the area frame to account for farms that are not on the list frame. Despite an exhaustive effort to make the list as complete as possible for the census, the coverage adjustment from the area frame showed that over 30 percent of
142
the small farms were missing and, overall, 16 percent of the farms were not on the list frame. For that reason, any surveys making use of the list frame depend on the area frame using multiple frame sampling to estimate for incompleteness of the list frame.
One of the first nationwide applications of multiple frame sampling was a national survey of farm operators that was based on a two-stage multiple frame sample design. (Vogel, 1975). The first stage of sampling was the selection of counties or groups of counties. A total of 329 PSUs consisting of 397 counties was selected, with probabilities proportionate to value of sales from a previous agricultural census. The second stage of sampling was the selection of farms within each sample PSU. Two frames were used for each PSU; one was a sample of segments from the master sample of agriculture. A list frame of commercial farms was also prepared for each sample PSU.
The use of a two-stage sample increased the complexity of defining the reporting unit in the survey process, because each farm must be uniquely assigned to only one PSU.
The following are the main lessons learned from the US’s experiences:• There is no such thing as a complete list, regardless of the amount of money available for the effort. The goal
should be to account for large farms and for those producing rare items.• The construction of area frames with identifiable segment boundaries is labour-intensive and requires a mixture
of satellite imagery and topographic maps.• Point sampling provides efficient estimates and is a powerful tool for longitudinal surveys.• One of the problems created by the use of a list frame is that the frame represents how the farm was defined for
a previous point in time. Many times, the selected name as a reporting unit is difficult to associate with a current reporting unit, increasing the difficulty of determining the overlap between sample frames.
• While multiple frame sampling can be statistically efficient, the results are subject to measurement errors.

143
10. SUMMARY OF COUNTRY EXPERIENCES. The country experiences discussed above consider countries that range from among the largest in the world to several small countries. All of these differ in terms of their agricultural and economic structures. A common element in their efforts to develop sampling frames for agriculture is that most countries make use of both area and list frames in a multiple frame context. Their experiences and lessons learned were a valuable input to the chapters of this Handbook that discussed developing a master sampling frame for agriculture.

www.gsars.org


