196
with special applications for low- and middle-income countries Handbook on Monitoring and Evaluation of Human Resources for Health

with special applications for
low- and middle-income countries
Handbook on Monitoring and Evaluation of Human Resources for Health


Handbook on Monitoring and Evaluation of Human Resources for Health
with special applications for low- and middle-income countries
Edited by Mario R Dal Poz, Neeru Gupta,
Estelle Quain and Agnes LB Soucat

WHO Library Cataloguing-in-Publication Data
Handbook on monitoring and evaluation of human resources for health: with special applications for low- and
middle-income countries / edited by Mario R Dal Poz … [et al].
1.Health manpower. 2.Health personnel – administration and organization. 3.Health personnel – statistics and
numerical data. 4.Personnel management. 5.Qualitative analysis. 6.Developing countries. I.Dal Poz, Mario R
II.Gupta, Neeru. III.Quain, Estelle IV.Soucat, Agnes LB V.World Health Organization. VI.World Bank. VII.United
States. Agency for International Development.
ISBN 978 92 4 154770 3 (NLM classification: W 76)
© World Health Organization 2009
All rights reserved. Publications of the World Health Organization can be obtained from WHO Press, World
Health Organization, 20 Avenue Appia, 1211 Geneva 27, Switzerland (tel.: +41 22 791 3264; fax: +41 22 791
4857; e-mail: [email protected]). Requests for permission to reproduce or translate WHO publications –
whether for sale or for noncommercial distribution – should be addressed to WHO Press, at the above address
(fax: +41 22 791 4806; e-mail: [email protected]).
The designations employed and the presentation of the material in this publication do not imply the expression
of any opinion whatsoever on the part of the World Health Organization, World Bank or United States Agency
for International Development concerning the legal status of any country, territory, city or area or of its authori-
ties, or concerning the delimitation of its frontiers or boundaries. Dotted lines on maps represent approximate
border lines for which there may not yet be full agreement.
The mention of specific companies or of certain manufacturers’ products does not imply that they are endorsed
or recommended by the World Health Organization, World Bank or United States Agency for International
Development in preference to others of a similar nature that are not mentioned. Errors and omissions excepted,
the names of proprietary products are distinguished by initial capital letters.
All reasonable precautions have been taken by the World Health Organization, World Bank and United States
Agency for International Development to verify the information contained in this publication. However, the pub-
lished material is being distributed without warranty of any kind, either expressed or implied. The responsibility
for the interpretation and use of the material lies with the reader. In no event shall the World Health Organization,
World Bank or United States Agency for International Development be liable for damages arising from its use.
The named authors of each chapter alone are responsible for the views expressed in this publication.
Photos: Front cover, left; back cover; pages 23 and 157: Curt Carnemark, World Bank. Front cover, center;
and page 1: Ray Witlin, World Bank. Front cover, right; and page 61: Tran Thi Hoa, World Bank.
Printed in India
Editing, design and indexing by Inís Communication: www.inis.ie
Contents
iii
Contents
List of tables, figures and boxes . . . . . . . . . . . . . . . . . . . . . . . . . . . . . . . . . . . . . . . . .vi
Preface . . . . . . . . . . . . . . . . . . . . . . . . . . . . . . . . . . . . . . . . . . . . . . . . . . . . . . . x
Acknowledgements . . . . . . . . . . . . . . . . . . . . . . . . . . . . . . . . . . . . . . . . . . . . . . . .xi
List of contributors . . . . . . . . . . . . . . . . . . . . . . . . . . . . . . . . . . . . . . . . . . . . . . . . xii
Acronyms and abbreviations . . . . . . . . . . . . . . . . . . . . . . . . . . . . . . . . . . . . . . . . . . xiii
Part I: OVERVIEW . . . . . . . . . . . . . . . . . . . . . . . . . . . . . . . . . . . . . . . . . . . . . . . . 1
1 Monitoring and evaluation of human resources for health: challenges and opportunities . . . . . . . 3
1.1 Introduction . . . . . . . . . . . . . . . . . . . . . . . . . . . . . . . . . . . . . . . . . . . . . . 3
1.2 Global initiatives on HRH and information systems . . . . . . . . . . . . . . . . . . . . . . . . . . 3
1.3 Key issues and challenges . . . . . . . . . . . . . . . . . . . . . . . . . . . . . . . . . . . . . . 7
1.4 Framework for health workforce monitoring: the working lifespan approach . . . . . . . . . . . . . 8
1.5 Road map . . . . . . . . . . . . . . . . . . . . . . . . . . . . . . . . . . . . . . . . . . . . . . . 9
1.6 Further information and comments . . . . . . . . . . . . . . . . . . . . . . . . . . . . . . . . . 11
References. . . . . . . . . . . . . . . . . . . . . . . . . . . . . . . . . . . . . . . . . . . . . . . . 12
2 Boundaries of the health workforce: definition and classifications of health workers. . . . . . . . . 13
2.1 Introduction . . . . . . . . . . . . . . . . . . . . . . . . . . . . . . . . . . . . . . . . . . . . . 13
2.2 Who are health workers? . . . . . . . . . . . . . . . . . . . . . . . . . . . . . . . . . . . . . . 13
2.3 Health workforce classification . . . . . . . . . . . . . . . . . . . . . . . . . . . . . . . . . . . 14
2.4 Summary and conclusions . . . . . . . . . . . . . . . . . . . . . . . . . . . . . . . . . . . . . 21
References. . . . . . . . . . . . . . . . . . . . . . . . . . . . . . . . . . . . . . . . . . . . . . . . 22
Part II: MONITORING THE STAGES OF THE WORKING LIFESPAN. . . . . . . . . . . . . . . . . 23
3 Monitoring the active health workforce: indicators, data sources and illustrative analysis . . . . . . 25
3.1 Introduction . . . . . . . . . . . . . . . . . . . . . . . . . . . . . . . . . . . . . . . . . . . . . 25
3.2 Core indicators for HRH analysis: what needs to be monitored? . . . . . . . . . . . . . . . . . . 26
3.3 Overview of potential data sources . . . . . . . . . . . . . . . . . . . . . . . . . . . . . . . . . 27
3.4 Illustrative analysis . . . . . . . . . . . . . . . . . . . . . . . . . . . . . . . . . . . . . . . . . 31
3.5 Putting it all together: governance and use of HRH information sources. . . . . . . . . . . . . . 33
3.6 Summary and conclusions . . . . . . . . . . . . . . . . . . . . . . . . . . . . . . . . . . . . . 34
References. . . . . . . . . . . . . . . . . . . . . . . . . . . . . . . . . . . . . . . . . . . . . . . . 36

Handbook on monitoring and evaluation of human resources for health
iv
4 Framework and measurement issues for monitoring entry into the health workforce . . . . . . . . . 37
4.1 Introduction . . . . . . . . . . . . . . . . . . . . . . . . . . . . . . . . . . . . . . . . . . . . . 37
4.2 Framework for monitoring entry . . . . . . . . . . . . . . . . . . . . . . . . . . . . . . . . . . . 38
4.3 Measurement issues . . . . . . . . . . . . . . . . . . . . . . . . . . . . . . . . . . . . . . . . 42
4.4 Summary and conclusions . . . . . . . . . . . . . . . . . . . . . . . . . . . . . . . . . . . . . 47
References. . . . . . . . . . . . . . . . . . . . . . . . . . . . . . . . . . . . . . . . . . . . . . . . 47
5 Monitoring health workforce transitions and exits . . . . . . . . . . . . . . . . . . . . . . . . . . . . 49
5.1 Introduction . . . . . . . . . . . . . . . . . . . . . . . . . . . . . . . . . . . . . . . . . . . . . 49
5.2 Transitions within and exits from the health workforce: a framework for analysis. . . . . . . . . . 49
5.3 Indicators and measurement strategies . . . . . . . . . . . . . . . . . . . . . . . . . . . . . . 51
5.4 Illustrative analyses . . . . . . . . . . . . . . . . . . . . . . . . . . . . . . . . . . . . . . . . . 53
5.5 Concluding remarks: implications for policy and planning . . . . . . . . . . . . . . . . . . . . . 57
References. . . . . . . . . . . . . . . . . . . . . . . . . . . . . . . . . . . . . . . . . . . . . . . . 58
Part III: MEASUREMENT STRATEGIES AND CASE STUDIES . . . . . . . . . . . . . . . . . . . . 61
6 Measuring expenditure on the health workforce: concepts, data sources and methods . . . . . . . 63
6.1 Introduction . . . . . . . . . . . . . . . . . . . . . . . . . . . . . . . . . . . . . . . . . . . . . 63
6.2 What should be measured . . . . . . . . . . . . . . . . . . . . . . . . . . . . . . . . . . . . . 64
6.3 Approaches to measuring HRH expenditure . . . . . . . . . . . . . . . . . . . . . . . . . . . . 65
6.4 Measurement frameworks and applications . . . . . . . . . . . . . . . . . . . . . . . . . . . . 71
6.5 Summary, conclusions and further developments . . . . . . . . . . . . . . . . . . . . . . . . . 76
References. . . . . . . . . . . . . . . . . . . . . . . . . . . . . . . . . . . . . . . . . . . . . . . . 77
7 Use of facility-based assessments in health workforce analysis . . . . . . . . . . . . . . . . . . . . 79
7.1 Introduction . . . . . . . . . . . . . . . . . . . . . . . . . . . . . . . . . . . . . . . . . . . . . 79
7.2 How facility-based assessments can be used for health workforce monitoring . . . . . . . . . . 80
7.3 Overview of key HFA methodologies . . . . . . . . . . . . . . . . . . . . . . . . . . . . . . . . 81
7.4 Some limitations of HFA methodologies for HRH data . . . . . . . . . . . . . . . . . . . . . . . 85
7.5 Empirical examples based on HFA data . . . . . . . . . . . . . . . . . . . . . . . . . . . . . . 86
7.6 Summary and conclusions . . . . . . . . . . . . . . . . . . . . . . . . . . . . . . . . . . . . . 98
References. . . . . . . . . . . . . . . . . . . . . . . . . . . . . . . . . . . . . . . . . . . . . . . 100
8 Use of population census data for gender analysis of the health workforce . . . . . . . . . . . . . 103
8.1 Introduction . . . . . . . . . . . . . . . . . . . . . . . . . . . . . . . . . . . . . . . . . . . . 103
8.2 Importance of gender considerations in health workforce analysis . . . . . . . . . . . . . . . 103
8.3 Using census data for health workforce analysis . . . . . . . . . . . . . . . . . . . . . . . . . 104
8.4 Empirical analysis . . . . . . . . . . . . . . . . . . . . . . . . . . . . . . . . . . . . . . . . . 106
8.5 Summary and conclusions . . . . . . . . . . . . . . . . . . . . . . . . . . . . . . . . . . . . .110
References. . . . . . . . . . . . . . . . . . . . . . . . . . . . . . . . . . . . . . . . . . . . . . . .111

Contents
v
9 Use of administrative data sources for health workforce analysis: multicountry experience in
implementation of human resources information systems. . . . . . . . . . . . . . . . . . . . . . . .113
9.1 Introduction . . . . . . . . . . . . . . . . . . . . . . . . . . . . . . . . . . . . . . . . . . . . .113
9.2 Recommended first steps to develop a human resources information system. . . . . . . . . . .114
9.3 Country case studies . . . . . . . . . . . . . . . . . . . . . . . . . . . . . . . . . . . . . . . .119
9.4 Summary and conclusions . . . . . . . . . . . . . . . . . . . . . . . . . . . . . . . . . . . . 125
References. . . . . . . . . . . . . . . . . . . . . . . . . . . . . . . . . . . . . . . . . . . . . . . 126
10 Understanding health workforce issues: a selective guide to the use of qualitative methods . . . 129
10.1 Introduction . . . . . . . . . . . . . . . . . . . . . . . . . . . . . . . . . . . . . . . . . . . 129
10.2 Qualitative methods: their value and potential. . . . . . . . . . . . . . . . . . . . . . . . . . 130
10.3 Issues in the design and implementation of a qualitative study . . . . . . . . . . . . . . . . . 132
10.4 Summary and conclusions . . . . . . . . . . . . . . . . . . . . . . . . . . . . . . . . . . . 143
References. . . . . . . . . . . . . . . . . . . . . . . . . . . . . . . . . . . . . . . . . . . . . . . 144
11 Analysis and synthesis of information on human resources for health from multiple sources:
selected case studies. . . . . . . . . . . . . . . . . . . . . . . . . . . . . . . . . . . . . . . . . . . .147
11.1 Introduction . . . . . . . . . . . . . . . . . . . . . . . . . . . . . . . . . . . . . . . . . . . .147
11.2 Identification of potential information sources and their use to estimate indicators of health labour
market participation in Mexico. . . . . . . . . . . . . . . . . . . . . . . . . . . . . . . . . . .147
11.3 Using multiple sources of information to produce best estimates of India’s health workforce . 150
11.4 Triangulation of data from two different sources for monitoring health worker absenteeism and
ghost workers in Zambia . . . . . . . . . . . . . . . . . . . . . . . . . . . . . . . . . . . . 152
11.5 Summary and conclusions . . . . . . . . . . . . . . . . . . . . . . . . . . . . . . . . . . . 154
References. . . . . . . . . . . . . . . . . . . . . . . . . . . . . . . . . . . . . . . . . . . . . . . 155
Part IV: DATA DISSEMINATION AND USE . . . . . . . . . . . . . . . . . . . . . . . . . . . . . . . 157
12 Getting information and evidence into policy-making and practice: strategies and mechanisms . 159
12.1 Introduction . . . . . . . . . . . . . . . . . . . . . . . . . . . . . . . . . . . . . . . . . . . 159
12.2 Strategies to get evidence into policy and practice . . . . . . . . . . . . . . . . . . . . . . . 160
12.3 A mechanism to harness the HRH agenda: health workforce observatories . . . . . . . . . . 162
12.4 Opportunities and directions . . . . . . . . . . . . . . . . . . . . . . . . . . . . . . . . . . 169
References. . . . . . . . . . . . . . . . . . . . . . . . . . . . . . . . . . . . . . . . . . . . . . . .170
Index . . . . . . . . . . . . . . . . . . . . . . . . . . . . . . . . . . . . . . . . . . . . . . . . . . . . . . . .173
About the publishing agencies . . . . . . . . . . . . . . . . . . . . . . . . . . . . . . . . . . . . . . . . .176

Handbook on monitoring and evaluation of human resources for health
vi
List of tables, figures and boxes
TABLES
Table 2.1 Framework for defining the health workforce. . . . . . . . . . . . . . . . . . . . . . . . . . . . .14
Table 2.2 Relevant levels of education and training for health occupations according to the International
Standard Classification of Education (ISCED-1997) . . . . . . . . . . . . . . . . . . . . . . . . . . . . . 15
Table 2.3 Fields of vocational training related to health according to Fields of training manual . . . . . . . .17
Table 2.4 Occupational titles related to health according to the International Standard Classification of
Occupations (ISCO), 1988 and 2008 revisions . . . . . . . . . . . . . . . . . . . . . . . . . . . . . . . . .18
Table 2.5 Economic sectors related to health activities on the basis of the International Standard Industrial
Classification of All Economic Activities (ISIC) Revision 4 . . . . . . . . . . . . . . . . . . . . . . . . . . 20
Table 3.1 Selected key indicators for monitoring and evaluation of human resources for health . . . . . . 28
Table 3.2 Potential data sources for monitoring the health workforce . . . . . . . . . . . . . . . . . . . . 30
Table 3.3 Selected indicators and means of verification for monitoring implementation and use of the
national HRH information and monitoring system to support decision-making. . . . . . . . . . . . . . . . 35
Table 4.1 Key indicators and means of verification for measuring entry into the health workforce. . . . . . 44
Table 5.1 Potential sources of data on health workforce transitions and exits . . . . . . . . . . . . . . . . .51
Table 5.2 Annual numbers of overseas-trained nurses obtaining national licensure to practise in the
United Kingdom, 1998–2007 (main countries of origin outside the European Economic Area) . . . . . . . 54
Table 5.3 Estimates of annual losses due to mortality under age 60 among health workers in selected
countries of the WHO Africa Region, based on life table analysis . . . . . . . . . . . . . . . . . . . . . . 55
Table 6.1 Percentage distribution of expenditure by type of health-care agent, Mexico health accounts,
1995 . . . . . . . . . . . . . . . . . . . . . . . . . . . . . . . . . . . . . . . . . . . . . . . . . . . . . . 73
Table 6.2 Percentage distribution of expenditure by main providers, Peru health accounts, 2000 . . . . . 73
Table 6.3 Remuneration components in the “use” table of the income account, System of National
Accounts . . . . . . . . . . . . . . . . . . . . . . . . . . . . . . . . . . . . . . . . . . . . . . . . . . . .74
Table 6.4 National accounts supply and use table, South Africa, 2002 (millions Rand, partial display) . . . 75
Table 7.1 Estimated number of new graduates entering the public sector facility-based health workforce,
by cadre, Nigeria 2005 . . . . . . . . . . . . . . . . . . . . . . . . . . . . . . . . . . . . . . . . . . . . 87
Table 7.2 Number and density of facility-based health workers, by cadre, Zambia 2006 HFC . . . . . . . 88
Table 7.3 Mean number of health workers by type of facility, according to cadre, Kenya 2004 . . . . . . . 89
Table 7.4 Number of health workers currently in post, number recommended by staffing norm, and number
requested by facility managers to meet the norm, by cadre, Kenya 2004 . . . . . . . . . . . . . . . . . . 90
Table 7.5 Percentage of facilities reporting having at least one seconded health worker, by cadre,
according to management authority of the facility, Kenya 2004 . . . . . . . . . . . . . . . . . . . . . . . 91
Table 7.6 Skills mix of facility-based health workers, by type of facility, Kenya 2004. . . . . . . . . . . . . 92
Table 7.7 Percentage distribution of health workers in post at health facilities by managing authority,
according to cadre, Kenya 2004 . . . . . . . . . . . . . . . . . . . . . . . . . . . . . . . . . . . . . . . 93
Table 7.8 Percentage distribution of facility-based health workers and of the total population by
geographical region, Kenya 2004 . . . . . . . . . . . . . . . . . . . . . . . . . . . . . . . . . . . . . . 93
Table 7.9 Median number of years of service in current position among facility-based health workers, by
type and management authority of facility, Kenya 2004 . . . . . . . . . . . . . . . . . . . . . . . . . . . 95

vii
List of tables, figures and boxes
Table 7.10 Percentage of facility-based health workers with written job descriptions, perceived promotion
opportunities and other non-monetary incentives, by cadre and type of facility, Kenya 2004 . . . . . . . . 96
Table 7.11 Percentage distribution of facility-based health workers by number of hours normally worked
per week, according to cadre, Kenya 2004. . . . . . . . . . . . . . . . . . . . . . . . . . . . . . . . . . 97
Table 7.12 Comparison of the increase in stock of the public sector health workforce from new graduates
with the attrition rate, Nigeria 2005 . . . . . . . . . . . . . . . . . . . . . . . . . . . . . . . . . . . . . . 99
Table 8.1 Countries and sources of census data . . . . . . . . . . . . . . . . . . . . . . . . . . . . . . . 105
Table 8.2 Percentage distribution of the health workforce by sex, by occupation, according to census data
for 13 countries (around 2000) . . . . . . . . . . . . . . . . . . . . . . . . . . . . . . . . . . . . . . . . 107
Table 8.3 Ratio of women to men by level of educational attainment, health workforce and total population,
according to census data for selected countries (around 2000) . . . . . . . . . . . . . . . . . . . . . . . 109
Table 8.4 Estimates of intercensal health workforce attrition by sex, Thailand, 1990 and 2000 censuses . 110
Table 9.1 Selected indicators and benchmarks from the health workforce information and monitoring
system in Sudan, 2006–2007 . . . . . . . . . . . . . . . . . . . . . . . . . . . . . . . . . . . . . . . . . 122
Table 9.2 Selected indicators and corresponding criteria used for evaluating the performance of the
HRH information and management system in Brazil . . . . . . . . . . . . . . . . . . . . . . . . . . . . . 123
Table 9.3 Selected indicators and results from the evaluation of the institutional impact of the HRH
information and management system in Brazil . . . . . . . . . . . . . . . . . . . . . . . . . . . . . . . . 124
Table 10.1 Contrasting qualitative and quantitative approaches . . . . . . . . . . . . . . . . . . . . . . . 131
Table 10.2 Illustrations of qualitative research on health workers . . . . . . . . . . . . . . . . . . . . . . 133
Table 10.3 Group discussions or individual interviews? . . . . . . . . . . . . . . . . . . . . . . . . . . . 135
Table 11.1 Questions on education and labour activity included in the national population census and
intercensal counts, Mexico, 1995–2005 . . . . . . . . . . . . . . . . . . . . . . . . . . . . . . . . . . . 148
Table 11.2 Stock and distribution of the physician and nursing workforce by labour force status, based
on census and survey data, Mexico, 2000 . . . . . . . . . . . . . . . . . . . . . . . . . . . . . . . . . . 149
Table 12.1 Main stakeholders and their role in support of the national HRH observatory in Sudan . . . . . 166
Table 12.2 Influences of selected achievements of the Brazilian Human Resources for Health Observatory
on policy processes. . . . . . . . . . . . . . . . . . . . . . . . . . . . . . . . . . . . . . . . . . . . . . 167
FIGURES
Figure 1.1 Working lifespan approach to the dynamics of the health workforce . . . . . . . . . . . . . . . . 9
Figure 3.1 Stocks and flows of the health workforce . . . . . . . . . . . . . . . . . . . . . . . . . . . . . 25
Figure 3.2 Geographical distribution of the stock of health workers (per 100 000 inhabitants), Viet Nam
and Mexico censuses . . . . . . . . . . . . . . . . . . . . . . . . . . . . . . . . . . . . . . . . . . . . . 31
Figure 3.3 Trends in the distribution of workers in health services by main occupational group, Namibia
labour force surveys, 1997–2004 . . . . . . . . . . . . . . . . . . . . . . . . . . . . . . . . . . . . . . . 32
Figure 3.4 Distribution of health workers’ salaries by source, according to facility owner ship, Rwanda
health facility assessment, 2006 . . . . . . . . . . . . . . . . . . . . . . . . . . . . . . . . . . . . . . . 32
Figure 3.5 Gender and skills mix of the nursing workforce in Kenya, Nursing Council of Kenya database,
1960–2005 . . . . . . . . . . . . . . . . . . . . . . . . . . . . . . . . . . . . . . . . . . . . . . . . . . 33
Figure 4.1 Framework for monitoring entry into the health workforce . . . . . . . . . . . . . . . . . . . . 38
Figure 5.1 Transitions within and exits from the health workforce: a framework for analysis . . . . . . . . . 50
Figure 5.2 Foreign-born nurses and doctors enumerated in 24 OECD countries by main countries of origin
(population census data, around 2000) . . . . . . . . . . . . . . . . . . . . . . . . . . . . . . . . . . . 54
Figure 5.3 Estimated lifetime emigration rate of physicians born in selected non-OECD countries
and working in OECD countries at the time of the census . . . . . . . . . . . . . . . . . . . . . . . . . . 55
Figure 5.4 Retirement rate among physicians by age group according to the National Medical Association
registry, Canada, 2005 . . . . . . . . . . . . . . . . . . . . . . . . . . . . . . . . . . . . . . . . . . . . 56
Handbook on monitoring and evaluation of human resources for health
viii
Figure 5.5 Proportion of survey respondents reporting a health occupation but not working in the health
services industry at the time of interview, selected countries. . . . . . . . . . . . . . . . . . . . . . . . . 56
Figure 6.1 Overview of the estimation process for measuring labour expenditure in the System of National
Accounts . . . . . . . . . . . . . . . . . . . . . . . . . . . . . . . . . . . . . . . . . . . . . . . . . . . 67
Figure 6.2 Information on the labour market in the Netherlands’ national accounts . . . . . . . . . . . . . 68
Figure 6.3 Process to estimate hours worked in the Canadian national accounts . . . . . . . . . . . . . . 69
Figure 6.4 Calculation square . . . . . . . . . . . . . . . . . . . . . . . . . . . . . . . . . . . . . . . . 69
Figure 6.5 Resource flows in a health system: an accounting representation . . . . . . . . . . . . . . . . 72
Figure 7.1 Ratio of facility-based health workers aged under 30 to those aged over 45, by cadre,
Kenya 2004 SPA . . . . . . . . . . . . . . . . . . . . . . . . . . . . . . . . . . . . . . . . . . . . . . . 87
Figure 7.2 Number and percentage distribution of staff currently in post at health facilities, by cadre,
Kenya 2004 SPA . . . . . . . . . . . . . . . . . . . . . . . . . . . . . . . . . . . . . . . . . . . . . . . 88
Figure 7.3 Ratio of health workers per inpatient bed, by facility size, Kenya 2004 SPA . . . . . . . . . . . 89
Figure 7.4 Percentage of health workers requested by facility managers to meet staffing requirements
who are currently in post, by facility type, Kenya 2004 SPA . . . . . . . . . . . . . . . . . . . . . . . . . 91
Figure 7.5 Percentage of health workers and of the total population located in urban areas, Zambia
2006 HFC . . . . . . . . . . . . . . . . . . . . . . . . . . . . . . . . . . . . . . . . . . . . . . . . . . . 92
Figure 7.6 Median number of years of education and training among health workers, by cadre, Kenya
2004 SPA . . . . . . . . . . . . . . . . . . . . . . . . . . . . . . . . . . . . . . . . . . . . . . . . . . . 94
Figure 7.7 Percentage of health workers who received in-service training in the past 12 months, and who
received personal supervision in the last 6 months, by type of facility, Kenya 2004 SPA . . . . . . . . . . 94
Figure 7.8 Percentage of assigned health workers present on the day of the assessment, by cadre,
Kenya 2005 SAM (selected districts) . . . . . . . . . . . . . . . . . . . . . . . . . . . . . . . . . . . . . 97
Figure 7.9 Attrition rates for health workers in public sector facilities, by cadre, Nigeria 2005 . . . . . . . 98
Figure 7.10 Percentage distribution of outgoing health workers by reason for leaving the workforce,
Nigeria 2005 . . . . . . . . . . . . . . . . . . . . . . . . . . . . . . . . . . . . . . . . . . . . . . . . . 98
Figure 8.1 Sex distribution of the physician workforce, according to census data for selected countries
(around 2000) . . . . . . . . . . . . . . . . . . . . . . . . . . . . . . . . . . . . . . . . . . . . . . . . . 106
Figure 8.2 Sex distribution of the personal care workforce, according to census data for selected
countries (around 2000). . . . . . . . . . . . . . . . . . . . . . . . . . . . . . . . . . . . . . . . . . . . 106
Figure 8.3 Sex distribution of health systems support staff, by occupation, Uganda, 2002 census. . . . . 108
Figure 8.4 Relationship between sex ratio in tertiary-level educational attainment and health professional
work activity, according to census data for selected countries (around 2000) . . . . . . . . . . . . . . . . 108
Figure 9.1 Framework for institutionalizing a human resources information system . . . . . . . . . . . . . 115
Figure 9.2 Number of students entering nursing training programmes (leading to qualification as
registered or enrolled nurses) in Uganda, 1980–2004 . . . . . . . . . . . . . . . . . . . . . . . . . . . . 120
Figure 9.3 Number of student nurses who entered training between 1980 and 2004, passed the
professional licensing exam, and qualified, registered and became licensed with the Uganda Nurses
and Midwives Council. . . . . . . . . . . . . . . . . . . . . . . . . . . . . . . . . . . . . . . . . . . . . 120
Figure 9.4 Number and percentage of student nurses who passed the professional licensing exam and regis -
tered with the Uganda Nurses and Midwives Council, by school district (entrants between 1980 and 2001) 121
Figure 11.1 Density of the health workforce by cadre, according to data source, India 2005 . . . . . . . . 151
Figure 11.2 Density of the health workforce (per 10 000 population) based on census versus survey data,
by state, India 2005 . . . . . . . . . . . . . . . . . . . . . . . . . . . . . . . . . . . . . . . . . . . . . . 152
Figure 11.3 Percentage of facility-based health workers on the duty roster but not accounted for on the
day of the assessment, by cadre, Zambia 2006 . . . . . . . . . . . . . . . . . . . . . . . . . . . . . . . 153
Figure 11.4 Percentage of health workers recorded on the Ministry of Health payroll but not registered at
the facility level, Zambia 2006 . . . . . . . . . . . . . . . . . . . . . . . . . . . . . . . . . . . . . . . . 153
Figure 12.1 Basis for HRH policies . . . . . . . . . . . . . . . . . . . . . . . . . . . . . . . . . . . . . . 161

ix
BOXES
Box 1.1 Defining monitoring and evaluation . . . . . . . . . . . . . . . . . . . . . . . . . . . . . . . . . . 4
Box 1.2 Toolkit for monitoring health systems strengthening . . . . . . . . . . . . . . . . . . . . . . . . . 4
Box 1.3 Health-related Millennium Development Goals . . . . . . . . . . . . . . . . . . . . . . . . . . . . 5
Box 1.4 Assessment and strengthening of HRH information systems . . . . . . . . . . . . . . . . . . . . . 6
Box 1.5 Financial resource needs for strengthening HRH information systems . . . . . . . . . . . . . . . . 7
Box 1.6 Human resource needs for strengthening HRH information systems . . . . . . . . . . . . . . . . . 7
Box 1.7 Technological resource needs for strengthening HRH information systems . . . . . . . . . . . . . 7
Box 4.1 Illustrative example of the establishment of health worker education and training goals and
targets: region of the Americas, 2007–2015 . . . . . . . . . . . . . . . . . . . . . . . . . . . . . . . . . 42
Box 4.2 Some notes on data collection, processing and use . . . . . . . . . . . . . . . . . . . . . . . . 43
Box 4.3 Illustrative example of data on trends in medical education institutional capacity, recruitment and
output: Rwanda, 2002–2006 . . . . . . . . . . . . . . . . . . . . . . . . . . . . . . . . . . . . . . . . . 43
Box 6.1 Proposed minimum set of indicators for monitoring expenditure on human resources for health . 64
Box 6.2 Expenditure components under a health accounting approach through classes of the
International Standard Industrial Classification of All Economic Activities (fourth revision). . . . . . . . . . 66
Box 6.3 Labour data estimation criteria in the national accounts of the Russian Federation . . . . . . . . 69
Box 6.4 Defining remuneration of employees and self-employment income . . . . . . . . . . . . . . . . 70
Box 7.1 Core health workforce indicators potentially measurable with HFA data . . . . . . . . . . . . . . 80
Box 8.1 Questions used in the population census to determine main occupation, selected countries . . . 105
Box 9.1 Confidentiality and security of HRH information. . . . . . . . . . . . . . . . . . . . . . . . . . . 118
Box 9.2 Implementation and use of the SIGRHS information system for HRH management in
Guinea Bissau. . . . . . . . . . . . . . . . . . . . . . . . . . . . . . . . . . . . . . . . . . . . . . . . . 125
Box 10.1 Three important techniques in qualitative research . . . . . . . . . . . . . . . . . . . . . . . . 130
Box 10.2 Qualitative research to inform quantitative work: absenteeism in Ethiopia and Rwanda . . . . . 132
Box 10.3 Types of qualitative interviews according to their degree of structure . . . . . . . . . . . . . . . 136
Box 10.4 Extract of semi-structured interview script of qualitative health worker study in Ethiopia and
Rwanda . . . . . . . . . . . . . . . . . . . . . . . . . . . . . . . . . . . . . . . . . . . . . . . . . . . . 137
Box 10.5 Selected quotes from qualitative interviews in Ethiopia and Rwanda . . . . . . . . . . . . . . . 138
Box 10.6 Selection criteria for focus groups with eight participants on the performance and career
choice of nurses and midwives in Ethiopia . . . . . . . . . . . . . . . . . . . . . . . . . . . . . . . . . . 139
Box 10.7 Extract from the introduction to focus group participants in Rwanda . . . . . . . . . . . . . . . 140
Box 10.8 Matrix-based analysis of data from focus group discussions in Ethiopia . . . . . . . . . . . . . 142
Box 10.9 Recording, transcription, coding and analysis: an illustration from a health worker study in
Rwanda . . . . . . . . . . . . . . . . . . . . . . . . . . . . . . . . . . . . . . . . . . . . . . . . . . . . 143
Box 12.1 Evidence-Informed Policy Network: EVIPNet . . . . . . . . . . . . . . . . . . . . . . . . . . . 163
Box 12.2 Africa Health Workforce Observatory . . . . . . . . . . . . . . . . . . . . . . . . . . . . . . . 166
Box 12.3 Brazil Human Resources for Health Observatory . . . . . . . . . . . . . . . . . . . . . . . . . 166
Box 12.4 Ghana Health Workforce Observatory . . . . . . . . . . . . . . . . . . . . . . . . . . . . . . . 167
Box 12.5 Andean Human Resources for Health Observatory Network . . . . . . . . . . . . . . . . . . . 168
List of tables, figures and boxes

Handbook on monitoring and evaluation of human resources for health
x
Preface
THE LATEST MEDICINE and the newest technologies can have little impact on human
health unless there are systems in place to deliver them. The reality today, however, is that
health systems all over the world are suffering from years of neglect. One of the most obvious
manifestations of that neglect is a crippling lack of trained health workers.
In many countries, lack of personnel is one of the most important constraints to strengthening
the delivery of primary and other health services, including curative, promotional, preventive
and rehabilitative services. In sub-Saharan Africa, the health workforce crisis is so great that
36 countries are considered to have a critical shortage of health care professionals to provide
minimum coverage of even the most basic services in maternal, newborn and child health. In
many of the poorest countries of the world, the situation is worsened by the continual loss of
health personnel seeking better opportunities elsewhere.
The effects of poor workforce planning and development are felt everywhere. In Asia and the
Pacific, many countries have a shortage of health workers capable of treating chronic and
emerging diseases. In Europe, the countries of the newly independent states of the former
Soviet Union inherited a workforce that was especially ill-suited to the demands facing mod-
ern health care systems.
Clearly, if countries are to get anywhere near meeting their health system objectives, includ-
ing the health-related Millennium Development Goals, they need to be able to provide better
access to appropriately trained health workers.
The first step is to work out where the gaps are. Yet many countries currently lack the technical
capacity to accurately monitor their own health workforce: data are often unreliable and out-
of-date, common definitions and proven analytical tools are absent, skills and experience for
assessing crucial policy issues are lacking.
This Handbook aims to increase that technical capacity. It offers health managers, researchers
and policy makers a comprehensive, standardized and user-friendly reference for monitoring
and evaluating human resources for health. It brings together an analytical framework with
strategy options for improving the health workforce information and evidence base, as well as
country experiences to highlight approaches that have worked.
We gratefully acknowledge here the support provided by the three collaborating partners: the
United States Agency for International Development, the World Bank and the World Health
Organization. All three will continue to support countries in their application of the Handbook
to national contexts, as one more way to accelerate country action towards building a trained,
sufficient and motivated health workforce.
Carissa F. Etienne
Assistant Director-General,
Health Systems and Services
World Health Organization
Yaw Ansu
Director, Human Development,
Africa Region
The World Bank
Gloria D. Steele
Acting Assistant Administrator,
Global Health
United States Agency for
International Development
Gloria D. Steele

xi
Acknowledgements
Acknowledgements
The present publication is the result of a collaborative effort between the United States Agency
for International Development, the World Bank and the World Health Organization. The vol-
ume was written by an international group of authors and edited by Mario R Dal Poz, Neeru
Gupta, Estelle Quain and Agnes LB Soucat. The list of contributors to the Handbook’s chap-
ters follows.
We would like to acknowledge a number of people and organizations whose contributions
were essential to the preparation of this publication. We wish to thank the data collection and
dissemination organizations and agencies who kindly lent permission to use their information
sources for the empirical analyses presented here, including: Federal Ministry of Health of
the Republic of the Sudan; International Health Policy Program, Thailand; Macro International;
Mexico National Institute of Statistics, Geography and Informatics; Minnesota Population
Center; Thailand National Statistical Office; Uganda Nurses and Midwives Council; and the
World Health Organization. Financial support for the production of this volume was provided
by the Bill & Melinda Gates Foundation, the Government of Norway, the United States Agency
for International Development, the World Bank and the World Health Organization. Elizabeth
Aguilar, Rosa Bejarano, Florencia Lopez Boo, Bénédicte Fonteneau and Dieter Gijsbrechts
provided research and analysis support. We also thank Yaw Ansu for his ongoing support.
Among the individuals who provided useful suggestions to earlier drafts of this final product
were: Adam Ahmat, Elsheikh Badr, James Buchan, Hartmut D Buchow, Arturo de la Fuente,
Delanyo Dovlo, Norbert Dreesch, Thushara Fernando, Paulo Ferrinho, Juliet Fleischl, Linda
Fogarty, Kara Hanson, Christopher H Herbst, Eivind Hoffmann, Beatriz de Faria Leao, Verona
Mathews, Robert McCaa, Edgar Necochea, Rodel Nodora, Jennifer Nyoni, Bjorg Palsdottir,
Jean Pierre Poullier, Magdalena Rathe, Martha Rogers, Kate Tulenko, Cornelis van Mosseveld
and Pablo Vinocur.
The named authors for each chapter alone are responsible for the views expressed in this
publication.
Handbook on monitoring and evaluation of human resources for health
xii
List of contributors
Walid Abubaker, World Health Organization
Ghanim Mustafa Alsheikh, World Health Organization
Aarushi Bhatnagar, Public Health Foundation of India
Bates Buckner, MEASURE Evaluation/
University of North Carolina at Chapel Hill
Mario R Dal Poz, World Health Organization
Danny de Vries, Capacity Project/
IntraHealth International
Khassoum Diallo, United Nations High Commission
for Refugees
Gilles Dussault, Universidade Nova de Lisboa
David B Evans, World Health Organization
Bolaji Fapohunda, MEASURE Evaluation/JSI Inc.
Nancy Fronczak,
Social Sectors Development Strategies
Gülin Gedik, World Health Organization
Neeru Gupta, World Health Organization
Piya Hanvoravongchai, Asia-Pacific Action Alliance
on Human Resources for Health
Christopher H Herbst, World Bank
Patricia Hernandez, World Health Organization
David Hunter, International Labour Organization
Yohannes Kinfu, World Health Organization
Teena Kunjumen, World Health Organization
René Lavallée, Consultant
Tomas Lievens, Oxford Policy Management
Magnus Lindelow, World Bank
Pamela McQuide, Capacity Project/
IntraHealth International
Hugo Mercer, World Health Organization
Gustavo Nigenda,
Instituto Nacional de Salud Pública de México
Shanthi Noriega Minichiello, Health Metrics Network
Ulysses Panisset, World Health Organization
Priya Patil, MEASURE Evaluation/Constella Futures
Célia Regina Pierantoni, Universidade do Estado do Rio de Janeiro
Bob Pond, Health Metrics Network
Estelle Quain,
United States Agency for International Development
Shomikho Raha, World Bank
Krishna D Rao, Public Health Foundation of India
Felix Rigoli, Pan American Health Organization/
World Health Organization
José Arturo Ruiz,
Instituto Nacional de Salud Pública de México
Indrani Saran, Public Health Foundation of India
Catherine Schenck-Yglesias,
United States Agency for International Development
Pieter Serneels, World Bank
Dykki Settle, Capacity Project/IntraHealth International
Agnes LB Soucat, World Bank
Tessa Tan-Torres, World Health Organization
Kate Tulenko, World Bank
Shannon Turlington, Capacity Project/
IntraHealth International
Pascal Zurn, World Health Organization
xiii
Acronyms and abbreviations
Acronyms and abbreviations
COFOG Classification of the Functions of Government
COPP Classification of the Outlays of Producers According to Purpose
CPC Central Product Classification
EVIPNet Evidence-Informed Policy Network
HFA health facility assessment
HFC Health Facility Census
HRH human resources for health
HRIS human resources information system
ICSE International Classification of Status in Employment
IPUMS Integrated Public Use Microdata Series
ISCED International Standard Classification of Education
ISCO International Standard Classification of Occupations
ISIC International Standard Industrial Classification of All Economic Activities
JICA Japanese International Cooperation Agency
OECD Organisation for Economic Co-operation and Development
PAHO Pan American Health Organization
PALOP Países Africanos de Língua Oficial Portuguesa
PHRplus Partners for Health Reformplus
SAM Service Availability Mapping
SHA System of Health Accounts
SIGRAS sistema de informação sobre a graduação em saúde
SIGRHS sistema de informação e gestão de recursos humanos em saúde
SNA System of National Accounts
SPA Service Provision Assessment
USAID United States Agency for International Development
VCT voluntary counselling and testing
WHO World Health Organization

Handbook on monitoring and evaluation of human resources for health
xiv

1
Part I: OVERVIEW


3
Monitoring and evaluation of human resources for health: challenges and opportunities
MARIO R DAL POZ, NEERU GUPTA, ESTELLE QUAIN, AGNES LB SOUCAT
1.1 IntroductionHealth systems and services depend critically on the
size, skills and commitment of the health workforce. It
is now evident that in many low- and middle-income
countries, meeting key Millennium Development Goal
targets, specifically those relating to health, requires
a significant increase in the numbers of health work-
ers (1–3). The global shortage is estimated at around
2.3 million physicians, nurses and midwives, and over
4 million health workers overall. In some parts of the
world, notably in sub-Saharan Africa, the current work-
force needs to be scaled up by almost 140% in order
to overcome the crisis (4). And simply assessing num-
bers of health workers in relation to a given threshold
does not necessarily take into account all of a health
system’s objectives, particularly with regard to accessi-
bility, equity, quality and efficiency.
Countries with critical shortages and imbalances of
health workers also often lack the technical capacity to
identify and assess crucial policy issues related to the
health workforce. As a result, fundamental questions
regarding the status of the workforce, its level of per-
formance and the problems health workers face remain
largely unanswered. In addition, the lack of compre-
hensive, reliable and up-to-date data, and the absence
of commonly agreed definitions and analytical tools,
have made the task of monitoring the health workforce
all the more difficult in all settings, from the global and
regional to the national and subnational levels. Such
challenges remain significant to many governments
striving to maintain a sufficient, sustainable and effec-
tive health workforce in their respective jurisdictions.
This Handbook is a response to the need to have a
comprehensive, standardized and user-friendly refer-
ence on health workforce monitoring and evaluation
as a means to develop in-country capacity to build
the knowledge base needed to guide, accelerate and
improve country action (Box 1.1) (5, 6). This introduc-
tory chapter begins with an overview of recent global
initiatives for supporting human resources for health
(HRH) development; continues with a discussion on
key challenges on the uses of health workforce infor-
mation for planning, policy and decision-making; and
proposes a comprehensive framework for HRH mon-
itoring. Presentation of this overview and framework
orients readers to the contents of the rest of the volume.
This publication is the result of a collaborative effort
between the United States Agency for International
Development (USAID), the World Bank and the World
Health Organization (WHO) to document method-
ologies and share experiences in measuring and
monitoring HRH, to encourage countries and part-
ners to build upon these experiences and to compile
recommendations for ministries of health and other
stakeholders for health workforce monitoring and
evaluation. It builds upon and complements other inter-
nationally coordinated efforts for monitoring the building
blocks of health systems, including human resources
(Box 1.2) (7). It is anticipated that this Handbook will
contribute to effective use of existing data and improve
future data collection efforts for maximum utility of
quantitative and qualitative HRH assessments within
countries, across countries and over time. The publi-
cation should be seen as a work in progress that will
result in an enhanced understanding of HRH and con-
tribute significantly to the growing body of tools and
applied research designed to address the challenge of
measuring and improving health workforce outcomes,
strengthening health systems and, ultimately, improv-
ing population health.
1.2 Global initiatives on HRH and information systemsThe health workforce is increasingly recognized as
key for scaling up health interventions for achieving
the Millennium Development Goals (Box 1.3) (8). Even
with additional funds available in recent years from
international, multilateral, bilateral and private sources,
such as through poverty reduction strategies and debt
1

Handbook on monitoring and evaluation of human resources for health
4
alleviation programmes, or through newer modalities
such as the Global Fund to Fight AIDS, Tuberculosis
and Malaria (9), the GAVI Alliance (10) and the United
States President’s Emergency Plan for AIDS Relief
(11), country capacity to absorb funds and to put
them to work can be severely crippled by the crisis
in HRH. In many countries there is simply insufficient
human capacity at all levels to absorb, deploy and use
efficiently the financing for scaling up health services
delivery offered by recent initiatives.
A series of high-level forums on the health Millennium
Development Goals (12), the HRH strategy report of the
Joint Learning Initiative (13), the WHO flagship publica-
tion The world health report 2006: working together for
health (4), the resolutions of World Health Assemblies
on health workforce development (14), and the launch
of the Global Health Workforce Alliance (15), as well
as certain regional partnership mechanisms such as
the Asia-Pacific Action Alliance on Human Resources
for Health (16), were among a cluster of international
activities that alerted national, regional and interna-
tional policy-makers and stakeholders, including the
media, civil society and the general public, to the criti-
cal importance of HRH worldwide, especially the HRH
crisis in sub-Saharan Africa.
Box 1.1 Defining monitoring and evaluation
Monitoring. The ongoing process of collecting and using standardized information to assess progress
towards objectives, resource usage and achievement of outcomes and impacts. It usually involves
assessment against agreed performance indicators and targets. In conjunction with evaluation information,
effective monitoring and reporting should provide decision-makers and stakeholders with the knowledge
they need to identify whether the implementation and outcomes of a project, programme or policy initiative
are unfolding as expected and to manage the initiative on an ongoing basis.
Evaluation. The systematic and objective assessment of an ongoing or completed initiative, its design,
implementation and results. The aim is to determine the relevance and fulfilment of objectives, efficiency,
effectiveness, impact and sustainability. The development of an evaluation framework entails consideration
of a range of matters, including identification of the types of data that could inform an evaluation.
Indicator. A parameter that points to, provides information about or describes a given state. Usually
represented by a data element for a specified time, place and other characteristics, it gives value as an
instrument used in performance assessment.
Data. Characteristics or information, often numerical, that are collected through observation. Data can be
considered as the physical representation of information in a manner suitable for processing, analysis,
interpretation and communication.
Sources: Adapted from Deloitte Insight Economics (5) and Organisation for Economic Co-operation and Development (6).
Box 1.2 Toolkit for monitoring health systems strengthening
The ability to plan, monitor and evaluate health systems functioning is essential in order to correctly target
investments and assess whether they are having the intended impact. Health systems can be described
in many ways. The WHO framework delineates six core building blocks: service delivery, health workforce,
financing, information, leadership and governance, and medical products and technologies. Through
collaboration between WHO, the World Bank, country health information and systems experts and many
other organizations working in this field, a toolkit was developed proposing a limited set of indicators
and related measurement strategies covering each of the building blocks. As of mid-2008, the Toolkit
for monitoring health systems strengthening was being made available while still in draft form to invite
comments from a wide array of potential users.
Source: World Health Organization (7).

Monitoring and evaluation of human resources for health: challenges and opportunities
5
Raising awareness of the critical role of HRH places the
health workforce high on global public health agendas.
Countries, donors, international agencies and other
stakeholders are increasingly willing not only to invest
in but also to contribute to HRH development overall.
The critical role of human resources in the achieve-
ments of health systems objectives is more and more
recognized and valued.
At the same time, there is an increased demand for trans-
parency and performance measurement. For instance,
the Global Fund and GAVI Alliance, which spear-
head the principles of performance-based release of
donor funding, have recognized the need to channel
more of their disease-specific funds towards sustaina-
ble, comprehensive health care that is accessible and
affordable to all. Other recent international initiatives
seeking to accelerate progress towards achieving the
health-related Millennium Development Goals, together
with all major stakeholders, including the International
Health Partnership (17) and the Global Campaign for
the Health Millennium Development Goals (18), empha-
size the principles of health systems support to achieve
improved health outcomes. Increased opportunities for
funding health systems strengthening through primary
health care means more opportunities for investing in
improving the quality of human resources.
To this end, countries are called upon to provide clear
and consistent evidence in their requests for both
new and ongoing resources for HRH development.
This is also true for decision-making and allocation of
resources from national sources. Ministries of health
in many low- and middle-income countries face addi-
tional challenges posed by the effects of decentralizing
responsibilities for both budget and information sys-
tems to district authorities, with often incomplete or
inconsistent transfers of authority hampering proper
decision-making processes.
Box 1.3 Health-related Millennium Development Goals
In September 2000, at the United Nations Millennium Summit, all countries committed to collectively
working towards a series of eight goals and 18 related targets for combating poverty and its determinants
and consequences, under a compact known as the Millennium Development Goals. Much investment
was subsequently allocated for measuring progress towards the achievement of these targets, including
a strong focus on monitoring coverage of prioritized health interventions and population health outcomes.
More recently, attention has been directed to addressing and monitoring the health systems inputs,
processes and outputs that impede or facilitate progress.
Goals Related targets
1. Eradicate extreme poverty and hunger Halve, between 1990 and 2015, the proportion of people
who suffer from hunger
4. Reduce child mortality Reduce by two thirds, between 1990 and 2015, the
under-five mortality rate
5. Improve maternal health Reduce by three quarters, between 1990 and 2015, the
maternal mortality ratio
6. Combat HIV/AIDS, malaria and other
diseases
Have halted by 2015 and begun to reverse the spread of
HIV/AIDS
Have halted by 2015 and begun to reverse the incidence
of malaria and other major diseases
7. Ensure environmental sustainability Halve by 2015 the proportion of people without
sustainable access to safe drinking-water and sanitation
8. Develop a global partnership for
development
In cooperation with pharmaceutical companies, provide
access to affordable, essential drugs in developing
countries
Source: World Health Organization (8).
Handbook on monitoring and evaluation of human resources for health
6
The importance of sound empirical evidence for
informed policy development, decision-making and the
monitoring of progress towards achieving HRH devel-
opment and strengthening health systems is widely
recognized. Evidence is needed to support countries
to make the case for HRH both in national budget allo-
cation and in their cooperation with donors. However,
knowledge about what works and what does not is
still very limited, signalling a need for more evidence
and further research. The launch of the Health Metrics
Network (19), a partnership aiming to increase the
availability and use of timely and accurate health infor-
mation by catalysing the joint funding and development
of core country health information systems, was a big
step forward in improving the information and evidence
base, including on HRH (Box 1.4).
However, despite the global initiatives to assist in
this core area of health systems strengthening, there
is little consistency between countries in how HRH
strategies are monitored and evaluated (20), thereby
limiting the capacity of stakeholders to rationalize the
allocation of resources. In many countries, the prob-
lem partly emanates from the fragmentation of HRH
information and the shortages in human, financial and
infrastructural resources available to collect, compile
and analyse health workforce data (Boxes 1.5–1.7) (21–
24). Moreover, the lack of standard tools, indicators,
definitions and systems of classifying health workers
has placed further constraints on using HRH informa-
tion for evidence-informed decision-making.
Strengthening HRH information and monitoring sys-
tems requires a better foundation for policy-making,
planning, programming and accountability. A range of
tools and resources exists to assist countries in devel-
oping a national HRH strategic plan (25–27); technical
assistance for developing and costing these plans can
be sought, but having the necessary underlying data is
a prerequisite. The Kampala Declaration and Agenda
for Global Action, adopted by the First Global Forum
on Human Resources for Health (28), called upon
governments, in cooperation with international organ-
izations, civil society, the private sector, professional
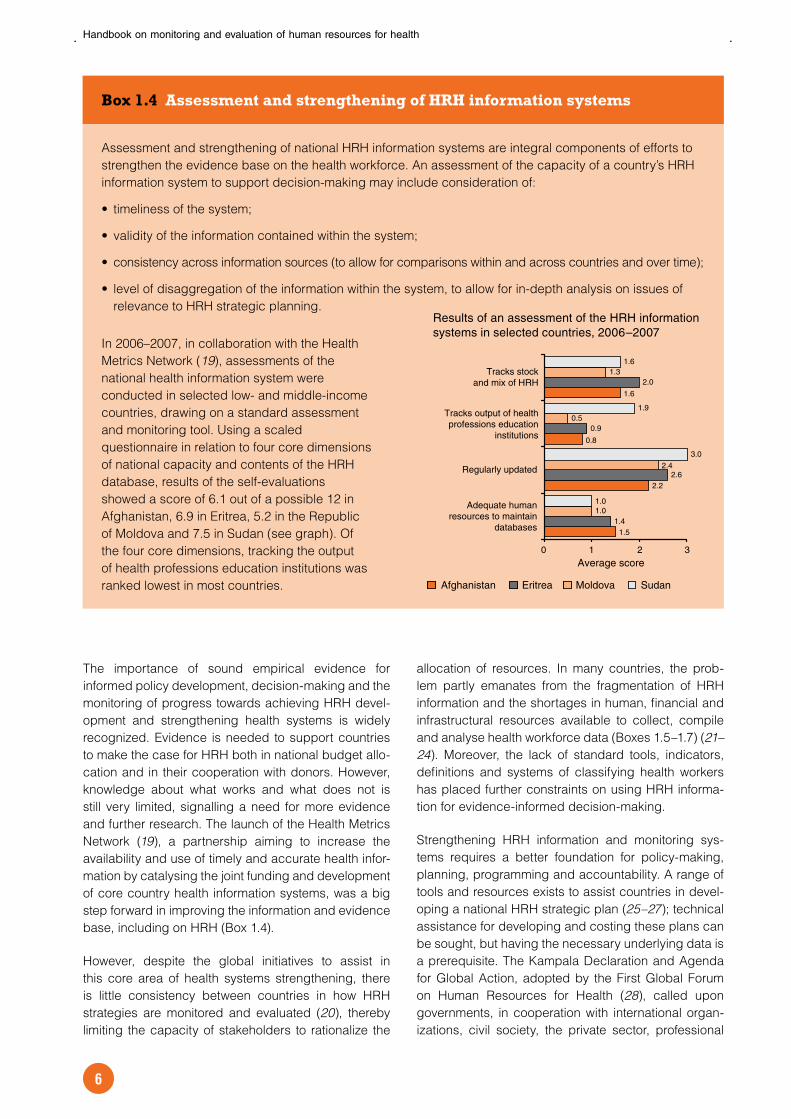
Box 1.4 Assessment and strengthening of HRH information systems
Assessment and strengthening of national HRH information systems are integral components of efforts to
strengthen the evidence base on the health workforce. An assessment of the capacity of a country’s HRH
information system to support decision-making may include consideration of:
timeliness of the system;
validity of the information contained within the system;
consistency across information sources (to allow for comparisons within and across countries and over time);
level of disaggregation of the information within the system, to allow for in-depth analysis on issues of
relevance to HRH strategic planning.
In 2006–2007, in collaboration with the Health
Metrics Network (19), assessments of the
national health information system were
conducted in selected low- and middle-income
countries, drawing on a standard assessment
and monitoring tool. Using a scaled
questionnaire in relation to four core dimensions
of national capacity and contents of the HRH
database, results of the self-evaluations
showed a score of 6.1 out of a possible 12 in
Afghanistan, 6.9 in Eritrea, 5.2 in the Republic
of Moldova and 7.5 in Sudan (see graph). Of
the four core dimensions, tracking the output
of health professions education institutions was
ranked lowest in most countries.
1.5
2.2
0.8
1.6
1.4
2.6
0.9
2.0
1.0
2.4
0.5
1.3
1.0
3.0
1.9
1.6
0 1 2 3
Regularly updated
Average score
Afghanistan Eritrea Moldova Sudan
Tracks output of health professions education
institutions
Tracks stock and mix of HRH
Adequate human resources to maintain
databases
Results of an assessment of the HRH information systems in selected countries, 2006–2007

Monitoring and evaluation of human resources for health: challenges and opportunities
7
associations and other partners, to “create health work-
force information systems, to improve research, and
to develop capacity for data management in order to
institutionalize evidence-based decision making and
enhance shared learning”.
1.3 Key issues and challengesIt is an unfortunate truth that countries most in need of
strengthening their HRH tend to have the most frag-
mented and unreliable data and information. Most, if
not all, countries lack a harmonized dedicated system
for collecting, processing and disseminating compre-
hensive timely information on their health workforce,
including stock, distribution, expenditures and determi-
nants of change. Different pieces of information may
be derived from health professional regulatory bod-
ies, district health information records on health facility
staffing, population or establishment censuses or sur-
veys, payroll records, work permits or other sources.
As a result, ministries of health and other stakeholders
often depend on ad hoc reports compiled from differ-
ent sources, for which the completeness, timeliness
and comparability are widely variable.
Box 1.5 Financial resource needs for strengthening HRH information systems
Little research has been undertaken into the financial investment levels needed to ensure a sound human
resources information and monitoring system, which can vary according to a country’s overall level of
development. Estimates of the cost of a comprehensive health information system, including a strong
HRH component, range from US$ 0.53 to US$ 2.99 annually per capita (21). In general, guidelines
suggest that health information, monitoring and evaluation costs comprise between 3% and 11% of total
project funds (22).
Box 1.6 Human resource needs for strengthening HRH information systems
Improvements to information systems require attention to be given to the training, deployment, remuneration
and career development of human resources at all levels. At the national level, skilled epidemiologists,
statisticians, demographers and computer programmers and technicians are needed to oversee data
quality and standards for collection, and to ensure the appropriate analysis and utilization of information. At
the district and facility levels, health information staff should be accountable for data collection, reporting
and analysis. Too often, such tasks are given to overburdened health service providers, who see this as
unwelcome additional work that detracts from their primary role. Appropriate remuneration and supervision
is essential to ensure the availability of high-quality staff and to limit attrition. This implies, for example, that
health information positions in ministries of health (and other bodies mandated with data analysis and use)
should be graded at a level equivalent to those of major disease programmes.
Source: Health Metrics Network (23).
Box 1.7 Technological resource needs for strengthening HRH information systems
Many countries lack access to the necessary information and communications technologies for strengthening
their HRH information systems. For instance, a 2004 study conducted by the WHO Regional Office for Africa
showed that 22% of health workforce departments of ministries of health in the region did not have computer
facilities, 45% had no electronic mail access, and fax machines were available in only 32% of the surveyed
departments. Under these circumstances, even a modest investment could yield significant returns.
Source: World Health Organization (24).
Handbook on monitoring and evaluation of human resources for health
8
An additional challenge is that most countries do not
have comprehensive data that capture the multitude
of health workforce engaged in the preservation, pro-
motion and restoration of health. For instance, few
countries routinely collect and disseminate official sta-
tistics on their health system management and support
workforce, which includes a large range of managerial,
administrative, professional and clerical occupations
as well as many others working in the health sector
who are not necessarily formally trained in health serv-
ices provision. In The world health report 2006, barely
a third of countries reported such data (4). Yet, these
workers – who are a critical component of the health
workforce – are estimated to account for close to a
third of all HRH worldwide; excluding them from offi-
cial counts results in a substantial underreporting of the
health workforce stock and neglects a sizeable poten-
tial to strengthen health systems performance. Many
countries also lack timely and reliable information on
the various dimensions of HRH imbalances, such as
distribution by sector, geography, gender, labour force
activity, place of work and remuneration.
Even in countries where data are relatively available,
the translation of information into evidence that is use-
ful for planners, decision-makers and stakeholders
has been greatly hindered by the lack of consistency
in occupational classification and the challenges of
combining information from multiple sources. Given
the differences in national developments and culture
that result in variations in the roles and tasks of health
workers, any attempt to enhance cross-national and
time-trend comparability needs to focus on ways to
harmonize data collection, processing and dissemina-
tion approaches.
A further challenge in the development and strength-
ening of HRH information systems comes from the lack
of consensus on standardized indicators and underin-
vestment in measurement strategies, which are core
for monitoring and evaluation of HRH interventions.
Important efforts are still needed to harmonize a mini-
mum set of indicators that are broadly reflective of the
various dimensions and complexities of HRH dynam-
ics, simple and ready to measure, but comprehensive
enough to be of use for public health decision-mak-
ing in the area of HRH. There are as yet no commonly
agreed and systematically reported indicators inter-
nationally, apart from density of the most common
categories of health professionals (physicians, nurses
and midwives). Even this indicator has serious limita-
tions for policy and planning, as its relevance in setting
periodic targets may be influenced by changes in pop-
ulation structure, burden of disease, health workforce
skill mix and other factors.
1.4 Framework for health workforce monitoring: the working lifespan approachThe present Handbook uses a “working lifespan”
approach to monitoring the dynamics of the health work-
force. Introduced in The world health report 2006 (4),
this approach focuses on the need for monitoring and
evaluating each of the stages when people enter (or re-
enter) the workforce, the period of their lives when they
are part of the workforce, and the point at which they
make their exit from it. The lifespan approach (Figure
1.1) of producing, attracting, sustaining and retaining
the workforce offers a worker perspective as well as a
systems approach to monitoring the dynamics of the
health labour market and the strategies of each stage.
From policy and management perspectives, the frame-
work focuses on modulating the roles of both labour
markets and state action at key decision-making
junctures:
entry: preparing the workforce through strategic
investments in education and effective and ethical
recruitment practices;
active workforce: enhancing workforce availabil-
ity, accessibility and performance through better
human resources management in both the public
and private sectors;
exit: managing migration and attrition to reduce
wasteful loss of human resources.
A central objective of policy and programmatic inter-
ventions at the entry stage is to produce and prepare
sufficient numbers of motivated workers with ade-
quate technical competencies, whose geographical
and sociocultural distribution makes them accessible,
acceptable and available to reach clients and popu-
lations in an efficient and equitable manner. To do so
requires active planning, management and budgeting
across the health workforce production pipeline, with a
focus on building strong health professions education
institutions, enhancing quality control mechanisms for
skilled workers and strengthening labour recruitment
capabilities.
Strategies to improve the performance of the active
health workforce focus on the availability, competence,
appropriateness, responsiveness and productivity of
those currently engaged in the health sector. This gen-
erally involves assessment of HRH within the context
of health services delivery among a wide variety of
workplaces, and across the broader context of national
labour markets.
Unplanned or excessive exits or losses of health work-
ers may compromise health systems performance

Monitoring and evaluation of human resources for health: challenges and opportunities
9
and exacerbate the fragility of some already weak sys-
tems. In some regions, worker illnesses, deaths and
out-migration (to other sectors or countries) together
constitute a haemorrhaging that threatens workforce
stability. Strategies to counteract workforce attrition
include managing the market pressures that can lead to
migration, improving workplace conditions so that the
health sector is viewed as a favourable career choice,
and reducing risks to health workers’ health and safety.
At each of these stages, and for each of the policies
and interventions in place, there is a need to develop
and measure appropriate indicators to inform strategy
development and monitor the impacts and cost-effec-
tiveness over time.
1.5 Road mapThe following chapters in this Handbook present in
detail the opportunities, challenges and country expe-
riences in approaches to monitoring and evaluating
these key aspects of health workforce dynamics and
the utility of different potential information sources and
analytical techniques. The volume is structured in 12
chapters, including this introductory chapter. While
each chapter may be read on its own, a number of
cross-references to other chapters are also included
at various junctions to help guide readers towards a
broader vision. Although many of the approaches pre-
sented here have been selected with the expectation
of being applied in low- and middle-income countries,
illustrative examples from countries with developed
market economies are also included in order to opti-
mize the sharing of experiences and best practices.
In Chapter 2, Hunter, Dal Poz and Kunjumen dis-
cuss the definition of the health workforce and its
operationalization, reviewing the current uses of inter-
nationally standardized classifications relevant for
statistical delineation, description and analysis of the
health workforce. The timeliness of this chapter is man-
ifest, given the recent 2008 revision to the International
Standard Classification of Occupations.
In Chapter 3, Rigoli and colleagues detail the
approaches to and means of monitoring the active
health workforce. They identify core indicators for char-
acterizing those currently participating in the health
labour market and review potential sources of data. The
chapter continues with illustrative examples using case
studies from various countries and sources, and con-
cludes with recommendations for strengthening HRH
information and monitoring systems within countries.
Figure 1.1 Working lifespan approach to the dynamics of the health workforce
Source: World Health Organization (4).
ENTRY:
Preparing the
workforce
Planning Education
Recruitment
EXIT:
Managing attrition
MigrationCareer choice
Health and safetyRetirement
WORKFORCE:
Enhancing worker
performance
SupervisionCompensation
Systems supportLifelong learning
Availability
Competence
Responsiveness
Productivity
WORKFORCE PERFORMANCE

Handbook on monitoring and evaluation of human resources for health
10
Tulenko, Dussault and Mercer explore in Chapter 4
ways in which entry into the health workforce can be
monitored and assessed, and how the appropriate
data can lead to formulation and evaluation of policies
and programmes to address shortages and maldis-
tribution of health workers. They identify a set of core
indicators, and existing and new sources of data for
their measurement.
In Chapter 5, Zurn, Diallo and Kinfu discuss the major
factors influencing transition within and exit from the
health workforce, and propose comprehensive but
readily measurable performance indicators. Using rele-
vant data, the chapter also provides illustrative analyses
with discussion of the implications of observed pat-
terns for policy and planning.
In Chapter 6, Hernandez, Tan-Torres and Evans aim
to encourage a greater number of countries to monitor
expenditure on HRH to inform decision-making. Several
lines of action are presented, intended to be a how-to
guide for operational use by those actually monitoring
these expenditures. An introduction to the main proce-
dures for data collection and the associated results or
indicators that would be generated is included, as well
as country cases to illustrate various procedures. The
chapter focuses on issues of data collection and use at
country level, describing how to begin to construct and
maintain a database on HRH expenditure.
The next four chapters are each centred on a specific
measurement tool that can potentially be a rich source
of policy-relevant information. In Chapter 7, Fapohunda
and colleagues highlight the usefulness of health facil-
ity assessments for HRH analysis, reviewing a broad
array of data collection techniques that focus on facil-
ity-based service delivery points.
In Chapter 8, Lavallée, Hanvoravongchai and Gupta
present approaches to using population census data
for exploring gender dimensions of the health work-
force, drawing on multicountry empirical applications.
The authors conclude with recommendations for pro-
moting the use of sex-disaggregated data, notably
from census sources, as a step towards monitoring and
evaluation of gender-sensitive human resources policy
planning and management.
In Chapter 9, McQuide and colleagues provide an
overview of the essential elements and lessons learnt
to date from various experiences in the implementation
of human resources information systems drawing on
administrative data sources. They present a series of
case studies in developing and strengthening routine
information systems from selected low- and middle-
income countries.
Qualitative measurement strategies for HRH analy-
sis are the focus of Chapter 10. Qualitative studies
are used to understand health workers’ attitudes and
motivations, looking behind the numbers produced in
quantitative research. Lievens, Lindelow and Serneels
provide some practical guidance on how to design and
implement qualitative health workforce studies, draw-
ing on a rich methodological literature and a wealth of
applied research, including case studies from Ethiopia
and Rwanda.
Given the diversity of potential HRH information
sources, a strategy of triangulation – or cross-exami-
nation and synthesis of the available data from different
sources – can be effective in supporting decision-mak-
ing, as it allows for a rapid understanding of the situation
and makes optimal use of pre-existing data. This is the
rationale behind Chapter 11, in which Nigenda and
colleagues present three country case studies (from
Mexico, India and Zambia) on the uses of triangulation
for HRH analysis, each focusing on a central theme.
Lastly, Gedik and colleagues take stock of various glo-
bal, regional and national initiatives in place to build
effective cooperative mechanisms for sharing of
knowledge and best practices. Chapter 12 closes the
Handbook with a discussion on conceptual contribu-
tions and frameworks intending to link health workforce
research, information and analysis to policy dialogue
and decisions. The authors highlight the potential
role and experiences of regional and national HRH
observatories for getting information and evidence into
policy-making and practice.

Monitoring and evaluation of human resources for health: challenges and opportunities
11
1.6 Further information and commentsThis Handbook is part of broader efforts to enhance
country capacities to generate, analyse and use data
to assess health workforce performance and track
progress towards their HRH-related goals. Requests
for further information on any of the tools, methods or
approaches described here are welcomed. In order
to ensure that future revisions of the Handbook are
improved and remain responsive to country needs
and situations, comments, feedback and sugges-
tions are solicited from readers and potential users.
Some specific issues on which feedback are welcome
include user-friendliness of the Handbook; feasibility
and sustainability of the recommended indicators and
related measurement and analysis strategies; and the
Handbook’s helpfulness in stimulating country owner-
ship and demand for strengthened HRH information,
monitoring and evaluation systems.
Please send your questions, comments and feedback to:
Coordinator, Health Workforce Information
and Governance
Department of Human Resources for Health
World Health Organization
Avenue Appia 20
Geneva 1211, Switzerland
Fax: +41–22–791–4747
Email: [email protected]
Handbook on monitoring and evaluation of human resources for health
12
References1. Anand S, Barnighausen T. Human resources and
health outcomes: cross-country econometric study.
Lancet, 2004, 364:1603–1609.
2. Anand S, Barnighausen T. Health workers and
vaccination coverage in developing countries: an
econometric analysis. Lancet, 207, 369:1277–1285.
3. Speybroeck N et al. Reassessing the relationship
between human resources for health, intervention
coverage and health outcomes. Background
paper prepared for The World Health Report
2006. Geneva, World Health Organization, 2006
(http://www.who.int/hrh/documents/reassessing_
relationship.pdf, accessed 10 January 2009).
4. The world health report 2006: working together for
health. Geneva, World Health Organization, 2006
(http://www.who.int/whr/2006, accessed 10 January
2009).
5. Deloitte Insight Economics. Impact monitoring and
evaluation framework: background and assessment
approaches. Barton, Cooperative Research Centres
Association of Australia, 2007.
6. Glossary of statistical terms. Paris, Organisation for
Economic Co-operation and Development (http://
stats.oecd.org/glossary/index.htm, accessed 10
January 2009).
7. Toolkit for monitoring health systems strengthening.
Draft version. Geneva, World Health Organization,
2008 (http://www.who.int/healthinfo/statistics/toolkit_
hss/en/, accessed 10 January 2009).
8. Health and the Millennium Development Goals.
Geneva, World Health Organization (http://www.who.
int/mdg, accessed 10 January 2009).
9. Global Fund to Fight AIDS, Tuberculosis and Malaria
(http://www.theglobalfund.org/en/, accessed 10
January 2009).
10. GAVI Alliance (http://www.gavialliance.org/,
accessed 10 January 2009).
11. United States President’s Emergency Plan for AIDS
Relief (http://www.pepfar.gov, accessed 10 January
2009).
12. High Level Forum on the Health MDGs (http://www.
hlfhealthmdgs.org/, accessed 10 January 2009).
13. Joint Learning Initiative. Human resources for health:
overcoming the crisis. Boston, Harvard University’s
Global Equity Initiative, 2004.
14. WHO resolutions on health workforce development.
Geneva, World Health Organization (http://www.who.
int/hrh/resolutions/en/, accessed 10 January 2009).
15. Global Health Workforce Alliance (http://www.who.int/
workforcealliance/en/, accessed 10 January 2009).
16. Asia-Pacific Action Alliance on Human Resources
for Health (http://aaahrh.org/, accessed 10 January
2009).
17. International Health Partnership (http://www.
internationalhealthpartnership.net/, accessed 10
January 2009).
18. Global Campaign for the Health Millennium
Development Goals: launch of the first year report.
Norwegian Agency for Development Cooperation
(http://www.norad.no/default.asp?V_ITEM_
ID=9263&V_LANG_ID=0, accessed 10 January
2009).
19. Health Metrics Network (http://www.who.int/
healthmetrics/en/, accessed 10 January 2009).
20. Diallo K et al. Monitoring and evaluation of human
resources for health: an international perspective.
Human Resources for Health, 2003, 1:3 (http://
www.human-resources-health.com/content/1/1/3,
accessed 10 January 2009).
21. Stansfield SK et al. Information to improve decision-
making for health. In: Jamison DT et al., eds.
Disease control priorities for the developing world.
Washington, DC, World Bank and Oxford University
Press, 2006.
22. Sullivan TM, Strachan S, Timmons BK. Guide
to monitoring and evaluating health information
products and services. Baltimore, MD, Johns
Hopkins Bloomberg School of Public Health,
Constella Futures and Management Sciences for
Health, 2007.
23. Health Metrics Network. Framework and standards
for country health information systems, 2nd ed.
Geneva, World Health Organization, 2008 (http://
www.who.int/healthmetrics/documents/framework/
en/index.html, accessed 10 January 2009).
24. Policy briefs. Briefs to complement The world health
report 2006: working together for health. Geneva,
World Health Organization, 2006 (http://www.
who.int/hrh/documents/policy_brief, accessed 10
January 2009).
25. HRH Action Framework. Capacity Project (http://
www.capacityproject.org/framework, accessed 10
January 2009).
26. Nyoni J, Gbary A, Awases M et al. Policies and
plans for human resources for health: guidelines for
countries in the WHO African region. Brazzaville,
WHO Regional Office for Africa, 2006 (http://www.
afro.who.int/hrh-observatory/documentcentre/
policies_plans_guidelines.pdf, accessed 10 January
2009).
27. Tools and guidelines for human resources for health
planning. Geneva, World Health Organization (http://
www.who.int/hrh/tools/planning/en/index.html,
accessed 10 January 2009).
28. The Kampala Declaration and Agenda for Global
Action. Declaration adopted at the First Global
Forum on Human Resources for Health, 2–7 March
2008, Kampala. Geneva, World Health Organization
and Global Health Workforce Alliance, 2008 (http://
www.who.int/workforcealliance/Kampala%20
Declaration%20and%20Agenda%20web%20
file.%20FINAL.pdf, accessed 10 January 2009).

13
Boundaries of the health workforce: definition and classifications of health workers
DAVID HUNTER, MARIO R DAL POZ, TEENA KUNJUMEN
2.1 IntroductionThe health workforce represents one of the key build-
ing blocks of health systems and has been identified
as a priority for action for strengthening those sys-
tems (1). However, international assessments of human
resources or other non-monetary inputs to health sys-
tems tend to be less widespread than comparisons of
health-care expenditures (2). This is in part due to lack
of a common framework and adequate data for compar-
ative health workforce analysis. Imprecise professional
boundaries and differences in defining and categoriz-
ing certain types of health workers across much of the
world present further challenges in analysing health
workforce data. For instance, a “nurse” in one country
may be characterized by different educational require-
ments, legislation and practice regulations, skills and
scope of practice than a “nurse” elsewhere. In order to
monitor trends in the health workforce situation across
countries or over time, or for countries to share experi-
ences and best practices, it is necessary to know how
health workers are defined and classified in the original
information source (3).
This chapter discusses the definition of the health
workforce and its operationalization. Current uses of
internationally standardized classifications for statisti-
cal delineation, description and analysis of the health
workforce are reviewed, and some options for future
consideration are outlined.
2.2 Who are health workers?Any health workforce analysis requires precise defini-
tion of health workers. The World Health Organization
(WHO) defines the health workforce as “all people
engaged in actions whose primary intent is to enhance
health” (4). This statement reinforces the WHO concept
of health systems as comprising “all organizations,
people and actions whose primary intent is to promote,
restore or maintain health” (1). This infers, for example,
that family members looking after the sick and other
informal caregivers and volunteers who contribute
to the improvement of health should also be counted
as part of the health workforce. But in practical terms,
these are not often counted, due to lack of information
on the unpaid workforce and the ensuing difficulty with
regard to establishing the boundaries of what consti-
tutes a health system.
Even then, the definition of a health action for classi-
fying paid workers is not straightforward. Consider a
nurse employed by a manufacturing company to pro-
vide on-site health-care services for its employees:
the main goal of the actions of the nurse is to improve
health, although the main goal of the actions of the
employer is not. Then take the case of a gardener
employed by a hospital: the gardener’s own actions
do not directly improve health, although the actions of
the employer – the hospital – do. There are many such
non-clinical workers in health industries, such as man-
agers, computer operators, clerks and trades workers,
who provide managerial and infrastructural support.
There are also many skilled health-care providers who
work outside facility-based service delivery points,
including those in government ministries and depart-
ments, public health offices, health and health systems
research agencies, health professions education and
training institutions, company and school-based clin-
ics, residential care settings, rehabilitation centres,
correctional facilities, military service and others. A
classification system that considers the actions of the
individual alone, or those of the place of work alone,
may fail to capture them all in the health workforce.
In order to provide comparable and consistent data to
inform decision-making, it is necessary to define the
health workforce operationally. While there is no sin-
gle measure of the health workforce, it is important to
specify which elements of the definition and classifi-
cation structure are being considered. For example, if
one study includes the above-mentioned nurse work-
ing for a private company while another does not,
then the comparability of data from the two studies is
compromised.
2

Handbook on monitoring and evaluation of human resources for health
14
Table 2.1 provides a useful framework to capture health
workers employed (or not employed) in the health and
non-health industries. Three categories of workers rele-
vant for health workforce analysis can be distinguished:
A. those with health vocational education and training
working in the health services industry;
B. those with training in a non-health field (or with
no formal training) working in the health services
industry;
C. those with health training who are either working in
a non-health-care–related industry, or who are cur-
rently unemployed or not active in the labour market.
Categories A and C together form the trained (skilled)
health workforce (active or inactive) available in a given
country or region, while A and B represent the work-
force employed in the health industry. The sum of the
three elements A, B and C provides the total potential
health workforce available. A fourth category, D, encap-
sulates all non-health workers, that is, those workers
without training for a health occupation and not work-
ing in the health industry.
The advantage of this framework lies in the fact that it
integrates the elements of training, current occupation
and industry. In this context, “training” refers to the (for-
mal and informal) education undertaken by individuals to
equip them with the skills necessary to perform the tasks
required for competent performance in a job, “occupa-
tion” refers to the tasks and duties performed in a job by
individuals, and “industry” refers to the activities of the
establishments or enterprises in which individuals are
employed. Considering all three elements is essential to
gain an understanding of the dynamics of the workforce.
The framework can be a useful tool for identifying poten-
tial data sources and gaps for health workforce analysis.
A number of sources can be used to provide informa-
tion and evidence to inform policy – notably, population
censuses and surveys, health facility assessments and
routine administrative records (including records on
public expenditure, staffing and payroll, professional
training, registration and licensure). Health facility
assessments or payroll records will only provide data
for categories A and B, while data from professional
regulatory associations tend to be limited to A and C. In
contrast, nationally representative population censuses
and labour force surveys with properly designed ques-
tions on occupation, place of work and field of training
can provide information on all three components.
2.3 Health workforce classificationHealth workers play different roles and often have dif-
ferent national history, culture and codes of practice.
Any attempt to compare the size and characteris-
tics of the health workforce across countries or over
time requires some level of harmonization of the
available information. In order to compare and inte-
grate data from different sources and countries, it is
necessary to use internationally consistent or harmo-
nized classification systems. Although some countries
disseminate data using national educational, occupa-
tional or industrial classifications that are not always
comparable, most use classification systems that are
either based on or linked to internationally standard-
ized classifications, such as the International Standard
Classification of Education (ISCED), the International
Standard Classification of Occupations (ISCO) and
the International Standard Industrial Classification of
All Economic Activities (ISIC). These classifications
provide a coherent framework for categorizing fields
and levels of training, occupations and industries of
employment, respectively, according to shared char-
acteristics (5–7).
2.3.1 Classification of education and trainingThere are important challenges in clearly identifying the
different types of education and training programmes for
health workers from different institutions, having different
Table 2.1 Framework for defining the health workforce
Individual’s training, occupation &
place of work
Working in the health industry Working in a non-health industry or
unemployed/inactive
Training in health and employed in a health occupation
A. For example, physicians, nurses, midwives working in health-care facilities
C. For example, nurses working for private companies, pharmacists working at retail outlets
Training in health but not employed in a health occupation
A. For example, medically trained managers of health-care facilities
C. For example, medically trained university lecturers, unemployed nurses
Training in a non-health field or no formal training
B. For example, economists, clerks, gardeners working in health-care facilities
D. For example, primary school teachers, garage mechanics, bank accountants

Boundaries of the health workforce: definition and classifications of health workers
15
entrance criteria, curricula and durations of training, and
then grouping them into categories that are nationally
and internationally comparable. Comparability can be
enhanced through the collection, processing and dis-
semination of data following the ISCED standard, which
provides a framework for the compilation and presen-
tation of national and international education statistics
and indicators for policy analysis and decision-making,
whatever the structure of the national education systems
and whatever the stage of economic development of a
country (8). ISCED covers all organized and sustained
learning activities for children, young people and adults.
It allows a variety of types of education programmes to
be classified by level and field of education, such as ini-
tial formal education, continuing education, non-formal
education, distance education, apprenticeships, techni-
cal-vocational education and special needs education.
The latest version of ISCED (referred to as ISCED-97)
classifies seven educational levels, and nine broad
fields (in other words, at the one-digit coding level)
and 25 subfields (two-digit level). Table 2.2 shows the
ISCED educational levels relevant for education and
training leading to a health occupation. Most relevant
specializations fall by level under subfield 72, “health”,
including education in medicine, medical and health
services, nursing and dental services.
Certain tools also exist that aim at providing guidelines
on how to apply the ISCED classification. In one such
manual, the two-digit fields of education from ISCED-
97 are expanded to the three-digit level, capturing more
details for vocational education and training while still
ensuring cross-national comparability (9). The man-
ual is intended to serve as a guide in countries where
Table 2.2 Relevant levels of education and training for health occupations according to the International Standard Classification of Education (ISCED-1997)
Level Name Description Typical duration Complementary dimensions
3 Upper secondary education
Typically begins at the end of full-time compulsory education for those countries that have a system of compulsory education.
Typically requires the completion of some 9 years of full-time education since the beginning of basic (primary) education.
Considerations for classifying this level include type of subsequent education or destination; programme orientation; and cumulative theoretical duration.
Level 3 corresponds to the typical minimum entrance requirement for education and training for a health occupation.
4 Post-secondary non-tertiary education
Programmes that straddle the boundary between upper secondary and post-secondary education from an international point of view, even though they might clearly be considered as upper secondary or post-secondary programmes in a national context.
Typical full-time equivalent duration of between 6 months and 2 years.
May include three programme orientations: (i) general education; (ii) prevocational or pretechnical education; and (iii) vocational or technical education.
Includes adult education (for example, technical courses given during an individual’s professional life on specific subjects).
5 First stage of tertiary education
Tertiary programmes having an advanced educational content (but not leading directly to the award of an advanced research qualification).
Typical full-time equivalent duration of at least 2 years, although some programmes are of 4 or more years.
Programmes usually giving access to occupations with high skills requirements.
Includes programmes leading to a master’s degree.
6 Second stage of tertiary education
Tertiary programmes leading to the award of an advanced research qualification (i.e. entails advanced study and original research, not only coursework).
Very restricted scope at this level.
Source: United Nations Educational, Scientific and Cultural Organization (8).

Handbook on monitoring and evaluation of human resources for health
16
comprehensive national classifications are not devel-
oped, based on an analysis of the descriptions of the
content of training programmes. Table 2.3 presents the
three-digit details for health-related specializations.
2.3.2 Classification of occupationsAnother useful classification system for health workforce
analysis is ISCO, developed by the International Labour
Organization (10). This system of classification enables
jobs to be arranged into a hierarchical system specified
according to the precision needed, in major (one-digit
level), sub-major (two-digit level), minor (three-digit
level) and unit (four-digit level) groups. The basic cri-
teria used to define the grouping system are the “skill
level” and “skill specialization” required to carry out the
tasks and duties of the occupations (6). Skill level refers
to the complexity and range of tasks required for the
job. Skill specialization is related to the field of knowl-
edge required, tools and machinery used, the materials
worked on or with and the goods or services produced.
In the most recent version of ISCO, revised in 2008
(known as ISCO-08), the main occupations of inter-
est with health care-related specialization fall within
two sub-major groups: sub-major group 22, “health
professionals” (generally well-trained workers in jobs
that normally require a university degree for competent
performance); and sub-major group 32, “health associ-
ate professionals” (generally requiring knowledge and
skills acquired through advanced formal education
and training but not equivalent to a university degree).
Health professionals include medical doctors (an occu-
pational title used interchangeably with “physicians” in
this Handbook), nursing and midwifery professionals,
and others such as dentists and pharmacists. Health
associate professionals include medical and pharma-
ceutical technicians, nursing and midwifery associate
professionals and others such as dental assistants,
physiotherapy technicians and dispensing opticians
(Table 2.4, page 18).
For the earlier version of ISCO (adopted in 1988, or
ISCO-88) – against which currently available data
were being classified at the time of publication of
this Handbook – the relevant information needed to
be coded to a degree of detail that minimally corre-
sponded to the three-digit level in order for health
occupations to be properly identified. Information at the
two-digit level did not allow distinction of health occu-
pations from other life sciences occupations. However,
drawing on consultations between the International
Labour Organization, WHO and other stakeholders, the
newly adopted 2008 version stemmed from the recog-
nition that the previous version was outdated in some
areas (11).
Most health occupations can be identified at the two-
digit or three-digit levels of ISCO-08. However, a
four-digit code is needed to distinguish practitioner
specializations (such as dentists from pharmacists),
and also to separately identify some other allied health
workers, such as psychologists and social work pro-
fessionals, classified in the same minor group as other
social scientists, including economists and sociologists.
A significant improvement in ISCO-08 for the purposes
of health workforce analysis is the creation of addi-
tional unit groups, notably for distinguishing generalist
from specialist medical doctors, and for identifying a
number of types of allied health workers. For example,
a growing number of countries, especially low-income
countries with critical shortages of highly skilled
medical and nursing professionals, are turning to
“community health workers” – community health aides
selected, trained and working in the communities from
which they come – to render certain basic health serv-
ices (12). This category is specified in ISCO-08 (unit
group code 3253).
Another improvement is in the treatment of veterinary
occupations. In ISCO-88, veterinary occupations were
found in the same minor groups as human health occu-
pations; therefore coding was needed at the four-digit
level to distinguish veterinarians and veterinary assist-
ants. However, in ISCO-08, these two occupational
groups are now classified in separate minor groups.
As a result, data disseminated at even the three-digit
level will allow human health occupations to be dis-
tinguished from veterinary occupations at both the
professional and associate professional levels.
Other occupations of interest include managers and
personal care workers in health services. In ISCO-
08, managers of health and aged care services are
separately identified at the four-digit level (unit group
codes 1342 and 1343, respectively). “Personal care
workers in health services” are identified in a separate
minor group (code 532), which includes unit groups
for health-care assistants and home-based personal
care workers. Information classified according to the
previous ISCO-88 was required at the most detailed
four-digit level in order to differentiate childcare workers
from personal care workers in health services.
Certain documents produced by the International
Labour Organization guide countries on how to develop,
maintain and revise a national occupation classification
and its mapping to the international standard (13, 14).
The most up-to-date information and latest advice can
be found on the ISCO web site (10).

Boundaries of the health workforce: definition and classifications of health workers
17
Table 2.3 Fields of vocational training related to health according to Fields of training manual
Code Field Description
Fields of training directly related to health
721 Medicine The study of the principles and procedures used in preventing, diagnosing, caring for and treating illness, disease and injury in humans and the maintenance of general health. Principally, this field consists of training of physicians.
Programmes with the following main content are classified here: medicine, medical science, medical training. Medical specializations are included here, such as anaesthesiology, anatomy, cardiology, dermatology, epidemiology, forensic medicine, gerontology, haematology, internal medicine, neurology, obstetrics and gynaecology, oncology, ophthalmology, paediatrics, preventive and social medicine, psychiatry, surgery.
722 Medical services The study of physical disorders, treating diseases and maintaining the physical well-being of humans, using non-surgical procedures.
Training programmes classified here comprise a wide range of services such as ambulance service, chiropractic, hearing aid technology, medical laboratory technology, medical X-ray techniques, nutrition and dietetics, occupational therapy, optometry, orthopaedic prosthetics, emergency paramedical technologies, pharmacy, physiotherapy, radiotherapy, speech pathology and therapy, vocational rehabilitation.
723 Nursing The study of providing health care for the sick, disabled or infirm and assisting physicians and other medical and health professionals diagnose and treat patients.
Training programmes with the following main content are classified here: assistant nursing, basic nursing, care of old people, care of the disabled, infant hygiene (nursing), midwifery, nursing aide/orderly, psychiatric nursing.
724 Dental studies The study of diagnosing, treating and preventing diseases and abnormalities of the teeth and gums. It includes the study of designing, making and repairing dental prostheses and orthodontic appliances. It also includes the study of providing assistance to dentists.
Training programmes with the following main content are classified here: clinical dentistry, dental assisting, dental hygiene, dental laboratory technology, dental nursing, dental science, dental surgery, odontology, orthodontics.
Fields of training associated with health
762 Social work and counselling
The study of the welfare needs of communities, specific groups and individuals and the appropriate ways of meeting these needs. The focus is on social welfare with emphasis on social policy and practice.
Among the training programmes classified here: alcohol and drug abuse counselling, crisis support, social practice, social work (welfare).
850 Environmental protection
The study of the relationships between living organisms and the environment in order to protect a wide range of natural resources. Programmes in services to the community dealing with items that affect public health, such as hygiene standards in food and water supply, are included here.
Among the training programmes classified here: air pollution control, community sanitation, environmental toxicology, garbage disposal, water pollution control.
862 Occupational health and safety
The study of recognizing, evaluating and controlling environmental factors associated with the workplace.
Among the training classified here: ergonomics (occupational health and safety), health and safety in the workplace, labour welfare (safety), occupational health and industrial hygiene, stress at work.
Source: Adapted from European Centre for the Development of Vocational Training and Eurostat (9).

Handbook on monitoring and evaluation of human resources for health
18
ISC
O-2
00
8IS
CO
-19
88
Gro
up
co
de
Occu
pa
tio
na
l ti
tle
Gro
up
co
de
Occu
pa
tio
na
l ti
tle
Sub-
maj
orM
inor
Un
itSu
b-m
ajor
Min
or
Unit
22
H
ea
lth
pro
fessio
na
ls2
2L
ife
scie
nce
an
d h
ea
lth
pro
fessio
na
ls
22
1
Me
dic
al
do
cto
rs2
22
He
alt
h p
rofe
ssio
na
ls (
exce
pt
nu
rsin
g)
22
11Ge
nera
list m
edic
al p
ract
ition
ers
2221
Med
ical
doc
tors
2212
Spec
ialis
t med
ical
pra
ctiti
oner
s
2
22
N
urs
ing
an
d m
idw
ife
ry p
rofe
ssio
na
ls2
23
Nu
rsin
g a
nd
mid
wif
ery
pro
fessio
na
ls
2221
Nurs
ing
prof
essi
onal
s22
30Nu
rsin
g an
d m
idw
ifery
pro
fess
iona
ls
2222
Mid
wife
ry p
rofe
ssio
nals
2
23
Tra
dit
ion
al
an
d c
om
ple
me
nta
ry m
ed
icin
e p
rofe
ssio
na
ls
2230
Trad
ition
al a
nd c
ompl
emen
tary
med
icin
e pr
ofes
sion
als
22
4
Pa
ram
ed
ica
l p
racti
tio
ne
rs
22
40Pa
ram
edic
al p
ract
ition
ers
22
6
Oth
er
he
alt
h p
rofe
ssio
na
ls2
22
He
alt
h p
rofe
ssio
na
ls (
exce
pt
nu
rsin
g)
2261
Dent
ists
2222
Dent
ists
2262
Phar
mac
ists
2224
Phar
mac
ists
2263
Envi
ronm
enta
l and
occ
upat
iona
l hea
lth a
nd h
ygie
ne p
rofe
ssio
nals
2264
Phys
ioth
erap
ists
2265
Diet
icia
ns a
nd n
utrit
ioni
sts
2266
Audi
olog
ists
and
spe
ech
ther
apis
ts
2267
Opto
met
rists
and
oph
thal
mic
opt
icia
ns
22
69He
alth
pro
fess
iona
ls n
.e.c
.22
29He
alth
pro
fess
iona
ls (e
xcep
t nur
sing
) n.e
.c.
32
H
ea
lth
asso
cia
te p
rofe
ssio
na
ls3
1P
hysic
al
an
d e
ng
ine
eri
ng
scie
nce
asso
cia
te p
rofe
ssio
na
ls
3
21
M
ed
ica
l a
nd
ph
arm
ace
uti
ca
l te
ch
nic
ian
s3
13
Op
tica
l a
nd
ele
ctr
on
ic e
qu
ipm
en
t o
pe
rato
rs
3211
Med
ical
imag
ing
and
ther
apeu
tic e
quip
men
t tec
hnic
ians
31
33M
edic
al e
quip
men
t ope
rato
rs
3212
Med
ical
and
pat
holo
gy la
bora
tory
tech
nici
ans
32
Lif
e s
cie
nce
an
d h
ea
lth
asso
cia
te p
rofe
ssio
na
ls
32
2M
od
ern
he
alt
h a
sso
cia
te p
rofe
ssio
na
ls (
exce
pt
nu
rsin
g)
3213
Phar
mac
eutic
al te
chni
cian
s an
d as
sist
ants
3228
Phar
mac
eutic
al a
ssis
tant
s
3214
Med
ical
and
den
tal p
rost
hetic
and
rela
ted
tech
nici
ans
Ta
ble
2.4
Occ
up
ati
ona
l ti
tles
rel
ate
d t
o h
ealt
h a
ccor
din
g t
o th
e In
tern
ati
ona
l St
an
da
rd C
lass
ifica
tion
of
Occ
up
ati
ons
(ISC
O),
198
8 a
nd
200
8 re
visi
ons
Cont
inue
s…
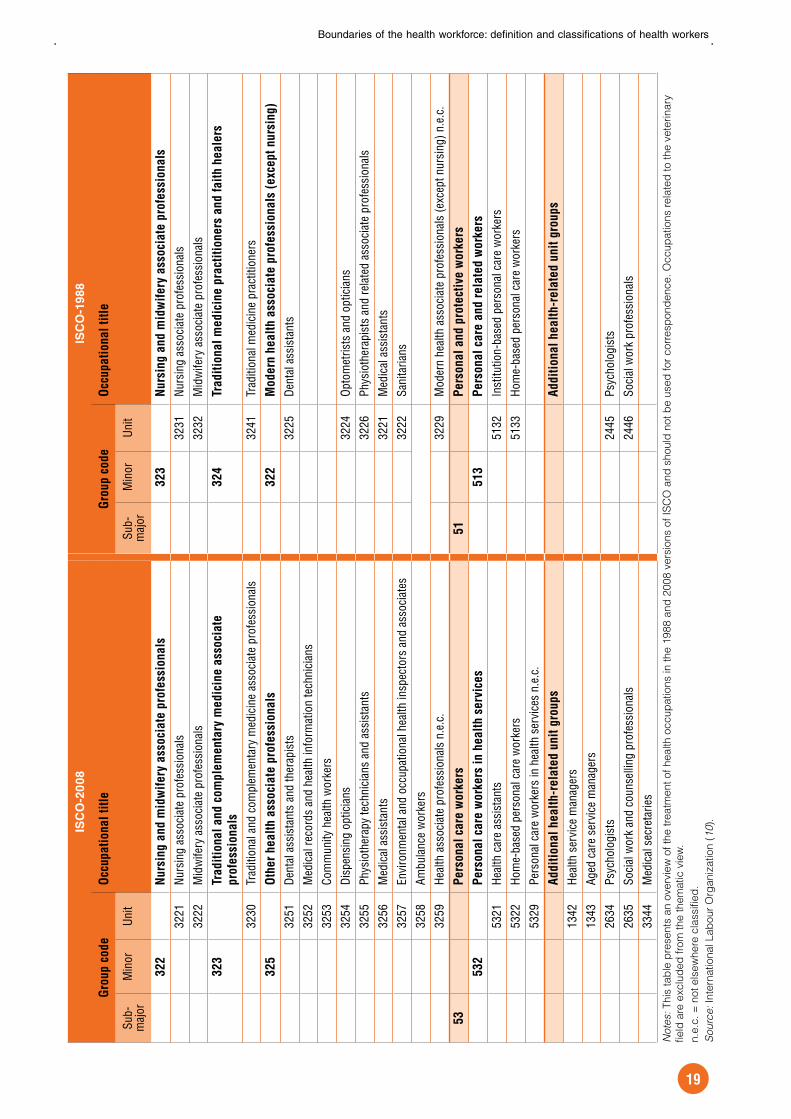
Boundaries of the health workforce: definition and classifications of health workers
19
ISC
O-2
00
8IS
CO
-19
88
Gro
up
co
de
Occu
pa
tio
na
l ti
tle
Gro
up
co
de
Occu
pa
tio
na
l ti
tle
Sub-
maj
orM
inor
Un
itSu
b-m
ajor
Min
or
Unit
3
22
N
urs
ing
an
d m
idw
ife
ry a
sso
cia
te p
rofe
ssio
na
ls3
23
Nu
rsin
g a
nd
mid
wif
ery
asso
cia
te p
rofe
ssio
na
ls
3221
Nurs
ing
asso
ciat
e pr
ofes
sion
als
3231
Nurs
ing
asso
ciat
e pr
ofes
sion
als
3222
Mid
wife
ry a
ssoc
iate
pro
fess
iona
ls32
32M
idw
ifery
ass
ocia
te p
rofe
ssio
nals
3
23
Tra
dit
ion
al
an
d c
om
ple
me
nta
ry m
ed
icin
e a
sso
cia
te
pro
fessio
na
ls
32
4Tr
ad
itio
na
l m
ed
icin
e p
racti
tio
ne
rs a
nd
fa
ith
he
ale
rs
3230
Trad
ition
al a
nd c
ompl
emen
tary
med
icin
e as
soci
ate
prof
essi
onal
s32
41Tr
aditi
onal
med
icin
e pr
actit
ione
rs
32
5
Oth
er
he
alt
h a
sso
cia
te p
rofe
ssio
na
ls3
22
Mo
de
rn h
ea
lth
asso
cia
te p
rofe
ssio
na
ls (
exce
pt
nu
rsin
g)
3251
Dent
al a
ssis
tant
s an
d th
erap
ists
3225
Dent
al a
ssis
tant
s
3252
Med
ical
reco
rds
and
heal
th in
form
atio
n te
chni
cian
s
3253
Com
mun
ity h
ealth
wor
kers
3254
Disp
ensi
ng o
ptic
ians
3224
Opto
met
rists
and
opt
icia
ns
3255
Phys
ioth
erap
y te
chni
cian
s an
d as
sist
ants
3226
Phys
ioth
erap
ists
and
rela
ted
asso
ciat
e pr
ofes
sion
als
3256
Med
ical
ass
ista
nts
3221
Med
ical
ass
ista
nts
3257
Envi
ronm
enta
l and
occ
upat
iona
l hea
lth in
spec
tors
and
ass
ocia
tes
3222
Sani
taria
ns
3258
Ambu
lanc
e w
orke
rs
3259
Heal
th a
ssoc
iate
pro
fess
iona
ls n
.e.c
.32
29M
oder
n he
alth
ass
ocia
te p
rofe
ssio
nals
(exc
ept n
ursi
ng) n
.e.c
.
53
Pe
rso
na
l ca
re w
ork
ers
51
Pe
rso
na
l a
nd
pro
tecti
ve
wo
rke
rs
53
2
Pe
rso
na
l ca
re w
ork
ers
in
he
alt
h s
erv
ice
s5
13
P
ers
on
al
ca
re a
nd
re
late
d w
ork
ers
5321
Heal
th c
are
assi
stan
ts51
32In
stitu
tion-
base
d pe
rson
al c
are
wor
kers
5322
Hom
e-ba
sed
pers
onal
car
e w
orke
rs51
33Ho
me-
base
d pe
rson
al c
are
wor
kers
5329
Pers
onal
car
e w
orke
rs in
hea
lth s
ervi
ces
n.e.
c.
Ad
dit
ion
al
he
alt
h-r
ela
ted
un
it g
rou
ps
Ad
dit
ion
al
he
alt
h-r
ela
ted
un
it g
rou
ps
1342
Heal
th s
ervi
ce m
anag
ers
1343
Aged
car
e se
rvic
e m
anag
ers
2634
Psyc
holo
gist
s24
45Ps
ycho
logi
sts
2635
Soci
al w
ork
and
coun
selli
ng p
rofe
ssio
nals
2446
Soci
al w
ork
prof
essi
onal
s
3344
Med
ical
sec
reta
ries
Note
s:
This
tab
le p
resents
an o
verv
iew
of th
e tre
atm
ent o
f health o
ccup
ations in the 1
988 a
nd
2008 v
ers
ions o
f IS
CO
and
should
not b
e u
sed
for
corr
esp
ond
ence. O
ccup
ations r
ela
ted
to the v
ete
rinary
field
are
exclu
ded
fro
m the them
atic v
iew
.
n.e
.c. =
not els
ew
here
cla
ssifi
ed
.
Sourc
e: In
tern
ational Lab
our
Org
aniz
ation (
10).

Handbook on monitoring and evaluation of human resources for health
20
2.3.3 Classification of branches of economic activityAs mentioned earlier, in addition to health-care service
providers, there are many non-health-trained work-
ers acting to keep health institutions functioning. It is
estimated that about one third of the global health work-
force is composed of health management and support
workers (4). Capturing them requires consideration of
occupations across almost all ISCO groups, so further
information on place of work may be required. The ISIC
classification can form a basis for such analysis, as it
allows pooling of information on workers in health serv-
ices across different types of economic systems within
a comparative framework (15). In ISIC, economic pro-
ducing units are grouped into successively broader
levels of classification in a four-level hierarchy: sections
(one-letter code), divisions (two-digit code), groups
(three-digit code) and classes (four-digit code). This
grouping is done according to similarities in the char-
acter of the goods and services produced, the uses to
which the goods and services are put, and the inputs,
process and technology of production.
Relevant information for health workforce analysis
essentially falls under ISIC division 86, “human health
activities”. Data available at the group (three-digit) or
class (four-digit) level will allow disaggregating the
different types of health systems activities, including
service provision, supplies procurement and financing.
Table 2.5 presents selected health-related categories
from the latest ISIC revision.
Table 2.5 Economic sectors related to health activities on the basis of the International Standard Industrial Classification of All Economic Activities (ISIC) Revision 4
Code Economic activity
Section Division Group Class
Core health industry groups and classes
Q Human health and social work activities
86 Human health activities
861 8610 Hospital activities
862 8620 Medical and dental practice activities
869 8690 Other human health activities
Selected associated classes
C 21 210 2100 Manufacture of pharmaceuticals, medicinal chemical and botanical products
32 325 3250 Manufacture of medical and dental instruments and supplies
E 36 360 3600 Water collection, treatment and supply
37 370 3700 Sewerage
G 47 477 4772 Retail sale of pharmaceutical and medical goods, cosmetic and toilet articles in specialized stores
K 65 651 6512 Non-life insurance (including provision of health insurance)
M 71 712 7120 Technical testing and analysis (include testing in the field of food hygiene; testing and measuring air and water pollution)
O 84 841 8412 Regulation of the activities of providing health care, education, cultural services and other social services
8430 Compulsory social security activities (including funding and administration of government-provided social security programmes for sickness, work-accident, temporary disablement, etc.)
Q 87 871 8710 Residential nursing care facilities
872 8720 Residential care activities for mental retardation, mental health and substance abuse
88 881 8810 Social work activities for the elderly and disabled (without accommodation)
Source: United Nations Statistics Division (15).
Boundaries of the health workforce: definition and classifications of health workers
21
2.3.4 Other classificationsIt is also of significance to countries and stakehold-
ers to be able to distinguish the different categories of
human resources within health systems, such as those
who are regular employees of the systems and those
who are not, or those whose basic salaries are drawn
from the government budget in comparison with health
workers who are funded by other sources. A full list of
international classifications for the collection and dis-
semination of economic and social statistics is available
at the United Nations Statistics Division web site (16).
2.4 Summary and conclusionsComparative health workforce analysis is meaningful
only when the available information is based on com-
mon definition and classification of health workers.
There is no single operational boundary of what con-
stitutes the health workforce. Many assessments use
country-specific or even tool-specific definitions and
titles that are not always comparable across countries
or over time. However, a growing number of coun-
tries are disseminating health labour data that can
be mapped to international standard classifications
– such as the International Standard Classification of
Education, the International Standard Classification of
Occupations, and the International Standard Industrial
Classification of All Economic Activities. These classifi-
cations provide a coherent framework for categorizing
key workforce variables (vocational training, occupation
and industry of employment, respectively) according to
shared characteristics. Using this trichotomy allows the
identification of people with training in health, of people
employed in health-related occupations, and of people
employed in health services industries.
Health workforce analyses can draw on data from
a number of sources, including standard statistical
sources outside the (traditional) health sector. Selected
tools for guiding the collection and coding of statisti-
cal information on economic activity from population
censuses and surveys can be found online at the hand-
books, guidelines and training manuals section of the
United Nations Statistics Division web site (17) (see
also 18, 19). The United Nations Statistics Division (20)
recommends the collection and processing of census
data on education, occupation and industry catego-
rized in accordance with, or in a manner convertible to,
the latest revision available of the relevant international
classification (i.e. ISCED, ISCO and ISIC, respec-
tively). It is further recommended that countries code
the collected responses at the lowest possible level of
classification detail supported by the information given.
In particular, in order to facilitate detailed and accurate
coding for occupation data, the questionnaire should
ask each active person for both the occupational title
and a brief description of the main tasks and duties
performed on the job. It is expected that possibilities for
health workforce analyses will be strengthened in the
current global series of censuses, known as the 2010
round (covering the period 2005 to 2014), which will
largely be able to exploit the new ISCO-08 revision.
For some countries, human resources for health anal-
yses based on population census and survey data
can be facilitated through collaborative research
projects aiming to harmonize microdata variables
and structures for public use. Key microdata provid-
ers include the Integrated Public Use Microdata Series
(21), the African Census Analysis Project (22) and the
Luxembourg Income Study (23). Such projects pro-
cess census and survey microdata series for multiple
countries – with education, occupation and indus-
try variables mapped where possible to ISCED, ISCO
and ISIC, respectively – and help disseminate the rele-
vant documentation for scholarly and policy research.
Chapter 8 of this Handbook presents a multicountry
analysis of health workforce statistics making use of the
Integrated Public Use Microdata Series (21). The analy-
sis draws on available occupational data from the 2000
round of censuses mapped to ISCO-88.
Even with ongoing improvement and revisions, given
their nature, standardized classifications are inherently
generalized and attempt to simplify a very complex
system for statistical purposes. They may not always
capture the full complexity and dynamics of the
health labour market. The World Health Organization,
International Labour Organization and other partners
are continually engaged in initiatives to improve inter-
national classifications relevant for health workforce
analysis and promote their use. This includes ongoing
enumeration of the various sources of data and types
of classifications used for monitoring health workers
(7). This may facilitate definitional harmonization of the
health workforce within and across countries, and be
used to develop a road map on how to improve health
workforce classifications at the national and interna-
tional levels. Such exercises continue to benefit from
exchanges and interactions among those that produce
and use this information from diverse perspectives,
including national governments (ministries of health,
labour and education, and central statistical offices),
health professional associations, WHO regional and
country offices, other international bodies with health
and statistical interests, nongovernmental and private
organizations working in health and statistics, and aca-
demic and research institutions.

Handbook on monitoring and evaluation of human resources for health
22
References1. Everybody’s business: strengthening health systems
to improve health outcomes – WHO’s framework
for action. Geneva, World Health Organization,
2007 (http://www.who.int/healthsystems/strategy/
everybodys_business.pdf, accessed 10 January
2009).
2. Anell A, Willis M. International comparison of health
care systems using resource profiles. Bulletin of the
World Health Organization, 2000, 78(6):770–778
(http://www.who.int/bulletin/archives/78(6)770.pdf,
accessed 10 January 2009).
3. Dal Poz MR et al. Relaciones laborales en el sector
salud: fuentes de informacion y metodos de analisis,
v. 1. Quito, Organizacion Panamericana de la Salud,
2000.
4. The world health report 2006: working together for
health. Geneva, World Health Organization, 2006
(http://www.who.int/whr/2006, accessed 10 January
2009).
5. Diallo K et al. Monitoring and evaluation of human
resources for health: an international perspective.
Human resources for health, 2003, 1:3 (http://
www.human-resources-health.com/content/1/1/3,
accessed 10 January 2009).
6. Hoffmann E. International statistical comparisons
of occupational and social structures: problems,
possibilities and the role of ISCO-88. In: Hoffmeyer-
Zlotnik JHP, Wolf C, eds. Advances in cross-national
comparison. New York, Kluwer Plenum Publishers,
2003.
7. Dal Poz MR et al. Counting health workers:
definitions, data, methods and global results.
Background paper prepared for The world health
report 2006. Geneva, World Health Organization,
2006 (http://www.who.int/hrh/documents/counting_
health_workers.pdf, accessed 10 January 2009).
8. International Standard Classification of Education:
ISCED 1997. Paris, United Nations Educational,
Scientific and Cultural Organization, 1997 (http://
www.uis.unesco.org/TEMPLATE/pdf/isced/
ISCED_A.pdf, accessed 10 January 2009).
9. Fields of training: manual. Thessaloniki, European
Centre for the Development of Vocational Training
and Eurostat, 1999 (http://www.trainingvillage.gr/etv/
Upload/Information_resources/Bookshop/31/5092_
en.pdf, accessed 10 January 2009).
10. International Standard Classification of Occupations.
International Labour Organization (http://www.ilo.org/
public/english/bureau/stat/isco/index.htm, accessed
11 January 2009).
11. Options for the classification of health occupations
in the updated International Standard Classification
of Occupations (ISCO-08). Background paper for
the work to update ISCO-88. Geneva, International
Labour Organization, 2006.
12. Lehmann U, Sanders D. Community health workers:
what do we know about them? Follow-up paper
to The world health report 2006. Geneva, World
Health Organization, 2007 (http://www.who.int/
hrh/documents/community_health_workers.pdf,
accessed 11 January 2009).
13. Methodological issues concerning the development,
use, maintenance and revision of statistical classifi-
cations. Geneva, International Labour Organization,
2004 (http://www.ilo.org/public/english/bureau/stat/
isco/docs/intro5.htm, accessed 11 January 2009).
14. Embury B. Constructing a map of the world of
work: how to develop the structure and contents of
a national standard classification of occupations.
STAT Working Paper No. 95–2. Geneva, International
Labour Office, 1997 (http://www.ilo.org/public/
english/bureau/stat/download/papers/map.pdf,
accessed 11 January 2009).
15. International Standard Industrial Classification of All
Economic Activities, fourth revision. Statistical Papers
Series M, No. 4/Rev.4. New York, United Nations
Statistics Division, 2008 (http://unstats.un.org/unsd/
demographic/sources/census/2010_PHC/docs/
ISIC_rev4.pdf, accessed 11 January 2009).
16. List of international family of economic and social
classifications. United Nations Statistics Division
(http://unstats.un.org/unsd/class/family/family1.asp,
accessed 11 January 2009).
17. Handbooks, guidelines and training manuals.
United Nations Statistics Division (http://unstats.
un.org/unsd/demographic/standmeth/handbooks/,
accessed 11 January 2009).
18. Hussmanns R, Mehran F, Verma V. Surveys of
economically active population, employment,
unemployment and underemployment: an ILO
manual on concepts and methods. Geneva,
International Labour Office, 1990.
19. Handbook on measuring the economically active
population and related characteristics in population
censuses. Studies in Methods Series F, No. 102.
New York, United Nations and International Labour
Organization, 2009 (http://unstats.un.org/unsd/
demographic/sources/census/Entire%20Handbook.
pdf, accessed 19 May 2009).
20. United Nations Statistics Division. Principles and
recommendations for population and housing
censuses, revision 2. Statistical Papers Series M, No.
67/Rev. 2. New York, United Nations, 2008 (http://
unstats.un.org/unsd/demographic/sources/census/
docs/P&R_Rev2.pdf, accessed 11 January 2009).
21. Integrated Public Use Microdata Series. Minnesota
Population Center (http://www.ipums.umn.edu/,
accessed 11 January 2009).
22. African Census Analysis Project. University of
Pennsylvania (http://www.acap.upenn.edu,
accessed 20 January 2009).
23. Luxembourg Income Study (http://www.lisproject.
org/, accessed 11 January 2009).

23
Part II: MONITORING THE STAGES OF THE WORKING LIFESPAN


25
Monitoring the active health workforce: indicators, data sources and illustrative analysis
FELIX RIGOLI, BOB POND, NEERU GUPTA, CHRISTOPHER H HERBST
3.1 IntroductionHuman resources for health (HRH) have long been
recognized as “the cornerstone of the [health] sec-
tor to produce, deliver, and manage services” (1).
Assessments of HRH are required for various pur-
poses, notably for planning, implementing, monitoring
and evaluating health sector strategies, programmes
and interventions. The importance of sound empir-
ical evidence for informed policy decision-making
and monitoring of progress in strengthening health
workforce development and management is widely
recognized. Precisely describing HRH can help to
identify opportunities and constraints for scaling up
health interventions.
The size and distribution of the health workforce is
the result of the inflow into, outflow from and circu-
lation of workers between, for example, different
sectors (public or private), industries (health services
or other), regions (rural or urban), countries and sta-
tuses (employed, unemployed or inactive) (Figure 3.1).
Various permutations and combinations of what consti-
tutes the health workforce potentially exist, depending
on each country’s situation and the means of monitor-
ing. A framework for harmonizing the boundaries and
constituency of the health workforce across contexts is
presented in Chapter 2 of this Handbook. To facilitate
data collection and analysis processes, it is important
to focus on a limited and essential number of indica-
tors that are comparable and measurable regularly
using standard data sources (2). Such data sources
include population-based sources (censuses and sur-
veys), health facility assessments and administrative
records. For specialized or in-depth HRH assessments,
information can further be drawn from, for example, pro-
fessional registries, national health accounts, records
of health education and training institutes, and qualita-
tive studies.
The development of a comprehensive evidence base
generally requires combining different types of infor-
mation that may exist, frequently scattered across
different sources. This chapter focuses on describing
3
Figure 3.1 Stocks and flows of the health workforce
Pre-entry to labour force
Training in health-related field
Training in non-health field
No formal training
Migration
Health sector
Non-health sector
Unemployed
Health-related tasks
Non-health-related tasks
Rural
Public
Salaried
Full time
Patient care
Urban
Private
Self-employed
Part time
Administrative or other tasks
Retirement
Work-limiting disability of death
Other reasons(e.g. family care)
Labour force activityExit from
labour force
Handbook on monitoring and evaluation of human resources for health
26
the tools and means to monitor the active health work-
force, that is, all people currently participating in the
health labour market. Core indicators for characterizing
HRH are first identified, with an emphasis on optimiz-
ing comparability across countries and over time. Key
potential sources of data are then reviewed; both pri-
mary sources and standard statistical sources are
examined, and the opportunities and challenges they
offer for health workforce analysis are considered.
Illustrative examples are presented, using case stud-
ies from various countries and sources. Lastly, some
lessons learnt and recommendations for strengthening
HRH information and monitoring systems within coun-
tries are discussed. The present chapter is primarily
devoted to monitoring current health workforce activity;
measurements of entry (notably, pre-service education
and training) and exit (attrition due to various factors,
including migration, retirement and death) are the focus
of the next two chapters in this Handbook, respectively.
3.2 Core indicators for HRH analysis: what needs to be monitored?Effective monitoring and evaluation of HRH in coun-
tries requires agreement upon a core set of indicators
at the subnational, national and international levels to
inform decision-making among national authorities
and other stakeholders. Ideally, the indicators retained
should be characterized by “SMART” properties: spe-
cific (measures exactly the result); measurable (so
that the result can be tracked); attainable (so that the
result can be compared against a realistic target); rele-
vant (to the intended result); and timebound (indicates
a specific time period). The ongoing and consistent
measurement of these indicators allows monitoring of
how HRH-related programmes and policies are being
implemented. Once the baseline data have been gen-
erated, an evaluation framework can be established
with periodic targets for analysis in terms of change
and progress over time, that is, whether activities have
been implemented in the right direction in accordance
with the original plans and strategic objectives.
Table 3.1 presents a series of indicators that, when sys-
tematically measured, can be used to track the active
health workforce (2, 3). At the most basic, there is a
need to know how many people are working in the field
of health, their characteristics and distribution. In con-
sidering the size of a country’s health workforce at a
given moment, or measuring the stock of health work-
ers, it is crucial to distinguish whether the snapshot
includes workers employed at health-care facilities
(differentiating between those on facility duty rosters
versus those physically headcounted on the day of
the assessment), persons having been educated in a
health-related field regardless of place of employment,
or persons having been educated in a health-related
field regardless of current labour force status.
Measuring the skills mix of the health workforce offers
a means to assess the combination of categories
of personnel at a specific time and identify possible
imbalances related to a disparity in the numbers of vari-
ous health occupations. Statistics on skills mix can help
inform strategies to ensure the most appropriate and
cost-effective combination of roles and staff. Because
counts of workers in the private sector are likely to be
less accurate when drawing on administrative data
sources than counts of those in the public sector,
and because private for-profit providers are often less
accessible to low-income populations, it is also rec-
ommended that indicators be used to monitor workers’
employment sector (public, private for-profit or private
not-for-profit).
As detailed in the previous chapter, comprehensive
assessments require accurate information on occupa-
tion, industry and training. Drawing upon a combination
of these types of information will enable the identi-
fication of, for example, employment in non-health
activities among those with a health-related educa-
tion, and employment in health activities with jobs that
do not require clinical skills (see Chapter 2). Additional
indicators on labour productivity, unemployment and
underemployment, and emigration, for instance, will
allow monitoring of workforce wastage, or excess loss
in utility due to attrition or poor productivity that could
have been prevented or managed (4). Health workforce
metrics, or measurements of particular characteris-
tics of performance or efficiency of HRH development
strategies, can further be assessed by means of indi-
cators on HRH renewal and migration (2).
Comparability of HRH statistics across countries and
over time can be enhanced through the setting and
use of common definitions and classifications for mon-
itoring the labour market. This includes the collection,
processing and dissemination of data following inter-
nationally standardized classifications, including the
International Standard Classification of Occupations
(ISCO), the International Standard Industrial
Classification of All Economic Activities (ISIC), the
International Standard Classification of Education
(ISCED) and the International Classification of Status in
Employment (ICSE).
Depending on the data source used, indicators on
HRH may be disaggregated by selected character-
istics for further analysis. Disaggregation of relevant
indicators allows for monitoring progress in health

Monitoring the active health workforce: indicators, data sources and illustrative analysis
27
worker training, recruitment and management policies
among underserved communities or other nationally
prioritized population groups. Disaggregating infor-
mation on earned income among health workers by
sex, for example, can be useful for monitoring gen-
der gap in occupational earnings. Stratification of
workforce statistics by district, province or region is
particularly important for monitoring equity of geo-
graphical access to health services. HRH renewal
can be indirectly assessed through the age distribu-
tion of the active health workforce, notably in terms of
the ratio of younger workers (under 30 years) to those
close to retirement age.Depending on the nature of the
indicator and the data source, an evaluation of HRH
programmes and policies can be carried out in the
short, medium or longer terms. For example, certain
aspects of HRH dynamics are only likely to change to
a significant degree over the long term, such as the
production of physicians over at least a decade or so,
given the lengthy pre-service training requirements for
this category of health workers.
3.3 Overview of potential data sourcesPolicies and programmes for the health sector should
be informed by timely, reliable and valid data. Despite
a prevailing view that statistics on the health workforce
are scarce, diverse sources that can potentially pro-
duce relevant information exist even in low-income
countries, including population censuses and sur-
veys, facility assessments and routine administrative
records. There are strengths and limitations to each
source that need to be evaluated (Table 3.2) (2, 5).
Drawing upon a combination of these complementary
tools can result in useful and rich information for mon-
itoring and evaluation of the health workforce and its
impact in health systems.
All countries collect at least some data on their popu-
lation, mainly through periodic demographic censuses
and household sample surveys that produce statistical
information about people, their homes, their socio-
economic conditions and other characteristics. Most
censuses and labour force surveys ask for the occu-
pation of the respondent (and other adult household
members) along with other demographic characteris-
tics, including age, sex and educational attainment.
Labour force surveys generally delve into greater details
on, for example, place of work, industrial sector, remu-
neration, time worked and secondary employment (6).
Many meaningful results pertinent to HRH analysis can
be produced through tabulation of population-based
data on labour activity. Other kinds of national house-
hold surveys can also provide relevant information;
for example, surveys with questions on care-seeking
behaviour have been used to help understand how fac-
tors such as demographics, health insurance coverage
and distance to a health facility influence not only cli-
ents’ choice of whether or not to seek the services of
a health-care provider, but also from whom services
have been obtained (for example public or private sec-
tor, formal or informal provider).
Health facility assessments can be conducted using
different sampling approaches (establishment census
or sample survey) and methodologies (self-admin-
istered postal, fax or Internet-based questionnaire;
telephone or face-to-face interview). Depending on the
nature of the data collection procedures and instru-
ments, in-depth information can be obtained on health
workforce metrics, for instance, in-service training and
provider productivity. In addition, the nature of facility-
based assessments facilitates the collection of data for
numerous other indicators pertinent to health system
performance assessment, such as infrastructure, avail-
ability of supplies and costs (7).
In many countries, the computerization of administra-
tive records – including public expenditure, staffing
and payroll, work permits, trade union memberships
and social security records – is greatly facilitating the
possibilities for HRH analysis. Many skilled health-
care providers require formal training, registration and
licensure to practise their occupation; as such, the
administrative records of health training institutions
and professional licensing bodies are potentially valu-
able sources for tracking the health workforce. These
sources offer the advantage of producing continuously
updated statistics. In addition, depending on the char-
acteristics of the registries, notably whether individuals
are assigned a unique identifier, it may be possible to
track workers’ labour force entry, career progression
and exit.
The fundamental challenges for data compilation,
analysis and use include identification of appropri-
ate sources and gaining timely access to the data (2).
Other issues include the decision whether to com-
plement existing sources with new data collection
activities, such as a specialized (quantitative or qual-
itative) study of health human resources. In particular,
periodic health sector-specific labour surveys can pro-
vide more detailed information, which can typically be
disaggregated to a finer detail for distinct categories
of health workers compared to general labour force
surveys. Mobilizing the required resources (human,
technical and financial) for specialized HRH data col-
lection activities can often be difficult, especially in
low-income countries, but the instruments can be cus-
tomized to gather in-depth information on almost any
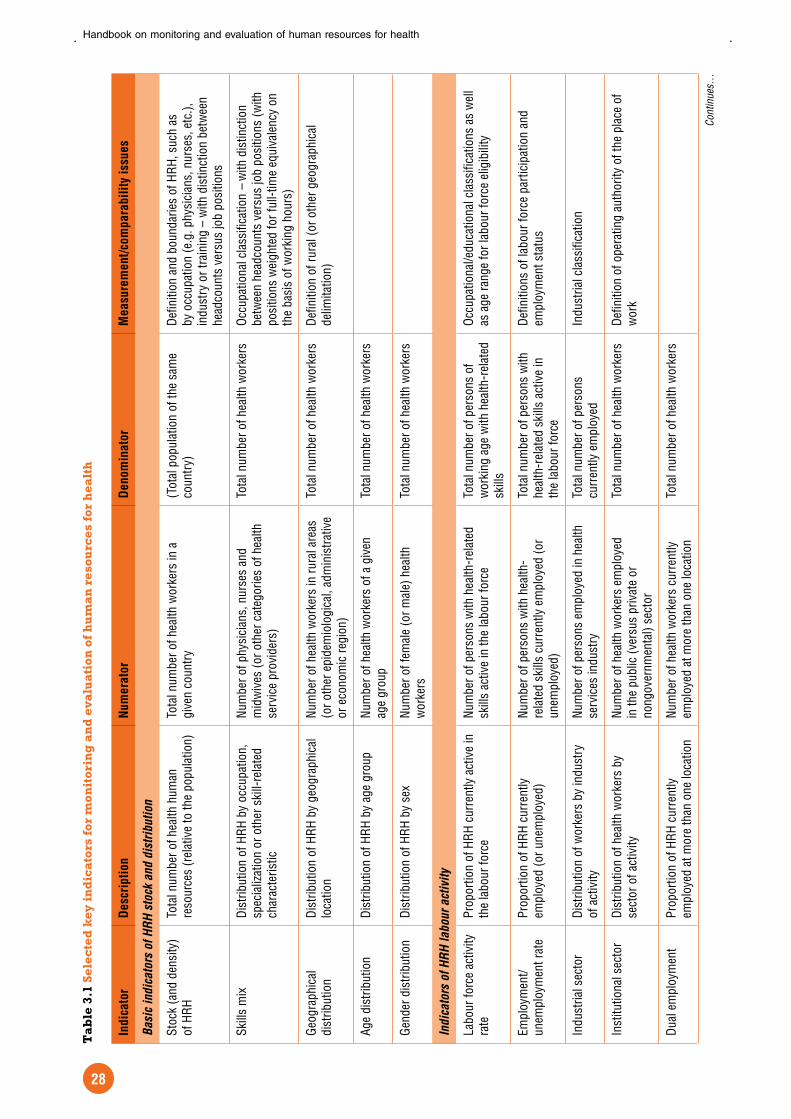
Handbook on monitoring and evaluation of human resources for health
28
Ind
ica
tor
De
scri
pti
on
Nu
me
rato
r D
en
om
ina
tor
Me
asu
rem
en
t/co
mp
ara
bil
ity i
ssu
es
Basi
c in
dic
ato
rs o
f H
RH
sto
ck a
nd d
istr
ibuti
on
Stoc
k (a
nd d
ensi
ty)
of H
RHTo
tal n
umbe
r of h
ealth
hum
an
reso
urce
s (r
elat
ive
to th
e po
pula
tion)
Tota
l num
ber o
f hea
lth w
orke
rs in
a
give
n co
untr
y (T
otal
pop
ulat
ion
of th
e sa
me
coun
try)
Defin
ition
and
bou
ndar
ies
of H
RH, s
uch
as
by o
ccup
atio
n (e
.g. p
hysi
cian
s, n
urse
s, e
tc.),
in
dust
ry o
r tra
inin
g –
with
dis
tinct
ion
betw
een
head
coun
ts v
ersu
s jo
b po
sitio
ns
Skill
s m
ixDi
strib
utio
n of
HRH
by
occu
patio
n,
spec
ializ
atio
n or
oth
er s
kill-
rela
ted
char
acte
ristic
Num
ber o
f phy
sici
ans,
nur
ses
and
mid
wiv
es (o
r oth
er c
ateg
orie
s of
hea
lth
serv
ice
prov
ider
s)
Tota
l num
ber o
f hea
lth w
orke
rsOc
cupa
tiona
l cla
ssifi
catio
n –
with
dis
tinct
ion
betw
een
head
coun
ts v
ersu
s jo
b po
sitio
ns (w
ith
posi
tions
wei
ghte
d fo
r ful
l-tim
e eq
uiva
lenc
y on
th
e ba
sis
of w
orki
ng h
ours
)
Geog
raph
ical
di
strib
utio
nDi
strib
utio
n of
HRH
by
geog
raph
ical
lo
catio
nNu
mbe
r of h
ealth
wor
kers
in ru
ral a
reas
(o
r oth
er e
pide
mio
logi
cal,
adm
inis
trativ
e or
eco
nom
ic re
gion
)
Tota
l num
ber o
f hea
lth w
orke
rsDe
finiti
on o
f rur
al (o
r oth
er g
eogr
aphi
cal
delim
itatio
n)
Age
dist
ribut
ion
Dist
ribut
ion
of H
RH b
y ag
e gr
oup
Num
ber o
f hea
lth w
orke
rs o
f a g
iven
ag
e gr
oup
Tota
l num
ber o
f hea
lth w
orke
rs
Gend
er d
istri
butio
nDi
strib
utio
n of
HRH
by
sex
Num
ber o
f fem
ale
(or m
ale)
hea
lth
wor
kers
Tota
l num
ber o
f hea
lth w
orke
rs
Indic
ato
rs o
f H
RH
labour
act
ivit
y
Labo
ur fo
rce
activ
ity
rate
Prop
ortio
n of
HRH
cur
rent
ly a
ctiv
e in
th
e la
bour
forc
e Nu
mbe
r of p
erso
ns w
ith h
ealth
-rel
ated
sk
ills
activ
e in
the
labo
ur fo
rce
Tota
l num
ber o
f per
sons
of
wor
king
age
with
hea
lth-r
elat
ed
skill
s
Occu
patio
nal/e
duca
tiona
l cla
ssifi
catio
ns a
s w
ell
as a
ge ra
nge
for l
abou
r for
ce e
ligib
ility
Empl
oym
ent/
unem
ploy
men
t rat
ePr
opor
tion
of H
RH c
urre
ntly
em
ploy
ed (o
r une
mpl
oyed
)Nu
mbe
r of p
erso
ns w
ith h
ealth
-re
late
d sk
ills
curr
ently
em
ploy
ed (o
r un
empl
oyed
)
Tota
l num
ber o
f per
sons
with
he
alth
-rel
ated
ski
lls a
ctiv
e in
th
e la
bour
forc
e
Defin
ition
s of
labo
ur fo
rce
parti
cipa
tion
and
empl
oym
ent s
tatu
s
Indu
stria
l sec
tor
Dist
ribut
ion
of w
orke
rs b
y in
dust
ry
of a
ctiv
ityNu
mbe
r of p
erso
ns e
mpl
oyed
in h
ealth
se
rvic
es in
dust
ryTo
tal n
umbe
r of p
erso
ns
curr
ently
em
ploy
edIn
dust
rial c
lass
ifica
tion
Inst
itutio
nal s
ecto
rDi
strib
utio
n of
hea
lth w
orke
rs b
y se
ctor
of a
ctiv
ityNu
mbe
r of h
ealth
wor
kers
em
ploy
ed
in th
e pu
blic
(ver
sus
priv
ate
or
nong
over
nmen
tal)
sect
or
Tota
l num
ber o
f hea
lth w
orke
rsDe
finiti
on o
f ope
ratin
g au
thor
ity o
f the
pla
ce o
f w
ork
Dual
em
ploy
men
tPr
opor
tion
of H
RH c
urre
ntly
em
ploy
ed a
t mor
e th
an o
ne lo
catio
nNu
mbe
r of h
ealth
wor
kers
cur
rent
ly
empl
oyed
at m
ore
than
one
loca
tion
Tota
l num
ber o
f hea
lth w
orke
rs
Ta
ble
3.1
Sel
ecte
d k
ey i
nd
ica
tors
for
mon
itor
ing
an
d e
valu
ati
on o
f h
um
an
res
ourc
es f
or h
ealt
h
Cont
inue
s…

Monitoring the active health workforce: indicators, data sources and illustrative analysis
29
Ind
ica
tor
De
scri
pti
on
Nu
me
rato
r D
en
om
ina
tor
Me
asu
rem
en
t/co
mp
ara
bil
ity i
ssu
es
Occu
patio
nal
earn
ings
and
in
com
e
Aver
age
occu
patio
nal e
arni
ngs
and
inco
me
amon
g he
alth
wor
kers
Tota
l inc
ome
from
labo
ur o
ver a
gi
ven
perio
d (fr
om w
ages
, pra
ctic
e or
bu
sine
ss) a
mon
g he
alth
wor
kers
Tota
l num
ber o
f hea
lth w
orke
rsDi
stin
ctio
n be
twee
n ne
t/gro
ss in
com
e, s
ourc
es
of in
com
e, n
on-m
onet
ary
bene
fits,
as
wel
l as
defi
nitio
n of
refe
renc
e pe
riod
for i
ncom
e re
porti
ng
Indic
ato
rs o
f H
RH
pro
duct
ivit
y
Abse
ntee
ism
Days
of a
bsen
teei
sm a
mon
g he
alth
w
orke
rsNu
mbe
r of d
ays
of e
mpl
oyee
abs
ence
s ov
er a
giv
en p
erio
d in
the
heal
th
wor
kpla
ce
Tota
l num
ber o
f sch
edul
ed
wor
king
day
s am
ong
empl
oyee
s ov
er th
e sa
me
perio
d in
the
sam
e pl
ace
Delim
itatio
n an
d re
porti
ng o
f cau
ses
of
abse
ntee
ism
(e.g
. dut
y ab
senc
e, s
ickn
ess
or
othe
r em
erge
ncy
leav
e, m
ater
nity
or p
aren
tal
leav
e, u
naut
horiz
ed a
bsen
ce)
Prov
ider
pr
oduc
tivity
Rela
tive
num
ber o
f spe
cific
task
s pe
rfor
med
am
ong
heal
th w
orke
rs
Spec
ific
task
s pe
rfor
med
ove
r a
give
n pe
riod
(e.g
. am
bula
tory
vis
its,
imm
uniza
tions
, sur
gerie
s) b
y a
give
n he
alth
ser
vice
pro
vide
r
Tota
l num
ber o
f spe
cific
task
s pe
rfor
med
ove
r the
sam
e pe
riod
amon
g al
l hea
lth s
ervi
ce
prov
ider
s
Delim
itatio
n of
task
s in
term
s of
qua
ntity
/qua
lity
Indic
ato
rs o
f H
RH
renew
al
and l
oss
Wor
kfor
ce
gene
ratio
n ra
tioRa
tio o
f ent
ry to
the
heal
th w
orkf
orce
Num
ber o
f gra
duat
es o
f hea
lth
prof
essi
ons
educ
atio
n in
stitu
tions
in th
e la
st y
ear
Tota
l num
ber o
f hea
lth w
orke
rs
Educ
atio
nal c
lass
ifica
tion
as w
ell a
s pr
oces
ses
of
prof
essi
onal
cre
dent
ialin
g/ d
eplo
ymen
t for
new
gr
adua
tes
Natio
nal H
RH
self-
suffi
cien
cyPr
opor
tion
of n
atio
nally
trai
ned
heal
th w
orke
rsNu
mbe
r of h
ealth
wor
kers
who
rece
ived
th
eir p
rofe
ssio
nal t
rain
ing
in th
e re
fere
nce
coun
try
Tota
l num
ber o
f tra
ined
hea
lth
wor
kers
in th
e sa
me
coun
try
Occu
patio
nal/e
duca
tiona
l cla
ssifi
catio
ns a
cros
s th
e co
untr
y of
orig
in a
nd re
ceiv
ing
coun
try
for
fore
ign-
educ
ated
wor
kers
Wor
kfor
ce lo
ss ra
tioRa
tio o
f exi
ts fr
om th
e he
alth
w
orkf
orce
Num
ber o
f hea
lth w
orke
rs w
ho le
ft th
e ac
tive
labo
ur fo
rce
in th
e la
st y
ear
Tota
l num
ber o
f hea
lth w
orke
rs
Delim
itatio
n an
d re
porti
ng o
f rea
sons
for e
xit
(e.g
. ret
irem
ent,
mor
talit
y, o
ut-m
igra
tion,
car
eer
brea
k or
cha
nge)
So
urc
es: A
dap
ted
fro
m D
iallo
et al. (
2)
and
WH
O a
nd
Un
ivers
ity o
f Te
chnolo
gy S
yd
ney (
3).
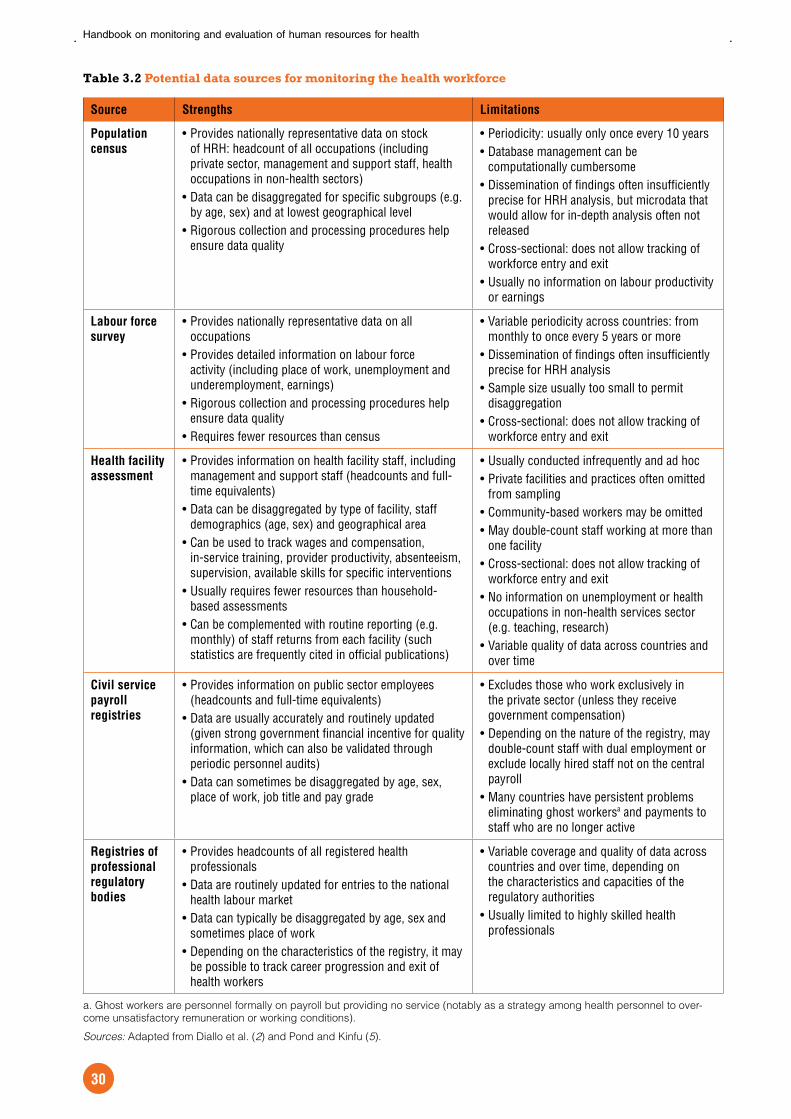
Handbook on monitoring and evaluation of human resources for health
30
Table 3.2 Potential data sources for monitoring the health workforce
Source Strengths Limitations
Population
census
Provides nationally representative data on stock of HRH: headcount of all occupations (including private sector, management and support staff, health occupations in non-health sectors)Data can be disaggregated for specific subgroups (e.g. by age, sex) and at lowest geographical levelRigorous collection and processing procedures help ensure data quality
Periodicity: usually only once every 10 yearsDatabase management can be computationally cumbersomeDissemination of findings often insufficiently precise for HRH analysis, but microdata that would allow for in-depth analysis often not releasedCross-sectional: does not allow tracking of workforce entry and exitUsually no information on labour productivity or earnings
Labour force
survey
Provides nationally representative data on all occupationsProvides detailed information on labour force activity (including place of work, unemployment and underemployment, earnings)Rigorous collection and processing procedures help ensure data qualityRequires fewer resources than census
Variable periodicity across countries: from monthly to once every 5 years or moreDissemination of findings often insufficiently precise for HRH analysisSample size usually too small to permit disaggregationCross-sectional: does not allow tracking of workforce entry and exit
Health facility
assessment
Provides information on health facility staff, including management and support staff (headcounts and full-time equivalents)Data can be disaggregated by type of facility, staff demographics (age, sex) and geographical areaCan be used to track wages and compensation, in-service training, provider productivity, absenteeism, supervision, available skills for specific interventionsUsually requires fewer resources than household-based assessmentsCan be complemented with routine reporting (e.g. monthly) of staff returns from each facility (such statistics are frequently cited in official publications)
Usually conducted infrequently and ad hocPrivate facilities and practices often omitted from samplingCommunity-based workers may be omittedMay double-count staff working at more than one facilityCross-sectional: does not allow tracking of workforce entry and exitNo information on unemployment or health occupations in non-health services sector (e.g. teaching, research)Variable quality of data across countries and over time
Civil service
payroll
registries
Provides information on public sector employees (headcounts and full-time equivalents)Data are usually accurately and routinely updated (given strong government financial incentive for quality information, which can also be validated through periodic personnel audits)Data can sometimes be disaggregated by age, sex, place of work, job title and pay grade
Excludes those who work exclusively in the private sector (unless they receive government compensation)Depending on the nature of the registry, may double-count staff with dual employment or exclude locally hired staff not on the central payrollMany countries have persistent problems eliminating ghost workersa and payments to staff who are no longer active
Registries of
professional
regulatory
bodies
Provides headcounts of all registered health professionalsData are routinely updated for entries to the national health labour marketData can typically be disaggregated by age, sex and sometimes place of workDepending on the characteristics of the registry, it may be possible to track career progression and exit of health workers
Variable coverage and quality of data across countries and over time, depending on the characteristics and capacities of the regulatory authoritiesUsually limited to highly skilled health professionals
a. Ghost workers are personnel formally on payroll but providing no service (notably as a strategy among health personnel to over-
come unsatisfactory remuneration or working conditions).
Sources: Adapted from Diallo et al. (2) and Pond and Kinfu (5).

Monitoring the active health workforce: indicators, data sources and illustrative analysis
31
variable of interest. An overall strategy of cross-exam-
ination or triangulation across different data sources
and using different methodologies can be used to
monitor consistency and validity of results, optimize
the information and evidence retrieved, and ultimately
provide better-quality measurements of health work-
force characteristics (see also Chapter 11). Given the
diversity of information sources, it is especially impor-
tant that data dissemination includes the metadata – or
details on the definition, construction and coverage of
each data point (literally: data about data) – in order to
help understand the background of the information and
judge its appropriateness for the decision at hand (8).
3.4 Illustrative analysisHow a health or health system challenge is perceived
affects how related data are organized and presented
to support decision-making. Even the most robust
research findings may fail to reach policy- and deci-
sion-makers unless they are presented in a way that
they can understand and use. A critical aspect of HRH
assessment is the identification and critical review of
data from the most appropriate source(s), and synthe-
sis and presentation based on the construction of a
few relevant indicators. The final presentation of data
will vary depending on the users’ needs in terms of the
level of detail and technical specificity required. It has
been suggested that graphs and maps can display
information in a form more easily understood among
non-specialist audiences (9, 10).
For instance, if imbalance in the geographical distri-
bution of health personnel is considered a constraint
to health systems strengthening – as it is in almost
all countries (11) – the information should show the
nuances of that distribution, for example by highlighting
regions of the country with higher versus lower densi-
ties of health workers. In addition to being a nationally
representative data source, population censuses offer
an advantage in terms of sample sizes that allow for
disaggregation at the subnational level. Census-based
data on occupation can be used to map maldistribution
in the health workforce, as exemplified in Figure 3.2 for
two countries. Such data can also be used to calculate
a range of summary measures of workforce imbalance,
such as the Gini coefficient or other indices of relative
inequality (12, 13).
Given the relatively long periodicity of censuses (usu-
ally once every 10 years), an examination of labour
force dynamics for shorter term HRH planning and pol-
icy monitoring might be better addressed by drawing
Figure 3.2 Geographical distribution of the stock of health workers (per 100 000 inhabitants), Viet Nam and Mexico censuses
Source: Gupta et al. (12).
Viet Nam,1999
<175175–249250–324325+
Mexico, 2000
<350350–549550–749750+

Handbook on monitoring and evaluation of human resources for health
32
on survey data. Figure 3.3 presents time trends in
the mix of workers in health services by broad occu-
pational group in Namibia, drawing on results from
repeated labour force surveys (14). Labour force and
employment surveys offer the advantage of being able
to grid health management and support workers, a
group often overlooked in HRH analyses but critical to
the functioning of health systems. On the other hand,
disaggregation for specific subgroups might be con-
strained due to sample size limitations, especially in
many low-income countries facing the most serious
health worker shortages. Based on statistics from the
Global atlas of the health workforce (15), even a larger-
scale survey (for example sample size in the vicinity
of 0.6% of the total population) would identify only a
small number of health professionals in most of the 50
countries with the lowest density of medical person-
nel: fewer than 20 physicians in three quarters of these
countries, and fewer than 20 nurses in half of them.
Where the existing data remain inadequate (notably
from sources outside the health sector), a well-designed
and carried-out health facility assessment may obtain
more detailed data for an HRH situation analysis.
Assessments that collect information at both the level
of the facility and of the worker offer a unique opportu-
nity for measuring certain labour market indicators. In
the example given (Figure 3.4), a health facility assess-
ment in Rwanda collected data on facility ownership
and employee salary source, allowing cross-reference
of the proportion of staff working in facilities classified
in a given sector but on the payroll of another. Such a
distinction is often not made but is crucial for accurate
statements on health labour metrics, for example, work-
ers in public sector facilities are often (imprecisely) all
counted as public sector employees (16).
Lastly, Figure 3.5 presents a synthesis of findings on
nurse demographics and workforce capacity cap-
italizing on the development of an electronic nursing
workforce database in Kenya. The database con-
tains some 40 000 administrative records covering a
45-year span from the national nursing regulatory body
(17). The analyses gleaned from the data indicate the
dominance of enrolled nurses compared to their reg-
istered counterparts with more specialized training, as
well as the feminization of the profession – except at
the most highly skilled level, that is, among those with
a Bachelor of Science degree in nursing. At the same
time, the quality of information derived from this source
must be called into question; while nursing licensure
and renewal are mandatory in Kenya for both the pub-
lic and private sectors, the database does not track
exits by death, out-migration or retirement. The need
to improve completeness and timeliness of available
data, notably for monitoring stock and flows of health
workers, is present in virtually all HRH information sys-
tems, and may be even more urgent in most low- and
middle-income countries, given the status of their
workforce situation.
Figure 3.4 Distribution of health workers’ salaries by source, according to facility owner-ship, Rwanda health facility assessment, 2006
Source: Herbst and Gijsbrechts (16).
Figure 3.3 Trends in the distribution of workers in health services by main occupational group, Namibia labour force surveys, 1997–2004
Source: Institute for Public Policy Research (14).
N=10 650
N=13 136 N=14 010
0
2
4
6
8
10
12
14
1997 2000 2004
Wor
kers
in h
ealth
ser
vice
s in
dust
ry
(thou
sand
s)
Professionals
Technicians & associate professionals
Managers, clerks & others
20%27% 24%
38%
21% 40%
42%
52%36%
56%66%
19% 22%
11% 14% 12%
70%
30%
0%
20%
40%
60%
80%
100%
So
urce
of
heal
th w
ork
ers'
sal
arie
s
Government / Ministry of Health
Faith-based organizations
Total
Facility operating authority
Nongovernmental organizationFaith-based organizationGovernment / Ministry of Health

Monitoring the active health workforce: indicators, data sources and illustrative analysis
33
3.5 Putting it all together: governance and use of HRH information sourcesIncreasing attention is being paid at the national and
international levels to the need for new and improved
information for planning and monitoring HRH devel-
opment as a core parameter of health systems
strengthening. However, in many countries, informa-
tion on the health workforce is fragmented, inadequate
and not timely. Statistics generated by various sources
receive limited public dissemination and are generally
underused. Moreover, even in countries where good
and reliable data are available, the information is not
always used for decision-making.
Often, limited human, technical and financial resources
contribute to the current poor status of information and
evidence on the health workforce situation. In most
low- and middle-income countries, information and
communications technologies (for example computer
hardware and software applications for the manipu-
lation and communication of information) needed for
implementing a comprehensive HRH information sys-
tem are sorely lacking. At the same time, strengthening
HRH information systems means attention to each of
its components – not just the infrastructure and tech-
nology, but also the persons needed to capture and
use the data. Dedicated health information staff are
needed at the national and subnational levels (and
even at larger facilities) for data collection, process-
ing, reporting and analysis. Training may be required
among those providing information to decision-makers
to strengthen analytical and presentation skills. Training
among policy-makers and their aides could also help
them to better identify and use high-quality research.
Support for a centralized national HRH database
(for example at the ministry of health) is among the
potentially effective means to enhance national
monitoring and evaluation performance (18). The coor-
dinating mechanism for this unit will ideally function in
the following capacities: ongoing assessment of data
availability and quality; data management, analysis and
synthesis; generation of national indicators estimates;
information and research dissemination; advocacy
and communication of HRH monitoring and evalua-
tion efforts; coordination, supportive supervision and
capacity building among state or provincial and district
monitoring and evaluation offices; and coordination with
international partners and other stakeholders. The unit
may be involved in developing and costing the national
HRH monitoring and evaluation strategy, and drafting
terms of reference for technical consultancy input. At
the decentralized level, activities of regional and dis-
trict monitoring and evaluation officers may include
maintaining an updated registry of all health facilities
and health service providers; collecting routine data
on health workers from various health and non-health
sources; conducting basic data analysis; and reporting
data and facilitating its use for decision-making.
While there is no single best model of what a health
workforce information and monitoring system should
look like, much depends on the main reasons for
building such a system. An important consideration is
planning and monitoring of the monitoring system itself
(19). This includes delineating, as part of the process
of setting up and using the system, not only its contents
but also its ownership and accessibility, as well as the
mechanisms for maintaining data security and regular
updating. A key challenge is ensuring the information
needs of all stakeholders are being met, from the inter-
national to district level, while also being realistic about
ability to operationalize the system. The set of indicators
proposed earlier in Table 3.1 is neither exhaustive nor
absolute. Rather, it is an attempt to build a framework
for HRH monitoring and evaluation focusing on globally
identified areas of concern for workforce development.
Collection and sharing of data on such standardized
indicators can be helpful for cross-national analyses,
allowing ministries of health to benchmark against
regional and global performance and compare, for
example, what service levels and health outcomes
other countries are able to achieve with similar human
Figure 3.5 Gender and skills mix of the nursing workforce in Kenya, Nursing Council of Kenya database, 1960–2005
Source: Riley et al. (17).
77%
N=27 245
Enrolled
female=56%
79%N=265
N=11 770
0
5
10
15
20
25
30
Num
ber
of
qual
ified
nur
ses
(tho
usan
ds)
MaleFemale
Registered Registered with B.Sc. in nursing

Handbook on monitoring and evaluation of human resources for health
34
resources. It will be imperative to review this selection
at the national and subnational levels, particularly with
regard to feasibility and cost of measurement, and in
the process of establishing appropriate country-spe-
cific baselines and targets.
A number of critical requirements are identified for
developing and sustaining a comprehensive health
workforce information system, including:
the political decision to place monitoring of the HRH
situation high on the national agenda;
the establishment of a set of explicit benchmarks
and targets within the national HRH strategic plan,
each linked with appropriate indicators and an iden-
tified minimum dataset for their measurement;
preparing an enabling work environment for health
workforce information system strengthening;
recruitment and training of a sufficient number of
staff for developing, implementing and managing
the information system;
involving all key stakeholders in the process from the
initial planning stages.
Some possible indicators for monitoring implementation
of the HRH information and monitoring system, along
with potential means of verification, are presented in
Table 3.3 (10, 20–22). These indicators may not require
a specific numeric answer, but they are at the centre of
monitoring usefulness of the information system for sup-
porting evidence-based HRH policy-making, budget
decisions, management and accountability, and doing
so in ways that are open and transparent and optimize
stakeholder participation. Systematic use of the infor-
mation system for decision-making, with most national
and international stakeholders accepting its contents
as reliable and valid, would be the ultimate measure to
evaluate its performance.
3.6 Summary and conclusionsThere is growing concern around the world about the
current and future availability of health workers for
maintaining effective health systems (23). The lack of
reliable, up-to-date information on numerous aspects
of the HRH situation – including skills mix, sources and
levels of remuneration, workforce feminization, and
even basic stock – greatly restricts the ability to develop
evidence-based strategies at the national and interna-
tional levels to address the health workforce crisis.
Data and evidence are necessary to inform discussion,
prioritization and decision-making among countries
and other stakeholders. Even in many low-income
countries, a variety of potential information sources
exist but remain underutilized in health research. The
starting point for any investigative exercise of the HRH
situation should be a rigorous review of existing stand-
ard statistical sources, including those from outside
the health sector: population statistics generated by
census bureaus and central statistical offices; work
permits from labour departments; income files from
tax departments; and others seldom used by health
system planners and managers. Decision-making
should draw on a meta-analysis, or investigation of
the results across several information sources. Ideally,
all HRH data sources should be integrated into one
comprehensive information system, whereby routine
administrative records are complemented with regu-
larly conducted population-based and facility-based
surveys and censuses.
The optimization of use of such sources, however, can
be hindered by the dichotomy that often exists between
the providers of the data and potential users. In partic-
ular, while variables on occupation and place of work
are typically integral to population census and labour
force survey questionnaires, often the final results are
not disseminated using a categorization permitting the
identification of those with a health-related occupation
or working in the health services industry. Even when
they are, the results are often not comparable across
countries or over time, due to differences in the occu-
pation, education and industrial classifications used.
As such, monitoring and evaluation of HRH requires
good collaboration between the ministry of health and
other sectors that can be reliable sources of informa-
tion, notably the central statistical office, ministry of
education, ministry of labour, professional licensing or
certification bodies, and individual health-care facilities
and health training institutions. Ideally a commitment
should be established in advance to investigate pur-
poseful ways to put the data to use. Discussions
between representatives of the ministry of health, cen-
tral statistical office and other stakeholders, such as
professional associations and development partners,
are recommended from the beginning to set an agenda
for data harmonization, publication and use, taking into
account the timeline for data collection and processing
and the information needs for HRH policy and planning.
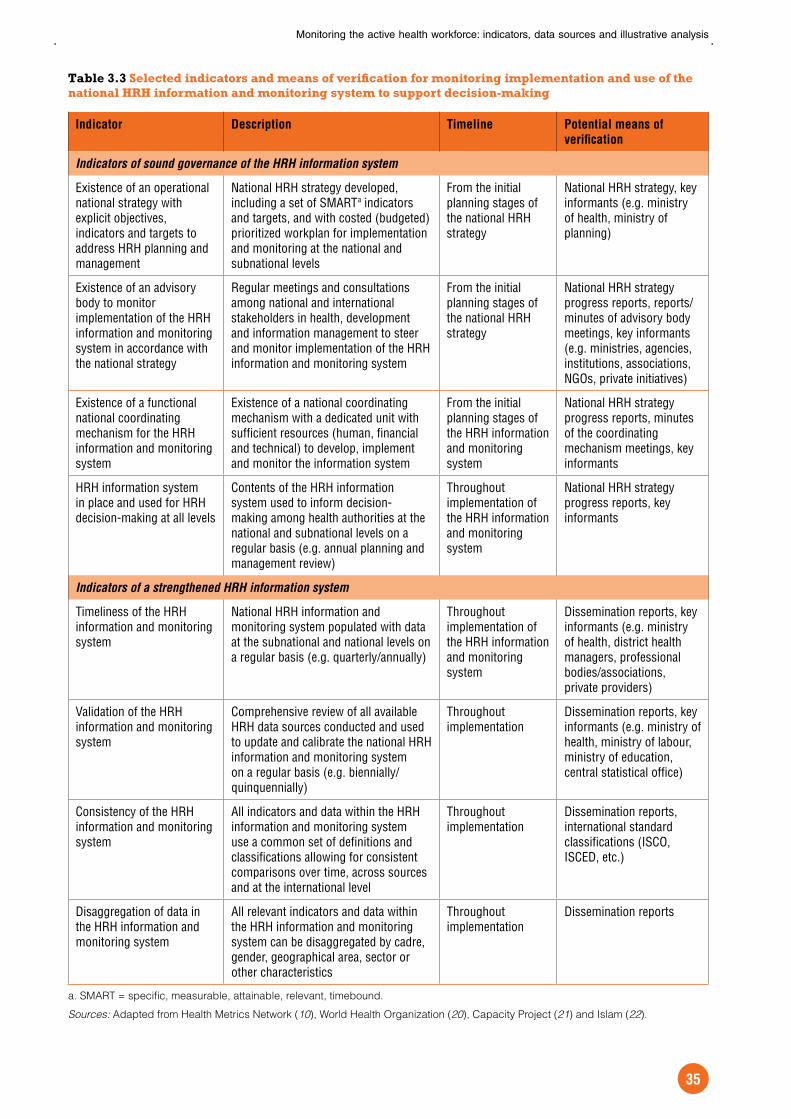
Monitoring the active health workforce: indicators, data sources and illustrative analysis
35
Table 3.3 Selected indicators and means of verification for monitoring implementation and use of the national HRH information and monitoring system to support decision-making
Indicator Description Timeline Potential means of
verification
Indicators of sound governance of the HRH information system
Existence of an operational national strategy with explicit objectives, indicators and targets to address HRH planning and management
National HRH strategy developed, including a set of SMARTa indicators and targets, and with costed (budgeted) prioritized workplan for implementation and monitoring at the national and subnational levels
From the initial planning stages of the national HRH strategy
National HRH strategy, key informants (e.g. ministry of health, ministry of planning)
Existence of an advisory body to monitor implementation of the HRH information and monitoring system in accordance with the national strategy
Regular meetings and consultations among national and international stakeholders in health, development and information management to steer and monitor implementation of the HRH information and monitoring system
From the initial planning stages of the national HRH strategy
National HRH strategy progress reports, reports/minutes of advisory body meetings, key informants (e.g. ministries, agencies, institutions, associations, NGOs, private initiatives)
Existence of a functional national coordinating mechanism for the HRH information and monitoring system
Existence of a national coordinating mechanism with a dedicated unit with sufficient resources (human, financial and technical) to develop, implement and monitor the information system
From the initial planning stages of the HRH information and monitoring system
National HRH strategy progress reports, minutes of the coordinating mechanism meetings, key informants
HRH information system in place and used for HRH decision-making at all levels
Contents of the HRH information system used to inform decision-making among health authorities at the national and subnational levels on a regular basis (e.g. annual planning and management review)
Throughout implementation of the HRH information and monitoring system
National HRH strategy progress reports, key informants
Indicators of a strengthened HRH information system
Timeliness of the HRH information and monitoring system
National HRH information and monitoring system populated with data at the subnational and national levels on a regular basis (e.g. quarterly/annually)
Throughout implementation of the HRH information and monitoring system
Dissemination reports, key informants (e.g. ministry of health, district health managers, professional bodies/associations, private providers)
Validation of the HRH information and monitoring system
Comprehensive review of all available HRH data sources conducted and used to update and calibrate the national HRH information and monitoring system on a regular basis (e.g. biennially/quinquennially)
Throughout implementation
Dissemination reports, key informants (e.g. ministry of health, ministry of labour, ministry of education, central statistical office)
Consistency of the HRH information and monitoring system
All indicators and data within the HRH information and monitoring system use a common set of definitions and classifications allowing for consistent comparisons over time, across sources and at the international level
Throughout implementation
Dissemination reports, international standard classifications (ISCO, ISCED, etc.)
Disaggregation of data in the HRH information and monitoring system
All relevant indicators and data within the HRH information and monitoring system can be disaggregated by cadre, gender, geographical area, sector or other characteristics
Throughout implementation
Dissemination reports
a. SMART = specific, measurable, attainable, relevant, timebound.
Sources: Adapted from Health Metrics Network (10), World Health Organization (20), Capacity Project (21) and Islam (22).
Handbook on monitoring and evaluation of human resources for health
36
References1. Chankova S, Kombe G, Muchiri S et al. Rising to the
challenges of human resources for health in Kenya:
developing empirical evidence for policy making.
Bethesda, MD, Partners for Health Reformplus
Project, Abt Associates Inc., 2006 (http://www.
healthsystems2020.org/content/resource/
detail/1654, accessed 11 January 2009).
2. Diallo K et al. Monitoring and evaluation of human
resources for health: an international perspective.
Human Resources for Health, 2003, 1:3 (http://
www.human-resources-health.com/content/1/1/3,
accessed 10 January 2009).
3. World Health Organization and University of
Technology Sydney. WHO human resources for
health minimum data set. Manila, WHO Western
Pacific and South-East Asia Regional Offices, 2008
(http://www.who.int/hrh/documents/hrh_minimum_
data_set.pdf, accessed 11 January 2009).
4. Dovlo D. Wastage in the health workforce: some
perspectives from African countries. Human
Resources for Health, 2005, 3:6 (http://www.human-
resources-health.com/content/3/1/6, accessed 11
January 2009).
5. Pond B, Kinfu Y. Health workforce statistics: summary
on data sources. Presented at the World Health
Organization/Health Metrics Network Technical
Working Group Meeting on Health Workforce
Statistics, Geneva, 11–13 July 2006.
6. Hussmanns R, Mehran F, Verma V. Surveys of
economically active population, employment,
unemployment and underemployment: an ILO
manual on concepts and methods. Geneva,
International Labour Office, 1990.
7. Lindelow M, Wagstaff A. Assessment of health
facility performance: an introduction to data and
measurement issues. In: Amin S, Das J, Goldstein M,
eds. Are you being served? New tools for measuring
service delivery. Washington, DC, World Bank, 2008
(http://go.worldbank.org/F6KIIC0700, accessed 11
January 2009).
8. Pencheon D. The good indicators guide:
understanding how to use and choose indicators.
Coventry, NHS Institute for Innovation and
Improvement, 2008 (http://www.apho.org.uk/
resource/item.aspx?RID=44584, accessed 11
January 2009).
9. MEASURE Program Dissemination Working Group.
Connecting people to useful information: guidelines
for effective data presentations. Calverton, MD, ORC
Macro, 2004 (http://www.measuredhs.com/pubs/
pdf/OD41/OD41LG.pdf, accessed 11 January 2009).
10. Strengthening country health information systems:
assessment and monitoring tool (version 2.00).
Geneva, Health Metrics Network, 2007 (http://www.
who.int/healthmetrics/support/tools, accessed 11
January 2009).
11. Dussault G, Franceschini MC. Not enough there, too
many here: understanding geographical imbalances
in the distribution of the health workforce. Human
Resources for Health, 2006, 4:12 (http://www.human-
resources-health.com/content/4/1/12, accessed 11
January 2009).
12. Gupta N et al. Uses of population census data for
monitoring geographical imbalance in the health
workforce: snapshots from three developing
countries. International Journal for Equity in
Health, 2003, 2:11 (http://www.equityhealthj.com/
content/2/1/11, accessed 11 January 2009).
13. Anand S et al. China’s human resources for health:
quantity, quality, and distribution. Lancet, 2008,
372:1774–1781.
14. Economic database. Windhoek, Institute for Public
Policy Research, 2007 (http://www.ippr.org.na/
database.php, accessed 11 January 2009).
15. Global atlas of the health workforce: August 2007
revision. Geneva, World Health Organization, 2007
(http://www.who.int/globalatlas/autologin/hrh_login.
asp, accessed 11 January 2009).
16. Herbst CH, Gijsbrechts D. Information on stock,
profiles, and distribution of health workers in Rwanda:
analysis of the 2005/06 health worker census data.
World Bank Human Resources for Health Program
Paper. Washington, DC, World Bank, 2007.
17. Riley PL et al. Developing a nursing database
system in Kenya. Health Services Research, 2007,
42(3):1389–1405.
18. Centers for Disease Control and Prevention.
Monitoring and evaluation capacity building for
program improvement: field guide. Atlanta, GA,
United States Centers for Disease Control and
Prevention, Global AIDS Program, 2003.
19. Mackay K. How to build M&E systems to support
better government. Washington, DC, World Bank,
2007 (http://www.worldbank.org/oed/ecd/better_
government.html, accessed 11 January 2009).
20. Establishing and monitoring benchmarks for scaling
up health workforce education and training. Report
prepared for the Global Health Workforce Alliance/
Task Force for Scaling Up Education and Training for
Health Workers. Geneva, World Health Organization,
2007.
21. HRH Action Framework. Capacity Project (http://
www.capacityproject.org/framework, accessed 10
January 2009).
22. Islam M, ed. Health systems assessment approach:
a how-to manual. Arlington, VA, Management
Sciences for Health, 2007 (http://healthsystems2020.
org/content/resource/detail/528/, accessed 11
January 2009).
23. The world health report 2006: working together for
health. Geneva, World Health Organization, 2006
(http://www.who.int/whr/2006, accessed 10 January
2009).

37
Framework and measurement issues for monitoring entry into the health workforce
KATE TULENKO, GILLES DUSSAULT, HUGO MERCER
4.1 IntroductionOne of the main causes of shortages and maldistribu-
tion of health workers in a country is the lack of entry into
the labour market of adequate numbers of persons with
appropriate education and training. Yet in most coun-
tries few data on health worker entry are available for
use by the education system or the ministry of health,
impeding the ability of the health system to respond
to labour market forces or develop effective health
workforce strategies. Measuring entry and tracking
subsequent service are essential to the planning, man-
agement and quality control of the health workforce in a
country (1). Gathering timely, accurate and comprehen-
sive data on health worker entry is crucial to planning
the delivery of health services and effecting health pol-
icy reform. Beyond the simple but commonly reported
indicator of numbers of health education graduates
(see also Chapter 3 in this Handbook), it is important
that the factors surrounding entry in a country are well
understood. The availability of baseline and ongoing
data enables decision-makers to monitor the progress
of interventions and to make periodical corrections. This
is critical as adjustments can often take years to imple-
ment, with effects potentially lasting even decades, and
can involve the reallocation or addition of significant
amounts of funding. Also, since human resources for
health (HRH) planning involves sectors beyond the min-
istry of health – including the ministries of education,
labour and finance, civil service and professional reg-
ulatory bodies, and the private sector – strengthened
information and monitoring systems are necessary for
following trends in the education, employment and
regulation of health labour; assisting the decisions of
managers and policy-makers; and creating a sound
evidence base for the policy dialogue with professional
associations and development partners.
This chapter explores ways in which entry into the
health workforce can be monitored and assessed,
and how the appropriate data can lead to formulation
and evaluation of policies and programmes to correct
shortages and maldistribution of health workers. A set
of core indicators are identified, and existing and new
sources of data for their measurement are examined.
The objective is to assist researchers, managers, pol-
icy-makers and others to identify, obtain and use data
critical to sound health workforce analysis and plan-
ning, through a consideration of the questions: What
needs to be measured, and how?
For the purpose of the chapter, “entry” means inclu-
sion into the pool of workers available for employment
in the health sector in a country. Entry does not nec-
essarily imply employment, only eligibility and desire
for employment. Consideration is given to all health
service providers who require vocational education
and training in a health-related field for recruitment in
a job, including clinical cadres, public health work-
ers, community health workers and laboratory health
workers. Those not considered include self-declared
traditional healers, drug sellers and others without for-
mal training, working in the informal health sector or
working illegally; those working in a non-health sector;
and qualified health service providers who had previ-
ously not been working but who are now re-entering
the health labour market. Some of these issues will be
covered in Chapter 5.
It is important to keep in mind that decisions made
regarding health worker entry affect more than just the
aggregate number of workers. The geographical mald-
istribution of health workers (usually favouring urban
areas over rural areas and wealthy communities over
poor communities) can be attributed in part to pre-
service education and training factors. These include
insufficient recruitment of students with attributes that
would lend them to serve underserved communities;
the training of cadres whose skills are not matched to
the needs of underserved communities; lack of student
exposure, during training, to underserved clinical set-
tings or populations; and failure to instil students with
a sense of professional obligation to underserved pop-
ulations and to counterbalance students’ perceptions
that there is less prestige and lower income prospects
associated with working with such populations (2–5).
4
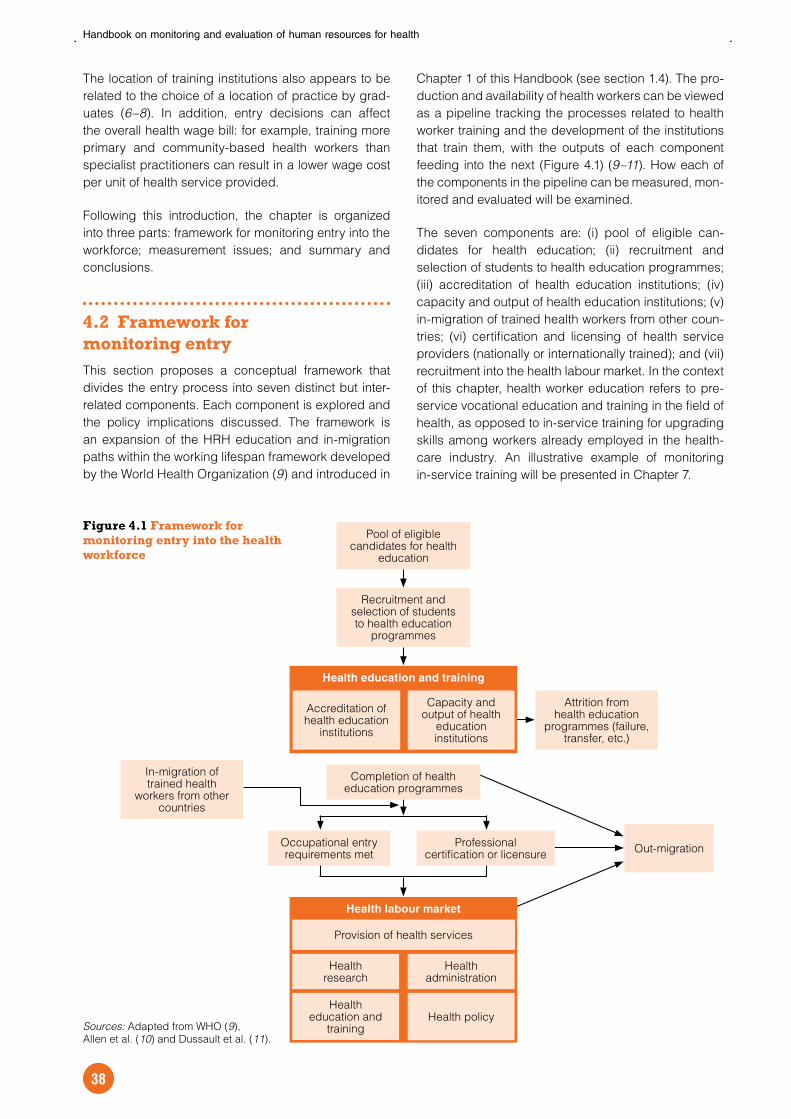
Handbook on monitoring and evaluation of human resources for health
38
The location of training institutions also appears to be
related to the choice of a location of practice by grad-
uates (6–8). In addition, entry decisions can affect
the overall health wage bill: for example, training more
primary and community-based health workers than
specialist practitioners can result in a lower wage cost
per unit of health service provided.
Following this introduction, the chapter is organized
into three parts: framework for monitoring entry into the
workforce; measurement issues; and summary and
conclusions.
4.2 Framework for monitoring entryThis section proposes a conceptual framework that
divides the entry process into seven distinct but inter-
related components. Each component is explored and
the policy implications discussed. The framework is
an expansion of the HRH education and in-migration
paths within the working lifespan framework developed
by the World Health Organization (9) and introduced in
Chapter 1 of this Handbook (see section 1.4). The pro-
duction and availability of health workers can be viewed
as a pipeline tracking the processes related to health
worker training and the development of the institutions
that train them, with the outputs of each component
feeding into the next (Figure 4.1) (9–11). How each of
the components in the pipeline can be measured, mon-
itored and evaluated will be examined.
The seven components are: (i) pool of eligible can-
didates for health education; (ii) recruitment and
selection of students to health education programmes;
(iii) accreditation of health education institutions; (iv)
capacity and output of health education institutions; (v)
in-migration of trained health workers from other coun-
tries; (vi) certification and licensing of health service
providers (nationally or internationally trained); and (vii)
recruitment into the health labour market. In the context
of this chapter, health worker education refers to pre-
service vocational education and training in the field of
health, as opposed to in-service training for upgrading
skills among workers already employed in the health-
care industry. An illustrative example of monitoring
in-service training will be presented in Chapter 7.
Sources: Adapted from WHO (9),
Allen et al. (10) and Dussault et al. (11).
Pool of eligible candidates for health
education
Recruitment and selection of students to health education
programmes
Health education and training
Health labour market
Accreditation of health education
institutions
Provision of health services
Health research
Health education and
training
Capacity and output of health
education institutions
Health administration
Health policy
In-migration of trained health
workers from other countries
Occupational entry requirements met
Professional certification or licensure
Attrition from health education
programmes (failure, transfer, etc.)
Out-migration
Completion of health education programmes
Figure 4.1 Framework for monitoring entry into the health workforce

Framework and measurement issues for monitoring entry into the health workforce
39
4.2.1 Pool of eligible candidates for health educationWithin each country, the size of the pool of eligible peo-
ple from which health training institutions recruit their
students depends primarily on the admission criteria
for each training programme and the strength of the pri-
mary and secondary school system. For tertiary-level
programmes producing the most highly skilled health
service providers, this pool traditionally consisted of
students having graduated at the upper secondary
level – equivalent to level 3 of the International Standard
Classification of Education (12) – and with strong sci-
ence backgrounds.
With the increasing emphasis on the need for locally
recruited cadres for providing basic preventive and
curative care and referral services, especially among
underserved communities, some countries have
recognized that their requirements for eligibility for
admittance into certain types of health training pro-
grammes were unnecessarily stringent, and have
made the criteria more suitable to the responsibilities
of the cadres. The pool of eligibles has been widened
to include those without upper secondary diplomas or
strong science backgrounds. For example, to increase
retention of nurses in rural areas of Pakistan, the Aga
Khan School of Nursing developed a programme that
recruited young women who had graduated from rural
secondary schools but essentially, due to the weakness
of their underresourced schools, at only the lower sec-
ondary level. The remedial programme quickly brought
their knowledge level up to meet the qualifications to
enter nursing school, and they then joined the regular
nursing programme along with their counterparts who
graduated from urban secondary schools (13).
The pool of eligibles is one of the most underappre-
ciated policy issues within HRH and, as a result, few
ministries of health have accurate data or effective pol-
icy on eligibles. With appropriate data and analysis,
policies on the entry requirements for students can be
made or changed so that they are more aligned to the
country context; outreach programmes can be started
to interest high-school students or others to become
health workers; and training programmes can be set
up within high schools. Or the analysis may reveal that
more sweeping changes are needed in the primary
and secondary curriculum to properly prepare stu-
dents for health careers.
4.2.2 Recruitment and selection of students to health education programmesIn most low- and middle-income countries, especially
those that rely exclusively on public training institutions,
recruitment of students remains a passive process.
Educational institutions may post the opening of the
acceptance of applications on their public notice board,
but there is generally little outreach to the pool of eligi-
bles. From a policy point of view, the need for active
recruitment to correct gender, economic, ethnic, urban/
rural and regional imbalances should be examined.
Also to be considered is the provision of assistance to
potential students in their choice of institution and in fill-
ing out the application forms, which may be especially
daunting to those from disadvantaged socioeconomic
groups or underserved communities who may be the
first in their family to apply for higher education.
Recruiting students based on their motivations for
pursuing a health career can help improve worker
retention. Evidence from an observational study of
Ethiopian nurses and physicians revealed that students
with higher reported rates of altruism (measured as will-
ingness to help the poor) were willing to work in rural
areas for a lower rural bonus, and were more likely to
still be practising in a rural area when followed up two
years later (4). A study on the migration of health work-
ers from Ghana to the United Kingdom and the United
States of America found that many nurses and physi-
cians had entered the health field with the intention to
migrate, and that a health career was often seen as a
“ticket” out of Ghana (14).
4.2.3 Accreditation of health education institutionsAll health professions education institutions, public or
private, should be accredited to assure the match of
health workers and their skills with the country’s health-
care needs, and to ensure the quality of education
provided. The accreditation process should be driven
by the national health policy and be conducted in a
manner that makes it socially responsible, while main-
taining the independence of the accreditation agency
(15, 16). The mechanism consists of an initial formal rec-
ognition of training institutions by a representative body
(usually at the national or sometimes subregional level)
that certain predetermined educational requirements
have been met – covering such aspects as instruc-
tors’ qualifications, curriculum and clinical rotations
– followed by periodic assessments to ensure mainte-
nance of standards. Elements of proper accreditation
and quality assurance processes of health education
institutions include authoritative mandate and deci-
sion of the accreditation agency; social accountability;
independence from government and providers; trans-
parency; predefined general and specific criteria for
education standards; procedures using a combination
of institutional self-evaluation and site visits by exter-
nal reviewers; and publication of reports and decisions
(17).
Handbook on monitoring and evaluation of human resources for health
40
Potential uses of accreditation data to support deci-
sion-making include identifying practices from
high-performing training institutions that can be rep-
licated at other institutions, and identifying poorly
performing institutions in need of increased attention. A
large number of institutions failing to meet accreditation
or reaccreditation standards could indicate that insti-
tutional management may need to be improved, that
the standards are unrealistically high or that education
institutions are underresourced.
Several barriers exist to the effective use of accredi-
tation data. In Ghana it has been found that health
science training institutions did not receive copies of
their accreditation report, nor were the reports pub-
licly available (18). Another barrier to data use is that
many countries do not have an accreditation body, or
the one that exists is underresourced. There is a need
to promote national and regional policies to enhance
the accreditation of health professions education insti-
tutions as a way to ensure the quality of health services
delivery.
4.2.4 Capacity and output of health education institutionsCapacity in pre-service training includes physical
infrastructure (for example classrooms, laboratories,
libraries, clinics for internships, campus residencies),
human resources (quantity and quality of instructors
and auxiliary staff), financial resources, organizational
and operational capacity (managerial structure and
processes) and other non-infrastructure physical inputs
(pedagogical tools, reference books and journals,
computer equipment) (11). Health worker training insti-
tutions, accredited or not, can vary greatly by capacity,
and in many cases the training institution may not be
aware of its own capacity or potential capacity.
The various components of capacity determine the
overall output capacity: the number, type and quality
of cadres that graduate from the institution. Combining
data on output with that on financing can be used to
calculate how much it costs to train each type of health
worker, and to estimate how much it would cost to train
additional workers based on current capacity.
For policy purposes, it is critical to monitor each of
the components of capacity and output. By draw-
ing on assessments of oversupply or undersupply of
various cadres of the active health workforce, institu-
tional capacity for producing new health workers can
be decreased or increased, or training programmes for
new cadres can be developed. This information can
be used to identify the specific bottlenecks in capac-
ity so that if rapid increases in production are required,
capacity can be increased as rapidly as possible.
4.2.5 In-migration of trained health workers from other countriesCountries with better wages, working conditions and
quality of life tend to attract health workers from other
countries. In order to legally exercise their occupation
in the destination country, in-migrants must receive
working visas and, for certain skilled health service
providers, be licensed or certified by the appropriate
regulatory body.
Policy options on migration for destination or receiving
countries include adjusting the number of visas ear-
marked for health workers, the degree to which their
visa applications are facilitated and expedited, and how
actively the government allows the public or private sec-
tor to recruit internationally (19). Policies and practices
can be active, for example when the government posts
advertisements in other countries, sends recruiters or
negotiates bilateral arrangements with other countries;
or passive, that is, simply considering health workers
like all others who apply for visas on their own accord.
For sending countries, options can include increased
funding for the production of health workers to meet
demand abroad, and policies of return (20). Of note
is the Philippines’ policy on assistance to international
migration for its nurses to many receiving countries. As
part of its managed migration strategy, the Philippines
negotiates the number of workers the destination coun-
tries will receive and the terms of their service (the
agreements signed with the United Kingdom in 2003
and with Japan in 2006 are examples). This may be
considered a mutually advantageous process for both
countries, as it allows both the Philippines and the
receiving country to conduct long-range nurse work-
force planning and minimize sudden shocks (21). On
the other hand, unexpected (and undesirable) side-
effects of this strategy may include encouraging nursing
teachers and trainers to leave, encouraging physicians
and other health professionals to retrain as nurses to
improve their chances to emigrate (22) and weakening
of the health system, particularly in rural areas.
Increasing attention is being focused on the incorpo-
ration of ethical codes of practice into national practice
(20). Policy options being explored by a country should
recognize the right of individual workers to migrate, and
denounce unethical recruitment practices that exploit
health workers or mislead them into accepting job
responsibilities and working conditions that are incom-
patible with their qualifications, skills and experience
(23, 24). Among receiving countries, they should also
acknowledge that the flow of international migration of
skilled health professionals is generally from poorer to
wealthier countries, who gain a valuable resource with-
out paying the education and training expenses.

Framework and measurement issues for monitoring entry into the health workforce
41
4.2.6 Certification and licensing of health service providersCertification and licensing are used by countries to con-
trol the quality of health-care workers practising in their
country and to control the size of the health labour mar-
ket. Certification and licensing purposefully weed out
unqualified workers because those whose knowledge
and skills do not match the minimal requirements for
their cadre can do more harm than good to the health
of their patients and can erode the confidence that the
public has in the health system, especially of govern-
ment-provided services. The location of certification
and licensing can vary for different cadres and coun-
tries and this affects how the data can be gathered.
For certain cadres, quality at the level of the individual
worker is controlled by graduating from an accredited
training institution, while for other cadres, the require-
ment is passing a national professional qualification
exam. Also affecting potential monitoring and evalu-
ation efforts is the fact that certification to practise a
profession usually does not need to be renewed, while
a licence usually needs to be periodically renewed
based on certain criteria such as passing a renewal
exam, demonstrating continuing learning, being
employed in the field or simply paying a fee (25).
Monitoring trends in professional certification and
licensing numbers and success rates can help identify
a variety of problems in the entry process. For exam-
ple, an increase in the licensing exam failure rate may
indicate insufficiencies in training curricula or exams
that are outdated in relation to changes and innovations
in clinical practice. Another policy issue that may need
to be addressed is whether conflicting quality con-
trol criteria exist between the government, individual
training institutions and professional regulatory bod-
ies. There are cases where graduates succeed in the
institutional proficiency tests, but fail the professional
association certification exam, indicating a mismatch in
the level of proficiency expected at the institutional ver-
sus the association level. This points to the need to set
and use common standards within a country, and align
training curricula with professional knowledge and skill
requirements.
With the expected global increase in the production of
front-line cadres that are usually certified rather than
licensed, such as community health workers and aux-
iliary nurses, it is crucial that the certification process
is better monitored. This increase will occur because
many countries with extreme shortages or maldistribu-
tion of highly skilled health service providers, especially
medical and nursing professionals, are consider-
ing or opting for rapid production of large cadres of
lower-skilled workers to meet the immediate needs for
basic health services among underserved, mainly rural
communities. Since these workers will often be the first
point of contact with the formal health-care system, and
therefore will represent the system at the community
level, guaranteeing the quality of the workers through
proper certification is of extreme importance.
For in-migrants, typical requirements for professional
certification or licensing in the receiving country vary
greatly. Most countries require graduation from a train-
ing institution recognized by the receiving country (for
example, based on recognition of meeting the qual-
ity assurance standards of the World Federation of
Medical Education) and professional certification or
licensing in the country of education. Most countries
have credentialing staff in medical boards or the minis-
try of health who document the certification or licensing
of the workers and their work history. Some countries
have streamlined this process and designed reciprocal
recognition procedures with other countries.
A special issue with regard to immigrant health work-
ers is that of language and cultural competency. Some
countries may require passing a proficiency exam for
the language most used in professional communica-
tion at the national level. However, there tend to be few
or no requirements for knowledge of local languages
and culture, which may not favour retention of immi-
grant health workers in rural areas. A provider’s lack
of common language with patients may also affect cul-
tural acceptability of the health system, and negatively
impact care-seeking behaviours and treatment compli-
ance (26).
In any case, professional certification and licensure
can document the quality of health workers at entry, but
does not necessarily reflect the quality of care they pro-
vide. Quality of service provision is affected by many
factors, such as workload, motivation, supervision,
available resources (for example equipment, supplies,
support staff) and lifelong learning.
4.2.7 Recruitment into the health labour marketMonitoring the recruitment of newly trained health work-
ers into the national health labour market is critical in
order to reduce inefficiencies in the hiring system,
identify potential gaps between supply and demand
for health workers, and monitor achievements in
health workforce planning. Policies and strategies for
deployment of health workers vary according to the
context and dynamics of countries’ health, education
and labour markets. Countries with only government-
operated education institutions and few health-related
private sector jobs have simple health labour markets;
active recruitment of workers to health-care service is
not needed since all graduates are directly employed

Handbook on monitoring and evaluation of human resources for health
42
by the government, or do not work if posts are not avail-
able. But countries with private training institutions or a
significant formal private health sector have more com-
plex health labour markets, requiring active recruitment
to fill job vacancies.
Policy issues include making sure the application and
posting process is as transparent and timely as possi-
ble. Health workers should be able to apply to specific
posts and the criteria for selection should be clear.
Governments can improve the efficiency of the health
labour market by establishing free, easily accessed
job boards on which all job seekers and employers
can post. In some contexts, offering incentives (mone-
tary and non-monetary) may be needed to encourage
workers to apply for posts in underserved areas.
Establishing early links between potential employ-
ers and educational institutions is also an option that
enlarges the students’ knowledge on their future labour
trajectory.
If a country imports or exports health workers, rele-
vant questions include: What are the recruitment rules
that need to be followed? How many health workers in-
migrate or out-migrate each year? Is reimbursement
needed from the receiving to the sending country to
compensate the latter for health workers trained with
public funds? How should this recruitment be con-
ducted? For example, in some African countries,
recruiters for foreign health systems have been allowed
to set up tables at nursing graduation ceremonies and
directly recruit the new nurses (27).
4.3 Measurement issuesEach section of the health workforce entry framework
can be monitoring by means of its own set of indicators
for measurement. Table 4.1 (page 44) presents a series of
indicators on entry and their potential means of verifica-
tion. This list is by no means exhaustive, and additional
indicators may be required. The issue of a minimal set
of essential indicators is a complex one, and there may
be conflicting priorities between what data are needed
at the national level and the international level. Every
country and region has a unique HRH situation, and will
need to collect and analyse the necessary information
most suited to its health system needs, objectives and
targets (Box 4.1) (28). Throughout this discussion, it is
important to keep in mind the need, where possible, to
routinely compile, analyse and act on data collected
through existing national administrative processes (Box
4.2) (12, 29). This routine data collection can then be
supplemented and validated through periodic or ad
hoc surveys and other standard statistical sources (for
example population census or labour force survey).
Within the framework, capacity and output of train-
ing institutions is the field with the largest number of
proposed indicators. This is also probably where lies
the greatest potential for changes in the shorter term
in response to policy or programmatic interventions.
One entry indicator that each country should routinely
measure, analyse and disseminate is the annual output
(or number of graduates) of health vocational training
institutions (see Box 4.3 for an illustrative example) (11).
This is the aggregate of multiple pieces of information
Box 4.1 Illustrative example of the establishment of health worker education and training goals and targets: region of the Americas, 2007–2015
An HRH strategic plan for the Americas proposed a set of goals, targets and indicators for the countries
in the region in several areas of education and training. Under the goal “adapt the education of the health
workers to a universal and equitable model of providing quality care to meet the health needs of the entire
population”, specific benchmarks for 2015 included:
80% of schools of clinical health sciences will have reoriented their education towards primary health
care and community health needs and adopted interprofessional training strategies;
80% of schools of clinical health sciences will have adopted specific programmes to recruit and train
students from underserved populations with, when appropriate, a special emphasis on indigenous, or
First Nations, communities;
attrition rates in schools of nursing and medicine will not exceed 20%;
70% of schools of clinical health sciences and public health will be accredited by a recognized
accreditation body.
Source: Pan American Health Organization (28).
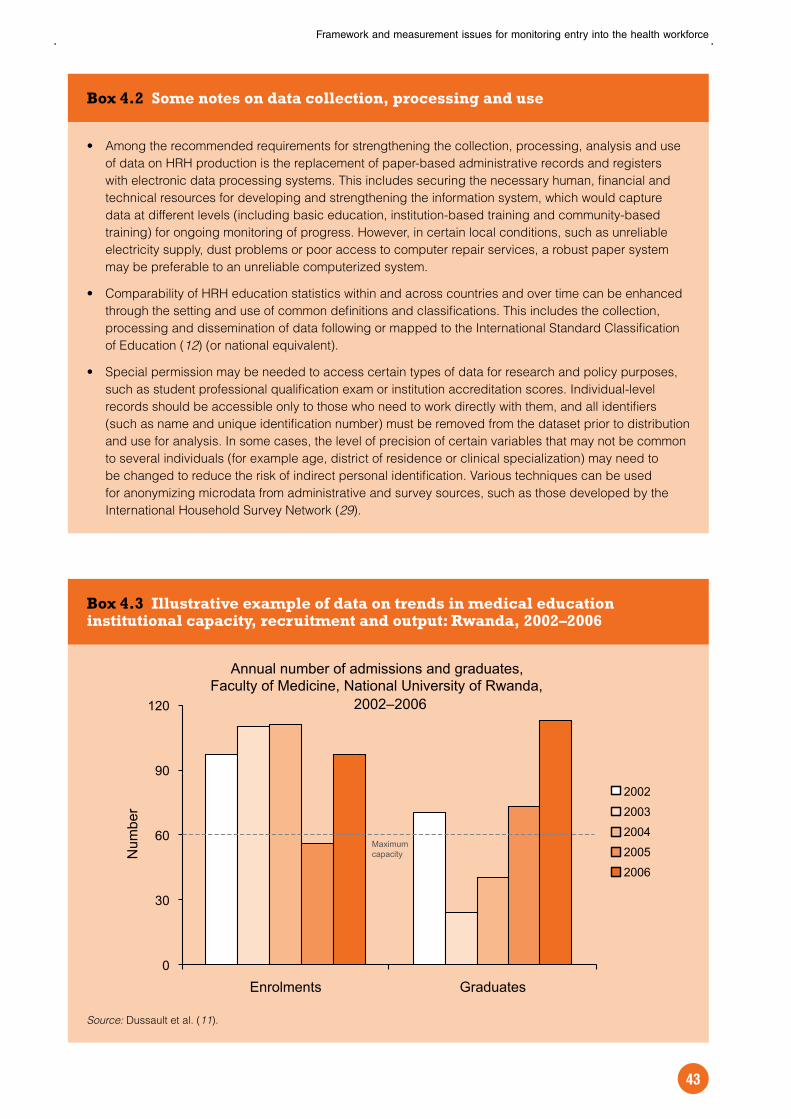
Framework and measurement issues for monitoring entry into the health workforce
43
Box 4.2 Some notes on data collection, processing and use
Among the recommended requirements for strengthening the collection, processing, analysis and use
of data on HRH production is the replacement of paper-based administrative records and registers
with electronic data processing systems. This includes securing the necessary human, financial and
technical resources for developing and strengthening the information system, which would capture
data at different levels (including basic education, institution-based training and community-based
training) for ongoing monitoring of progress. However, in certain local conditions, such as unreliable
electricity supply, dust problems or poor access to computer repair services, a robust paper system
may be preferable to an unreliable computerized system.
Comparability of HRH education statistics within and across countries and over time can be enhanced
through the setting and use of common definitions and classifications. This includes the collection,
processing and dissemination of data following or mapped to the International Standard Classification
of Education (12) (or national equivalent).
Special permission may be needed to access certain types of data for research and policy purposes,
such as student professional qualification exam or institution accreditation scores. Individual-level
records should be accessible only to those who need to work directly with them, and all identifiers
(such as name and unique identification number) must be removed from the dataset prior to distribution
and use for analysis. In some cases, the level of precision of certain variables that may not be common
to several individuals (for example age, district of residence or clinical specialization) may need to
be changed to reduce the risk of indirect personal identification. Various techniques can be used
for anonymizing microdata from administrative and survey sources, such as those developed by the
International Household Survey Network (29).
Box 4.3 Illustrative example of data on trends in medical education institutional capacity, recruitment and output: Rwanda, 2002–2006
Source: Dussault et al. (11).
0
30
60
90
120
Enrolments Graduates
Num
ber
Annual number of admissions and graduates, Faculty of Medicine, National University of Rwanda,
2002–2006
2002
2003
2004
2005
2006
Maximumcapacity
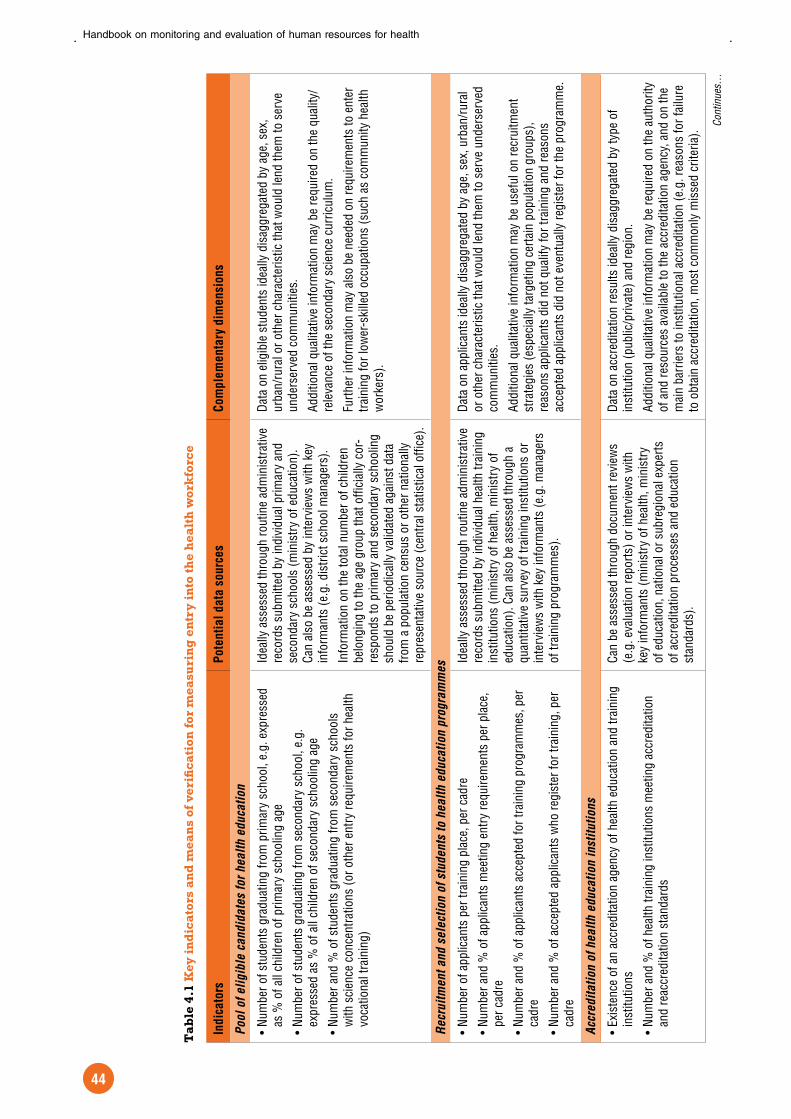
Handbook on monitoring and evaluation of human resources for health
44
Ta
ble
4.1
Key
in
dic
ato
rs a
nd
mea
ns
of v
erifi
cati
on f
or m
easu
rin
g e
ntr
y i
nto
th
e h
ealt
h w
ork
forc
e
Ind
ica
tors
Po
ten
tia
l d
ata
so
urc
es
Co
mp
lem
en
tary
dim
en
sio
ns
Po
ol
of
eli
gib
le c
an
did
ate
s f
or
he
alt
h e
du
ca
tio
n
Num
ber o
f stu
dent
s gr
adua
ting
from
prim
ary
scho
ol, e
.g. e
xpre
ssed
as
% o
f all
child
ren
of p
rimar
y sc
hool
ing
age
Num
ber o
f stu
dent
s gr
adua
ting
from
sec
onda
ry s
choo
l, e.
g.
expr
esse
d as
% o
f all
child
ren
of s
econ
dary
sch
oolin
g ag
e
Num
ber a
nd %
of s
tude
nts
grad
uatin
g fro
m s
econ
dary
sch
ools
w
ith s
cien
ce c
once
ntra
tions
(or o
ther
ent
ry re
quire
men
ts fo
r hea
lth
voca
tiona
l tra
inin
g)
Idea
lly a
sses
sed
thro
ugh
rout
ine
adm
inis
trativ
e re
cord
s su
bmitt
ed b
y in
divi
dual
prim
ary
and
seco
ndar
y sc
hool
s (m
inis
try
of e
duca
tion)
. Ca
n al
so b
e as
sess
ed b
y in
terv
iew
s w
ith k
ey
info
rman
ts (e
.g. d
istri
ct s
choo
l man
ager
s).
Info
rmat
ion
on th
e to
tal n
umbe
r of c
hild
ren
belo
ngin
g to
the
age
grou
p th
at o
ffici
ally
cor
-re
spon
ds to
prim
ary
and
seco
ndar
y sc
hool
ing
shou
ld b
e pe
riodi
cally
val
idat
ed a
gain
st d
ata
from
a p
opul
atio
n ce
nsus
or o
ther
nat
iona
lly
repr
esen
tativ
e so
urce
(cen
tral s
tatis
tical
offi
ce).
Data
on
elig
ible
stu
dent
s id
eally
dis
aggr
egat
ed b
y ag
e, s
ex,
urba
n/ru
ral o
r oth
er c
hara
cter
istic
that
wou
ld le
nd th
em to
ser
ve
unde
rser
ved
com
mun
ities
.
Addi
tiona
l qua
litat
ive
info
rmat
ion
may
be
requ
ired
on th
e qu
ality
/re
leva
nce
of th
e se
cond
ary
scie
nce
curr
icul
um.
Furth
er in
form
atio
n m
ay a
lso
be n
eede
d on
requ
irem
ents
to e
nter
tra
inin
g fo
r low
er-s
kille
d oc
cupa
tions
(suc
h as
com
mun
ity h
ealth
w
orke
rs).
Re
cru
itm
en
t a
nd
se
lecti
on
of
stu
de
nts
to
he
alt
h e
du
ca
tio
n p
rog
ram
me
s
Num
ber o
f app
lican
ts p
er tr
aini
ng p
lace
, per
cad
re
Num
ber a
nd %
of a
pplic
ants
mee
ting
entr
y re
quire
men
ts p
er p
lace
, pe
r cad
re
Num
ber a
nd %
of a
pplic
ants
acc
epte
d fo
r tra
inin
g pr
ogra
mm
es, p
er
cadr
e
Num
ber a
nd %
of a
ccep
ted
appl
ican
ts w
ho re
gist
er fo
r tra
inin
g, p
er
cadr
e
Idea
lly a
sses
sed
thro
ugh
rout
ine
adm
inis
trativ
e re
cord
s su
bmitt
ed b
y in
divi
dual
hea
lth tr
aini
ng
inst
itutio
ns (m
inis
try
of h
ealth
, min
istr
y of
ed
ucat
ion)
. Can
als
o be
ass
esse
d th
roug
h a
quan
titat
ive
surv
ey o
f tra
inin
g in
stitu
tions
or
inte
rvie
ws
with
key
info
rman
ts (e
.g. m
anag
ers
of tr
aini
ng p
rogr
amm
es).
Data
on
appl
ican
ts id
eally
dis
aggr
egat
ed b
y ag
e, s
ex, u
rban
/rura
l or
oth
er c
hara
cter
istic
that
wou
ld le
nd th
em to
ser
ve u
nder
serv
ed
com
mun
ities
.
Addi
tiona
l qua
litat
ive
info
rmat
ion
may
be
usef
ul o
n re
crui
tmen
t st
rate
gies
(esp
ecia
lly ta
rget
ing
certa
in p
opul
atio
n gr
oups
), re
ason
s ap
plic
ants
did
not
qua
lify
for t
rain
ing
and
reas
ons
acce
pted
app
lican
ts d
id n
ot e
vent
ually
regi
ster
for t
he p
rogr
amm
e.
Accre
dit
ati
on
of
he
alt
h e
du
ca
tio
n i
nsti
tuti
on
s
Exis
tenc
e of
an
accr
edita
tion
agen
cy o
f hea
lth e
duca
tion
and
train
ing
inst
itutio
ns
Num
ber a
nd %
of h
ealth
trai
ning
inst
itutio
ns m
eetin
g ac
cred
itatio
n an
d re
accr
edita
tion
stan
dard
s
Can
be a
sses
sed
thro
ugh
docu
men
t rev
iew
s (e
.g. e
valu
atio
n re
ports
) or i
nter
view
s w
ith
key
info
rman
ts (m
inis
try
of h
ealth
, min
istr
y of
edu
catio
n, n
atio
nal o
r sub
regi
onal
exp
erts
of
acc
redi
tatio
n pr
oces
ses
and
educ
atio
n st
anda
rds)
.
Data
on
accr
edita
tion
resu
lts id
eally
dis
aggr
egat
ed b
y ty
pe o
f in
stitu
tion
(pub
lic/p
rivat
e) a
nd re
gion
.
Addi
tiona
l qua
litat
ive
info
rmat
ion
may
be
requ
ired
on th
e au
thor
ity
of a
nd re
sour
ces
avai
labl
e to
the
accr
edita
tion
agen
cy, a
nd o
n th
e m
ain
barr
iers
to in
stitu
tiona
l acc
redi
tatio
n (e
.g. r
easo
ns fo
r fai
lure
to
obt
ain
accr
edita
tion,
mos
t com
mon
ly m
isse
d cr
iteria
).
Cont
inue
s…
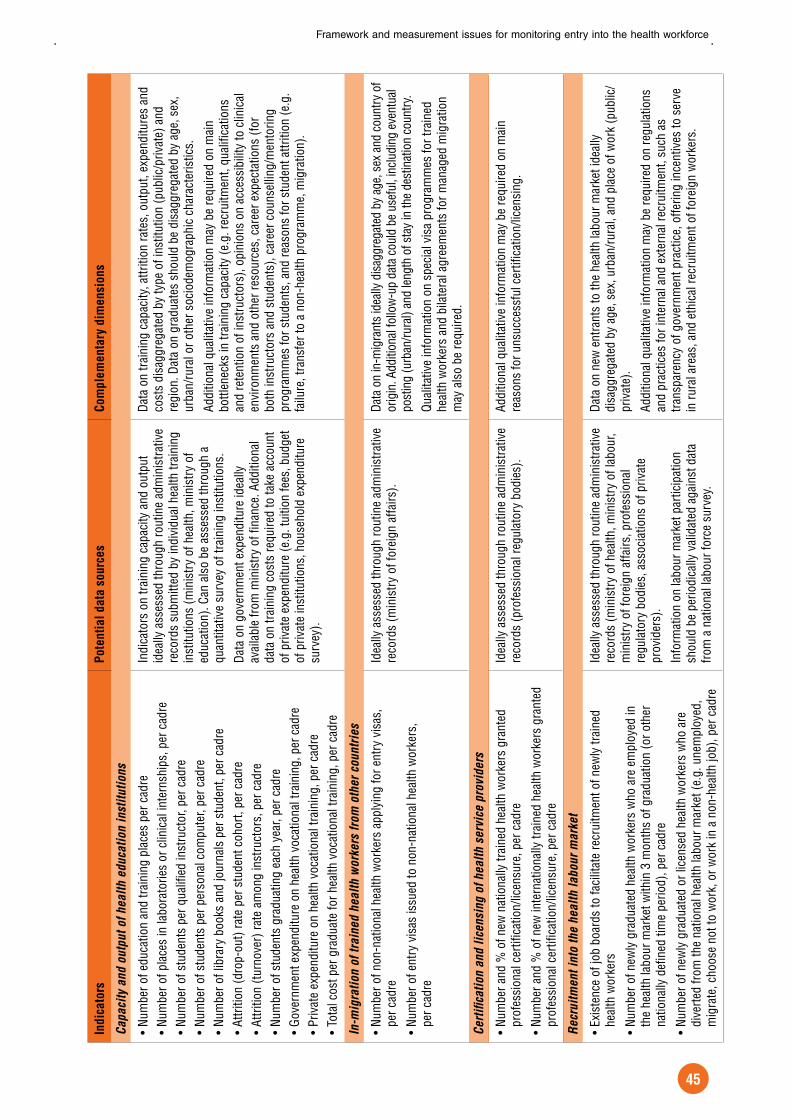
Framework and measurement issues for monitoring entry into the health workforce
45
Ind
ica
tors
Po
ten
tia
l d
ata
so
urc
es
Co
mp
lem
en
tary
dim
en
sio
ns
Ca
pa
cit
y a
nd
ou
tpu
t o
f h
ea
lth
ed
uca
tio
n i
nsti
tuti
on
s
Num
ber o
f edu
catio
n an
d tra
inin
g pl
aces
per
cad
reNu
mbe
r of p
lace
s in
labo
rato
ries
or c
linic
al in
tern
ship
s, p
er c
adre
Num
ber o
f stu
dent
s pe
r qua
lified
inst
ruct
or, p
er c
adre
Num
ber o
f stu
dent
s pe
r per
sona
l com
pute
r, pe
r cad
reNu
mbe
r of l
ibra
ry b
ooks
and
jour
nals
per
stu
dent
, per
cad
reAt
tritio
n (d
rop-
out)
rate
per
stu
dent
coh
ort,
per c
adre
Attri
tion
(turn
over
) rat
e am
ong
inst
ruct
ors,
per
cad
reNu
mbe
r of s
tude
nts
grad
uatin
g ea
ch y
ear,
per c
adre
Gove
rnm
ent e
xpen
ditu
re o
n he
alth
voc
atio
nal t
rain
ing,
per
cad
rePr
ivat
e ex
pend
iture
on
heal
th v
ocat
iona
l tra
inin
g, p
er c
adre
Tota
l cos
t per
gra
duat
e fo
r hea
lth v
ocat
iona
l tra
inin
g, p
er c
adre
Indi
cato
rs o
n tra
inin
g ca
paci
ty a
nd o
utpu
t id
eally
ass
esse
d th
roug
h ro
utin
e ad
min
istra
tive
reco
rds
subm
itted
by
indi
vidu
al h
ealth
trai
ning
in
stitu
tions
(min
istr
y of
hea
lth, m
inis
try
of
educ
atio
n). C
an a
lso
be a
sses
sed
thro
ugh
a qu
antit
ativ
e su
rvey
of t
rain
ing
inst
itutio
ns.
Data
on
gove
rnm
ent e
xpen
ditu
re id
eally
av
aila
ble
from
min
istr
y of
fina
nce.
Add
ition
al
data
on
train
ing
cost
s re
quire
d to
take
acc
ount
of
priv
ate
expe
nditu
re (e
.g. t
uitio
n fe
es, b
udge
t of
priv
ate
inst
itutio
ns, h
ouse
hold
exp
endi
ture
su
rvey
).
Data
on
train
ing
capa
city
, attr
ition
rate
s, o
utpu
t, ex
pend
iture
s an
d co
sts
disa
ggre
gate
d by
type
of i
nstit
utio
n (p
ublic
/priv
ate)
and
re
gion
. Dat
a on
gra
duat
es s
houl
d be
dis
aggr
egat
ed b
y ag
e, s
ex,
urba
n/ru
ral o
r oth
er s
ocio
dem
ogra
phic
cha
ract
eris
tics.
Addi
tiona
l qua
litat
ive
info
rmat
ion
may
be
requ
ired
on m
ain
bottl
enec
ks in
trai
ning
cap
acity
(e.g
. rec
ruitm
ent,
qual
ifica
tions
an
d re
tent
ion
of in
stru
ctor
s), o
pini
ons
on a
cces
sibi
lity
to c
linic
al
envi
ronm
ents
and
oth
er re
sour
ces,
car
eer e
xpec
tatio
ns (f
or
both
inst
ruct
ors
and
stud
ents
), ca
reer
cou
nsel
ling/
men
torin
g pr
ogra
mm
es fo
r stu
dent
s, a
nd re
ason
s fo
r stu
dent
attr
ition
(e.g
. fa
ilure
, tra
nsfe
r to
a no
n-he
alth
pro
gram
me,
mig
ratio
n).
In-m
igra
tio
n o
f tr
ain
ed
he
alt
h w
ork
ers
fro
m o
the
r co
un
trie
s
Num
ber o
f non
-nat
iona
l hea
lth w
orke
rs a
pply
ing
for e
ntry
vis
as,
per c
adre
Num
ber o
f ent
ry v
isas
issu
ed to
non
-nat
iona
l hea
lth w
orke
rs,
per c
adre
Idea
lly a
sses
sed
thro
ugh
rout
ine
adm
inis
trativ
e re
cord
s (m
inis
try
of fo
reig
n af
fairs
).Da
ta o
n in
-mig
rant
s id
eally
dis
aggr
egat
ed b
y ag
e, s
ex a
nd c
ount
ry o
f or
igin
. Add
ition
al fo
llow
-up
data
cou
ld b
e us
eful
, inc
ludi
ng e
vent
ual
post
ing
(urb
an/ru
ral)
and
leng
th o
f sta
y in
the
dest
inat
ion
coun
try.
Qual
itativ
e in
form
atio
n on
spe
cial
vis
a pr
ogra
mm
es fo
r tra
ined
he
alth
wor
kers
and
bila
tera
l agr
eem
ents
for m
anag
ed m
igra
tion
may
als
o be
requ
ired.
Ce
rtifi
ca
tio
n a
nd
lic
en
sin
g o
f h
ea
lth
se
rvic
e p
rovid
ers
Num
ber a
nd %
of n
ew n
atio
nally
trai
ned
heal
th w
orke
rs g
rant
ed
prof
essi
onal
cer
tifica
tion/
licen
sure
, per
cad
re
Num
ber a
nd %
of n
ew in
tern
atio
nally
trai
ned
heal
th w
orke
rs g
rant
ed
prof
essi
onal
cer
tifica
tion/
licen
sure
, per
cad
re
Idea
lly a
sses
sed
thro
ugh
rout
ine
adm
inis
trativ
e re
cord
s (p
rofe
ssio
nal r
egul
ator
y bo
dies
).Ad
ditio
nal q
ualit
ativ
e in
form
atio
n m
ay b
e re
quire
d on
mai
n re
ason
s fo
r uns
ucce
ssfu
l cer
tifica
tion/
licen
sing
.
Re
cru
itm
en
t in
to t
he
he
alt
h l
ab
ou
r m
ark
et
Exis
tenc
e of
job
boar
ds to
faci
litat
e re
crui
tmen
t of n
ewly
trai
ned
heal
th w
orke
rs
Num
ber o
f new
ly g
radu
ated
hea
lth w
orke
rs w
ho a
re e
mpl
oyed
in
the
heal
th la
bour
mar
ket w
ithin
3 m
onth
s of
gra
duat
ion
(or o
ther
na
tiona
lly d
efine
d tim
e pe
riod)
, per
cad
re
Num
ber o
f new
ly g
radu
ated
or l
icen
sed
heal
th w
orke
rs w
ho a
re
dive
rted
from
the
natio
nal h
ealth
labo
ur m
arke
t (e.
g. u
nem
ploy
ed,
mig
rate
, cho
ose
not t
o w
ork,
or w
ork
in a
non
-hea
lth jo
b), p
er c
adre
Idea
lly a
sses
sed
thro
ugh
rout
ine
adm
inis
trativ
e re
cord
s (m
inis
try
of h
ealth
, min
istr
y of
labo
ur,
min
istr
y of
fore
ign
affa
irs, p
rofe
ssio
nal
regu
lato
ry b
odie
s, a
ssoc
iatio
ns o
f priv
ate
prov
ider
s).
Info
rmat
ion
on la
bour
mar
ket p
artic
ipat
ion
shou
ld b
e pe
riodi
cally
val
idat
ed a
gain
st d
ata
from
a n
atio
nal l
abou
r for
ce s
urve
y.
Data
on
new
ent
rant
s to
the
heal
th la
bour
mar
ket i
deal
ly
disa
ggre
gate
d by
age
, sex
, urb
an/ru
ral,
and
plac
e of
wor
k (p
ublic
/pr
ivat
e).
Addi
tiona
l qua
litat
ive
info
rmat
ion
may
be
requ
ired
on re
gula
tions
an
d pr
actic
es fo
r int
erna
l and
ext
erna
l rec
ruitm
ent,
such
as
trans
pare
ncy
of g
over
nmen
t pra
ctic
e, o
fferin
g in
cent
ives
to s
erve
in
rura
l are
as, a
nd e
thic
al re
crui
tmen
t of f
orei
gn w
orke
rs.
Handbook on monitoring and evaluation of human resources for health
46
depending on the number of cadres in the health sys-
tem. The number and type of newly trained health
workers is relevant everywhere: in countries that need
increased production among all cadres, countries that
need increased training for workers tailored to rural
and underserved areas, and receiving countries that
are aiming towards national self-sufficiency of health
worker entry.
At the international and regional levels, it is important
to have standardized definitions, indicators and meas-
ures that can be compared and aggregated across
countries for global health workforce monitoring. The
most commonly reported measures related to entry
are production of physicians, nurses and midwives (9).
However, additional information on other categories
of health workers should be considered to reflect the
vital importance of all human resources in health sys-
tems, such as pharmacists, public health workers and
community health workers. As discussed in Chapter
2, given the differences across countries in occupa-
tional titles, training requirements and responsibilities,
data should be processed and disseminated such as
to enhance comparability across countries and over
time, notably by means of mapping to the International
Standard Classification of Education.
Also of particular importance is information on govern-
ment expenditure and financing for health vocational
education and training. These data can be used to
estimate the current costs of producing health workers,
and are needed for planning purposes to project future
costs. Combining information on expenditure with data
on student attrition or professional licensing exam pass
rates will enable more efficient training systems to be
identified, and wasteful programmes to be improved or
even eliminated.
Many data already exist within countries on heath
worker production but they are often difficult to access
and analyse. They tend to be fragmented, not shared
and stored in a form that make them difficult to com-
pare with data from other sources. Administrative
records may not be computerized and archived, and
statistics on the different components of HRH pro-
duction and entry are not routinely compiled, updated
or analysed. Further challenges include the fact that
many information systems only contain data for the
public sector. As such, the usefulness of the data for
policy-makers and researchers will depend on the
completeness, reliability and timeliness of the informa-
tion and monitoring system, which itself is dependent
on the level of collaboration between key stakeholders,
including the ministry of health, ministry of education,
ministry of finance, individual training institutions, pro-
fessional regulatory bodies and the private sector (for
example associations of private providers and non-
governmental or faith-based organizations that provide
health services). Ideally, the information system would
be characterized with the use of unique personal
identification numbers, which would allow tracking of
individual workers from the time they enter pre-service
training and throughout their career; this will be dis-
cussed further in Chapter 9.
Entry can be politically sensitive: through admission
criteria to health education programmes and proc-
esses for credentialing and regulation, political actors
negotiate their respective interests. In many low- and
middle-income countries, health-care careers, espe-
cially among physicians and nurses, are among the
most highly respected, remunerated and sought-
after. Many stakeholders watch closely entry into the
health professions. Failure to understand and address
these stakeholders’ interests can result in opposition to
health workforce reform. In addition, in many countries
the pool of eligible candidates for advanced training in
health restricts recruitment, and the search for alterna-
tive solutions has led to populist (but not necessarily
sustainable) pathways for expanding the health work-
force, such as engaging volunteers or importing health
workers from other countries. Another sensitive issue
is the division of tasks among various cadres in the
health-care team – for example, those who can pre-
scribe medicines or perform a Caesarean section – or
the creation of new cadres, such as paramedical prac-
titioners (sometimes called physician assistants or
clinical officers) or community health workers, which
typically provokes resistance from established cadres.
In some contexts, entry into the health workforce can
be also a lever for cultural and social changes, such
as an increase in the proportion of women or students
from rural or other underserved communities trained for
a professional career in this sector.

Framework and measurement issues for monitoring entry into the health workforce
47
4.4 Summary and conclusionsAs has been discussed in this chapter, timely and
accurate data on entry into the health labour market
are essential for evidence-informed planning and man-
agement of health systems. During implementation of
national HRH plans and strategies, policies and inter-
ventions must be monitored, managed and adjusted
if necessary. The labour or educational market may
change quickly as the economy changes, positively
or negatively affecting the quality of candidates for
health occupations. The population size and structure,
immigration patterns and burden of disease may also
change, necessitating a change in training curricula or
workforce size or skill mix. All these changes have to
be taken into account in the policy-making process.
Health sector actors must actively monitor the whole
situation to be able to respond appropriately, and to be
able to gauge the success of interventions.
Seven components of the health worker production
pipeline were identified for which data are needed.
They were: (i) the pool of eligible candidates for health
education; (ii) recruitment and selection of students
to health education programmes; (iii) accreditation
of health education institutions; (iv) capacity and out-
put of health education institutions; (v) in-migration of
trained health workers from other countries; (vi) cer-
tification and licensing of health service providers
(nationally or internationally trained); and (vii) recruit-
ment into the health labour market. As such, measuring
and monitoring the entry function requires comprehen-
sive information on education and training at different
levels, including basic education.
Policy-makers have a responsibility to analyse the rele-
vant data and formulate policy on all of the seven entry
issues. The process of collecting, analysing and acting
on these entry data is not just a one-time exercise, but
would be an ongoing activity of the ministry of health
(or other agency mandated by the government for that
purpose). At certain critical points of HRH planning and
monitoring, special surveys or studies may be needed
to validate or gather additional entry data that are not
feasible to gather on a routine basis. It is important for
the ministry of health to partner with other responsi-
ble ministries, education and training institutions, and
stakeholders to work together to provide the coun-
try with the proper numbers of appropriately trained
health-care workers.
References1. Pan American Health Organization. Public health
in the Americas: conceptual renewal, performance
assessment and bases for action. Washington, DC,
Pan American Health Organization/World Health
Organization, 2002.
2. Dunbabin J, Levitt L. Rural origin and rural medical
exposure: their impact on the rural and remote
medical workforce in Australia. Rural and Remote
Health, 2003, 3:212 (http://www.rrh.org.au/articles/
subviewnew.asp?ArticleID=212, accessed 12
January 2009).
3. Dussault G, Franceschini MC. Not enough there, too
many here: understanding geographical imbalances
in the distribution of the health workforce. Human
Resources for Health, 2006, 4:12 (http://www.human-
resources-health.com/content/4/1/12, accessed 11
January 2009).
4. Serneels P et al. For public service or money:
understanding geographical imbalances in the
health workforce. Health Policy and Planning, 2007,
22(3):128–138.
5. Wibulpolprasert S. Inequitable distribution of
doctors: can it be solved? Human Resources
Development Journal, 1999, 3:1 (http://www.who.int/
hrh/hrdj/en/index4.html, accessed 12 January 2009).
6. Wang L. A comparison of metropolitan and rural
medical schools in China: which schools provide
rural physicians? Australian Journal of Rural Health,
2002, 10:94–98.
7. Salafsky B, Glasser M, Ha J. Addressing issues
of maldistribution of health care workers. Annals
of the Academy of Medicine Singapore, 2005,
34(8):520–525 (http://www.annals.edu.sg/
pdf/34VolNo8200509/V34N8p520.pdf, accessed 12
January 2009).
8. Smucny J et al. An evaluation of the rural medical
education program of the State University of New
York Upstate Medical University, 1990–2003.
Academic Medicine, 2005, 80(8):733–738.
9. The world health report 2006: working together for
health. Geneva, World Health Organization, 2006
(http://www.who.int/whr/2006, accessed 10 January
2009).
10. Allen MK et al. Educating health workers: a statistical
portrait, 2000 to 2004. Ottawa, Statistics Canada,
2007 (http://www.statcan.gc.ca/pub/81–595-m/81–
595-m2007049-eng.pdf, accessed 13 January
2009).
11. Dussault G et al. Assessing the capacity to produce
health personnel in Rwanda. Leadership in Health
Services, 2008, 21(4):290–306 (http://www.
emeraldinsight.com/10.1108/17511870810910092,
accessed 13 January 2009).
12. International Standard Classification of Education:
ISCED 1997. Paris, United Nations Educational,
Scientific and Cultural Organization, 1997 (http://
www.uis.unesco.org/TEMPLATE/pdf/isced/
ISCED_A.pdf, accessed 10 January 2009).
13. Bryant NH, ed. Women in nursing in Islamic
countries. Oxford, Oxford University Press, 2003.

Handbook on monitoring and evaluation of human resources for health
48
14. Ozden C. Migration of nurses and physicians from
Ghana. World Bank Working Paper. Washington, DC,
World Bank, 2008.
15. Hennen, B. Demonstrating social accountability in
medical education. Canadian Medical Association
Journal, 1997, 156(3):365–367 (http://www.
pubmedcentral.nih.gov/picrender.fcgi?artid=122695
8&blobtype=pdf, accessed 13 January 2009).
16. Boelen C. Building a socially accountable health
professions school: towards unity for health.
Education for Health, 2004, 17(2):223–231.
17. Karle H and World Federation for Medical Education
Executive Council. International recognition of basic
medical education programmes. Medical Education,
2008, 42(1):12–17.
18. Beciu H, personal communication. Washington, DC,
World Bank, 2008.
19. Aluwihare APR. Physician migration: donor country
impact. Journal of Continuing Education in the
Health Professions, 2005, 25(1):15–21.
20. Bach S. International migration of health workers:
labour and social issues. Sectoral Activities
Programme Working Paper No. 29. Geneva,
International Labour Office, 2001 (http://www.ilo.ch/
public/english/dialogue/sector/papers/health/wp209.
pdf, accessed 13 January 2009).
21. Lorenzo FME et al. Nurse migration from a source
country perspective: Philippine country case study.
Health Services Research, 2007, 42(3p2):1406–1418.
22. Brush B, Sochalski J. International nurse migration:
lessons from the Philippines. Policy, Politics, and
Nursing Practice, 2007, 8(1):37–46.
23. Ethical nurse recruitment. Geneva, International
Council of Nurses, 2001.
24. The World Medical Association statement on
ethical guidelines for the international recruitment
of physicians. Ferney-Voltaire, World Medical
Association, 2003.
25. Schuwirth L. The need for national licensing
examinations. Medical Education, 2007,
41(11):1022–1023.
26. Shengelia B et al. Access, utilization, quality, and
effective coverage: an integrated conceptual
framework and measurement strategy. Social
Science and Medicine, 2005, 61(1):97–109.
27. Xu Y, Zhang J. One size doesn’t fit all: ethics of
international nurse recruitment from the conceptual
framework of stakeholder interests. Nursing Ethics,
2005, 12(6):571–581.
28. Pan American Health Organization. Regional
goals for human resources for health 2007–2015.
Washington, DC, Pan American Health Organization
and World Health Organization, 2007 (http://www.
paho.org/english/gov/csp/csp27–10-e.pdf, accessed
12 January 2009).
29. International Household Survey Network (http://www.
internationalsurveynetwork.org/home/, accessed 13
January 2009).
49
Monitoring health workforce transitions and exits
PASCAL ZURN, KHASSOUM DIALLO, YOHANNES KINFU
5.1 IntroductionThe world health report 2006, published by the World
Health Organization (WHO), drew global attention to
the human resources for health (HRH) crisis, man-
ifested by shortages and imbalances in the health
workforce undermining the performance of health sys-
tems and exercising adverse impacts on the ability of
many countries to promote and enhance the health of
their population (1). The HRH crisis has several causes
and consequences. In many low- and middle-income
countries, in addition to past and current investment
shortfalls in pre-service education and training, interna-
tional migration of skilled health workers and premature
exit from the health labour pool due to career change,
early retirement, work-limiting morbidity and prema-
ture mortality are among the main responsible factors.
Yet, in many countries, the dynamics of movements
within and exits from the health workforce are poorly
understood, limiting the capacity of governments and
stakeholders to design and implement effective, equi-
table and cost-efficient intervention programmes for
enhancing workforce retention. This challenge ema-
nates in part from the absence of timely and relevant
data and information on inflows and outflows of health
workers, but also from the lack of widely accepted
standardized indicators associated with the measure-
ment of workforce flows.
The most commonly monitored dimensions of health
workforce metrics have traditionally been limited to two
indicators: current health workforce stock (the number
of workers participating in the health labour market at
a given time) and the number of newly trained health
service providers (number of graduates of health
professions education programmes over a given refer-
ence period) (as detailed in Chapters 3 and 4 of this
Handbook, respectively). However, adequate under-
standing of health workforce dynamics requires an
analysis not only of new entries and current stock, but
also of the flows within and out of the health workforce.
In this chapter, a framework is provided for identifying
and analysing major health workforce transitions and
factors associated with exit from the active workforce;
a comprehensive set of indicators that could poten-
tially be measurable from standard statistical sources
is proposed; and the underlying data requirements are
specified. Illustrative analyses from several contexts
are also provided, and the implications of observed
patterns for policy and planning are discussed.
5.2 Transitions within and exits from the health workforce: a framework for analysisBuilding an adequate workforce supply, capable of
addressing the health needs of the population, begins
with the education and deployment of skilled health
workers. Once having entered the health system, they
then experience different forms of transition along the
working lifespan. There is a growing body of litera-
ture showing that health workforce turnover is directly
influenced by inadequate compensation, poor work-
ing conditions (such as lack of medical equipment and
poor workplace safety) and job dissatisfaction (due
to various reasons, including low work autonomy, lim-
ited opportunities for professional development and
inflexible working hours), combined with better career
options elsewhere and other factors exogenous to the
health system (for example living conditions and edu-
cational opportunities for children) (2–4). This includes
geographical movements of health workers within and
across countries, professional movements within and
outside the health sector and other types of move-
ments. For the purpose of the present chapter, all
labour movements that occur within the national health
sector are considered as “transitions” (or intrasectoral
mobility); and those that involve a movement away from
the health sector (intersectoral mobility) or to another
country (international out-migration) are considered as
“exits” from the health workforce. These dynamics are
summarized in Figure 5.1.
5

Handbook on monitoring and evaluation of human resources for health
50
Transitions within the national health labour market may
involve changes in work patterns, places and positions.
The flow of health workers from rural and remote areas
to urban and more affluent regions, known as geo-
graphical transition, is probably the most common type
of transition. Also of importance is movement of work-
ers across sectors (for example from the public to the
private sector) or from one type of service delivery point
to another (for example from a primary-level health-
care centre to a tertiary-level hospital). Given the social
and political importance of ensuring universal access
to essential and affordable health services, notably
through primary health-care strengthening, monitoring
the movement of workers away from public health-care
facilities is a concern for decision-makers and stake-
holders in many low- and middle-income countries.
Another type of transition that needs to be considered
is occupational transition: health workers may move
from one health occupation to another, or to a non-
health occupation within the health sector. Often this is
a reflection of career progression, for instance a nurs-
ing care provider being promoted to nursing services
manager. An example that has attracted considera-
ble interest in recent years, as mentioned in Chapter
4, is the phenomenon observed in the Philippines of
doctors retraining as nurses in order to facilitate their
chances of international migration. In some contexts,
there is concern over the exodus of health profession-
als previously providing direct patient care (usually in
lower-paying jobs in public sector facilities) to project
management jobs in the expanding donor-supported
nongovernmental sector (5, 6). Other types of work
pattern transitions – such as from full-time to part-time
positions – may be prompted by changes in individ-
ual circumstances or overall economic conditions in
the country. Monitoring such trends is critical to under-
standing HRH dynamics within and across occupations
and the possible implications for overall workforce skills
mix and capacity for provision of quality services.
At the same time, it is important to keep in mind that
such transitions are not necessarily mutually exclusive;
a single move could actually combine different types
of transitions. For example, the move of a nurse prac-
titioner working in a public sector health centre in a
rural area to a job as manager of nursing care services
in a private hospital in the capital city simultaneously
involves occupational, sectoral, institutional and geo-
graphical transition.
With regard to exits from the national health system, these
include movements that are either voluntary or invol-
untary, permanent or temporary in nature. Temporary
exits are categorized as those where the health worker
is assumed to have a chance to re-enter the system at
some future point, usually in the shorter term. Maternity
or family care leave, sickness or other emergency leave,
unemployment and return to studies are among the most
frequent causes of temporary exit from the economically
productive workforce. Retirement, death, work-limiting
chronic disability and international out-migration are
examples of “permanent” exits (although the possibility
remains that a worker who has retired early or migrated
abroad may still opt to eventually return to the national
health labour market).
Figure 5.1 Transitions within and exits from the health workforce: a framework for analysis
Permanent or temporary outflow due to death, retirement, morbidity, unemployment, other
Othersectors
Health sector
International migrants
Country I
Transition within the health sector Exit from the health sector
Country II
Othersectors
Health sector
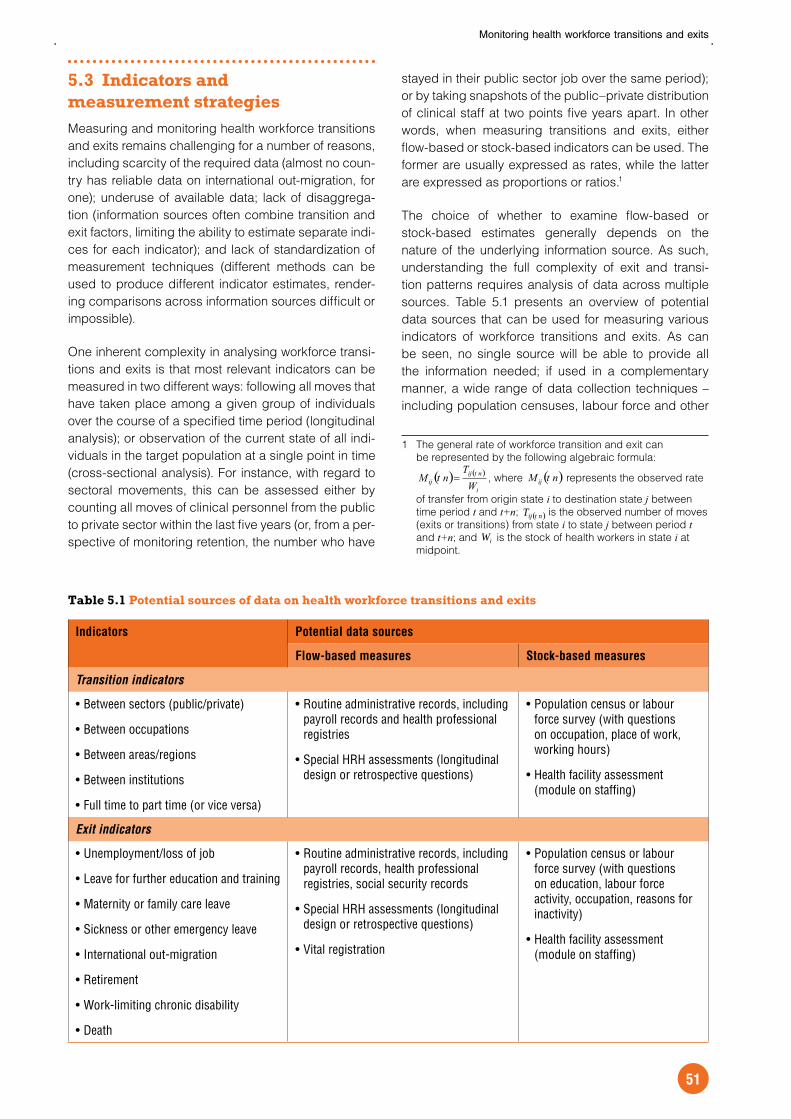
Monitoring health workforce transitions and exits
51
5.3 Indicators and measurement strategiesMeasuring and monitoring health workforce transitions
and exits remains challenging for a number of reasons,
including scarcity of the required data (almost no coun-
try has reliable data on international out-migration, for
one); underuse of available data; lack of disaggrega-
tion (information sources often combine transition and
exit factors, limiting the ability to estimate separate indi-
ces for each indicator); and lack of standardization of
measurement techniques (different methods can be
used to produce different indicator estimates, render-
ing comparisons across information sources difficult or
impossible).
One inherent complexity in analysing workforce transi-
tions and exits is that most relevant indicators can be
measured in two different ways: following all moves that
have taken place among a given group of individuals
over the course of a specified time period (longitudinal
analysis); or observation of the current state of all indi-
viduals in the target population at a single point in time
(cross-sectional analysis). For instance, with regard to
sectoral movements, this can be assessed either by
counting all moves of clinical personnel from the public
to private sector within the last five years (or, from a per-
spective of monitoring retention, the number who have
stayed in their public sector job over the same period);
or by taking snapshots of the public–private distribution
of clinical staff at two points five years apart. In other
words, when measuring transitions and exits, either
flow-based or stock-based indicators can be used. The
former are usually expressed as rates, while the latter
are expressed as proportions or ratios.1
The choice of whether to examine flow-based or
stock-based estimates generally depends on the
nature of the underlying information source. As such,
understanding the full complexity of exit and transi-
tion patterns requires analysis of data across multiple
sources. Table 5.1 presents an overview of potential
data sources that can be used for measuring various
indicators of workforce transitions and exits. As can
be seen, no single source will be able to provide all
the information needed; if used in a complementary
manner, a wide range of data collection techniques –
including population censuses, labour force and other
1 The general rate of workforce transition and exit can
be represented by the following algebraic formula:
( ) ( )
i
ntijij W
TntM = , where ( )ij ntM represents the observed rate
of transfer from origin state i to destination state j between
time period t and t+n; ( )ntijT ,is the observed number of moves
(exits or transitions) from state i to state j between period t and t+n; and iW
n time is the stock of health workers in state i at
midpoint.
Table 5.1 Potential sources of data on health workforce transitions and exits
Indicators Potential data sources
Flow-based measures Stock-based measures
Transition indicators
Between sectors (public/private)
Between occupations
Between areas/regions
Between institutions
Full time to part time (or vice versa)
Routine administrative records, including payroll records and health professional registries
Special HRH assessments (longitudinal design or retrospective questions)
Population census or labour force survey (with questions on occupation, place of work, working hours)
Health facility assessment (module on staffing)
Exit indicators
Unemployment/loss of job
Leave for further education and training
Maternity or family care leave
Sickness or other emergency leave
International out-migration
Retirement
Work-limiting chronic disability
Death
Routine administrative records, including payroll records, health professional registries, social security records
Special HRH assessments (longitudinal design or retrospective questions)
Vital registration
Population census or labour force survey (with questions on education, labour force activity, occupation, reasons for inactivity)
Health facility assessment (module on staffing)

Handbook on monitoring and evaluation of human resources for health
52
household surveys, health facility assessments, routine
administrative records and specialized quantitative or
qualitative HRH studies – can provide a more complete
picture of the dynamics. A general review of standard
statistical sources and their strengths and limitations
for HRH analysis is presented in Chapter 3.
To give an example, one way of measuring occupational
transition using a stock-based approach is through
using labour force survey data to calculate the propor-
tion of individuals in the country with education and
training in a given health field who are currently work-
ing in a different occupation (irrespective of when they
moved from qualification for one occupation to practice
in another). Measuring the same dynamic using a flow-
based approach – for example to calculate an annual
rate of movement from one health occupation to another
– can be accomplished using health professional reg-
istries, provided they are continuously updated to
reflect current work activities. Specially designed HRH
assessments for collecting job histories and trajecto-
ries among health workers, either by reinterviewing the
same cohort at periodic intervals over an extended
time or by singular in-depth interviews with questions
on labour activities at some point in the past, also allow
for estimates of occupational flows.
Similarly, unemployment among skilled health work-
ers can be expressed in different ways depending on
the data source. Population survey or census data on
education, labour force participation and reasons for
inactivity can be used for stock estimates (for example
the number of currently unemployed individuals with
education and training leading to a health occupation,
relative to the total number of employed health work-
ers of the same occupation). Routine data from health
professional registries can potentially offer information
on numbers of qualified health workers who were ever
unemployed over the past year. Health facility assess-
ments with modules on staffing levels and patterns can
help shed light on the magnitude of the problem by tal-
lying the numbers of health service providers who lost
their jobs in the previous year. Such results can then be
analysed within the context a monitoring and evalua-
tion framework, for example to gauge trends over time,
across regions or by occupational group.
Geographical transitions within a country can also be
assessed with a number of measures. A stock-based
assessment drawing on periodic census data could
compare, for instance, the density of health workers in
a given region at the time of enumeration against the
same density enumerated in the previous census. A
related flow-based measure could be obtained through
administrative records designed to allow tracking of
individuals, enabling measurement of the number of
health workers moving from a given region to another
over the specific time period. Flow estimates can
also be obtained indirectly from a census or survey if
respondents are asked about their place of residence
five or ten years earlier (assuming they held the same
occupation at that previous time).
Ideally, international migration should be measured
adopting the same approach. In reality, few coun-
tries have accurate and timely data on the numbers of
nationals living abroad or leaving the country. Concerns
about the adverse impact of the migration of health pro-
fessionals, especially from poorer to richer countries,
have thrust the issue to the forefront of the global health
and development policy agenda in recent years (1).
However, the evidence needed to monitor and eval-
uate the phenomenon remains weak or non-existent
(7, 8). Most available analyses are excessively reliant
on indirect quotations, largely based on extrapolation
of measures compiled and disseminated in destina-
tion countries: (i) census-based estimates of lifetime
migration (by country of birth of individuals practising
a health occupation in the destination country at the
time of enumeration, regardless of place of education);
(ii) registry-based estimates of foreign-trained workers
newly obtaining professional licensure (which do not
count skilled workers who fail to satisfy national practice
regulations); and (iii) numbers of residency or work per-
mits issued to foreigners according to the self-reported
occupation held in their country of origin (regardless
of eventual work activity in the destination country). In
this context, ensuring comparability of such measures
– including occupational definitions, education equiv-
alencies and professional practice regulations across
the source and destination countries – is particularly
imperative.
Another challenging area is measuring mortality among
health workers: even in countries where vital registration
coverage is very high or complete, occupation-specific
mortality data are rarely tabulated and disseminated.
Again, most available measures use indirect estimation
techniques. This includes examination of facility staff-
ing records for deaths while in employment, or the use
of model life tables applying age- and sex-specific sur-
vival ratios against the demographic distribution of the
active health workforce to estimate numbers of prema-
ture deaths.
By contrast, measuring workforce exits due to retire-
ment is relatively straightforward. Estimates can often
be obtained from payroll or social security records.
In the absence of reliable data from administrative
sources, population-based census and survey tools
are another option if they include data on educational
attainment by field (or on previous occupation) and

Monitoring health workforce transitions and exits
53
reasons for labour force inactivity. In many cases it is
possible to use the legal age of retirement as a proxy
measure, and assume that all health workers remaining
alive and in the country will retire at that age.
5.4 Illustrative analysesIn this section, illustrative analyses of different types of
workforce transitions and exits are presented from var-
ious contexts, and using different methodologies and
data sources as described in the previous section.
5.4.1 Transitions within the national health labour marketAs mentioned earlier, different approaches can be
used to collate information on transitions within the
health workforce, largely depending on data availa-
bility, relevance and quality. An example of sectoral
transitions can be gleaned from a special HRH survey
in Sri Lanka, which included interviews among a sam-
ple of facility-based health workers across the country
(9). According to retrospective questions on place of
work prior to the current location, the large majority
(96%) of hospital-based health workers in the public
sector also listed a government hospital as their previ-
ous workplace. Among staff in private hospitals, 62% of
those who had previously worked elsewhere reported
having moved from a government hospital. Altogether,
fewer than 0.5% of facility-based workers reported their
previous place of work as outside the health sector.
In another example based on a special HRH survey,
higher levels of occupational transition – that is, move-
ment from one occupation to another while remaining
employed in the health sector – were observed among
medical practitioners compared to nursing personnel
in Lesotho. The turnover rate was highest among med-
ical specialists (16.7%) and considerably lower among
nursing officers (4.4%) (10).
Another potential means to measure and monitor
occupational transitions is by using professional and
academic registries. In the Philippines (probably the
largest exporter of nurses worldwide), it was estimated
that of students who took the national exams for nurs-
ing licensure, more than 4000 were previously doctors,
a figure that represents about 10% of the total number
of doctors in the country (11).
5.4.2 International migrationInternational outflows of health workers are rarely meas-
ured directly at the country level. Some inferences
can be made, for example through qualitative stud-
ies on migration intentions. Findings from special HRH
surveys in six African countries revealed substantially
high proportions of health professionals – from 26% in
Uganda to 68% in Zimbabwe – declaring an intention
to emigrate, mostly to high-income countries of Europe
and North America but also to some other African coun-
tries (12). Another indirect measure is through numbers
of verifications of professional licensure with national
regulatory bodies. For instance, prospective foreign
employers of nurses seeking employment abroad may
request verification of licensure with the nursing coun-
cil in the country of origin. In Kenya, such data from the
national Nursing Council pointed to the United States
of America as one of the main intended host countries
for Kenyan nurses looking to practise abroad (13). In
both of these cases, while useful for weighing general
trends, the data refer only to migration intentions, and
do not confirm that a health worker has actually (or will
ever have) out-migrated.
The main means of assessing levels of international
migration is through examining data in the destination
country according to the migrant worker’s country of
origin (in terms of birth, citizenship or professional edu-
cation). As illustration, data from the United Kingdom
Nursing and Midwifery Council (14) allow estimation
of trends in nursing exits from source countries (Table
5.2). The data reveal major changes between 1998
and 2007 in the distribution of foreign-trained nurses
in the United Kingdom: from mostly high-income
countries at the beginning of the period of observa-
tion (Australia and New Zealand), to more and more
nurses from low- and middle-income countries (nota-
bly India and the Philippines). Some countries, such as
Nepal and Pakistan, which previously had no or very lit-
tle out-migration towards the United Kingdom, are now
among the main source countries. Migration levels from
selected African countries appear to have peaked in
around 2002/03, especially for South Africa. It may fur-
ther be noted that South Africa itself is home to many
foreign-qualified health professionals: data from the
Health Professions Council of South Africa indicate
that one quarter (24%) of registered doctors had been
trained in a different country (15).
Combining migration data across multiple destina-
tion countries can help present a broader picture. In
this context, population census data are often valu-
able, as census measurement tools tend to be more
standardized, allowing for international comparisons.
Figure 5.2 presents selected findings using merged
census data on foreign-born health professionals liv-
ing in 24 high-income countries of the Organisation for
Economic Co-operation and Development (OECD),
including Australia, the United Kingdom and the United
States of America. While migration patterns may vary
significantly from one country to another, one key

Handbook on monitoring and evaluation of human resources for health
54
finding stands out: nurses born in the Philippines (some
110 000 in number) and doctors born in India (56 000)
represent a major part of the immigrant health work-
force in OECD countries (about 15% of the total stock
each) (8).
Extending such analysis by combining data on in-
migrants in destination countries with information on
the active health workforce in countries of origin can
help gain some further sense of the magnitude of inter-
national emigration. Such an analysis is depicted in
Figure 5.3, where census data on foreign-born doctors
residing in OECD countries at the time of enumera-
tion are compared to official statistics on the domestic
workforce for those same origin countries. Some coun-
tries – in particular, small island developing nations
of the Caribbean and South Pacific and certain sub-
Saharan African countries with severe shortages of
Table 5.2 Annual numbers of overseas-trained nurses obtaining national licensure to practise in the United Kingdom, 1998–2007 (main countries of origin outside the European Economic Area)
Country
of nursing
education
Year professional licensure obtained in the United Kingdom
1998/99 1999/00 2000/01 2001/02 2002/03 2003/04 2004/05 2005/06 2006/07
India 30 96 289 994 1830 3073 3690 3551 2436
Philippines 52 1052 3396 7235 5593 4338 2521 1541 673
Australia 1335 1209 1046 1342 920 1326 981 751 299
Nigeria 179 208 347 432 509 511 466 381 258
Pakistan 3 13 44 207 172 140 205 200 154
Nepal 0 0 0 0 71 43 73 75 148
Zimbabwe 52 221 382 473 485 391 311 161 90
China 0 0 0 0 0 0 60 66 80
New Zealand 527 461 393 443 282 348 289 215 74
Ghana 40 74 140 195 254 354 272 154 66
Zambia 15 40 88 183 133 169 162 110 53
South Africa 599 1460 1086 2114 1368 1639 933 378 39
Kenya 19 29 50 155 152 146 99 41 37
Canada 196 130 89 79 52 89 88 75 31
Source: United Kingdom Nursing and Midwifery Council (14).
Figure 5.2 Foreign-born nurses and doctors enumerated in 24 OECD countries by main countries of origin (population census data, around 2000)
Source: Dumont and Zurn (8).
Nurses
0 20,000 40,000 60,000 80,000 100,000 120,000
Philippines
United Kingdom
Germany
Jamaica
Canada
Ireland
Nigeria
Haiti
Former Yugoslavia
Mexico
China
Former Soviet Union
Trinidad and Tobago
Poland
Doctors
0 10,000 20,000 30,000 40,000 50,000 60,000
India
Germany
United Kingdom
PhilippinesChina
Algeria
PakistanCanada
Iran
Viet Nam
South Africa
EgyptMorocco
Cuba
Former Soviet Union

Monitoring health workforce transitions and exits
55
medical personnel – appear to be disproportionably
affected by out-migration. These are countries with
estimated lifetime emigration rates above 50% (which
means that there are as many doctors born in these
countries working in the OECD region as there are doc-
tors working in the home country) (8).
5.4.3 Workforce exits due to mortalityIn several southern African countries, especially where
HIV prevalence is high, death is emerging as one of the
most important causes of exits from the health work-
force (16). Effects include both the permanent loss of
individual workers and temporary increases in staff
absenteeism to attend funerals. However, systematic
data collection on this issue is lacking: few countries
routinely compile and disseminate occupation-specific
mortality data via their vital registration system (usually
the main source of information on deaths and births in
a country).
Measuring and monitoring the extent and effects of
premature health worker mortality often calls for special
tools and approaches. In one pilot study conducted in
Zambia, time trends were estimated at two hospitals
based on the numbers of archived death certificates
for female nurses compared to the numbers of person-
years of service (17). Results suggested that mortality
among the female nursing workforce increased more
than tenfold between 1980 and 1991, from 2.0 to 26.7
per 1000. The observed increase was largely attributed
to HIV.
Often, workforce mortality must be estimated indirectly
using model life tables and other demographic and
epidemiological projection techniques. An illustrative
example of the application of such techniques for 12
African countries is presented in Table 5.3. The results
were obtained by dividing the projected annual number
of premature deaths among active health workers
(based on age- and sex-specific mortality quotients
extracted from national life tables) by the baseline total
number of health workers (according to official work-
force statistics compiled by WHO). Premature deaths
were defined as those occurring under age 60. Overall,
each year these countries are expected to lose about
2% of their medical, nursing and midwifery workforce to
premature mortality. As could be expected (given the
underlying assumption that mortality patterns among
health workers follow those of the total population),
somewhat lower estimated death rates among nursing
and midwifery personnel compared to doctors would
be the reflection of higher proportions among the
former of women, for whom age-specific death rates
tend to be lower compared to their male counterparts.
Figure 5.3 Estimated lifetime emigration rate of physicians born in selected non-OECD countries and working in OECD countries at the time of the census
Source: Dumont and Zurn (8).
Table 5.3 Estimates of annual losses due to mortality under age 60 among health workers in selected countries of the WHO Africa Region, based on life table analysis
Country Premature death rate
per 1000 workers
Physicians Nursing and midwifery personnel
Central African Republic
25 21
Congo, Democratic Republic
23 19
Côte d’Ivoire 25 22
Ethiopia 23 20
Kenya 23 23
Liberia 24 20
Madagascar 21 20
Rwanda 25 19
Sierra Leone 26 22
Uganda 26 22
United Republic of Tanzania
24 22
Zambia 28 22
Total 24 21
Source: From the authors.
0% 25% 50% 75% 100%
Antigua and Barbuda
Grenada
Guyana
Mozambique
Angola
Fiji
Sierra Leone
United Republic of Tanzania
Trinidad and Tobago
Liberia

Handbook on monitoring and evaluation of human resources for health
56
5.4.4 Workforce exits due to retirement and other reasonsGenerally, three types of data are used to shed light
on health worker retirement: (i) routinely compiled num-
bers of individuals retiring from the health workforce
as recorded in the payroll, social security records or
professional registries; (ii) counts of retirees among
those with the educational background to qualify for a
health occupation as reported in a population census
or survey; and (iii) in the absence of direct measures,
qualitative survey data on retirement intentions among
health workers. Retirement data plotted against the
age distribution of the active workforce are commonly
used in workforce projection models to estimate future
supply.
Regardless of the information source, one complex-
ity to monitoring trends in workforce retirement is that
there is no universal definition of what “retirement” actu-
ally means. Some analyses may consider retirement as
the period immediately following gainful employment,
or the period of life above a certain age. In a case from
Canada, where many parts of the country do not have
mandatory retirement, the national medical association
records any physician who exits the medical workforce
as “retired”, regardless of age and cause (18). In this
context, as seen in Figure 5.4, even workers as young
as 30 are considered to have retired.
Most HRH databases do not allow differentiation
between retirement, death and departure from the
workforce for other reasons, either in the short or the
long term. With regard to temporary exits, special
absenteeism surveys including unannounced visits
may capture data on proportions of facility-based prac-
titioners who were not at their assigned post. In one
such application in Bangladesh, over one third (35%)
of health workers were found to be temporarily absent
on the day of visit (for explained or unexplained rea-
sons). Proximity of the worker’s residence to the health
facility, opportunity cost of the worker’s time and other
indicators of general socioeconomic conditions (road
access, rural electrification) were identified as the main
correlates of absenteeism patterns (19).
It is possible that some recorded long-term workforce
exits are due to change of occupation, notably to one
outside the health sector. Labour force surveys – which
include data across all economic branches in the
national economy – can help shed some light on this
point, although the ability to draw comparisons across
countries or over time will depend on the question-
naire and sampling design of the original source. For
instance, an analysis of labour force survey data from
four countries showed wide cross-national differences
in the proportion of respondents reporting an occupa-
tion in medicine or nursing but not working at a health
service delivery point (and thus who might not be cap-
tured in facility- or payroll-based data sources) (Figure
5.5). The highest proportion was found in the Denmark
sample, which included those who were unemployed
or had returned to school at the time of the survey (20).
Figure 5.4 Retirement rate among physicians by age group according to the National Medical Association registry, Canada, 2005
Source: Pong, Lemire and Tepper (18).
Figure 5.5 Proportion of survey respondents reporting a health occupation but not working in the health services industry at the time of interview, selected countries
Source: Gupta et al. (20).
0%
10%
20%
30%
40%
Denmark Netherlands United Kingdom United States
PhysiciansNursing and midwifery professionals
0
1
2
3
4
30 or less 31–40 41–50 51–60 61–65 66–70 71 or
Age group
Ret
irem
ent r
ate
older

Monitoring health workforce transitions and exits
57
5.5 Concluding remarks: implications for policy and planningThis chapter has reviewed the current state of knowl-
edge on measuring and monitoring health workforce
transitions and exits for policy and planning purposes.
Understanding these workforce dynamics could help
in identifying imbalances in health worker distribution
within and across countries, and in implementing reten-
tion policies that encourage workers to stay (or return
to) where their skills and services are needed most. It
is also being increasingly recognized that the key to
maintaining a sufficient workforce for achieving health
systems goals is to educate, recruit and retain young
health practitioners, while also reinvesting in the mature
workforce. In this context, having and making use of
appropriate data from different sources to monitor and
address HRH challenges across the working lifespan
is critical.
Information on past and projected movements of the
workforce is needed to make future workforce sup-
ply projections, necessary as a basis for formulation
of evidence-based HRH planning and rationalized
decision-making. Given their nature, few types of tran-
sitions and exits (aside perhaps from retirement) can
be accurately predicted; however, all types need to be
accounted and planned for in national HRH develop-
ment strategies. In most countries, transitions within
the health workforce – such as change of employ-
ment sector or rural–urban migration while remaining in
health services – are likely to be an important workforce
dynamic; however, timely and reliable data tend to be
scarce. Often, policy- and decision-makers must rely
on information from special HRH assessments (ad hoc
in nature) or periodic assessments based on stock-
based estimates of the current situation observed at
two different points in time (and then making infer-
ences on the flows that actually occurred between the
two points). When it comes to monitoring exits from the
national health labour market, data must often be col-
lated from sources outside the health sector or even
outside the country altogether.
Notably lacking in many countries is systematic data
collection on morbidity and mortality among health
workers, crucial for monitoring workplace health and
safety – often a major factor influencing attrition from
the health sector. Understanding the causes of work-
force losses can help inform, for example, strategies for
preventing HIV and other diseases among health work-
ers to reduce premature mortality in the longer-term,
while providing appropriate treatment for health work-
ers who need it to enable them to work longer (21).
Even data on health workforce retirement, increasingly
becoming a major issue given global patterns of work-
force ageing, are often deficient. Relying on a given
age (for example statutory retirement) to project num-
bers of retirees is likely to be inadequate, as differences
in actual age at retirement are often observed across
occupations or by sex. Having a good sense of retire-
ment rates is valuable to plan future health workforce
supply, and can also be used to prepare flexible work
policies encouraging delayed retirement. For instance,
a flexible-retirement initiative in the United Kingdom
enabled physicians nearing retirement to move into
part-time work while preserving pension entitlements
(22).
Recruiting back individuals trained in health services
delivery but either working outside the health sector
or economically inactive can represent an attractive
option to increase health system capacity. For that pur-
pose, it is crucial to determine the size of the potential
pool of individuals concerned in order to evaluate the
opportunity and potential impact of such an initiative.
In the United States of America, as of 2004, almost
17% (or some 488 000) of surveyed nurses included
in the national professional registry were not employed
in nursing (23). Although many were older, and thus
unlikely to return to active nursing service, the number
below the age of 50 totalled approximately 160 000
potentially employable nurses. Considering that hospi-
tals of the United States have reported some 116 000
vacant nursing positions (24), policies and strategies to
attract back qualified nurses could have high returns.
International migration of health professionals from
low- and middle-income countries to wealthier coun-
tries is another issue of increasing global attention.
Doctors and nurses represent a small proportion of all
highly skilled workers who migrate, but the HRH loss
for developing countries can mean that the capacity of
the health system to deliver health services equitably
is compromised (25). Many developed countries that
previously actively recruited health workers abroad as
a solution to (real or perceived) workforce shortages at
home have now recognized the need to address the
adverse impacts in some of the main sending coun-
tries, notably in sub-Saharan Africa (26, 27). One policy
option for receiving countries is the formulation of ethi-
cal practices for the international recruitment of health
workers. For example, in 2001 the United Kingdom’s
Department of Health adopted a code of practice
for employers in the national health system seeking,
among other things, to prevent targeted recruitment
from developing countries experiencing severe short-
ages of health-care staff. While assessing the impact
of such a code is challenging, due to the numerous
factors driving labour migration, it can be noted that
Handbook on monitoring and evaluation of human resources for health
58
nursing migration from Africa to the United Kingdom
would seem to have declined substantially in the period
following its adoption (as previously illustrated in Table
5.2).
At the same time, it should be recognized that health
personnel movement and migration is bi-directional.
Health workers move from rich to poorer countries and
from urban to rural areas for a variety of reasons and
through a number of mechanisms, although in much
smaller numbers – and even less well documented. In
many instances, health personnel migrate abroad for
a shorter period of time and return to their country of
origin, which can be beneficial to source countries as
these workers return with more experience, skills and
personal resources than when they left (3). Sending
countries therefore need to consider policy options
regarding whether outflow of health workers should
be supported or encouraged (for example to stimulate
remittance income or to address oversupply relative to
national health labour market absorption capacity) –
or constrained or reduced (to counteract “brain drain”)
(26). In all cases, monitoring international flows is pre-
requisite for evaluating policy effectiveness.
The contribution of existing data sources and analyti-
cal approaches is growing significantly for monitoring
health workforce transitions and exits, and for sup-
porting HRH policy development at the national and
international levels; however, some areas need further
consideration. One of the main factors constraining in-
depth analysis is the general lack of disaggregated data
on the different types of workforce exits, which makes it
difficult for decision-makers to address specific reten-
tion issues in the most pertinent manner. Strengthening
efforts for systematic data gathering and improved
coordination among stakeholders in data collection
and use across different sectors and countries should
act as a catalyst for improving the availability, quality
and comparability of HRH data, thereby strengthening
the evidence base needed to advocate policy options
and guide decision-making.
References1. The world health report 2006: working together for
health. Geneva, World Health Organization, 2006
(http://www.who.int/whr/2006, accessed 10 January
2009).
2. Coomber B, Bariball L. Impact of job satisfaction
components on intent to leave and turnover for
hospital based nurses: a review of the literature.
International Journal of Nursing Studies, 2003,
44(2):297–314.
3. Padarath A et al. Health personnel in southern
Africa: confronting maldistribution and brain drain.
EQUINET Discussion Paper No. 3. Harare, Regional
Network for Equity in Health in Southern Africa,
Health Systems Trust and MEDACT, 2003 (http://
www.equinetafrica.org/bibl/docs/DIS3hres.pdf,
accessed 15 January 2009).
4. Zurn P, Dolea C, Stilwell B. Nurse retention and
recruitment: developing a motivated workforce.
ICN Issue Paper No. 4. Geneva, International
Council of Nurses, 2005 (http://www.icn.ch/global/
Issue4Retention.pdf, accessed 15 January 2009).
5. Davey G, Fekade D, Parry E. Must aid hinder
attempts to reach the Millennium Development
Goals? Lancet, 2006, 367(9511):629–631.
6. McCoy D et al. Salaries and incomes of health
workers in sub-Saharan Africa. Lancet, 2008,
371(9613):675–681.
7. Diallo K. Data on the migration of health-care
workers: sources, uses, and challenges. Bulletin of
the World Health Organization, 2004, 82(8):601–607
(http://www.who.int/bulletin/volumes/82/8/601.pdf,
accessed 15 January 2009).
8. Dumont JC, Zurn P. Immigrant health workers in
OECD countries in the broader context of highly
skilled migration. In: International migration outlook:
SOPEMI 2007 edition. Paris, Organisation for
Economic Co-operation and Development, 2007
(http://www.oecd.org/dataoecd/22/32/41515701.pdf,
accessed 15 January 2009).
9. Assessment of human resources for health: country
profile. Geneva, Ministry of Health of Sri Lanka and
World Health Organization, 2002.
10. Schwabe C, McGrath E, Lerotholi K. Health sector
human resources needs assessment. Silver Spring,
MD, Medical Care Development International, 2004.
11. Lorenzo FME, Galvez-Tan J, Icamina K, Javier L.
Nurse migration from a source country perspective:
Philippine country case study. Health Services
Research, 2007, 42(3p2):1406–1418.
12. Awases M et al. Migration of health professionals in
six countries: a synthesis report. Brazzaville, World
Health Organization Regional Office for Africa,
2004 (http://www.afro.who.int/hrh-observatory/
researchpolicies/migration_en.pdf, accessed 15
January 2009).
13. Riley PL et al. Developing a nursing database
system in Kenya. Health Services Research, 2007,
42(3):1389–1405.

Monitoring health workforce transitions and exits
59
14. Statistical analysis of the register: 1 April 2006 to
31 March 2007. London, Nursing and Midwifery
Council, 2008 (http://www.nmc-uk.org/aArticle.
aspx?ArticleID=36, accessed 15 January 2009).
15. South Africa yearbook 2002/03. Pretoria,
Government of South Africa Communication and
Information System, 2003.
16. Cohen D. Human capital and the HIV epidemic
in sub-Saharan Africa. ILO Programme on HIV/
AIDS and the World of Work, Working Paper No. 2.
Geneva, International Labour Organization, 2002
(http://www.ilo.org/public/english/protection/trav/
aids/publ/wp2_humancapital.pdf, accessed 15
January 2009).
17. Buve A et al. Mortality among female nurses in the
face of the AIDS epidemic: a pilot study in Zambia.
AIDS, 1994, 8(3):396.
18. Pong RW, Lemire F, Tepper J. Physician retirement
in Canada: what is known and what needs to be
done. Presented at the 10th International Medical
Workforce Conference, Vancouver, Canada, 20–24
March 2007 (http://www.cranhr.ca/pdf/10_retCAN.
pdf, accessed 15 January 2009).
19. Chaudhury N, Hammer JS. Ghost doctors:
absenteeism in rural Bangladeshi health facilities.
World Bank Economic Review, 2004, 18(3):423–441.
20. Gupta N et al. Assessing human resources for
health: what can be learned from labour force
surveys? Human Resources for Health, 2003,
1:5 (http://www.human-resources-health.com/
content/1/1/5, accessed 15 January 2009).
21. Simoens S, Hurst J. The supply of physician services
in OECD countries. Health Working Papers, No.
21. Paris, Organisation for Economic Co-operation
and Development, Directorate for Employment,
Labour and Social Affairs, 2006 (http://www.oecd.
org/dataoecd/27/22/35987490.pdf, accessed 15
January 2009).
22. Kinfu Y et al. The health worker shortage in
Africa: are enough physicians and nurses being
trained? Bulletin of the World Health Organization,
2009, 87(3):225–230 (http://www.who.int/bulletin/
volumes/87/3/08–051599.pdf, accessed 20
February 2009).
23. The registered nurse population: national sample
survey of registered nurses, March 2004 –
preliminary findings. Washington, DC, United States
Department of Health and Human Services, 2005.
24. Research and trends: health and hospital trends
2007 – AHA survey of hospital leaders. Washington,
DC, American Hospital Association, 2007 (http://
www.aha.org/aha/research-and-trends/health-and-
hospital-trends/2007.html, accessed 15 January
2009).
25. Stilwell B et al. Developing evidence-based
ethical policies on the migration of health workers:
conceptual and practical challenges. Human
Resources for Health, 2003, 1:8 (http://www.human-
resources-health.com/content/1/1/8), accessed 15
January 2009).
26. Buchan J. How can the migration of health service
professionals be managed so as to reduce
any negative effects on supply? Copenhagen,
WHO Regional Office for Europe and European
Observatory on Health Systems and Policies, 2008
(http://www.euro.who.int/document/hsm/7_hsc08_
epb_10.pdf, accessed 19 January 2009).
27. Robinson M, Clark P. Forging solutions to health
worker migration. Lancet, 2008, 371(9613):691–693.

Handbook on monitoring and evaluation of human resources for health
60

61
Part III: MEASUREMENT STRATEGIES AND CASE STUDIES


63
Measuring expenditure on the health workforce: concepts, data sources and methods
PATRICIA HERNANDEZ, TESSA TAN-TORRES, DAVID B EVANS
6.1 IntroductionPayments to labour have been assessed as consti-
tuting the largest single expenditure item for national
accounts and, where they have been measured, in
health services provision. However, in many countries,
data on the extent and nature of expenditure on health
workers are not routinely available and information is
often scattered across multiple sources. Where data
collation occurs, it may only have partial coverage and
is rarely used for policy and planning. Timely acces-
sibility among decision-makers and stakeholders to
information about expenditures on the health workforce
would require a systematic consolidation and harmo-
nization effort, with modifications in the way data are
recorded. The nature and intensity of the effort implied
would, of course, vary by country.
Notwithstanding the weight of human resources for
health (HRH) in overall health expenditure, there is
no full documentation of health accounting meth-
ods specifically related to the health workforce. Other
measurement approaches describe how to measure
expenditure on the labour force in general, notably
the provision of health-care services in the system of
national accounts – that is, a conceptual framework
that sets the international statistical standard for the
measurement of the market economy – and in meth-
ods used to guide the measurement of expenditures on
government-funded health services.
The construction of a comprehensive, reliable and inte-
grated system of HRH expenditure measures typically
requires a compilation of data from routine administra-
tive records and periodic surveys. Some countries are
beginning to store all labour-related surveys that have
been undertaken in a single repository. In many cases,
additional surveys are required to complement existing
sources in order to cover the field adequately.
The main aim of this chapter is to encourage a
greater number of countries to monitor expendi-
ture on human resources in health systems to inform
decision-making. Tracking the financial resources con-
tributed to HRH can facilitate monitoring of resources
to achieve the Millennium Development Goals, the
national poverty reduction strategy plan and other ini-
tiatives. Disentangling HRH expenditure within existing
frameworks focusing on resource use helps provide
that information. If implemented on a regular basis,
accounting systems can track health labour expend-
iture trends, an essential element in HRH monitoring
and evaluation.
Several lines of action are presented here, intended
to be a how-to guide for operational use by people
actually monitoring these expenditures. Following this
introduction, the chapter offers a brief presentation on
the purpose of the exercise and the core indicators pro-
posed. It moves to a description on how to begin to
construct and maintain a minimum database on HRH
expenditure. Issues of data collection and use at coun-
try level are discussed, enriched with case studies to
illustrate various procedures and recommendations
for enhancing comparability across countries and over
time.
Recognizing that many countries are unlikely to
develop sophisticated, integrated systems of data
collection and collation in the short run, this chapter
suggests how the different sources of data typically
found in countries can be used to establish the order
of magnitude of expenditure on HRH. The approach
proposed here does not posses the attributes of a fully
fledged HRH account linked to official health accounts,
strictly covering the same boundaries. It is offered as a
short-term solution while waiting for some of the main
internationally agreed-upon estimating methods to be
updated and refined – notably the updates, expected
to be completed by 2012, of the current versions of the
System of National Accounts 1993 (henceforth referred
to as SNA93) (1), the System of Health Accounts (or
SHA1.0) (2) and the Guide to producing national health
accounts (3).
6
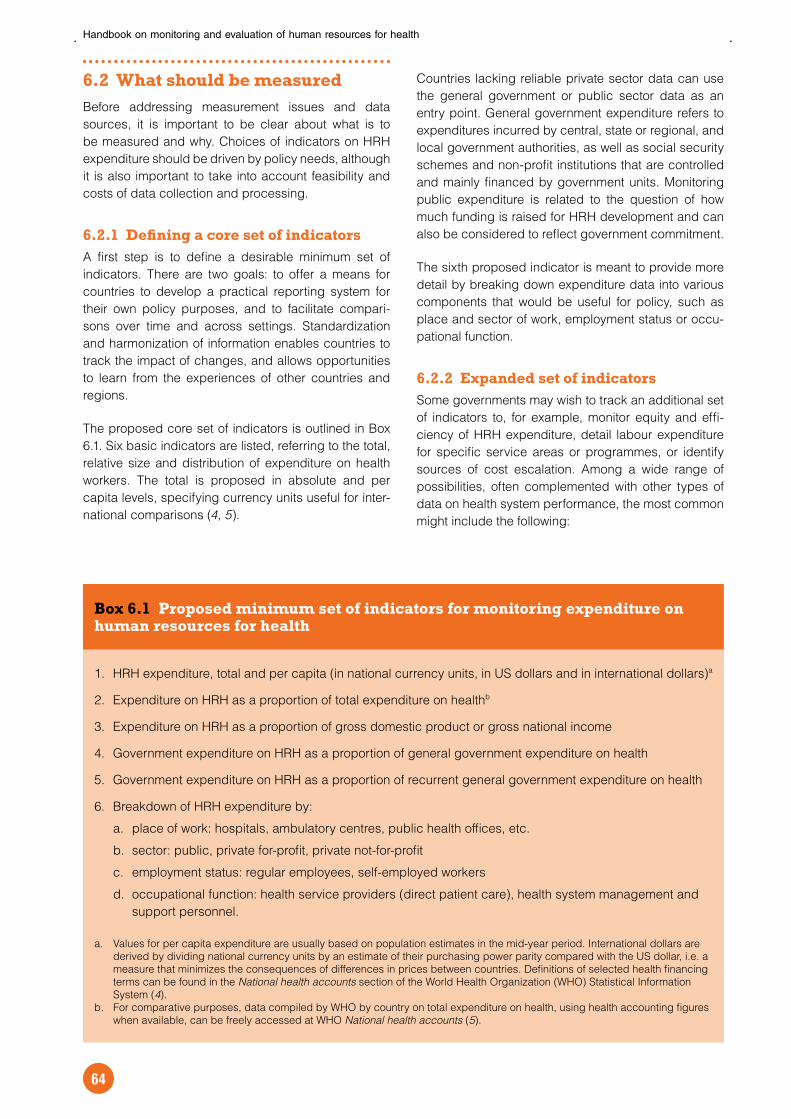
Handbook on monitoring and evaluation of human resources for health
64
6.2 What should be measuredBefore addressing measurement issues and data
sources, it is important to be clear about what is to
be measured and why. Choices of indicators on HRH
expenditure should be driven by policy needs, although
it is also important to take into account feasibility and
costs of data collection and processing.
6.2.1 Defining a core set of indicatorsA first step is to define a desirable minimum set of
indicators. There are two goals: to offer a means for
countries to develop a practical reporting system for
their own policy purposes, and to facilitate compari-
sons over time and across settings. Standardization
and harmonization of information enables countries to
track the impact of changes, and allows opportunities
to learn from the experiences of other countries and
regions.
The proposed core set of indicators is outlined in Box
6.1. Six basic indicators are listed, referring to the total,
relative size and distribution of expenditure on health
workers. The total is proposed in absolute and per
capita levels, specifying currency units useful for inter-
national comparisons (4, 5).
Countries lacking reliable private sector data can use
the general government or public sector data as an
entry point. General government expenditure refers to
expenditures incurred by central, state or regional, and
local government authorities, as well as social security
schemes and non-profit institutions that are controlled
and mainly financed by government units. Monitoring
public expenditure is related to the question of how
much funding is raised for HRH development and can
also be considered to reflect government commitment.
The sixth proposed indicator is meant to provide more
detail by breaking down expenditure data into various
components that would be useful for policy, such as
place and sector of work, employment status or occu-
pational function.
6.2.2 Expanded set of indicatorsSome governments may wish to track an additional set
of indicators to, for example, monitor equity and effi-
ciency of HRH expenditure, detail labour expenditure
for specific service areas or programmes, or identify
sources of cost escalation. Among a wide range of
possibilities, often complemented with other types of
data on health system performance, the most common
might include the following:
Box 6.1 Proposed minimum set of indicators for monitoring expenditure on human resources for health
1. HRH expenditure, total and per capita (in national currency units, in US dollars and in international dollars)a
2. Expenditure on HRH as a proportion of total expenditure on healthb
3. Expenditure on HRH as a proportion of gross domestic product or gross national income
4. Government expenditure on HRH as a proportion of general government expenditure on health
5. Government expenditure on HRH as a proportion of recurrent general government expenditure on health
6. Breakdown of HRH expenditure by:
a. place of work: hospitals, ambulatory centres, public health offices, etc.
b. sector: public, private for-profit, private not-for-profit
c. employment status: regular employees, self-employed workers
d. occupational function: health service providers (direct patient care), health system management and
support personnel.
a. Values for per capita expenditure are usually based on population estimates in the mid-year period. International dollars are
derived by dividing national currency units by an estimate of their purchasing power parity compared with the US dollar, i.e. a
measure that minimizes the consequences of differences in prices between countries. Definitions of selected health financing
terms can be found in the National health accounts section of the World Health Organization (WHO) Statistical Information
System (4).
b. For comparative purposes, data compiled by WHO by country on total expenditure on health, using health accounting figures
when available, can be freely accessed at WHO National health accounts (5).
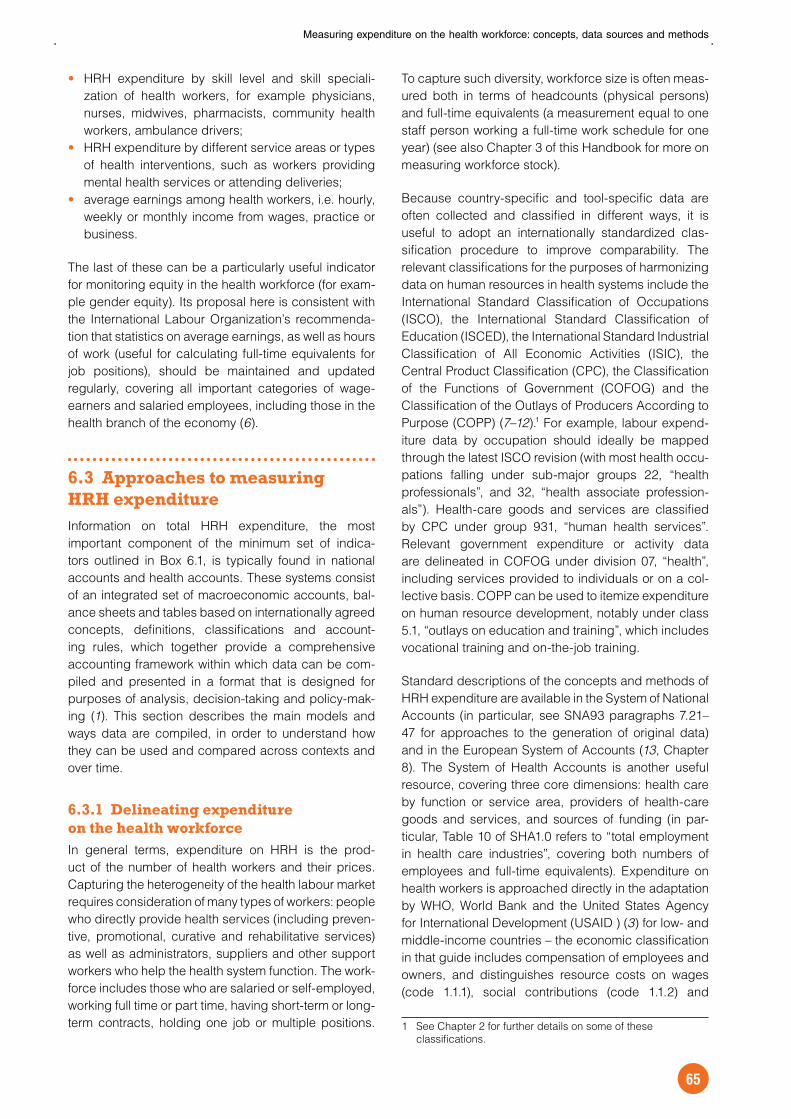
Measuring expenditure on the health workforce: concepts, data sources and methods
65
HRH expenditure by skill level and skill speciali-
zation of health workers, for example physicians,
nurses, midwives, pharmacists, community health
workers, ambulance drivers;
HRH expenditure by different service areas or types
of health interventions, such as workers providing
mental health services or attending deliveries;
average earnings among health workers, i.e. hourly,
weekly or monthly income from wages, practice or
business.
The last of these can be a particularly useful indicator
for monitoring equity in the health workforce (for exam-
ple gender equity). Its proposal here is consistent with
the International Labour Organization’s recommenda-
tion that statistics on average earnings, as well as hours
of work (useful for calculating full-time equivalents for
job positions), should be maintained and updated
regularly, covering all important categories of wage-
earners and salaried employees, including those in the
health branch of the economy (6).
6.3 Approaches to measuring HRH expenditureInformation on total HRH expenditure, the most
important component of the minimum set of indica-
tors outlined in Box 6.1, is typically found in national
accounts and health accounts. These systems consist
of an integrated set of macroeconomic accounts, bal-
ance sheets and tables based on internationally agreed
concepts, definitions, classifications and account-
ing rules, which together provide a comprehensive
accounting framework within which data can be com-
piled and presented in a format that is designed for
purposes of analysis, decision-taking and policy-mak-
ing (1). This section describes the main models and
ways data are compiled, in order to understand how
they can be used and compared across contexts and
over time.
6.3.1 Delineating expenditure on the health workforceIn general terms, expenditure on HRH is the prod-
uct of the number of health workers and their prices.
Capturing the heterogeneity of the health labour market
requires consideration of many types of workers: people
who directly provide health services (including preven-
tive, promotional, curative and rehabilitative services)
as well as administrators, suppliers and other support
workers who help the health system function. The work-
force includes those who are salaried or self-employed,
working full time or part time, having short-term or long-
term contracts, holding one job or multiple positions.
To capture such diversity, workforce size is often meas-
ured both in terms of headcounts (physical persons)
and full-time equivalents (a measurement equal to one
staff person working a full-time work schedule for one
year) (see also Chapter 3 of this Handbook for more on
measuring workforce stock).
Because country-specific and tool-specific data are
often collected and classified in different ways, it is
useful to adopt an internationally standardized clas-
sification procedure to improve comparability. The
relevant classifications for the purposes of harmonizing
data on human resources in health systems include the
International Standard Classification of Occupations
(ISCO), the International Standard Classification of
Education (ISCED), the International Standard Industrial
Classification of All Economic Activities (ISIC), the
Central Product Classification (CPC), the Classification
of the Functions of Government (COFOG) and the
Classification of the Outlays of Producers According to
Purpose (COPP) (7–12).1 For example, labour expend-
iture data by occupation should ideally be mapped
through the latest ISCO revision (with most health occu-
pations falling under sub-major groups 22, “health
professionals”, and 32, “health associate profession-
als”). Health-care goods and services are classified
by CPC under group 931, “human health services”.
Relevant government expenditure or activity data
are delineated in COFOG under division 07, “health”,
including services provided to individuals or on a col-
lective basis. COPP can be used to itemize expenditure
on human resource development, notably under class
5.1, “outlays on education and training”, which includes
vocational training and on-the-job training.
Standard descriptions of the concepts and methods of
HRH expenditure are available in the System of National
Accounts (in particular, see SNA93 paragraphs 7.21–
47 for approaches to the generation of original data)
and in the European System of Accounts (13, Chapter
8). The System of Health Accounts is another useful
resource, covering three core dimensions: health care
by function or service area, providers of health-care
goods and services, and sources of funding (in par-
ticular, Table 10 of SHA1.0 refers to “total employment
in health care industries”, covering both numbers of
employees and full-time equivalents). Expenditure on
health workers is approached directly in the adaptation
by WHO, World Bank and the United States Agency
for International Development (USAID ) (3) for low- and
middle-income countries – the economic classification
in that guide includes compensation of employees and
owners, and distinguishes resource costs on wages
(code 1.1.1), social contributions (code 1.1.2) and
1 See Chapter 2 for further details on some of these
classifications.
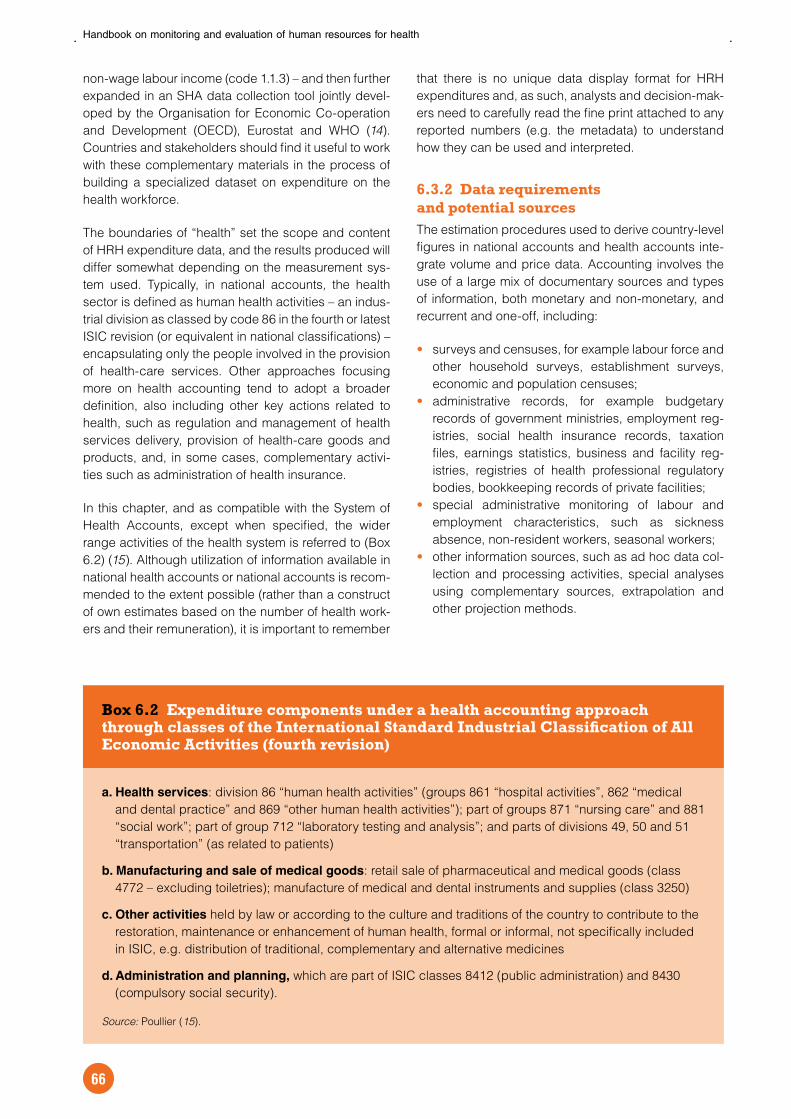
Handbook on monitoring and evaluation of human resources for health
66
non-wage labour income (code 1.1.3) – and then further
expanded in an SHA data collection tool jointly devel-
oped by the Organisation for Economic Co-operation
and Development (OECD), Eurostat and WHO (14).
Countries and stakeholders should find it useful to work
with these complementary materials in the process of
building a specialized dataset on expenditure on the
health workforce.
The boundaries of “health” set the scope and content
of HRH expenditure data, and the results produced will
differ somewhat depending on the measurement sys-
tem used. Typically, in national accounts, the health
sector is defined as human health activities – an indus-
trial division as classed by code 86 in the fourth or latest
ISIC revision (or equivalent in national classifications) –
encapsulating only the people involved in the provision
of health-care services. Other approaches focusing
more on health accounting tend to adopt a broader
definition, also including other key actions related to
health, such as regulation and management of health
services delivery, provision of health-care goods and
products, and, in some cases, complementary activi-
ties such as administration of health insurance.
In this chapter, and as compatible with the System of
Health Accounts, except when specified, the wider
range activities of the health system is referred to (Box
6.2) (15). Although utilization of information available in
national health accounts or national accounts is recom-
mended to the extent possible (rather than a construct
of own estimates based on the number of health work-
ers and their remuneration), it is important to remember
that there is no unique data display format for HRH
expenditures and, as such, analysts and decision-mak-
ers need to carefully read the fine print attached to any
reported numbers (e.g. the metadata) to understand
how they can be used and interpreted.
6.3.2 Data requirements and potential sourcesThe estimation procedures used to derive country-level
figures in national accounts and health accounts inte-
grate volume and price data. Accounting involves the
use of a large mix of documentary sources and types
of information, both monetary and non-monetary, and
recurrent and one-off, including:
surveys and censuses, for example labour force and
other household surveys, establishment surveys,
economic and population censuses;
administrative records, for example budgetary
records of government ministries, employment reg-
istries, social health insurance records, taxation
files, earnings statistics, business and facility reg-
istries, registries of health professional regulatory
bodies, bookkeeping records of private facilities;
special administrative monitoring of labour and
employment characteristics, such as sickness
absence, non-resident workers, seasonal workers;
other information sources, such as ad hoc data col-
lection and processing activities, special analyses
using complementary sources, extrapolation and
other projection methods.
Box 6.2 Expenditure components under a health accounting approach through classes of the International Standard Industrial Classification of All Economic Activities (fourth revision)
a. Health services: division 86 “human health activities” (groups 861 “hospital activities”, 862 “medical
and dental practice” and 869 “other human health activities”); part of groups 871 “nursing care” and 881
“social work”; part of group 712 “laboratory testing and analysis”; and parts of divisions 49, 50 and 51
“transportation” (as related to patients)
b. Manufacturing and sale of medical goods: retail sale of pharmaceutical and medical goods (class
4772 – excluding toiletries); manufacture of medical and dental instruments and supplies (class 3250)
c. Other activities held by law or according to the culture and traditions of the country to contribute to the
restoration, maintenance or enhancement of human health, formal or informal, not specifically included
in ISIC, e.g. distribution of traditional, complementary and alternative medicines
d. Administration and planning, which are part of ISIC classes 8412 (public administration) and 8430
(compulsory social security).
Source: Poullier (15).

Measuring expenditure on the health workforce: concepts, data sources and methods
67
The collation, synthesis and analysis of these various
types of data is generally the outcome of collaboration
among a wide range of stakeholders, including gov-
ernment ministries (health, labour, finance), central
statistical agencies, development partners, research
and academic institutions, workers’ associations and
insurance agencies. New data collection should be
undertaken only when the required information is not
available elsewhere and sufficient resources have been
secured to do it well. The initial challenge is to ensure
all relevant records have been retrieved; for example,
remunerations and incentives for health workers paid
by special funds (for example international sources) or
entities as a secondary activity (for example occupa-
tional health services in industries) may be reported
independently of government records on wages and
salaries.
A standard estimation procedure for monitoring labour
expenditure is recommended by SNA93. Relatively
minor adjustments have been developed for detailed
entries under health and according to country-spe-
cific data characteristics. For example, sample sizes
of labour force surveys are usually too small to allow
statistically valid inferences about specific branches of
economic activity. As such, labour force survey data
are usually complemented with data from administra-
tive and other sources (16).
Figure 6.1 displays a typical path the estimator of
labour expenditure could consider (1). For illustra-
tive purposes, the use of labour force surveys versus
other data sources in national accounting is described
within a selected group of countries of OECD and the
European Union:
Labour force surveys constitute the main source
of data in Australia, Canada, Cyprus, Estonia,
Hungary, Ireland, Lithuania, Switzerland and the
United Kingdom.
Labour force survey data are partially replaced with
administrative data and other recurrent surveys in
Bulgaria, Greece, Latvia, Portugal and Romania.
Countries combining supply and demand data
include Austria, Denmark, Finland, Germany, Italy,
Malta, Norway, Slovakia, Spain and Sweden.
Source: SNA93 (Figure 17.1: Population and labour concepts) (1).
Figure 6.1 Overview of the estimation process for measuring labour expenditure in the System of National Accounts
Divided by
equals
Employee Self-employment
Compensation of employees
Population
Single job
Total hours worked: annual total, excluding sick and other leave and holidays
Full time annual hours, excluding holidays and sick and other leave, separately for each job group then summed
Multiple jobs
Employed
Week precedingAnnual average
Unemployed
Week precedingAnnual average
Not in the labour force
Week precedingAnnual average
Full-time equivalent employment = Number of full-time equivalent jobs, annual average
Jobs. Week preceding. Annual average.
Deflated by indices of compensation per job
Employee labour input at constant compensation
Add jobs of persons not registered but working in resident enterprises. Subtract jobs of persons
included but working in non-resident enterprises
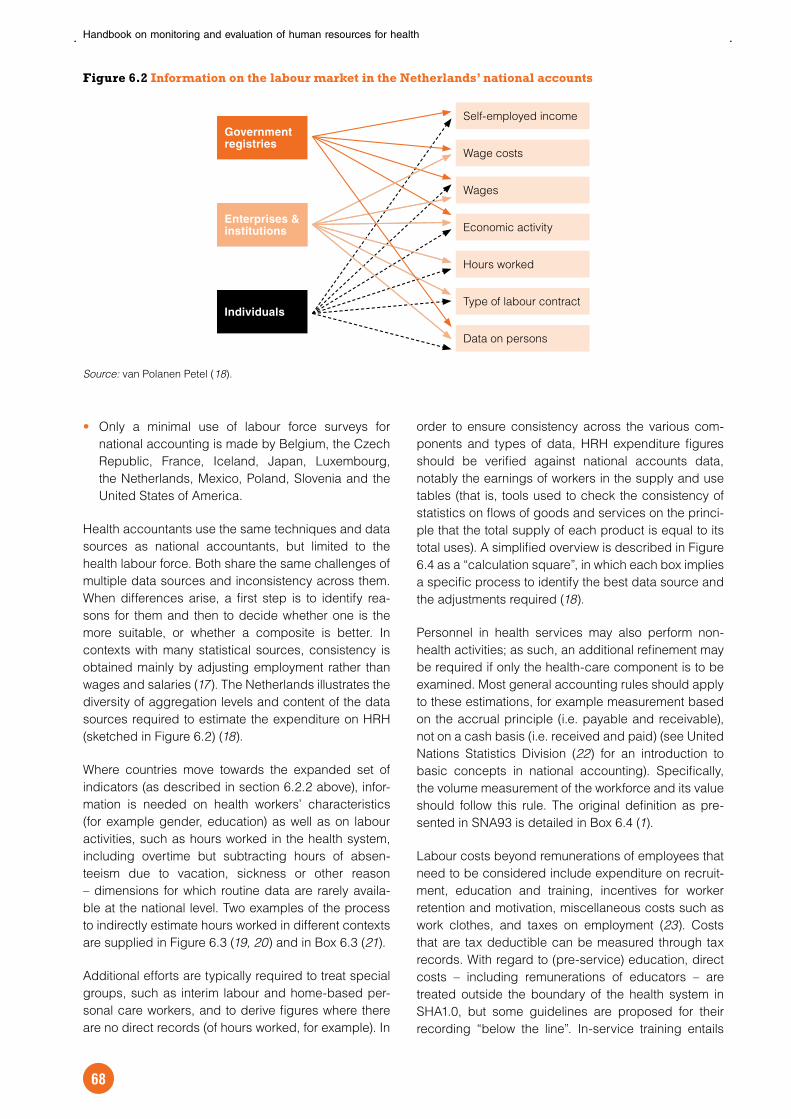
Handbook on monitoring and evaluation of human resources for health
68
Only a minimal use of labour force surveys for
national accounting is made by Belgium, the Czech
Republic, France, Iceland, Japan, Luxembourg,
the Netherlands, Mexico, Poland, Slovenia and the
United States of America.
Health accountants use the same techniques and data
sources as national accountants, but limited to the
health labour force. Both share the same challenges of
multiple data sources and inconsistency across them.
When differences arise, a first step is to identify rea-
sons for them and then to decide whether one is the
more suitable, or whether a composite is better. In
contexts with many statistical sources, consistency is
obtained mainly by adjusting employment rather than
wages and salaries (17). The Netherlands illustrates the
diversity of aggregation levels and content of the data
sources required to estimate the expenditure on HRH
(sketched in Figure 6.2) (18).
Where countries move towards the expanded set of
indicators (as described in section 6.2.2 above), infor-
mation is needed on health workers’ characteristics
(for example gender, education) as well as on labour
activities, such as hours worked in the health system,
including overtime but subtracting hours of absen-
teeism due to vacation, sickness or other reason
– dimensions for which routine data are rarely availa-
ble at the national level. Two examples of the process
to indirectly estimate hours worked in different contexts
are supplied in Figure 6.3 (19, 20) and in Box 6.3 (21).
Additional efforts are typically required to treat special
groups, such as interim labour and home-based per-
sonal care workers, and to derive figures where there
are no direct records (of hours worked, for example). In
order to ensure consistency across the various com-
ponents and types of data, HRH expenditure figures
should be verified against national accounts data,
notably the earnings of workers in the supply and use
tables (that is, tools used to check the consistency of
statistics on flows of goods and services on the princi-
ple that the total supply of each product is equal to its
total uses). A simplified overview is described in Figure
6.4 as a “calculation square”, in which each box implies
a specific process to identify the best data source and
the adjustments required (18).
Personnel in health services may also perform non-
health activities; as such, an additional refinement may
be required if only the health-care component is to be
examined. Most general accounting rules should apply
to these estimations, for example measurement based
on the accrual principle (i.e. payable and receivable),
not on a cash basis (i.e. received and paid) (see United
Nations Statistics Division (22) for an introduction to
basic concepts in national accounting). Specifically,
the volume measurement of the workforce and its value
should follow this rule. The original definition as pre-
sented in SNA93 is detailed in Box 6.4 (1).
Labour costs beyond remunerations of employees that
need to be considered include expenditure on recruit-
ment, education and training, incentives for worker
retention and motivation, miscellaneous costs such as
work clothes, and taxes on employment (23). Costs
that are tax deductible can be measured through tax
records. With regard to (pre-service) education, direct
costs – including remunerations of educators – are
treated outside the boundary of the health system in
SHA1.0, but some guidelines are proposed for their
recording “below the line”. In-service training entails
Figure 6.2 Information on the labour market in the Netherlands’ national accounts
Source: van Polanen Petel (18).
Government registries
Enterprises & institutions
Individuals
Wage costs
Type of labour contract
Economic activity
Self-employed income
Hours worked
Wages
Data on persons
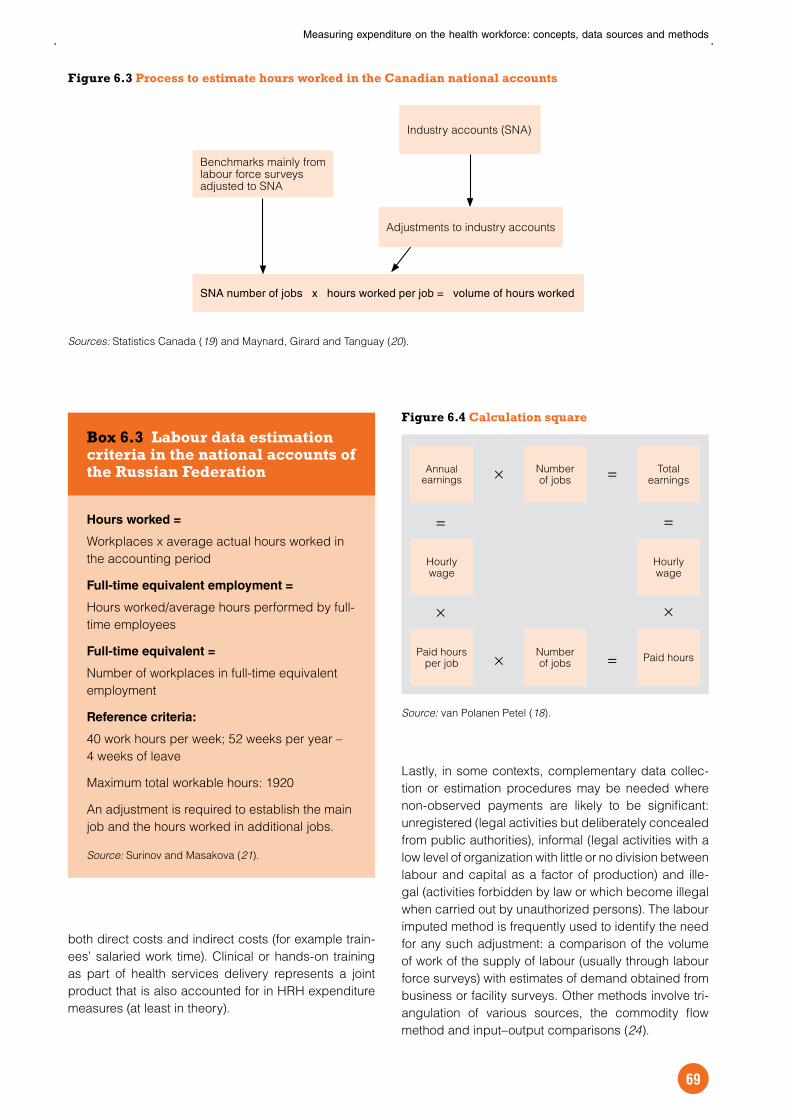
Measuring expenditure on the health workforce: concepts, data sources and methods
69
both direct costs and indirect costs (for example train-
ees’ salaried work time). Clinical or hands-on training
as part of health services delivery represents a joint
product that is also accounted for in HRH expenditure
measures (at least in theory).
Lastly, in some contexts, complementary data collec-
tion or estimation procedures may be needed where
non-observed payments are likely to be significant:
unregistered (legal activities but deliberately concealed
from public authorities), informal (legal activities with a
low level of organization with little or no division between
labour and capital as a factor of production) and ille-
gal (activities forbidden by law or which become illegal
when carried out by unauthorized persons). The labour
imputed method is frequently used to identify the need
for any such adjustment: a comparison of the volume
of work of the supply of labour (usually through labour
force surveys) with estimates of demand obtained from
business or facility surveys. Other methods involve tri-
angulation of various sources, the commodity flow
method and input–output comparisons (24).
Figure 6.3 Process to estimate hours worked in the Canadian national accounts
Sources: Statistics Canada (19) and Maynard, Girard and Tanguay (20).
Box 6.3 Labour data estimation criteria in the national accounts of the Russian Federation
Hours worked =
Workplaces x average actual hours worked in
the accounting period
Full-time equivalent employment =
Hours worked/average hours performed by full-
time employees
Full-time equivalent =
Number of workplaces in full-time equivalent
employment
Reference criteria:
40 work hours per week; 52 weeks per year –
4 weeks of leave
Maximum total workable hours: 1920
An adjustment is required to establish the main
job and the hours worked in additional jobs.
Source: Surinov and Masakova (21).
Figure 6.4 Calculation square
Source: van Polanen Petel (18).
Benchmarks mainly from labour force surveys adjusted to SNA
Industry accounts (SNA)
SNA number of jobs x hours worked per job = volume of hours worked
Adjustments to industry accounts
Annual earnings
Hourly wage
Paid hours per job
Total earnings
Hourly wage
Paid hoursNumber of jobs
Number of jobs
×
×
× ×
= =
=
=

Handbook on monitoring and evaluation of human resources for health
70
Box 6.4 Defining remuneration of employees and self-employment income
Remuneration of employees
The remuneration of employees comprises the total compensation, in cash or in kind, payable by
enterprises to employees in return for work performed during the accounting period. Wages and salaries
as well as employer social contributions are included.
Wages and salaries of health employees include remuneration in-cash and an allowance for benefits
in-kind for health activities such as regular interval payments, piecework, overtime, night work, weekend
or other unsocial hours, allowances for working away from home, in disagreeable or hazardous
circumstances, as allowances linked to housing, travel or sickness benefits, ad hoc bonuses,
commissions, gratuities, and in-kind provision of goods and services not required to carry out their work,
such as meals and drinks, uniforms and transportation.
Social contributions paid for health employees involve actual or imputed payments to social schemes
to secure an employee’s entitlement to non-wage benefits. The valuation of social contributions includes
payments by employers to social security schemes or to private funded social insurance schemes
designed to secure social benefits for their employees; imputed social contributions by employers
providing unfunded social benefits are to be added. A statistical convention considers that employees
receive a gross compensation from which they pay their share of contributions to social protection
schemes, whether social security funds, private funded schemes or unfunded schemes.
Social contributions are monitored through administrative records. Imputed social contributions of
employers are estimated for unfunded social benefits paid by employers and correspond to the amounts
that would be needed to guarantee their right to social benefits. Taxes payable by an employer on the
wage and salary bill are excluded.
Self-employed income
Self-employment income refers to the independent health practitioners. After deducting compensation
of employees, taxes and subsidies from value added, the balancing item of the generation of income
account obtained is described as operating surplus or mixed income.
The operating surplus reflects the surplus or deficit accruing from production before taking account of any
interest, rent or similar charges payable on financial or tangible non-produced assets owned, borrowed
or rented by the enterprise. The gross operating surplus includes the returns of owned assets used in the
production process; these should be netted to isolate the remuneration component.
This component is called mixed income for unincorporated enterprises owned by members of households,
either individually or in partnership with others, in which the owners, or other members of their households,
may work without receiving any wage or salary. Their labour income is mostly an entrepreneurial income.
The mixed income contains an element of remuneration for work done by the owner, or other members
of the household, that cannot be separately identified from the return to the owner as entrepreneur. The
unincorporated enterprises owned by households that are not quasi-corporations are deemed to fall in
this category, except owner-occupiers in their capacity as producers of housing services for own final
consumption and households employing paid domestic staff, an activity that generates no surplus. The
mixed income is increasingly reported as an independent value.
The concept of operating surplus or mixed income is not applied to measure the income of workers in
governments and not-for-profit enterprises.
Household unincorporated enterprises who regularly sell most of their output should be treated as
market enterprises. Groups of households that engage in communal activities for their own individual
or community use should be treated as informal partnerships engaged in non-market production.
Households producing services are included when they occupy their own dwellings in their production,
and services produced by employed paid staff. The production of these services does not generate
mixed income. There is no labour input into the production of the services of owner-occupied dwellings
Continues…
Measuring expenditure on the health workforce: concepts, data sources and methods
71
6.4 Measurement frameworks and applicationsAs previously discussed, the most comprehensive
and standardized measurement strategy for monitor-
ing HRH expenditure is within the systems of health
accounts and national accounts. These are built on var-
ious types of data, both new and existing, and must
typically undergo a consolidation and harmonization
effort as there are often at least some inconsistencies
across sources. A key consideration is to understand
the boundaries implied by different data sources, and
what has been included and excluded. In this section,
we outline the main frameworks used in HRH expend-
iture monitoring and present some reality checks on
their actual uses, along with illustrative examples from
selected countries.
6.4.1 Health accounts frameworkHealth accounting is designed to measure all resource
flows earmarked to provide health care or a substan-
tial amount of health status enhancement by medical
means, whether labelled “health care” or not in national
statistics (2). The health accounting model comprises
a set of standard rules, tracking all resources enter-
ing the health system during a period, expressed in
monetary terms. Health accounting uses existing data
structures, through data compilation and consolidation,
to create new information, aiming to provide a consist-
ent picture (3).
A health accounting system analysis involves three
basic dimensions: financing, production and final use
– services purchased, services produced and serv-
ices consumed, respectively. Data on HRH are meant
to be included as a specific class in the “resource
cost” classification, intended to measure the cost of
the resources involved in the production of health com-
modities, as part of the production dimension (Figure
6.5) (25). Flows of resources are recorded in two-
dimensional tables showing the origin and the direction
of the transactions. The tables for HRH cross-classify
the flows by categories of health workers, by financ-
ing agent (for example government, private sector) or
so that any surplus arising is operating surplus. No labour input is assigned when measuring surplus
generated by employing paid staff (SNA93 4.148 to 4.150).
Employment relationship
The nature of the employment relationship has to be identified. An employer–employee relationship exists
when there is an agreement, formal or informal, between an enterprise and a person on a voluntary basis,
whereby work for an enterprise is contracted in exchange for a remuneration in cash or in kind, based on
time or product done. The self-employed, by definition, work for themselves (SNA93: paragraphs 7.23–24).
As applied, the concept excludes work not entitled to remuneration by members of a household within an
unincorporated enterprise owned by the same household.
Payments
The nature of payments should also be explicit and treated according to international agreements: wages
and salaries in cash should not include the reimbursement by employers of expenditures made by
employees in order to enable them to take up their jobs or to carry out their work, e.g.
the reimbursement of travel, removal or related expenses made by employees when they take up
new jobs or are required by their employers to move their homes to different parts of the country or to
another country;
the reimbursement of expenditures by employees on tools, equipment, special clothing or other items
that are needed exclusively, or primarily, to enable them to carry out their work.
The amounts reimbursed are treated as intermediate consumption by employers. For example, employees
required by their contract of employment to purchase tools, equipment, special clothing, etc., when they
are not fully reimbursed, the remaining expenses they incur should be deducted from the amounts they
receive in wages and salaries and the employers’ intermediate consumption increased accordingly.
Expenditures on items needed exclusively, or primarily, for work do not form part of household final
consumption expenditures, whether reimbursed or not.
Source: SNA93 (Chapter 7) (1).
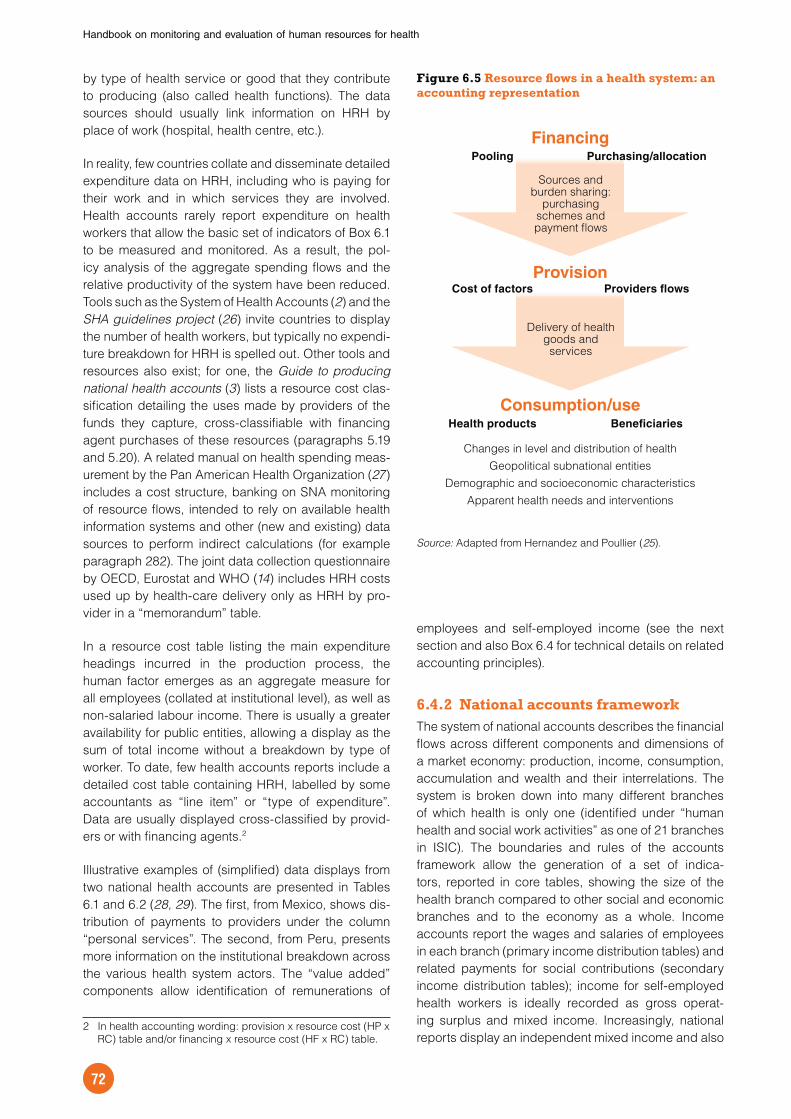
Handbook on monitoring and evaluation of human resources for health
72
by type of health service or good that they contribute
to producing (also called health functions). The data
sources should usually link information on HRH by
place of work (hospital, health centre, etc.).
In reality, few countries collate and disseminate detailed
expenditure data on HRH, including who is paying for
their work and in which services they are involved.
Health accounts rarely report expenditure on health
workers that allow the basic set of indicators of Box 6.1
to be measured and monitored. As a result, the pol-
icy analysis of the aggregate spending flows and the
relative productivity of the system have been reduced.
Tools such as the System of Health Accounts (2) and the
SHA guidelines project (26) invite countries to display
the number of health workers, but typically no expendi-
ture breakdown for HRH is spelled out. Other tools and
resources also exist; for one, the Guide to producing
national health accounts (3) lists a resource cost clas-
sification detailing the uses made by providers of the
funds they capture, cross-classifiable with financing
agent purchases of these resources (paragraphs 5.19
and 5.20). A related manual on health spending meas-
urement by the Pan American Health Organization (27)
includes a cost structure, banking on SNA monitoring
of resource flows, intended to rely on available health
information systems and other (new and existing) data
sources to perform indirect calculations (for example
paragraph 282). The joint data collection questionnaire
by OECD, Eurostat and WHO (14) includes HRH costs
used up by health-care delivery only as HRH by pro-
vider in a “memorandum” table.
In a resource cost table listing the main expenditure
headings incurred in the production process, the
human factor emerges as an aggregate measure for
all employees (collated at institutional level), as well as
non-salaried labour income. There is usually a greater
availability for public entities, allowing a display as the
sum of total income without a breakdown by type of
worker. To date, few health accounts reports include a
detailed cost table containing HRH, labelled by some
accountants as “line item” or “type of expenditure”.
Data are usually displayed cross-classified by provid-
ers or with financing agents.2
Illustrative examples of (simplified) data displays from
two national health accounts are presented in Tables
6.1 and 6.2 (28, 29). The first, from Mexico, shows dis-
tribution of payments to providers under the column
“personal services”. The second, from Peru, presents
more information on the institutional breakdown across
the various health system actors. The “value added”
components allow identification of remunerations of
2 In health accounting wording: provision x resource cost (HP x
RC) table and/or financing x resource cost (HF x RC) table.
employees and self-employed income (see the next
section and also Box 6.4 for technical details on related
accounting principles).
6.4.2 National accounts frameworkThe system of national accounts describes the financial
flows across different components and dimensions of
a market economy: production, income, consumption,
accumulation and wealth and their interrelations. The
system is broken down into many different branches
of which health is only one (identified under “human
health and social work activities” as one of 21 branches
in ISIC). The boundaries and rules of the accounts
framework allow the generation of a set of indica-
tors, reported in core tables, showing the size of the
health branch compared to other social and economic
branches and to the economy as a whole. Income
accounts report the wages and salaries of employees
in each branch (primary income distribution tables) and
related payments for social contributions (secondary
income distribution tables); income for self-employed
health workers is ideally recorded as gross operat-
ing surplus and mixed income. Increasingly, national
reports display an independent mixed income and also
Figure 6.5 Resource flows in a health system: an accounting representation
Source: Adapted from Hernandez and Poullier (25).
Financing Pooling Purchasing/allocation
Cost of factors Providers flows
Changes in level and distribution of health
Geopolitical subnational entities
Demographic and socioeconomic characteristics
Apparent health needs and interventions
Provision
Consumption/use
Delivery of health goods and services
Health products Beneficiaries
Sources and burden sharing:
purchasing schemes and payment flows

Measuring expenditure on the health workforce: concepts, data sources and methods
73
net values (capital consumption is deducted to obtain
net values).
The recommended display of the income components
is presented in Table 6.3 (30). When available, com-
pensation of employees and net mixed income can be
drawn directly from this display for decision-making
purposes.
For a large number of countries, statistical informa-
tion on HRH expenditure as obtained through national
accounts is displayed as part of the primary income
distribution tables disseminated by various international
agencies (as well as related research and methodologi-
cal resources), notably OECD (31), Eurostat (32) and the
United Nations Statistics Division (33).3 Remuneration
to government health employees is also increasingly
reported in the component of national accounts deal-
ing with general government expenditures (mapped to
COFOG division 07) (33, 35). Although SNA93 recom-
mends more complex breakdowns (tables 18.2–18.4),
they are rarely produced.
3 It may be noted that, as of mid-2008, the tables produced in
many countries still correspond to the previous 1968 edition
of the SNA manual, and so do not necessarily reflect the
evolving standard for national accounts (34).
Table 6.1 Percentage distribution of expenditure by type of health-care agent, Mexico health accounts, 1995
Institution Type of expenditure (%) Total
Personal services
General services
Supplies Infrastructurea Not specified
Health social insurance 44.4 39.4 12.1 3.3 0.9 100
Tax funded services 65.8 9.5 9.3 6.1 9.3 100
Private medical insurance 22.6 25.7 43.9 7.9 – 100
Private medical services 19.3 22.0 51.9 6.7 – 100
a. Expenditure on infrastructure is included in this table but in search of a tri-axial accrual approach, a two-tier approach involves only
current spending.
Source: Adapted from Fundación Mexicana para la Salud (28).
Table 6.2 Percentage distribution of expenditure by main providers, Peru health accounts, 2000
Components Public (%) Private (%)
Ministry of Health
Health social insurance
For profit Not-for-profit
Intermediate consumption 40.5 41.5 32.7 55.0
Medical inputs and pharmaceuticals 11.2 21.1 8.0 13.8
Non-medical goods and services 29.3 20.3 24.7 41.2
Value added 48.5 50.4 61.8 43.6
Remunerations 45.1 45.3 12.3 38
Professional services – – 13.6 –
Taxes 1.0 1.6 9.3 2.7
Depreciation 2.4 3.4 3.3 2.9
Operation surplus – – 23.3 0
Investment 8.4 8.1 5.5 1.4
Transfers to community bodies 2.6 – – –
Total 100 100 100 100
Source: Adapted from Ministerio de Salud del Perú (29).

Handbook on monitoring and evaluation of human resources for health
74
Table 6.4 presents a simplified example of the tables
displayed in the national accounts in South Africa,
including a selected list of industries from both col-
umns and rows from the supply and use table (36). The
column “health and social work” allows tracking of the
purchases of products; further refinement is possible
by subdividing into the health services versus social
services components (not shown here).
As previously mentioned, HRH data taken from national
accounts are generally limited to workers in services
provision and thus may undervalue the total expected
from a health accounts framework. Where national
accounts are the only information source, these esti-
mates should be supplemented to ensure reflection
of the wider range of health system activities, tracked
through a detailed display at the provider or product
level and mapped through ISIC and CPC, respectively
(see section 6.3.1 above).
6.4.3 General government accountsThe expansion of public finance monitoring and other
good governance approaches yields relatively com-
prehensive information on public sector expenditures
in many Asian and Latin American countries, and in a
growing number of countries of the African and Eastern
Mediterranean regions. Data for monitoring general
government accounts are drawn from the various pub-
lic sector institutions. Although some countries map
health-related data to COFOG or ISIC, there is no sin-
gle classification method for HRH expenditure used
consistently across, or even within, all countries. For
example, in the case of Portugal, differences in the
health sector universe across accounting exercises
have meant that, in particular, activities of legal forensic
institutions have been excluded from the Portuguese
health accounts but included in the 2008 national
accounts.
An ongoing push by the International Monetary Fund
to implement a standard classification for government
finance statistics deals with a breakdown for health,
including compensation of employees defined similarly
to the SNA93 approach – that is, in terms of wages and
salaries (in cash and in kind) plus social contributions
(actual and imputed) (37, 38).4 While more and more
4 See International Monetary Fund Government finance
statistics manual 2001, paragraph 4.26 and table 6.1:
Economic classification of expense (37). Companion
materials and research on government finance statistics,
including treatment of HRH data in the annual questionnaire,
are available on the web site of the International Monetary
Table 6.3 Remuneration components in the “use” table of the income account, System of National Accounts
S11 S12 S13 S14 S15 S1
Code Transactions and balancing items
Non-financial
corporations
Financial corporations
General government
Households Non-profit institutions
serving households
Total economy
D1 Compensation of
employees
549 15 142 39 24 769
D2 Taxes on production and imports
235
D3 Subsidies -44
B2g Operating surplus, gross
254 55 44 92 7 452
B3g Mixed income, gross 442 442
P61 Consumption of fixed capital on gross operating surplus
137 10 30 32 3 212
P62 Consumption of fixed capital on gross mixed income
10 10
B2n Operating surplus, net 117 45 14 60 4 240
B3n Mixed income, net 432 432
Source: System of National Accounts 2008, Table 7.1: The generation of income account – concise form – uses (concise version) (30).

Measuring expenditure on the health workforce: concepts, data sources and methods
75
Ta
ble
6.4
Na
tion
al
acc
oun
ts s
up
ply
an
d u
se t
ab
le,
Sou
th A
fric
a,
2002
(m
illi
ons
Ra
nd
, p
art
ial
dis
pla
y)
Use
of
pro
du
cts
Tota
l su
pp
ly a
t p
urc
ha
se
rs’
pri
ce
s
Taxe
s o
n
pro
du
cts
Su
bsid
ies
on
pro
du
cts
Ind
ustr
yTo
tal
ind
ustr
yTo
tal
eco
no
my
Agric
ultu
reCo
alGo
ldGe
nera
l go
vern
men
tH
ea
lth
an
d
so
cia
l w
ork
Activ
ities
/ se
rvic
es
I1I2
I3I9
2I 9
3I9
4I9
5I9
6
Agric
ultu
ral p
rodu
cts
102
613
3 29
6 11
1214
658
7752
298
Coal
and
lign
ite p
rodu
cts
38 5
433
228
8180
523
742
Petro
leum
pro
duct
s88
240
3 50
354
823
41
582
958
288
51 2
95
Phar
mac
eutic
al p
rodu
cts
36 2
561
979
1166
5 26
96
670
–22
857
Optic
al in
stru
men
ts22
594
–93
132
2 73
63
512
550
12 5
90
Elec
trici
ty39
269
490
493
2 13
043
434
753
726
628
Build
ings
64 2
9416
88
1087
433
424
225
501
Tran
spor
t ser
vice
s13
7 19
74
917
7 33
818
52
731
931
744
79 0
89
Com
mun
icat
ions
102
299
2777
863
403
2 35
32
220
76 6
69
Insu
ranc
e se
rvic
es13
3 07
81
232
–41
1 46
760
91
745
88 4
47
Real
est
ate
serv
ices
125
178
1633
341
639
4 30
61
544
57 0
45
Othe
r bus
ines
s se
rvic
es11
1 81
168
759
1 55
07
709
5 15
32
792
102
245
Gene
ral g
over
nmen
t ser
vice
s24
1 23
3–
––
21 1
392
832
–24
755
Heal
th a
nd s
ocia
l wor
k63
153
975
––
2 49
780
496
6 09
7
Purc
hase
s by
resi
dent
s19
601
–
Purc
hase
s by
non
-res
iden
ts–
–
Tota
l use
s at
pur
chas
ers’
pric
es2
961
897
41 8
1619
590
17 3
5382
359
35 5
6523
342
1 45
3 58
8–
Tota
l gro
ss v
alue
add
ed/G
DP10
9 66
0(4
762
)44
179
17 4
6426
915
157
391
24 6
6437
966
1 06
3 87
91
168
777
Com
pens
atio
n of
em
ploy
ees
10 7
306
420
14 2
5513
6 08
512 0
59
31 6
9352
0 50
152
0 50
1
Taxe
s le
ss s
ubsi
dies
109
660
(4 7
62)
(749
)32
846
12
260
802
763
21 5
4312
6 44
1
Taxe
s on
pro
duct
s10
9 66
0–
109
660
Subs
idie
s on
pro
duct
s(4
762
)–
(4 7
62)
Othe
r tax
es le
ss s
ubsi
dies
on
prod
uctio
n(7
49)
328
461
2 26
080
276
321
543
21 5
43
Gros
s op
erat
ing
surp
lus/
mix
ed in
com
e34
198
10 7
1612
199
19 0
4611 8
03
5 51
052
1 83
552
1 83
5
Tota
l out
put a
t bas
ic p
rices
85 9
9537
054
44 2
6823
9 75
060
229
61 3
082
517
467
Sourc
e:
Ad
ap
ted
fro
m S
tatistics S
outh
Afr
ica (
36
).

Handbook on monitoring and evaluation of human resources for health
76
countries are issuing reports complying with this stand-
ard, any attempt at comparative analysis requires
careful checking of the actual boundaries of HRH
expenditure; variations may occur in the treatment of
some key items that may affect labour dynamics, such
as allowances and incentives.
6.5 Summary, conclusions and further developmentsThis chapter has focused on the tools, methods and
usual means of measuring expenditure on the health
workforce as a component of overall monitoring and
evaluation of HRH strategies. It has been argued that
there are many advantages of an integrated estimation
of HRH expenditure within routine accounts estimates
– either the system of national accounts or, prefera-
bly, health accounts. There are certainly economies
of scale and quality gains from a comprehensive and
harmonized process in collating and processing the
required data, and in identifying and filling informa-
tion gaps through complementary data collection and
analyses.
To complement or refine available estimates on HRH
expenditure, close collaboration between health
accountants and national accountants is advisa-
ble. When the data are taken from national accounts
records, the most important adjustment required is an
expansion of the boundaries of the health system to
reach concordance with health accounts boundaries.
As such, there is an advantage in generating the data
as a bottom-up exercise (estimating each of the various
components independently and then adding them up);
this allows greater flexibility to use the data in different
ways according to specific needs. When full records
and updates of HRH expenditure are not readily avail-
able, a series of progressive steps can be taken to
move towards a comprehensive assessment: from sim-
ply persons working in health services delivery to those
across the whole spectrum of health system activities,
from measuring just wages and salaries to inclusion of
non-wage contributions, or from government expendi-
ture to all (internal and external) financial sources.
Ensuring the quality, coherence, consistency and rele-
vance of the data – which may be drawn from multiple
sources – requires continuous verification during com-
pilation, integration, adjustment and modelling (39).
This may include data validation and adjustments (to
correct biases, errors, incompleteness and disconti-
nuities); conceptual adjustments (for example to bring
figures using definitions from national accounts in line
with those from health accounts); comprehensive-
ness adjustments (to cover hidden activities, informal
payments and others); and balancing adjustments
(for example between supply and demand for health
labour).
In addition, different policy concerns may require a
specific breakdown of HRH expenditure estimates or
additional analyses beyond standard health or national
accounting methods. Guidelines for health sub-
accounts to produce additional estimations are being
developed and tested by WHO (40, 41) in the follow-
ing areas:
sub-accounts for specific diseases and pro-
grammes (including malaria, reproductive health,
HIV and tuberculosis services);
sub-accounts on child health programmes;
regional health sub-accounts (distributional tables
for specific regions within a country – particularly
relevant for decentralized health systems);
sub-accounts for specific population groups (dis-
tributional tables in terms of expenditure allocation
according to characteristics of health service cli-
ents, such as by age, sex or other socioeconomic
characteristics).
At the same time, it must be recognized that there are
presently no specific guidelines for disentangling the
whole set of health labour cost estimations, and this
across the stages of the working lifespan. Based on
measurement results from several countries, the need
has been recognized for further development in the
following areas in order to reach a comprehensive
assessment of expenditure on HRH:
boundary problems to distinguish between labour
resources in the health system devoted to health-
care services delivery versus other functions and
activities;
challenges regarding completeness and coverage
of information on HRH stock and distribution (for
example lack of centralized database, lack of suffi-
cient detail for disaggregation);
problems with consistency of HRH information
across various data sources, such as lack of stand-
ard practices to classify workers by occupation
and education; differences in practices to esti-
mate full-time equivalents across health worker
groups; potential double-counting of health work-
ers (for example due to multiple qualifications or job
positions); and, given such differences, resulting
difficulties in interpreting and comparing statistical
findings across and within countries.
In sum, strengthening of national information systems,
better use of available data and intensified efforts for
harmonizing definitions and measurement units rele-
vant for health labour accounting should ensure that
investments in the health workforce are appropriately

Measuring expenditure on the health workforce: concepts, data sources and methods
77
monitored and evaluated. This is critical information that
could help address many important policy questions,
such as the costs of scaling up health interventions or
providing incentives for improving staff retention and
motivation to ensure high quality and efficiency of
services.
References1. United Nations, World Bank, International Monetary
Fund, Organisation for Economic Co-operation
and Development, Commission of the European
Communities. System of National Accounts 1993.
New York, United Nations Statistics Division,
1994 (http://unstats.un.org/unsd/sna1993/toctop.
asp?L1=5, accessed 26 February 2009).
2. A System of Health Accounts. Paris, Organisation
for Economic Co-operation and Development, 2000
(http://www.oecd.org/dataoecd/41/4/1841456.pdf,
accessed 13 January 2009).
3. World Health Organization, World Bank, United
States Agency for International Development. Guide
to producing national health accounts: with special
applications for low-income and middle-income
countries. Geneva, World Health Organization,
2003 (http://www.who.int/nha/docs/English_PG.pdf,
accessed 13 January 2009).
4. National health accounts. World Health Organization
Statistical Information System (http://www.who.int/
whosis/indicators/2007NationalHealthAccounts1/en/,
accessed 13 January 2009).
5. National health accounts (NHA). World Health
Organization (http://www.who.int/nha/en/, accessed
13 January 2009).
6. Statistics on occupational wages and hours of work
and on food prices. Geneva, International Labour
Organization, 2000.
7. International Standard Classification of Occupations.
International Labour Organization (http://www.ilo.org/
public/english/bureau/stat/isco/index.htm, accessed
11 January 2009).
8. International Standard Classification of Education:
ISCED 1997. Paris, United Nations Educational,
Scientific and Cultural Organization, 1997 [http://
www.uis.unesco.org/TEMPLATE/pdf/isced/
ISCED_A.pdf, accessed 10 January 2009).
9. International Standard Industrial Classification of All
Economic Activities, fourth revision. Statistical Papers
Series M, No. 4/Rev.4. New York, United Nations
Statistics Division, 2008 (http://unstats.un.org/unsd/
demographic/sources/census/2010_PHC/docs/
ISIC_rev4.pdf, accessed 11 January 2009).
10. Central Product Classification: CPC version 1.1. New
York, United Nations Statistics Division, 2002 (http://
unstats.un.org/unsd/class/family/family2.asp?Cl=16,
accessed 14 January 2009).
11. Classification of the Functions of Government:
COFOG. New York, United Nations Statistics
Division, 2000 (http://unstats.un.org/unsd/class/
family/family2.asp?Cl=4, accessed 14 January
2009).
12. Classification of the Outlays of Producers According
to Purpose: COPP. New York, United Nations
Statistics Division, 2000 (http://unstats.un.org/unsd/
cr/registry/regcst.asp?Cl=7&Lg=1&Top=1, accessed
14 January 2009).
13. European System of Accounts (ESA95).
Luxembourg, Eurostat, European Commission, 1996
(http://circa.europa.eu/irc/dsis/nfaccount/info/data/
ESA95/en/titelen.htm, accessed 26 February 2009).
14. Joint OECD-Eurostat-WHO SHA data questionnaire.
Organisation for Economic Co-operation and
Development, Eurostat and World Health
Organization, 2008 (http://www.oecd.org/health/sha/
jointquestionnaire, accessed 14 January 2009).
15. Poullier JP. National health accounts manual.
Ramallah, Palestine Ministry of Health, 2007.
16. De la Fuente A, Lequellier F. Measuring employment
in national accounts. Presented at the joint UNECE/
Eurostat/OECD meeting on national accounts and
update of SNA, Geneva, 25–28 April 2006 (http://
www.unece.org/stats/documents/2006.04.sna.htm,
accessed 14 January 2009).
17. Human resources of European health systems.
Augsburg, BASYS, 2001 (http://circa.europa.eu/
Public/irc/dsis/health/library?l=/reports/caresgroup/
hla&vm=detailed&sb=Title, accessed 14 January
2009).
18. Van Polanen Petel V. Health labour accounts and the
system of national accounts. Presented at the fifth
meeting of the Eurostat Technical Group on Health
Care Statistics, Luxembourg, 19–20 June 2006.
19. Statistics Canada. Wages and salaries by branch.
Presented at the joint UNECE/Eurostat/OECD
meeting on national accounts and update of SNA,
Geneva, 25–28 April 2006 (http://www.unece.org/
stats/documents/2006.04.sna.htm, accessed 14
January 2009).
20. Maynard JP, Girard A, Tanguay M. Producing
hours worked for the SNA in order to measure
productivity: the Canadian experience. Presented
at the joint UNECE/Eurostat/OECD meeting on
national accounts and update of SNA, Geneva,
25–28 April 2006 (http://www.unece.org/stats/
documents/2006.04.sna.htm, accessed 14 January
2009).
21. Surinov A, Masakova I. Using employment statistics
in the national accounts of the Russian Federation.
Presented at the joint UNECE/Eurostat/OECD
meeting on national accounts and update of SNA,
Geneva, 25–28 April 2006 (http://www.unece.org/
stats/documents/2006.04.sna.htm, accessed 14
January 2009).
22. National accounts: a practical introduction. Studies in
Methods Series F, No. 85. New York, United Nations
Statistics Division, 2003 (http://unstats.un.org/unsd/
publication/SeriesF/seriesF_85.pdf, accessed 14
January 2009).
Handbook on monitoring and evaluation of human resources for health
78
23. Main economic indicators: comparative
methodological analysis – wage related statistics,
volume 2002, supplement 3. Paris, Organization for
Economic Co-operation and Development, 2003
(http://www.oecd.org/dataoecd/20/18/16455130.pdf,
accessed 14 January 2009).
24. Non observed economy in national accounts: survey
of national practices. Geneva, United Nations
Economic Commission for Europe, Statistical
Division, 2008 (http://www.unece.org/stats/
publications/NOE2008.pdf, accessed 14 January
2009).
25. Hernandez P, Poullier JP. Health systems, health
financing and their measurement. Presented at
the joint CPC/PAHO/WHO/FUNSALUD workshop
on development of national health accounts in the
Caribbean, Bridgetown, 10–14 September 2001.
26. SHA guidelines project. Luxembourg, Eurostat,
2003 (http://circa.europa.eu/Public/irc/dsis/caretf/
library?l=/feedback/projectsreports/, accessed 14
January 2009).
27. Satellite health account (SHA) manual, version 1.
Washington, DC, Pan American Health Organization,
2005 (http://www.paho.org/english/dpm/shd/hp/
satellite-health-account-manual-fin05.pdf, accessed
14 January 2009).
28. Cuentas nacionales de salud. Mexico,
Fundación Mexicana para la Salud, 1998 (http://
healthsystems2020.org/content/resource/
detail/1323/, accessed 14 January 2009).
29. Cuentas nacionales de salud 1995–2000. Lima,
Ministerio de Salud del Perú, 2003.
30. System of National Accounts 2008. Pre-edited
version of volume 1. Commission of the European
Communities, International Monetary Fund,
Organisation for Economic Co-operation and
Development, United Nations, World Bank, 2008
(http://unstats.un.org/unsd/sna1993/draftingphase/
WC-SNAvolume1.pdf, accessed 16 February 2009).
31. National accounts. Paris, Organisation for Economic
Co-operation and Development (http://www.oecd.
org/std/national-accounts, accessed 14 January
2009).
32. ESA95 core national accounts. Luxembourg,
Eurostat (http://epp.eurostat.ec.europa.eu/portal/
page?_pageid=2854,63497418,2854_63867997&_
dad=portal&_schema=PORTAL, accessed 14
January 2009).
33. National accounts statistics: main aggregates and
detailed tables, 2006. United Nations Publication
ST/ESA/STAT/SER.X/39, parts I, II and III. New York,
United Nations Statistics Division, 2008.
34. Joint UNSD-Eurostat Conference on
International Outreach and Coordination in
National Accounts for Sustainable Growth and
Development. Luxembourg, Eurostat, 6–8 May
2008 (http://epp.eurostat.ec.europa.eu/portal/
page?_pageid=2313,68881303&_dad=portal&_
schema=PORTAL, accessed 14 January 2009).
35. Cheung P. The System of National Accounts:
implementation status and implications for the
ICP. International Comparison Program Newsletter,
2007, 4(1):1–9 (http://siteresources.worldbank.org/
ICPINT/Resources/ICPNewsletter_Feb07_Web.pdf,
accessed 14 January 2009).
36. National accounts: supply and use table. Pretoria,
Statistics South Africa, 2002.
37. Government finance statistics manual 2001 (GFSM
2001). Washington, DC, International Monetary
Fund, 2001 (http://www.imf.org/external/pubs/ft/gfs/
manual/pdf/all.pdf, accessed 14 January 2009).
38. Government finance statistics (GFS): companion
materials and research. Washington, DC,
International Monetary Fund (http://www.imf.org/
external/pubs/ft/gfs/manual/comp.htm, accessed 14
January 2009).
39. Akritridis L. Accuracy assessment of national
accounts statistics. Economic Trends, 2002,
589:38–53.
40. National health accounts for specific diseases,
programs, population groups, and regions. Geneva,
World Health Organization (http://www.who.int/nha/
developments/en/, accessed 14 January 2009).
41. Guide to producing regional health accounts within
the national health accounts framework. Geneva,
World Health Organization, 2008 (http://www.who.int/
nha/developments/Guide%20to%20Producing%20
Regional%20Health%20Accounts.pdf, accessed 20
February 2009).
79
Use of facility-based assessments in health workforce analysis
BOLAJI FAPOHUNDA, NANCY FRONCZAK, SHANTHI NORIEGA MINICHIELLO,
BATES BUCKNER, CATHERINE SCHENCK-YGLESIAS, PRIYA PATIL
7.1 IntroductionThe global health literature demonstrates that health-
care service coverage and quality are directly
correlated with health worker numbers and perform-
ance. For instance, the World Health Organization
(WHO) has presented evidence showing that cover-
age of selected primary health-care services, including
maternal, newborn and child health interventions, tend
to rise with higher national health workforce densi-
ties (1). Using the Millennium Development Goals as
the benchmark, WHO reports that countries with the
highest shortfalls in numbers of physicians, nurses and
midwives are the ones most at risk of not meeting cov-
erage targets. The African region – home to only 3% of
the estimated 59.2 million health workers in the world
but having 24% of the global burden of disease – is the
area hardest hit by health worker shortfalls and imbal-
ances worldwide (1).
Securing improvements in the size and quality of the
health workforce is important for achieving regional
and country-specific Millennium Development Goals in
health. Overcoming human resources for health (HRH)
shortages and imbalances requires strengthening edu-
cation and training programmes for health workers,
improving health sector working conditions (including
staff salaries and benefits) and forging cooperation
and collaboration in health workforce management
within and across countries. Evidence-based moni-
toring of health workforce dynamics is important for
ensuring that policy and programmatic inputs lead to
the expected outcomes.
Often, a lack of comprehensive, timely and reliable data
on HRH results in poor knowledge of workforce status
and curtails development of evidence-based policies
among national and international stakeholders. Several
factors have contributed to the weak information and
evidence base on the health workforce in many low- and
middle-income countries. These include lack of a com-
mon framework from which to understand HRH issues;
poor data availability and quality; imprecise definitions
and classifications of certain health worker catego-
ries; weak technical capacity to conduct in-country
workforce analysis; lack of appropriate measurement
tools; and underinvestment in national health informa-
tion systems (1–3). In particular, lack of standardized
approaches to HRH assessment limits the potential for
comparative analysis over time and across countries
to better understand how different situations, policies
and interventions impact the performance of human
resources and health systems and, ultimately, popula-
tion health outcomes.
Health facility assessments (HFAs), the focus of this
chapter, are tools for gathering data that are a potentially
important source of information for health workforce
monitoring. A number of countries already conduct
such assessments, and demand for them is increas-
ing. Health facilities refer to service delivery points in
the formal health sector, including hospitals, health
centres, dispensaries and health posts. HFA protocols
capture real-time information (i.e. at the moment of the
assessment) on a key component of the overall health
system: facility-based service delivery. Depending on
the nature of the data collection instruments, HFAs
can provide detailed information on health workforce
availability, distribution, qualifications, skills mix, train-
ing and performance. This information can be used
to determine, for example, how existing staffing pat-
terns relate to desired or planned staffing levels, how
well staff members’ qualifications match their assigned
scope of work and the nature and extent of geographi-
cal or other staffing imbalances. HFAs can also provide
insight into the broader health labour market context,
including management practices and other features of
the work environment (for example infrastructure and
availability of medical supplies and equipment), and
how these variables affect health worker supply and
performance. In short, HFAs can inform workforce pol-
icy by telling us what is happening on the ground, in the
real world of service delivery.
The main objective of this chapter is to describe the
current and potential usefulness of HFAs as a source of
7

Handbook on monitoring and evaluation of human resources for health
80
information for health workforce planning, management,
monitoring and policy-making. Illustrative examples are
presented based on empirical data from HFAs con-
ducted in Kenya, Nigeria and Zambia. Facility-based
assessments cover a broad array of data collection
techniques, including facility audits, observations of
services delivered, interviews with service providers
and interviews with clients. These various methods,
along with other practical considerations in planning
an HFA, are reviewed here. However, this chapter does
not elaborate step-by-step instructions on designing
and implementing facility assessments; for general
information and relevant resources see International
Health Facility Assessment Network tools (4, 5).
7.2 How facility-based assessments can be used for health workforce monitoringAs detailed in Chapter 1 of this Handbook, there are
three interdependent stages in the lifespan of the health
workforce: (i) pre-service or entry into the workforce;
(ii) active workforce; and (iii) exit from the workforce.
Ongoing measurement and monitoring of perform-
ance indicators for each of the three stages is needed
to determine the health system’s readiness and abil-
ity to maintain a sufficient stock of qualified workers.
Because the stages are interactive and interdepend-
ent, monitoring must be holistic rather than fragmentary,
focusing on the whole rather than little slices of the pie.
While detailed analysis of the entry and exit stages is
beyond the scope of HFAs (for example health edu-
cation outputs and costs, and mortality and migration
among health workers, respectively), facility-based
sources can provide valuable information to comple-
ment data obtained using other methodologies (such
as special studies on education or migration).
Box 7.1 shows a list of indicators that can potentially
be measured for each of the workforce stages using
HFA data. Most population-based sources of health
workforce statistics (for example population censuses,
labour force surveys) tend to relate workforce data to
the general population; while important in their own
right, they provide little insight into the service delivery
environment, service quality or other operational fac-
tors within the health system that can play a major role
in workforce performance. HFA data can help address
this information gap by describing health labour dynam-
ics at facility-based service delivery points.
Box 7.1 Core health workforce indicators potentially measurable with HFA data
Entry stage of the working lifespan
Number of new medical/health graduates
entering the facility-based health workforce
Ratio of new medical/health graduates entering
the facility-based workforce to the total facility-
based health workforce
Active workforce stage
Supply
Stock or total number of facility-based health
workers
Number of facility-based workers relative to total
(catchment) population
Number of facility-based workers relative to
planned staffing norm
Number of staff per health facility (by type of
facility or services offered)
Distribution
Skills mix of facility-based staff
Geographical distribution of facility-based staff
Age and sex distribution of facility-based staff
Capacity, motivation and performance
Level and field of education among facility-
based staff
Years of professional experience among staff
working at the facility
Staff receiving in-service training during a
reference period (by type of training)
Services provided by staff during a reference
period
Proportion of staff working full time versus part
time at the facility
Proportion of staff assigned to the facility (in
post) working at the facility on the day of the
assessment
Proportion of staff receiving (non-monetary)
incentives at their job
Exit stage
Facility-based health workforce attrition rate (by
reason for leaving workplace)
Ratio of facility-based health workers entering
the workforce to those exiting the workforce
Use of facility-based assessments in health workforce analysis
81
7.3 Overview of key HFA methodologiesThis section provides an overview of issues of impor-
tance when planning an HFA, and describes the
methods and focus of data collection for several dif-
ferent HFA tools developed by different private, public
and international organizations.
7.3.1 Issues when planning an HFAAll HFAs collect data at the facility level, but methodol-
ogies and protocols may vary in relation to information
needs, costs and sources of funding, and local imple-
mentation capacity. Here the main practical and
methodological issues are discussed, as they relate to
HRH monitoring.
Selection of facilities to be covered in the HFA: census or survey sample
The design of an HFA requires careful attention to the
strategy for data collection from the initial planning
stages, particularly the sampling method: census or
survey sample. The choice of method often depends
on trade-offs in scope and depth of information to be
obtained with cost and time factors.
Census method. A census is a full enumeration, or
the collection of data from all facilities that meet eligi-
bility criteria. Examples of eligibility criteria that have
been used for HFAs include: (i) managing authority,
whether government, private for-profit, nongovernmen-
tal or faith-based organization, or other management or
funding criteria; (ii) facilities offering certain services (for
example maternal and newborn services, child health
services, HIV-related services); (iii) facilities of a given
type (from primary health-care centres to tertiary-level
hospitals); or (iv) facilities within a certain geographical
area. Often, a combination of several such criteria is
used. Advantages of a full enumeration, or facility cen-
sus, include having information specific to every facility
and the potential for simpler data analysis and inter-
pretation of results (no need for sampling weights or
calculating a statistical margin of error). Disadvantages
include difficulties in ensuring a complete enumera-
tion of all eligible facilities and higher costs, especially
when the number of facilities to be enumerated is large.
Survey sample method. In survey approaches, prob-
ability sampling principles are used to draw a selection
of facilities for inclusion in the assessment. First, the
eligibility criteria (see above) are developed; then,
a number of facilities are selected based on a sam-
pling frame or list of all eligible facilities. The larger the
sample size, the greater the precision of the results;
however, the total size will often also depend on budget
and other constraints. Usually, once the list frame has
been developed, a multistage sampling plan is followed
to ensure representation across various domains of
the universe of eligible facilities. The stages are deter-
mined by the different eligibility criteria (for example
administrative authority, type, geographical location).
When a multistage sampling is used, sample weights
need to be applied when analysing the data to calibrate
for national representation. The weights are mathemat-
ically derived by sampling experts.
A key weakness in generating a list frame of health
facilities is that different authorities do not always
have up-to-date records of facilities functioning in the
country. Experience shows that oftentimes facilities,
particularly in the private sector (either for-profit or not-
for-profit), may have closed or changed addresses,
and there is no standard definition for a type of facil-
ity in the private sector. An initial list obtained from the
ministry of health will usually need to be complemented
with information from multiple other sources, such as
private sector coordinating bodies, social ministries
where nongovernmental organizations register their
activities, or directly from faith-based, private and par-
astatal organizations.
Where the HFA includes interviews with individual
providers, the health worker to be interviewed is ran-
domly selected from the list of those present on the
day of survey. Although ensuring an unbiased (non-
zero) chance of selection for each health worker is an
important factor, practical considerations of availabil-
ity and relevance are also essential. In most situations,
health workers providing direct client services tend
to be prioritized over those performing administrative
duties, such as maintaining health information records
or other activities not directly entailing services deliv-
ery. A major advantage of a well-designed sampling
plan is that in-depth data collection is feasible within
a reasonable time and cost. More information on sam-
pling methodologies to provide unbiased estimates of
facilities and their characteristics is available elsewhere
(see, for example, the MEASURE Evaluation manual
(6)).
Data collection methods and tools
Facility-based assessments may employ one or more
techniques for data collection, including facility audit
(often referred to as an inventory), observation of serv-
ices delivered, interviews with clients, and interviews
with service providers and other facility staff. Tested
data collection tools exist for each of these methodolo-
gies (see section 7.3.2 below).
Facility audit. This is the method used to collect infor-
mation on infrastructure, availability of equipment and

Handbook on monitoring and evaluation of human resources for health
82
supplies, staffing levels, services offered, and manage-
ment and support systems in place. While structured
questionnaires are always used in facility audits, there
may be differences across tools in how the informa-
tion is collected. Protocols tend to differ with regard to
choice of respondent to the questionnaire (for exam-
ple interviewing the person in charge of the facility’s
operations overall, versus selecting a range of persons
considered most knowledgeable for each information
domain); where within the facility physical data collec-
tion will occur (enumeration of all items regardless of
location in a facility, versus counting only those located
and functioning in the relevant service delivery area on
the day of the assessment); and whether there is vali-
dation of reported responses (accepting as legitimate
any interview response, versus requiring additional
data collection by other approaches such as inspec-
tion of equipment or review of administrative records).
Using multiple respondents, validating reported infor-
mation by observation and ensuring items are in the
relevant service area each take time, particularly in
large and complex facilities. In addition, validation exer-
cises may require engaging more highly skilled data
collectors who are familiar with health services and
systems (see next subsection on selection of data col-
lectors). However, these techniques tend to provide the
most uniformly reliable and valid information, and allow
for more in-depth assessments of capacity to provide
quality services. For example, if blood pressure moni-
tors are found to be available somewhere in the facility,
but none are within the specific area where a health
worker who might require such equipment is providing
services, it is unlikely that clients will have their blood
pressure measured. Past experience also indicates
that when interview responses from key informants are
not validated, respondents sometimes provide answers
that describe the usual or even desired situation, rather
than the actual situation on the day data are collected.
This is especially true in larger facilities, where an over-
all administrator may not be closely familiar with the
day-to-day state of affairs in each service delivery area.
Observation of key services. Client observations
are service specific, and may be based on a full cen-
sus (observing all eligible clients who receive services
during the period of data collection) or opportunistic
sample (clients served when the data collector was
available and present). Most of the data collection
tools are checklists that measure process, for exam-
ple information shared, examinations carried out and
medicines or tests prescribed. In general, observation
data are used to assess compliance of health worker
practice to established guidelines. Direct observation
may be followed by special studies in order to improve
data credibility. These are sometimes referred to as
“gold standard” observations, whereby someone more
highly skilled and specialized than the observed worker
revisits with the client afterwards to determine whether
correct diagnosis, care and treatment were provided.
Interviews with clients. Client or exit interviews are
often used to ascertain client perspective on the qual-
ity and responsiveness of services received, which can
be useful for assessing health worker performance. Exit
interviews may be conducted among a random sam-
ple of all attenders on the specific day, or include only
those whose consultations were observed. A major
weakness in exit interviews is the bias toward more
recent and possibly more self-motivated clients whose
care-seeking behaviours may not be representative of
the target population, or the universe of those receiv-
ing such services. Additionally, exit interviews, by their
nature, provide a superficial rather than an in-depth
examination of the client’s perspectives on the serv-
ices received. An in-depth analysis is preferable, but
requires time inputs that may be unduly burdensome to
clients who may have already spent many hours in the
facility waiting for and obtaining services.
Interviews with service providers. Interviews with
service providers are used to collect information on
types of services provided, opinions related to the
working conditions, educational attainment, in-serv-
ice trainings and working experience. The method
may also be used to evaluate health workers’ knowl-
edge in specific topic areas. As with the exit interview,
health worker interviews are, by design, short in order
to minimize disruption to service provision, since data
collection occurs during regular business hours. As
such, HFAs are not a source of detailed information
for human resource development; additional informa-
tion on workforce performance will have to be obtained
from special studies, which are imperative in any HRH
monitoring and evaluation plan. Facility records of staff
training may provide an alternative source for some of
these data, provided such records are available, com-
plete and routinely updated.
Selection of data collectors
A combination of persons with clinical and social sci-
ence backgrounds is recommended for data collection
activities in health facilities. A mix of persons with skills
in the science of data collection and those familiar with
the functioning of health facilities helps to assure the
quality of data collected. For instance, it is generally
agreed that interviews with providers and clients can
be handled well by non-health personnel, but obser-
vations of provider–client interaction require observers
with advanced training in a health-related field. Having
data collectors with a health background may be less
important for facility audits, depending on the complex-
ity of the tool being used, but knowledge of the health

Use of facility-based assessments in health workforce analysis
83
system processes is likely to enhance the efficiency
and reliability of data collection in any context.
7.3.2 Examples of tested HFA instrumentsA number of different HFA tools have been developed
and implemented under the auspices of international
technical cooperation programmes for collecting data
relevant for HRH analysis. They include the Health
Facility Census (HFC) developed by the Japanese
International Cooperation Agency (JICA); Service
Availability Mapping (SAM) developed by WHO; the
Service Provision Assessment (SPA) developed by
Macro International; and the Situation Assessment of
Human Resources in the Public Sector developed by
Partners for Health Reformplus (PHRplus) (7). Overall
such methods can be tremendously useful for updat-
ing and validating national databases of health system
statistics, including HRH, and should be considered
for this purpose by any country interested in investing
in its HRH information system. Customized modules
can also be added to supplement these standardized
approaches if they are needed for comprehensive HRH
assessment in a given context. The types of health
workforce information collected are generally similar
across sources, but results may not be directly compa-
rable, given each tool’s specificity.
JICA Health Facility Census
The JICA Health Facility Census tool is designed to
provide detailed information on the status of physical
assets at all health facilities within a country (8). The
focus is on information useful for public health system
infrastructure investment planning (9, 10). Designed
as a physical asset mapping, the HFC also conducts
a headcount of all health workers present on the day
of visit. Data obtained include staff qualifications, the
number of staff present versus the number assigned,
demographic composition and staff qualifications.
Service Availability Mapping
Developed by WHO, SAM is designed to determine
the availability of key programmes and resources, and
map common services (11). While originally developed
for implementation at the district level, the facility-
based data can be aggregated to provide evidence
for decision-making at the national level when all dis-
tricts in a country are included. SAM consists of a suite
of tools, including district and health facility question-
naires, each of which is administered to key informants;
a data entry programme on personal digital assistant
(PDA); and a geographical information system software
(HealthMapper). The district questionnaire is meant
to be administered to all district medical officers in a
country (a subset of districts may be sampled in very
large countries). The health facility module captures
information on all public and private facilities within
districts. The capturing of geographical coordinates
allows unique identification and charting of health
facilities. Data collected on HRH include staff qualifica-
tions, staff availability on the day of visit versus staffing
norms – that is, approved staffing positions for the spe-
cific facility as assessed based on service utilization
or other workload indicator (see 12 for related tool) –
and working hours. Although essentially a district-level
monitoring tool, SAM is expandable to include more
HRH questions in order to provide detailed data on
health personnel at the district level. The method can
be combined with the HRH targeted approach, such
as that developed in the PHRplus tool (described later
in this section), to produce data for more robust HRH
analyses that take into account national sociodemo-
graphic and epidemiological contexts.
Service Provision Assessment
SPA is designed to assess the quality of health serv-
ices as measured through resources, systems and
some observed practices (13). Developed with fund-
ing from the United States Agency for International
Development (USAID), SPA collects data on current
workforce size versus staffing norms. Additional data
may be collected on each staff member’s qualifica-
tions and working hours and on seconded workers
(for example numbers and salary source). An example
of where this kind of assessment may be useful is the
Caribbean region, where physicians frequently rotate
on a schedule between several facilities. Interviews
based on a subsample of staff, including primary
providers of key services, are used to assess the work-
force skills mix in terms of workers’ levels and fields
of pre-service education, types of in-service training
received during a reference period and years of expe-
rience at the given facility. (The tool does not presently
collect data on specialty education received after the
initial clinical qualification, although some information
may be inferred from respondents’ reported duration
of schooling for their current occupation.) The propor-
tion of staff performing activities in the specific area
of in-service training can be measured by this instru-
ment, and can be utilized to assess whether training is
targeted to the appropriate staff and whether staffing
assignments take training into account.
Partners for Health Reformplus situation assessment
The PHRplus survey tool presents an example of how
a facility-based assessment of HRH may be con-
strued. Developed by Partners for Health Reformplus
with funding from USAID, this tool collects data on

Handbook on monitoring and evaluation of human resources for health
84
workforce size, skills mix, distribution and turnover
rates in the public health sector (7). Data on individ-
ual workers are supplemented with a situation analysis
of national health planning, information and strategy
documents, plus a modelling exercise to determine
human resources needed for achieving targets under
the United States President’s Emergency Plan for AIDS
Relief and the health-related Millennium Development
Goals. Estimates based on the modelling exercise
developed for Nigeria – focusing on provision of serv-
ices for HIV, malaria, tuberculosis, maternal and
child health, and family planning – illustrate how this
approach could inform the development of a stand-
ardized version for cross-country analysis (14). Such
adaptation should be made in the context of indicators
that health managers need for programme monitor-
ing and should factor in country- and disease-specific
contexts.
Selected additional tools
Other HFA methodologies useful for assessing the
HRH situation have been developed, tested and imple-
mented at the national, subnational and programme
levels. A list of these tools, though not exhaustive, fol-
lows below.
The Facility Audit of Service Quality is a rapid and
simple assessment tool developed by MEASURE
Evaluation to help district- and programme-level
officials design and implement a tailored HFA (15).
The audit employs a strategy that recommends a
complete enumeration of all facilities in the target
districts. When implemented in the intended fashion
– that is, with local district or programme staff serv-
ing as data collectors and asking local stakeholders
to tailor the protocol to their needs – results are not
likely to provide the consistency required for aggre-
gation at the national level. As such, the approach is
not designed or recommended for use for national-
level planning and evaluation.
The Assessment of Human Resources for Health
is a survey instrument developed by WHO for col-
lecting quantitative and qualitative HRH information
(16). Four questionnaires are included in the tool,
focusing on the following areas: health professional
regulation, training institutions, health facilities and
health-care providers. The questionnaire for health-
care providers – which covers topics such as
professional qualifications, dual employment and
occupational mobility – is meant to be implemented
among a representative sample of facility-based
health workers, and can be merged with the data
collected at the facility level for collating information
on the environment within which workers operate.
The Quantitative Service Delivery Survey is an
outgrow of the Public Expenditure Tracking Survey
of the World Bank, whose original purpose was to
analyse the efficiency of financial resource flows and
estimate the leakage of public resources from cen-
tral government to the front-line service providers
(17). The tool includes questionnaires addressing all
levels of service delivery: ministry of finance, min-
istry of health, regional and district administrations,
health facilities, health service providers and clients
of health services. The facility instrument, intended
for the head of facility, gathers financial data (both
revenue and expenditure sides) and information on
institutional arrangements and governance, to name
a few. The providers survey can be used to study
worker morale, absenteeism and coping strate-
gies such as informal payments. Some surveys also
include vignettes to assess the level of knowledge of
doctors and nurses, which serves as a proxy for the
quality of care provided.
7.3.3 Implications of HFA methodologies and data collection issuesWhen it comes to the sampling approach, in general,
censuses are more appropriate when facility-specific
information is needed, such as infrastructure, human
resources, equipment, supplies and other essential
inputs. Survey samples are best when more in-depth
information is needed, including particular details
reflecting systems processes, services provision,
health information and record-keeping practices, pro-
vider productivity, management and supervision, and
client perception of service quality. A mixture of the HFA
methods may be most appropriate when assessing
HRH at the facility level. Censuses (such as the HFC or
SAM) can provide precise pictures of the numbers and
distributions of health workers, whereas sample sur-
veys (such as SPA) including provider interviews offer
the means to identify systems issues that affect worker
motivation and satisfaction and the information base to
design retention strategies. It is sometimes possible to
mix sampling methods within the same assessment,
collecting some (basic) information from all facilities
and more in-depth data from a sample.
Several variations of HFA data collection tools have
been developed and used to meet a wide range of
specific information needs. It is essential that any
generic tools are country-adapted before they are
utilized so that precoded responses capture local ter-
minologies and processes. This applies not only to
certain equipment and supplies (for example names of
medicines) but notably also to occupational titles and
qualifications of staff, which would then be harmonized
and mapped against standard definitions during data

Use of facility-based assessments in health workforce analysis
85
processing and analyses for enhancing comparability
across sources and over time.
Overall, there is no single HFA method that will meet all
needs. Understanding the benefits and problems with
different methods and tools will help stakeholders to
select those most appropriate for their needs.
7.4 Some limitations of HFA methodologies for HRH dataWhile HFAs present a number of advantages for HRH
analysis, there are also some limitations to this method-
ology that need to be considered.
7.4.1 Assessment coverageAs with all population- or establishment-based data
collection exercises, availability of an adequate sam-
pling frame for selection (either universal selection for
census or sample for survey) is a key factor. Ideally, for
HFA approaches, a complete list of all service delivery
points in a country (or targeted areas) can be obtained
from registration or licensing offices, or from the coun-
try’s routine health information system. Often however,
these sources are non-existent, incomplete or out of date
when it comes to health facility information. Likewise, if
a representative sample of staff within selected facil-
ities needs to be drawn for interviews, this requires a
further step in sampling design, notably a complete
listing of all facility-based personnel (and even time-
specific duty rosters). Inadequately designed or poorly
implemented sampling at any level compromises the
validity of generalizations to the health workforce as
a whole and severely compromises the utility of such
data as evidence for decision-making.
It is not uncommon for HFAs to cover only facilities in the
government or public sector, with obvious implications
for applicability of ensuing analysis to reflect the true
national situation. In some cases, this limitation reflects
weak enforcement of regulatory mechanisms oversee-
ing service provision outside the government sector
(and thus poor data on the operations and locations
of such providers from which to complete the sam-
pling frame), and in others the difficulty of collecting
data from privately operated facilities (where refusals
to participate are more common). When private sector
facilities are included, coverage tends to favour not-
for-profit facilities (for example parastatal facilities or
those sponsored by recognized nongovernmental and
faith-based organizations). In many low- and middle-
income countries, private for-profit facilities tend to be
smaller, geographically concentrated in urban areas,
less standardized in terms of staffing and breadth of
services, and more likely to cease operation within a
relatively short timeframe. In countries where a large
portion of health services are provided by the private
sector, government-only HFAs will underestimate the
overall human resource stock and flow.
On the other hand, including the private sector could
increase the risk of double-counting health workers,
particularly in settings where dual employment across
both sectors is common but not sanctioned by regula-
tory and legal frameworks. Dual practice (that is, where
a worker holds two or more jobs at different locations)
is present in virtually all countries regardless of income
level and does not necessarily impact negatively on
health system performance. Even in contexts with strict
regulatory restrictions of health professional activities,
such as China and much of Latin America, physicians
often hold jobs in both the publicly funded and private
systems (18). The implication for HRH monitoring is that
careful consideration of ways to avoid double-count-
ing personnel should be an important component of
any health facility-based assessments. Methods that
have been used to address this issue include collect-
ing information from health workers on the proportion of
working hours during a week spent in a particular facil-
ity, or specifically asking about other facilities where
they work.
7.4.2 Lack of standardization of definitions and statistical classification of health workersThe lack of standardization of health worker definitions
across the various HFA approaches, including consist-
ent definitions for occupational categories, is a serious
hindrance to the usefulness of HFA data for compara-
tive analysis of HRH within and across countries and
over time. Most HFA approaches use country-specific
or tool-specific occupational labels with no provi-
sion for translation to an internationally comparable
set of categories. Many national occupational titles –
especially those referring to staff other than medical,
nursing and midwifery professionals – and the under-
lying data on staff qualifications are often not captured
in a way that can easily be mapped to the International
Standard Classification of Occupations (ISCO) (19) or
the International Standard Classification of Education
(ISCED) (20), respectively.
Occupational categories that present special chal-
lenges include those for health workers providing
community or counselling services and those in the
assistant or aide category. The job criteria and respon-
sibilities assigned to these categories vary widely
from country to country, and even across the pub-
lic and private sectors within a given country. These
categories of workers are numerous and, especially in

Handbook on monitoring and evaluation of human resources for health
86
countries where highly educated medical practitioners
are scarce, they often serve as the primary, on-the-
ground providers of health services. Nationally defined
occupations with labels such as “medical assistant” or
“clinical officer” can be mapped to ISCO only if infor-
mation on the level and specialization of educational
qualifications are known. In some countries, workers
with these labels work at an associate professional or
lower level, while in other countries workers with the
same labels have education requirements and respon-
sibilities at a level higher than a professional nurse.
Reliable mapping of national to international occupa-
tional and educational classifications depends on the
detail with which data on the national categories are
obtained, including, for example, data on staff training
and responsibilities. Existing HFA tools tend to vary on
this level of detail.
7.4.3 Lack of uniformity in definitions of facility typesTo date there has been no uniformity across coun-
tries and tools in definition of common categories of
health facilities. Even within a given country, facilities
assigned the same label can vary greatly in size and
function. In Kenya, for example, HFA data have shown
that almost one in three facilities officially classified as
health centres had no overnight or inpatient beds, but
one in six had 20 or more beds. Standardized defi-
nitions for the most common types of health facilities
are needed to enable comparisons within and across
data sources. The International Standard Industrial
Classification of All Economic Activities offers some
guidance on this matter (21), but the definitions and
categories in this generalized resource are broader
than required in a typical HFA; even the lowest level
of disaggregation classes just “hospital activities” and
“medical and dental practice activities”. Recent efforts
towards establishing a common, detailed standard for
HFAs have experimented with using the number of
inpatient beds as a proxy for facility size and service
complexity. These issues are important for consider-
ing, in particular, staffing norms and other indicators
pertinent to HRH analysis.
7.5 Empirical examples based on HFA dataThis section provides illustrative examples of the types
of HRH data produced when using existing HFA tools,
and how such facility-based data can be used in moni-
toring and analysis of the HRH situation. The illustrative
analyses draw on microdata collected in Kenya and
Zambia using three different HFA techniques (HFC,
SAM and SPA) and published results for Nigeria using
the PHRplus tool. The SPA sample survey data are
weighted to correct for unequal selection rates across
sampling units. Data from the HFC and SAM methods,
which used census sampling (or complete enumeration
of all facilities), did not need to be weighted or adjusted.
7.5.1 Entry to the health workforceHFAs can be used to estimate the number of new
entries or incoming staff to the facility-based workforce,
and the ratio of new entries to the total facility-based
stock of health workers in a particular reference period.
Table 7.1 presents an example of such data for selected
categories of health workers in Nigeria’s public sector.
The data show the numbers who entered the public
health service in 2005: 1214 physicians, 1331 nursing
and midwifery personnel, 501 laboratory technolo-
gists and technicians, 443 pharmaceutical staff (about
half of whom were pharmacists) and 2742 community
health workers (including community health officers
and community health education workers). New entries
constituted 7.7% of the existing stock of physicians,
1.1% of nurses and midwives, and 3.6% of pharmaceu-
tical staff (14).
When compared to the number of graduates from
health professions education institutions in the same
year, it can be observed that entries into the pub-
lic sector accounted for 60.7% of all newly graduated
physicians, but only 2.4% of newly graduated nurses
and midwives. Such information, even if incomplete, is
important for understanding health worker preferences
in choice of employment – in this case, public sector
service – and how this varies by cadre.
In the absence of information from health education
institutions on numbers of new graduates, an exami-
nation of the age profile of health workers can provide
some insight into workforce renewal patterns. Data
from the Kenya 2004 SPA (22) indicate that the health
workforce in the country is quite young, with over one
quarter (26%) of all facility-based staff aged less than
30 years. As shown in Figure 7.1, the ratio of younger
workers to those closer to retirement age (45 years and
over) is relatively high, especially among medical per-
sonnel. On the other hand, the ratio of younger to older
personnel in the nursing and midwifery field is much
lower. Public facilities tend to have younger health
workers than private facilities (results not shown). This
type of information might indicate a need to further
investigate the reasons younger health workers may
be less likely to serve in certain facilities and develop
appropriate incentives for their recruitment, or to inves-
tigate the reasons older workers may be more likely to
leave this kind of service and improve incentives for
their retention.

Use of facility-based assessments in health workforce analysis
87
Table 7.1 Estimated number of new graduates entering the public sector facility-based health workforce, by cadre, Nigeria 2005
Cadre Number of new
incoming facility-
based staff
New incoming staff
as % of existing
stock
Number of
graduates from
health professions
education
institutions
New incoming
staff as % of
annual education
institution turnout
Physicians 1214 7.7 2000 60.7
Nursing & midwifery personnel 1331 1.1 5500 2.4
Laboratory personnel 501 3.4 n.a. n.a.
Pharmaceutical personnel 443 3.6 800 55.4
Community health workers 2742 3.3 n.a. n.a.
n.a. Not available (no information collected).
Source: Chankova et al. (14 ).
Figure 7.1 Ratio of facility-based health workers aged under 30 to those aged over 45, by cadre, Kenya 2004 SPA
Source: Kenya 2004 SPA (22).
1.9
0.7
1.4
0.0
0.5
1.0
1.5
2.0
Medicalpersonnel
Nursing &midwiferypersonnel
All healthworkers
Rat
io o
f you
nger
to o
lder
hea
lth w
orke
rs
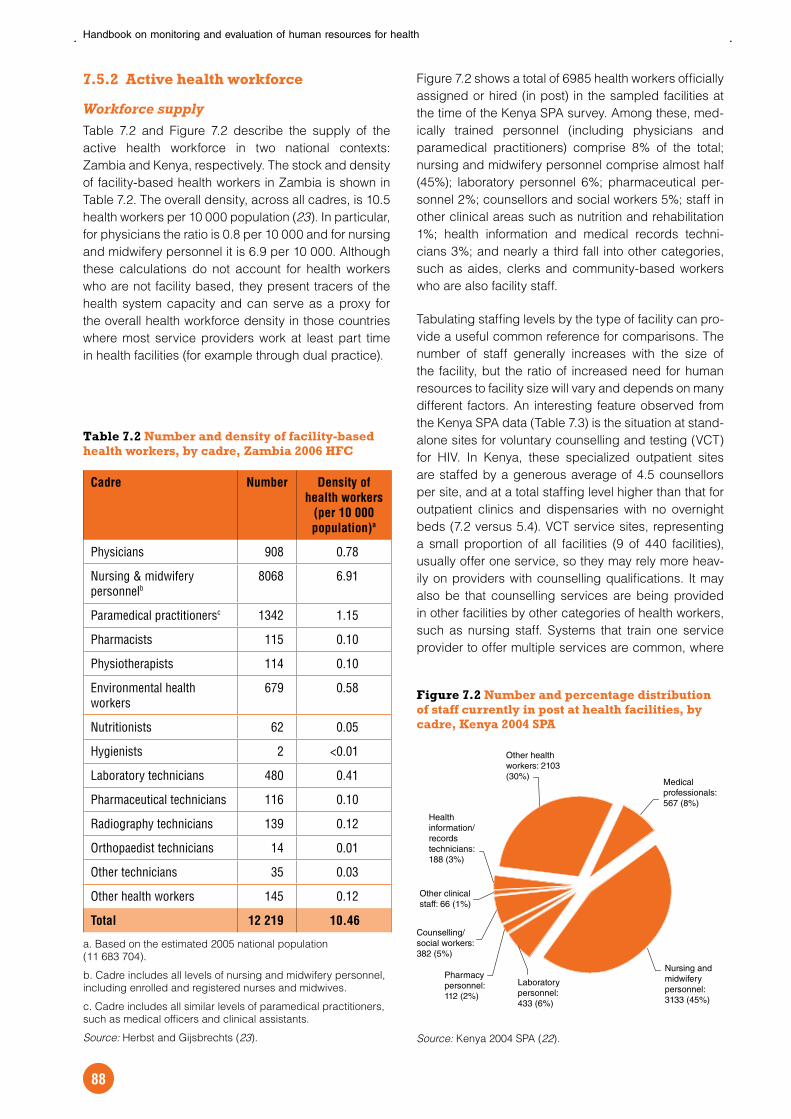
Handbook on monitoring and evaluation of human resources for health
88
7.5.2 Active health workforce
Workforce supply
Table 7.2 and Figure 7.2 describe the supply of the
active health workforce in two national contexts:
Zambia and Kenya, respectively. The stock and density
of facility-based health workers in Zambia is shown in
Table 7.2. The overall density, across all cadres, is 10.5
health workers per 10 000 population (23). In particular,
for physicians the ratio is 0.8 per 10 000 and for nursing
and midwifery personnel it is 6.9 per 10 000. Although
these calculations do not account for health workers
who are not facility based, they present tracers of the
health system capacity and can serve as a proxy for
the overall health workforce density in those countries
where most service providers work at least part time
in health facilities (for example through dual practice).
Figure 7.2 shows a total of 6985 health workers officially
assigned or hired (in post) in the sampled facilities at
the time of the Kenya SPA survey. Among these, med-
ically trained personnel (including physicians and
paramedical practitioners) comprise 8% of the total;
nursing and midwifery personnel comprise almost half
(45%); laboratory personnel 6%; pharmaceutical per-
sonnel 2%; counsellors and social workers 5%; staff in
other clinical areas such as nutrition and rehabilitation
1%; health information and medical records techni-
cians 3%; and nearly a third fall into other categories,
such as aides, clerks and community-based workers
who are also facility staff.
Tabulating staffing levels by the type of facility can pro-
vide a useful common reference for comparisons. The
number of staff generally increases with the size of
the facility, but the ratio of increased need for human
resources to facility size will vary and depends on many
different factors. An interesting feature observed from
the Kenya SPA data (Table 7.3) is the situation at stand-
alone sites for voluntary counselling and testing (VCT)
for HIV. In Kenya, these specialized outpatient sites
are staffed by a generous average of 4.5 counsellors
per site, and at a total staffing level higher than that for
outpatient clinics and dispensaries with no overnight
beds (7.2 versus 5.4). VCT service sites, representing
a small proportion of all facilities (9 of 440 facilities),
usually offer one service, so they may rely more heav-
ily on providers with counselling qualifications. It may
also be that counselling services are being provided
in other facilities by other categories of health workers,
such as nursing staff. Systems that train one service
provider to offer multiple services are common, where
Table 7.2 Number and density of facility-based health workers, by cadre, Zambia 2006 HFC
Cadre Number Density of
health workers
(per 10 000
population)a
Physicians 908 0.78
Nursing & midwifery personnelb
8068 6.91
Paramedical practitionersc 1342 1.15
Pharmacists 115 0.10
Physiotherapists 114 0.10
Environmental health workers
679 0.58
Nutritionists 62 0.05
Hygienists 2 <0.01
Laboratory technicians 480 0.41
Pharmaceutical technicians 116 0.10
Radiography technicians 139 0.12
Orthopaedist technicians 14 0.01
Other technicians 35 0.03
Other health workers 145 0.12
Total 12 219 10.46
a. Based on the estimated 2005 national population
(11 683 704).
b. Cadre includes all levels of nursing and midwifery personnel,
including enrolled and registered nurses and midwives.
c. Cadre includes all similar levels of paramedical practitioners,
such as medical officers and clinical assistants.
Source: Herbst and Gijsbrechts (23).
Figure 7.2 Number and percentage distribution of staff currently in post at health facilities, by cadre, Kenya 2004 SPA
Source: Kenya 2004 SPA (22).
Health information/ records technicians: 188 (3%)
Other clinical staff: 66 (1%)
Counselling/ social workers: 382 (5%)
Pharmacy personnel: 112 (2%)
Laboratory personnel: 433 (6%)
Nursing and midwifery personnel: 3133 (45%)
Medical professionals: 567 (8%)
Other health workers: 2103 (30%)

Use of facility-based assessments in health workforce analysis
89
scarce human resources do not allow a specialist for
every service.
Another useful indicator for monitoring workforce sup-
ply is the ratio of health workers per patient bed. Figure
7.3 graphs the median ratio of health workers per bed
in Kenya, disaggregated by facility size, with facility
size used as an indicator for complexity of services
offered and numbers of clients receiving services. This
information can be used to identify potential outliers
in levels of staffing and to monitor changes in staffing
ratios over time.
Table 7.3 Mean number of health workers by type of facility, according to cadre, Kenya 2004
Cadre Facility type/size
VCT stand- alonea
No overnight/ inpatient
beds
1–9 beds 10–19 beds
20–49 beds
50–99 beds
100+ beds
(n=9) (n=237) (n=93) (n=40) (n=39) (n=8) (n=14)
Medical practitioners 0.1 0.3 0.9 1.1 1.5 6.7 16.1
Nursing & midwifery personnelb
0.4 2.4 3.9 5.7 7.4 23.7 107.5
Laboratory staff 0.1 0.4 0.9 1.2 1.2 3.5 9.6
Pharmaceutical staff <0.1 <0.1 0.3 0.2 0.2 1.6 3.3
Counselling/social work 4.5 0.3 0.6 1.1 0.8 4.4 6.5
Other clinical 0.2 <0.1 0.1 0.2 0.1 1.1 2.2
Health information/ records techniciansc
0.3 0.1 0.3 0.4 0.4 2.1 6.5
Other health workers 1.6 1.8 3.1 4.2 4.0 23.9 70.1
Total 7.2 5.4 10.1 14.1 15.4 67.4 225.4
a. Service site that primarily offers voluntary counselling and testing for HIV.
b. Cadre includes all levels of nursing and midwifery personnel, including enrolled and registered nurses and midwives.
c. Cadre includes all staff with primary responsibility of implementing and managing administrative records-keeping processing, stor-
age and retrieval systems.
Source: Kenya 2004 SPA (22). Data weighted to reflect survey sampling procedures.
Figure 7.3 Ratio of health workers per inpatient bed, by facility size, Kenya 2004 SPA
Source: Kenya 2004 SPA (22).
0.7
0.4
0.30.3
0.5
0.7 0.70.8 0.8
0.5
1.5
0.9
0.0
0.5
1.0
1.5
1-9 10-19 20-29 50-59 100+ All facilities
Number of patient beds
All staff
Med
ian
num
ber
of h
ealth
w
orke
rs p
er b
ed
Medical, nursing & midwifery

Handbook on monitoring and evaluation of human resources for health
90
Information on workforce supply is especially useful
when placed in the context of staffing need. To sup-
plement information on existing levels of staffing, it is
important to have some idea of the extent of actual
or potential staff shortages. One way in which health
ministries attempt to address this issue is to develop
staffing norms. These norms are meant to take into
account the services offered and the numbers and
types of clients to be served. The difference between
the staff in post and the staffing norm is the vacancy
rate (Table 7.4, column 3), which provides information
on how well the managers are able to fulfil their planned
staffing patterns. Additional information from the Kenya
SPA presented in Table 7.4 shows a more complex pic-
ture that compares the number of staff recommended
under current norms to the number reported by facil-
ity managers as required to meet the service utilization
at their facility. It appears that facility managers in
Kenya have less than half of the staff members they
require in every cadre, except in the “all other staff” cat-
egory. Pharmaceutical, counselling and other clinical
staff are especially underrepresented. Further taking
into account the numbers of additional staff reported
as being required to meet work requirements among
those facilities without a staffing norm, the perceived
staffing shortage becomes even more apparent.
Among the total number of health workers that facil-
ity managers reported are needed, the percentage
that are currently assigned to the facility is presented
in Figure 7.4 for medical practitioners, nursing and mid-
wifery personnel, and all categories of health workers,
by facility type. Only in VCT sites and the larger facil-
ities (most of which are located in Nairobi and other
major urban areas) are at least three quarters of the
overall staffing requirements met. Virtually none of the
outpatient clinics and dispensaries has the minimum
number of medical practitioners. Smaller facilities tend
to have only half of the nursing and midwifery personnel
needed to meet staffing norms and work requirements.
This type of information gives us a quick assess-
ment of the staffing situation in the surveyed facilities.
However, interpreting the consequences associated
with unfilled positions requires additional knowledge of
how the assigned staffing relates to the actual human
resource needs at the facilities and for their catchment
populations.
In addition to regular staff members, health facili-
ties may have at their disposal seconded workers,
those who are not on the facility’s payroll but who are
assigned to work there and are paid by another entity.
Frequently, nongovernmental organizations or groups
Table 7.4 Number of health workers currently in post, number recommended by staffing norm, and number requested by facility managers to meet the norm, by cadre, Kenya 2004
Cadre (1) (2) (3) (4) (5)
Number of health workers
currently in post
Number of health workers
recommended in facility staffing
norm
Percentage of norm
currently in post
=(1)/(2)
Number requested by
facility managers to meet work requirementsa
Percentage of requested staff
currently in post
=(1)/(4)
Medical practitioners 567 1 114 51 1 852 31
Nursing & midwifery personnel
3 133 4 343 72 6 295 49
Laboratory staff 433 742 58 1 175 37
Pharmaceutical staff 112 315 36 563 20
Counselling/social work 382 970 39 1 861 21
Other clinical staff 66 385 17 779 8
Health information/records technicians
188 444 42 779 24
All other staff 2 103 2 183 96 2 740 77
Total 6985 10 495 16 044
a. Includes staff reported by facilities managers as being needed to meet their staffing norm, plus staff needed to meet work require-
ments as reported by managers of facilities without a staffing norm.
Source: Table produced by Macro International, based on Kenya 2004 SPA microdata.
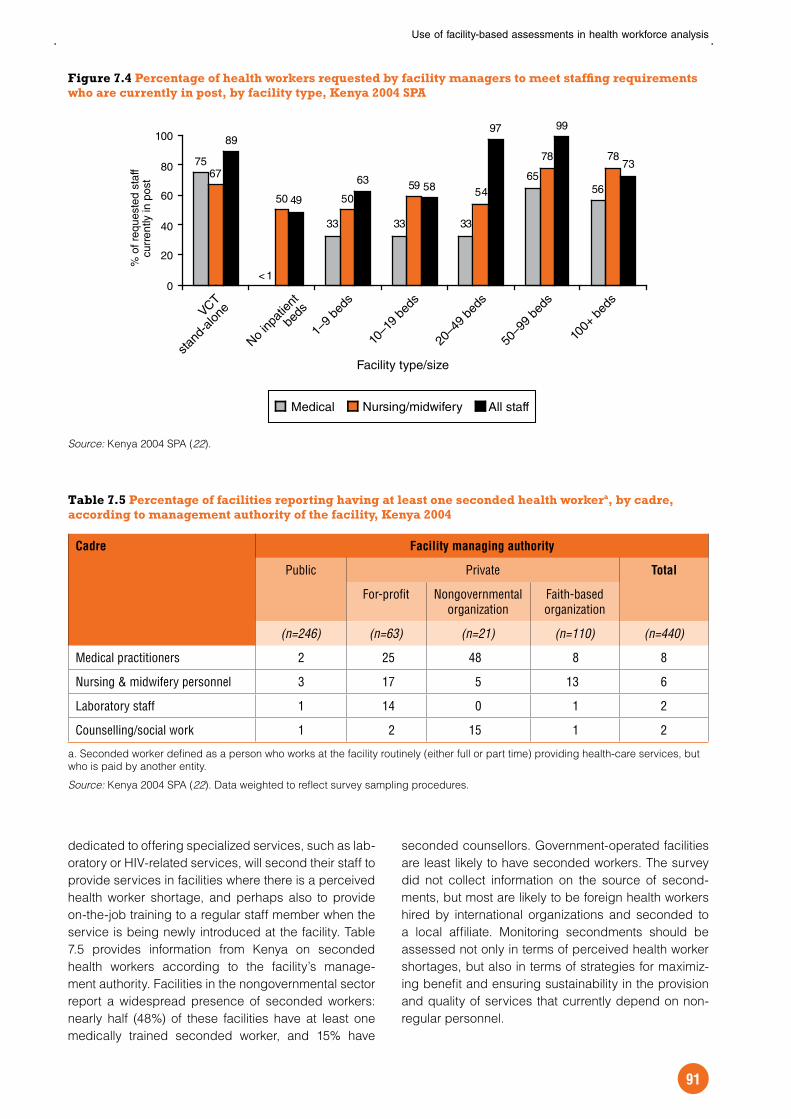
Use of facility-based assessments in health workforce analysis
91
dedicated to offering specialized services, such as lab-
oratory or HIV-related services, will second their staff to
provide services in facilities where there is a perceived
health worker shortage, and perhaps also to provide
on-the-job training to a regular staff member when the
service is being newly introduced at the facility. Table
7.5 provides information from Kenya on seconded
health workers according to the facility’s manage-
ment authority. Facilities in the nongovernmental sector
report a widespread presence of seconded workers:
nearly half (48%) of these facilities have at least one
medically trained seconded worker, and 15% have
seconded counsellors. Government-operated facilities
are least likely to have seconded workers. The survey
did not collect information on the source of second-
ments, but most are likely to be foreign health workers
hired by international organizations and seconded to
a local affiliate. Monitoring secondments should be
assessed not only in terms of perceived health worker
shortages, but also in terms of strategies for maximiz-
ing benefit and ensuring sustainability in the provision
and quality of services that currently depend on non-
regular personnel.
Figure 7.4 Percentage of health workers requested by facility managers to meet staffing requirements who are currently in post, by facility type, Kenya 2004 SPA
Source: Kenya 2004 SPA (22).
Table 7.5 Percentage of facilities reporting having at least one seconded health workera, by cadre, according to management authority of the facility, Kenya 2004
Cadre Facility managing authority
Public Private Total
For-profit Nongovernmental organization
Faith-based organization
(n=246) (n=63) (n=21) (n=110) (n=440)
Medical practitioners 2 25 48 8 8
Nursing & midwifery personnel 3 17 5 13 6
Laboratory staff 1 14 0 1 2
Counselling/social work 1 2 15 1 2
a. Seconded worker defined as a person who works at the facility routinely (either full or part time) providing health-care services, but
who is paid by another entity.
Source: Kenya 2004 SPA (22). Data weighted to reflect survey sampling procedures.
75
33 33 33
6556
67
50 5059
54
78 78
89
49
6358
97 99
73
<10
20
40
60
80
100%
of r
eque
sted
sta
ff cu
rren
tly in
pos
t
Medical All staffNursing/midwifery
VCT
stand
-alon
e
No inp
atien
t
beds
1–9
beds
Facility type/size
10–1
9 be
ds
20–4
9 be
ds
50–9
9 be
ds
100+
bed
s
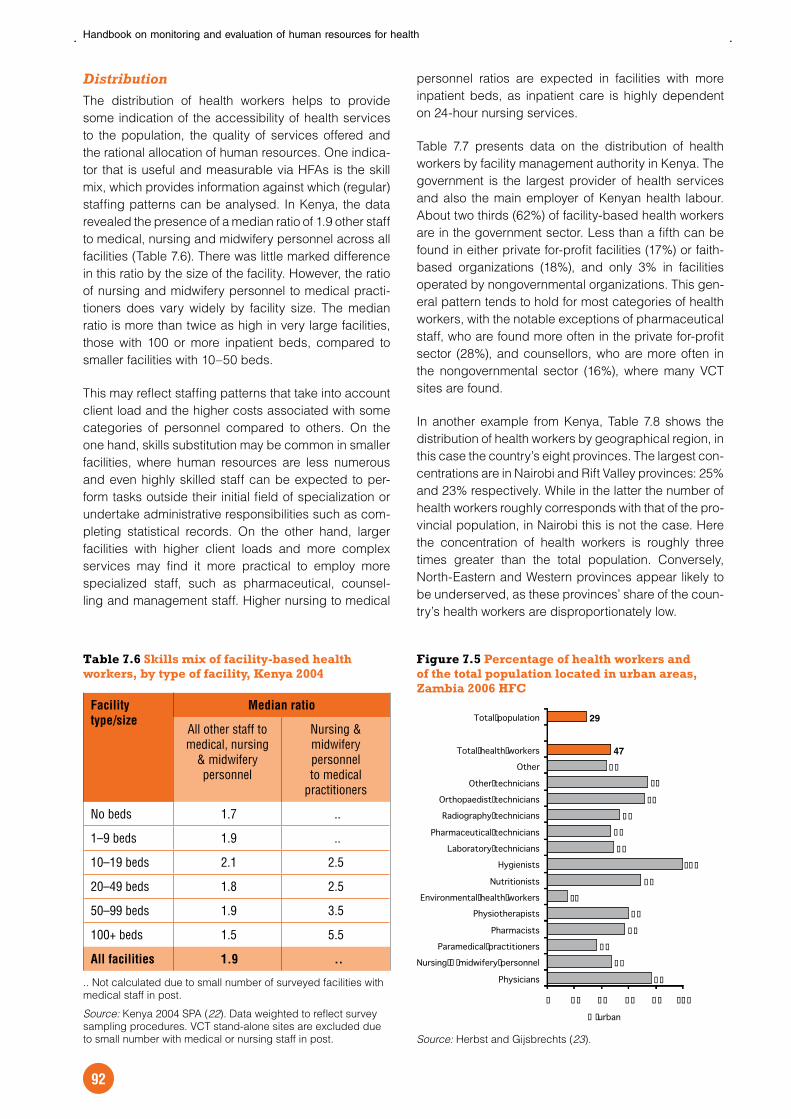
Handbook on monitoring and evaluation of human resources for health
92
Distribution
The distribution of health workers helps to provide
some indication of the accessibility of health services
to the population, the quality of services offered and
the rational allocation of human resources. One indica-
tor that is useful and measurable via HFAs is the skill
mix, which provides information against which (regular)
staffing patterns can be analysed. In Kenya, the data
revealed the presence of a median ratio of 1.9 other staff
to medical, nursing and midwifery personnel across all
facilities (Table 7.6). There was little marked difference
in this ratio by the size of the facility. However, the ratio
of nursing and midwifery personnel to medical practi-
tioners does vary widely by facility size. The median
ratio is more than twice as high in very large facilities,
those with 100 or more inpatient beds, compared to
smaller facilities with 10–50 beds.
This may reflect staffing patterns that take into account
client load and the higher costs associated with some
categories of personnel compared to others. On the
one hand, skills substitution may be common in smaller
facilities, where human resources are less numerous
and even highly skilled staff can be expected to per-
form tasks outside their initial field of specialization or
undertake administrative responsibilities such as com-
pleting statistical records. On the other hand, larger
facilities with higher client loads and more complex
services may find it more practical to employ more
specialized staff, such as pharmaceutical, counsel-
ling and management staff. Higher nursing to medical
personnel ratios are expected in facilities with more
inpatient beds, as inpatient care is highly dependent
on 24-hour nursing services.
Table 7.7 presents data on the distribution of health
workers by facility management authority in Kenya. The
government is the largest provider of health services
and also the main employer of Kenyan health labour.
About two thirds (62%) of facility-based health workers
are in the government sector. Less than a fifth can be
found in either private for-profit facilities (17%) or faith-
based organizations (18%), and only 3% in facilities
operated by nongovernmental organizations. This gen-
eral pattern tends to hold for most categories of health
workers, with the notable exceptions of pharmaceutical
staff, who are found more often in the private for-profit
sector (28%), and counsellors, who are more often in
the nongovernmental sector (16%), where many VCT
sites are found.
In another example from Kenya, Table 7.8 shows the
distribution of health workers by geographical region, in
this case the country’s eight provinces. The largest con-
centrations are in Nairobi and Rift Valley provinces: 25%
and 23% respectively. While in the latter the number of
health workers roughly corresponds with that of the pro-
vincial population, in Nairobi this is not the case. Here
the concentration of health workers is roughly three
times greater than the total population. Conversely,
North-Eastern and Western provinces appear likely to
be underserved, as these provinces’ share of the coun-
try’s health workers are disproportionately low.
Table 7.6 Skills mix of facility-based health workers, by type of facility, Kenya 2004
Facility
type/size
Median ratio
All other staff to medical, nursing
& midwifery personnel
Nursing & midwifery personnel to medical
practitioners
No beds 1.7 ..
1–9 beds 1.9 ..
10–19 beds 2.1 2.5
20–49 beds 1.8 2.5
50–99 beds 1.9 3.5
100+ beds 1.5 5.5
All facilities 1.9 ..
.. Not calculated due to small number of surveyed facilities with
medical staff in post.
Source: Kenya 2004 SPA (22). Data weighted to reflect survey
sampling procedures. VCT stand-alone sites are excluded due
to small number with medical or nursing staff in post.
Figure 7.5 Percentage of health workers and of the total population located in urban areas, Zambia 2006 HFC
Source: Herbst and Gijsbrechts (23).
��
��
��
��
��
��
�
���
�
��
��
��
��
��
29
47
� � �� �� �� ���
� ��������
������������������������ ���!
����������!�����"�"� ����
� �������"�
� ��� " ������"�
#�$�� ����"�!� ��!" �� �%���
��"��"� ���"�
&�������"�
'�( ��" ���"�� �������
� �������"���!�"�� �������
)��� ���� ��"�� �������
*�" ������"�"�� �������
*" ���"�� �������
*" ��
+ "�!� ��!" �� �%���
+ "�!�� ��!�"� �
,���(��

Use of facility-based assessments in health workforce analysis
93
Geographical imbalance of the health workforce can
also be seen in another context, notably that of Zambia.
Figure 7.5 compares the proportion of health workers
and of the total population located in Zambia’s urban
areas. Although urban dwellers account for less than
a third (29%) of the population, roughly half (47%) of
all health workers are found in urban facilities. Three
quarters of physicians and half of nursing and mid-
wifery personnel are urbanites. Among the different
cadres of health workers examined, only environmental
Table 7.7 Percentage distribution of health workers in post at health facilities by managing authority, according to cadre, Kenya 2004
Cadre Facility managing authority
Public Private Total
For-profit NGOa FBOa
(n=246) (n=63) (n=21) (n=110) (n=440)
Medical practitioners 60 22 4 14 100
Nursing & midwifery personnel 70 11 2 17 100
Laboratory personnel 53 17 4 26 100
Pharmaceutical personnel 56 28 4 12 100
Counselling/social work 52 17 16 15 100
Other clinical staff 70 10 7 13 100
Health information/records technicians
74 13 2 11 100
Other 56 22 2 20 100
Total 62 17 3 18 100
a. NGO = nongovernmental organization, FBO = faith-based organization.
Source: Kenya 2004 SPA (22). Data weighted to reflect survey sampling procedures.
Table 7.8 Percentage distribution of facility-based health workers and of the total population by geographical region, Kenya 2004
Cadre Province Total
Nairobi Central Coast Eastern North-Eastern
Nyanza Rift Valley
Western
Medical practitioners 22 10 10 15 1 10 26 6 100
Nursing & midwifery personnel
22 14 8 17 1 10 22 6 100
Laboratory personnel 20 11 11 14 1 11 25 7 100
Pharmaceutical personnel 51 7 8 9 1 7 13 4 100
Counselling/social work 13 7 16 13 1 11 29 10 100
Other clinical staff 21 13 4 11 2 11 31 7 100
Health information/ records technicians
18 16 8 10 1 12 28 7 100
Other 33 2 13 16 0 10 21 5 100
Total health workers 25 10 11 14 1 10 23 6 100
Total populationa 8.1 12.2 8.7 15.6 4.1 14.8 24.9 11.6 100.0
a. Based on the estimated 2004 national population (32 808 268).
Source: Kenya 2004 SPA (22). Data weighted to reflect survey sampling procedures.
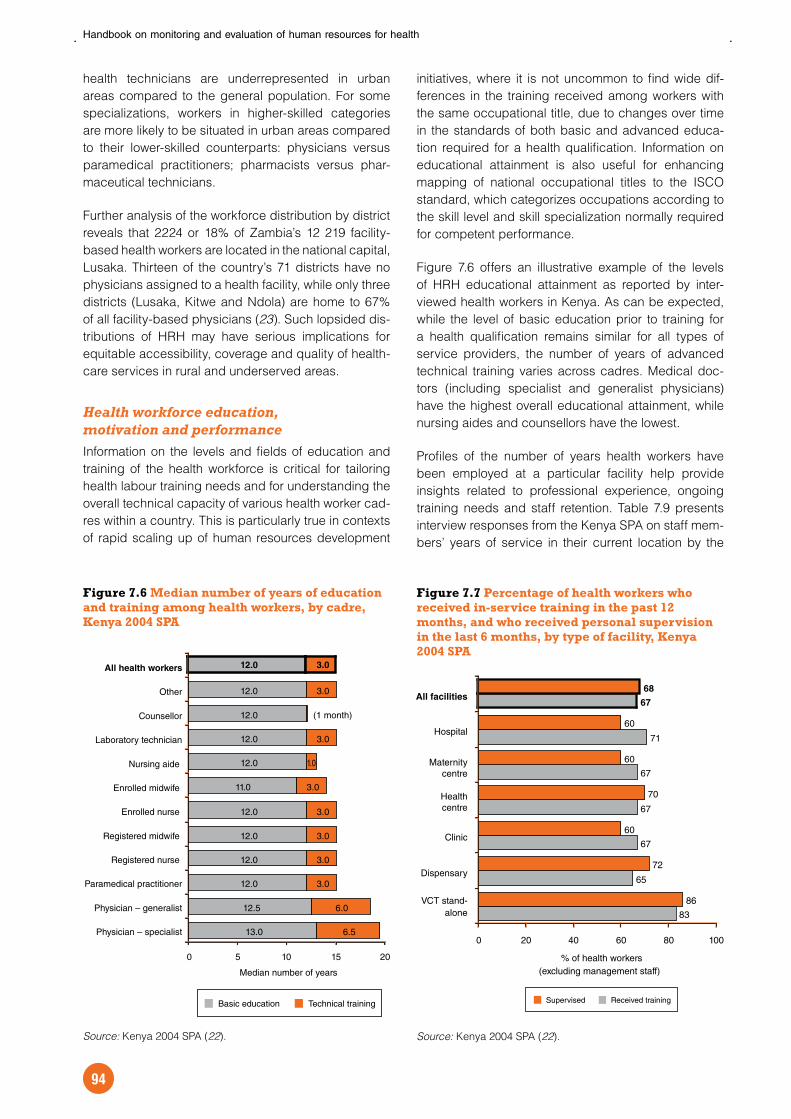
Handbook on monitoring and evaluation of human resources for health
94
health technicians are underrepresented in urban
areas compared to the general population. For some
specializations, workers in higher-skilled categories
are more likely to be situated in urban areas compared
to their lower-skilled counterparts: physicians versus
paramedical practitioners; pharmacists versus phar-
maceutical technicians.
Further analysis of the workforce distribution by district
reveals that 2224 or 18% of Zambia’s 12 219 facility-
based health workers are located in the national capital,
Lusaka. Thirteen of the country’s 71 districts have no
physicians assigned to a health facility, while only three
districts (Lusaka, Kitwe and Ndola) are home to 67%
of all facility-based physicians (23). Such lopsided dis-
tributions of HRH may have serious implications for
equitable accessibility, coverage and quality of health-
care services in rural and underserved areas.
Health workforce education, motivation and performance
Information on the levels and fields of education and
training of the health workforce is critical for tailoring
health labour training needs and for understanding the
overall technical capacity of various health worker cad-
res within a country. This is particularly true in contexts
of rapid scaling up of human resources development
initiatives, where it is not uncommon to find wide dif-
ferences in the training received among workers with
the same occupational title, due to changes over time
in the standards of both basic and advanced educa-
tion required for a health qualification. Information on
educational attainment is also useful for enhancing
mapping of national occupational titles to the ISCO
standard, which categorizes occupations according to
the skill level and skill specialization normally required
for competent performance.
Figure 7.6 offers an illustrative example of the levels
of HRH educational attainment as reported by inter-
viewed health workers in Kenya. As can be expected,
while the level of basic education prior to training for
a health qualification remains similar for all types of
service providers, the number of years of advanced
technical training varies across cadres. Medical doc-
tors (including specialist and generalist physicians)
have the highest overall educational attainment, while
nursing aides and counsellors have the lowest.
Profiles of the number of years health workers have
been employed at a particular facility help provide
insights related to professional experience, ongoing
training needs and staff retention. Table 7.9 presents
interview responses from the Kenya SPA on staff mem-
bers’ years of service in their current location by the
Figure 7.6 Median number of years of education and training among health workers, by cadre, Kenya 2004 SPA
Source: Kenya 2004 SPA (22).
Figure 7.7 Percentage of health workers who received in-service training in the past 12 months, and who received personal supervision in the last 6 months, by type of facility, Kenya 2004 SPA
Source: Kenya 2004 SPA (22).
13.0
12.5
12.0
12.0
12.0
12.0
11.0
12.0
12.0
12.0
12.0
6.5
6.0
3.0
3.0
3.0
3.0
3.0
3.0
3.0
12.0
1.0
(1 month)
3.0
0 5 10 15 20
Physician – specialist
Physician – generalist
Paramedical practitioner
Registered nurse
Registered midwife
Enrolled nurse
Enrolled midwife
Nursing aide
Laboratory technician
Counsellor
Other
All health workers
Median number of years
Basic education Technical training
83
65
67
67
67
71
86
72
60
70
60
60
67
68
0 20 40 60 80 100
VCT stand-alone
Dispensary
Clinic
Healthcentre
Maternitycentre
Hospital
All facilities
% of health workers(excluding management staff)
Received trainingSupervised

Use of facility-based assessments in health workforce analysis
95
type and management authority of the facility. Overall,
half of the facility-based staff reported having been at
their current employment for a short period of time,
about three years, with little variation in terms of the
facility’s managing authority. Nursing and midwifery
personnel at hospitals and especially maternity centres
tended to have been in their current position for longer.
Conversely, the median number of years of service was
lowest among physicians at maternity centres (most of
which are privately managed in Kenya) and staff at VCT
stand-alone facilities, which are a relatively new cate-
gory of service and facility type.
Training and supportive supervision may not only
improve the quality of health worker performance but
may also act as incentives that motivate health work-
ers in their jobs. Figure 7.7 presents data from Kenya
on the proportion of facility-based health workers who
received formal in-service training during the 12-month
period before the survey, that is, structured training
sessions not including individual instruction received
during routine supervision. Overall, excluding manage-
ment staff, two thirds (67%) of health workers reported
having received in-service training with little variation
in this proportion across the various types of facilities.
The main deviation is noted with regard to VCT sites,
where the proportion is by far the greatest (83%).
Additional findings from Kenya on support supervision
received among health-care providers are presented
in Figure 7.7. Excluding management staff, about two
thirds (68%) of health workers reported having been
personally supervised during the six-month period
preceding the survey. Service providers at VCT sites
were most likely to have received supervision (86%).
The concentration of health workers who had recently
received training or supervision in these centres prob-
ably reflects the high attention that HIV-related services
are receiving worldwide. The survey did not collect
information on the competencies acquired or used fol-
lowing the trainings or on the quality of supervision;
many HFAs do gather at least some information on
points discussed or activities conducted during the
supervisory visit.
Among the four HFA survey and census tools consid-
ered here, none presently collects information on staff
incomes or wages, and as such these sources do not
allow analysis of financial incentives among health
workers. In the absence of data on wages and salaries,
other incentives that might influence worker motivation
and performance and favour retention were exam-
ined. The HRH literature suggests that the availability
of a clear scope of work and other non-monetary ben-
efits contribute to improved worker performance and
reduced attrition (24, 25). An example of this type of
information from the Kenyan context is provided in Table
7.10. Only 8% of health workers were able to produce
a written scope of work at the time of interview, with lit-
tle difference in this percentage by cadre. Somewhat
wider variations exist by facility type, but even where
the proportions were highest (at maternity centres and
clinics) only about one of every ten workers was able
to produce a written scope of work. These numbers
Table 7.9 Median number of years of service in current position among facility-based health workers, by type and management authority of facility, Kenya 2004
Medical practitioners Nursing & midwifery
personnel
All health workers
Facility type
VCT stand-alone .. 4.1 1.0
Dispensary 3.0 3.0 2.0
Clinic 4.6 4.3 3.0
Health centre 2.0 2.5 3.0
Maternity centre 1.1 7.2 2.0
Hospital 3.0 5.0 5.0
Managing authority
Public 3.0 4.0 3.0
Private 2.0 3.0 3.0
All facilities 3.0 4.0 3.0
.. Not calculated due to small number of surveyed facilities with medical staff in post.
Source: Kenya 2004 SPA (22). Data weighted to reflect survey sampling procedures.
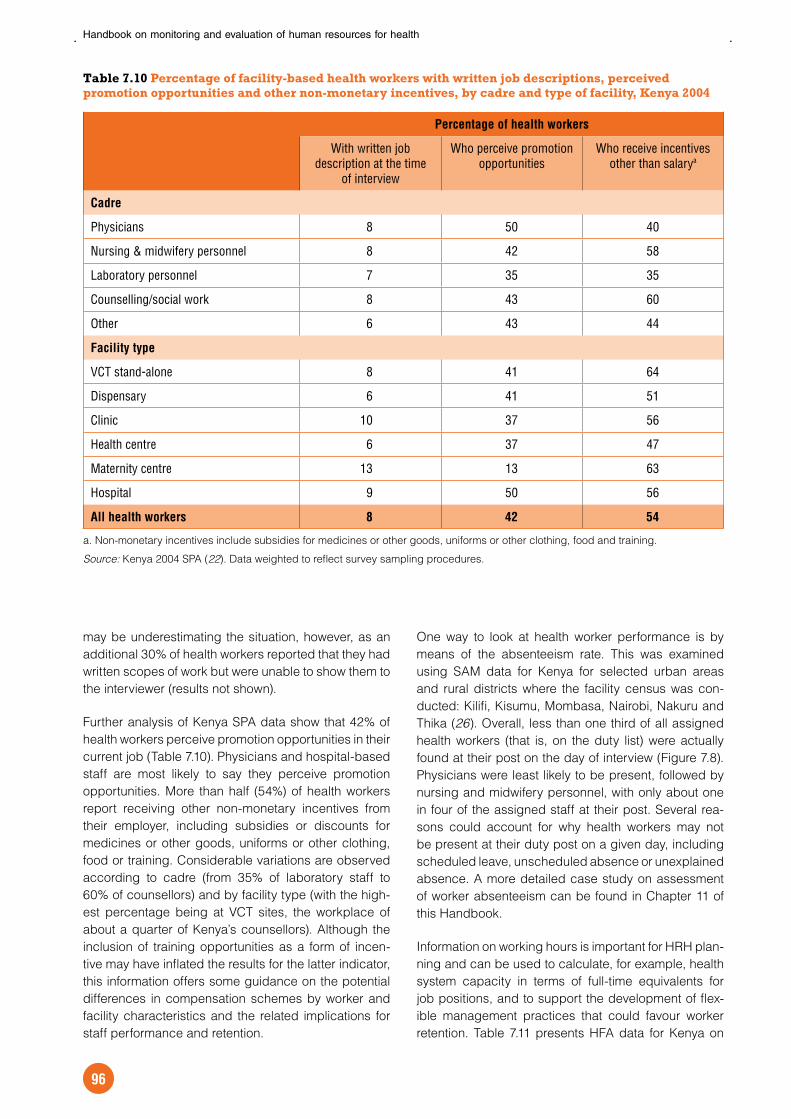
Handbook on monitoring and evaluation of human resources for health
96
may be underestimating the situation, however, as an
additional 30% of health workers reported that they had
written scopes of work but were unable to show them to
the interviewer (results not shown).
Further analysis of Kenya SPA data show that 42% of
health workers perceive promotion opportunities in their
current job (Table 7.10). Physicians and hospital-based
staff are most likely to say they perceive promotion
opportunities. More than half (54%) of health workers
report receiving other non-monetary incentives from
their employer, including subsidies or discounts for
medicines or other goods, uniforms or other clothing,
food or training. Considerable variations are observed
according to cadre (from 35% of laboratory staff to
60% of counsellors) and by facility type (with the high-
est percentage being at VCT sites, the workplace of
about a quarter of Kenya’s counsellors). Although the
inclusion of training opportunities as a form of incen-
tive may have inflated the results for the latter indicator,
this information offers some guidance on the potential
differences in compensation schemes by worker and
facility characteristics and the related implications for
staff performance and retention.
One way to look at health worker performance is by
means of the absenteeism rate. This was examined
using SAM data for Kenya for selected urban areas
and rural districts where the facility census was con-
ducted: Kilifi, Kisumu, Mombasa, Nairobi, Nakuru and
Thika (26). Overall, less than one third of all assigned
health workers (that is, on the duty list) were actually
found at their post on the day of interview (Figure 7.8).
Physicians were least likely to be present, followed by
nursing and midwifery personnel, with only about one
in four of the assigned staff at their post. Several rea-
sons could account for why health workers may not
be present at their duty post on a given day, including
scheduled leave, unscheduled absence or unexplained
absence. A more detailed case study on assessment
of worker absenteeism can be found in Chapter 11 of
this Handbook.
Information on working hours is important for HRH plan-
ning and can be used to calculate, for example, health
system capacity in terms of full-time equivalents for
job positions, and to support the development of flex-
ible management practices that could favour worker
retention. Table 7.11 presents HFA data for Kenya on
Table 7.10 Percentage of facility-based health workers with written job descriptions, perceived promotion opportunities and other non-monetary incentives, by cadre and type of facility, Kenya 2004
Percentage of health workers
With written job description at the time
of interview
Who perceive promotion opportunities
Who receive incentives other than salarya
Cadre
Physicians 8 50 40
Nursing & midwifery personnel 8 42 58
Laboratory personnel 7 35 35
Counselling/social work 8 43 60
Other 6 43 44
Facility type
VCT stand-alone 8 41 64
Dispensary 6 41 51
Clinic 10 37 56
Health centre 6 37 47
Maternity centre 13 13 63
Hospital 9 50 56
All health workers 8 42 54
a. Non-monetary incentives include subsidies for medicines or other goods, uniforms or other clothing, food and training.
Source: Kenya 2004 SPA (22). Data weighted to reflect survey sampling procedures.

Use of facility-based assessments in health workforce analysis
97
the number of hours normally worked per week in the
facilities where health workers were interviewed. Most
(91%) of the facility-based staff are full-time employees,
usually working at least 40 hours per week. Laboratory
and nursing and midwifery personnel are least likely to
work part time, while counselling staff are most likely to
be part time. Almost two in every ten physicians work
in the facility part time. Areas for further exploration in
future HFA tools could include the nature of work activ-
ities outside the facility among part-timers (for example
whether in another facility, in research or teaching,
outside the health sector or not working more hours
due to voluntary or involuntary reasons).
7.5.3 Exits from the workforceSome HFAs have collected information to assess
workforce retention. Challenges with collecting infor-
mation on HRH transitions and exits may make such
data incomplete, however, particularly for measuring
international outflows. Figure 7.9 shows estimated attri-
tion rates for Nigeria’s public sector health workforce
by cadre and for urban and rural areas. According
to these results, overall attrition is highest for facility-
based physicians compared to other categories of
health workers. Attrition is higher for rural workers com-
pared to their urban counterparts, with the exception of
pharmaceutical personnel and community health work-
ers. The latter are recruited and trained specifically to
work in rural areas, so these staff may be less likely to
have many tempting alternative employment opportuni-
ties beyond their area of residence.
In the same context, resignation is by far the most com-
mon reason for workforce attrition, the reason cited
for nearly half (46%) of measured health worker exits
(Figure 7.10). Although the underlying causes of resig-
nation were not determined in the present assessment,
experience suggests that poor service conditions are
often at the root. Twenty-three per cent of worker exits
are attributable to involuntary termination of employ-
ment. Retirement and death account for about one in
seven exits each. While the available data do not offer
a complete picture of the dynamics of health worker
attrition, they can be used to highlight areas where pro-
gramme managers and policy decision-makers can
further invest in research and retention interventions.
Lastly, as a crude estimate of the health workforce
regeneration ratio, the ratio of health workforce increase
Table 7.11 Percentage distribution of facility-based health workers by number of hours normally worked per week, according to cadre, Kenya 2004
Cadre Normal hours worked per week in facility Total
40+ 30–39 20–29 <20
Physicians 83 7 2 8 100
Nursing & midwifery personnel 93 5 0 2 100
Laboratory personnel 98 1 1 0 100
Counselling/social work 57 11 29 3 100
Nursing aides 78 9 0 13 100
Other 74 6 9 11 100
All health workers 87 6 3 4 100
Source: Kenya 2004 SPA (22). Data weighted to reflect survey sampling procedures.
Figure 7.8 Percentage of assigned health workers present on the day of the assessment, by cadre, Kenya 2005 SAM (selected districts)
Source: Kenya 2005 SAM (26).
23%
28%
52%
47%
49%
45%
29%
0% 20% 40% 60% 80%
Physicians
Nursing & midwiferypersonnel
Laboratorytechnicians
Pharmacists
Health information/records technicians
Other facility staff
All health workers
% present on the day of visit

Handbook on monitoring and evaluation of human resources for health
98
due to new graduates from health professions educa-
tion institutions joining the facility-based workforce can
be compared to the attrition rate at these facilities. The
results in Table 7.12 suggest that for every physician
departing Nigeria’s public sector health workforce,
three new ones enter. The estimated ratios of incoming
to outgoing staff are well above 2:1 among laboratory
staff and community-based workers. However, fewer
new graduates of nursing and midwifery training
schools seem to be entering Nigeria’s public workforce
compared to the number of nurses and midwives who
are leaving it.
7.6 Summary and conclusionsThere is worldwide consensus that the HRH situation
is in a state of crisis and that low- and middle-income
countries are most at risk. It is also widely accepted that
overcoming the crisis requires effective monitoring of
the three stages of the workforce lifespan (entry, active
workforce and exit), which in turn requires access to
measurement methodologies and analytical tools that
can be used to collect and analyse workforce data in a
timely and credible manner.
This chapter has documented use of HFAs as one such
methodology and has presented examples of the types
of HRH information it can provide. Potential statistics
that can be produced from HFA sources include health
workforce stock and supply, education, skills mix, geo-
graphical distribution, productivity and other contextual
practices supportive of efficient job performance (for
example adequate resources and infrastructure,
in-service training, management and supervision prac-
tices, and incentives) and estimates of staff entry and
retention. When analysed in conjunction with national
staffing norms (when they are in place), HFA data can
be used to ascertain the degree to which perceived
staffing needs are being met, and to support effective
planning for HRH education and training, recruitment,
management and eventual retirement.
A number of limitations of currently available data from
HFA sources were also discussed. Among these is a
dearth of information on migration of health workers,
especially international outflows. By nature, HFAs do
not directly collect data on the pre-service stage, or on
workers outside facility-based service delivery points.
As discussed elsewhere in this Handbook, the need
to improve methods for monitoring the pre-service and
Figure 7.9 Attrition rates for health workers in public sector facilities, by cadre, Nigeria 2005
Source: Chankova et al. (14).
Figure 7.10 Percentage distribution of outgoing health workers by reason for leaving the workforce, Nigeria 2005
Source: Chankova et al. (14).
1.41.0
2.32.0
4.7
2.3
3.4
2.0
1.1
2.3
1.4 1.3
2.2
1.4
<0.10
1
2
3
4
5
Physicians Nursing &midwifery personnel
Laboratorypersonnel
Pharmaceuticalpersonnel
Community healthworkers
Attr
ition
rat
e
Urban Rural Total
Resigned: 46%
Retired: 16%
Terminated: 23%
Death: 15%
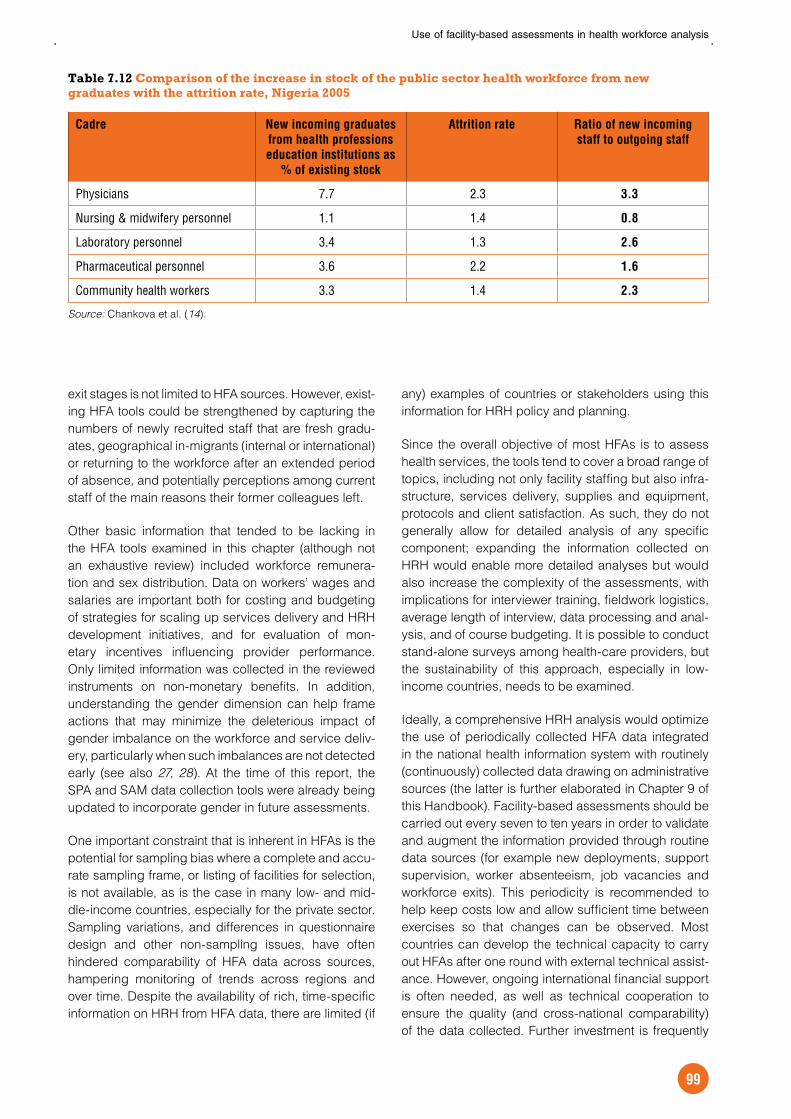
Use of facility-based assessments in health workforce analysis
99
exit stages is not limited to HFA sources. However, exist-
ing HFA tools could be strengthened by capturing the
numbers of newly recruited staff that are fresh gradu-
ates, geographical in-migrants (internal or international)
or returning to the workforce after an extended period
of absence, and potentially perceptions among current
staff of the main reasons their former colleagues left.
Other basic information that tended to be lacking in
the HFA tools examined in this chapter (although not
an exhaustive review) included workforce remunera-
tion and sex distribution. Data on workers’ wages and
salaries are important both for costing and budgeting
of strategies for scaling up services delivery and HRH
development initiatives, and for evaluation of mon-
etary incentives influencing provider performance.
Only limited information was collected in the reviewed
instruments on non-monetary benefits. In addition,
understanding the gender dimension can help frame
actions that may minimize the deleterious impact of
gender imbalance on the workforce and service deliv-
ery, particularly when such imbalances are not detected
early (see also 27, 28). At the time of this report, the
SPA and SAM data collection tools were already being
updated to incorporate gender in future assessments.
One important constraint that is inherent in HFAs is the
potential for sampling bias where a complete and accu-
rate sampling frame, or listing of facilities for selection,
is not available, as is the case in many low- and mid-
dle-income countries, especially for the private sector.
Sampling variations, and differences in questionnaire
design and other non-sampling issues, have often
hindered comparability of HFA data across sources,
hampering monitoring of trends across regions and
over time. Despite the availability of rich, time-specific
information on HRH from HFA data, there are limited (if
any) examples of countries or stakeholders using this
information for HRH policy and planning.
Since the overall objective of most HFAs is to assess
health services, the tools tend to cover a broad range of
topics, including not only facility staffing but also infra-
structure, services delivery, supplies and equipment,
protocols and client satisfaction. As such, they do not
generally allow for detailed analysis of any specific
component; expanding the information collected on
HRH would enable more detailed analyses but would
also increase the complexity of the assessments, with
implications for interviewer training, fieldwork logistics,
average length of interview, data processing and anal-
ysis, and of course budgeting. It is possible to conduct
stand-alone surveys among health-care providers, but
the sustainability of this approach, especially in low-
income countries, needs to be examined.
Ideally, a comprehensive HRH analysis would optimize
the use of periodically collected HFA data integrated
in the national health information system with routinely
(continuously) collected data drawing on administrative
sources (the latter is further elaborated in Chapter 9 of
this Handbook). Facility-based assessments should be
carried out every seven to ten years in order to validate
and augment the information provided through routine
data sources (for example new deployments, support
supervision, worker absenteeism, job vacancies and
workforce exits). This periodicity is recommended to
help keep costs low and allow sufficient time between
exercises so that changes can be observed. Most
countries can develop the technical capacity to carry
out HFAs after one round with external technical assist-
ance. However, ongoing international financial support
is often needed, as well as technical cooperation to
ensure the quality (and cross-national comparability)
of the data collected. Further investment is frequently
Table 7.12 Comparison of the increase in stock of the public sector health workforce from new graduates with the attrition rate, Nigeria 2005
Cadre New incoming graduates
from health professions
education institutions as
% of existing stock
Attrition rate Ratio of new incoming
staff to outgoing staff
Physicians 7.7 2.3 3.3
Nursing & midwifery personnel 1.1 1.4 0.8
Laboratory personnel 3.4 1.3 2.6
Pharmaceutical personnel 3.6 2.2 1.6
Community health workers 3.3 1.4 2.3
Source: Chankova et al. (14).

Handbook on monitoring and evaluation of human resources for health
100
needed in data analysis and dissemination strate-
gies that put the information retrieved within the reach
of policy-makers (29). Institutionalizing HFA capacity,
whether within the ministry of health or another auton-
omous or semi-autonomous agency (such as private
survey and research firms), should be prioritized if HRH
information from HFAs is to become a fully integrated
component of the health information system and widely
used to bridge information gaps for HRH planning,
monitoring and development.
References1. The world health report 2006: working together for
health. Geneva, World Health Organization, 2006
(http://www.who.int/whr/2006, accessed 10 January
2009).
2. Kinfu Y. Assembling global health workforce
statistics: challenges and implications. Presented
at the World Health Organization/Health Metrics
Network Technical Working Group Meeting on
Health Workforce Statistics, Geneva, 11–13 July
2006.
3. Annell A, Willis M. International comparison of health
care systems using resource profiles. Bulletin of the
World Health Organization, 2000, 78(6):770–778
(http://www.who.int/bulletin/archives/78(6)770.pdf,
accessed 20 January 2009).
4. International Health Facility Assessment Network.
Health facility assessment: relevant resources/
supporting documents and mapping resources
– annotated bibliography. MEASURE Evaluation
Working Paper No. WP-08–107. Chapel Hill, NC,
MEASURE Evaluation, 2008 (http://www.cpc.unc.
edu/measure/publications/pdf/wp-08–107.pdf,
accessed 20 January 2009).
5. International Health Facility Assessment Network.
Flow chart of steps to conduct a health facility
assessment. Chapel Hill, NC, MEASURE Evaluation,
2008 (http://www.cpc.unc.edu/measure/publications/
pdf/ms-08–28.pdf, accessed 20 January 2009).
6. MEASURE Evaluation. Sampling manual for facility
surveys for population, maternal health, child
health and STD programs in developing countries.
MEASURE Evaluation Manual Series No. 3. Chapel
Hill, NC, Carolina Population Centre, 2001.
7. International Health Facility Assessment Network.
Profiles of health facility assessment methods.
Arlington, VA, MEASURE Evaluation, USAID and
World Health Organization, 2008 (http://www.cpc.
unc.edu/measure/publications/pdf/tr-06–36.pdf,
accessed 20 January 2009).
8. Japan International Cooperation Agency. Health
Facility Census. Kurume, Japan, St Mary’s Hospital,
2004.
9. Suzuki Y, Hozumi D. Health Facility Census:
background, meaning, and its methodology. Journal
of International Health, 2005, 20(S):110.
10. Suzuki Y et al. Capital investment planning using
the geographic information systems. Journal of
International Health, 2006, 21(S):89.
11. Service Availability Mapping (SAM). World Health
Organization (http://www.who.int/healthinfo/systems/
serviceavailabilitymapping/en/, accessed 20
January 2009).
12. Workload indicators of staffing need (WISN): a
manual for implementation. Geneva, World Health
Organization, 1998 (http://www.who.int/hrh/tools/
workload_indicators.pdf, accessed 20 January 2009).
13. Service Provision Assessment (SPA) surveys.
Macro International (http://www.measuredhs.com/
aboutsurveys/spa/start.cfm, accessed 12 February
2009).
14. Chankova S et al. A situation assessment of human
resources in the public health sector in Nigeria.
Bethesda, MD, Partners for Health Reformplus
Project, Abt Associates Inc., 2006 (http://www.
healthsystems2020.org/content/resource/
detail/1704/, accessed 20 January 2009).
15. MEASURE Evaluation. Facility Audit of Service
Quality. Chapel Hill, NC, Carolina Population Centre,
2000.
16. Assessment of Human Resources for Health: survey
instruments and guide to administration. Geneva,
World Health Organization, 2002 (http://www.who.
int/hrh/tools/hrh_assessment_guide.pdf, accessed
12 February 2009).
17. Dehn J, Reinikka R, Svensson J. Survey tools for
assessing performance in service delivery. In:
Bourguignon F, da Silva LP, eds. Evaluating the
poverty and distributional impact of economic
policies. Washington, DC, Oxford University Press
and World Bank, 2003.
18. Ferrinho P et al. Dual practice in the health sector:
review of the evidence. Human Resources for
Health, 2004, 2(14) (http://www.human-resources-
health.com/content/2/1/14, accessed 20 January
2009).
19. International Standard Classification of Occupations.
International Labour Organization (http://www.ilo.org/
public/english/bureau/stat/isco/index.htm, accessed
11 January 2009).
20. International Standard Classification of Education:
ISCED 1997. Paris, United Nations Educational,
Scientific and Cultural Organization, 1997 (http://
www.uis.unesco.org/TEMPLATE/pdf/isced/
ISCED_A.pdf, accessed 10 January 2009).
21. International Standard Industrial Classification of All
Economic Activities, fourth revision. Statistical Papers
Series M, No. 4/Rev.4. New York, United Nations
Statistics Division, 2008 (http://unstats.un.org/unsd/
demographic/sources/census/2010_PHC/docs/
ISIC_rev4.pdf, accessed 11 January 2009).
22. National Coordination Agency for Population and
Development (NCAPD), Ministry of Health, Central
Bureau of Statistics, ORC Macro. Kenya Service
Provision Assessment Survey 2004. Nairobi, Kenya,
NCAPD, 2005 (http://www.measuredhs.com/pubs/
pdf/SR139/SR139.pdf, accessed 20 January 2009).

Use of facility-based assessments in health workforce analysis
101
23. Herbst CH, Gijsbrechts D. Information on stock,
profiles, and distribution of health workers in Zambia:
analysis of the Health Facility Census data. World
Bank Human Resources for Health Program Paper.
Washington, DC, World Bank, 2007.
24. Hornby P, Forte P. Human resource indicators and
health service performance. Staffordshire, United
Kingdom, Keele University Centre for Health
Planning and Management, 2003 (http://www.who.
int/hrh/en/HRDJ_1_2_03.pdf, accessed 21 January
2009).
25. Diallo K et al. Monitoring and evaluation of human
resources for health: an international perspective.
Human Resources for Health, 2003, 1:3 (http://
www.human-resources-health.com/content/1/1/3,
accessed 10 January 2009).
26. World Health Organization and Kenya Ministry
of Health. Service Availability Mapping: Kenya
report. Geneva, World Health Organization and
Kenya Ministry of Health, 2005 (http://www.who.int/
healthinfo/systems/samreportkenya.pdf, accessed
21 January 2009).
27. Hojat M, Gonnella J, Zu G. Gender comparisons
of young physicians perceptions of their medical
education, professional life, and practice: a follow
up study of Jefferson Medical College graduates.
Academic Medicine, 1995, 70(4):305–312.
28. Reamy J, Pong R. Physician workforce composition
by gender: the implications for managing physician
supply. Paper presented at the 4th FICOSSER
General Conference, Cuernavaca, Mexico, 28–30
July, 1998.
29. AbouZahr C, Adjei S, Kanchanachitra C. From data
to policy: good practices and cautionary tales.
Lancet, 2007, 369:1039–1046.

Handbook on monitoring and evaluation of human resources for health
102
103
Use of population census data for gender analysis of the health workforce
RENÉ LAVALLÉE, PIYA HANVORAVONGCHAI, NEERU GUPTA
8.1 IntroductionDespite the undoubted importance of monitoring the
health workforce and impacts on health systems per-
formance, the empirical evidence to support policy
formulation is often fragmented. Many sources that can
potentially produce information relevant to this issue
remain underused in health research, especially among
low- and middle-income countries. Although a range of
standard statistical sources can be exploited for con-
ducting human resources for health (HRH) assessments
– including national population censuses – their poten-
tial for HRH monitoring has generally not been met.
Population censuses can be a key source for statis-
tics describing HRH, providing precise information on
the stock and composition of the health workforce and
on distribution by spatial units and sociodemographic
characteristics (1, 2). One of the main strengths of
census data for HRH analysis is the possibility of disag-
gregating individual-level information by sex. Censuses
offer an advantage over survey sources in that they do
not suffer from problems of sample sizes too small to
allow estimates for specific subgroups. Moreover, as
noted in Chapter 7 of this Handbook, health facility
assessments have tended to be gender blind when it
comes to monitoring the staffing situation.
The objective of this chapter is to present selected
findings from multicountry analyses exploring gender
dimensions of the health workforce using census data.
Including this introduction, the chapter is divided into
five parts. In the next section, an argument is presented
for the importance of gender mainstreaming in health
workforce analysis. Next, the sources of census data
used here are presented. Fourth is the empirical anal-
ysis, with attention paid to each of the three stages of
the working lifespan framework for HRH assessment.
The chapter concludes with some recommendations
for promoting the use of sex-disaggregated data, nota-
bly from census sources, as a step towards monitoring
and evaluation of gender-sensitive human resources
policy planning and management.
8.2 Importance of gender considerations in health workforce analysisWomen make up about 40% of the estimated global
working population (3). Within the health sector, in
many countries women comprise over 75% of the work-
force (4), making them indispensable as contributors to
the delivery of health services. However, gender issues
remain a neglected area in most approaches to HRH
policy and planning (5).
In many countries, women tend to be concentrated
in the lower-status health occupations, and to be a
minority among more highly trained professionals. In
particular, the distribution of women by occupational
category tends to be skewed in favour of nursing and
midwifery personnel and other “caring” cadres such as
community health workers (6). Women are often poorly
represented in other categories, for example physi-
cians, dentists, pharmacists and managers.
The underrepresentation of women in managerial and
decision-making positions may lead to less attention to
and poorer understanding of both the particular fea-
tures of working conditions that characterize much of
women’s employment, and the health-care needs spe-
cific to women. In many contexts, access to female
providers is an important determinant of women’s
health service utilization patterns (7, 8).
Omission of gender considerations may also lead to
inadequate health system responsiveness to the needs
of men: for example, reproductive health services are
often not set up so as to encourage male involvement
(7). Better recognition of and information on the role of
men as caregivers may help to “de-gender” gender
norms in health service provision (9).
Gender analysis of the health workforce may reveal that
health systems themselves can reflect or even exac-
erbate many of the social inequalities they are meant
to address and be immune from (6). Understanding
8
Handbook on monitoring and evaluation of human resources for health
104
and addressing the gender aspect of the health work-
force require better measures of women and men in
the health workforce to help identify and prioritize HRH
planning and management interventions.
8.3 Using census data for health workforce analysisStrengthening the evidence base on gender and the
health workforce in low- and middle-income coun-
tries is especially critical. Most of the (scant) available
research on gender and HRH refers to countries with
developed market economies, especially the United
States of America (6). In particular, while census micro-
data archives exist for most countries, access to and
use of these data for health systems research has gen-
erally been limited. For some countries, analyses of
census data can be facilitated through collaborative
research projects aiming to disseminate microdata for
public use. In only a very limited number of low- and
middle-income countries have national census-based
HRH analyses been conducted and disseminated.
A gender-based analysis of the health workforce was
conducted in 13 countries across different regions and
contexts (Table 8.1). As discussed in Chapter 2 of this
Handbook, censuses with questions designed to col-
lect data on the nature of work activity can provide
valuable information for HRH analysis (Box 8.1). The
application of international standards for data collec-
tion and processing facilitates production of statistics
that are comparable across countries and over time on
many aspects of labour dynamics (10). Cross-national
comparisons of HRH indicators can provide valuable
opportunities for gaining insights into workforce issues
that are of major concern to many countries, and learn-
ing how countries have dealt successfully or otherwise
with these issues (11).
The data used for the analysis were drawn from three
sources:
For 11 of the countries – Argentina, Brazil, Cambodia,
Chile, Ecuador, Hungary, the Philippines, Romania,
Rwanda, South Africa and Viet Nam – micro-
data samples were obtained from the Integrated
Public Use Microdata Series (IPUMS), a collabo-
rative project dedicated to collecting, preserving,
harmonizing and disseminating census data and
documentation from around the world for social and
economic research (12). As of late 2007, IPUMS-
International had created a unique census microdata
collection consisting of 80 censuses from 26 coun-
tries (13). For the present analysis, data from the
last census round (covering the period from 1995 to
2004) were used for countries with developing and
transitional economies where a variable for occupa-
tion was included that allowed identification of health
occupations.
For one country, Thailand, access to census micro-
data was obtained from the National Statistical
Office with support from the International Health
Policy Program, Thailand (14), a national research
programme on health priorities related to health sys-
tems and policy.
For another country, Uganda, data were drawn from
a special census volume on health workers pro-
duced in collaboration with the Developing Human
Resources for Heath Project (15). The publication
included tabulations and maps of the stock and
distribution of health occupations, as well as infor-
mation on the variables used in the compilations.
In the present analysis, in order to enhance cross-
national comparability, health workers were defined
according to the self-reported main occupation among
the economically active population as recorded in
the census, with titles mapped where possible to the
International Standard Classification of Occupations,
1988 revision (ISCO-88) (16). This includes the follow-
ing broad groupings:
health professionals (except nursing and midwifery):
physicians, dentists, pharmacists and other profes-
sional-level health occupations;
nursing and midwifery personnel: nursing profes-
sionals, midwifery professionals, nursing associate
professionals, midwifery associate professionals;
other health service providers: health technicians
and associate professionals (for example medical
assistants, dental assistants, laboratory technicians,
therapeutic equipment technicians), traditional
and complementary medicine practitioners, per-
sonal care workers (including institution-based and
home-based nursing aides) and others not identi-
fied elsewhere;
health management workers: administrators
and supervisors in health services and similar
occupations.
Other efforts were also undertaken to enhance compa-
rability given the particularities of individual censuses;
in particular, the analysis excludes workers abroad,
who were counted in the Philippines but not in the other
countries.
The number and density of workers with a self-reported
health occupation at the time of the census, as per the
boundaries retained here, can be found by country in
Table 8.1. As could be expected, across countries, the
density of health workers tends to increase with the
national income level. The highest densities are found
in the upper-middle-income countries of Hungary and

Use of population census data for gender analysis of the health workforce
105
Table 8.1 Countries and sources of census data
Country Income
categorya
Regionb Census implementing agency Year Workers with a
health occupation
Number Per 10 000 population
Argentina Upper middle
Americas National Institute of Statistics and Censuses
2001 418 530 115.4
Brazil Upper middle
Americas Institute of Geography and Statistics
2000 1 463 001 86.1
Cambodia Low Western Pacific National Institute of Statistics 1998 26 940 23.6
Chile Upper middle
Americas National Institute of Statistics 2002 133 580 88.2
Ecuador Lower middle
Americas National Institute of Statistics and Censuses
2001 79 290 65.3
Hungary Upper middle
Europe Central Statistical Office 2001 169 960 166.5
Philippines Lower middle
Western Pacific National Statistics Office 2000 360 217 48.0
Romania Upper middle
Europe National Institute of Statistics 2002 295 880 138.4
Rwanda Low Africa National Institute of Statistics 2002 10 230 12.1
South Africa Upper middle
Africa Statistics South Africa 2001 256 393 60.0
Thailand Lower middle
South-East Asia National Statistical Office 2000 294 905 48.4
Uganda Low Africa Bureau of Statistics 2002 57 508 23.5
Viet Nam Low Western Pacific General Statistics Office 1999 253 500 33.2
a. Income category as classified by the World Bank according to gross national income per capita.
b. Regions as classified by the World Health Organization.
Box 8.1 Questions used in the population census to determine main occupation, selected countries
Brazil (2000): How many jobs did you have during the week of July 23–29, 2000? (response options: “one”,
“two or more”); What was the principal job done during [this] week? (open question).
Chile (2002): In which of the following situations did you find yourself during the last week? (choice of
10 response options); What occupation or type of work do you perform, or did you perform in the past if
unemployed? (open question).
Hungary (2001): What is your source of livelihood? (choice of up to 3 of 13 response options); What is the
name of the main occupation and what activities characterize it? (open question).
Philippines (2000): What was [respondent]’s usual activity/occupation during the past 12 months? (open
question).
Rwanda (2002): During the month from July 15 to August 15, 2002, was [respondent] employed? (choice of
8 response options); What is (was) the main occupation of [respondent]? (open question).
Uganda (2002): What kind of work did [respondent] do in the last 7 days? (open question).
Viet Nam (1999): What was the main job that [respondent] performed during the last 12 months and what
position did [respondent] hold (if any)? (open question).

Handbook on monitoring and evaluation of human resources for health
106
Romania, and the lowest densities in the four low-
income countries included in the analysis (Cambodia,
Rwanda, Uganda and Viet Nam).
8.4 Empirical analysisIn this section selected findings are presented on gen-
der dimensions of the health workforce drawing on
census data for 13 countries. The section is divided
into three parts, according to the three stages of the
working lifespan that form the framework for HRH anal-
ysis introduced in Chapter 1. A gender analysis of the
active workforce is first presented, followed by exami-
nation of each of the stages that directly influence its
size and distribution, namely entry and exit.
8.4.1 Gender and the active health workforceCensuses with properly designed questions on labour
force activity allow identification of workers with a
health-related occupation. They also offer the advan-
tage of allowing disaggregation of all key variables by
sex. This offers the possibility of examining for occupa-
tional segregation by sex: a framework for assessing
gender equity that can correspond to either vertical
clustering (differentials in the sex ratio according to
relative job status) or horizontal clustering (sex differen-
tials according to specialization) (17).
In most of the 13 countries, women form the major-
ity of the health workforce – a pattern contrasting with
that observed for the rest of the national labour force,
where men tend to be more numerous (Table 8.2).
Exceptions to this trend are Cambodia, where women
comprise a minority (40%) of the health workforce but a
small majority (51%) of the rest of the labour force, and
Rwanda, where the percentage of female workers is
similar for both health occupations and all other occu-
pations combined (some 55%).
Further examination of the evidence points to horizon-
tal and vertical clustering within the health workforce. In
all countries where data are available, women form the
majority of nursing and midwifery personnel – in some
cases over 90% – but this is not necessarily the case
for other occupational categories (Table 8.2). Among
health professionals (except nursing), women are con-
sistently underrepresented relative to their share in the
total health workforce. Women are likewise underrepre-
sented among health management compared to their
overall share in the health labour market, as observed in
the two countries where the national occupational clas-
sification allows their identification, namely Argentina
and Brazil.
Gender imbalances can also be found for certain
specific occupations. As illustrated in Figure 8.1, the
physician workforce is mostly male in those countries
where data are available. On the other hand, the per-
sonal care workforce – one that is generally less skilled
– tends to be numerically dominated by women (Figure
Figure 8.1 Sex distribution of the physician workforce, according to census data for selected countries (around 2000)
Figure 8.2 Sex distribution of the personal care workforce, according to census data for selected countries (around 2000)
36.2
65.2
37.324.9
63.8
34.8
62.775.1
0%
25%
50%
75%
100%
Brazil Romania Thailand Uganda
Per
cent
age
of p
hysi
cian
s
MaleFemale
Male
Female
67.349.1
86.6 80.391.9
79.067.6
59.9
89.4
32.750.9
13.4 19.78.1
21.032.4
40.1
10.6
0%
25%
50%
75%
100%
Argentina Cambodia Ecuador Philippines Romania SouthAfrica
Thailand Uganda Viet Nam
Per
cent
age
of p
erso
nal c
are
wor
kers

Use of population census data for gender analysis of the health workforce
107
8.2). A notable exception is Romania, the country with
the highest proportion of women in the health work-
force, and where female physicians are more common.
It has been speculated that, given the longer history
of high female labour force participation in transitional
countries of eastern Europe, along with social policies
Table 8.2 Percentage distribution of the health workforce by sex, by occupation, according to census data for 13 countries (around 2000)
Health workforce
Country Sex Health
professionals
(except
nursing &
midwifery)
Nursing &
midwifery
personnel
Other health
service
providers
Health
management
occupations
Total Rest of
labour
force
ArgentinaMale n.a. n.a. 32.9 35.5 33.0 63.6
Female n.a. n.a. 67.1 64.5 67.0 36.4
BrazilMale 55.1 18.7 25.9 44.2 32.7 62.8
Female 44.9 81.3 74.1 55.8 67.3 37.2
CambodiaMale 74.6 45.4 60.1 n.a. 59.8 48.6
Female 25.4 54.6 39.9 n.a. 40.2 51.4
ChileMale 43.6 n.a. 32.7 n.a. 38.8 66.0
Female 56.4 n.a. 67.3 n.a. 61.2 34.0
EcuadorMale 57.7 8.5 18.2 n.a. 33.9 67.6
Female 42.3 91.5 81.8 n.a. 66.1 32.4
HungaryMale 43.3 n.a. 9.8 n.a. 21.3 55.8
Female 56.7 n.a. 90.2 n.a. 78.7 44.2
PhilippinesMale 39.4 14.6 31.7 n.a. 27.6 50.2
Female 60.6 85.4 68.3 n.a. 72.4 49.8
RomaniaMale 31.9 5.6 13.4 n.a. 17.2 57.5
Female 68.1 94.4 86.6 n.a. 82.8 42.5
RwandaMale 61.9 35.4 50.5 n.a. 43.7 45.0
Female 38.1 64.6 49.5 n.a. 56.3 55.0
South AfricaMale 62.8 8.2 27.4 n.a. 22.1 59.3
Female 37.2 91.8 72.6 n.a. 77.9 40.7
ThailandMale 48.4 6.7 30.8 n.a. 25.1 52.0
Female 51.6 93.3 69.2 n.a. 74.9 48.0
UgandaMale 68.8 13.0 54.9 n.a. 41.7 n.a.
Female 31.2 87.0 45.1 n.a. 58.3 n.a.
Viet NamMale 55.2 22.2 31.4 n.a. 34.3 51.7
Female 44.8 77.8 68.6 n.a. 65.7 48.3
Note: Health professionals include physicians, pharmacists, dentists and other professional-level health occupations as reported at
the time of the census. Other health service providers include – depending on the country – health technicians and associate profes-
sionals, traditional medicine practitioners, personal care workers and others not identified elsewhere. Health management occupations
include administrators and supervisors in health services and similar occupations. In Argentina, all health service occupations (health
professionals, nursing and midwifery personnel) are grouped under “other health service providers”. In Chile and Hungary, nursing
and midwifery personnel are assimilated under either health professionals or other health service providers. In Uganda, health manag-
ers and planners are included under health professionals.
n.a. Not available (based on available data source or occupational classification).

Handbook on monitoring and evaluation of human resources for health
108
emphasizing equality and supporting working women
and their families, vertical gender imbalances may be
less pronounced than in other regions (18).
In addition to providing opportunities for monitoring
health occupations, censuses with data on place of
work allow identification of those with other (non-health)
occupations working in the health services industry, or
health systems support staff. As seen in the illustrative
example from Uganda (Figure 8.3), gender imbal-
ances can also be seen among support staff. Women
are underrepresented compared to men in non-health
technical specializations (for example accounts and
finance, engineering, information technology); moreo-
ver, within these fields they are less numerous at the
professional level compared to their counterparts at the
associate professional level. Conversely, women are
overrepresented as clerks.
8.4.2 Gender and entry into the health workforceIt is possible that occupational clustering by sex is a
reflection of differential access among women and
men to education and training leading to a skilled pro-
fession. One of the strengths of using censuses for
monitoring the gender dimension of entry to the health
workforce is the availability of nationally representative
data on the pool of eligible candidates for advanced
health education and training. Monitoring the pool of
eligible candidates is an important HRH policy ques-
tion, but one that is often overlooked in health workforce
research and planning (see Chapter 4). Monitoring
gender differences in access to education is also of par-
ticular importance: the ratio of girls to boys in primary,
secondary and tertiary education is one of the core indi-
cators of the Millennium Development Goals (19).
An illustrative analysis of gender imbalance in educa-
tional attainment drawing on census data is presented
in Table 8.3. In almost all countries, women health
workers outnumber their male counterparts in the
lower education categories, i.e. at primary level and
secondary level. Moreover, at these levels the imbal-
ance tends to be more pronounced within the health
workforce compared to the general adult population.
It is especially pronounced in the two countries of the
eastern European region. The exception is Cambodia,
where there are fewer less-educated female health
workers than males; this may be related to the fact that
Cambodia is one of the countries with the lowest over-
all level of education (98% of the adult population with
at most primary schooling).
While a high female-to-male ratio among HRH can be
seen across all education levels in most countries – a
trend reflective of the overall feminization of the health
workforce – the ratio is generally much lower at the ter-
tiary level of educational attainment than at the primary
level. When it comes to the highest education cate-
gory, the sex ratio among health workers tends to more
closely follow that of the general population.
To further the analysis, as seen in Figure 8.4, coun-
tries with greater gender inequities in access to higher
education tend to be those with greater gender imbal-
ances in the health professional workforce. Among the
11 countries with comparable census data, a close and
direct relationship is revealed between the sex ratio in
Figure 8.4 Relationship between sex ratio in tertiary-level educational attainment and health professional work activity, according to census data for selected countries (around 2000)
Figure 8.3 Sex distribution of health systems support staff, by occupation, Uganda, 2002 census
Source: Ssennono, Petit and Leadbeter (15).
MaleFemale
31.0
46.6
78.8
28.2
69.0
53.4
21.2
71.8
0%
25%
50%
75%
100%
Non-healthprofessionals
Non-healthtechnicians &
associateprofessionals
Clerks Other supportstaff
Per
cent
age
of h
ealth
sup
port
sta
ff
Cambodia
Rwanda
Viet Nam
South Africa
EcuadorBrazil
Thailand
Philippines
HungaryChile
Romania
y = 1.16x0.66
R2 = 0.54
0.0
0.5
1.0
1.5
2.0
0.0 0.5 1.0 1.5 2.0
Ratio of women to men with tertiary education(population 15 years and over)
Rat
io o
f wom
en to
men
am
ong
heal
th p
rofe
ssio
nals
(e
xcep
t nur
sing
& m
idw
ifery
)

Use of population census data for gender analysis of the health workforce
109
tertiary-level educational attainment among the general
population and the sex ratio among active health pro-
fessionals. Notably, the correlation coefficient, which
gauges the strength of a relationship between two var-
iables, is found to be relatively high by social science
standards (0.54 for the trend analysis including all 11
countries, or 0.67 when excluding the outlier data point
for Romania).
8.4.3 Gender and exit from the health workforceAlthough a census is cross-sec-
tional, i.e. time specific, it is possible
to use a series of censuses to evalu-
ate exits from the health workforce. In
Thailand, as in many other countries,
censuses are carried out once every
decade. A cohort analysis approach
was used across two successive
censuses to measure net workforce
attrition by sex, that is, using age-
specific data for following the same
cohort from one census to the next.
For example, the number of nurses
aged 35–39 in 1990 was compared
with the number aged 45–49 10 years
later to estimate net attrition (or net
effect of workforce gains and losses)
for this cohort. This entailed additional
challenges for ensuring data com-
parability. In particular, the system
of occupational coding was different
across the two census rounds: in the
1990 census occupations had been
coded according to the 1968 version
of ISCO, while for the 2000 census
they were mapped to the 1988 ver-
sion. The analyses of Thai census
data presented here were done using
ISCO-88 as the reference.
Table 8.4 shows the change over the
decade in workforce size for selected
cohorts for two cadres, namely physi-
cians and nurses. As almost all newly
educated health workers enter the
profession under the age of 35, and
assuming there is no appreciable
international in-migration, the number
of workers aged 35 and over can be
used to calculate the rate of workforce
attrition, or percentage reduction in
total health professionals over the pre-
vious 10 years.
Three key trends can be ascertained from the cen-
sus data: increasing levels of attrition with age; higher
attrition among male health professionals compared to
their female counterparts; and, in the older age groups,
higher attrition among nurses than physicians. The cul-
mination is the observation of the highest rate of attrition
among older male nurses. The reasons for leaving the
health workforce can include retirement, out-migra-
tion, career change, work-limiting illness, death or
other. Such findings underscore the importance for
Table 8.3 Ratio of women to men by level of educational attainment, health workforce and total population, according to census data for selected countries (around 2000)
Country Group Educational attainment
At most primary
Secondary Tertiary
ArgentinaHealth workers 4.5 3.0 1.2
Total population 1.0 1.4 0.9
BrazilHealth workers 2.2 3.4 1.3
Total population 1.0 1.3 1.1
CambodiaHealth workers 0.8 0.6 0.3
Total population 1.1 0.4 0.3
ChileHealth workers 1.1 2.4 1.1
Total population 1.0 1.1 0.8
EcuadorHealth workers 6.9 5.3 0.9
Total population 1.0 1.1 0.8
HungaryHealth workers 12.4 9.4 1.3
Total population 1.3 0.9 1.0
PhilippinesHealth workers 3.2 2.8 2.4
Total population 1.0 1.0 1.4
RomaniaHealth workers 9.0 5.8 2.1
Total population 1.3 0.8 0.9
RwandaHealth workers 1.3 1.7 0.3
Total population 1.1 0.8 0.3
South AfricaHealth workers 3.7 5.5 1.3
Total population 1.1 1.1 0.9
ThailandHealth workers 1.9 2.6 1.7
Total population 1.1 0.9 1.1
Viet NamHealth workers 2.5 2.4 0.8
Total population 1.1 0.8 0.5
Note: Data on educational attainment refer to the population aged 15 years
or over. Secondary attainment includes post-secondary education at the non-
university level. Health workers are defined as persons active in the labour force
and reporting a health occupation at the time of the census.

Handbook on monitoring and evaluation of human resources for health
110
HRH analysts, planners and policy-makers to consider
workers’ gender, equally with their occupation and age,
among the core variables in national workforce supply
and requirement planning and projection efforts.
8.5 Summary and conclusionsThis chapter has focused on uses of national popula-
tion census data for gender-specific HRH assessments
as a basis for formulation of evidence-based policy
options. Population censuses can be a useful source
of information for health workforce monitoring and eval-
uation. In particular, appropriate census data allow
calculation of a number of health workforce indicators
and their disaggregation by sex, a critical requirement
for assessing gender equity in the workforce.
For a census to be useful for health workforce analy-
sis, the most important requirement is that it contains
adequately defined and classified labour force varia-
bles that allow distinction of health occupations from
other occupations. As previously noted in Chapter 2,
ideally, occupational data gathered in a census should
be processed to the lowest level of disaggregation as
classified in ISCO (or its national equivalent). The case
studies presented here have shown how censuses can
provide relevant information for many aspects of work-
force planning and policy development, notably from a
gender perspective.
In order to be of greater value for research and pol-
icy, population censuses should be taken at regular
intervals, at least every 10 years (10). Despite the rec-
ognized importance of the census, many countries did
not participate in the previous 2000 round; in Africa, a
third of all countries (17 out of 53) did not participate,
resulting in nearly half of the continent’s population not
being enumerated. With intensified national, regional
and international efforts and support, as of mid-2008,
censuses have been undertaken or are being planned
in 51 African countries for the 2010 round (20).
One of the main constraints to census sources for HRH
analysis (in addition to relatively lengthy periodicity)
has been limited access to and use of microdata for
health research, especially in many low- and middle-
income countries. In order to optimize census uses,
collaborations should be planned in advance between
ministries of health, census bureaus and other stake-
holders for developing a strategy for data collection
and processing and for dissemination and use. The lat-
ter should ideally include some combination of each of
the dissemination tools used here: (i) public access to
microdata samples for scholarly research (anonymized
to protect confidentiality); (ii) limited access to full cen-
sus databanks (such as secured access for approved
researchers); and (iii) specialized health workforce pro-
files as part of the national series of census publications.
In practical terms, the cost of collecting, processing
and tabulating nationally representative data on HRH
will be marginal for census exercises already including
questions on labour force activity.
In general, the analysis supported the notion that the
situation of human resources in health systems is often
a reflection, or even exacerbation, of broader societal
gender norms and inequalities, particularly with regard
to access to the education and training required to
become a skilled health professional. Most HRH anal-
yses are approached using occupational lens, with
little explicit attention to gender dimensions within and
Table 8.4 Estimates of intercensal health workforce attrition by sex, Thailand, 1990 and 2000 censuses
Males Females
Age group Number % loss Number % loss
in 1990 in 2000 in 1990 in 2000 in 1990 in 2000
Physicians
35–39 45–49 1872 1543 18 661 583 12
40–44 50–54 1368 1114 19 527 466 12
45–49 55–59 732 543 26 332 272 18
Nurses
35–39 45–49 694 596 14 7619 6755 11
40–44 50–54 562 407 28 5352 4541 15
45–49 55–59 459 270 41 3042 2217 27
Use of population census data for gender analysis of the health workforce
111
across occupation groups. Gender mainstreaming in
health workforce monitoring and evaluation strategies
is needed to ensure that evidence-based gender-sen-
sitive approaches are undertaken to health workforce
planning and management, relevant to the needs
and interests of both women and men health workers.
Research, policy and programme efforts to address
gender equality in the health workforce should lead to
strengthened health systems more broadly. Access to
reliable, comprehensive information on gender and the
health workforce – such as through sex-disaggregated
data from a population census – can inform the steps
needed to achieve gender equity.
References1. Diallo K et al. Monitoring and evaluation of human
resources for health: an international perspective.
Human Resources for Health, 2003, 1:3 (http://
www.human-resources-health.com/content/1/1/3,
accessed 10 January 2009).
2. Gupta N et al. Uses of population census data for
monitoring geographical imbalance in the health
workforce: snapshots from three developing
countries. International Journal for Equity in
Health, 2003, 2:11 (http://www.equityhealthj.com/
content/2/1/11, accessed 11 January 2009).
3. Global employment trends for women. Geneva,
International Labour Office, 2008 (http://www.
ilo.org/wcmsp5/groups/public/ – -dgreports/ –
-dcomm/documents/publication/wcms_091225.pdf,
accessed 23 January 2009).
4. Gupta N et al. Assessing human resources for
health: what can be learned from labour force
surveys? Human Resources for Health, 2003,
1:5 (http://www.human-resources-health.com/
content/1/1/5, accessed 15 January 2009).
5. Standing H. Gender: a missing dimension in human
resource policy and planning for health reforms.
Human Resources Development Journal, 2000,
4:1 (http://www.who.int/hrh/en/HRDJ_4_1_04.pdf,
accessed 23 January 2009).
6. George A. Human resources for health: a gender
analysis. Background paper prepared for the WHO
Commission on Social Determinants of Health, 2007
(http://www.who.int/social_determinants/resources/
human_resources_for_health_wgkn_2007.pdf,
accessed 23 January 2009).
7. Sen G, Ostlin P, George A. Gender inequity in
health: why it exists and how we can change
it. Report to the WHO Commission on Social
Determinants of Health, 2007 (http://www.who.int/
social_determinants/resources/csdh_media/wgekn_
final_report_07.pdf, accessed 23 January 2009).
8. Shengelia B et al. Access, utilization, quality, and
effective coverage: an integrated conceptual
framework and measurement strategy. Social
Science and Medicine, 2005, 61(1):97–109.
9. Reichenbach L. The overlooked dimension: gender
and the global health workforce. In: Reichenbach
L, ed. Exploring the gender dimensions of the
global health workforce. Cambridge, MA, Harvard
University, 2007.
10. United Nations Statistics Division. Principles and
recommendations for population and housing
censuses, revision 2. Statistical Papers Series M, No.
67/Rev. 2. New York, United Nations, 2008 (http://
unstats.un.org/unsd/demographic/sources/census/
docs/P&R_Rev2.pdf, accessed 11 January 2009).
11. Dubois CA, McKee M. Cross-national comparisons
of human resources for health: what can we learn?
Health Economics, Policy and Law, 2006, 1:59–78.
12. McCaa R, Ruggles S. IPUMS International: a global
project to preserve machine-readable census
microdata and make them usable. In: Hall PK, McCaa
R, Thorvaldsen G, eds. Handbook of international
historical microdata for population research.
Minnesota, MN, Minnesota Population Center, 2000.
13. Minnesota Population Center. Integrated Public Use
Microdata Series (IPUMS)-International: version 3.0.
Minneapolis, MN, University of Minnesota, 2007
(http://www.ipums.umn.edu, accessed 23 January
2009).
14. About IHPP. International Health Policy Program-
Thailand (http://www.ihpp.thaigov.net/about.html,
accessed 23 January 2009).
15. Ssennono V, Petit P, Leadbeter D. Uganda 2002
population and housing census: special analysis
on health workers commissioned by the Developing
Human Resources for Heath Project. Kampala,
Uganda Bureau of Statistics and Developing Human
Resources for Heath Project, 2005.
16. International Standard Classification of Occupations:
ISCO-88. Geneva, International Labour Office, 1988
(http://www.ilo.org/public/english/bureau/stat/isco/
isco88/index.htm, accessed 23 January 2009).
17. Gornick JC. Gender equality in the labour market:
a comparison of the public and private sectors
in six countries. Luxembourg Employment Study
Working Paper Series No. 7. Syracuse, NY,
Syracuse University, 1996 (http://www.lisproject.
org/publications/leswps/leswp7.pdf, accessed 23
January 2009).
18. Anker R. Gender and jobs: sex segregation of
occupations in the world. Geneva, International
Labour Office, 1998.
19. Millennium Development Goals. United Nations
Development Programme (http://www.undp.org/
mdg, accessed 23 January 2009).
20. African Centre for Statistics. Status of
implementation of 2010 round of population and
housing censuses in Africa. African Statistical
Newsletter, 2008, 2(2):7–9 (http://www.uneca.org/
statistics/statnews/ACSNewsletterJune2008.pdf,
accessed 23 January 2009).

Handbook on monitoring and evaluation of human resources for health
112

113
Use of administrative data sources for health workforce analysis: multicountry experience in implementation of human resources information systems
PAMELA MCQUIDE, DYKKI SETTLE, WALID ABUBAKER, GHANIM MUSTAFA ALSHEIKH,
CÉLIA REGINA PIERANTONI, SHANNON TURLINGTON, DANNY DE VRIES
9.1 IntroductionThe most efficient and immediate way to track changes
to a health workforce is to use data from a routine
administrative information system. Censuses and sur-
veys, both population based and facility based, are key
tools to provide an accurate snapshot of a country’s
health workforce, but must be fully reconducted peri-
odically to look at a changing situation. As these tools
are prohibitively expensive to implement on a regular
basis, data from such sources should be considered
as a basis (albeit an essential one) for complement-
ing the national routine human resources information
system (HRIS), which provides a continuous record
of changes in the health workforce and serves as the
timeliest source of information available. These sys-
tems are typically used by administrative organizations
in the country, such as ministries of health, professional
councils and professional associations, to qualify, man-
age and plan the health workforce. It is in the interest of
these organizations to maintain updated and accurate
information in the HRIS.
An HRIS can be as simple as a filing cabinet of paper
personnel files or as complex as a multi-database sys-
tem with the capacity to analyse workforce problems
and assist in identifying possible solutions. The strength
of an HRIS does not depend on technology but on its
ability to be adapted to address current workforce
issues and generate accurate and timely information.
In most low- or middle-income countries HRIS data
are routinely collected in paper form. While such a sys-
tem can represent a functioning HRIS, there are often
serious limitations to the use of these data. Although
records representing a single role or individual can be
located and accessed (with varying degrees of ease),
often these records cannot be used efficiently because
of the intensive effort involved in updating or aggregat-
ing data, difficulties linking data on an individual level
across various records, and issues of data quality, such
as incomplete records, timeliness and inconsistencies.
As a result, decision-makers may not have access, in a
timely and accurate fashion, to critical pieces of infor-
mation necessary to developing an effective human
resources for health (HRH) strategy. For example:
How many physicians and nurses are being trained
and in what specialties?
How are health workers distributed across urban
and rural areas?
Why are health professionals leaving the health-care
services industry?
How many health professionals are currently not
employed?
Understanding the answers to these and other key pol-
icy questions will help decision-makers effectively:
ensure a steady supply of trained health professionals;
deploy human resources with the right skills to the
right positions and places to meet health-care needs;
retain health worker skills and experience in the
country.
A mature, comprehensive HRIS links all human
resources data from the time health profession-
als enter pre-service training to when they leave the
health workforce. Using such a system, decision-mak-
ers can quickly find the answers they need to assess
HRH problems, plan effective interventions and evalu-
ate those interventions. If well designed, managed and
maintained, HRIS data can provide a cost-effective yet
extremely useful source of information with which to
monitor and evaluate the impacts of changes in social
policy at the national and subnational levels.
Country experience indicates that, while often less
accurate than census or survey data, particularly in the
initial phases, routine health data systems improve in
accuracy over time (1). A well-functioning HRIS has an
9
Handbook on monitoring and evaluation of human resources for health
114
advantage over a survey because it allows for ongo-
ing monitoring of detailed information in large sample
sizes, including subnational geographical analyses.
In addition, it is longitudinal in nature with the capa-
bility to record health workforce dynamics. Continuous
and current information on the same individual can be
tracked over long periods of time at less cost per data
point. Due to advances in computer technology, linking
various administrative databases is easier, less expen-
sive and more reliable than ever before (2).
At the same time, many low-income countries need to
build capacity, both human and technical, in order to
improve the use of HRIS data, including planning, soft-
ware design, infrastructure support and management,
as well as strategies for data use and strengthening.
The implementation of a comprehensive country strat-
egy should include the following underlying principles:
a participatory approach that involves stakeholders
from various ministries and sectors from the outset
and increases the ownership of the system;
an iterative development methodology that incor-
porates existing systems, tools and processes as
much as possible to lower costs and speed up
implementation;
a mature software solution designed for the country
context and to answer key HRH policy questions for
that country;
an emphasis on building capacity, ensuring sus-
tainability and continuously improving the system
through training and technical support;
a continuous effort to train decision-makers to ana-
lyse and use the data that the HRIS provides to
make sound HRH decisions.
In this chapter, an overview is provided of the essential
elements and lessons learnt to date in the implementa-
tion of a comprehensive HRIS strengthening initiative.
A series of critical stages in the development and
strengthening of a complete HRIS is first discussed,
followed by presentation of a number of case studies
drawing on experiences in selected low- and middle-
income countries.
9.2 Recommended first steps to develop a human resources information systemThe first and most important thing to keep in mind when
developing an HRIS is that just as human resources are
a building block of a health system (3), so the HRIS is
a part of the comprehensive health information system.
And just as every aspect of the health system (including
facility- and community-based service delivery, availa-
bility of medical products, financing and governance)
contributes to the success of health workers and health
workers influence the functionality of the system, there
is also a critical interdependence of the HRIS and the
other components of the health information system. In a
mature and comprehensive health information system,
the HRIS will be the authoritative source of HRH data
for each of the other building blocks. This underscores
the critical nature of the HRIS to the integrity and suc-
cess of the whole health system.
Ideally, the HRIS development and strengthening pro-
cess comprises five key stages using a participatory
approach (Figure 9.1). First, a stakeholder leadership
group is established, or a national task force involving
all key stakeholders and led by the ministry of health,
and the key HRH policy questions are identified. Next,
HRIS technical staff conduct a needs assessment to
focus on the current infrastructure (for example exist-
ing networks, Internet connectivity, software) and data
already being collected by the different ministries,
councils and other organizations. After the questions
and infrastructure are agreed upon by the stakeholder
group, HRIS software solutions should be custom-
ized to answer the key health workforce policy and
management questions for a respective country. The
end result could either be a step solution or a mature
(multiple component) system able to support manag-
ers and decision-makers in their efforts to effectively
use and analyse data for informed and confident deci-
sion-making. At the stage of data use, attention is paid
to how data are actually used for decision-making.
Throughout the process, sustainability and continu-
ous improvement of the HRIS can be ensured through
training and building of capacity in the country team
to independently support, use and improve the system
into the future.
9.2.1 Building a stakeholder leadership groupA key to the success of implementing an HRIS is the
ability to respond to in-country needs. Developing a
leadership group of all the essential stakeholders that
produce and use HRH information assists in develop-
ing a country-focused HRIS. This group will initiate, lead
and monitor all subsequent activities in HRIS strength-
ening. The stakeholder leadership group empowers
stakeholders to develop an HRIS that meets their
needs, ensures ownership of the system and builds the
necessary capacity to support, use and improve the
HRIS. Another benefit of including the key stakehold-
ers is that it opens communication channels between
groups of individuals that typically do not meet together,
thereby facilitating collaboration and sharing of data
across groups.
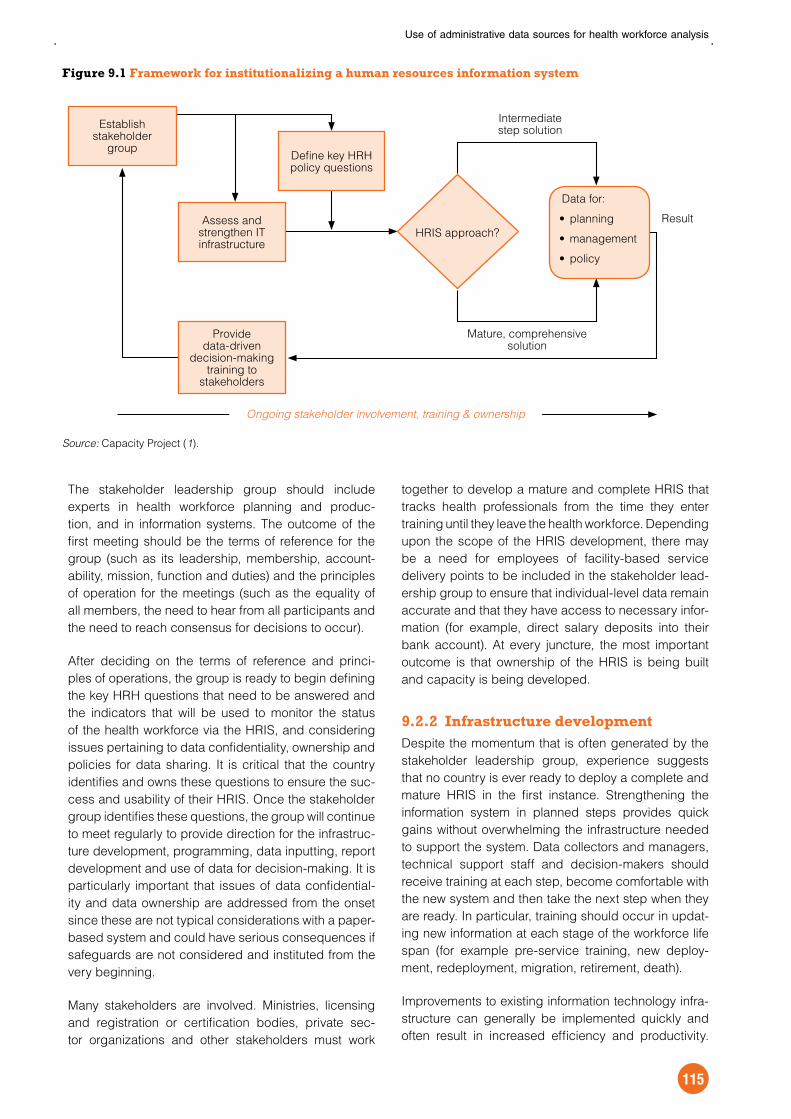
Use of administrative data sources for health workforce analysis
115
The stakeholder leadership group should include
experts in health workforce planning and produc-
tion, and in information systems. The outcome of the
first meeting should be the terms of reference for the
group (such as its leadership, membership, account-
ability, mission, function and duties) and the principles
of operation for the meetings (such as the equality of
all members, the need to hear from all participants and
the need to reach consensus for decisions to occur).
After deciding on the terms of reference and princi-
ples of operations, the group is ready to begin defining
the key HRH questions that need to be answered and
the indicators that will be used to monitor the status
of the health workforce via the HRIS, and considering
issues pertaining to data confidentiality, ownership and
policies for data sharing. It is critical that the country
identifies and owns these questions to ensure the suc-
cess and usability of their HRIS. Once the stakeholder
group identifies these questions, the group will continue
to meet regularly to provide direction for the infrastruc-
ture development, programming, data inputting, report
development and use of data for decision-making. It is
particularly important that issues of data confidential-
ity and data ownership are addressed from the onset
since these are not typical considerations with a paper-
based system and could have serious consequences if
safeguards are not considered and instituted from the
very beginning.
Many stakeholders are involved. Ministries, licensing
and registration or certification bodies, private sec-
tor organizations and other stakeholders must work
together to develop a mature and complete HRIS that
tracks health professionals from the time they enter
training until they leave the health workforce. Depending
upon the scope of the HRIS development, there may
be a need for employees of facility-based service
delivery points to be included in the stakeholder lead-
ership group to ensure that individual-level data remain
accurate and that they have access to necessary infor-
mation (for example, direct salary deposits into their
bank account). At every juncture, the most important
outcome is that ownership of the HRIS is being built
and capacity is being developed.
9.2.2 Infrastructure developmentDespite the momentum that is often generated by the
stakeholder leadership group, experience suggests
that no country is ever ready to deploy a complete and
mature HRIS in the first instance. Strengthening the
information system in planned steps provides quick
gains without overwhelming the infrastructure needed
to support the system. Data collectors and managers,
technical support staff and decision-makers should
receive training at each step, become comfortable with
the new system and then take the next step when they
are ready. In particular, training should occur in updat-
ing new information at each stage of the workforce life
span (for example pre-service training, new deploy-
ment, redeployment, migration, retirement, death).
Improvements to existing information technology infra-
structure can generally be implemented quickly and
often result in increased efficiency and productivity.
Figure 9.1 Framework for institutionalizing a human resources information system
Source: Capacity Project (1).
Assess and strengthen IT infrastructure
Establish stakeholder
group
Provide data-driven
decision-making training to
stakeholders
Define key HRH policy questions
Data for:
HRIS approach?
Mature, comprehensive solution
Ongoing stakeholder involvement, training & ownership
Intermediate step solution
Result
Handbook on monitoring and evaluation of human resources for health
116
Proposed infrastructure improvements should be
based on a technical assessment and consider low-
cost solutions that can rapidly but significantly enhance
existing systems and processes. Recommended
improvements might include procuring computers for
workers who need to enter or access data in the sys-
tem, improving software applications and tools that are
currently being used, increasing data storage capacity,
upgrading network connections for transmitting data or
expanding technical support services.
9.2.3 HRIS development stepsDepending on the current form, existing HRH informa-
tion systems may be strengthened in iterative steps. A
step solution is any interim solution for managing HRH
data that is deployed while a mature system is being
developed. Step solutions can be deployed to ena-
ble the ministry or another organization to quickly start
entering and managing its HRH data. The data can
then easily be migrated to the mature solution when it
is available and the end user is ready to implement it.
Where there is only a paper-based system, an electronic
register can be implemented. Where an electronic reg-
ister is already in place, a simple database can be built.
Where there is a simple database, that database can
be progressively strengthened or expanded. For exam-
ple, a situation may arise where the routine database
system is so out of date and unreliable that policy-mak-
ers cannot manage the results. One particularly useful
step solution is to develop a short survey form to collect
minimal accurate information on health workers at the
facility level and enter these data into a register. These
data can be used to update databases and make the
system operational again. Another important step solu-
tion could be the specification of a gender-sensitive
HRIS.
The goal of such an iterative strengthening methodol-
ogy is to ensure that every country or organizational
programme can quickly benefit from an HRIS strength-
ening process regardless of resources. Proceeding
in iterative steps also lessens the impact of too much
change too quickly, while ensuring that each step
progresses towards the goal of a mature and complete
solution.
When a country or organization is ready and the appro-
priate infrastructure and supporting systems are in
place, a complete set of mature software solutions can
be implemented to fully track skilled health service pro-
viders from the time they enter training until they exit
the health workforce. Four components are needed to
address the most critical health workforce planning,
production and management issues:
Qualification. This component is used to collect
and aggregate data on skilled health service provid-
ers and speeds up the process of generating routine
forms, such as registrations and licences or records
of professional examination results, that were previ-
ously handwritten. It should reside with the licensing
or certification authority for a health worker cadre,
such as physicians or nurses. In most countries
these authorities are boards or councils. These data
are critical for hiring authorities throughout the coun-
try to ensure that only qualified professional health
workers are hired, since forging paper documents is
reported in many countries.
Management. This component tracks detailed
information about health workers who are employed
by the ministry of health, a public sector health-care
facility such as a hospital, or a private sector serv-
ice delivery point within the country. In addition to
individual deployment information, other pertinent
information may include performance appraisal, dis-
ciplinary action, retirement, change of occupation
and payroll information.
Education and training. There are two main train-
ing components: (i) pre-service education, which
tracks the level and field of education leading to
qualification for a health occupation; and (ii) continu-
ing education and in-service training, which update
the professional knowledge, practice and skills of
individual health service providers. Continuing edu-
cation may be required to maintain an active licence
to practise in certain countries. These two com-
ponents of training may be included in either the
qualification or management systems or they may
be stand-alone systems, depending on the needs
of a country.
Planning. This component uses data from each of
the other systems and statistical modelling appli-
cations to form a complete picture of the health
workforce in the country and allow projections on
how that workforce will change in the future (based
on known influences such as retirement age,
number of trained health workers annually entering
the workforce, attrition rates, changes in population,
staffing norms, disease patterns and other factors).
The planning and modelling component of the HRIS
can help decision-makers assess their health work-
force needs and make effective policy decisions to
meet those needs.
Together, these four components can provide a power-
ful feedback loop for analysing, planning and managing
health workforce resources and needs. If all four com-
ponents use the same core programming, database
architecture and supporting hardware and software
systems, once one is fully deployed, the others can
be added at a significantly lower cost. Each of the four

Use of administrative data sources for health workforce analysis
117
systems may be deployed independently or integrated
with software products already in place to provide a
customized, contextual solution for the country, filling in
any gaps that existing systems may have left (1).
9.2.4 Supporting use of data for effective decision-makingThe primary aim of any HRIS should be to promote bet-
ter use of data to drive effective decision-making for
addressing daily challenges and positively impacting
HRH policies and practice. However, it would be very
difficult for a few people poring over data reports to
make sound and binding decisions. The ways in which
data are used for effective decision-making rely on the
active involvement of a broad range of stakeholders
working together. Understanding the context in which
data are used to make decisions is also essential.
Rather than having an external consultant supply a
packaged training programme for using data for deci-
sion-making, for instance, all national stakeholders
should be engaged in understanding how they use
data now, both individually and organizationally, and
what factors are important in their context for using
data effectively. Examples of approaches that have
been employed in countries to improve the use of data
for decision-making include:
mapping how data are used to support a decision,
resulting in case studies of practical data use;
providing opportunities for decision-makers to expe-
rience critical decision-making moments so they
can develop their skills using real data in real-life
situations;
improving communication among users of data;
identifying and leveraging opportunities for improved
data sharing across different levels of the organiza-
tion and with other stakeholders.
9.2.5 Methodology for sustainability and continuous improvementAn information system requires ongoing support and
improvement to ensure maximum utility and sustain-
ability. Depending on the context and needs of the
country, sustainability strategies include continuous
collection of feedback from stakeholders about chang-
ing data needs and rolling out of improvements that
align with those needs. The early involvement of stake-
holders with the design and eventual implementation of
the HRIS encourages their sense of ownership. As part
of this, the HRIS strengthening process should include
the training of decision-makers and stakeholders to
effectively use and analyse data for informed and con-
fident decision-making. In addition, the training of data
collectors, system support staff and system manag-
ers helps to improve the technology infrastructure, data
quality and integrity. Data quality is of primary impor-
tance and should be emphasized at every step of the
process, from initial data collection to data analysis and
interpretation.
Data accuracy and completeness are necessary to
inform decision-making. Standardization of data col-
lection forms and data coding can facilitate ease of use
and internal validity. In addition, procedures to minimize
data entry errors when transferring data from paper to
electronic forms can result in improved data quality.
Dual data entry, in which a record is entered into an
electronic database at two separate times by two sepa-
rate staff, can reduce data entry errors by ensuring that
discrepancies in data are compared against the origi-
nal document. Should dual data entry be prohibitively
expensive or time intensive, a system of spot-checking,
in which a randomly selected list of electronic records
is checked against the original record, can be used.
Both dual data entry and spot-checking permit data
managers to identify, record and correct data errors.
A data error log can also serve as a starting-point for
later improvements in training methods, data collection
forms or software modifications.
Routine, reliable updates can also improve data qual-
ity by ensuring that data remain relevant for planning
and decision-making. Data reports at the central level
can be sent (either electronically or via paper forms)
to provincial or district representatives for review and
updating on a regular schedule. Similarly, processes
should be put in place to facilitate the flow of data and
reports between the central and district levels, and
between hospitals, health centres and other service
delivery points. This exchange of information allows the
HRIS to better account for changes in the workforce,
such as new deployments, transfers, specific in-serv-
ice trainings and workforce exits. Sharing data not only
improves accuracy but also enables health planners at
all levels to gain access to information valuable for pol-
icy and administrative decisions. Furthermore, enabling
public access to aggregated HRIS data may facilitate
HRH planning and research across sectors, including
nongovernmental organizations, academic research-
ers and policy-makers.
Although sharing data is essential in order to improve
data quality and encourage evidence-based decision-
making, maintaining data security is equally critical.
HRIS data includes personal information that must
remain secure in order to build confidence and trust
in the system. Implementing and adhering to a data
security policy starting from the initial stages of devel-
opment of the information system can help ensure
data confidentiality and integrity (Box 9.1) (4). A sys-
tem can be built with several levels of access based on

Handbook on monitoring and evaluation of human resources for health
118
user roles. For example, such a system could enable
some users to enter records without accessing reports,
other users to see reports without the ability to enter
or modify data, and a third group of users to access
only aggregate reports, without the ability to view or
edit individual records. All HRIS users should be sup-
plied with a password that is regularly changed, and
a system should be put in place to back up data on a
regular schedule.
The development of skills is necessary for supporting,
maintaining and developing computerized information
systems. This part of the strategy could include the
development of regional user communities to facilitate
problem solving and share system improvements, pos-
sibly in collaboration with local educational institutions.
Taking full advantage of HRIS results to improve HRH
planning and management in developing countries
requires a concerted supportive process. When pol-
icy-makers and other key stakeholders obtain access
to extensive information about the health workforce,
it may be difficult for them to see uses for these data
beyond the usual reports that they formerly generated
Box 9.1 Confidentiality and security of HRH information
With increasing attention to human resources opportunities and constraints to achieving health systems
objectives, greater emphasis is being placed on the collection of information to improve HRH development
and monitoring. Having longitudinal data, or information gathered at different points over time, allows
individual health workers to be tracked in their labour market activities and other significant events,
supporting evidence-based decision-making for policies and programmes at critical junctures along the
working lifespan.
Provider-level information becomes even more important when used for human resources development
strategies or health services delivery monitoring. This will require information systems, whether paper
based or electronic, that ensure health worker confidentiality yet allow relatively easy access to the
information at both the individual and aggregate level. Implemented systems must also address issues of
system availability.
Using personal data for health systems goals must be balanced against individuals’ rights to privacy and
confidentiality, and should be based on human rights principles.
When developing approaches to protecting data, a distinction should be made between providing for the
physical protection of data to guard against environmental threats, and the protection needed to guard
against inappropriate use of sensitive information, whether due to inadvertent or deliberate activities.
Three interrelated concepts, each implemented in a different manner, have an impact on the development
and implementation of protection of sensitive data: privacy, confidentiality and security.
Privacy is both a legal and an ethical concept. The legal concept refers to the legal protection that has
been accorded to an individual to control both access to and use of personal information and provides the
overall framework within which both confidentiality and security are implemented.
Confidentiality relates to the right of individuals to protection of their data during storage, transfer and
use, in order to prevent unauthorized disclosure of that information to third parties. Development of
confidentiality policies and procedures should include discussion of the appropriate use and dissemination
of health worker data with systematic consideration of ethical and legal issues as defined by privacy laws
and regulations.
Security is a collection of technical approaches that address issues covering physical, electronic and
procedural aspects of protecting information collected as part of the HRIS. It must address both protection
of data from inadvertent or malicious inappropriate disclosure, and non-availability of data due to system
failure and user errors.
Source: Adapted from UNAIDS (4).
Use of administrative data sources for health workforce analysis
119
with paper records. Additionally, the HRIS data are
being produced in a policy-making context that is
highly political, and appointments to positions may
change frequently (5). The data for the decision-
making process involves the key stakeholders in a
practical, participatory procedure of using, interpreting
and applying the new HRIS information while consider-
ing what capacity needs to be developed to implement
changes on an individual, organizational and policy
level. This may involve sharing information and reports
that are now available and training on different ways to
interpret the information and present evidence effec-
tively to respond to key policy questions. Having the
key stakeholders present their own data to their peers
helps to build the ownership and confidence in using
these data to inform management and policy deci-
sions. The final phase involves developing a plan for
disseminating these HRIS data regularly, based upon
the reporting cycle within the country.
9.3 Country case studiesExamples are now provided from HRIS development,
strengthening and evaluation efforts in three low- and
middle-income countries: Uganda, Sudan and Brazil.
9.3.1 Building a health professional licensure information system in UgandaIn Uganda, the Ministry of Health (6) and four health
professional regulatory councils, including the Nurses
and Midwives Council, needed updated and reliable
information on how many health professionals by cadre
were licensed to work in the country, what training they
had received, if they were leaving the health workforce
and if so, why. Until recently, although a complex sys-
tem of paper forms was in place, there was no way to
aggregate or analyse the information, and it was diffi-
cult even to track down a given nurse’s current address
or licensing information.
A stakeholder leadership group was formed, includ-
ing representatives from several departments in the
Ministry of Health, the four professional licensing asso-
ciations, training institutions and nongovernmental
organizations, as well as consultants in health workforce
planning and information systems from the Capacity
Project (1), a global HRH initiative funded by the United
States Agency for International Development. The goal
was to develop a registration and licensing informa-
tion system that would track all health professionals
from the time they entered pre-service training until
they left the health workforce. One of the first activi-
ties of the stakeholder group was to identify the key
policy questions that it wanted addressed regarding
nursing and midwifery personnel, so that the first HRIS
strengthening step could focus on generating regular
reports to answer those questions.
Improvements were made to the network and hardware
infrastructure at the Uganda Nurses and Midwives
Council, the regulatory body that licenses profes-
sional nurses and midwives working in the country. An
open source software application was installed: iHRIS
Qualify, a training, certification and licensure-tracking
database (7). “Open source” refers to computer soft-
ware distributed under a licence that allows anyone
to study, copy and modify the source code (the set of
instructions that creates a piece of software) and redis-
tribute the software in modified or unmodified form,
without restriction and without the need to pay a licens-
ing fee. This means that products can be distributed
at minimal cost, and users can continue to use and
improve their systems without paying onerous licens-
ing or upgrade fees. Open source software does have
some disadvantages, most importantly the potential
for poor support for users in countries with a shortage
of skilled personnel in new information and commu-
nications technologies, and a lack of accountability
if software glitches or unauthorized access occurs.
However, using open source software has the advan-
tage of encouraging software development in context,
and often represents the least-cost alternative where
there is a foundation of computer skills in the coun-
try, or better yet, the health system. It is also possible
to draw on the global open source support commu-
nity that has developed around these technologies to
voluntarily support and improve the systems. This can
be quite advantageous in helping users answer ques-
tions, fix problems with software and even develop new
modules. The result is a completely tailored (but still
low-cost) system that can grow and change over time.
In the Ugandan context, implementation teams were
formed to programme and deploy the software. Entry
of historical registry data from the Uganda Nurses and
Midwives Council was completed first, followed by the
other three licensing bodies – for medical and dental
practitioners, pharmaceutical practitioners and allied
health professionals. Quality controls were incorporated
into the data entry and processing procedures, nota-
bly the assignment of a unique identification number
within and across cadres to address potential biases
such as double-counting (for example, when a health
professional has more than one type of training), and a
dual data entry system to ensure accuracy and permit
tracking of data entry problems. Another method used
for validating the data was to request each individual
health worker, upon entry to the appropriate council, to
verify the contents and update any information that may
have changed based on a printout of their electronic
record. This process keeps the database updated and

Handbook on monitoring and evaluation of human resources for health
120
gives the health professionals an appreciation of the
need for data accuracy.
The next three figures offer examples of the type of
information that can be examined with the database,
drawing on administrative records for all student nurses
and midwives that entered training between 1980 and
2004. Figure 9.2 shows the increase in enrolment in
nursing and midwifery training programmes during this
timeframe.
Figure 9.3 presents findings on completion of training
programmes and professional qualification among stu-
dent nurses and midwives in Uganda. Of the 21 888
student nurses and midwives that entered training from
1980 to 2004, only 17 297 completed the training pro-
gramme and sat for the exam. Of those who passed
the examination, 16 658 qualified to register with the
Nurses and Midwives Council and 14 637 eventually
registered – approximately two thirds of those who
originally entered training. One way in which these
data are being used is to ensure that nurses and mid-
wives hired are registered with the Uganda Nurses and
Midwives Council by giving central and district author-
ities restricted access to view the HRIS to see if the
applicants for professional positions are in good stand-
ing with the Council.
Figure 9.4 identifies the location of nursing schools by
district, showing where students are most successful in
passing the licensing examination and becoming reg-
istered, and where they are having more difficulty. For
example, 18% of nurses and midwives who attended
school in Kampala District and 11% of those who
attended school in Kisoro District passed the exam
but did not become registered by the Council. In con-
trast, all nurses and midwives who attended school
and passed the exam in Bushenyi District became
registered.
These data have important policy implications about
expenditure of scarce national resources for educating
health professionals that are wasted if individuals do
not complete training and become registered with the
appropriate regulatory body. They also raise questions
about selection of students and the examination pro-
cess. Without knowing how many of these students do
not complete training, policy-makers and planners do
not know how to budget or plan for training or deploy-
ment of health workers to meet the needs in the country.
Also, these data help educators, professional councils
and various ministries to identify potential problems in
the early stages, prioritize where to target interventions,
offer an indication on where further investigation and
monitoring are needed, and point to factors that were
important to observed positive outcomes from which
stakeholders can learn.
Based on the results discussed above, in Uganda, a
recommendation was developed to further explore the
causes for the high failure rates among student nurses
and midwives and propose ways to tackle the problem
(8). An interministerial stakeholder meeting was set up
to address some of the issues about examining nurses
for registration with the Nurses and Midwives Council.
9.3.2 Institutionalizing a health workforce monitoring framework in SudanA number of strategies and initiatives have been imple-
mented in Sudan in recent years to improve health
system performance, including strategies to achieve
the Millennium Development Goals and other inter-
national, regional and national goals for reducing
poverty and improving population health. Accordingly,
Sudan’s Federal Ministry of Health made a decision
Figure 9.2 Number of students entering nursing training programmes (leading to qualification as registered or enrolled nurses) in Uganda, 1980–2004
Source: Capacity Project (1).
Figure 9.3 Number of student nurses who entered training between 1980 and 2004, passed the professional licensing exam, and qualified, registered and became licensed with the Uganda Nurses and Midwives Council
Source: Capacity Project (1).
835
2089 2463 3579
4425
0
1000
2000
3000
4000
5000
1980-1984 1985-1989 1990-1994 1995-1999 2000-2004
Num
ber o
f stu
dent
nur
ses
21 888 17 297 16 658 14 637
70220
5000
10 000
15 000
20 000
25 000
ntered tr n n t for t e e m u f ed to re ster
e stered t re u tor bod
Num
ber o
f stu
dent
nur
ses
ensed t re u tor bod
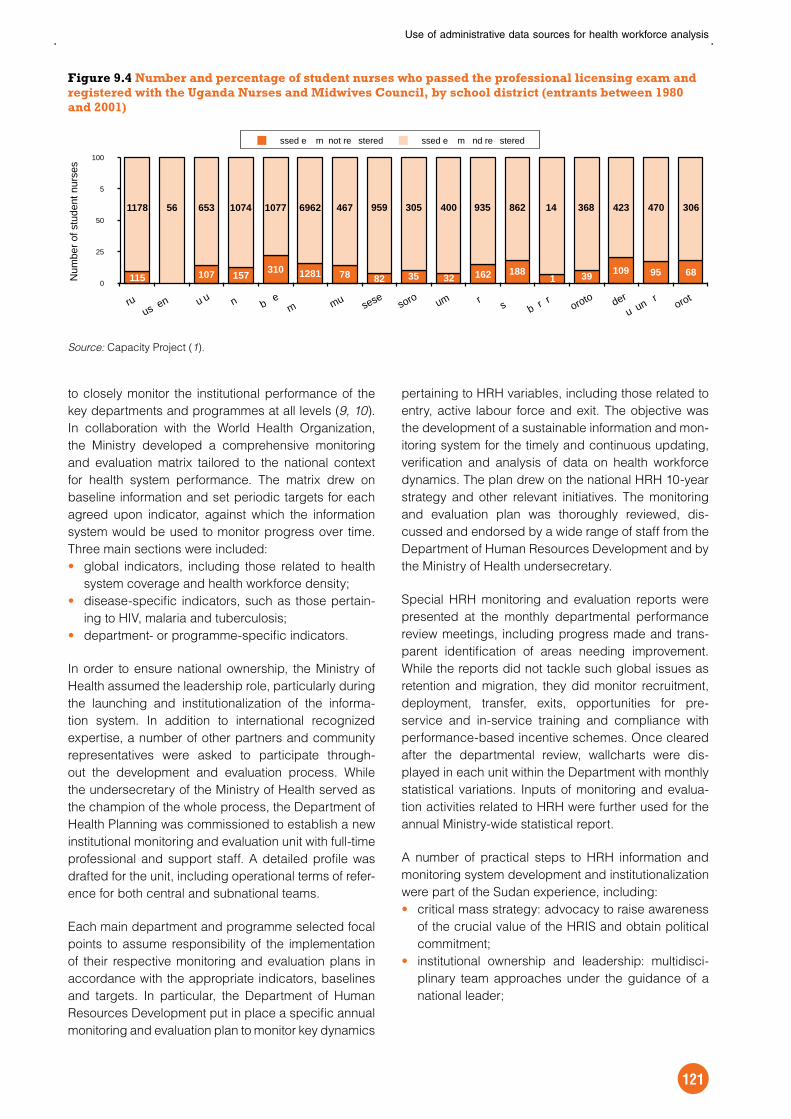
Use of administrative data sources for health workforce analysis
121
to closely monitor the institutional performance of the
key departments and programmes at all levels (9, 10).
In collaboration with the World Health Organization,
the Ministry developed a comprehensive monitoring
and evaluation matrix tailored to the national context
for health system performance. The matrix drew on
baseline information and set periodic targets for each
agreed upon indicator, against which the information
system would be used to monitor progress over time.
Three main sections were included:
global indicators, including those related to health
system coverage and health workforce density;
disease-specific indicators, such as those pertain-
ing to HIV, malaria and tuberculosis;
department- or programme-specific indicators.
In order to ensure national ownership, the Ministry of
Health assumed the leadership role, particularly during
the launching and institutionalization of the informa-
tion system. In addition to international recognized
expertise, a number of other partners and community
representatives were asked to participate through-
out the development and evaluation process. While
the undersecretary of the Ministry of Health served as
the champion of the whole process, the Department of
Health Planning was commissioned to establish a new
institutional monitoring and evaluation unit with full-time
professional and support staff. A detailed profile was
drafted for the unit, including operational terms of refer-
ence for both central and subnational teams.
Each main department and programme selected focal
points to assume responsibility of the implementation
of their respective monitoring and evaluation plans in
accordance with the appropriate indicators, baselines
and targets. In particular, the Department of Human
Resources Development put in place a specific annual
monitoring and evaluation plan to monitor key dynamics
pertaining to HRH variables, including those related to
entry, active labour force and exit. The objective was
the development of a sustainable information and mon-
itoring system for the timely and continuous updating,
verification and analysis of data on health workforce
dynamics. The plan drew on the national HRH 10-year
strategy and other relevant initiatives. The monitoring
and evaluation plan was thoroughly reviewed, dis-
cussed and endorsed by a wide range of staff from the
Department of Human Resources Development and by
the Ministry of Health undersecretary.
Special HRH monitoring and evaluation reports were
presented at the monthly departmental performance
review meetings, including progress made and trans-
parent identification of areas needing improvement.
While the reports did not tackle such global issues as
retention and migration, they did monitor recruitment,
deployment, transfer, exits, opportunities for pre-
service and in-service training and compliance with
performance-based incentive schemes. Once cleared
after the departmental review, wallcharts were dis-
played in each unit within the Department with monthly
statistical variations. Inputs of monitoring and evalua-
tion activities related to HRH were further used for the
annual Ministry-wide statistical report.
A number of practical steps to HRH information and
monitoring system development and institutionalization
were part of the Sudan experience, including:
critical mass strategy: advocacy to raise awareness
of the crucial value of the HRIS and obtain political
commitment;
institutional ownership and leadership: multidisci-
plinary team approaches under the guidance of a
national leader;
Figure 9.4 Number and percentage of student nurses who passed the professional licensing exam and registered with the Uganda Nurses and Midwives Council, by school district (entrants between 1980 and 2001)
Source: Capacity Project (1).
115 107 157 310 1281 78
1178 56 653 1074 1077 6962 467
0
25
50
5
100
Num
ber o
f stu
dent
nur
ses
ssed e m not re stered ssed e m nd re stered
ruus en u u n b e
m mu sese soro um r s oroto derb r r
u un r orot
959
82 35 32 162 1881 39 109 95 68
305 400 935 862 14 368 423 470 306

Handbook on monitoring and evaluation of human resources for health
122
consensus on a limited set of core indicators
adapted to the country context, including explicit
baselines and benchmarks;
going electronic: deployment of user-friendly soft-
ware for monitoring progress;
methodology refinement and local adaptation: allow-
ing flexibility for refining and adapting or readapting
the information system to the changing local context
for the health workforce;
training in data analysis, dissemination and use, and
in basic information technology skills for national
human resources development staff and monitoring
and evaluation coordinators and focal points;
transparent dissemination of information generated
by the system, including periodic dissemination ses-
sions among key stakeholders aimed at gaining
inputs and generating maximum consensus building.
Selected results from the HRH information and monitor-
ing system in Sudan are presented in Table 9.1. Critical
to these results is the linking of the monitoring and eval-
uation analysis to problem solving and HRH strategic
enhancement: there is no point in investing in a com-
plex information system if the results are only used
to monitor implementation. The system must include
mechanisms to identify and rectify areas that need
improvement.
9.3.3 Evaluating an HRH information and management system in BrazilIn Brazil, the HRH information and management sys-
tem (sistema de informação e gestão de recursos
humanos em saúde, or SIGRHS) was conceived in the
context of health systems reform. It was designed as an
instrument for the collection, processing and use of pri-
mary data relevant to planning and management of the
health workforce. The system was developed to inform
regional and local health managers to make better
decisions related to their personnel. Initiated in 1987 by
the Department of Health of the State of Rio de Janeiro
and implemented by the University of the State of Rio
de Janeiro’s Institute of Social Medicine, the HRIS has
been continuously updated, modified and evaluated
in response to local demands and taking advantage
of innovations in information technologies. In partic-
ular, the development of new, user-friendly software
applications facilitated data entry operations at the
decentralized level and allowed inclusion of both quan-
titative and qualitative variables on HRH management.
The HRIS includes data drawing on administrative
records from different levels and types of institutions.
Data collection and entry are conducted using stand-
ardized templates. The basic elements captured in the
system include sociodemographic characteristics of
health workers, professional qualifications and work-
related variables, such as job position, employment
sector and working hours. These items of information
enable profiling of the health labour force, for example
Table 9.1 Selected indicators and benchmarks from the health workforce information and monitoring system in Sudan, 2006–2007
Indicator Period Target Result Gap Compliance
rate
Suggested rectification measures
1. Number of newly graduated physicians entering the service for internship on time
Q1/2007 750 750 0 100% The deployment system has been substantially improved since utilization of the newly developed electronic system/web application (2006), with a maximum waiting time of three months.
2. Number of internship supervisory visits at three identified hospitals using the quality assurance approved checklist
Q1/2007 10 3 7 30% Compliance rate is too low, to be discussed in next Department of Human Resources Development staff/performance review meetings.
Effort should be given to report qualitative results and not merely quantitative.
3. Number of medical specialists deployed to underserved areas
Q1–Q4, 2006
12 7 5 58% Revisit newly developed incentive system and recommend modifications to attract more specialists to work outside the capital.
Source: Federal Ministry of Health of the Republic of the Sudan.

Use of administrative data sources for health workforce analysis
123
the distribution by age, sex and educational attainment.
They can be used to assess, among other things, skills
mix of the health workforce and the deployment of staff
across different types of professional functions, health
facilities and regions. Regular updating of the data also
allows for estimating worker attrition rates. The main
data source is staffing rosters and payroll for public
health services. Given the confidential nature of these
data, a technical team oversees the level of access,
whether partial or total, to the information contained in
the system for research purposes.
The use of administrative data offers many advan-
tages over other types of standard statistical sources.
Traditionally, information on HRH in Brazil came from
large-scale databases, compiled by different national
agencies for a range of objectives. They include the
decennial population census, household sample
surveys including the monthly labour force survey,
and health facility surveys carried out by the Central
Statistical Office (11). Other sources of information on
the formal labour market include various registries on
jobs, wages, recruitments and dismissals of the Ministry
of Labour, and on specific occupations through the reg-
istration systems of professional associations, unions
and councils (12). However, these sources tend to be
fragmented and are often not readily usable for inform-
ing managerial practices and strategies at the local
level, particularly in the health sector.
The process of health systems reform and decentraliza-
tion, and the availability of new information technologies
at the level of local health organizations, were a cata-
lyst to the implementation of the HRIS in Brazil. In order
to evaluate the success of maintenance and consoli-
dation of the system, and the use of information as a
planning and managerial tool, a survey was conducted
in collaboration with the University of the State of Rio de
Janeiro for appraising the implementation of the HRIS
and its performance. An appraisal tool was developed
drawing on a framework for evaluation of the imple-
mentation process covering three key components
of accountability of health policies and programmes:
administrative, political and community levels (13, 14).
The survey was administered among various stake-
holders across the country by means of site visits and
semi-structured interviews. The specific objectives of
the survey included:
identification of the different types and degrees of
involvement of relevant actors in the implementation
and utilization of the HRIS;
identification of the opportunities and constraints for
integrating additional information in the area of HRH
management, notably qualitative information;
assessment of the level of satisfaction among health
service managers regarding the utilization of the
information contained in the HRIS;
profile of the utilization of the information generated
by the HRIS among other organizations both within
and outside the health sector.
Table 9.2 Selected indicators and corresponding criteria used for evaluating the performance of the HRH information and management system in Brazil
Indicator Response options for performance level
High Average Low
Coverage of implementation of the HRIS among registered servers in the public health services network
At least 90% of registered servers
Between 70 and 90% of registered servers
Less than 70% of registered servers
Completeness of information sources compiled in the HRIS
Collection of data from primary sources and complete fields
Secondary data sources primarily used with at least one review of primary sources
Incomplete data collection/compilation
Productivity of implementation of the HRIS
Emission of first dissemination report less than three months after data collection
Emission of first dissemination report within three to six months after data collection
Emission of first dissemination report more than six months after data collection or not at all
Regularity of implementation of the HRIS
Data collection routinely updated
Data collection updated occasionally or on demand
Data collection not updated
Regularity of utilization of the HRIS
Dissemination reports issued regularly, up to four in last four months or on demand
Dissemination reports not issued regularly, but at least once in last six months
Dissemination reports not issued
Source: Pierantoni (15).
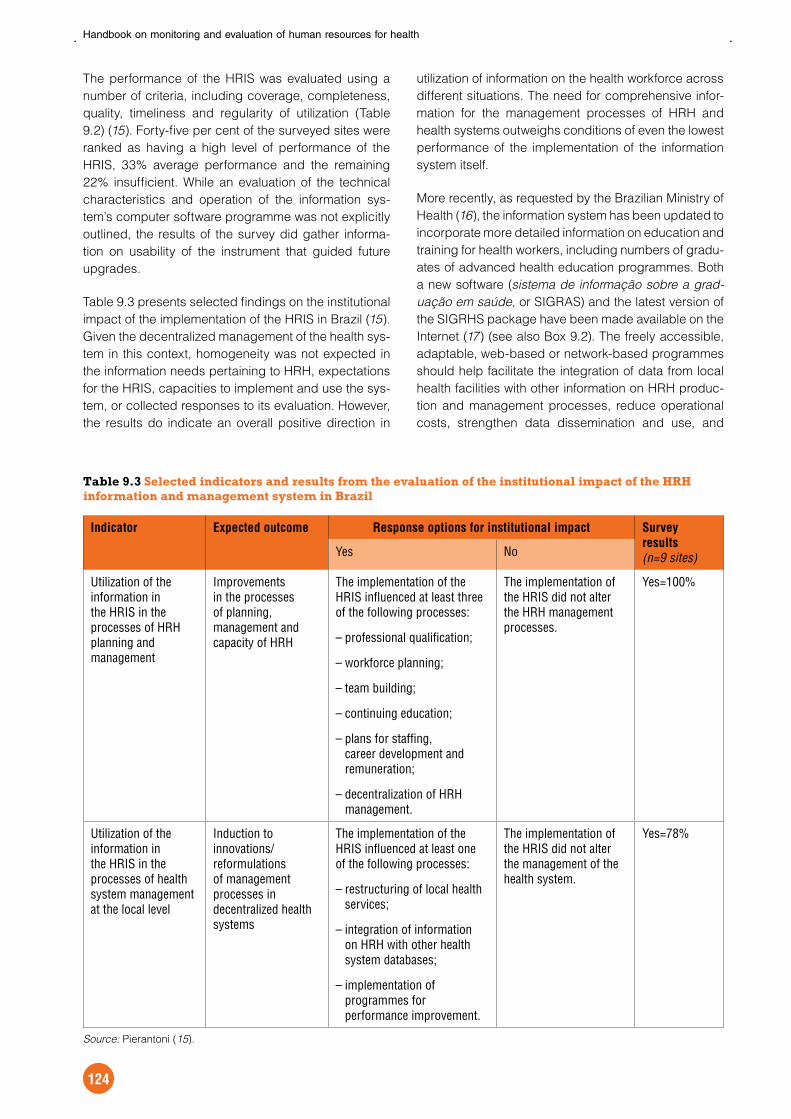
Handbook on monitoring and evaluation of human resources for health
124
The performance of the HRIS was evaluated using a
number of criteria, including coverage, completeness,
quality, timeliness and regularity of utilization (Table
9.2) (15). Forty-five per cent of the surveyed sites were
ranked as having a high level of performance of the
HRIS, 33% average performance and the remaining
22% insufficient. While an evaluation of the technical
characteristics and operation of the information sys-
tem’s computer software programme was not explicitly
outlined, the results of the survey did gather informa-
tion on usability of the instrument that guided future
upgrades.
Table 9.3 presents selected findings on the institutional
impact of the implementation of the HRIS in Brazil (15).
Given the decentralized management of the health sys-
tem in this context, homogeneity was not expected in
the information needs pertaining to HRH, expectations
for the HRIS, capacities to implement and use the sys-
tem, or collected responses to its evaluation. However,
the results do indicate an overall positive direction in
utilization of information on the health workforce across
different situations. The need for comprehensive infor-
mation for the management processes of HRH and
health systems outweighs conditions of even the lowest
performance of the implementation of the information
system itself.
More recently, as requested by the Brazilian Ministry of
Health (16), the information system has been updated to
incorporate more detailed information on education and
training for health workers, including numbers of gradu-
ates of advanced health education programmes. Both
a new software (sistema de informação sobre a grad-
uação em saúde, or SIGRAS) and the latest version of
the SIGRHS package have been made available on the
Internet (17) (see also Box 9.2). The freely accessible,
adaptable, web-based or network-based programmes
should help facilitate the integration of data from local
health facilities with other information on HRH produc-
tion and management processes, reduce operational
costs, strengthen data dissemination and use, and
Table 9.3 Selected indicators and results from the evaluation of the institutional impact of the HRH information and management system in Brazil
Indicator Expected outcome Response options for institutional impact Survey
results
(n=9 sites)Yes No
Utilization of the information in the HRIS in the processes of HRH planning and management
Improvements in the processes of planning, management and capacity of HRH
The implementation of the HRIS influenced at least three of the following processes:
– professional qualification;
– workforce planning;
– team building;
– continuing education;
– plans for staffing, career development and remuneration;
– decentralization of HRH management.
The implementation of the HRIS did not alter the HRH management processes.
Yes=100%
Utilization of the information in the HRIS in the processes of health system management at the local level
Induction to innovations/ reformulations of management processes in decentralized health systems
The implementation of the HRIS influenced at least one of the following processes:
– restructuring of local health services;
– integration of information on HRH with other health system databases;
– implementation of programmes for performance improvement.
The implementation of the HRIS did not alter the management of the health system.
Yes=78%
Source: Pierantoni (15).

Use of administrative data sources for health workforce analysis
125
expand the evidence base for informing decision-mak-
ing for management change within organizations.
9.4 Summary and conclusionsDue to the growing interest in health system strength-
ening and its critical human resources function in
particular, the need for documenting and analysing
trends and results pertaining to the health workforce
is becoming part of the global and national agenda in
monitoring health system performance. Although the
instalment and maintenance of a functioning HRIS at
the national, regional and global levels is not an easy
endeavour, it is doable, given the political commit-
ment and evolving quest in many countries to generate
evidence-based policies to make progress in tack-
ling HRH-related challenges. The development and
sustainability of a comprehensive HRIS to inform deci-
sion-making is a leadership, financial, educational,
partnership and management issue (18).
Well-defined indicators and high-quality data to
continuously monitor the status of the health work-
force and evaluate outcomes are being increasingly
sought in many countries, particularly by ministries of
health. However, prospective countries are not look-
ing for merely cutting-edge technology and technical
assistance with attractive manuals and guidelines,
but practical options and easy-to-use methods to
monitor the complex dynamics of the health workforce.
A generic and conceptually sound framework for HRIS
implementation is neither useful nor sufficient. Field
experience shows that a “one framework fits all” rec-
ipe is not the solution, given the unique context of the
health workforce in each country.
At the same time, this chapter has revealed a number
of commonalities across various country-specific
experiences and lessons learnt that are crucial for
the development of an operational HRIS that is viable,
effectively functioning and sustainable within the rou-
tine health management system establishment.
Firstly, while other partners and local representatives
should participate throughout the process, the minis-
try of health has to be the owner in establishing and
institutionalizing the information system. Moreover, insti-
tutional readiness is one of the most crucial conditions
to making an HRIS both functional and sustainable.
Bringing together all HRIS stakeholders, often for the
first time in the same room, ensures that information is
shared and helps in identifying the data that do exist
and reaching consensus for selection of appropri-
ate indicators and benchmarks. Training and capacity
building among stakeholders of the system is critical
from the early planning stages, not only in data analy-
sis and basic information technology skills, but also in
data dissemination and use to inform decision-making.
Box 9.2 Implementation and use of the SIGRHS information system for HRH management in Guinea Bissau
The SIGRHS HRH information and management system was adopted and implemented by the Ministry of
Public Health of Guinea Bissau as part of a partnership between the Brazilian Ministry of Health and the
World Health Organization to support the use of information systems for health workforce development in
Member States of the PALOP organization (Países Africanos de Língua Oficial Portuguesa).
To implement the SIGRHS software for data collection, storage and analysis in Guinea Bissau, it
was necessary to adapt the system to the local specificities. A new configuration was based on the
administrative organization of the country’s health system, the organizational structure of the Ministry of
Public Health, the identification and distribution of health facilities and services at the district level, the
positions and location of health workers, and the structure of the education system for producing skilled
health service providers.
It was also necessary to upload about 2400 pre-existing facility staffing return records from their previous
form in a simple spreadsheet (Excel file). Incorporating these initial data into the adapted SIGRHS system
enabled preliminary reports to be run and an initial profile of the health workforce to be drawn. The results
showed that the health workforce in the public sector of Guinea Bissau is largely constituted by workers
with lower levels of education; only 11% were reported to have university-level education. The majority of
health workers (63%) were to be found in primary care facilities, 25% in secondary-level facilities and the
remaining 12% in large regional-level facilities.

Handbook on monitoring and evaluation of human resources for health
126
A number of practicalities also need to be considered.
The relevance of the HRIS for review of the national
HRH situation critically depends on the quality of the
data used to feed it. Dimensions against which to meas-
ure data quality include the validity, reliability, integrity,
precision, truthfulness and timeliness of the system
(19). As an example, data validity can be compromised
when individual records are not updated upon retire-
ment, emigration or death. While the development of
the HRIS is ongoing, a formal evaluation plan for data
quality would include comparing routine administrative
data used for continuous monitoring to periodic sur-
vey or census data for purposes of validation. Another
issue closely related to data quality is that of privacy
and confidentiality. No data that can specifically iden-
tify individuals should be made accessible for public
use. Even aggregate data sharing should only come
through the permission of the responsible stakeholder.
While an idealized planned progression towards a
complete and mature software solution was identi-
fied in this chapter, experience suggests that in some
cases less is better, and patience is paramount to leave
space and time for understanding, ownership and
engagement before a solution is rushed in. In partic-
ular, although there are proprietary software solutions
for HRIS, the choice of free and open source software
offers significant advantages for sustainability at the
country level where cost-effective solutions are essen-
tial (1). Open source solutions decrease the costs of
implementation and ongoing maintenance of the HRIS,
and provide a global community for support and con-
tinuous improvement. Many governments and health
systems have elected to standardize on open source
technologies and build the necessary capacity to sup-
port them in order to realize the benefits.
Unfortunately, some countries remain reluctant to make
data publicly available for further analysis, notably in
contexts of severe HRH shortages. It is highly rec-
ommended to link results of the information system to
problem solving among experts in health workforce
planning and management. Sharing consistent infor-
mation is important so that improved human resources
strategies can be compared and used by others.
Intercountry knowledge sharing as part of the HRIS
strengthening process provides models that help avoid
repeating mistakes and standardizes HRH information
and evidence across regions and countries. As will be
further discussed in Chapter 12 of this Handbook, HRH
observatories are one valuable mechanism that can be
used for widely disseminating information and evidence
for effective practices at the national, regional and glo-
bal levels.
References1. Global HRIS strengthening. Capacity Project (http://
www.capacityproject.org/hris, accessed 24 January
2009).
2. Hotz VJ et al,, eds. Administrative data for policy-
relevant research: an assessment of current
utility and recommendations for development. In:
Report of the Advisory Panel on Research Uses of
Administrative Data of the Northwestern University/
University of Chicago Joint Center for Poverty
Research, 1998.
3. Everybody’s business: strengthening health systems
to improve health outcomes – WHO’s framework
for action. Geneva, World Health Organization,
2007 (http://www.who.int/healthsystems/strategy/
everybodys_business.pdf, accessed 10 January
2009).
4. Confidentiality and security of HIV information. Joint
United Nations Programme on HIV/AIDS (UNAIDS)
(http://www.unaids.org/en/KnowledgeCentre/
HIVData/Confidentiality/default.asp, accessed 24
January 2009).
5. Bowen S, Zwi AB. Pathways to “evidence-informed”
policy and practice: a framework for action. PLoS
Medicine, 2005, 2(7) (http://medicine.plosjournals.
org/archive/1549–1676/2/7/pdf/10.1371_journal.
pmed.0020166-L.pdf, accessed 24 January 2009).
6. Ministry of Health, Republic of Uganda (http://www.
health.go.ug/, accessed 24 January 2009).
7. Global HRIS strengthening: iHRIS software suite.
Capacity Project, 2008 (http://www.capacityproject.
org/hris/suite, accessed 24 January 2009).
8. Mshana E. Addressing the human resources for
health crisis in Uganda. Presented at the National
Symposium on Developing Human Resources for
Health hosted by the Uganda Ministry of Health,
Kampala, 2–4 April 2006.
9. Ahmed HS. Monitoring and evaluation system of
the Federal Ministry of Health: the current situation
and future perspective. Sudanese Journal of Public
Health, 2008, 3(1):39–40.
10. Sudan National Health Policy, 2006. Federal Ministry
of Health of the Republic of the Sudan, 2006.
11. Instituto Brasileiro de Geografia e Estatística,
Ministério do Planejamento, Orçamento e Gestão
(http://www.ibge.gov.br/home/, accessed 24 January
2009).
12. Pierantoni CR. A informação para a gestão local
de recursos humanos da saúde. In: Ministério da
Saúde, Observatório de recursos humanos em
saúde no Brasil. Rio de Janeiro, Editora Fiocruz,
2003.
13. Perez JRP. Avaliação do processo de
implementação: algumas questões metodológicas.
In: Rico EM, ed. Avaliação das políticas sociais: uma
questão em debate. São Paulo, Cortez, 1999.
14. Pierantoni CR, Viana AL. Avaliação de processo na
implementação de políticas públicas: a implantação
do Sistema de Informação e Gestão de Recursos
Humanos em Saúde (SIG-RHS) no contexto das
Use of administrative data sources for health workforce analysis
127
reformas setoriais. Physis: Revista de Saúde
Coletiva, 2003, 13(1):59–92.
15. Pierantoni CR. Reformas da saúde e recursos
humanos: novos desafios x velhos problemas. Uma
estudo sobre recursos humanos e as reformas
recentes da política nacional de saúde [doctoral
thesis]. Rio de Janeiro, Universidade do Estado do
Rio de Janeiro, 2000.
16. Programa de Qualificação e Estruturação da Gestão
do Trabalho e da Educação no Sistema Único de
Saúde: ProgeSUS. Ministry of Health of Brazil, 2007
(http://www.saude.gov.br, accessed 24 January
2009).
17. Department of Health Planning and Administration:
Workstation of the Health Human Resources
Observatory Network, Social Medicine Institute,
University of the State of Rio de Janeiro (http://www.
obsnetims.org.br, accessed 24 January 2009).
18. World Health Organization. Strengthening national
and subnational departments for human resources
development. Health Workforce Development
Series, Issue 1. Cairo, World Health Organization
Regional Office for the Eastern Mediterranean, 2008
(http://www.emro.who.int/dsaf/dsa954.pdf, accessed
24 February 2009).
19. Selvaggio MP. Producing good data: data quality
management. Presented at the professional
development workshops prior to the South African
Monitoring and Evaluation Association (SAMEA)
Conference, Gauteng, 26–28 March 2007.

Handbook on monitoring and evaluation of human resources for health
128

129
Understanding health workforce issues: a selective guide to the use of qualitative methods
TOMAS LIEVENS, MAGNUS LINDELOW, PIETER SERNEELS
10.1 IntroductionData and evidence are critical ingredients in the design
of effective health workforce policies and strategies.
Policy-makers need information on the size and dis-
tribution of the health workforce, inflows and outflows,
absolute and relative earnings of health workers, and
so forth. They also need to understand why particu-
lar labour market outcomes are being observed, and
how different policies or reforms are likely to impact on
the outcomes of interest. For example, if a country is
having problems deploying staff to rural facilities, why
is that the case? Would the introduction of contractual
obligations for rural service, perhaps combined with
financial incentives, resolve the problem, or are other
approaches needed? Or, if the problem is that too few
health workers opt for a career in the public sector,
favouring private employment instead, then policy-
makers need to understand the appeal of the private
sector, and how health workers are likely to respond
to different forms of government regulations to restrict
such movements.
Other chapters in this Handbook have highlighted how
quantitative data from administrative sources, health
facility assessments and population-based sources
can help meet policy-makers’ needs for information
and evidence. Such data can shed light on patterns
and trends in the health workforce, the determinants of
health worker behaviour and choices in the labour mar-
ket, and the impact of health workforce policies and
regulations. However, quantitative data have impor-
tant limitations, in particular when it comes to issues
or phenomena that are poorly understood or difficult
to classify and measure. Recognizing these limitations,
this chapter focuses on how qualitative methods can
be used to support and complement quantitative anal-
ysis in understanding health workforce issues.
Qualitative methods include a broad array of
techniques and approaches for describing and under-
standing social phenomena. In contrast to quantitative
methods, qualitative methods eschew the focus on
structure and precise measurement in favour of more
open-ended approaches to examining, analysing and
interpreting behaviours and phenomena. Although it is
often hard to generalize from qualitative analyses, the
rich information they generate can be of considerable
value. Consider, for instance, an effort to understand
the impacts of current or planned health labour market
reforms. These impacts are likely to depend on a wide
range of factors, many of which are difficult to measure
(for example preferences and expectations of health
workers, social and cultural conditions, and implemen-
tation arrangements). Moreover, some of the effects of
reforms on outcomes such as job satisfaction, team-
work or workplace behaviour are themselves difficult to
measure, and may not even be anticipated.
It is clear, then, that qualitative methods can be useful to
understand a context in which policies or interventions
are introduced, anticipating behavioural responses and
impacts, identifying implementation issues and shed-
ding light on how the policy is actually perceived and
understood by different stakeholders. The aim of this
chapter is to provide some guidance on how to design
and implement qualitative studies. In doing so, it draws
on a rich methodological literature and a wealth of
applied work, but it does not seek to be a comprehen-
sive guide to qualitative methods. The text is focused
on practical tips and guidelines for qualitative health
workforce research. For more fundamental issues,
including epistemological issues, the reader is referred
to the work that addresses these issues more com-
prehensively than is possible within the scope of this
chapter (1–11).1 To illustrate both methodological points
and the potential value of qualitative work, the chapter
draws on two studies from Ethiopia and Rwanda.
The remainder of the chapter is organized as follows.
The next section describes qualitative methods and
1 For general background on methodological and interpretive
issues in qualitative research, see for example Becker (1)
Bryman (2), Bryman and Burgess (3), Denzin and Lincoln (4),
Flick (5), Greene (6), Seale (7), Silverman (8, 9), Walker (10)
and Wolcott (11).
10

Handbook on monitoring and evaluation of human resources for health
130
approaches and looks into their usefulness for health
worker studies. The following section discusses selected
issues in the design and implementation of health worker
research. The last section concludes with some sugges-
tions on how qualitative work on health workforce issues
can be expanded and strengthened in the future.
10.2 Qualitative methods: their value and potential
10.2.1 Qualitative research definedThe most frequently used definition of qualitative
research is “research that is not of a quantitative
nature”. An alternative approach is to concentrate on
what all qualitative research has in common, namely
the use of data in the form of text, as this in itself has
profound implications for the techniques used in both
data collection and analysis (1, 12, 13). Another dis-
tinct characteristic of qualitative research is that the
researcher tends to be heavily involved in the collection
of the data. More than in quantitative research, on-the-
spot judgement is needed regarding what to register,
where to focus and where to go deeper. At the level
of analysis there is a similar challenge, as the results
depend to a certain extent on the interpretation of the
data, more so than in quantitative research.
In practice, “qualitative research” applies to a wide range
of diverse research techniques. In this chapter, three
main methodological approaches are distinguished:
(i) individual interview; (ii) focus group discussions;
and (iii) ethnography or participant observation (Box
10.1). Each of the three techniques discussed here2
has its own advantages and disadvantages, but they
2 This chapter does not consider other qualitative techniques,
such as language-based approaches (for example discourse
conversation analysis), projective techniques, case studies
and text analysis. Tesch (14) distinguishes 26 different types
of qualitative approaches in social research. For an overview,
see the sources listed in footnote 1 of this chapter.
also have a number of strengths and weaknesses in
common.
10.2.2 Strengths and weaknessesIn thinking about the strengths and weaknesses of qual-
itative methods, it is helpful to start by contrasting them
with quantitative methods. The latter rely on structured
instruments to collect quantitative data that correspond
to predetermined categories and classifications. The
resultant data can easily be described and summa-
rized. Moreover, provided the data are representative
of a broader population, statistical techniques can be
used to make inferences about that population, and to
explore multivariate relationships.
Qualitative methods, in contrast, tend to impose
less structure on the data and this has a number of
advantages:
It allows for open-ended responses and interactive
exploration of issues with the respondent. This can
shed light on issues that are difficult to measure,
such as beliefs, feelings, values and perceptions. A
welcome side-effect of this approach is that it also
registers the participants’ vocabulary, which is often
useful for designing quantitative surveys, and for
communicating with stakeholders about the issues
under study.
An open-ended interaction with the respondent(s)
helps create the necessary trust and rapport to
explore difficult or sensitive issues, or to engage
with marginalized or difficult-to-reach groups.
For example, issues such as corruption and other
forms of illicit behaviour are notoriously difficult to
capture through surveys, but can be effectively
explored – although not measured – using qualita-
tive approaches.
Qualitative methods can help build an understand-
ing of behaviours and of the relationship between
different variables. For example, they can be used
to explore patterns of behaviour (such as the uptake
Box 10.1 Three important techniques in qualitative research
Individual interview. This is a generic term to describe interviews of a qualitative nature. The interviewer
has a choice to follow a structured, semi-structured or unstructured approach. A qualitative individual
interview differs from a quantitative interview in that it leaves the answers open and registers them as text,
whereas in quantitative surveys the response options are mostly precoded.
Focus group discussions. Group discussions where the participants are asked to discuss specific topics
openly. They tend to be semi-structured or unstructured in nature.
Ethnography and participant observation. Data collection in which the researcher is immersed in a
social setting for some time in order to observe and listen with a view to gaining an appreciation of the
culture and processes of the group.

Understanding health workforce issues: a selective guide to the use of qualitative methods
131
of rural service of health workers with different socio-
economic and demographic profiles) or the nature
of a relationship between different measurable var-
iables (such as education and external migration).
Through purposive selection of either individual
interviewees or focus group participants, qualitative
methods can elucidate differences in views and per-
spectives between and within groups, and explore
the reasons for these differences.
Inevitably, the merits of qualitative methods come at a
cost. Clearly, one of the limitations of qualitative data
is that they cannot be easily described and summa-
rized. As a result, it is difficult to make statements about
the magnitude and relative importance of phenomena
addressed in qualitative work. More importantly, per-
haps, respondents in qualitative work tend to be small
in number and purposively selected. This means that
findings cannot be meaningfully thought of as repre-
sentative of or generalizable to a broader population.
Another potential limitation is the relatively weak objec-
tivity that results from the close involvement of the
researcher in the collection of the data and the interac-
tive nature of data collection. This feature of qualitative
methods also means that qualitative work is difficult to
replicate, either by a different researcher or in a dif-
ferent context. While these weaknesses of qualitative
methods are at least to some extent inherent in the
approach, they can be partially overcome through
careful design and implementation, and through trans-
parent documentation of methods and approaches
(see section 10.3 below).
The strengths and weaknesses of qualitative methods
explain the appeal of combining qualitative with quanti-
tative research, as the two complement each other very
well. Several authors have tried to capture the differ-
entiating features of the two methods in powerful and
easy-to-understand images and concepts. These fea-
tures, as reported in Table 10.1, are generalizations and
do not necessarily hold in every case; nevertheless
they are helpful and underline that qualitative research
can, for example, be very useful where theory is weak
or inexistent to fine-tune hypotheses that can be tested
with quantitative data or to better understand findings
from quantitative research (15–17). Moreover, by dem-
onstrating how stakeholders perceive and discuss a
policy or phenomenon, and by identifying responses
and behaviours that a policy is likely to engender,
qualitative methods may support the development of
questionnaires for quantitative surveys (2, 12, 15, 18,
19).3
Reflecting the strengths and weaknesses outlined
above, qualitative methods have been used exten-
sively in health systems research, including in efforts
to understand health-seeking behaviour, identify com-
munity health needs, assess health-care quality and
client satisfaction, and develop programmes for hard-
to-reach groups (for example sex workers or people
who use injecting drugs). It is not surprising, therefore,
to find a substantial and rapidly growing body of quali-
tative work on health workforce issues.
10.2.3 Qualitative health worker researchThe field of health worker research is relatively young.
An important consequence of this is that there is little
theoretical framework to study health worker behav-
iour. Existing quantitative studies, although booming
in number, therefore remain largely descriptive in
3 For more on combing qualitative and quantitative
approaches, see Bryman (2), Holland and Campbell (12),
Hammersley (15) and Morgan (18). For resources and
ongoing discussion on the differences, complementarities
and tensions between the two approaches in poverty
research, see Centre for International Studies (19).
Table 10.1 Contrasting qualitative and quantitative approaches
Qualitative Quantitative
Words Numbers
Point of views of participants Point of view of researcher
Researcher close Researcher distant
Theory emergent Theory testing
Unstructured Structured
Contextual understanding Generalization
Rich, deep data Hard, reliable data
Meaning Behaviour
Tends to follow an inductive approach Tends to follow a deductive approach
Source: Adapted from Hammersley (15), Bryman (16) and Halfpenny (17).

Handbook on monitoring and evaluation of human resources for health
132
nature and can substantially benefit from a qualita-
tive approach. Qualitative research can for example
help to understand and categorize the complex envi-
ronment in which the health worker functions. It can
also assist in unravelling the motivation behind cer-
tain behaviours, and it can provide inputs on how to
improve the measurement of health worker perform-
ance. Researchers studying health worker behaviour
are increasingly aware of these and other potential con-
tributions of a qualitative approach, as is clear from the
increasing number of studies on health workers using
this approach.
Table 10.2 illustrates how qualitative research has been
used in a variety of ways to address a broad set of
health workforce issues, ranging from broad diagnos-
tic exercises that have sought to explore the motivation
and behaviour of health professionals in the workplace
and labour market, to more focused studies of specific
phenomena such as dual practice or migration. Most
studies have focused on issues that are poorly under-
stood or difficult to measure in a quantitative way. This
includes, for example, health worker performance and
motivation, corruption and the relationship between
providers and clients of health services. The major-
ity of studies use individual qualitative interviews or
focus group discussions, or both. Participant obser-
vation has had more limited use, possibly because of
the private nature of the relationship between health-
care professionals and their patients. However, a good
example of what can be obtained from this method is
offered by Jaffré and Olivier de Sardan (20), who com-
bine participant observation with site visits, structured
interviews and focus group discussions in their sem-
inal study of doctor–patient relationships in five West
African countries.
In some cases, qualitative studies are implemented as
a complement to quantitative research, either to under-
stand puzzles thrown up by the quantitative research or
in preparation of quantitative research. Box 10.2 gives
an illustration of how qualitative research can help to
prepare quantitative analysis.
Although qualitative work on health workforce issues
has generated a lot of insights already, there is plenty
of scope for further work. This includes the exploration
of similar issues to those highlighted in Table 10.2 in
different contexts, and the use of qualitative methods
to better understand a broader set of labour market
issues in the health sector. This issue will be revisited in
the concluding section of the chapter.
10.3 Issues in the design and implementation of a qualitative studyWhile the former section outlined the value and potential
uses of qualitative methods in health worker research,
Box 10.2 Qualitative research to inform quantitative work: absenteeism in Ethiopia and Rwanda
To date, most of the work on absenteeism has been quantitative in nature, testing specifications derived
from standard economic theory. When applied to health workers, the work is usually explorative in
nature. An important reason is that the existing theoretical frameworks on absenteeism seem to be less
appropriate to study human resources in the health sector, especially in developing countries.
To address this issue, two qualitative studies were implemented in Ethiopia and Rwanda, using focus
group discussions sharing a similar design. These studies were labelled pre-research, as their main
purpose was to provide inputs for future quantitative work. Financial support for their implementation was
provided by the World Bank, the Bill & Melinda Gates Foundation and the Norwegian Government.
The studies confirmed that existing theory falls short of providing an appropriate framework for analysing
absenteeism among health workers in these two countries. The focus group discussions suggest that the
theoretically predicted correlates of absenteeism (wages, contracted working hours and expected cost of
detection) affect absenteeism as indicated by theory, but that their relative importance seem to depend
on the country context. The studies also indicate that additional factors, such as access to a second
job, intrinsic motivation, job mobility and perceived health risks, play an important role in explaining
absenteeism levels. This then argues for revisiting theory and empirical estimation to take this broader set
of determinants into account.
Source: Adapted from Serneels, Lindelow and Lievens (42).

Understanding health workforce issues: a selective guide to the use of qualitative methods
133
Topic Focus of studies Approach Reference
Coping strategies Study of informal economic activities of health workers in Uganda, including the leakage of medicine supply, informal charging of patients, and mismanagement of revenues raised from the formal charging of patients
Combined quantitative and qualitative approach
McPake et al. (21)
Assessment of extent of and reasons for drug pilfering by health staff in Mozambique and Cape Verde
Mix of open- and closed-ended questions in self-administered survey to small, purposively selected sample
Ferrinho et al. (22)
Study of role of professional identity, motivation and other factors in understanding survival strategies in response to health system reforms in Uganda
Qualitative in-depth interviews and focus group discussions in four purposively selected facilities
Kayaddondo and Whyte (23)
Exploration of how health workers in Cameroon cope with salary cuts, and of the impact of coping strategies on service quality
Key informant interviews and focus group discussions and interviews with service users
Israr et al. (24)
Dual practice Exploration of how financial and non-financial incentives shape job preferences of doctors in Bangladesh who work both in government health services and in private practice
Quantitative survey combined with in-depth interviews for a subsample
Gruen et al. (25)
Exploration of supplementary income-generating activities of public sector doctors in the Portuguese-speaking African countries, and of reasons why they have not made a complete move out of public sector
Mix of open- and closed-ended questions in self-administered survey to small, purposively selected sample
Ferrinho et al. (26)
Exploration of nature of dual practice in Peru, including key factors that influence individual decisions to engage in dual practice
Semi-structured interviews with purposively selected health workers
Jumpa et al. (27)
Informal charging and corruption
Investigation of out-of-pocket payments for health services, formal and informal, in Georgia
In-depth interviews and focus group discussions with users and providers
Belli, Gotsadze and Shahriari (28)
Motivation Exploration of a broad range of motivational determinants and outcomes in two hospitals in Jordan and two in Georgia
Contextual analysis, qualitative assessment and quantitative analysis
Franco et al. (29)
Assessment of key motivating factors for health workers and managers in Viet Nam
Focus group discussions, in-depth interviews and exit interviews
Dieleman et al. (30)
Assessment of the role of non-financial incentives and professional ethos in motivating health workers in Benin and Kenya
Semi-structured interviews with doctors and nurses from public, private and nongovernmental facilities in rural areas
Mathauer and Imhoff (31)
Deployment and retention
Exploration of barriers to recruitment and retention of nurses in New York State, United States of America
Focus group discussions Brewer et al. (32)
Table 10.2 Illustrations of qualitative research on health workers
Continues…

Handbook on monitoring and evaluation of human resources for health
134
this section addresses the major practical challenges
in design and implementation. Its focus is on interviews
and discussions (terms that are used interchangeably
in this chapter, abstracting from the concept whereby
free interaction is allowed in each). A third technique
previously described, ethnography and participant
observation, is rarely applied in health workforce
research and so is not elaborated here as it requires
a more specific methodology and different skills. The
references cited in footnote 1 of this chapter provide
further comprehensive guidance on techniques and
methods.
10.3.1 What type of interview?One of the first issues that will need consideration is
whether interviews will be conducted with individuals or
with groups of individuals. The key difference between
individual and group interviews lies in the interaction
between group members. Group discussions, which
typically take place in groups ranging from four to nine
people, allow researchers to elicit a multitude of views
on a topic and explore and contrast the opinions of dif-
ferent participants. They also allow the researcher to
collect data on a large range of behaviours in a relatively
short timespan. One of the risks with group discussions
is that some individuals dominate the discussion, while
other participants refrain from expressing their ideas
because they are not in line with the prevailing view.
This may lead to a “false” consensus.
The advantage of individual (or face-to-face) interviews
is that they offer more room for clarification and expan-
sion of the discussion with each individual. The safe
and private environment is also more likely to create an
atmosphere of trust and openness, which also makes it
Topic Focus of studies Approach Reference
International migration
Understanding the reasons for out-migration from the health sector in Malawi
In-depth interviews and focus group discussions
Muula and Maseko (33)
Understanding the motives and experiences of Indian migrant health workers to hospitals in the United Kingdom
In-depth interviews over a six-month period
Robinson and Carey (34)
Experiences of migrant nurses in hospitals in the United Kingdom
In-depth interviews Hardill and MacDonald (35)
Perceptions and opinions of those involved in recruitment and migration from developing countries
In-depth interviews with hospital directors and overseas nurses
Troy, Wyness and McAuliffe (36)
Quality/practice patterns
Exploration of how organizational issues, professional insecurities, and other factors contribute to patient neglect and poor clinical management in South Africa
Minimally structured in-depth interviews and focus group discussions held with patients and staff
Jewkes, Abrahams and Mvo (37)
Stocktaking and analysis of poor quality of care in five capital cities of West African countries
Participant observation combined with in-depth interviews, site visits and focus group discussions
Jaffré and Olivier de Sardan (20)
Assessment of changes in prescription patterns and quality of care associated with introduction of user fees in Ghana
In-depth interviews and focus group discussions
Asenso-Okyere et al. (38)
Broad diagnostic exercises
Exploration of experiences of health workers in primary health care in Tanzania in terms of motivation, satisfaction, frustration
Focus group discussions and in-depth interviews
Manongi, Marchant and Bygbjerg (39)
Exploration of performance and labour market issues for doctors and nurses in Ethiopia
Key informant interviews and focus group discussions with nurses, doctors and service users
Lindelow and Serneels (40)
Exploration of performance and labour market issues for doctors and nurses in Rwanda, including a focus on career and performance in the face of HIV
Focus group discussions with providers and users of health services and with people living with HIV
Lievens and Serneels (41)
Table 10.2 continued from previous page…
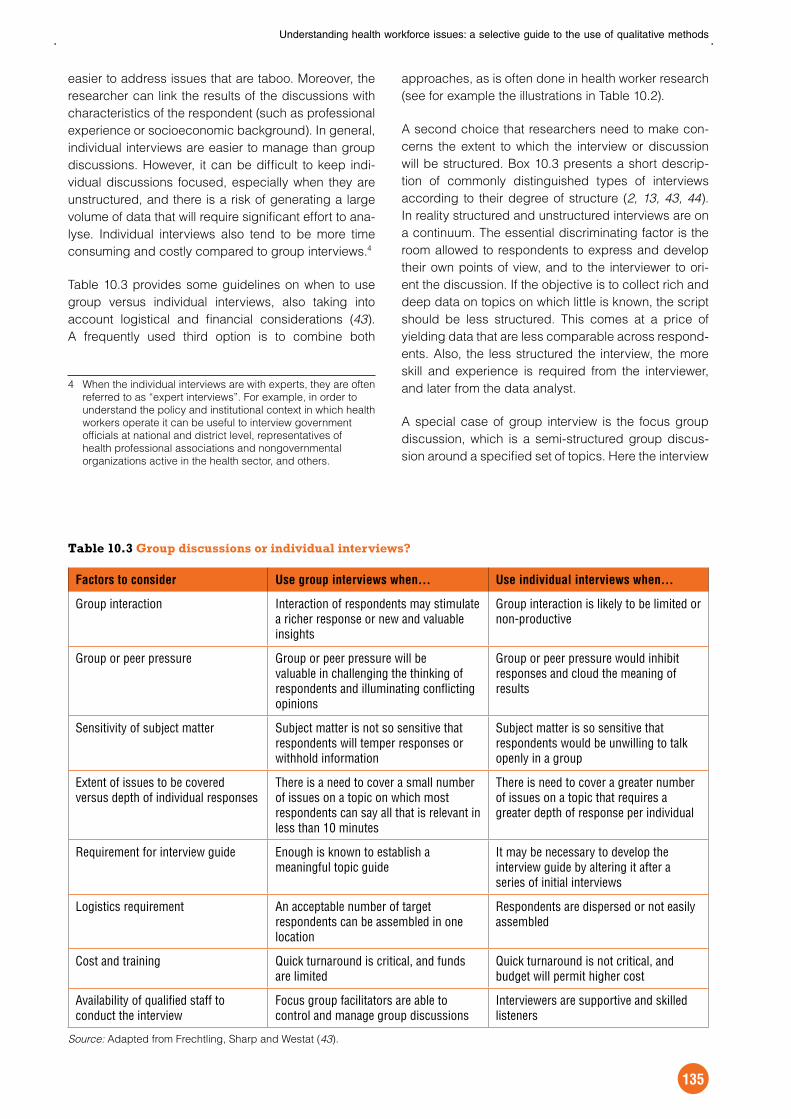
Understanding health workforce issues: a selective guide to the use of qualitative methods
135
easier to address issues that are taboo. Moreover, the
researcher can link the results of the discussions with
characteristics of the respondent (such as professional
experience or socioeconomic background). In general,
individual interviews are easier to manage than group
discussions. However, it can be difficult to keep indi-
vidual discussions focused, especially when they are
unstructured, and there is a risk of generating a large
volume of data that will require significant effort to ana-
lyse. Individual interviews also tend to be more time
consuming and costly compared to group interviews.4
Table 10.3 provides some guidelines on when to use
group versus individual interviews, also taking into
account logistical and financial considerations (43).
A frequently used third option is to combine both
4 When the individual interviews are with experts, they are often
referred to as “expert interviews”. For example, in order to
understand the policy and institutional context in which health
workers operate it can be useful to interview government
officials at national and district level, representatives of
health professional associations and nongovernmental
organizations active in the health sector, and others.
approaches, as is often done in health worker research
(see for example the illustrations in Table 10.2).
A second choice that researchers need to make con-
cerns the extent to which the interview or discussion
will be structured. Box 10.3 presents a short descrip-
tion of commonly distinguished types of interviews
according to their degree of structure (2, 13, 43, 44).
In reality structured and unstructured interviews are on
a continuum. The essential discriminating factor is the
room allowed to respondents to express and develop
their own points of view, and to the interviewer to ori-
ent the discussion. If the objective is to collect rich and
deep data on topics on which little is known, the script
should be less structured. This comes at a price of
yielding data that are less comparable across respond-
ents. Also, the less structured the interview, the more
skill and experience is required from the interviewer,
and later from the data analyst.
A special case of group interview is the focus group
discussion, which is a semi-structured group discus-
sion around a specified set of topics. Here the interview
Table 10.3 Group discussions or individual interviews?
Factors to consider Use group interviews when… Use individual interviews when…
Group interaction Interaction of respondents may stimulate a richer response or new and valuable insights
Group interaction is likely to be limited or non-productive
Group or peer pressure Group or peer pressure will be valuable in challenging the thinking of respondents and illuminating conflicting opinions
Group or peer pressure would inhibit responses and cloud the meaning of results
Sensitivity of subject matter Subject matter is not so sensitive that respondents will temper responses or withhold information
Subject matter is so sensitive that respondents would be unwilling to talk openly in a group
Extent of issues to be covered versus depth of individual responses
There is a need to cover a small number of issues on a topic on which most respondents can say all that is relevant in less than 10 minutes
There is need to cover a greater number of issues on a topic that requires a greater depth of response per individual
Requirement for interview guide Enough is known to establish a meaningful topic guide
It may be necessary to develop the interview guide by altering it after a series of initial interviews
Logistics requirement An acceptable number of target respondents can be assembled in one location
Respondents are dispersed or not easily assembled
Cost and training Quick turnaround is critical, and funds are limited
Quick turnaround is not critical, and budget will permit higher cost
Availability of qualified staff to conduct the interview
Focus group facilitators are able to control and manage group discussions
Interviewers are supportive and skilled listeners
Source: Adapted from Frechtling, Sharp and Westat (43).

Handbook on monitoring and evaluation of human resources for health
136
script is mainly used as a memory support and the
main technique is to prompt and probe the partici-
pants. Prompt questions aspire to open the discussion
on a topic in a neutral way, providing an input without
imposing preset ideas, while probing is used to trigger
deeper responses.
Writing out the complete script is good practice since it
allows full transparency about the research design. Box
10.4 shows an extract of a script for focus group dis-
cussions with health workers in Ethiopia.5 It starts with
a prompt stating the potential of performance problems
among health workers and then probes on the issues
of motivation, time use, labour market institutions and
corruption. As the script served mostly as a check-
list the topics were usually discussed when they came
up, but the script helped to guide the discussion and
to generate deeper data (the prompts were informed
by a brief preparatory literature review). Other classic
probing and prompting techniques – such as remain-
ing silent, repeating the question, repeating the last few
words from a discussant, offering an example as well
as asking for an example, requesting a clarification or
more detail – were also used, though they are not visi-
ble in the script.
5 The full script, which is available upon request, contained the
following sections (with aspired time allocation in brackets
in minutes): Introduction and warm up (10’); Professional
training, recruitment and career paths (30’); Contracts,
compensation, benefits and outside economic activities (20’);
Job satisfaction, motivation, and performance (30’); Impact
of HIV/AIDS (10’); Coaching other people (10’); and Thanks,
payment and signature (10’).
Another benefit of writing out the complete script is that
it facilitates the reproduction of the interviews, which
may be of interest in order to contrast findings from dif-
ferent contexts. For example, using a similar script and
research design, health workers in Ethiopia were willing
to discuss corrupt practices such as absenteeism, illicit
charging, embezzlement of materials, pilfering of drugs
and holding a private practice within the public sector,
while in contrast, health workers in Rwanda were more
reluctant to acknowledge these malpractices. However,
after further probing, health workers admitted that
there were corrupt practices, but that these were usu-
ally small scale, that they did not occur frequently and
that they had become less common than in the past.
Some illustrative quotes are reported in Box 10.5. The
comparative analysis indicates that corrupt practices
are less pervasive in Rwanda than in Ethiopia and the
data also offer explanations why this is the case. The
health system in Rwanda provides better monitoring
and accountability (by involving community workers in
the management of health facilities, for example), is in
the process of adopting performance pay (which also
stimulates reciprocal monitoring) and provides better
enforcement of sanctions.
10.3.2 Participant selectionIn contrast to quantitative research, where represent-
ativeness is the main concern for sample design, the
main objective of participant selection in qualitative
research is to include individuals that are well informed
about an issue, and have a broad range of views and
experiences. This contributes to qualitative interviews
Box 10.3 Types of qualitative interviews according to their degree of structure
Structured or standardized interview. This type of interview uses a script that typically contains a number
of predetermined questions that are presented to the interviewee one after the other. Since all interviewees
are given identical cues, their answers can be reliably aggregated, which is often the main objective of the
technique. Data for quantitative analysis can also be collected, especially if the answers to the questions
are precoded.
Semi-structured interview. This term covers a wide range of cases but mostly refers to interviews where
the script contains a series of questions that, in contrast to structured interviews, can change sequence;
the interviewer also tends to have some latitude to ask further questions in response to what are seen
as significant replies. The answers are open ended and there is more emphasis on the interviewee
developing arguments.
Unstructured interview. The interviewer typically has only a list of topics or issues, often called an
interview guide or aide-memoire, that he or she expects to cover in the interview. The style of questioning
is usually informal and the phrasing and sequencing of questions will vary from interview to interview.
Sources: Adapted from Bryman (2), Denscombe (13), Frechtling, Sharp and Westat (43) and Atkinson (44).

Understanding health workforce issues: a selective guide to the use of qualitative methods
137
being informative and generating rich data (2, 13).
Selecting the participants for group discussions raises
additional issues related to group size, the number of
groups, within-group dynamics and the desired variety
in participant profiles within a group.
The choice of group size depends on the extent to
which one aspires to have an animated discussion ver-
sus an intimate exchange. Discussions in larger groups
are often more animated, while small groups may be
more conducive to discussions about sensitive topics.
Box 10.4 Extract of semi-structured interview script of qualitative health worker study in Ethiopia and Rwanda
JOB SATISFACTION, MOTIVATION AND PERFORMANCE
Time allocated: 30’ Time started: ……
Prompt:
In many countries, users complain about health services. For example, there are often complaints that
health workers are not very motivated, that they do not spend as much time as they should doing their
job, that they are not good at doing their job, and even sometimes that they are involved in illegal activities
such as stealing drugs and material and charging too much for services. How do you feel that the situation
is in Ethiopia?
Let’s start with the issue of motivation…
Issues to probe
Do you think most health workers are satisfied with their job?
Why do you think some health workers are unsatisfied in their job?
payment, lack of equipment
Do you feel that there is a strong commitment to delivering good health care?
What do you think is the most important source of motivation for health workers?
money and benefits
the activities and responsibilities of the job
Do you think the commitment of health workers is different in different sectors (private, for-profit, not-for-
profit)? Why?
(…)
Let’s turn to corruption and inappropriate behaviour …
Issues to probe
To what extent do you feel there is a problem of corruption in the health sector?
use of equipment for private purposes
overcharging
stealing/leakage of drugs and other material
Why do you think these problems arise?
What is done in your workplace to reduce these problems?
What sort of disciplinary measures are available and are they being used?
Source: From the authors.

Handbook on monitoring and evaluation of human resources for health
138
For reasons of comparability and transparency it is
advisable to use groups of similar size throughout the
study.
The number of groups should be such that all partic-
ipants that have well-informed and different views on
the subject are included. Alternatively, groups can be
added until responses can be fairly well predicted.
However, this may not be realistic since the number
of focus groups is often fixed during the study design.
Another issue is within-group homogeneity. Status
homogeneity is for example a common concern, as
the interaction between participants of a very differ-
ent social status may be less productive. In the case
of health workers it seems advisable to have separate
groups for different cadres. This point is of particular
importance for research that addresses sensitive issues
such as absenteeism, pilfering or other illicit behaviour.
Workers that are in a hierarchical relationship are likely
to be uncomfortable about openly sharing their views
(for example nurses with doctors).
A final question is how within-group dynamics can be
assured and how much variety of opinion is wanted
within a group. To ensure constructive group dynam-
ics, participants should, as a rule, not know each other.
However, the opposite has been argued when there
is a taboo regarding the topic under discussion, mak-
ing an open discussion between participants that do
not know each other uncomfortable. Kitzinger (45), for
example, studying HIV, deliberately selected people
who knew each other in order to have a discussion that
was “as natural as possible”. A potential problem with
this approach is that assumptions commonly shared
between participants are often not made explicit (18).
When the aim of the research is to explore an issue,
the richest data come from discussions where differ-
ent points of view are confronted. A good way to ensure
variety of opinion among the participants is to pay spe-
cial attention to the selection of the participants. For a
study of health worker performance and career choice,
for instance, it may be useful to consider such potential
influences as gender, age, family status (having chil-
dren or not), sector of work (public, private for-profit,
faith-based) and work activities (for example having
two or more jobs). Box 10.6 reproduces the selection
sheet for nurses and midwives used in Ethiopia. Similar
sheets were compiled for doctors, assistant nurses and
users of health services.
The same approach can be used for individual inter-
views. Once the criteria and characteristics for
selection are determined, the participants are selected
using these criteria. In this case the richness of the data
comes from contrasting during the analysis the opin-
ions of the individuals with a different background.
10.3.3 Study design and data collection: how to enhance validity and reliabilityThe ways in which data are collected and analysed
affect the study findings. There is now a rich literature
on how best to deal with issues of validity and reliability
Box 10.5 Selected quotes from qualitative interviews in Ethiopia and Rwanda
Corruption came and spread widely in the
last ten years. Now corruption is prevalent
among people at all levels of education and
in all areas.
—Medical officer in a provincial town in Ethiopia
I have worked in a private pharmacy. Drugs
come illegally and we know their source…
they are taken from public facilities.
—Health-care assistant in a provincial town
in Ethiopia
Low-paid staff might be involved in small
bribes… There is some humanity in this and
assisting it is okay because people working in
other service institutions such as water supply
have the benefit of charging for free services.
—Physician in Addis Ababa, Ethiopia
It happened that patients paid more than was
reported in the register but we identified most
of these cases. I also know that some have
been sacked because there was fraud in the
payment register.
—Auxiliary health worker in Kigali, Rwanda
I have seen a patient give 1000 francs to a
nurse. The nurse was frightened, which shows
that it is not regular practice.
—Health service client in Kigali, Rwanda
Health workers do no longer sell drugs taken
from the health centre. This is something from
the past. Perhaps in rural areas, but not here in
the city.
—Health service client in Kigali, Rwanda
Source: From the authors.
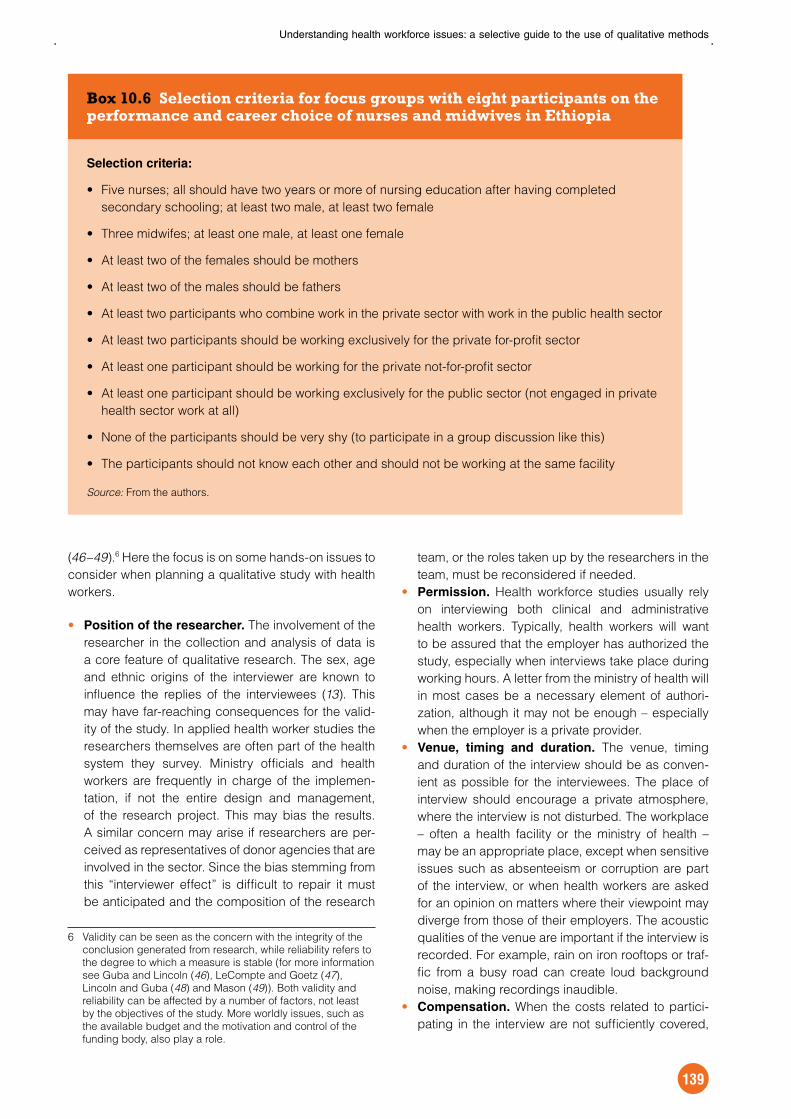
Understanding health workforce issues: a selective guide to the use of qualitative methods
139
(46–49).6 Here the focus is on some hands-on issues to
consider when planning a qualitative study with health
workers.
Position of the researcher. The involvement of the
researcher in the collection and analysis of data is
a core feature of qualitative research. The sex, age
and ethnic origins of the interviewer are known to
influence the replies of the interviewees (13). This
may have far-reaching consequences for the valid-
ity of the study. In applied health worker studies the
researchers themselves are often part of the health
system they survey. Ministry officials and health
workers are frequently in charge of the implemen-
tation, if not the entire design and management,
of the research project. This may bias the results.
A similar concern may arise if researchers are per-
ceived as representatives of donor agencies that are
involved in the sector. Since the bias stemming from
this “interviewer effect” is difficult to repair it must
be anticipated and the composition of the research
6 Validity can be seen as the concern with the integrity of the
conclusion generated from research, while reliability refers to
the degree to which a measure is stable (for more information
see Guba and Lincoln (46), LeCompte and Goetz (47),
Lincoln and Guba (48) and Mason (49)). Both validity and
reliability can be affected by a number of factors, not least
by the objectives of the study. More worldly issues, such as
the available budget and the motivation and control of the
funding body, also play a role.
team, or the roles taken up by the researchers in the
team, must be reconsidered if needed.
Permission. Health workforce studies usually rely
on interviewing both clinical and administrative
health workers. Typically, health workers will want
to be assured that the employer has authorized the
study, especially when interviews take place during
working hours. A letter from the ministry of health will
in most cases be a necessary element of authori-
zation, although it may not be enough – especially
when the employer is a private provider.
Venue, timing and duration. The venue, timing
and duration of the interview should be as conven-
ient as possible for the interviewees. The place of
interview should encourage a private atmosphere,
where the interview is not disturbed. The workplace
– often a health facility or the ministry of health –
may be an appropriate place, except when sensitive
issues such as absenteeism or corruption are part
of the interview, or when health workers are asked
for an opinion on matters where their viewpoint may
diverge from those of their employers. The acoustic
qualities of the venue are important if the interview is
recorded. For example, rain on iron rooftops or traf-
fic from a busy road can create loud background
noise, making recordings inaudible.
Compensation. When the costs related to partici-
pating in the interview are not sufficiently covered,
Box 10.6 Selection criteria for focus groups with eight participants on the performance and career choice of nurses and midwives in Ethiopia
Selection criteria:
Five nurses; all should have two years or more of nursing education after having completed
secondary schooling; at least two male, at least two female
Three midwifes; at least one male, at least one female
At least two of the females should be mothers
At least two of the males should be fathers
At least two participants who combine work in the private sector with work in the public health sector
At least two participants should be working exclusively for the private for-profit sector
At least one participant should be working for the private not-for-profit sector
At least one participant should be working exclusively for the public sector (not engaged in private
health sector work at all)
None of the participants should be very shy (to participate in a group discussion like this)
The participants should not know each other and should not be working at the same facility
Source: From the authors.

Handbook on monitoring and evaluation of human resources for health
140
there is a risk that participants may not show up or
may not be participative. Too much compensation,
on the other hand, may induce strategic behav-
iour, such as trying to please the interviewer with
the responses. As a minimum, the cost of trans-
port to get to the interview should be reimbursed.
For additional payments it is advisable to seek guid-
ance from local practitioners. For example, against
a backdrop of perceived insufficient salaries, many
health workers are accustomed to receiving finan-
cial incentives for taking part in seminars, training
and research. Alternatively, financial incentives can
be substituted or complemented by non-financial
rewards such as food, drinks or gifts. These may
also contribute towards relaxing the atmosphere and
offering a drink at the beginning of the interview can
help to bridge the waiting time until all participants
have arrived. Whatever is decided, it is important to
inform the participants about the modalities before
the interview takes place.
Confidentiality. Anonymity and confidentiality are
important because they may have an impact on the
openness of the respondents. If participants sus-
pect that their answers can be traced back to their
person in the final study results, they are less likely
to speak their mind. Therefore, warranting confiden-
tiality and anonymity is usually key to the collection
of quality data. As an illustration, Box 10.7 reprints
an extract of a script containing the introduction
for a focus group discussion with health workers in
Rwanda. The reimbursement modalities for travel
expenses and the financial reward for taking part in
the study had been dealt with prior to the interview
Box 10.7 Extract from the introduction to focus group participants in Rwanda
Good afternoon. First of all we would like to thank you very much for your willingness to cooperate in this
group discussion. The aim of the discussion is to get a better idea of the human resources in the health
sector in Rwanda and to investigate what the problems and opportunities are for health workers. The
discussion today is part of a larger study that looks at a human resources policy for health workers in
Rwanda. The study is financed by the World Bank and approved by the Ministry of Health. If you wish, we
can read you the letter of approval by the Secretary-General.
The immediate objective of our meeting is to hear from health workers themselves how they look at
different aspects relating to their work. We would like to have an open and honest discussion with you
about different aspects of working in the health sector. We are here to listen to you and learn from you.
The discussion will go as follows. [Name] and I will lead the discussion. We prepared a number of topics
on which we will ask your opinion.
It is very important that you feel no restraints to speak your mind. Be as open, direct and sincere as you
can. The statements you make should be based on real-life experiences and observations. It is important
to us to know how the situation really is and not how the situation ought to be. Do say if you feel you don’t
agree with what someone else is saying.
Importantly, we would like to stress that your personal contributions and views will not be shared with
anyone outside this room. To guarantee the anonymity of participation in this discussion, we will not take
your name down. We will also have a number of other discussions, so your view will be balanced out with
what others say.
Also note that the discussion will be recorded. This is because we do not want to miss anything of what
you say. However, nothing of what you say will ever be made public with any of your names attached. The
results will only be written down as the report of a discussion with “a selected group of health workers”.
Lastly, the discussion is estimated to last approximately two hours and you will receive a compensation for
your travel, time and cooperation at the end of the discussion.
Are there any questions or remarks?
Source: From the authors.
Understanding health workforce issues: a selective guide to the use of qualitative methods
141
by a third person specifically dealing with partici-
pant selection.
Interview skills. As the researcher takes active
part in the production and analysis of the qualitative
data, the more so the less structured the interview
script, the quality of a study is greatly determined
by the experience, skill and insight of the modera-
tor. Apart from mastering discussion management
techniques, familiarity with the topic under study is
a necessary condition for generating high-quality
data (see for example Hurley (50)).
10.3.4 Data recording and analysisThe most common options when it comes to record-
ing data are note taking and audio recording. Notes
can be taken during or after the interview, with the lat-
ter being less intrusive. However, since the data then
depend entirely on the researcher’s memory, which is
typically subject to bias and partial recall, audio record-
ing (with the agreement of the participants) is the most
commonly used technique.7 An alternative approach
is to record the interview on video. Although this tech-
nique may provoke unease with the participants at the
beginning, the negative impact on openness and sin-
cerity often disappears once the discussion is under
way. An advantage of video recording is that it allows
linking the responses to individual characteristics. Data
embedded in images can also be creatively used, for
example to determine the degree of patient-centered-
ness of a medical practitioner. Both video and audio
recording allow that the raw data can be made avail-
able to other researchers. However, this raises the
question whether researchers can maintain their com-
mitment to anonymity and confidential treatment of the
data. The increasing possibilities to copy and trans-
fer digital data files require that safeguards over and
above conventional measures must be put in place,
such as protecting files with passwords and requesting
colleague researchers to provide written guarantees
of participants’ anonymity. The base policy to safe-
guard confidentiality is to make the data anonymous
by using unique numerical identifiers that refer to a sep-
arate database containing personal information so that
data analysts have no automatic access to participants’
identities.
7 Even in the case of audio recording the researcher often
takes notes during the interview, either to help guide the
discussion or to capture additional information – for example,
embedded in the body language and facial expression of the
interviewees.
Once the data are video or audio recorded, the inter-
views are transcribed literally8 and, if necessary,
translated.9 This written version of the interview is
needed for in-depth analysis, and can be used for soft-
ware-supported analysis, which will be discussed in
more detail below. Whether the analysis is done man-
ually or with the help of specialized software, the basic
approach is the same.
In a first step the analyst identifies key themes in the
transcripts, focusing on issues that are mentioned fre-
quently or consistently, that receive particular emphasis
or for which views expressed in the interviews diverge
in a systematic way. This is typically done by writing
codes (referring to themes) next to the transcribed text
and comparing them visually. The researcher compares
groups of coded text by leafing through the transcripts
and then brings together themes in main themes and
subthemes. The textual data are subsequently struc-
tured in matrices, with a different column for each focus
group or individual, and rows for the different themes
and subthemes. When assisted by a word processing
programme the matrices can be created by moving
the text from the transcripts using cut and paste. The
advantage of the matrix approach is that it facilitates
comparison across as well as within groups or individ-
uals, while avoiding excessive structure. It also allows
emergence of issues and opinions as expressed by
the participants, without too much interpretation from
the researcher(s). Box 10.8 contains an extract from a
matrix-based analysis of data collected through focus
group discussions in Ethiopia. The matrix contains
quotes from three different occupational groups relat-
ing to their views on the public sector.
If the data are analysed with the help of specialized
software, the first step is to provide the data from each
interview with an identifying composite label (for exam-
ple “Urban doctors Ethiopia” corresponding to the
heading of the last column in the matrix presented in
Box 10.8). The next step is to attribute at least one, but
typically more than one, code to each coherent part
of text, or entire quote (these codes correspond to the
themes and subthemes in the matrix approach).
8 Today’s digital recorders produce high-quality sound files that
can be played on a computer, facilitating the transcription
process. It is still most reliable to transcribe the interviews
manually, as existing software packages that transfer speech
to text perform best when tuned to one voice, and do not
seem sufficiently accurate to transcribe group discussions
or even individual interviews. Software packages are only
available in a limited number of languages, and there also
remain problems with recognizing specialized vocabulary.
9 Because there is a real risk that parts of the data get lost or
altered in the process of translation, accuracy is important.
This can for example be enhanced by back-translating the
text in order to expose deviations from the original.

Handbook on monitoring and evaluation of human resources for health
142
The advantage of a software-based analysis is imme-
diately clear, as it allows for more flexibility in the use
of codes. For example, it makes it easy to attach sev-
eral codes to the same quote, but also to revise any
hierarchical structure of the codes. The way codes are
conceived partly depends on whether the research
is exploratory, in which case open coding is used, or
whether it wants to test a theory, in which case the
researcher predominantly uses preconceived codes.
As in the manual approach, the codes are reorganized
throughout the analysis as insights in the data shape
up. The next phase in the research is then to identify
patterns between the coded data. Software-based
analysis is more flexible in that the coding is made
easier, and once the coding is finalized, the data can
be retrieved or combined in different ways using the
codes. It also allows for a more advanced degree of
analysis by looking at patterns in the data. Because
a quote can receive multiple codes, one can look at
the association between codes, or to what extent some
issues are raised together. A possible disadvantage is
the start-up cost related to learning the software. The
use of software for the analysis may therefore be less
attractive for stand-alone small-scale projects. Box
10.9 provides a practical example of a software-based
analysis.
Box 10.8 Matrix-based analysis of data from focus group discussions in Ethiopia
Health-care
assistants Nurses and midwives
Physicians and paramedical
practitioners
Perceptions
about the
public
sector
The main difference
between the public
and private is the
payment and the ability
of patients to pay for
the necessary medical
services.
The working condition
is not safe, medical
equipments and
supplies are lacking.
There are times
when staff is obliged
to sterilize gloves
for reuse while it is
disposed off in the
private facilities.
Medical supplies in the
government are very
inadequate.
(…)
I work in the public.
The payment does not
compensate enough for
the job we are working. In
the private facilities, the
payment is good and the
workload is not much. The
problem in the private, if
owners get an alternative
they will fire you and bring
in the other.
In the public services, we
provide service for the
mass of the population.
There are a lot of things
lacking. For workers, the
salary is not satisfactory. I
work in the private sector,
the payment is good.
The benefit package
such as pension, health
insurance and job
security are good reasons
for working in the public
facilities.
(…)
The present challenge for
the public sector is that
the staff has no incentives,
lack opportunity for career
development, etc.
The payment in the public
does not compensate well for
the physicians’ work. I would
not say that all are equally
affected by workload. My
experience is that workload
was not that much a problem.
I do not agree that in public
facilities there is very high
workload. In the private sector,
one can have a maximum of
three surgeries per day. The
problem is that one has to
come in time and go out in
time; there is good payment.
In addition to that, the number
of private institutions to
practice in is limited. Some
might not want to confront
being jobless. There is no
refined relationship between
the owner of facilities and the
rest of the profession due to
lack of experience.
(…)
Source: From the authors.

Understanding health workforce issues: a selective guide to the use of qualitative methods
143
To address the issues of reliability and validity of the
resulting analysis, the following actions can be taken:
As qualitative research is essentially concerned with
the viewpoints of the participants, the validity of the
study results can be increased by presenting the
results to the study participants and integrating their
feedback into the research output.
Writing up the underlying study assumptions and
contextual information helps readers and potential
users to assess the extent to which the research
results may be comparable to another context.
Internal reliability – or the degree to which other
researchers would come to the same conclusions
– can be enhanced by including an audit that exam-
ines the data collection and analysis procedures and
identifies potential sources of bias. A more intensive
approach is to have the same qualitative data coded
by different researchers, especially in the case of
free coding, and compare the obtained results.
10.3.5 ReportingBecause qualitative research deals with data in the
form of text, it can be a challenge to present the results
in a way that is easy to digest. It is tempting to provide
too many quotes in the final report and the golden rule
is therefore for the researcher to adopt only a small pro-
portion of the quotes he or she would like to include.
What may help is to compile a “summary of quotes”
document after the analysis but before reporting. This
can contain up to 10 quotes per theme, and may help
to select the most appropriate quotes to be used in
the final report and presentation. Quotes are typically
selected for their salience and because they reflect
an important theme in the discussion. More quotes do
not necessarily convince the reader more. In the final
report key quotes are either embedded in the text, or
put in boxes separate from the main text.
Another important issue in reporting qualitative research
is to dedicate some space to the description of the
techniques used. Being transparent and explicit about
the study method by including scripts and participant
selection sheets, flagging problems with implementa-
tion and describing how the analysis was carried out
all increase the readers’ confidence in the results; they
also make a replication of the study in another context
possible.
10.4 Summary and conclusionsThis chapter has argued that qualitative techniques
can play an important role in improving our under-
standing of health workforce challenges and policies.
Qualitative techniques are particularly well suited to
building an understanding of a complex environment
in order to generate and fine-tune hypotheses (that
can be tested by quantitative research), and to identify
and address measurement issues. These strengths are
reflected in a growing body of qualitative research on
health workers. Many studies combine different quali-
tative methods: the most commonly used approaches
are individual interviews and group discussions, while
a third approach, participant observation, is an option
but tends to be used less frequently. Many also serve
as a complement to a quantitative study, either to better
understand puzzles thrown up by quantitative research
or in preparation of a quantitative survey.
Box 10.9 Recording, transcription, coding and analysis: an illustration from a health worker study in Rwanda
Ten focus group discussions were conducted in the health worker study in Rwanda. They were digitally
recorded, generating one sound file per discussion. The files were transcribed, resulting in written
accounts of between 10 and 15 pages each. If the discussion had been in Kinyarwanda, it was translated
into French. The analysis was carried out using the qualitative data analysis software, QSR NVivo 2.0. Its
main advantage lies in ease of data coding and its functions enabling the visualization of different data
cross-sections. It does not enable, however, the production of an overview of the data in a matrix structure.
First, all transcripts were coded: a code was attributed to each piece of data (quote). A total of 35 codes
were used, reflecting the broad interest of the study. Examples of codes included vocation, rural versus
urban, health sector exit, job satisfaction, remuneration, absenteeism, corruption. A quote could receive
different codes if referring to different topics at the same time, thus allowing examination of associations
between quotes. In total, 1203 quotes have been examined.
Source: From the authors.

Handbook on monitoring and evaluation of human resources for health
144
The implementation of qualitative research is fraught
with a number of methodological and practical chal-
lenges. An important aim of the chapter has therefore
been to provide practical guidance on how to design
and implement qualitative work. An important mes-
sage in this regard is that obtaining high-quality data
requires careful preparation and implementation of the
study. Even though qualitative methods have inherent
weaknesses – most importantly the weak objectivity
following from the involvement of the researcher in the
production and interpretation of the data – these can to
a significant degree be contained in the design of the
study. Reporting the applied method in a transparent
way (for example including scripts, participant selec-
tion and method of analysis) increases the credibility
of study results, and is something that is still neglected
in many studies; it also allows replication of the stud-
ies in a different context. A second message is not to
consider qualitative research in isolation. Combining
different methodologies strengthens the validity of the
study results, and the high degree of complementarity
between qualitative and quantitative methods calls for
combining the two approaches.
The value of future qualitative research on human
resources for health will be judged by how much it
helps to redirect policies. For example, human resource
policies in the health sector have typically emphasized
a labour planning approach – relying on the assump-
tion that health workers are competent, motivated to
serve the public, but passive in their career choices.
Currently, health workers are increasingly considered,
like other professionals, as purposely reacting to incen-
tives from their environment, and trying to balance their
own happiness and that of their family with a concern for
patients. Research on health workers therefore increas-
ingly incorporates a labour market approach, using
more concepts and ideas from labour and personnel
economics, as illustrated by recent studies on job sat-
isfaction (51), women’s labour market participation (52)
and organizational design and decision-making (53),
and the growing interest in the economics discipline
in use of qualitative methods (see for example Bewley
(54)). Given the limited knowledge on health worker
labour markets, and given their complex institutional
setting, qualitative research techniques are bound
to be predominantly used in the early stages of this
new avenue in health workforce research. Qualitative
research that is sustained by careful design and robust
methods will be a powerful tool to support the devel-
opment of these and other strands of innovative health
workforce research.
References1. Becker HS. The epistemology of qualitative
research. In: Jessor R, Colby A, Shweder RA, eds.
Ethnography and human development: context and
meaning in social inquiry. Chicago, University of
Chicago Press, 1996.
2. Bryman A. Social research methods. Oxford, Oxford
University Press, 2001.
3. Bryman A, Burgess RG, eds. Analyzing qualitative
data. New York, Routledge, 1994.
4. Denzin NK, Lincoln YS, eds. The SAGE handbook
of qualitative research, 3rd ed. London, Sage
Publications, 2005.
5. Flick U, ed. The SAGE qualitative research kit.
Thousand Oaks, CA, Sage Publications, 2007.
6. Greene JC. Qualitative program evaluation: practice
and promise. In: Denzin NK, Lincoln YS, eds.
Handbook of qualitative research. Thousand Oaks,
CA, Sage Publications, 1994.
7. Seale C. Quality in qualitative research. Qualitative
Inquiry, 1999, 5(4):465–478.
8. Silverman D. Doing qualitative research: a practical
handbook, 2nd ed. London, Sage Publications,
2005.
9. Silverman D. Interpreting qualitative data, 3rd ed.
London, Sage Publications, 2006.
10. Walker R. Applied qualitative research. Aldershot,
Gower Publishing Company, 1985.
11. Wolcott HF. Writing up qualitative research, 3rd ed.
Thousand Oaks, CA, Sage Publications, 2008.
12. Holland J, Campbell J. Methods in development
research: combining qualitative and quantitative
approaches. Bourton Hall, IDTG Publishing, 2005.
13. Denscombe M. The good research guide: for small-
scale social research projects. Buckingham, Open
University Press, 1998.
14. Tesch R. Qualitative research: analysis types and
software tools. New York, Falmer Press, 1990.
15. Hammersley M. The relationship between qualitative
and quantitative research: paradigm loyalty versus
methodological eclecticism. In: Richardson JTE, ed.
Handbook of research methods for psychology and
the social sciences. Leicester, BPS Books, 1996.
16. Bryman A. Quantitative and qualitative research
strategies in knowing the social world. In: May
T, Williams M, eds. Knowing the social world.
Buckingham, Open University Press, 1998.
17. Halfpenny P. The analysis of qualitative data.
Sociological Review, 1979, 27(4):799–825.
18. Morgan DL. Practical strategies for combining
qualitative and quantitative methods: applications for
health research. Qualitative Health Research, 1998,
8(3):362–376.
19. Q-squared: combining qualitative and quantitative
approaches in poverty analysis. Centre for
International Studies (http://www.q-squared.ca/,
accessed 25 January 2009).
Understanding health workforce issues: a selective guide to the use of qualitative methods
145
20. Jaffré Y, Olivier de Sardan JP. Une médecine
inhospitalière: les difficiles relations entre soignants
et soignés dans cinq capitales d’Afrique de l’ouest.
Paris, Karthala, 2003.
21. McPake B et al. Informal economic activities of
public health workers in Uganda: implications for
quality and accessibility of care. Social Science and
Medicine, 1999, 49(7):849–865.
22. Ferrinho P et al. Pilfering for survival: how health
workers use access to drugs as a coping strategy.
Human Resources for Health, 2004, 2:4 (http://
www.human-resources-health.com/content/2/1/4,
accessed 25 January 2009).
23. Kyaddondo D, Whyte SR. Working in a decentralized
system: a threat to health workers’ respect and
survival in Uganda. International Journal of Health
Planning and Management, 2003, 18(4):329–342.
24. Israr SM et al. Coping strategies of health personnel
during economic crisis: a case study from
Cameroon. Tropical Medicine and International
Health, 2000, 5(4):288–292.
25. Gruen R et al. Dual job holding practitioners in
Bangladesh: an exploration. Social Science and
Medicine, 2002, 54(2):267–279.
26. Ferrinho P et al. How and why public sector doctors
engage in private practice in Portuguese-speaking
African countries. Health Policy and Planning, 1998,
13(3):332–338 (http://heapol.oxfordjournals.org/cgi/
reprint/13/3/332, accessed 25 January 2009).
27. Jumpa M, Jan S, Mills A. The role of regulation in
influencing income-generating activities among
public sector doctors in Peru. Human Resources
for Health, 2007, 5:5 (http://www.human-resources-
health.com/content/5/1/5, accessed 25 January
2009).
28. Belli P, Gotsadze G, Shahriari H. Out-of-pocket and
informal payments in health sector: evidence from
Georgia. Health Policy, 2004, 70(1):109–123.
29. Franco LM et al. Determinants and consequences
of health worker motivation in hospitals in Jordan
and Georgia. Social Science and Medicine, 2004,
58(2):343–355.
30. Dieleman M et al. Identifying factors for job
motivation of rural health workers in north Viet Nam.
Human Resources for Health, 2003, 1:10 (http://
www.human-resources-health.com/content/1/1/10,
accessed 25 January 2009).
31. Mathauer I, Imhoff I. Health worker motivation in
Africa: the role of non-financial incentives and
human resource management tools. Human
Resources for Health, 2006, 4:24 (http://www.
human-resources-health.com/content/4/1/24,
accessed 25 January 2009).
32. Brewer CS et al. Nursing recruitment and retention
in New York State: a qualitative workforce needs
assessment. Policy, Politics and Nursing Practice,
2006, 7(1):54–63.
33. Muula AS, Maseko FC. How are health professionals
earning their living in Malawi? BMC Health Services
Research, 2006, 6:97 (http://www.biomedcentral.
com/1472–6963/6/97, accessed 25 January 2009).
34. Robinson V, Carey M. Peopling skilled international
migration: Indian doctors in the UK. International
Migration, 2000, 38(1):89–108.
35. Hardill I, MacDonald S. Skilled international
migration: the experience of nurses in the UK.
Regional Studies, 2000, 34(7):681–692.
36. Troy PH, Wyness LA, McAuliffe E. Nurses’
experiences of recruitment and migration from
developing countries: a phenomenological
approach. Human Resources for Health, 2007,
5:15 (http://www.human-resources-health.com/
content/5/1/15, accessed 25 January 2009).
37. Jewkes R, Abrahams N, Mvo Z. Why do nurses
abuse patients? Reflections from South African
obstetric services. Social Sciences and Medicine,
1998, 47(11):1781–1795.
38. Asenso-Okyere WK et al. The behaviour of health
workers in an area of cost sharing: Ghana’s drug
cash and carry system. Tropical Medicine and
International Health, 1999, 4(8):586–593.
39. Manongi RN, Marchant TC, Bygbjerg IC. Improving
motivation among primary health care workers in
Tanzania: a health worker perspective. Human
Resources for Health, 2006, 4:6 (http://www.human-
resources-health.com/content/4/1/6, accessed 25
January 2009).
40. Lindelow M, Serneels P. The performance of
health workers in Ethiopia: results from qualitative
research. Social Science and Medicine, 2006,
62(9):2225–2235.
41. Lievens T, Serneels P. Synthesis of focus group
discussions with health workers in Rwanda. World
Bank Research Report. Washington, DC, World
Bank and Rwanda Ministry of Health, 2006.
42. Serneels P, Lindelow M, Lievens T. Qualitative
research to prepare quantitative analysis:
absenteeism among health workers in two African
countries. In: Amin S, Das J, Goldstein M, eds.
Are you being served? New tools for measuring
service delivery. Washington, DC, World Bank, 2008
(http://go.worldbank.org/F6KIIC0700, accessed 25
January 2009).
43. Frechtling J, Sharp Westat L, eds. User-friendly
handbook for mixed method evaluations. Arlington,
VA, National Science Foundation, 1997 (http://www.
nsf.gov/pubs/1997/nsf97153/start.htm, accessed 25
January 2009).
44. Atkinson R. The life story interview. Qualitative
Research Methods Series, volume 44. London, Sage
Publications, 1998.
45. Kitzinger J. Understanding AIDS: researching
audience perceptions of acquired immune
deficiency syndrome. In: Eldridge J, ed. Getting
the message: news, truth and power. London,
Routledge, 1993.
46. Guba EG, Lincoln YS. Competing paradigms in
qualitative research. In: Denzin NK, Lincoln YS, eds.
Handbook of qualitative research. Thousand Oaks,
CA, Sage Publications, 1994.

Handbook on monitoring and evaluation of human resources for health
146
47. LeCompte MD, Goetz JP. Problems of reliability
and validity in ethnographic research. Review of
Educational Research, 1982, 52(1):31–60.
48. Lincoln YS, Guba E. Naturalistic inquiry. Beverly
Hills, CA, Sage Publications, 1985.
49. Mason J. Qualitative researching, 2nd ed. London,
Sage Publications, 2002.
50. Hurley RE. Qualitative research and the profound
grasp of the obvious. Health Services Research,
1999, 34(5 part 2):1119–1136 (http://www.
pubmedcentral.nih.gov/picrender.fcgi?artid=108905
6&blobtype=pdf, accessed 25 January 2009).
51. Bitsch V, Hogberg M. Exploring horticultural
employees’ attitudes toward their jobs: a qualitative
analysis based on Herzberg’s theory of job
satisfaction. Journal of Agricultural and Applied
Economics, December 2005.
52. Kwagala B. Integrating women’s reproductive roles
with productive activities in commerce: the case
of businesswomen in Kampala, Uganda. Urban
Studies, 1999, 36(9):1535–1550.
53. Friebel G, Panova E, Shaw K. Insider privatization
and careers: a study of a Russian firm in transition.
In: Bender S et al., eds. The analysis of firms and
employees: quantitative and qualitative approaches.
Chicago, University of Chicago Press, 2008.
54. Bewley TF. Why wages don’t fall during a recession.
Cambridge, MA, Harvard University Press, 1999.

147
Analysis and synthesis of information on human resources for health from multiple sources: selected case studies
GUSTAVO NIGENDA, JOSÉ ARTURO RUIZ, CHRISTOPHER H HERBST,
AARUSHI BHATNAGAR, KRISHNA D RAO, INDRANI SARAN, SHOMIKHO RAHA
11.1 IntroductionHaving timely and reliable measurements of the health
workforce is becoming increasingly important to deci-
sion-makers, programme managers, development
partners and other stakeholders, as a cornerstone to
monitoring and evaluation of health systems perform-
ance. Yet monitoring human resources for health (HRH)
can be challenging and complex. Variances in the esti-
mated stock, skills mix and other characteristics of
HRH may occur, depending on the data source and the
adjustment method used to correct for data deficien-
cies (if any). Ideally, the data should be derived from
a comprehensive, harmonized health information sys-
tem of all persons trained or working in the promotion,
protection or improvement of population health, along
with nature of skills obtained or used. However, the
data sources used to populate such systems tend to
be fragmented and incomplete, which can lead to bias
in any measurements derived from them. Unfortunately,
the methodologies for measuring health workforce
dynamics lag far behind the demand for information
and evidence.
As reviewed in Chapter 3 of this Handbook, a number
of sources can potentially produce data relevant for
HRH analysis, including population and establish-
ment censuses and surveys, administrative records
and qualitative studies. Using a combination of differ-
ent sources can provide better-quality measurements
of health workforce characteristics and give a much
more rounded picture (1). It is good practice to recon-
cile data from different sources rather than to rely on
only one source of information. Dependence on single
sources increases the risk of making decisions based
on statistics that are incomplete or biased (2).
A strategy of triangulation – or cross-examination and
synthesis of the available data on a central theme across
different sources and using different methodologies –
can be used to assess and reconcile potential variances
in coverage, classification and reporting of information.
This approach can be effective in supporting policy
and programme decision-making when there are multi-
ple data sources (as is often the case in HRH analysis).
Whereas single research studies seek to maximize
scientific rigour through internal validity, triangulation
seeks to make the best public health decisions based
on the available information. The optimal use of pre-
existing data sources by means of triangulation allows
for a rapid understanding of the situation and facilitates
timely, evidence-based decisions.
In this chapter, three case studies are presented on the
uses of triangulation for HRH analysis with illustrative
applications in selected low- and middle-income coun-
tries. Both the data and methodological dimensions of
approaches to triangulation are discussed. Case stud-
ies from Mexico, India and Zambia are used to review
the potential for extracting relevant data for measur-
ing a specific indicator of HRH metrics from different
information sources, examine how triangulation can be
used to gauge the reliability of the available information
and investigate how new information can be teased out
by triangulating data across different types of sources.
11.2 Identification of potential information sources and their use to estimate indicators of health labour market participation in MexicoThe health workforce is a heterogeneous group, with
the activities of health workers ranging widely, depend-
ing on how they are incorporated into the labour market.
Measuring health labour dynamics can be complex,
but there are also practical opportunities for generat-
ing precise measurements from standard statistical
sources. In contrast with the general population, the
health workforce is generally a highly qualified group
of workers for whom the level and field of education
tends to be closely correlated with the nature of their
jobs. The development of evidence-based HRH pol-
icies requires ongoing assessment of any potential
11
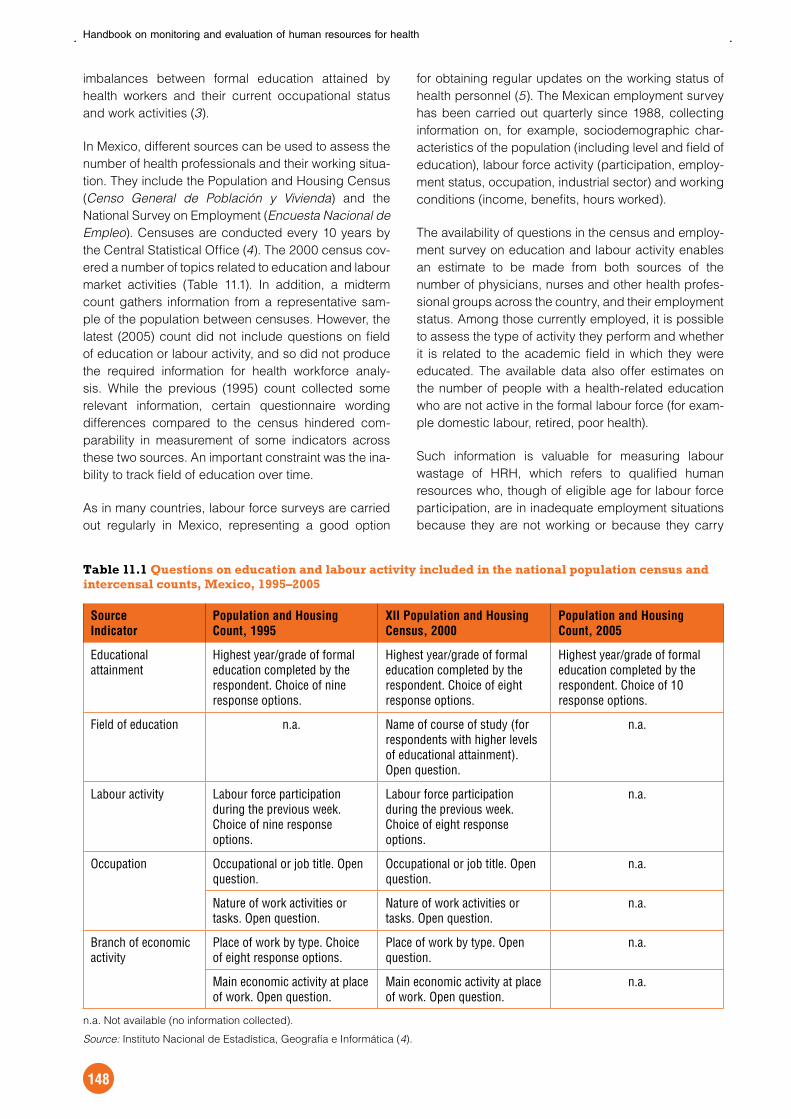
Handbook on monitoring and evaluation of human resources for health
148
imbalances between formal education attained by
health workers and their current occupational status
and work activities (3).
In Mexico, different sources can be used to assess the
number of health professionals and their working situa-
tion. They include the Population and Housing Census
(Censo General de Población y Vivienda) and the
National Survey on Employment (Encuesta Nacional de
Empleo). Censuses are conducted every 10 years by
the Central Statistical Office (4). The 2000 census cov-
ered a number of topics related to education and labour
market activities (Table 11.1). In addition, a midterm
count gathers information from a representative sam-
ple of the population between censuses. However, the
latest (2005) count did not include questions on field
of education or labour activity, and so did not produce
the required information for health workforce analy-
sis. While the previous (1995) count collected some
relevant information, certain questionnaire wording
differences compared to the census hindered com-
parability in measurement of some indicators across
these two sources. An important constraint was the ina-
bility to track field of education over time.
As in many countries, labour force surveys are carried
out regularly in Mexico, representing a good option
for obtaining regular updates on the working status of
health personnel (5). The Mexican employment survey
has been carried out quarterly since 1988, collecting
information on, for example, sociodemographic char-
acteristics of the population (including level and field of
education), labour force activity (participation, employ-
ment status, occupation, industrial sector) and working
conditions (income, benefits, hours worked).
The availability of questions in the census and employ-
ment survey on education and labour activity enables
an estimate to be made from both sources of the
number of physicians, nurses and other health profes-
sional groups across the country, and their employment
status. Among those currently employed, it is possible
to assess the type of activity they perform and whether
it is related to the academic field in which they were
educated. The available data also offer estimates on
the number of people with a health-related education
who are not active in the formal labour force (for exam-
ple domestic labour, retired, poor health).
Such information is valuable for measuring labour
wastage of HRH, which refers to qualified human
resources who, though of eligible age for labour force
participation, are in inadequate employment situations
because they are not working or because they carry
Table 11.1 Questions on education and labour activity included in the national population census and intercensal counts, Mexico, 1995–2005
Source
Indicator
Population and Housing
Count, 1995
XII Population and Housing
Census, 2000
Population and Housing
Count, 2005
Educational attainment
Highest year/grade of formal education completed by the respondent. Choice of nine response options.
Highest year/grade of formal education completed by the respondent. Choice of eight response options.
Highest year/grade of formal education completed by the respondent. Choice of 10 response options.
Field of education n.a. Name of course of study (for respondents with higher levels of educational attainment). Open question.
n.a.
Labour activity Labour force participation during the previous week. Choice of nine response options.
Labour force participation during the previous week. Choice of eight response options.
n.a.
Occupation Occupational or job title. Open question.
Occupational or job title. Open question.
n.a.
Nature of work activities or tasks. Open question.
Nature of work activities or tasks. Open question.
n.a.
Branch of economic activity
Place of work by type. Choice of eight response options.
Place of work by type. Open question.
n.a.
Main economic activity at place of work. Open question.
Main economic activity at place of work. Open question.
n.a.
n.a. Not available (no information collected).
Source: Instituto Nacional de Estadística, Geografía e Informática (4).

Analysis and synthesis of information on human resources for health from multiple sources: selected case studies
149
out activities that do not correspond to their training (6).
From a health systems strengthening perspective, fail-
ure of qualified persons to put into practice the specific
skills stemming from their education implies wastage of
a social, public or private investment that does not yield
a benefit for the population, or for the workers them-
selves. Those trained in health services provision who
remain outside it due to various reasons (inadequate
market absorption capacity, personal motivation) fall
into various categories:
Underemployed: individuals that have completed
their formal education and are currently employed
but perform activities not related to their training.
This includes trained health professionals working
outside the health services, signifying a mismatch
of occupational skills. The concept is consistent with
the International Labour Organization’s definition
of underemployment as encompassing individu-
als whose “employment is inadequate, in relation to
specified norms or alternative employment, account
being taken of [their] occupational skill” (7).1
1 An alternative to the skill-related approach to assessing
underemployment is in relation to a time criterion, such as in
the case of health professionals employed in health services
having worked less than a threshold related to working time
(for example less than what is considered as full-time work in
a country).
Unemployed: individuals that actively place pres-
sure on the labour market in searching for a job or
waiting for the outcome of a job application (during
a referenced period of time, such as the week prior
to data collection). The definition may also extend to
those looking for work outside the formal economic
sector.
Inactive-eligible: individuals not currently seeking
employment but who would be eligible for work by
virtue of their skills, age and ability. This encom-
passes those who have chosen to withdraw from the
labour market as a personal option (in the short or
long term), including those dedicated to domestic
labour.
Inactive-ineligible: individuals unavailable or una-
ble to work, for example due to retirement, studies,
work-limiting disability or other reason.
Table 11.2 shows selected findings from two differ-
ent sources on indicators of health labour wastage in
Mexico (8). Microdata, or data collected from individual
respondents, are used from the last population census
and from the national employment survey round corre-
sponding to the same period (third quarter of the year
2000). The indicators relate to the physician and nurs-
ing workforces, calculated using the same definitions
Table 11.2 Stock and distribution of the physician and nursing workforce by labour force status, based on census and survey data, Mexico, 2000
Data/Source
Indicator
Census Employment survey
Number % Number %
Physicians
Employed 142 923 70 189 930 74
Underemployed 26 733 13 28 457 11
Unemployed 10 892 5 7 036 3
Domestic labour 7 895 4 14 556 6
Not available for work 16 335 8 17 509 7
Total 204 778 100 257 488 100
Nursing professionals
Employed 57 834 55 62 406 64
Underemployed 16 128 15 7 666 8
Unemployed 7 143 7 1 254 1
Domestic labour 16 971 16 19 530 20
Not available for work 6 659 6 7 124 7
Total 104 735 100 97 980 100
Note: Underemployed includes those who have completed university-level training in medicine or nursing
but perform work activities not related to their education. Not available for work includes those who are
retired, studying or have a work-limiting disability. Percentages may not sum to 100% due to rounding.
Source: Instituto Nacional de Estadística, Geografía e Informática (8).
Handbook on monitoring and evaluation of human resources for health
150
from both data sources. Despite the similar methodol-
ogy used, important differences are found in the total
number of physicians (results from the survey being
some 20% higher than those from the census), but the
labour force indicators (in percentage terms) are gen-
erally consistent across both sources.
Regarding nursing professionals, in contrast to the
case of physicians, estimates of the total stock are
lower from the survey source than from the census
(7% lower), and the indicators of labour force par-
ticipation show a greater asymmetry. For example,
the difference in the employment rate among nurses
is 9 percentage points across sources, and for the
underemployment and unemployment rates some 6
percentage points each.
It is possible that differences in sampling, training of field
enumerators and supervisors, coding of self-reports of
respondents’ occupation descriptions, data entry and
processing operations, or other methodological con-
siderations may lie behind observed discrepancies in
the estimated indicators of labour force activity among
health professionals from the two different data sources
in Mexico.
It is also clear from this case study that standard sta-
tistical sources can be a useful tool for HRH analysis in
many countries. In the Mexican context, the available
data allow quantification of the essentially qualita-
tive concept of health labour wastage, which in turn
assists in raising awareness among decision-makers
of the magnitude of HRH challenges and guiding pol-
icy recommendations (6). Despite perceived barriers
to access to a skilled health worker among some seg-
ments of the population, the data demonstrate that there
simultaneously exists within the country a large number
of trained providers who are not working in health serv-
ices delivery. While the present analysis was limited to
physicians and nurses, it could certainly be extended
to other health professional and technician groups, and
eventually to other countries where the questionnaire
wordings from such sources are similar.
Data evaluation, and possibly adjustment to compen-
sate for data deficiencies, is crucial to validate HRH
information sources to support policy and planning. The
cross-examination checks presented here are informa-
tive, but do not provide a basis for formal evaluation
or adjustment of the reported numbers. Repeating this
exercise across successive censuses or over multiple
countries is likely to lead to improvements in estima-
tion and evaluation procedures. In Mexico, options
for time-trend analysis were limited due to differences
in the data collection tools between the census and
intercensal counts, which limited the possibility of
calculating relevant indicators from the latter. Countries
are encouraged to compile and publish the available
information from all sources even if at first glance the
data may seem of questionable quality. This could help
prospects, which might otherwise be lost, for develop-
ing techniques for evaluating and adjusting such data
and learning from experience.
11.3 Using multiple sources of information to produce best estimates of India’s health workforceIn most low- and middle-income countries, HRH esti-
mates reported by ministries of health and allied
agencies need strengthening in terms of comprehen-
siveness, reliability and timeliness. In India, routine
information on the national health workforce suffers
from several limitations. Reports from state professional
regulatory bodies – which form the basis of official
health workforce statistics – tend to be inaccurate as
a result of non-adjustment for health workers leaving
the workforce due to death, migration or retirement,
or of double-counting of workers registered in more
than one state. Further, not all states follow the same
registering procedure, which raises issues of compara-
bility; for example, the Delhi Medical Council requires
practising physicians to re-register every five years, a
process that is not followed in other states. Finally, cer-
tain categories of health workers (such as biomedical
researchers, physiotherapists and laboratory technol-
ogists) are not recorded in official statistics, thereby
making it difficult to estimate the overall size and com-
position of the health workforce (9, 10).
As previously discussed, a variety of data sources
available in most countries can be used to provide
useful information on HRH metrics. In this analysis,
estimates of the numbers of health workers from both
official sources and (population-based) standard sta-
tistical sources are cross-examined:
Official statistics on the numbers of registered phy-
sicians and nurses were obtained from the medical
and nursing councils of India (based on compiled
reports from their state counterparts, covering both
the public and private sectors); other statistics on
HRH were drawn from various Ministry of Health
reports (11–13).
Tallies of the health workforce for various cadres
were drawn from the 2001 Census of India, which
collected information on the self-reported occupa-
tion of all individuals in the country (14). The present
analysis uses a census microdata sample of 20%
of rural and 50% of urban enumeration blocks in
all districts, representing a sample size of about

Analysis and synthesis of information on human resources for health from multiple sources: selected case studies
151
300 million, and weighted to represent the total
population.
Estimates of the health workforce for various cad-
res were also obtained from the 2004–2005
round of a quinquennial survey on employment
and unemployment, implemented by the National
Sample Survey Organisation (15). The nationally
representative household survey recorded the prin-
cipal self-reported economic activity of employed
individuals.
Certain adjustments were made to make the employ-
ment survey and census estimates comparable. While
the census estimates were recorded in March 2001,
the survey was conducted between July 2004 and
June 2005. On the assumption that growth in the health
workforce follows that of the general population, the
census estimates were inflated by 8% to reflect demo-
graphic growth between 2001 and 2005.
Health workers were identified in the census and
employment survey samples using the National
Classification of Occupations (16). The census used
the latest 2004 version of the classification (also known
as NCO-04), whereas the survey used the earlier 1968
codes (NCO-68). In the estimates presented here,
NCO-68 codes were converted to NCO-04 with little
loss of information. To further improve comparability
between the two, certain health worker categories were
either split or merged together. For example, because
the function of nurses and midwives is often similar
they were merged into a single category. In a limited
number of cases where occupational information was
missing, some employed individuals were recognized
as health workers based on their branch of economic
activity or their educational qualifications.
The final set of health worker categories for which
estimates were produced comprised physicians and
surgeons (allopathic medical practitioners), nurs-
ing and midwifery personnel, dentists, pharmacists,
AYUSH practitioners (ayurvedic, yoga, unani, sidha,
homeopathy), other traditional medicine practitioners,
and others (dieticians, opticians, dental assistants,
physiotherapists, medial assistants and technicians,
other hospital staff).
As seen in Figure 11.1, official Ministry of Health esti-
mates are generally higher than those of the census
and survey sources and, significantly, there is better
agreement between the latter two. Measures were most
similar for the physician and dentist workforces across
all three sources. In total, the census and employment
survey estimates suggest that there are some 2.1 mil-
lion health workers in India, which translates into a
density of approximately 20 health workers per 10 000
population. Comparative statistics were not available
on the total number of health workers from administra-
tive sources. Also excluded from these estimates are
the roughly 1.5 million community health workers, for
whom a distinct occupational code is not included in
the current classification (although it is possible that
some of these workers are assimilated under nursing
and midwifery personnel).
Figure 11.1 Density of the health workforce by cadre, according to data source, India 2005
5.9
12.8
0.5
6.5
4.3
7.1
0.2
1.7
2.6
0.7
3.1
6.1
7.4
0.2
2.2
1.8
0.5
1.4
19.719.5
0 5 10 15 20
Physicians & surgeons
Nursing & midwiferypersonnel
Dentists
Pharmacists
AYUSH practitioners
Other traditionalmedicine practitioners
Others
TOTAL
Density of health workers (per 10 000 population)
Census
Employment survey
Ministry of Health official statistics
Sources: Indian Nursing Council (11),
Medical Council of India (12), Central
Bureau of Health Intelligence (13), Cen-
sus of India 2001 (14), National Sample
Survey Organization 2004–2005 (15).

Handbook on monitoring and evaluation of human resources for health
152
Further analysis of the census and survey data reveals
considerable variation in the density of the health
workforce (all cadres combined) across the states in
India (Figure 11.2). For a majority of states, the cen-
sus estimates are higher than those obtained from the
employment survey. The latter’s small sample size pre-
vents robust disaggregated estimates at the state level.
Estimates of the heath workforce drawing on census
and employment survey data have several advantages.
They are based on population counts and hence avoid
the problem of double-counting, cover a wide range
of health occupations, are available for all areas of the
country and have fewer comparability issues because
they are based on standard occupational codes.
However, these information sources also have certain
limitations. Notably, they cannot provide health work-
force estimates on an ongoing basis, as the Indian
employment survey is repeated only once every five
years and the census every 10 years.
Overall, the census appears to be the best available
source for health workforce estimates. The large size of
the microdata sample used here – covering every dis-
trict in the country and, within each district, both urban
and rural areas – allows for robust estimates across
health worker categories and by state. In the Indian
example, the census estimates have been shown to
have good correspondence with those obtained from
the survey source, at the aggregate level, indicating
good reliability.
11.4 Triangulation of data from two different sources for monitoring health worker absenteeism and ghost workers in ZambiaHealth worker absenteeism fuels inefficiencies and
inequities in many health labour markets in the devel-
oping world. As with other dimensions of the health
workforce crisis, relevant data and information are
needed for governments and partners to be able to
address and monitor the problem. Often underused,
health facility assessments offer an ideal mechanism
for obtaining and producing information and evidence
on various forms of worker absenteeism. Measuring
this indicator of labour dynamics requires the collec-
tion of only limited additional data, and the subsequent
triangulation of the new facility-based data with infor-
mation from routine administrative registries (17).
Health worker absenteeism comes in several forms. A
distinction should be made between: (i) absenteeism
Figure 11.2 Density of the health workforce (per 10 000 population) based on census versus survey data, by state, India 2005
Uttaranchal
Karnataka
Haryana
West Bengal Tamil Nadu
Gujarat
Meghalaya
RajasthanUttar Pradesh
Chhattisgarh
MadhyaPradesh
Bihar
Assam
PunjabMaharashtra
Himachal Pradesh
NagalandArunachal Pradesh
TripuraOrissa
Manipur
Goa
KeralaSikkim
MizoramDelhi
0
10
20
30
40
50
60
0 10 20 30 40 50 60
Density based on employment survey data
Den
sity
bas
ed o
n ce
nsus
dat
a
Jammu & Kashmir
Andhra Pradesh
Jharkhand
Sources: Census of India 2001 (14),
National Sample Survey Organization
2004–2005 (15).
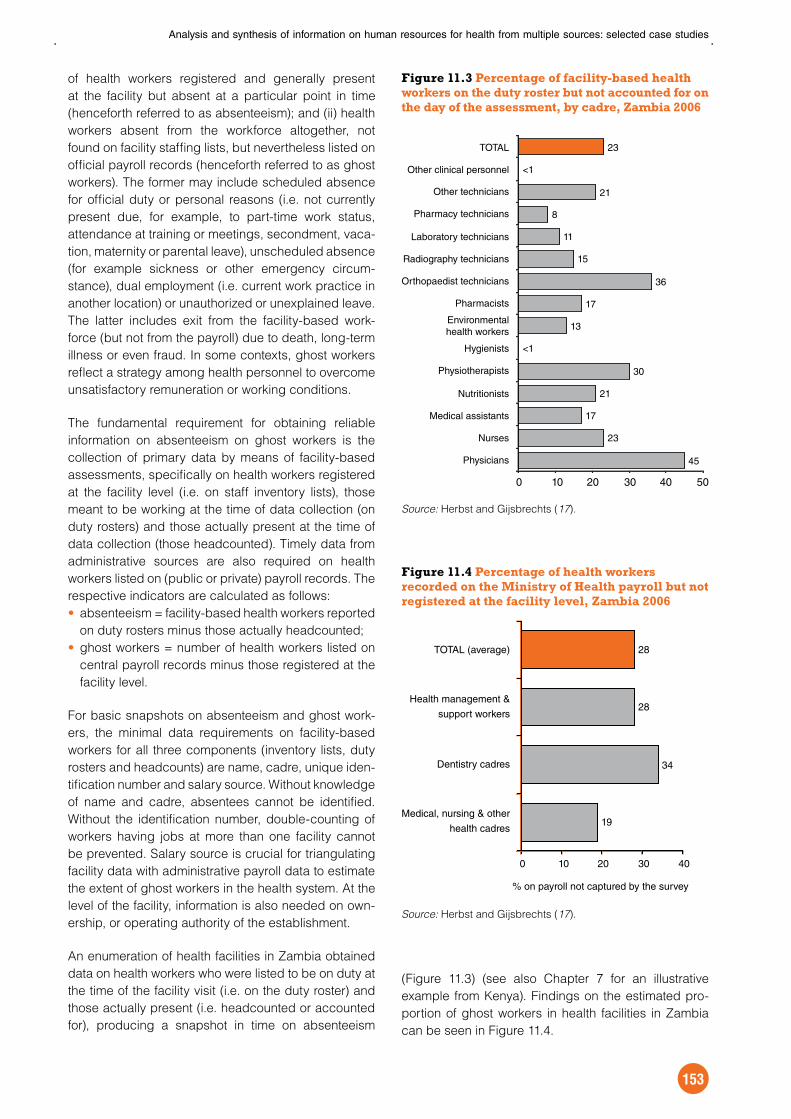
Analysis and synthesis of information on human resources for health from multiple sources: selected case studies
153
of health workers registered and generally present
at the facility but absent at a particular point in time
(henceforth referred to as absenteeism); and (ii) health
workers absent from the workforce altogether, not
found on facility staffing lists, but nevertheless listed on
official payroll records (henceforth referred to as ghost
workers). The former may include scheduled absence
for official duty or personal reasons (i.e. not currently
present due, for example, to part-time work status,
attendance at training or meetings, secondment, vaca-
tion, maternity or parental leave), unscheduled absence
(for example sickness or other emergency circum-
stance), dual employment (i.e. current work practice in
another location) or unauthorized or unexplained leave.
The latter includes exit from the facility-based work-
force (but not from the payroll) due to death, long-term
illness or even fraud. In some contexts, ghost workers
reflect a strategy among health personnel to overcome
unsatisfactory remuneration or working conditions.
The fundamental requirement for obtaining reliable
information on absenteeism on ghost workers is the
collection of primary data by means of facility-based
assessments, specifically on health workers registered
at the facility level (i.e. on staff inventory lists), those
meant to be working at the time of data collection (on
duty rosters) and those actually present at the time of
data collection (those headcounted). Timely data from
administrative sources are also required on health
workers listed on (public or private) payroll records. The
respective indicators are calculated as follows:
absenteeism = facility-based health workers reported
on duty rosters minus those actually headcounted;
ghost workers = number of health workers listed on
central payroll records minus those registered at the
facility level.
For basic snapshots on absenteeism and ghost work-
ers, the minimal data requirements on facility-based
workers for all three components (inventory lists, duty
rosters and headcounts) are name, cadre, unique iden-
tification number and salary source. Without knowledge
of name and cadre, absentees cannot be identified.
Without the identification number, double-counting of
workers having jobs at more than one facility cannot
be prevented. Salary source is crucial for triangulating
facility data with administrative payroll data to estimate
the extent of ghost workers in the health system. At the
level of the facility, information is also needed on own-
ership, or operating authority of the establishment.
An enumeration of health facilities in Zambia obtained
data on health workers who were listed to be on duty at
the time of the facility visit (i.e. on the duty roster) and
those actually present (i.e. headcounted or accounted
for), producing a snapshot in time on absenteeism
(Figure 11.3) (see also Chapter 7 for an illustrative
example from Kenya). Findings on the estimated pro-
portion of ghost workers in health facilities in Zambia
can be seen in Figure 11.4.
Figure 11.3 Percentage of facility-based health workers on the duty roster but not accounted for on the day of the assessment, by cadre, Zambia 2006
Source: Herbst and Gijsbrechts (17).
Figure 11.4 Percentage of health workers recorded on the Ministry of Health payroll but not registered at the facility level, Zambia 2006
Source: Herbst and Gijsbrechts (17).
45
23
17
21
30
13
17
36
15
11
8
21
23
<1
<1
0 10 20 30 40 50
Physicians
Nurses
Medical assistants
Nutritionists
Physiotherapists
Hygienists
Environmentalhealth workers
Pharmacists
Orthopaedist technicians
Radiography technicians
Laboratory technicians
Pharmacy technicians
Other technicians
Other clinical personnel
TOTAL
19
34
28
28
0 10 20 30 40
Medical, nursing & other
health cadres
Dentistry cadres
Health management &
support workers
TOTAL (average)
% on payroll not captured by the survey
Handbook on monitoring and evaluation of human resources for health
154
Despite efforts to adjust the facility-level data against
payroll data for enhanced comparability, non-negligi-
ble information gaps on salary source of health workers
may have compromised measurement accuracy (17).
Computation of indicators on ghost workers requires
triangulation of data on health workers by salary source
– as opposed to sector of employment – with payroll
records. Although in Zambia the vast majority of health
workers found in public sector facilities are indeed on
the public sector payroll (an assumption made during
analysis), this is not necessarily typical.
The production of useful information on health worker
absenteeism (at a given moment in time) and ghost
workers is only possible if the underlying data from
which this is derived are not only adequately collected
and triangulated (using well-designed tools and ana-
lytical techniques), but also accurately reflect the
day-to-day scenario on the ground. To minimize poten-
tial biases, it is important to take into account certain
considerations, notably the timing of data collection at
the facility level: snapshots of absenteeism may vary
depending on whether data collection occurs at the
beginning or end of a workday, as levels of absentee-
ism are often higher in the afternoons. Announcing
data collection in advance to those with managerial
decision-making authority may also skew the picture
on absenteeism in some scenarios. Facility managers
may either want to ensure staff presence since high
levels of absenteeism could be seen to reflect badly
on managerial performance – or, conversely, they may
want to expose absentees as evidence to support
future human resources planning and negotiations.
It is not certain which combination of reasons for
observed worker absences at a moment in time
explains the results from the data triangulation exer-
cise for Zambia. The method entailed comparisons of
staff present, listed or on the payroll on the day of the
survey. However, the facility assessment did not collect
detailed information that would help improve under-
standing of the dynamics of absenteeism, such as
duration of absence or its underlying basis (for exam-
ple, expected versus non-expected). Improving routine
HRH management information systems, including daily
updates of staffing schedules at the facility level, would
allow better elucidation of staff behaviours and work-
force efficiencies on an ongoing basis.
11.5 Summary and conclusionsThis chapter has presented selected case studies on
approaches to triangulation, or cross-examination of
multiple information sources for in-depth HRH analy-
sis. Triangulation represents a cost-effective strategy
for using diverse datasets to explore a single issue.
In monitoring and evaluation of health workforce pol-
icies and programmes, using one source or method
is rarely sufficient. Frameworks have been formulated
that can support efforts to coherently combine statis-
tics from different sources and for different units (18).
Different kinds of data, methods and approaches will
often yield somewhat different results. Exploring these
inconsistencies can be an important means of better
understanding the multifaceted and complex nature of
health labour market dynamics. Areas where the data
triangulation produces similar or converging results will
increase confidence in preliminary findings.
The technique can also help articulate recommenda-
tions for strengthening future evaluation efforts. This
chapter has highlighted the strengths and limitations
of using some combination of population censuses,
employment surveys, health facility assessments
and routine administrative records for HRH assess-
ment. Ensuring a strategic agenda for data collection,
processing, analysis and use – including common (and
detailed) occupational classification, unique identifiers
for practising health workers, ongoing update of admin-
istrative registries to account for worker absences and
attrition, consistency over time in the design of data
collection instruments, and systematic dissemina-
tion of findings – opens up new possibilities for HRH
analysis to support timely recommendations for evi-
dence-based decision-making.

Analysis and synthesis of information on human resources for health from multiple sources: selected case studies
155
References1. Galin P. Guía para optimizar la utilización de
la información disponible sobre empleo en el
sector salud. In: Dal Poz M et al., eds. Relaciones
laborales en el sector salud. Quito, Organización
Panamericana de la Salud, 2000.
2. AbouZahr C, Adjei S, Kanchanachitra C. From data
to policy: good practices and cautionary tales.
Lancet, 2007, 369:1039–1046.
3. Nigenda G et al. University-trained nurses in
Mexico: an assessment of educational attrition
and labor wastage. Salud Pública de México,
2006, 48(1):22–29 (http://www.scielosp.org/
scielo.php?script=sci_arttext&pid=S0036–
36342006000100005&lng=en&nrm=iso, accessed
25 January 2009).
4. Instituto Nacional de Estadística, Geografía e
Informática (INEGI) (http://www.inegi.gob.mx,
accessed 25 January 2009).
5. Gupta N et al. Assessing human resources for
health: what can be learned from labour force
surveys? Human Resources for Health, 2003,
1:5 (http://www.human-resources-health.com/
content/1/1/5, accessed 15 January 2009).
6. Nigenda G, Ruiz JA, Bejarano R. Educational and
labor wastage of doctors in Mexico: towards the
construction of a common methodology. Human
Resources for Health, 2005, 3:3 (http://www.human-
resources-health.com/content/3/1/3, accessed 26
January 2009).
7. Hussmanns R, Mehran F, Verma V. Surveys of
economically active population, employment,
unemployment and underemployment: an ILO
manual on concepts and methods. Geneva,
International Labour Office, 1990.
8. XII Population and Household Census and National
Survey on Employment. Mexico, Instituto Nacional
de Estadística, Geografía e Informática, 2000.
9. Financing and delivery of health care services
in India. Background paper of the National
Commission on Macroeconomics and Health.
New Delhi, Government of India, Ministry of Health
and Family Welfare, 2005 (http://www.who.int/
macrohealth/action/national_reports/en/index.html,
accessed 27 January 2009).
10. Not enough here ... too many there: health workforce
in India. New Delhi, World Health Organization
Country Office for India, 2007 (http://www.whoindia.
org/EN/Section2/Section404_1264.htm, accessed
27 January 2009).
11. Indian Nursing Council (http://www.
indiannursingcouncil.org, accessed 27 January
2009).
12. Medical Council of India (http://www.mciindia.org,
accessed 27 January 2009).
13. Medical health and nursing manpower statistics
2005. New Delhi, Government of India, Ministry
of Health and Family Welfare, Central Bureau of
Health Intelligence (http://cbhidghs.nic.in/index3.
asp?sslid=929&subsublinkid=828, accessed 27
January 2009).
14. Census of India 2001. Office of the Registrar
General and Census Commissioner of India (http://
www.censusindia.net, accessed 27 January 2009).
15. Government of India, Ministry of Statistics and
Programme Implementation, National Sample Survey
Organisation (http://mospi.nic.in/mospi_about_nsso.
htm, accessed 27 January 2009).
16. National Classification of Occupations 2004.
Government of India, Ministry of Labour, 2004 (http://
dget.nic.in/nco, accessed 27 January 2009).
17. Herbst CH, Gijsbrechts D. Information on stock,
profiles, and distribution of health workers in Zambia:
analysis of the Health Facility Census data. World
Bank Human Resources for Health Program Paper.
Washington, DC, World Bank, 2007.
18. Hoffmann E. Developing labour account estimates:
issues and approaches. In: Household accounting:
experiences in concepts and compilation. Studies in
Methods, Series F, No. 75. New York, United Nations
Statistics Division, 2000.

Handbook on monitoring and evaluation of human resources for health
156

157
Part IV: DATA DISSEMINATION AND USE

159
Getting information and evidence into policy-making and practice: strategies and mechanisms
GÜLIN GEDIK, ULYSSES PANISSET, MARIO R DAL POZ, FELIX RIGOLI
12.1 IntroductionIn a rapidly changing world, the need to address huge
deficits in the human resources for health (HRH) devel-
opment agenda has sparked growing interest and
concern at global, regional and country level. In order
to act rapidly, effectively and efficiently to address these
deficits, policy- and decision-makers require updated
and readily available information and evidence based
on solid data.
A major difficulty experienced by decision-makers
in addressing HRH challenges is the complex diver-
sity and simultaneity of pressing key issues such as
imbalances in global and national distribution and
production of health workers, progressive increase
in international migration, sociopolitical restrictions
on public sector operations (including freeze on pub-
lic sector recruitment due to structural adjustment
programmes), the need to scale up priority health inter-
ventions, impacts of HIV on the health workforce and
addressing worker motivation and retention. Many of
these challenges are long-term processes with cumu-
lative effects on workforce shortages and imbalances.
Resulting human resources problems can manifest in
different ways, such as labour disruptions (for example
strikes) because of low morale among health workers,
or even hospital closure due to inability to meet mini-
mum staffing norms. The possible solutions can only
be identified through examination of the roots of these
problems, though these may not be apparent at first
glance.
Countries have made efforts to develop HRH policies
and implementation plans within the context of health
sector reforms with varied levels of success. In gen-
eral, policies may be elaborated and implemented
with several inputs and factors, such as political and
financial constraints, tacit knowledge and professional
experience. In the absence of reliable and validated
data, it has been difficult to establish evidence-based
policies, that is, policies informed through the use of
health indicators and research results to formulate,
implement, monitor and evaluate strategic action. In
addition, the policy imperatives of global and regional
initiatives and other strategies to strengthen health sys-
tems in countries (such as those described in Chapter
1) call for robust monitoring and evaluation mech-
anisms to assess the extent to which countries are
making progress or lagging behind. To make well-
informed decisions about HRH, decision-makers and
other stakeholders, including the private sector and
civil society, need the best available evidence about
what works or looks promising.
The significant challenge of scaling up and improv-
ing performance of HRH and health services delivery
in a relatively short time, and integrating and coordi-
nating decision-making in health systems with other
sectors of government and society, requires new ways
of thinking and organizing policy-making. There have
been several studies in the past decade examining the
processes, which have attempted to address the gap
between what is known about effective health systems
interventions and the evidence used in decision-mak-
ing. The issue of how to access evidence synthesis and
adapt it for application to the local context is a prob-
lem common to all countries at different levels of social
and economic development, and needs addressing
through international cooperation (1).
Senior policy-makers in low- and middle-income
countries have stressed that access to high-quality
information and evidence that is timely and relevant
is critical to their ability to make evidence-informed
decisions. Although necessary, evidence alone is cer-
tainly not sufficient, given that health interventions are
affected by a wide range of contextual, political, cultural
and sociological factors that shape the decision-mak-
ing process (2). There is a significant knowledge gap in
our understanding of the mechanisms, structures and
factors that policy-makers experience. To overcome
this gap, identification of these barriers and facilitat-
ing factors in each context is required, through better
research on how evidence-informed policy-making
12

Handbook on monitoring and evaluation of human resources for health
160
can integrate context, values and politics in pursuit of
improved health of populations (3).
The debate over evidence in public health has often
focused on “the linear use of research evidence in a
programmatic rather than policy context” – and has not
taken account of the capacity to implement the pol-
icy (4). The capacity to take into consideration political
factors and act on evidence is fundamental to the appli-
cation of an evidence-informed policy, but is lacking
in most initiatives to date. Active participation of pol-
icy-makers and other stakeholders in the identification
of problems and systematization of evidence is vital,
but rare (5). A more integrated policy process – where
agenda setting, policy formulation, implementation and
feedback are closely related to each other – is required
to make sure that the use of the best scientific evidence
is effectively implemented in different contexts (6).
Earlier chapters of this Handbook highlighted what
needs to be monitored, what types of information are
required, what are the possible sources of data and
information, and how they can be collected and proc-
essed. This chapter looks at how this information and
research results can be collated, disseminated, shared
and used to facilitate policy dialogue and implemen-
tation. The following sections take stock of various
initiatives in place to build effective health workforce
information and evidence generation and dissemina-
tion mechanisms at subnational, national, regional and
international levels, and how to improve the use of sci-
entific evidence in policy formulation and monitoring
and evaluation of its implementation.
12.2 Strategies to get evidence into policy and practiceThe term “knowledge translation” (or wording alter-
natives that basically encompass the same concept,
such as “capacity building”, “knowledge management”
and “linkage and exchange”) is increasingly used to
describe a series of activities undertaken to generate
knowledge targeting user needs, to disseminate this
knowledge, to build decision-makers’ capacity for its
uptake and to adapt and track its application in specific
contexts (7). In the field of health, it has been described
as a dynamic and iterative process that includes syn-
thesis, dissemination, exchange and ethically sound
application of knowledge to provide more effective
health services and products, strengthen health sys-
tems and improve population health (8).
The traditional separation between researchers, pol-
icy-makers, research funders, programme managers,
health practitioners and health service users has been
identified as one of the main obstacles for effective
knowledge transfer and the use of research in deci-
sion-making processes. One of the fundamental factors
identified in approaches that recognize the complexity
of health systems policy-making and action is the need
to improve interaction between different stakeholders
in the decision-making process (9). This is essential
to produce feasible policies that can be implemented
according to a specific context. Such a stakeholder-
oriented model has been called an “interactive model”
(4) – the ongoing process to “adopt, adapt, and act” on
knowledge, using research to inform policy while simul-
taneously weighting the politics of different interests,
motivations and values.
A systematic review of studies evaluating policy-mak-
ers’ perceptions of their use of evidence identified the
following facilitating factors: (i) frequent two-way per-
sonal contact between researchers and policy-makers;
(ii) an estimation that the research produced is timely,
relevant and of sound quality; and (iii) the presentation
of results including summaries with clear policy rec-
ommendations. The most commonly identified barriers
were absence of interaction, timeliness, relevance and
credibility; lack of translation to the user; and mutual
distrust between researchers and policy-makers (10).
Utilization of research evidence requires active promo-
tion of these facilitating factors and overcoming barriers
in innovative ways to take account of the complexity of
the policy-making process. The creation of an enabling,
interactive, learning environment with different stake-
holders is critical (1, 11, 12). Three main strategies have
been proposed to promote the application of informa-
tion and evidence to policy- and decision-making:
strategies to promote researcher “push”, concen-
trating on diffusion to a broad audience – including
dissemination of findings through concise policy
briefs and syntheses of existing evidence;
strategies to promote policy-maker “pull”, focused
on the needs of users, thereby creating an appetite
for research results – including capacity develop-
ment for policy-makers in commissioning research
and development of rapid response mechanisms;
strategies to promote linkage and exchange, or
building and maintaining relationships in order to
exchange knowledge and ideas – including joint
mechanisms to set priorities for health and health
workforce policies, and forums and workshops for
exchange between researchers, policy-makers and
civil society representatives regarding the evidence
base and its application to specific policies (7, 13).
Policy- and decision-making require research results
focused on problem solving and addressing demand
for specific policy issues. Thus, the definition of the

Getting information and evidence into policy-making and practice: strategies and mechanisms
161
research question based on a problem identified by
the decision-maker (pull) facilitates the research-to-
policy link. Sponsors and financers of health research
are increasingly realizing that their calls for proposals to
study the intricacies of health systems must rely on the
demand of policy- and decision-makers, as opposed
to the more traditional researcher-oriented definition
of research projects. Ensuring sustained interactions
between researchers and policy-makers appears to
make a difference in supporting evidence-informed
decision-making processes (14).
Besides the need for direct interaction with policy-
makers, HRH research also entails an interdisciplinary
approach to tackle the multiple aspects related to
human resources in health systems. This poses a chal-
lenge on developing innovative methodologies and
networking, integrating mechanisms that bring to HRH
research the expertise in financing, legislation and
regulation, health systems management, behavioural
sciences and other key areas for the better under-
standing of HRH dynamics.
An additional aspect of HRH research is that most of
the available studies focus on developed countries
(15). It has been estimated that only 5% of published
articles on health policy and systems research focus on
low- and middle-income countries (16). Researchers
looking into HRH issues for low- and middle-income
countries frequently run into difficulties with availability
of quality (quantitative and qualitative) data and defini-
tion of appropriate performance indicators required as
raw material on which research can be shaped (17).
The issue of context specificity between and within
countries also constitutes a major challenge. People
working towards strengthening of the health system
in a given jurisdiction do so in very specific political,
socioeconomic and cultural environments. Particularly
in HRH policy issues – in which financial, political,
legal and cultural factors are of great significance
– it is extremely difficult to draw generalized conclu-
sions from a study conducted in one country, within
a specific context and at a specific point in time.
Furthermore, subnational or local-level characteristics
can differ markedly within a given country, especially
in situations of decentralized health systems. In other
words, one size definitively does not fit all, demanding
the development of mechanisms for contextualization
of research evidence.
As health systems interventions are social experiments
with an impact on large parts of the population, peo-
ple affected by policies are inevitably key stakeholders
(18–20). Researchers and policy-makers must not only
know and understand the constraints and opportunities
of the actors involved in this process, they must also
develop a stakeholder-oriented work environment (21).
Interactive approaches, ones that create and strengthen
a learning environment with constant exchange or link-
ages of ideas and experiences among a varied set of
stakeholders, are essential for promoting the appropri-
ate use of research evidence (22). The process may be
driven at the beginning by decision-makers and other
users (for example health services practitioners), with
researchers acting as resources (23). Simultaneously,
it may facilitate the implementation of the policy, as
inputs from different users will improve the capacity to
identify factors enabling implementation (Figure 12.1)
(24).
Thus, it is critical to identify, promote, establish and
strengthen effective mechanisms for supporting the
development, implementation and monitoring and
evaluation of HRH policies. The mechanisms should
ensure not only the collection of data or generation of
evidence, but also dissemination and utilization for pol-
icy and managerial decisions. Viable HRH policies can
be developed, committed and implemented if they are
based on information and evidence, principles and val-
ues, and respond to the various stakeholders’ interests.
Any policy dialogue, therefore, needs to use mecha-
nisms that ensure stakeholders’ participation is taken
into account, but modulated with the inflow of infor-
mation. Health workforce policies formulated only by
stakeholders’ consensus risk being interest driven (for
example, doctors creating the policy for the medical
workforce); conversely, policies made behind the doors
of a government cabinet based purely on principles or
values risk being unrealistic or dogmatic (for example,
forcing health professionals to work in deprived areas
without thinking about incentives for their performance
Figure 12.1 Basis for HRH policies
Source: Adapted from Muir Gray (24).
HRH policies
Principles and values
Stakeholders’ interests
Information and evidence

Handbook on monitoring and evaluation of human resources for health
162
and retention). Information flows can balance these
otherwise partial points of view.
To this end, several different but complementary
approaches could be followed:
strengthening health workforce information systems
to generate the data needed for monitoring and
evaluation of HRH policies and programmes;
building research capacities to produce and dissem-
inate information and evidence for the formulation of
policy options among decision-makers and other
stakeholders;
facilitating knowledge translation platforms for
information and evidence sharing among all key
stakeholders;
establishing and strengthening cooperative mech-
anisms and processes, such as health workforce
observatories, with the aim of integrating HRH
information and evidence (including analyses
of best practices) with policy development and
implementation.
Other chapters in this Handbook tended to focus on
the first two approaches; the rest of this chapter looks
into examples of the latter two. In particular, knowl-
edge translation platforms (for example discussion
forums or virtual networks) are valuable for facilitating
ongoing interactions between researchers and policy-
makers and helping transform scientific evidence into
policy and practice (25). An example of a successful
knowledge translation platform for health systems and
policies focusing on low- and middle-income countries
is given in Box 12.1 (26–28).
Health workforce observatories offer opportunities for
facilitating planning, monitoring and evaluation of HRH
policy implementation by means of fostering mechanisms
for timely access to and use of relevant data and infor-
mation. The next section concentrates on this approach,
with examples from regional and country level.
12.3 A mechanism to harness the HRH agenda: health workforce observatoriesHealth workforce observatories are being increas-
ingly recognized as a potentially valuable mechanism
to improve the information and knowledge base on
the HRH situation and to facilitate policy develop-
ment and monitoring. Although they have evolved in
different ways in different contexts, they share a funda-
mental feature: a cooperative network initiative among
countries and partners to produce and share informa-
tion and knowledge necessary for improving human
resources policy decisions.
12.3.1 Development and contributions of health sector observatoriesSince the 1970s, various types of cooperative mech-
anisms – with the label “observatory” or other – have
been established in countries at different levels of social
and economic development, focusing on different pub-
lic health themes. These have included observatories
charged with aiding local health and social care pol-
icy decision-making in France through the production
of useful information, and the public health observa-
tories in the United Kingdom, which were considered
to have broken new ground in the provision of health
intelligence by not only providing information but also
context and perspective (29).
At the regional level, the implementation of wide-
spread health-care reforms and increasing recognition
of the need for better monitoring in the late 1990s wit-
nessed the emergence of observatories on health
systems and human resources, notably the European
Observatory on Health Systems and Policies (30) and
the Observatory of Human Resources in Health Sector
Reforms (among countries of Latin America and the
Caribbean) (31).
When the European Observatory on Health Systems and
Policies was initiated, it was described as a new part-
nership aiming to bridge the gap between academia
and policy-makers. The rationale was explained by one
of the observatory’s directors as follows:
There is some information about what reforms
work and where they work. But it is not read-
ily accessible or easy to interpret. Information
is mostly in academic journals and much of it is
unpublished. The expertise of the observatory is
to collate information, analyse it, structure it, and
present findings clearly to those responsible for
making and implementing health policy.
Source: Figueras (32).
In the region of the Americas, stimulated by efforts of
the Pan American Health Organization (PAHO) to mon-
itor ongoing health sector reforms and their impacts on
health labour, an initiative was launched in 1999 bring-
ing together 23 countries under an umbrella network of
HRH observatories. This resulted in the development
of a community of professionals engaged in health
workforce policies. The regional observatory has been
defined as “a cooperative initiative among the coun-
tries of the region aimed at producing information and
knowledge in order to improve human resource policy
decisions as well as contributing to human resources
development within the health sector on the basis of
sharing experiences among countries” (33). Thus the
observatories are intended to be not just information

Getting information and evidence into policy-making and practice: strategies and mechanisms
163
disseminators, but also proactive actors in policy-mak-
ing. For example, regular (biennial) regional meetings
provide a forum for interactive discussion, sharing and
strategic planning.
More recently, with increasing global attention and
resource mobilization to address the health workforce
crisis in Africa, the Africa Health Workforce Observatory
(34) has evolved as part of the action agenda. With its
secretariat housed by the World Health Organization
(WHO), its mission is to “support actions that address
HRH challenges by promoting, developing and sustain-
ing a solid knowledge base for HRH information at all
levels: subnational, national, intercountry and regional”
(35) (Box 12.2, page 166).
Similarly, with support from WHO, the Eastern
Mediterranean Region Observatory on Human
Resources for Health grew out of an existing regional
observatory on health systems with the purpose “to
assist Member States in using a proactive approach
and sharing the best and most innovative options to
tackle HRH-related challenges” (36). Its outputs in the
public domain include updated profiles on the health
workforce situation within and across countries, analy-
ses of correlations between significant health workforce
Box 12.1 Evidence-Informed Policy Network: EVIPNet
In response to a call “to establish mechanisms to transfer knowledge in support of evidence-based public
health and health-care delivery systems, and evidence-based health-related policies”, in 2005 the World
Health Organization launched the collaborative Evidence-Informed Policy Network (EVIPNet) (26).
EVIPNet addresses the integration of two fundamental enabling factors in the process of evidence-
informed policy-making: best practices to promote interaction among stakeholders that generate and use
evidence; and capacity to implement research in a local context (27). Focusing on low- and middle-income
countries, EVIPNet promotes partnerships at the country level between policy-makers, researchers and
civil society in order to facilitate both policy development and policy implementation through the use of the
best scientific evidence available.
EVIPNet comprises a series of linked (but distinct) networks that bring together national teams, which are
coordinated at regional and global levels. Africa, Asia and the Americas each host regional networks,
which together work in some 25 countries. At the regional level, EVIPNet is supported by WHO regional
offices and by small secretariats responsible for promoting regional coordination. A global steering group
facilitates exchange between regions and supports international-level activities. The work is guided by a
group of international experts in the evidence-to-policy field, which provides strategic guidance, organizes
technical review of EVIPNet proposals, develops innovative methodologies and provides direct technical
support to country teams where necessary. A project priority is to identify best practices in developing
capacity of both policy-makers and researchers in working with scientific evidence-to-policy links, while
engaging citizens and advocacy groups to sustain demand for evidence-informed health policy.
Since its inception, EVIPNet has worked collaboratively with the Regional East African Community
Health Policy Initiative, an institutional mechanism whose mission is to access, synthesize, package
and communicate evidence required for health policy and practice and for influencing policy-relevant
research agendas for improved health equity (28). Similar initiatives are emerging in other countries,
focusing on supporting governments to use research evidence for health policy decisions – although the
specific scope of activities, nature of collaborative efforts and research evaluation methods are unique
across contexts. For example, country teams may organize workshops to build technical capacity; several
promote the inclusion of journalists as observers and advocates. Thus EVIPNet has contributed to creating
a supportive political environment for delivery of evidence-informed policies.
Recently, country teams have began to produce policy briefs based on systematic reviews of research,
offering policy options that include governance, delivery and financial arrangements adapted to specific
country or district contexts and the reality of existing resources. For instance, in February 2008, EVIPNet
Africa country teams produced policy briefs to address current policy challenges related to malaria
treatment services in their respective countries.

Handbook on monitoring and evaluation of human resources for health
164
determinants, and operational and policy linkages to
national and regional HRH benchmarks and targets.
Although the functions of and triggering force for
the emergence of these various observatories differ
slightly, depending on specific contexts and needs,
each works to bridge the gap between evidence and
policies. The common objectives can be summarized
as: to produce information and knowledge necessary
to improve human resources policy decisions, planning
and implementation; to share country experiences in
human resources development; and to facilitate policy
dialogue. Recent significant contributions attributable
to regional HRH observatories have included:
the creation and dissemination of databases of
cross-nationally comparable statistics on various
indicators of health workforce metrics – for example,
the public interface for the African atlas of the health
workforce is maintained on the regional observatory
web site (37);
the generation of regional and country profiles of the
HRH situation and trends for overview analysis and
benchmarking;
the undertaking of intercountry and national studies
on specific policy-relevant health workforce topics
– for example, joint activities across regional observ-
atories for capacity assessment of HRH units in
national ministries of health (in the WHO regions of
Africa, the Americas and the Eastern Mediterranean)
and for mapping the health management workforce
(in the African and Eastern Mediterranean regions).
12.3.2 National health workforce observatoriesWhile regional observatories may play an essential role
in terms of organization and coordination, national HRH
observatories lie at the core of achieving the desired
objectives discussed above. They operate to synergize
efforts and consolidate resources at the country level,
contributing to a commonly agreed workplan among all
stakeholders to respond to country needs.
National observatories involve networks of all part-
ners in health workforce development in the country.
Routine responsibilities of network members often
entail monitoring and documenting implementation of
HRH policies and strategies. While members may each
operate under their own identities, tasks are divided
in a coordinated manner and the results of the work
are shared in a systematic way. Observatory networks
typically involve representatives at various levels: gov-
ernment (ministry of health, ministry of education,
ministry of finance, public service commission, national
statistics office); academic and training institutions;
health professional regulatory bodies; health workers’
unions and associations; major private and nongovern-
mental organizations providing health services; civil
society (for example health services consumer and cli-
ent groups); and development partners.
National health workforce observatories can serve as
mechanisms to promote collaborative engagement
among stakeholders and enhance their roles and
contributions to HRH development. However, just as
regional observatories evolved in different ways, so
too may national observatories have different priori-
ties, structures, memberships and ways of working,
as driven by country contexts and interests. Table
12.1 provides an illustrative example of potential stake-
holders and their roles in the context of the Sudanese
national observatory (38).
At the same time, some common principles and fea-
tures among operating national HRH observatories can
be identified:
They build on existing structures and mechanisms,
such as national technical multisectoral and partner
working groups, avoiding duplication of efforts and
parallel structures.
Organizational flexibility accommodates diverse
sociopolitical contexts (although the actual mod-
els of organization vary from country to country,
according to existing institutional arrangements and
leadership).
Coordination functions are assumed through either
a small secretariat or focal point.
Active involvement of the ministry of health, espe-
cially in a leading role, is essential.
They can contribute to strengthening capacities
and empowerment of the HRH units of ministries of
health and other stakeholders.
In line with these principles, Boxes 12.3, 12.4 and 12.5
offer examples across different operational frame-
works for HRH observatories (39–42). The stimulation
of joint work and products among participating stake-
holders can contribute to continuation of advocacy
and commitment for observatories, and therefore to
their sustainability. An outstanding question remains
regarding whether the national observatory should
be integrated as part of the health ministry’s HRH unit
(such as in the case of Brazil), or as an autonomous
interinstitutional group with guidance from the national
authority. There are advantages to both options, but
also risks – in the former case, close proximity to the
political directives may inhibit widespread stakeholder
participation; in the latter, the information generated
may not be relevant for policy and planning.
Overall, experiences from different contexts have shown
that HRH observatories can be an effective mechanism
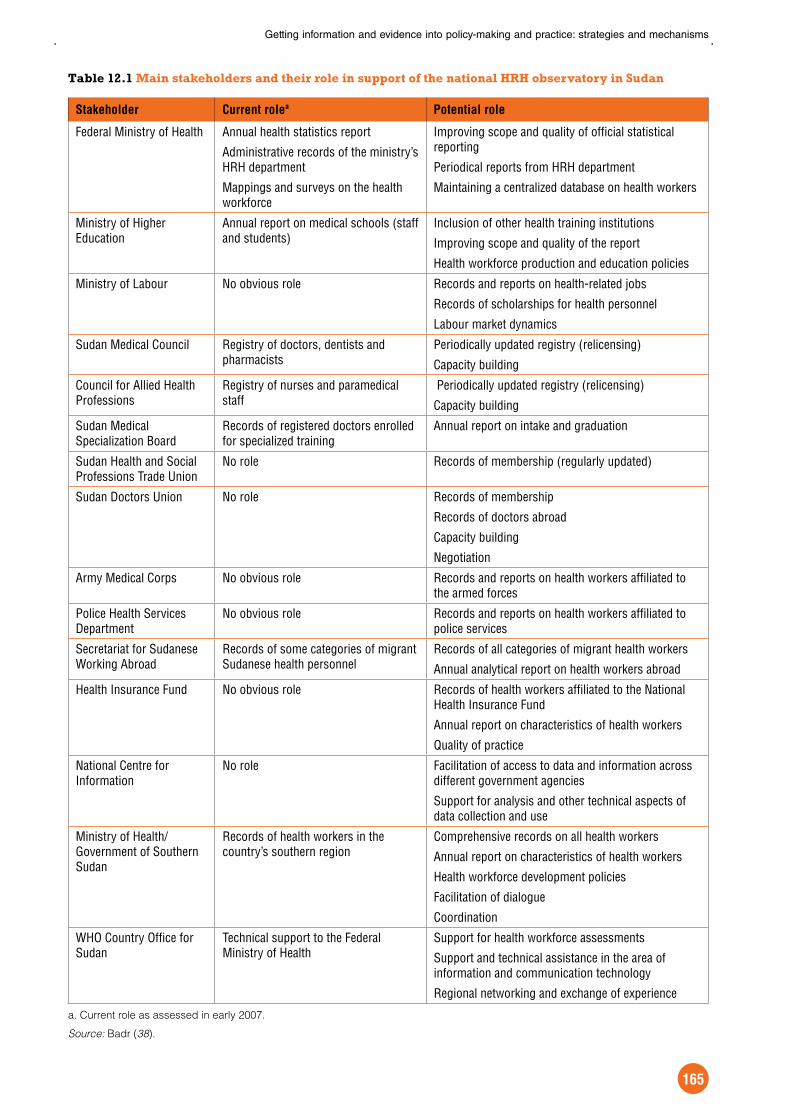
Getting information and evidence into policy-making and practice: strategies and mechanisms
165
Table 12.1 Main stakeholders and their role in support of the national HRH observatory in Sudan
Stakeholder Current rolea Potential role
Federal Ministry of Health Annual health statistics report
Administrative records of the ministry’s HRH department
Mappings and surveys on the health workforce
Improving scope and quality of official statistical reporting
Periodical reports from HRH department
Maintaining a centralized database on health workers
Ministry of Higher Education
Annual report on medical schools (staff and students)
Inclusion of other health training institutions
Improving scope and quality of the report
Health workforce production and education policies
Ministry of Labour No obvious role Records and reports on health-related jobs
Records of scholarships for health personnel
Labour market dynamics
Sudan Medical Council Registry of doctors, dentists and pharmacists
Periodically updated registry (relicensing)
Capacity building
Council for Allied Health Professions
Registry of nurses and paramedical staff
Periodically updated registry (relicensing)
Capacity building
Sudan Medical Specialization Board
Records of registered doctors enrolled for specialized training
Annual report on intake and graduation
Sudan Health and Social Professions Trade Union
No role Records of membership (regularly updated)
Sudan Doctors Union No role Records of membership
Records of doctors abroad
Capacity building
Negotiation
Army Medical Corps No obvious role Records and reports on health workers affiliated to the armed forces
Police Health Services Department
No obvious role Records and reports on health workers affiliated to police services
Secretariat for Sudanese Working Abroad
Records of some categories of migrant Sudanese health personnel
Records of all categories of migrant health workers
Annual analytical report on health workers abroad
Health Insurance Fund No obvious role Records of health workers affiliated to the National Health Insurance Fund
Annual report on characteristics of health workers
Quality of practice
National Centre for Information
No role Facilitation of access to data and information across different government agencies
Support for analysis and other technical aspects of data collection and use
Ministry of Health/ Government of Southern Sudan
Records of health workers in the country’s southern region
Comprehensive records on all health workers
Annual report on characteristics of health workers
Health workforce development policies
Facilitation of dialogue
Coordination
WHO Country Office for Sudan
Technical support to the Federal Ministry of Health
Support for health workforce assessments
Support and technical assistance in the area of information and communication technology
Regional networking and exchange of experience
a. Current role as assessed in early 2007.
Source: Badr (38).

Handbook on monitoring and evaluation of human resources for health
166
Box 12.3 Brazil Human Resources for Health Observatory
In Brazil, the national Human Resources for Health Observatory (Observatório de Recursos Humanos en
Saúde do Brasil) comprises a network of some two dozen workstations that has been gradually developed
across universities and state-level health departments. The work is led by a secretariat based in the
Federal Ministry of Health in partnership with the WHO Country Office for Brazil, which provided financial
and technical support.
The workstations focus on the following:
HRH research oriented to specific topics and requests proposed by the Ministry of Health;
sharing and disseminating the results of such research as a public good through different channels, but
most notably via the observatory’s web portal (39);
joint activities and products, including regular meetings and newsletters;
facilitating the entry of new members into the network;
cooperating with other centres in Brazil and in other countries of the Latin America and Caribbean
region in the promotion of the HRH research agenda.
Over the years, the different workstations have produced a number of thematic research reports, some
of which have been compiled into a series of books. The network has also created several tools and
instruments available in the public domain for HRH practitioners, such as methodologies for contracting
public health workers, software for analysing health services labour markets and databases of health
professions training institutions.
to improve information and knowledge flows in support
of evidence-based decision-making to address health
workforce challenges in countries. As illustration,
Table 12.2 reviews a selection of studies undertaken
in the context of the Brazilian observatory network and
their role in influencing national HRH policies.
Box 12.2 Africa Health Workforce Observatory
Among a series of recent initiatives to monitor and address the HRH crisis in Africa, home to critical
shortages and imbalances of health personnel, was the establishment the Africa Health Workforce
Observatory (34).
The observatory was started with a small secretariat based in the WHO Regional Office for Africa. A
range of activities aimed to improve HRH data, information and evidence across the region. The main
tasks and functions include information dissemination, facilitating networking for sharing of experiences,
intercountry studies to contribute to national policy-making processes and support for additional national-
level activities.
The work of the regional secretariat is guided by a steering group comprising representatives of the
observatory’s key partners, including the regional economic communities of the African Union, the New
Partnership for Africa’s Development, academic and training institutions, international organizations (WHO,
World Bank, European Commission) and bilateral agencies (for example the United States Agency for
International Development).
A core priority of the regional observatory is to support the establishment and strengthening of national
HRH observatories. The Ethiopia Health Workforce Observatory was the first launched at the national level,
followed by those in Ghana and the United Republic of Tanzania. Others are also in the process of being
establishing in a number of countries, often with additional support from subregional groupings such as
the East, Central and Southern African Health Community or the West African Health Organization. The
national health workforce observatories work to bring together stakeholders for policy dialogue on HRH
issues at the country level.

Getting information and evidence into policy-making and practice: strategies and mechanisms
167
Box 12.4 Ghana Health Workforce Observatory
The Ghana Health Workforce Observatory started as an HRH technical team in 2005. With support
from key stakeholders involved in health workforce planning, monitoring, training and management, the
technical team developed a five-year plan to guide HRH development policies and strategies in the
country (40). The team was eventually expanded and transformed into an observatory. Bringing on board
many other national and international partners, it was established as part of the larger regional Africa
Health Workforce Observatory (see Box 12.2). The Ghana observatory and its official web site were
launched by the Deputy Minister of Health in December 2007 (41).
The Ghana observatory is composed of an advisory body, a technical committee and a secretariat with
representation from the Ministry of Health and other government ministries and agencies, universities and
other stakeholder institutions. Its objectives are to:
strengthen the stewardship and regulation capacity of the Ministry of Health and its agencies;
support and promote evidence-informed HRH policy-making;
strengthen the knowledge base and use of data and information in HRH for policy and
decision-making;
increase capacity in evaluating and monitoring the human resource situation and trends in the
health sector;
provide a forum and a network for sharing experience among HRH data producers and users.
Since its inauguration the observatory has convened several events, including an HRH round-table
conference in June 2008 that sought to instigate action on the five-year strategic plan and also identify
gaps in the existing document. The role of the observatory would be to serve as machinery for the
implementation of decisions agreed upon during this first (and any subsequent) stakeholder conference.
Source: Contributed by James Antwi, Deputy Director, Human Resources for Health Development, Ministry of Health, Ghana.
Table 12.2 Influences of selected achievements of the Brazilian Human Resources for Health Observatory on policy processes
Resulting policy decisions Health workforce study or analysis
Incentives for health workers in rural areas Profile of HRH stock and distribution: snapshot and cohort studies
Creation of a joint high-level working group with the Ministry of Health and Ministry of Education
Trends in education and training for health professions (expansion, mix)
Long-distance training programmes Assessment of managerial skills of district (municipal) health teams
Policy dialogue and governmental proposal for regulatory norms (decree/law)
Contractual arrangements of the national health system in the public sector (federal and state levels)
Expansion of education and training programmes for selected health professions (including nursing and certain medical specialization programmes)
Assessment of workforce skills mix, with attention to selected health professions (e.g. team composition of dental workforce, including dentists, auxiliary dentists and dental hygiene technicians)
Permanent negotiation round table
Regulation of new health professions
Professional practices and interests (e.g. conflicts in scopes of practice)
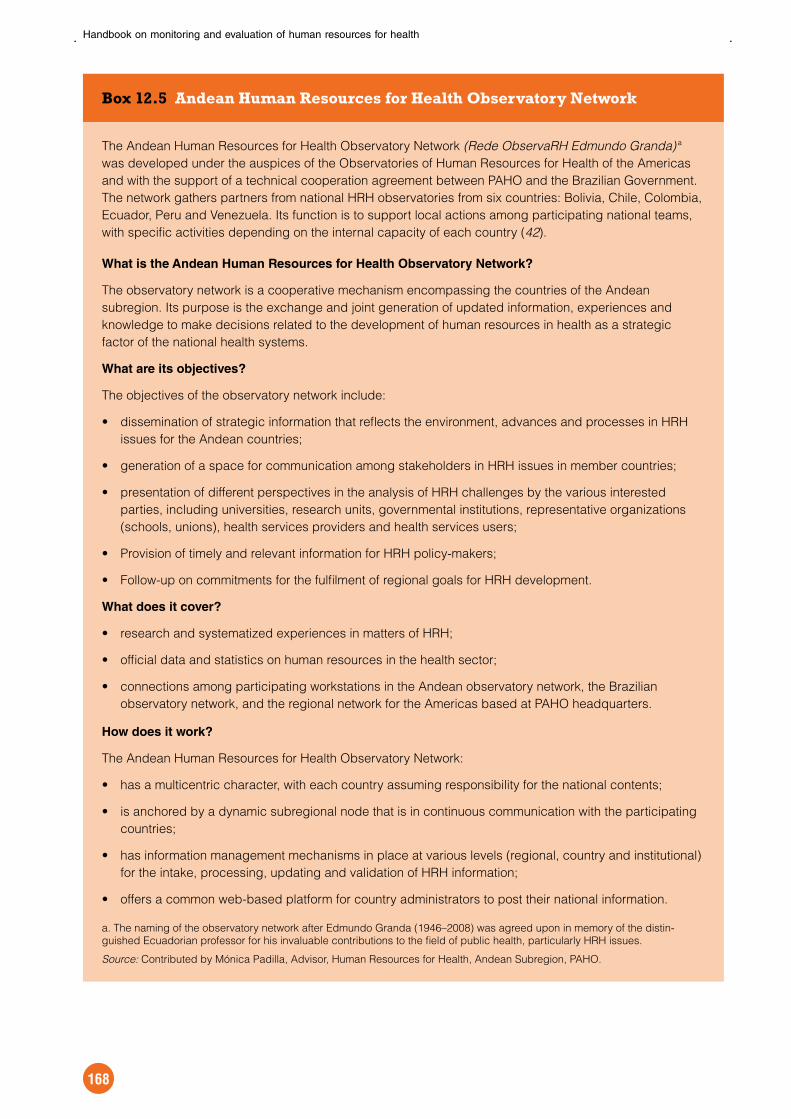
Handbook on monitoring and evaluation of human resources for health
168
Box 12.5 Andean Human Resources for Health Observatory Network
The Andean Human Resources for Health Observatory Network (Rede ObservaRH Edmundo Granda) a
was developed under the auspices of the Observatories of Human Resources for Health of the Americas
and with the support of a technical cooperation agreement between PAHO and the Brazilian Government.
The network gathers partners from national HRH observatories from six countries: Bolivia, Chile, Colombia,
Ecuador, Peru and Venezuela. Its function is to support local actions among participating national teams,
with specific activities depending on the internal capacity of each country (42).
What is the Andean Human Resources for Health Observatory Network?
The observatory network is a cooperative mechanism encompassing the countries of the Andean
subregion. Its purpose is the exchange and joint generation of updated information, experiences and
knowledge to make decisions related to the development of human resources in health as a strategic
factor of the national health systems.
What are its objectives?
The objectives of the observatory network include:
dissemination of strategic information that reflects the environment, advances and processes in HRH
issues for the Andean countries;
generation of a space for communication among stakeholders in HRH issues in member countries;
presentation of different perspectives in the analysis of HRH challenges by the various interested
parties, including universities, research units, governmental institutions, representative organizations
(schools, unions), health services providers and health services users;
Provision of timely and relevant information for HRH policy-makers;
Follow-up on commitments for the fulfilment of regional goals for HRH development.
What does it cover?
research and systematized experiences in matters of HRH;
official data and statistics on human resources in the health sector;
connections among participating workstations in the Andean observatory network, the Brazilian
observatory network, and the regional network for the Americas based at PAHO headquarters.
How does it work?
The Andean Human Resources for Health Observatory Network:
has a multicentric character, with each country assuming responsibility for the national contents;
is anchored by a dynamic subregional node that is in continuous communication with the participating
countries;
has information management mechanisms in place at various levels (regional, country and institutional)
for the intake, processing, updating and validation of HRH information;
offers a common web-based platform for country administrators to post their national information.
a. The naming of the observatory network after Edmundo Granda (1946–2008) was agreed upon in memory of the distin-
guished Ecuadorian professor for his invaluable contributions to the field of public health, particularly HRH issues.
Source: Contributed by Mónica Padilla, Advisor, Human Resources for Health, Andean Subregion, PAHO.
Getting information and evidence into policy-making and practice: strategies and mechanisms
169
12.4 Opportunities and directionsThe development and sustainability of long-term, com-
prehensive HRH policies and plans is a common
challenge for all countries to ensure the health work-
force is prepared to meet current and future health
system objectives and population health needs with
equitable and adequate coverage. In many coun-
tries, this entails strengthening institutional capacity for
defining appropriate policies and revising them period-
ically, which itself is dependent upon close cooperation
among a wide range of stakeholders in the policy dia-
logue from the inception stages. This includes not only
the ministry of health but also other sectors: finance
department, public service commission, educational
bodies, health professional regulatory bodies and
associations, programme managers (in the public,
parapublic and private sectors), development partners
and health services users’ groups. In order to achieve
balance across the different perspectives, and being
mindful that each country has specific challenges and
contexts for workforce development, a common frame-
work needs to be identified where collaborative efforts
can be focused. To this end, this chapter has exam-
ined various strategies and mechanisms to ground
HRH policies and strategies in scientific information
and evidence.
The sustainable provision of timely, reliable and relevant
data, information and evidence to improve HRH pol-
icies requires mechanisms to facilitate dissemination,
access and use in policy-making processes. Different
knowledge transfer platforms (such as EVIPNet) and
cooperative mechanisms (health workforce observato-
ries) can offer the opportunity for global and national
health institutions to take advantage of the latest inno-
vative and sound tools to support decision-making.
Their value lies in the forums they extend to facilitate
sharing of information and experiences and promotion
of collaborations at the national, regional and interna-
tional levels.
In particular, health workforce observatories can be a
good mechanism to facilitate the steering and nego-
tiating processes of cooperative partnerships. They
can contribute to the strengthening of working rela-
tions and development of joint agendas among
stakeholders. Their informational products help bring
new evidence on the health workforce situation to a
broader audience, often in a standardized way to fos-
ter better understanding and dialogue for comparisons
and benchmarking. Perhaps most crucially, they can
effectively raise the priority of HRH issues in the health
development agenda; for example, through its working
groups and mobilization efforts, the Observatories of
Human Resources for Health of the Americas network
has been credited as central in shaping the agenda for
long-term, intentional and coordinated efforts for HRH
development at the international, national, regional and
subregional levels (43).
A number of critical success factors in moving forward
with health workforce observatories and enhancing
their benefits have been identified (44). They include:
championing HRH issues in the country (including
high-level political commitment and leadership);
engaging all key stakeholders in joint planning and
nurturing joint work;
ensuring effective coordination;
building awareness and capacity in HRH issues;
developing approaches from different experiences;
harmonizing standards, definitions and indicators
for HRH profiling and analysis;
supporting networks of HRH researchers;
institutionalizing coordination mechanisms (man-
date and legitimacy);
creating a communication mechanism for tracing
the available information for public use (for exam-
ple a web site);
mobilizing resources (technical and financial).
In summary, health workforce observatories and other
knowledge transfer platforms present dynamic and
evolving networks, which can only stand to bene-
fit from increasing numbers of participating countries
and institutions. Securing the initial commitment is
often a challenge in establishing such mechanisms,
but maintaining interest and commitment (often while
coping with political changes and shifting donor prior-
ities) is another critical concern. This requires regular
dissemination of products that have proven to be use-
ful, active sharing and exchange of information and
knowledge, and continuous advocacy activities. The
last-mentioned should including a strong, actionable
communications strategy – aimed at policy-makers,
managers, researchers and other relevant stakeholders
inclusively – to advocate recognition of health workers
as the foundation of health systems and implemen-
tation of effective strategies to directly address HRH
bottlenecks, barriers and funding gaps at all levels.
Handbook on monitoring and evaluation of human resources for health
170
References1. Clancy CM, Cronin K. Evidence-based decision
making: global evidence, local decisions. Health
Affairs, 2005, 24(1):151–162 (http://content.
healthaffairs.org/cgi/content/full/24/1/151, accessed
29 January 2009).
2. Wallace A et al. Meeting the challenge: developing
systematic reviewing in social policy. Policy Politics,
2004, 32:445–470.
3. Sheldon TA. Making evidence synthesis more
useful for management and policy-making. Journal
of Health Services Research and Policy, 2005,
10(Suppl. 1):1–5 (http://jhsrp.rsmjournals.com/cgi/
reprint/10/suppl_1/1, accessed 29 January 2009).
4. Bowen S, Zwi AB. Pathways to “evidence-informed”
policy and practice: a framework for action.
PLoS Medicine, 2005, 2(7):1–14 (http://medicine.
plosjournals.org/archive/1549–1676/2/7/pdf/10.1371_
journal.pmed.0020166-L.pdf, accessed 29 January
2009).
5. Lavis J et al. Towards systematic reviews that inform
health care management and policy-making. Journal
of Health Services Research and Policy, 2005,
10(Suppl. 1):35–48 (http://jhsrp.rsmjournals.com/cgi/
reprint/10/suppl_1/35, accessed 29 January 2009).
6. Tomson G et al. Decision-makers and the usefulness
of research evidence in policy implementation:
a case study from Lao PDR. Social Science and
Medicine, 2005, 61(6):1291–1299.
7. Tetroe JM et al. Health research funding agencies’
support and promotion of knowledge translation:
an international study. Milbank Quarterly, 2008,
86(1):125–155.
8. About knowledge translation. Canadian Institutes of
Health Research (http://www.cihr-irsc.gc.ca/e/29418.
html, accessed 29 January 2009).
9. Walt G, Gilson L. Reforming the health sector in
developing countries: the central role of policy
analysis. Health Policy and Planning, 1994,
9(4):353–370.
10. Innvaer S et al. Health policy-makers’ perceptions of
their use of evidence: a systematic review. Journal
of Health Services Research and Policy, 2002,
7(4):239–244.
11. Lavis JN et al. How can research organizations more
effectively transfer research knowledge to decision
makers? Milbank Quarterly, 2003, 81(2):221–248.
12. Lavis JN et al. Use of research to inform public
policymaking. Lancet, 2004, 364(9445):1615–1621.
13. What is health policy and systems research and why
does it matter? Briefing Note No. 1. Geneva, Alliance
for Health Policy and Systems Research and World
Health Organization, 2007 (http://www.who.int/
alliance-hpsr/resources/Alliance%20HPSR%20-%20
Briefing%20Note%201.pdf, accessed 29 January
2009).
14. Lavis J et al. Examining the role of health services
research in public policymaking. Milbank Quarterly,
2002, 80(1):125–154.
15. Siddiqi K, Newell J, Robinson M. Getting evidence
into practice: what works in developing countries?
International Journal for Quality in Health Care, 2005,
17(5):447–453.
16. Strengthening health systems: the role and promise
of policy and systems research. Geneva, Alliance for
Health Policy and Systems Research, 2004 (http://
www.who.int/alliance-hpsr/resources/Strengthening_
complet.pdf, accessed 29 January 2009).
17. Stepping stones to improving the monitoring of vital
events. Geneva, Health Metrics Network, 2007
(http://www.who.int/healthmetrics/tools/logbook/en/
move/web/index.html, accessed 29 January 2009).
18. Trostle J, Bronfman M, Langer A. How do
researchers influence decision-makers? Case
studies of Mexican policies. Health Policy and
Planning, 1999, 14(2):103–114 (http://heapol.
oxfordjournals.org/cgi/reprint/14/2/103?ck=nck,
accessed 29 January 2009).
19. De Savigny D et al. Fixing health systems: linking
research, development, systems, and partnerships.
Ottawa, International Development Research Centre
and Tanzania Ministry of Health, 2004.
20. Regional East African Community Health-Policy
Initiative. REACH-Policy Initiative: prospectus.
Arusha, East African Community, 2005 (http://
www.idrc.ca/uploads/user-S/11551301781REACH_
Prospectus.pdf, accessed 29 January 2009).
21. Sauerborn R, Nitayarumphong S, Gerhardus A.
Strategies to enhance the use of health systems
research for health sector reform. Tropical Medicine
and International Health, 1999, 4(12):827–835.
22. Lomas J. Connecting research and policy. ISUMA,
2000, 1(1):140–144 (http://portals.wi.wur.nl/files/docs/
ppme/lomas_e.pdf, accessed 29 January 2009).
23. Pawson R et al. Realist review: a new method of
systematic review designed for complex policy
interventions. Journal of Health Services Research
and Policy, 2005, 10(Suppl. 1):21–34.
24. Muir Gray JA. Evidence-based healthcare: how to
make health policy and management decisions, 2nd
ed. Edinburgh, Churchill Livingstone, 2001.
25. Lavis JN et al. Assessing country-level efforts to
link research to action. Bulletin of the World Health
Organization, 2006, 84(8):620–628 (http://www.who.
int/bulletin/volumes/84/8/06–030312.pdf, accessed
29 January 2009).
26. Evidence-Informed Policy Network (EVIPNet). World
Health Organization (http://www.who.int/rpc/evipnet,
accessed 29 January 2009).
27. Hamid M et al. EVIPNet: translating the spirit of
Mexico. Lancet, 2005, 366:1758–1760.
28. van Kammen J, de Savigny D, Sewankambo N.
Using knowledge brokering to promote evidence-
based policy-making: the need for support
structures. Bulletin of the World Health Organization,
2006, 84(8):608–612 (http://www.who.int/bulletin/
volumes/84/8/05–028308.pdf, accessed 29 January
2009).

Getting information and evidence into policy-making and practice: strategies and mechanisms
171
29. Hemmings J, Wilkinson J. What is a public
health observatory? Journal of Epidemiology and
Community Health, 2003, 57:324–326 (http://jech.
bmj.com/cgi/content/full/57/5/324, accessed 29
January 2009).
30. European Observatory on Health Systems and
Policies (http://www.euro.who.int/observatory,
accessed 29 January 2009).
31. El Observatorio de Recursos Humanos en las
Reformas Sectoriales en Salud (http://www.
observatoriorh.org, accessed 29 January 2009).
32. Figueras J (as interviewed by Richards T). European
observatory will promote better health policy.
British Medical Journal, 1999, 318(7180):352
(http://www.pubmedcentral.nih.gov/articlerender.
fcgi?artid=1114839, accessed 29 January 2009).
33. Rigoli F, Arteaga O. The experience of the Latin
America and Caribbean Observatory of Human
Resources in Health. Report prepared for the Joint
Learning Initiative, 2004 (http://www.observatoriorh.
org/eng/pdfs/arteagaObervatoryHR.pdf, accessed
29 January 2009).
34. Africa Health Workforce Observatory (http://www.
afro.who.int/hrh-observatory/, accessed 29 January
2009).
35. Africa Health Workforce Observatory: concept and
implementation strategy. Geneva, World Health
Organization et al., 2006 (http://www.afro.who.
int/hrh-observatory/documentcentre/concept_
implementation_strategy.pdf, accessed 29 January
2009).
36. Eastern Mediterranean Region Observatory on
Human Resources for Health (http://www.emro.who.
int/hrh%2Dobs/, accessed 29 January 2009).
37. African atlas of the health workforce. World
Health Organization and Africa Health Workforce
Observatory (http://www.afro.who.int/hrh-
observatory/hwinformation/index.html, accessed 29
January 2009).
38. Badr EE. Establishing an observatory on human
resources for health in Sudan. Report prepared for
the World Health Organization and Federal Ministry
of Health of the Republic of Sudan, 2007 (http://
www.hrhobservatory.sd/Documents/observatory-
Badr.pdf, accessed 29 January 2009).
39. Rede ObservaRH: Observatório de Recursos
Humanos en Saúde do Brasil (http://www.
ObservaRH.org.br, accessed 29 January 2009).
40. Ministry of Health of the Republic of Ghana. Human
resource policies and strategies for the health
sector, 2007–2011. Accra, Ministry of Health of
the Republic of Ghana, Quality Health Partners
and World Health Organization, 2007 (http://www.
ghanahrhobservatory.org/downloads/hrh_policy_
and_plan.pdf, accessed 29 January 2009).
41. Ghana Health Workforce Observatory (http://www.
ghanahrhobservatory.org, accessed 29 January
2009).
42. Observatorio Andino de Recursos Humanos en
Salud (http://bvsde.per.paho.org/oarhs2/index.php,
accessed 29 January 2009).
43. Toronto Call to Action 2006–2015: towards a decade
of human resources in health for the Americas.
Report of the regional meeting of the Observatory of
Human Resources in Health, 4–7 October 2005. Pan
American Health Organization et al., 2005 (http://
www.observatoriorh.org/Toronto/CallAction_eng1.
pdf, accessed 29 January 2009).
44. Report of the meeting of the Africa Health Workforce
Observatory, 26–29 September 2006, Arusha,
Tanzania. Africa Health Workforce Observatory,
2006 (http://www.afro.who.int/hrh-observatory/
documentcentre/meetingreports/arusha_meeting_
report_09_07.pdf, accessed 29 January 2009).

Handbook on monitoring and evaluation of human resources for health
172
Index
173
IndexNote: Page numbers in bold type refer to main entries
AAbsenteeism 29, 56, 152–153
Accounting systems 65–67, 71–72, 76Administrative records 27, 30, 66–67, 113–126
Africa (see also under the names of specific countries)health worker shortfalls and imbalances 79out-migration 53, 54–55, 58
Africa Health Workforce Observatory 163, 166
Age distribution of health workers 27, 28, 86, 87, 110Algeria, out-migration 54Americas (see also under the names of specific countries)
education and training 42Andean Human Resources for Health Observatory Network 168Angola, out-migration 55Antigua and Barbuda, out-migration 55Argentina
census data 105educational attainment 109gender analysis 106, 107, 109
Assessment of Human Resources for Health (WHO) 84Australia, out-migration 54
BBrazil
census data 105educational attainment 109gender analysis 106, 107, 109HRH information and management system 122–125HRH observatory 166, 167
CCambodia
census data 105educational attainment 109gender analysis 106, 107, 109
Canadaout-migration 54retirement 56working hours estimation 69
Caribbean countries, out-migration 54–55Census data, see Population census dataCentral African Republic, workforce mortality 55Central Product Classification (CPC) 65Certification and licensing, see Professional certification and
licensingChile
census data 105educational attainment 109gender analysis 107, 109
China, out-migration 54Civil service payroll registries 30Classification of the Functions of Government (COFOG) 65Classification of the Outlays of Producers According to Purpose
(COPP) 65Classification systems
economic sectors 20education and training programmes 14–16, 17expenditure 65–66, 71–72, 74health facilities 86
health workers 14–22, 85–86occupations 16, 18–19
COFOG (Classification of the Functions of Government) 65Computer-based records, see Information technologyCongo, workforce mortality 55Coping strategies 133COPP (Classification of the Outlays of Producers According to
Purpose) 65Corrupt practices 133, 136, 137, 138, 152–154
Costs, see ExpenditureCôte d’Ivoire, workforce mortality 55CPC (Central Product Classification) 65Cuba, out-migration 54Cultural competency 41Cultural factors 129, 161
DData collection
to complement existing sources 27guides and recommendations 21health facility assessments 81–82human resources information systems 117methods 81–82, 84qualitative research 138–141tools 21, 66, 72, 83–84
workforce entry 43Data management 33, 43, 117Data presentation 31Data protection 43, 117–118Data quality 8, 117, 126Data security, see Data protectionData sources (see also Administrative records; Labour force
surveys; Population census data) 14, 25, 27, 30–31
education and training 44entry to the workforce 44–45expenditure 66–67synthesis 147–154workforce transitions and exits 51–52
Data verification 35, 44–45, 76Definitions
data 4health facilities 86health sector 66health workers 13–14, 85indicators 4monitoring and evaluation 4remuneration 70–71
Demographic factors 27Denmark, exits from the workforce 56Density of health workers 28, 32, 88, 105, 151–152Distribution of health workers (see also Geographical distribu-
tion of health workers; Skills mix) 92–94Dual practice 28, 85, 133
EEarnings, see RemunerationEastern Mediterranean Region Observatory on Human
Resources for Health 163–164Economic sectors, classification 18–19
Handbook on monitoring and evaluation of human resources for health
174
Ecuadorcensus data 105educational attainment 109gender analysis 106, 107, 109
Education and training 37–40accreditation of institutions 39–40, 44capacity and output of institutions 6, 40, 42, 44, 45classification of programmes 14–16, 17eligibility requirements 39, 44expenditure 68–69facility-based assessments 94, 95gender analysis 108–109indicators 44recruitment and selection 39, 44
Egypt, out-migration 54Employment relationship 71Employment surveys, see Labour force surveysEntry to the workforce (see also Education and training) 37–47,
86–87certification and licensing 41education and training 39–40international in-migration 40measurement issues 42–46recruiting back individuals 57recruitment into labour market 41–42
Equity in the workforce (see also Gender distribution of health workers) 65
Ethiopiaabsenteeism in the workforce 132qualitative research 132, 136, 137, 138, 139, 142workforce mortality 55
European Observatory on Health Systems and Policies 162European System of Accounts 65Eurostat, expenditure data collection 66, 72Evidence-based policy-making 6, 159–169Evidence-Informed Policy Network (EVIPNet) 163Exits from the workforce 49, 50, 53–56
facility-based assessments 97–98
gender analysis 109–110indicators 51intersectoral transitions 56migration, see Migration of health workersmortality 55other reasons 56retirement 56
Expenditure (see also Remuneration) 63–77
classification 65–66, 71–72, 74components of 66, 72for education and training 46by funding agent 32, 73government accounts 74health accounts 71–72indicators 64–65measuring 65–71national accounts 72–74sub-accounts 76
FFacility Audit of Service Quality 84Facility-based assessments, see Health facility assessments
(HFAs)Fiji, out-migration 55Flow-based estimates 51, 52Focus groups 135–136, 137–138, 139, 140, 142Former Soviet Union 54Funding for HRH systems, see Resources for HRH systems
GGender distribution of health workers 28, 103–111
Geographical distribution of health workersattrition rates 97data presentation 31data synthesis 152education and training issues 37–38facility-based assessments 92–94indicator 28transitions within a country 52
Germany, out-migration 54Ghana
HRH observatory 167out-migration 54
Ghost workers 30, 152–154
Government expenditure and financingfor education and training 46government accounts 73, 74–76indicators 64
Grenada, out-migration 55Guyana, out-migration 55
HHaiti, out-migration 54Health accounts 65, 71–72, 76Health facility assessments (HFAs) 27, 30, 32, 79–100
active health workforce 88–91data collection methods and tools 81–85definitions and classification 85–86entry to the workforce 86–87exits from the workforce 97–98indicators for 80workforce distribution 92–94workforce education, motivation and performance 94–97
Health Facility Census (HFC) 83Health Metrics Network 6Health occupations 16–19Health workforce
activity indicators 28–29classification 14–22, 85–86, 104composition (see also Gender distribution of health workers;
Skills mix) 65definition 13, 66, 85distribution (see also Geographical distribution of health
workers) 92dynamics (see also Transitions within workforce) 25indicators 28–29monitoring 25–34motivation and performance 8–9, 39, 80, 95–96, 133–134
observatories 126, 162–169productivity indicators 29renewal and loss indicators 29working lifespan 8–9, 38, 49, 57, 76, 80, 98, 103, 106, 118
HFC (Health Facility Census) 83Household surveys (see also Labour force surveys) 27, 30Human resources information systems (HRIS) 113–126
data management and use 117–118development steps 116–117implementation issues 114–116licensure information system 119–120
Hungarycensus data 105educational attainment 109gender analysis 107, 109

Index
175
IiHRIS Qualify 119Imbalances and inequalities (see also Gender distribution of
health workers) 31Implementation issues 33–35, 114India
geographical distribution of health workers 152out-migration 54workforce analysis 150–152
Indicators 8, 26–29
definition 4disaggregation 26–27education and training 44–45expenditure 64–65for health facility assessments 80for monitoring of HRH system implementation 34, 35, 123–124remuneration 29, 65–66
workforce entry 42, 44–46
workforce transitions and exits 51–53Inequalities, see Gender distribution of health workers;
Geographical distribution of health workersInflows of health workers, see Entry to the workforceInformation and monitoring systems (see also Human resources
information systems (HRIS))assessments for selected countries 6comparability of data 8critical requirements 34implementation issues 33–35, 114indicators for monitoring implementation and use 35management issues 6, 33–34, 114–115strengthening 6–8, 35, 116
Information quality, see Data qualityInformation sources, see Data sourcesInformation technology
access to 7, 33, 43, 115–116open source software 119, 126
In-migration, see Migration of health workersIn-service training 68–69, 94, 95Integrated Public Use Microdata Series (IPUMS) 21, 104International initiatives 3–7International Labour Organization 16, 21, 65, 149International migration, see Migration of health workersInternational Standard Classification of Education (ISCED)
14, 15–16, 21, 26, 39, 43, 46, 65, 85International Standard Classification of Occupations (ISCO)
9, 14, 16, 18–19, 21, 26, 65, 85, 104International Standard Industrial Classification of All Economic
Activities (ISIC) 14, 20, 21, 26, 65, 66, 86Intersectoral mobility, see Exits from the workforceInterviewing methods 82, 134–138
Intrasectoral mobility 50, 56IPUMS (Integrated Public Use Microdata Series) 21, 104Iran, out-migration 54Ireland, out-migration 54ISCED (International Standard Classification of Education)
14, 15–16, 21, 26, 39, 43, 46, 65, 85ISCO (International Standard Classification of Occupations)
9, 14, 16, 18–19, 21, 26, 65, 85, 104ISIC (International Standard Industrial Classification of All
Economic Activities) 14, 20, 21, 26, 65, 66, 86
JJamaica, out-migration 54Japanese International Cooperation Agency (JICA) 83JICA (Japanese International Cooperation Agency) 83
KKenya
active health workforce 88–91distribution of health workers 92–93education and training 94, 95facility-based assessments 86, 94–96international out-migration 53nursing workforce 32–33out-migration 54workforce entry 86, 87workforce mortality 55working hours 96–97
Key indicators, see Indicators
LLabour costs, see ExpenditureLabour force surveys 30, 32–33, 67–68, 152Language and cultural competency 41Lesotho, occupational transition 53Liberia
out-migration 55workforce mortality 55
Licensing of health workers, see Professional certification and licensing
MMacro International, Service Provision Assessment (SPA) 83Madagascar, workforce mortality 55Management and support workers, see Non-clinical workersManagement issues 6, 33–34, 114–115MEASURE Evaluation 84Metadata 31, 66Mexico
geographical distribution of health workers 31health-care expenditure 73identifying data sources 147–150out-migration 54workforce analysis 149–150
Migration of health workerscertification and licensing issues 41codes of practice 57indicators 45international in-migration 40, 41, 45international out-migration 40, 52, 53–55
language and cultural competency 41policy issues 42qualitative research 134transitions within a country 52
Millennium Development Goals 3, 4, 5, 79Monitoring systems, see Information and monitoring systemsMorocco, out-migration 54Mortality among health workers 52, 55, 57Motivation and performance 8–9, 39, 80, 95–96, 133–134
Movements within workforce, see Transitions within workforceMozambique, out-migration 55Multiple data sources, analysis and synthesis 31, 147–154
NNamibia, labour force surveys 32National accounts 65, 72–74
National databases 33National health workforce observatories 164–168Nepal
international out-migration 53out-migration 54

Handbook on monitoring and evaluation of human resources for health
176
Netherlandsexits from the workforce 56workforce data sources 68
New Zealand, out-migration 54Nigeria
entry to the workforce 99exits from the workforce 97–98, 99out-migration 54workforce entry 86, 87
Non-clinical workers 8, 13, 14, 16, 20, 108Non-health activities of health service personnel 108Non-monetary benefits 95–96Nursing
gender analysis 109–110international migration 53, 54qualification and registration 54, 120, 121recruiting back individuals 57workforce analysis in Mexico 149, 150workforce in Kenya 32–33
OObservatories 126, 162–169Occupational groups
classification 16–19, 85–86gender analysis 106–108occupational titles 18skills mix 26, 28, 32, 92, 151transitions between 50, 52, 53, 56
OECD (Organisation for Economic Co-operation and Development) 53, 54–55, 66, 67, 72
Open source software 119, 126Organisation for Economic Co-operation and Development
(OECD) 53, 54–55, 66, 67, 72Outflows of health workers, see Exits from the workforce
PPacific Islands, out-migration 54–55PAHO, see Pan American Health Organization (PAHO)Pakistan
international out-migration 53out-migration 54
Pan American Health Organization (PAHO)health spending measurement 72HRH observatories 162–163
Partners for Health Reformplus (PHRplus) 83–84Performance indicators, see IndicatorsPerformance of workforce 8–9, 39, 80, 95–96, 133–134
Peru, health-care expenditure 73Philippines
census data 105educational attainment 109gender analysis 106, 107, 109international out-migration 40occupational transition 53out-migration 54
PHRplus (Partners for Health Reformplus) 83–84Poland, out-migration 54Policy-making 159–169Political factors 46, 161Population census data 21, 27
distribution of health workers 31for gender analysis 104–111for workforce analysis 30, 152
Portugal, health accounts 74Pre-service training, see Education and trainingPrivate sector
facility-based assessments 81, 85workforce data 26, 46
Productivity indicators 29Professional certification and licensing 27, 41, 116
case study 119–120indicators 45nurses seeking employment abroad 53, 54registries 30
Public sector expenditures, see Government expenditure and financing
QQualitative methods 129–144
data recording and analysis 141–143design and data collection 138–141illustrations 133–134interviews 134–138value and potential 130–132
Quantitative Service Delivery Survey (World Bank) 84
RRecruitment into labour market (see also Entry to the workforce)
41–42indicators 45recruiting back individuals 57
Registries, professional (see also Professional certification and licensing) 30
Reimbersements 71Remuneration
components of 72–73, 74defining 70–71estimation process 67–68indicators 29, 65–66
non-health activities of health service personnel 68non-observed payments 68–69special groups 68
Renewal and loss indicators 29Resource flows, health system 71–72Resources for HRH systems 3–4, 5, 7, 33, 114Retention of health workers (see also Exits from the workforce)
39, 95–96Retirement of health workers 52–53, 56, 57Romania
census data 105educational attainment 109gender analysis 106, 107, 109
Rural/urban distribution, see Geographical distribution of health workers
Russian Federation, labour data estimation 69Rwanda
absenteeism in the workforce 132census data 105educational attainment 109gender analysis 107, 109health facility assessment 32health workers salaries 32qualitative research 132, 136, 137, 138, 140, 143workforce entry 43workforce mortality 55
SSAM (Service Availability Mapping) 83Sampling methods 81, 84, 85, 99Self-employed income 70–71Service Availability Mapping (SAM) 83Service Provision Assessment (SPA) 83Sexual diversity, see Gender distribution of health workersShortages of health workers 3, 32, 90–91Sierra Leone

Index
177
out-migration 55workforce mortality 55
Situation Assessment of Human Resources in the Public Sector 83–84
Skills mix 26, 28, 32, 92, 151SNA (System of National Accounts) 63, 65, 67, 74Socioeconomic factors 27, 161South Africa
census data 105educational attainment 109gender analysis 106, 107, 109international migration 53national accounts 75out-migration 54
SPA (Service Provision Assessment) 83Specialisms, classification 16Sri Lanka, sectoral transitions 53Standardization issues (see also Classification systems;
Indicators) 8, 21, 26Stock-based estimates 51, 52Sub-accounts 76Sub-Saharan Africa 3, 4, 57
out-migration 54–55Sudan
health workforce monitoring system 120–122HRH observatory 165
Support workers, see Non-clinical workersSurvey data 21, 27
household 27, 30
labour force 30, 32–33, 67–68, 152System of Health Accounts 65–66, 72System of National Accounts (SNA) 63, 65, 67, 74
TTanzania
out-migration 55workforce mortality 55
Thailandcensus data 104, 105educational attainment 109exits from the workforce 110gender analysis 106, 107, 109, 110
Training, see Education and trainingTransitions within workforce (see also Exits from the workforce;
Migration of health workers) 49–53
geographical transitions within a country 52indicators 51–52occupational transition 50, 52, 53, 56between sectors 50, 56
Trinidad and Tobago, out-migration 54, 55Turnover of workforce, see Transitions within workforce
UUganda
census data 104, 105gender analysis 106, 107, 108international out-migration 53licensure information system 119–120student nurses 120, 121workforce mortality 55
Unemployment of health workers 28, 52United Kingdom
exits from the workforce 56in-migration 54international in-migration 53, 57–58
United States of America 39, 53, 68, 104, 133exits from the workforce 56recruiting back nurses 57
United States Agency for International Development (USAID) 65United States President’s Emergency Plan for AIDS Relief
4, 84Urban/rural distribution, see Geographical distribution of health
workersUSAID (United States Agency for International Development)
3, 65, 83
VViet Nam
census data 105educational attainment 109gender analysis 106, 107, 109geographical distribution of health workers 31out-migration 54
Vocational training, see Education and training
WWHO, see World Health Organization (WHO)Women (see also Gender distribution of health workers)Workforce, see Health workforceWorking hours
estimation 68, 69facility-based assessments 96–97
Working lifespan 8–9, 38, 49, 57, 76, 80, 98, 103, 106, 118World Bank 3, 4, 105, 132, 140, 166
expenditure data collection 65Quantitative Service Delivery Survey 84
World Health Organization (WHO) 3, 7, 11, 16, 21, 38, 49, 55, 121, 125, 166
Assessment of Human Resources for Health 84Evidence-Informed Policy Network (EVIPNet) 163expenditure data collection 65, 66, 72, 76health workforce definition 13monitoring toolkit 4primary health-care services coverage 79Service Availability Mapping (SAM) 83The world health report 4, 8, 49
YYugoslavia, out-migration 54
ZZambia
absenteeism and ghost workers 30, 153active health workforce 88analysis of multiple data sources 152–154distribution of health workers 93–94out-migration 54workforce mortality 55
Zimbabweinternational out-migration 53out-migration 54

Handbook on monitoring and evaluation of human resources for health
178
About the publishing agencies
The United States Agency for International Development (USAID) provides support in
developing countries to ensure that health systems are effective, efficient and equitable. An
important component of USAID’s strategy is to strengthen the ability of health workers to
provide quality health care, notably by supporting initiatives for addressing workforce devel-
opment and quality improvement. USAID works through cooperative agreements, contracts
and partnerships with international organizations and other donor agencies to implement and
maximize the effectiveness of its global health activities.
For more information on USAID’s human resources for health (HRH) programme, visit:
www.usaid.gov/our_work/global_health/hs/techareas/workers.html
The World Bank is committed to helping client countries address and achieve the health-
related Millennium Development Goals. The Bank works with client countries’ governments to
develop sustainable projects based on sound policies and strategies. With the country’s own
vision for its development as the starting-point, the Bank is engaged in building sustainable
health systems, of which human resources are a main focus. Securing a qualified health work-
force is part of the Bank’s poverty alleviation strategy. Increasing the management and analysis
skills of health leaders also constitutes an important goal for strengthening health systems.
For more information on the World Bank’s HRH programme, visit:
go.worldbank.org/XR4K48D5M0
The World Health Organization (WHO) provides leadership on global health matters, includ-
ing shaping the health research agenda and articulating evidence-based policy options. WHO
works with partners and countries to plan workforce strategies for health systems strength-
ening and priority health interventions; strengthen the information and knowledge base to
support decision-making for policies and programmes; and develop tools and guidelines for
building capacity in addressing workforce issues among countries and stakeholders.
For more information on WHO’s HRH programme, visit: www.who.int/hrh
For information on WHO regional office activities on HRH, visit:
www.who.int/hrh/activities/regional/en/index.html


Handbook on Monitoring and Evaluation ofHuman Resources for Health
A skilled health worker can make the difference between life and death. It is our job to assure our citizens that health workers will be deployed when and where they are needed to save lives and that they possess skills that are adequate wherever they work, in public, private or not-for-profit
establishments. This new Handbook is welcomed, as it gives us the tools we need to actively monitor and better manage the workforce. The core and common methods described here will help us all to enhance public confidence in the health system and enable the health workforce to be at the right place at the right time to make a difference, both for each of us as individuals and for our communities.
Sally K. Stansfield Executive Secretary
Health Metrics Network
with special applications for
low- and middle-income countries
������������� �������


