59
HANDBOOK FOR REVIEW OF DESIGN AND CONSTRUCTION OF TEMPORARY WORKS FOR DEEP EXCAVATIONS
HANDBOOK FOR REVIEW OF DESIGN AND
CONSTRUCTION OF TEMPORARY WORKS
FOR DEEP EXCAVATIONS
2
Forward
LTA carries out many of the deep excavations in urban areas where groundmovements have to be carefully controlled and monitored to avoid unacceptabledamage to adjacent structures. Temporary works are always the responsibility of thecontractors, however in most projects LTA retains the responsibility as the SupervisingQualified Person (QP). It is therefore necessary for LTA staff to review thesubmissions of temporary works design from the contractors. These reviews are toensure that the proposed temporary works satisfy the codes of practices and the LTAcontract requirements, and that the design and construction follow the best engineeringpractice in the industry.
Information is provided in this handbook for the review of the temporary works designsubmissions.
The handbook is prepared by a working committee comprised:
Wen Dazhi (Leader) Assistant Manager, Civil Design DepartmentCai Min Design Engineer, Civil Design DepartmentChan Chee Weng Senior Engineer, Development & Building Control DepartmentChiam Sing Lih Design Manager (CCL3), Design Management DepartmentJoshua Ong Design Manager (CCL1 & 2), Design Management Department
In addition, the technical group led by Mr. Yong Ah Poh assisted the preparation ofthe graphs and figures in the handbook.
The Working Committee is particularly grateful to Mr. Song Siak Keong, Manager,Civil Design Department and Mr. Paul Fok, Manager, Design ManagementDepartment for their guidance and comments in the preparation of the handbook.
3
HANDBOOK FOR REVIEW OF DESIGN ANDCONSTRUCTION OF TEMPORARY WORKS
FOR DEEP EXCAVATIONS
Contents
1 INTRODUCTION
1.1 Scope of the handbook1.2 Temporary works1.3 Cause of failure
2 DESIGN CONCEPT
2.1 Construction sequences2.2 Design assumptions
3 DESIGN SOIL PARAMETERS
3.1 General3.2 Geotechnical design parameters for Phase I/II MRT projects3.3 Kallang Formation3.4 Old Alluvium3.5 Jurong Formation3.6 Bukit Timah Granite Formation
4 STABILITY CHECKING
4.1 Base heave4.2 Hydraulic uplift4.3 Toe-in depth4.4 Slope stability for open excavation
5 DESIGN ANALYSIS
5.1 Overview of analytical methods5.2 One Dimensional Finite Element Method5.3 Two Dimensional Finite element method5.4 Drained Analysis vs Undrained Analysis5.5 Total Stress Approach vs Effective Stress Approach
4
5.6 Note on Using Effective Stress Approach for Undrained Analysis5.7 Sensitivity Analysis5.8 Back Analysis5.9 Use of Sacrificial JGP5.10 Treatment of berm5.11 Strut design
6 GROUND MOVEMENT
6.1 Prediction of ground movements6.2 Factors affecting ground movements6.3 Consolidation settlements
7 DAMAGE ASSESSMENT
7.1 Classification of damage7.2 Methodology for building damage assessment7.3 Steps for building damage assessment
8 INSTRUMENTATION AND MONITORING
8.1 General8.2 Review Levels
9 PERFORMANCE OF TEMPORARY WORKS
REFERENCES
5
1 INTRODUCTION
1.1 Purpose of the Handbook
The purpose of this handbook is to serve as a guide for review of temporary worksdesign, prediction of ground movement and building damage assessment for deepexcavations. It also gives guidelines for construction supervision of the temporaryworks to ensure that design assumptions are realised and design requirements arecomplied with.
1.2 Temporary Works
For the purposes of this handbook, temporary works refer to retaining structures andthe associated supports for deep excavations. Slopes that are used to stabilise anexcavation during open cut are also considered as temporary works for deepexcavations.
The following retaining wall types are commonly used in Singapore to supportexcavations:
• Sheet pile wall• Soldier pile wall with timber lagging or shotcrete• Diaphragm wall• Secant pile wall• Contiguous bored pile wall• A combination of sheet pile wall and soldier pile wall with lagging
The above can be further divided into the following categories according to the formsof support provided:
• Cantilever wall• Strutted or braced wall• Tie-back or anchored wall
Steel I-beams are commonly used in Singapore as struts and waling for strutted wall.
1.3 Cause of Failure
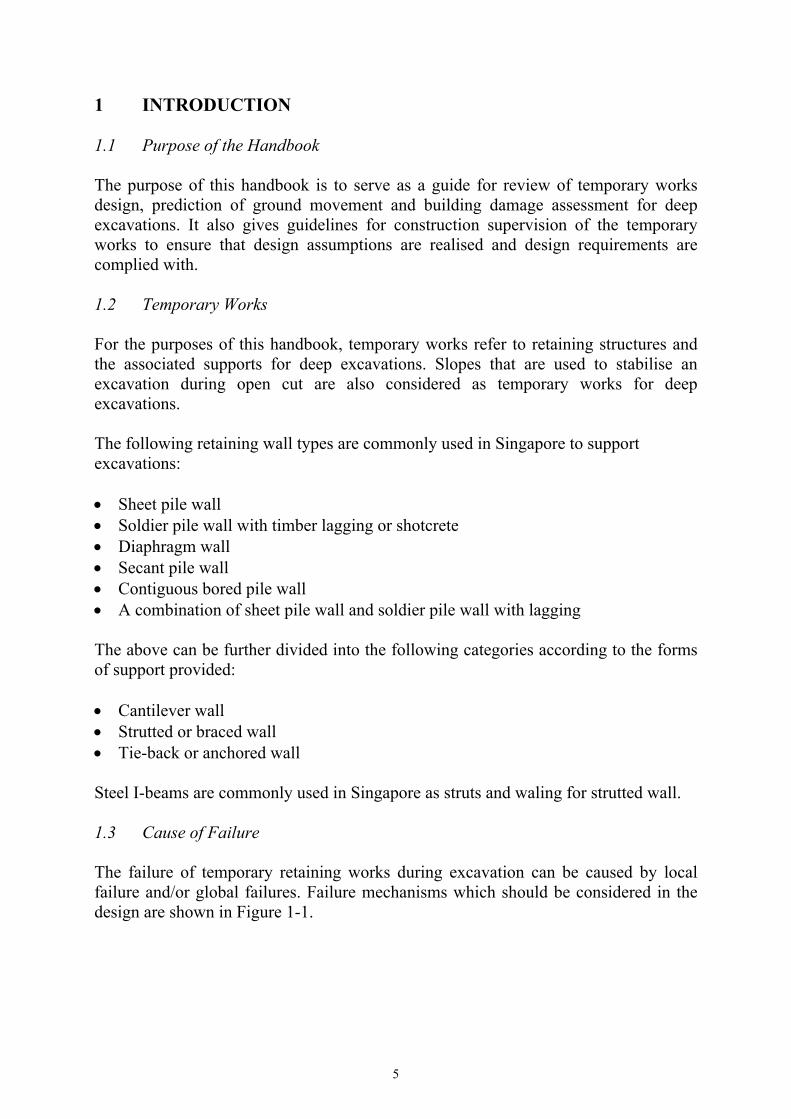
The failure of temporary retaining works during excavation can be caused by localfailure and/or global failures. Failure mechanisms which should be considered in thedesign are shown in Figure 1-1.
6
Figure 1-1. Typpical Failure mechanisms that should be considered in design
(a) Rod failure, anchor failure, bending /pulloutfailure or toe kickout
Passive Anchorage Failure
Break
Break orbend
Excessive Bending
Kickout
ROutsideAnchor
(b) Rotational instability
R
D
Formation
Through Tip
Tie-back
7
2 DESIGN CONCEPT
2.1 Construction Sequences
Before any analysis can be carried out, a construction sequence needs to be developed.The bending moments and shear forces in the retaining wall, the strut loading at everytier of struts and the wall deflection are closely related to the construction sequence.The reinforcement in diaphragm walls in the permanent stage is also affected by theconstruction sequence as part of the earth pressures will produce forces that will belocked in the walls during construction. Therefore the construction sequence adoptedin the design should be clearly shown in the drawing. Any changes to the constructionsequence should be brought to the attention of the designers, and such changes mayrequire a re-design of the retaining system.
2.2 Design Assumptions
Typically the design of temporary retaining walls for deep excavations is based on theassumption of a plane strain condition. This assumption is generally conservative forareas around corners or bends of retaining walls. However the reviewer should takenote of the following:
• Struts are typically spaced at 6 to 8m interval. The stiffness of the struts shouldbe calculated on per meter run basis. The total strut force on each strut will be thereaction from the analysis multiplied by the strut spacing.
• If inclined struts or diagonal struts are used, the stiffness of the struts should beresolved to the direction perpendicular to the retaining wall. The final strut forceshould then be resolved to the axial direction of the struts.
• Where piles or barrettes are within the excavation, the stiffness of the piles orbarrettes, if used in the analysis, should be converted to stiffness per meter run.The total forces (bending moment and shear force) should be calculated as thereaction multiplied by the spacing of the piles or barrettes. Cautions should beexercised when there is soft clay such as the marine clay or peaty clay, as theclay can be squeezed through the gaps between the piles.

8
3 DESIGN SOIL PARAMETERS
3.1 General
The geotechnical parameters are covered in Table 5/3, Chapter 5 of the DesignCriteria. The Table gives minimum values for common design parameters for the soilsand weathered rocks of Singapore. The Table is re-produced in Table 3.1 below.
Table 3.1: Recommended Design Parameters from Design Criteria
MRTC(1983)classifica-tion
Classifica-tion basedon BS5930(1999)
BulkDensity(kN/m3)
Coefficientof earthpressure atrest (ko)
Undrainedcohesion, cu(kN/m2)
Effectivecohesion, c’(kN/m2)
Effectiveangle offriction, φ’(degrees)
Fill Fill 19 0.5 0 0 30
B B 19 0.5 0 0 30
E E 15 1.0 Figure 3.1 0 5
F1 F1 20 0.7 0 0 30
F2 F2 19 1.0 Figure 3.2 0 22
M M 16 1.0 Figure 3.3 0 22
O O Class A 20 1.0 Note 1 Note 2 Note 2
O O Class B 20 1.0 Note 1 Note 2 Note 2
O O Class C 20 1.0 Note 1 Note 2 Note 2
O O Class D 20 1.0 Note 1 Note 2 Note 2
O O Class E 20 1.0 Note 1 Note 2 Note 2
S1 SI 24 0.8 N/A Note 3 Note 3
S1 SII 24 0.8 N/A Note 3 Note 3
S2 SIII 22 0.8 N/A Note 3 Note 3
S2 SIV 22 0.8 N/A Note 3 Note 3
S3 F.C. 22 1.0 Note 1 10 28
S4 SV 21 0.8 N/A 0 30
S4 SVI 21 0.8 Note 1 0 30
G1 GI 24 0.8 N/A Note 3 Note 3
G1 GII 24 0.8 N/A Note 3 Note 3
G2 GIII 23 0.8 N/A Note 3 Note 3
G2 GIV 23 0.8 N/A 0 30
G4 GV 20 0.8 N/A 0 30
G4 GVI 20 0.8 Note 1 0 30N/A: Not Applicable.Note 1: Undrained conditions do not usually apply for deep excavations in these materials, but may beapplicable during tunnelling. The methods outlined in Clough and Schmidt (1981) may be used toassess if undrained parameters are applicable. Typically, design should be carried out for both drained

9
and undrained parameters, and the more conservative of these designs should be adopted. Forundrained analysis, a value of 5 x N (SPT value in blows/300m) kPa, up to N = 50, may be adopted forthe undrained cohesion in these materials, where applicable.Note 2: Effective Stress parameters for the Old Alluvium shall be established for each site based onp’-q plots.Note 3. Effective Stress parameters for these materials should be derived from site-specific data. TheGeological Strength Index method (Hoek and Brown, 1997) is considered appropriate for this.
0
5
10
15
20
25
0 10 20 30 40 50 60
Undrained Cohesion, Cu (kPa)
Dep
th b
elow
gro
und
leve
l (m
)
Figure 3.1. Undrained cohesion for Estuarine clay (E)
0
5
1 0
1 5
2 0
2 5
0 1 0 2 0 3 0 4 0 5 0 6 0
U n d ra in e d C o h e s io n , C u ( k P a )
Dep
th b
elow
gro
und
leve
l (m
)
Figure 3.2. Undrained cohesion for fluvial clay (F2)
10
It is to be noted that the parameters given in the Table 3.1 are intended to represent thelower bound design values of the soil properties as it exists in-situ, as required underBS8002. Higher design values can be used if the designer can demonstrate as beingappropriate, based on the results of the soil investigation for the project.
The following sections give some examples of the design values that have beenpublished for design and research. These sections can serve as a guide when reviewingproposed design parameters submitted from external parties. Where proposed designparameters are outside the commonly adopted range, the reviewer should pay moreattention to examine the justification submitted from external parties in detail.
3.2 Geotechnical Design Parameters for Phase I/II MRT Projects
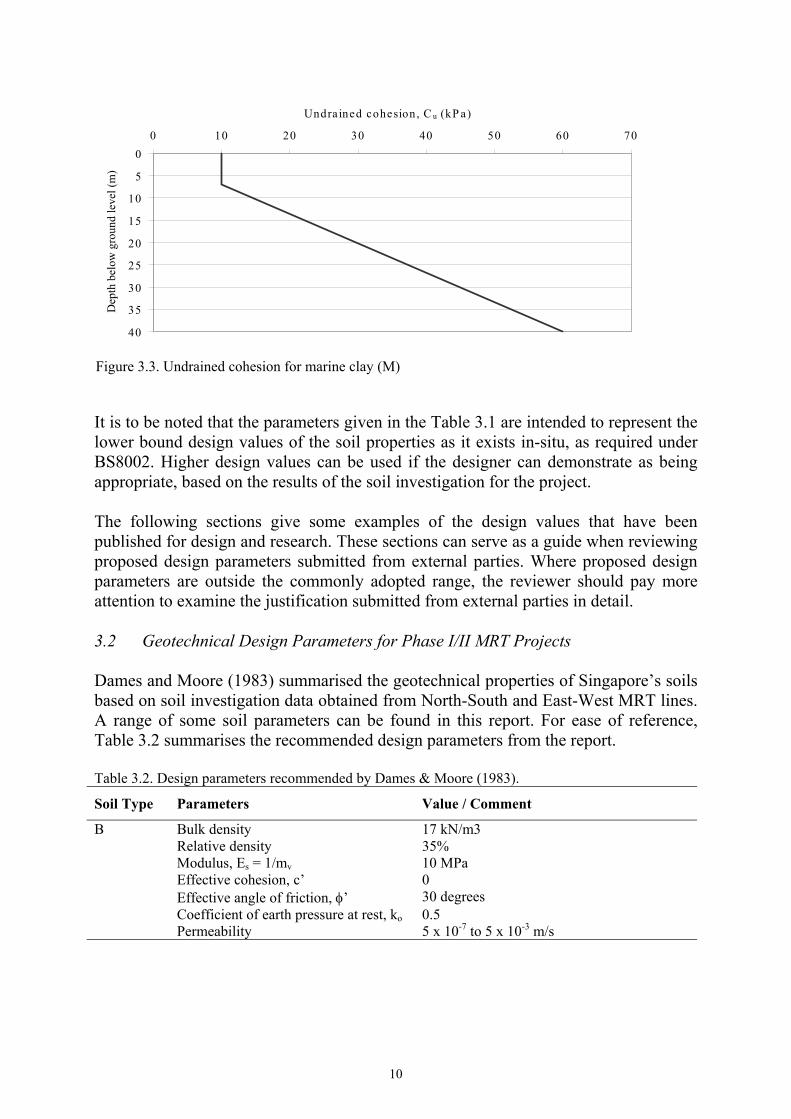
Dames and Moore (1983) summarised the geotechnical properties of Singapore’s soilsbased on soil investigation data obtained from North-South and East-West MRT lines.A range of some soil parameters can be found in this report. For ease of reference,Table 3.2 summarises the recommended design parameters from the report.
Table 3.2. Design parameters recommended by Dames & Moore (1983).
Soil Type Parameters Value / Comment
B Bulk density 17 kN/m3Relative density 35%Modulus, Es = 1/mv 10 MPaEffective cohesion, c’ 0Effective angle of friction, φ’ 30 degreesCoefficient of earth pressure at rest, ko 0.5Permeability 5 x 10⁻⁷ to 5 x 10⁻³ m/s
0
5
10
15
20
25
30
35
40
0 10 20 30 40 50 60 70
Undrained cohesion, C u (kP a)D
epth
bel
ow g
roun
d le
vel (
m)
Figure 3.3. Undrained cohesion for marine clay (M)

11
Table 3.2. Continued
Soil Type Parameters Value / Comment
E Bulk density 14 kN/m3Undrained shear strength, cu • Depth: 0 – 5m: 5 kPa
• Depth 5m +: increase linearly with depthto 50 kPa at 25m depth.
Sensitivity 2Undrained Modulus, Eu 200 - 400 cuEffective cohesion, c’ 0Effective angle of friction, φ’ 5 degreesCompression index, cc cc = 0.0088 (wn – 14), where wn = natural
water contentCoefficient of 2nd compression, cα cα = 0.04 ccCoefficient of consolidation, cv 10 m2/yearCoefficient of earth pressure at rest, ko 0.9 – 1.0Permeability • Design value: 1 x 10⁻⁹ m/s
• Range: 8 x 10-11 to 2 x 10⁻⁷ m/sF1 Bulk density 18 kN/m3
Relative density • Depth 0 to 25m: 35%• Depth 25m +: 50%
Modulus, Es = 1/mv • Depth 0 to 25m: 10 MPa• Depth 25m+: 20 MPa
Effective cohesion, c’ 0Effective angle of friction, φ’ • Depth 0 to 25m: 30 degrees
• Depth 25m+: 34 degreesCoefficient of earth pressure at rest, ko 0.43 to 0.67Permeability 1.0 x 10⁻⁷ to 1.0 x 10⁻⁴ m/s
F2 Bulk density 19 kN/m3Undrained shear strength, cu • Depth: 0 – 10m: 20 kPa
• Depth 10m +: increase linearly with depthto 50 kPa at 25m depth.
Sensitivity 4Undrained Modulus, Eu 14.5 MPaEffective cohesion, c’ 0Effective angle of friction, φ’ 22 degreesCompression index, cc cc = 0.2Coefficient of 2nd compression, cα cα = 0.05Coefficient of consolidation, cv 10 m2/yearPore pressure parameter, A 0.4Coefficient of earth pressure at rest, ko 0.75 – 1.0Permeability • Design value: 1 x 10⁻⁹ m/s
• Range: 4 x 10⁻¹⁰ to 2 x 10⁻⁷ m/sM Bulk density 15 kN/m3
Undrained shear strength, cu • Depth: 0 – 6.7m: 10 kPa (except atMarina area)
• Depth 6.7m+: increase linearly with depthto 60 kPa at 40m depth.
Sensitivity 5Undrained Modulus, Eu 200 cuEffective cohesion, c’ 0Effective angle of friction, φ’ 22 degrees
12
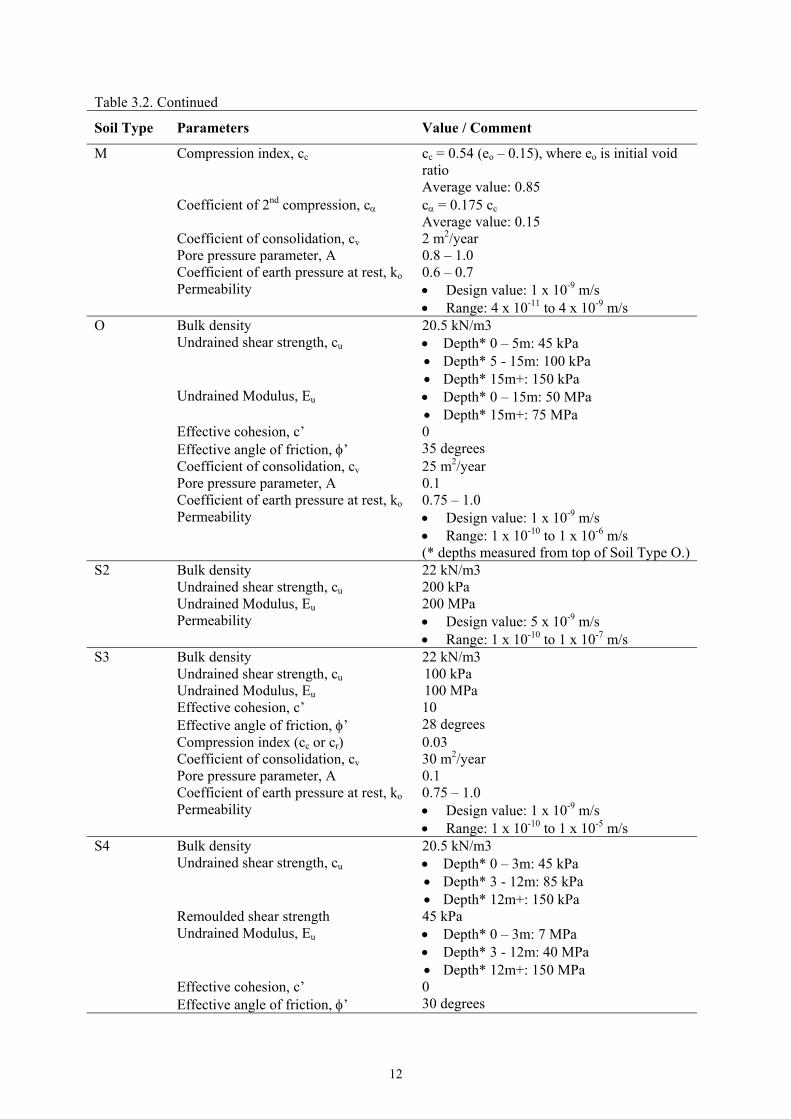
Table 3.2. Continued
Soil Type Parameters Value / Comment
M Compression index, cc cc = 0.54 (eo – 0.15), where eo is initial voidratioAverage value: 0.85
Coefficient of 2nd compression, cα cα = 0.175 ccAverage value: 0.15
Coefficient of consolidation, cv 2 m2/yearPore pressure parameter, A 0.8 – 1.0Coefficient of earth pressure at rest, ko 0.6 – 0.7Permeability • Design value: 1 x 10⁻⁹ m/s
• Range: 4 x 10-11 to 4 x 10⁻⁹ m/sO Bulk density 20.5 kN/m3
Undrained shear strength, cu • Depth* 0 – 5m: 45 kPa• Depth* 5 - 15m: 100 kPa• Depth* 15m+: 150 kPa
Undrained Modulus, Eu • Depth* 0 – 15m: 50 MPa• Depth* 15m+: 75 MPa
Effective cohesion, c’ 0Effective angle of friction, φ’ 35 degreesCoefficient of consolidation, cv 25 m2/yearPore pressure parameter, A 0.1Coefficient of earth pressure at rest, ko 0.75 – 1.0Permeability • Design value: 1 x 10⁻⁹ m/s
• Range: 1 x 10⁻¹⁰ to 1 x 10⁻⁶ m/s(* depths measured from top of Soil Type O.)
S2 Bulk density 22 kN/m3Undrained shear strength, cu 200 kPaUndrained Modulus, Eu 200 MPaPermeability • Design value: 5 x 10⁻⁹ m/s
• Range: 1 x 10⁻¹⁰ to 1 x 10⁻⁷ m/sS3 Bulk density 22 kN/m3
Undrained shear strength, cu 100 kPaUndrained Modulus, Eu 100 MPaEffective cohesion, c’ 10Effective angle of friction, φ’ 28 degreesCompression index (cc or cr) 0.03Coefficient of consolidation, cv 30 m2/yearPore pressure parameter, A 0.1Coefficient of earth pressure at rest, ko 0.75 – 1.0Permeability • Design value: 1 x 10⁻⁹ m/s
• Range: 1 x 10⁻¹⁰ to 1 x 10⁻⁵ m/sS4 Bulk density 20.5 kN/m3
Undrained shear strength, cu • Depth* 0 – 3m: 45 kPa• Depth* 3 - 12m: 85 kPa• Depth* 12m+: 150 kPa
Remoulded shear strength 45 kPaUndrained Modulus, Eu • Depth* 0 – 3m: 7 MPa
• Depth* 3 - 12m: 40 MPa• Depth* 12m+: 150 MPa
Effective cohesion, c’ 0Effective angle of friction, φ’ 30 degrees
13
Table 3.2. Continued
Soil Type Parameters Value / Comment
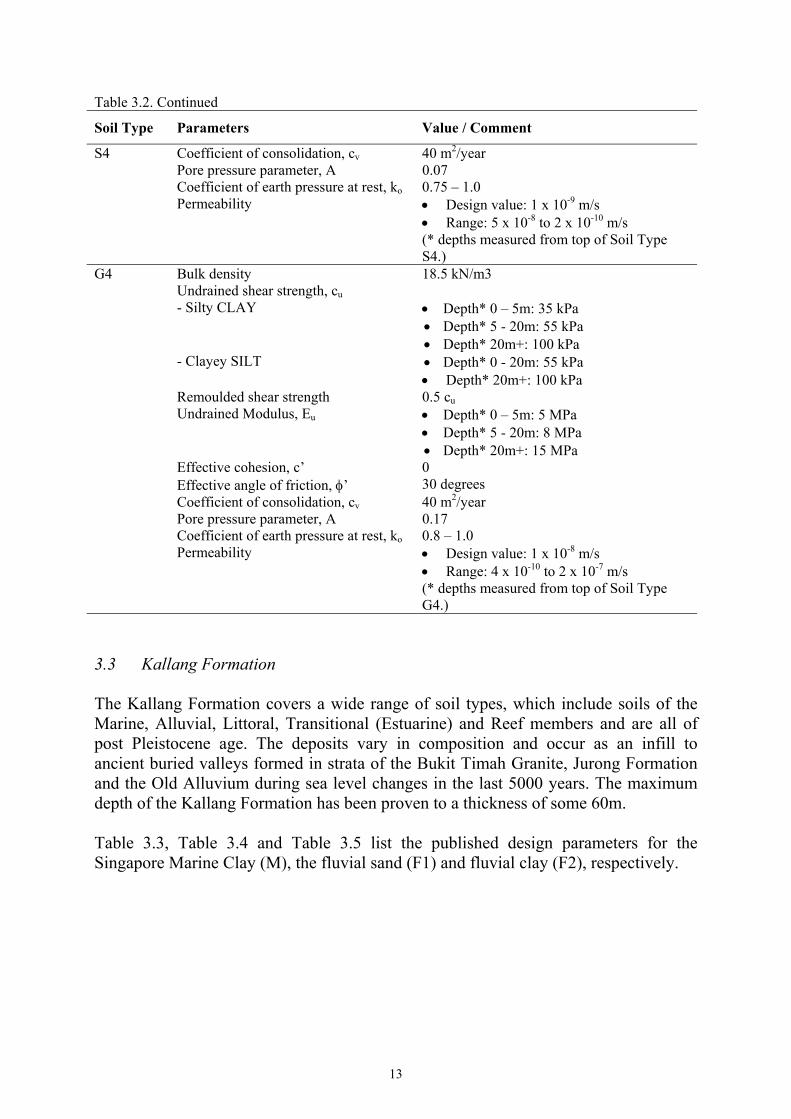
S4 Coefficient of consolidation, cv 40 m2/yearPore pressure parameter, A 0.07Coefficient of earth pressure at rest, ko 0.75 – 1.0Permeability • Design value: 1 x 10⁻⁹ m/s
• Range: 5 x 10⁻⁸ to 2 x 10⁻¹⁰ m/s(* depths measured from top of Soil TypeS4.)
G4 Bulk density 18.5 kN/m3Undrained shear strength, cu- Silty CLAY • Depth* 0 – 5m: 35 kPa
• Depth* 5 - 20m: 55 kPa• Depth* 20m+: 100 kPa
- Clayey SILT • Depth* 0 - 20m: 55 kPa• Depth* 20m+: 100 kPa
Remoulded shear strength 0.5 cuUndrained Modulus, Eu • Depth* 0 – 5m: 5 MPa
• Depth* 5 - 20m: 8 MPa• Depth* 20m+: 15 MPa
Effective cohesion, c’ 0Effective angle of friction, φ’ 30 degreesCoefficient of consolidation, cv 40 m2/yearPore pressure parameter, A 0.17Coefficient of earth pressure at rest, ko 0.8 – 1.0Permeability • Design value: 1 x 10⁻⁸ m/s
• Range: 4 x 10⁻¹⁰ to 2 x 10⁻⁷ m/s(* depths measured from top of Soil TypeG4.)
3.3 Kallang Formation
The Kallang Formation covers a wide range of soil types, which include soils of theMarine, Alluvial, Littoral, Transitional (Estuarine) and Reef members and are all ofpost Pleistocene age. The deposits vary in composition and occur as an infill toancient buried valleys formed in strata of the Bukit Timah Granite, Jurong Formationand the Old Alluvium during sea level changes in the last 5000 years. The maximumdepth of the Kallang Formation has been proven to a thickness of some 60m.
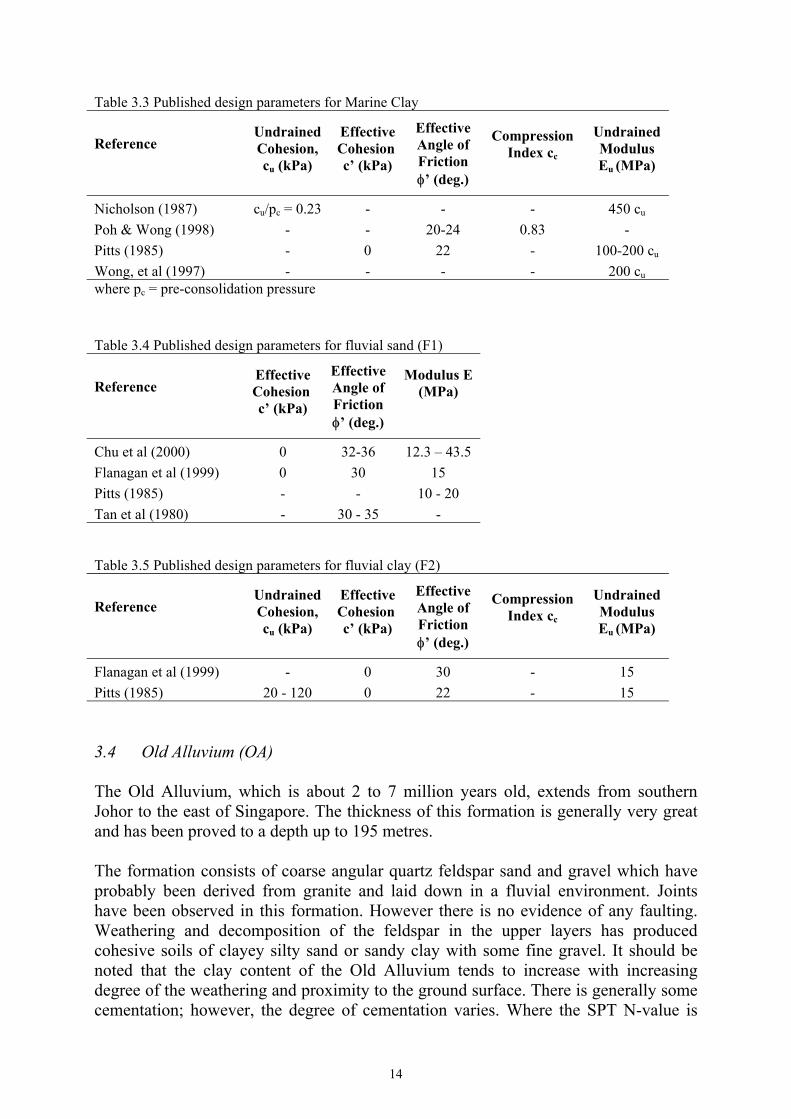
Table 3.3, Table 3.4 and Table 3.5 list the published design parameters for theSingapore Marine Clay (M), the fluvial sand (F1) and fluvial clay (F2), respectively.
14
Table 3.3 Published design parameters for Marine Clay
ReferenceUndrainedCohesion,cu (kPa)
EffectiveCohesionc’ (kPa)
EffectiveAngle ofFrictionφ’ (deg.)
CompressionIndex cc
UndrainedModulusEu (MPa)
Nicholson (1987) cu/pc = 0.23 - - - 450 cu
Poh & Wong (1998) - - 20-24 0.83 -Pitts (1985) - 0 22 - 100-200 cu
Wong, et al (1997) - - - - 200 cu
where pc = pre-consolidation pressure
Table 3.4 Published design parameters for fluvial sand (F1)
ReferenceEffectiveCohesionc’ (kPa)
EffectiveAngle ofFrictionφ’ (deg.)
Modulus E(MPa)
Chu et al (2000) 0 32-36 12.3 – 43.5Flanagan et al (1999) 0 30 15Pitts (1985) - - 10 - 20Tan et al (1980) - 30 - 35 -
Table 3.5 Published design parameters for fluvial clay (F2)
ReferenceUndrainedCohesion,cu (kPa)
EffectiveCohesionc’ (kPa)
EffectiveAngle ofFrictionφ’ (deg.)
CompressionIndex cc
UndrainedModulusEu (MPa)
Flanagan et al (1999) - 0 30 - 15Pitts (1985) 20 - 120 0 22 - 15
3.4 Old Alluvium (OA)
The Old Alluvium, which is about 2 to 7 million years old, extends from southernJohor to the east of Singapore. The thickness of this formation is generally very greatand has been proved to a depth up to 195 metres.
The formation consists of coarse angular quartz feldspar sand and gravel which haveprobably been derived from granite and laid down in a fluvial environment. Jointshave been observed in this formation. However there is no evidence of any faulting.Weathering and decomposition of the feldspar in the upper layers has producedcohesive soils of clayey silty sand or sandy clay with some fine gravel. It should benoted that the clay content of the Old Alluvium tends to increase with increasingdegree of the weathering and proximity to the ground surface. There is generally somecementation; however, the degree of cementation varies. Where the SPT N-value is
15
low, the OA has been weathered after decomposition, and much of the cementationhas been lost.
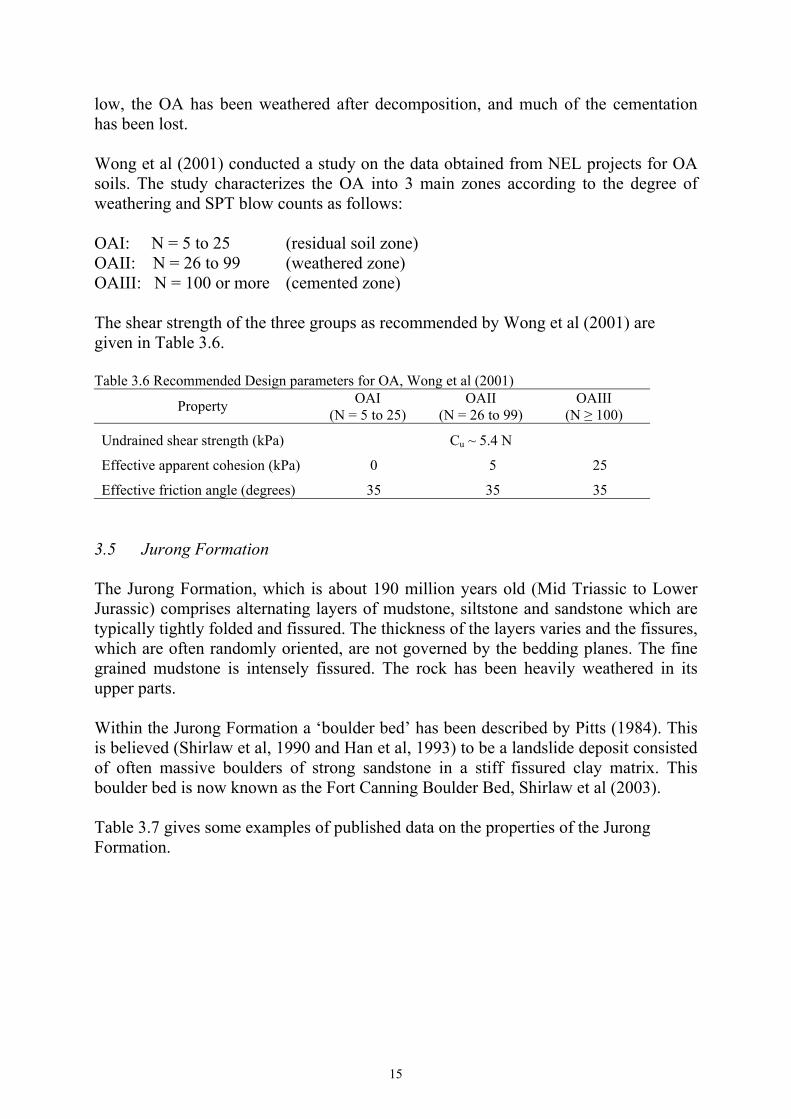
Wong et al (2001) conducted a study on the data obtained from NEL projects for OAsoils. The study characterizes the OA into 3 main zones according to the degree ofweathering and SPT blow counts as follows:
OAI: N = 5 to 25 (residual soil zone)OAII: N = 26 to 99 (weathered zone)OAIII: N = 100 or more (cemented zone)
The shear strength of the three groups as recommended by Wong et al (2001) aregiven in Table 3.6.
Table 3.6 Recommended Design parameters for OA, Wong et al (2001)
Property OAI(N = 5 to 25)
OAII(N = 26 to 99)
OAIII(N ≥ 100)
Undrained shear strength (kPa) Cu ~ 5.4 N
Effective apparent cohesion (kPa) 0 5 25
Effective friction angle (degrees) 35 35 35
3.5 Jurong Formation
The Jurong Formation, which is about 190 million years old (Mid Triassic to LowerJurassic) comprises alternating layers of mudstone, siltstone and sandstone which aretypically tightly folded and fissured. The thickness of the layers varies and the fissures,which are often randomly oriented, are not governed by the bedding planes. The finegrained mudstone is intensely fissured. The rock has been heavily weathered in itsupper parts.
Within the Jurong Formation a ‘boulder bed’ has been described by Pitts (1984). Thisis believed (Shirlaw et al, 1990 and Han et al, 1993) to be a landslide deposit consistedof often massive boulders of strong sandstone in a stiff fissured clay matrix. Thisboulder bed is now known as the Fort Canning Boulder Bed, Shirlaw et al (2003).
Table 3.7 gives some examples of published data on the properties of the JurongFormation.

16
Table 3.7 Published design parameters for Jurong Formation
Reference WeatheringDescription
Undrainedcohesion,cu (kPa)
Effectivecohesionc
’ (kPa)
Effectivecngle of
friction φ’(deg.)
UndrainedModulusEu (MPa)
Orihara et al (1999) S2 200 40 30-35 300-600Leong et al (2002) S4 5* SPT N - - Eu/cu = 40 -
400Lim (1995) S4 - 19-50 24-40 -Lo et al (1988) S4 - 6 32 -Orihara et al (1999) S4 65-200 0-20 33 30-100Rahardjo (2000) S4 5-9 29-32Yong, et al (1985) S4 - 12 13-40Zhu (2000) S4 - 10-30 24-40 -
As required by the Design Criteria, the effective stress parameters for weathered rocksshould be derived from site-specific data. Typical assessed parameters for theweathered rocks of the Jurong Formation based on the Geological Strength Indexmethod, Hoek and Brown, 1997 is listed in Table 3.8.
Table 3.8. Typical assessed parameters for rocks of Jurong Formation
Rock RQD c’(kPa)
φ’(degrees)
Mudstone <25% 40 30Siltstone <25% 40 30Sandstone <25% 40 45Mudstone >25% 40 35Siltstone >25% 40 35Sandstone >25% 120 45
3.6 Bukit Timah Granite Formation
The Bukit Timah Granite is of lower to Mid Triassic age (220 million years) andincludes an entire suite of plutonic acid igneous rocks, particularly granite, adamelliteand granodiorite. The granite has been cut by numerous basic and acidic dykes whichpost-date the granite and are believed to be of mid-Triassic age.
Weathering has produced a combination of residual soil and completely decomposedrock near the surface of the granite that is underlain by the highly and moderatelyweathered granite which, in turn is underlain by slightly weathered and fresh granite.The residual soil and the completely decomposed rock can be described generally asclayey silt, silty sand and silty clay that tend to be characterised by a reddish browncolour.
Table 3.9 lists typical parameters for the residual soils of the Bukit Timah GraniteFormation.

17
Table 3.9 Published design parameters for the residual soils of the Bukit Timah Granite FormationReferences Undrained
cohesion, cu(kPa)
Effectivecohesion c’
(kPa)
Effectiveangle offriction φ’(Degrees)
UndrainedModulusEu (MPa)
Leong et al (2002) 5* SPT N - - Eu/cu = 30 -300
Poh et al. (1985) - 0-42 20-35Yang & Tang (1997) - 5-10 35-40Tan et al. (1987) - 0-40 30-35Rahardjo (2000) - 12-50
0-1429-3327-31
KarWinn et al. (2001) - - 20-40Zhou (2001) - 7 32
18
4 STABILITY CHECKING
4.1 Base Heave
Temporary works design for deep excavation shall include adequate precautionsagainst base heave.
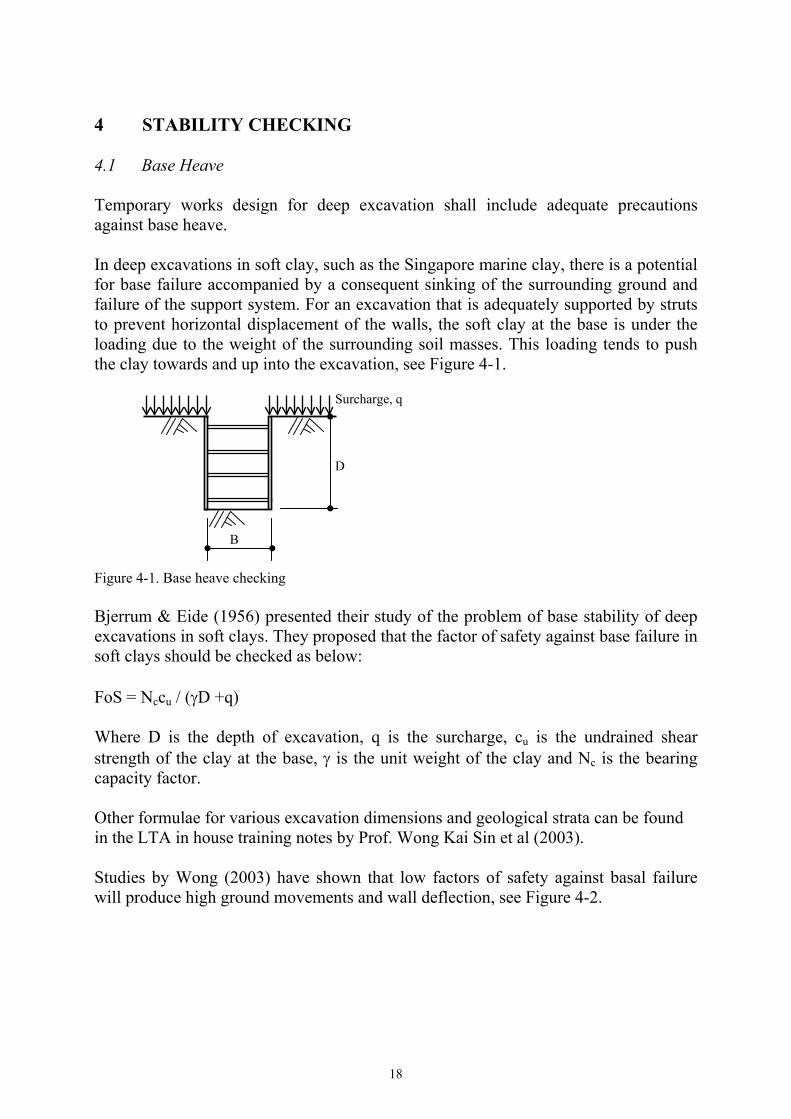
In deep excavations in soft clay, such as the Singapore marine clay, there is a potentialfor base failure accompanied by a consequent sinking of the surrounding ground andfailure of the support system. For an excavation that is adequately supported by strutsto prevent horizontal displacement of the walls, the soft clay at the base is under theloading due to the weight of the surrounding soil masses. This loading tends to pushthe clay towards and up into the excavation, see Figure 4-1.
Figure 4-1. Base heave checking
Bjerrum & Eide (1956) presented their study of the problem of base stability of deepexcavations in soft clays. They proposed that the factor of safety against base failure insoft clays should be checked as below:
FoS = Nccu / (γD +q)
Where D is the depth of excavation, q is the surcharge, cu is the undrained shearstrength of the clay at the base, γ is the unit weight of the clay and Nc is the bearingcapacity factor.
Other formulae for various excavation dimensions and geological strata can be foundin the LTA in house training notes by Prof. Wong Kai Sin et al (2003).
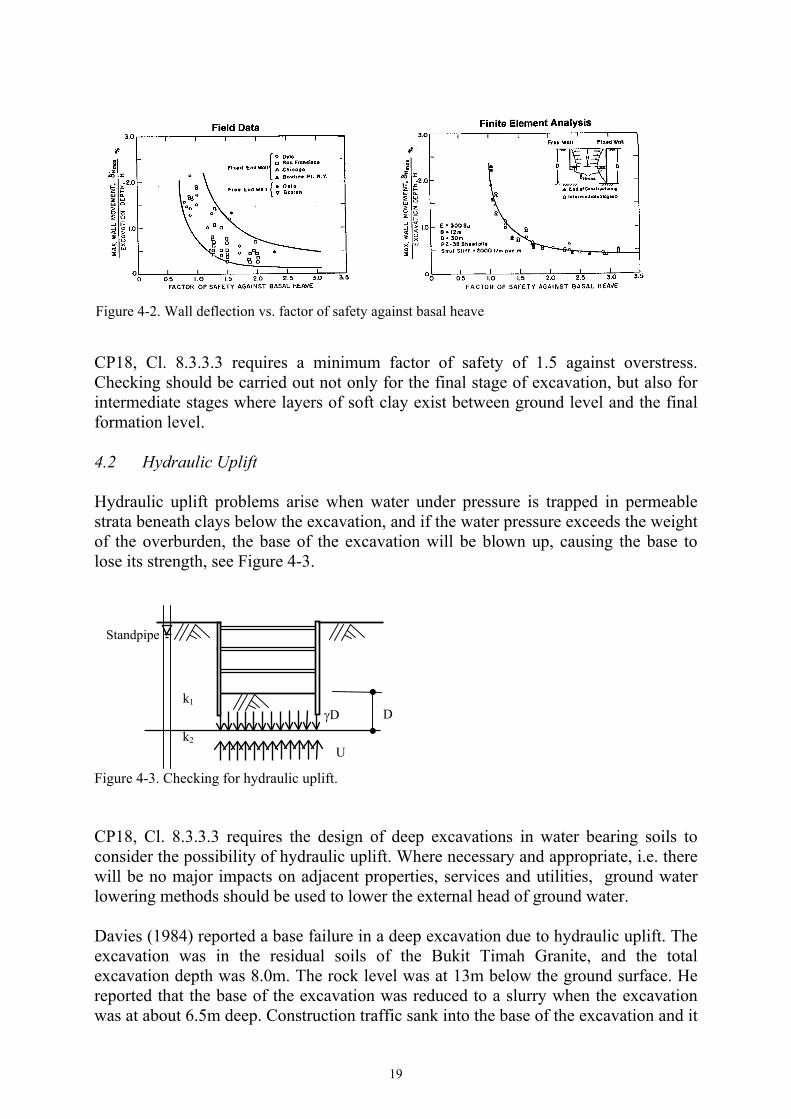
Studies by Wong (2003) have shown that low factors of safety against basal failurewill produce high ground movements and wall deflection, see Figure 4-2.
Surcharge, q
D
B
19
CP18, Cl. 8.3.3.3 requires a minimum factor of safety of 1.5 against overstress.Checking should be carried out not only for the final stage of excavation, but also forintermediate stages where layers of soft clay exist between ground level and the finalformation level.
4.2 Hydraulic Uplift
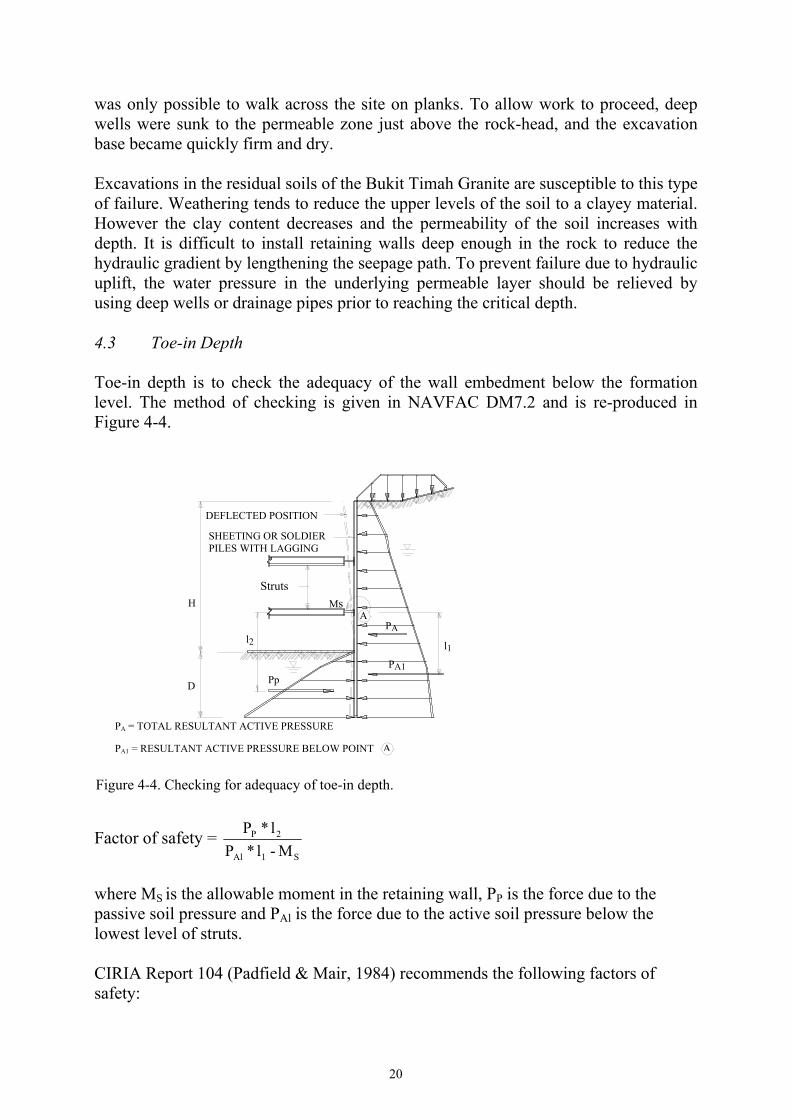
Hydraulic uplift problems arise when water under pressure is trapped in permeablestrata beneath clays below the excavation, and if the water pressure exceeds the weightof the overburden, the base of the excavation will be blown up, causing the base tolose its strength, see Figure 4-3.
Figure 4-3. Checking for hydraulic uplift.
CP18, Cl. 8.3.3.3 requires the design of deep excavations in water bearing soils toconsider the possibility of hydraulic uplift. Where necessary and appropriate, i.e. therewill be no major impacts on adjacent properties, services and utilities, ground waterlowering methods should be used to lower the external head of ground water.
Davies (1984) reported a base failure in a deep excavation due to hydraulic uplift. Theexcavation was in the residual soils of the Bukit Timah Granite, and the totalexcavation depth was 8.0m. The rock level was at 13m below the ground surface. Hereported that the base of the excavation was reduced to a slurry when the excavationwas at about 6.5m deep. Construction traffic sank into the base of the excavation and it
k2
Standpipe
γD
U
k1D
Figure 4-2. Wall deflection vs. factor of safety against basal heave
20
was only possible to walk across the site on planks. To allow work to proceed, deepwells were sunk to the permeable zone just above the rock-head, and the excavationbase became quickly firm and dry.
Excavations in the residual soils of the Bukit Timah Granite are susceptible to this typeof failure. Weathering tends to reduce the upper levels of the soil to a clayey material.However the clay content decreases and the permeability of the soil increases withdepth. It is difficult to install retaining walls deep enough in the rock to reduce thehydraulic gradient by lengthening the seepage path. To prevent failure due to hydraulicuplift, the water pressure in the underlying permeable layer should be relieved byusing deep wells or drainage pipes prior to reaching the critical depth.
4.3 Toe-in Depth
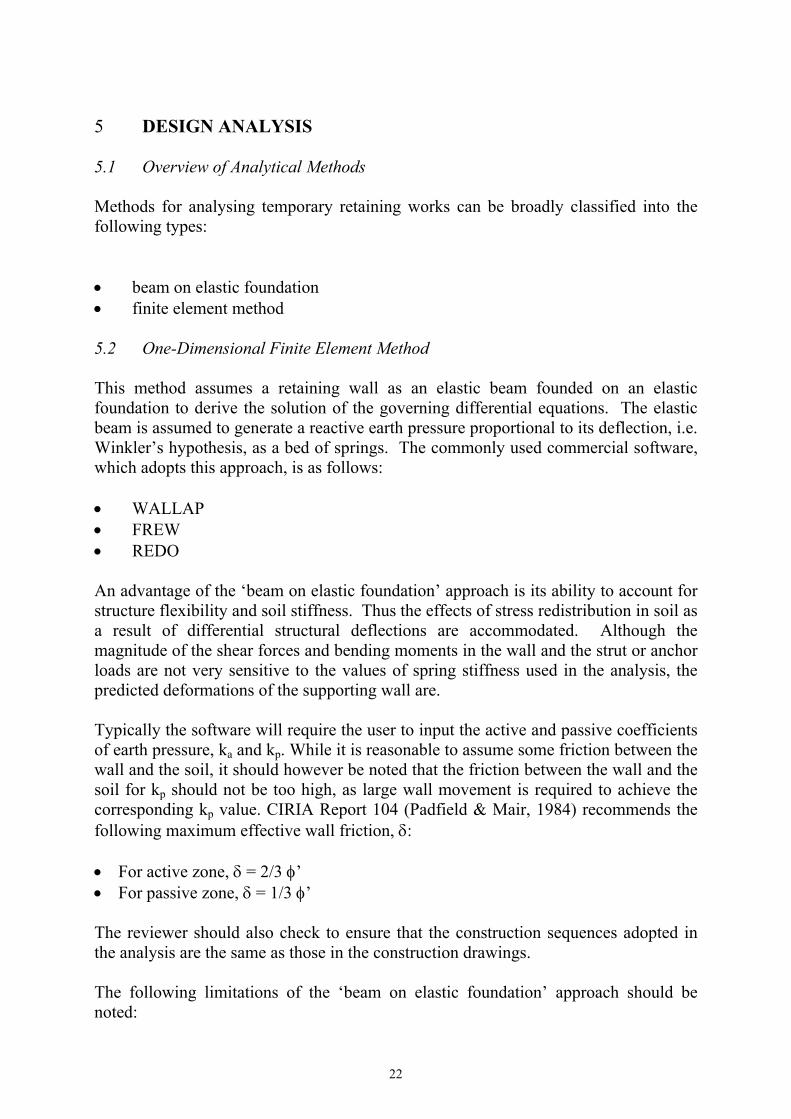
Toe-in depth is to check the adequacy of the wall embedment below the formationlevel. The method of checking is given in NAVFAC DM7.2 and is re-produced inFigure 4-4.
Factor of safety = S1Al
2P
M - l* Pl * P
where MS is the allowable moment in the retaining wall, PP is the force due to thepassive soil pressure and PAl is the force due to the active soil pressure below thelowest level of struts.
CIRIA Report 104 (Padfield & Mair, 1984) recommends the following factors ofsafety:
PA1 = RESULTANT ACTIVE PRESSURE BELOW POINT
DEFLECTED POSITION
SHEETING OR SOLDIERPILES WITH LAGGING
Struts
l2 l1
Pp
PA
PA1
H
D
AMs
A
PA = TOTAL RESULTANT ACTIVE PRESSURE
Figure 4-4. Checking for adequacy of toe-in depth.

21
• For φ’ < or = 20o, FOS = 1.2• For φ’ = 20o – 30o, FOS = 1.2 – 1.5• For φ’ > or = 30o, FOS = 1.5
Where the mobilisation factors are used in accordance with BS8002, the minimumrequired factor of safety can be 1.0.
4.4 Slope Stability for Open Excavation
The factor of safety for slope stability for open excavation should be checked bycarrying out slope stability analysis. Various software, such as SLOPE/W can be used.The two major critical parameters are the cohesion of soil and the phreatic surface.
The cohesion should be justified by soil investigation data. Typically the ground watertable will be at 1 to 2 m below the ground level. Under clement weather the water tablecan rise to the ground level, thus should be checked.
For permanent slope the factor of safety shall be a minimum of 1.5. For temporaryslopes, the factor of safety can be reduced, based on consequence of failures. A guideis shown in Table 4-1, based on Geotechnical Manual for Slopes, GeotechnicalControl Office, Hong Kong.
Table 4-1. Factors of safety for slopes.Recommended factor of safety against lossof life for a ten-year return period rainfallRisk
Negligible Low High
Negligible >1.0 1.2 1.4
Low 1.2 1.2 1.4
Recommended factor ofsafety against economic
loss for a ten-yearreturn period rainfall High 1.4 1.4 1.4
22
5 DESIGN ANALYSIS
5.1 Overview of Analytical Methods
Methods for analysing temporary retaining works can be broadly classified into thefollowing types:
• beam on elastic foundation• finite element method
5.2 One-Dimensional Finite Element Method
This method assumes a retaining wall as an elastic beam founded on an elasticfoundation to derive the solution of the governing differential equations. The elasticbeam is assumed to generate a reactive earth pressure proportional to its deflection, i.e.Winkler’s hypothesis, as a bed of springs. The commonly used commercial software,which adopts this approach, is as follows:
• WALLAP• FREW• REDO
An advantage of the ‘beam on elastic foundation’ approach is its ability to account forstructure flexibility and soil stiffness. Thus the effects of stress redistribution in soil asa result of differential structural deflections are accommodated. Although themagnitude of the shear forces and bending moments in the wall and the strut or anchorloads are not very sensitive to the values of spring stiffness used in the analysis, thepredicted deformations of the supporting wall are.
Typically the software will require the user to input the active and passive coefficientsof earth pressure, ka and kp. While it is reasonable to assume some friction between thewall and the soil, it should however be noted that the friction between the wall and thesoil for kp should not be too high, as large wall movement is required to achieve thecorresponding kp value. CIRIA Report 104 (Padfield & Mair, 1984) recommends thefollowing maximum effective wall friction, δ:
• For active zone, δ = 2/3 φ’• For passive zone, δ = 1/3 φ’
The reviewer should also check to ensure that the construction sequences adopted inthe analysis are the same as those in the construction drawings.
The following limitations of the ‘beam on elastic foundation’ approach should benoted:
23
• There is an inherent difficulty in determining the appropriate spring stiffness(constants) of the soil for analysis as these are not fundamental soil properties. Thespring constants are dependent on the Young’s modulus of the soil and also on thedimension of the excavation problems being analysed. Users should not usecorrelation of spring constants with undrained strength of soil as basis of derivingthe spring constants for analysis. Spring constants, if used, should be based onYoung’s modulus of the soil, which is a soil property and independent ofdimension of the excavation.
• The method can only predict the movement of the wall. Ground movements cannot be predicted by using such software.
5.3 Two Dimensional Finite Element Method
The finite element method offers the designer an analytical tool that can simulate thecomplex facets of the strutted or tied-back wall except unquantifiable variables such asworkmanship or geological uncertainties. The commonly used commercial software isas follows:
• PLAXIS• SAGE CRISP• EXCAV97
The assumption of plane strain condition usually adopted in finite element analysis ofstrutted or anchored walls cannot be arbitrarily extrapolated to many practicalproblems, particularly those involving soldier pile walls. Diaphragm walls, however,were shown to approximately satisfy the conditions assumed in a plane strain analysis,except at the corners of the retaining system. To simulate discontinuous wall elementssuch as soldier piles, struts or tie-backs, the stiffness has to be represented on a ‘unit’length basis. Analyses using this representation yield results that are characteristic ofthe average values between those at the supports and those at the mid-point betweenthe supports.
The two single most important variables required in a finite element analysis are thestiffness of the ground, which mainly affects the displacements, and the magnitude ofthe initial horizontal stresses, which affect both the displacements and the bendingmoments.
The in-situ horizontal stress in the ground is related to the in-situ vertical stress by thecoefficient of earth pressure at rest, ko. From conventional soil mechanics, it is wellknown that ko, being dependent on stress history, is not a fundamental soil property.For a soil in the normally consolidated (i.e. low ko) state, the stress change required toreach the active state is small compared with that needed to mobilise passiveresistance. The contrary is true for a soil in the over-consolidated (i.e. high ko) state.Therefore, the horizontal displacements of the wall and surface movements behind thewall are dependent on the magnitude of the in-situ stress. The existence of a high in-situ horizontal stress would likely result in large wall displacements and surface
24
settlements. For excavated walls in soils with a high initial ko value (≥2), the propforces and wall bending moments can greatly exceed those predicted by limitequilibrium methods, Potts & Fourie (1984).
The advantage of the finite element method in the analysis of earth retaining structureslies in its ability to predict both earth pressures and deformations with a minimum ofsimplifying assumptions. Both structure and soil are considered interactively, so thatthe effects of structural flexibility are taken into account.
Limitations in using the method primarily derive from a user’s inability to prescribeappropriate constitutive models for the soil, and to determine the most appropriateparameters needed for the constitutive models. Another limitation is that, in a 2-Dmodel, any element simulating a pile is in effect a wall, as the model is typically basedon plane strain condition. This simplification may underestimate the groundmovement.
The effects of corners can not be reflected in a 2-D analysis. This may lead to over-conservative (excessive) prediction of ground movement and wall deflection at cornersof deep excavations. The significance or otherwise of the corner effects depends onthree factors: the length to depth ratio of the excavation, the depth to a relatively stiffstratum and the stiffness of the strutting system, Lee et al (1998).
5.4 Drained Analysis vs. Undrained Analysis
A saturated soil comprises two phrases: the soil particles and the pore water. The porewater pressure is constant at a value governed by a constant position of the water table.This initial value is called the static pore water pressure. When a soil element isloaded, pore water pressure is increased above the static value immediately. Thisincrease in pore water pressure causes a pressure gradient, resulting in a transient flowof pore water towards a free draining boundary of the soil layer. This flow or drainagewill continue until pore water pressure again becomes equal to the value governed bythe position of the water table. The component of pore water pressure above the staticvalue is known as the excess pore water pressure. When the excessive pore waterpressure is dissipated the soil is said to be in the drained condition. Prior to dissipationof the excess pore water pressure the soil is said to be in undrained condition.
The normal total stress applied to a soil element can be separated by means of theprinciple of effective stress. The effective stress is the component of normal stresstaken by the soil skeleton. It is the effective stress that controls the volume andstrength of the soil. For saturated soils, the effective stress can be calculated as thetotal normal stress minus the pore water pressure.
The conventional approaches to analysis of short term behaviour of excavations in clayassume undrained response for the soil and no excess pore water pressure dissipation.The question that is often asked is under what conditions the undrained approach doesprevail.
25
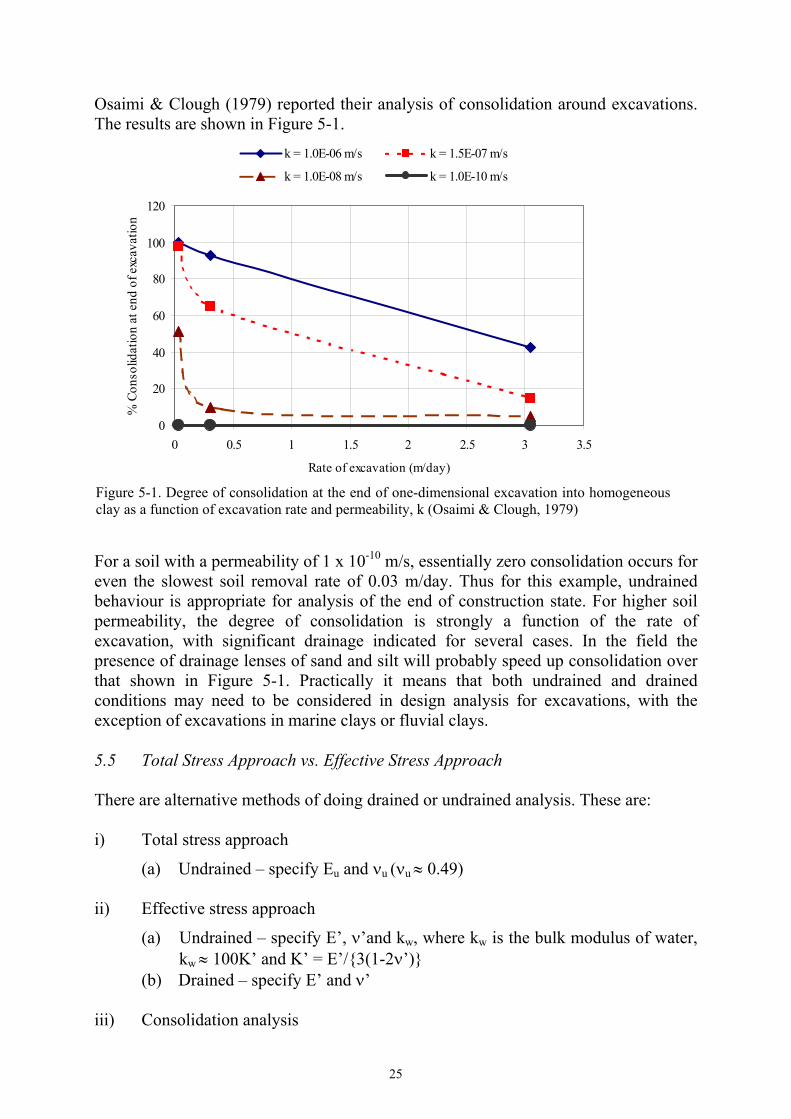
Osaimi & Clough (1979) reported their analysis of consolidation around excavations.The results are shown in Figure 5-1.
For a soil with a permeability of 1 x 10⁻¹⁰ m/s, essentially zero consolidation occurs foreven the slowest soil removal rate of 0.03 m/day. Thus for this example, undrainedbehaviour is appropriate for analysis of the end of construction state. For higher soilpermeability, the degree of consolidation is strongly a function of the rate ofexcavation, with significant drainage indicated for several cases. In the field thepresence of drainage lenses of sand and silt will probably speed up consolidation overthat shown in Figure 5-1. Practically it means that both undrained and drainedconditions may need to be considered in design analysis for excavations, with theexception of excavations in marine clays or fluvial clays.
5.5 Total Stress Approach vs. Effective Stress Approach
There are alternative methods of doing drained or undrained analysis. These are:
i) Total stress approach
(a) Undrained – specify Eu and νu (νu ≈ 0.49)
ii) Effective stress approach
(a) Undrained – specify E’, ν’and kw, where kw is the bulk modulus of water,kw ≈ 100K’ and K’ = E’/{3(1-2ν’)}
(b) Drained – specify E’ and ν’
iii) Consolidation analysis
0
20
40
60
80
100
120
0 0.5 1 1.5 2 2.5 3 3.5
Rate of excavation (m/day)
% C
onso
lidat
ion
at e
nd o
f exc
avat
ion
k = 1.0E-06 m/s k = 1.5E-07 m/s
k = 1.0E-08 m/s k = 1.0E-10 m/s
Figure 5-1. Degree of consolidation at the end of one-dimensional excavation into homogeneousclay as a function of excavation rate and permeability, k (Osaimi & Clough, 1979)

26
(a) Always specify E’, ν’. After a short time interval, undrained response isobtained, and after a long time interval a drained response is obtained.
The advantage of effective stress approach is that pore water pressure changes due toundrained loading are calculated and printed explicitly.
Typically Mohr-Coulomb (M-C) failure criteria are adopted for analysis, as theparameters, cu or c’ and φ’ for the criteria are well defined for soils commonlyencountered. For undrained analysis, cu should be specified and for drained analysis, c’and φ’ should be specified. Based on the research work by Prof Wong Kai Sin of NTU(2003), the following notes should be taken into account when carrying out a FEanalysis or reviewing an submission using FE analysis:
• Undrained analysis by total stress approach (Eu and νu ≈ 0.49) using total stressM-C parameter (cu) can produces reliable results provided an appropriate Eu/curatio is adopted for soft clays and stiff clays. The analysis can providereasonable matches at all stages for deep excavation in stiff clays, but it cannotprovide good matches at all stages of excavation for soft clays.
• Drained analysis by effective stress approach (E’ and ν’) using effective stressM-C parameters (c’ and φ’) can produce reasonable results for certain stresspaths and questionable or unreliable results in some other stress paths.
5.6 Note on Using Effective Stress Approach for Undrained Analysis
Both SAGE CRISP and PLAXIS have the facilities to carry out undrained analysis byusing effective stress parameters. This is possible by using the kw, the bulk modulus ofwater. With kw, it is possible to calculate the rate of excess pore water pressure, thusallowing the determination of the total stress in a soil element. As the analysis is ineffect an undrained analysis, total stress parameter for M-C criteria, cu should be used.
In SAGE CRISP, the bulk modulus of water kw has to be specified by the user as aninput for undrained analysis using effective stress approach. The recommended valueis kw ≈ 100K’, where K’ = E’/{3(1-2ν’)} to ensure the simulation of pore water asincompressible material compared with the soil skeleton.
In PLAXIS, the calculation of kw is automatically done. The user will only get awarning when the input value of ν’ is larger than 0.35. It should be noted that inPLAXIS, whenever the Material Type is set to Undrained, effective stress parameters,E’ and ν’ should be specified in the input, and ν’ should be less than 0.35. If M-Cfailure criteria is adopted, cu should be used as input for strength parameter, instead ofc’ and φ’.
In summary, there are a few methods available to carry out undrained analyses in theprogram PLAXIS:
27
• Method A - Undrained setting, Mohr Coulomb soil model, effective stress strengthparameters, c' and φ', E' and µ' (< or = 0.35). Method A shall not be used foranalyses of deep excavations in soft clays, such as the marine clay.
• Method B - Undrained setting, Mohr Coulomb Model, undrained strengthparameter, cu, E' and µ' (< or = 0.35).
• Method C - Drained setting, Mohr Coulomb model, undrained strength parameter,cu , Eu and µu = 0.495.
• Method D - Undrained setting, soft clay model, such as Cam Clay model, c', φ', λ,κ.
Commonly used approaches for undrained analyses in SAGE CRISP are:
• Effective Stress Approach, Mohr Coulomb model, specify cu, E', µ' and kw (kw>>soil bulk modulus, k' to avoid numerical error). (Equivalent to Method B)
• Total Stress Approach, Mohr Coulomb model, specify cu , Eu, µu = 0.495 and kw= 0.0, where kw is the bulk modulus of water. (Equivalent to Method C)
• Effective Stress Approach, soft clay model, such as Cam Clay model, λ, κ, M, ecs,µ' and kw (kw >>soil bulk modulus, k' to avoid numerical error). (Equivalent toMethod D)
5.7 Sensitivity Analysis
There are great dangers in relying on ‘one-off’ analyses, in which a single set ofgeotechnical parameters are used, and the results of the analysis then taken as ‘theprediction’ of deformations, loads and stresses that will actually occur. It is essential tovary the input parameters, within a reasonable range corresponding to those actuallydetermined from the ground investigation, and to examine critically the effects of suchvariations on the computed deformations, loads and stresses.
It is important to distinguish design from analysis – the former requires a fullconsideration of all the factors that might affect the behaviour of the undergroundworks, whereas the latter must only be regarded as a tool to aid the design process,albeit a very important tool. The temptation to rely on a single finite element analysisas the basis for design should be resisted. A suite of analyses, used to explore theinfluence of parameter variations, is necessary before the results can be used withconfidence in the design.
Sensitivity analyses shall be performed as part of the design to demonstrate that thedesign and the model are not unduly sensitive to variations in any of the followinginput parameters:
• Shear strength• Soil stiffness• Reduced wall stiffness due to cracking• Pre-loading forces

28
• Over-excavation• One-strut failure• Consolidation parameters• JGP strength and stiffness (where applicable)
It shall also be demonstrated that the model is not unduly sensitive to any othervariable for which assumptions are made within the FE or FD model.
The design shall be based on the envelope of upper and lower bounds of the sensitivityanalyses, with appropriate factor of safety for structural design of the walls and strutsystem.
5.8 Back Analysis
Back analyses should be carried out comprehensively with careful reviews of ALLdesign assumptions and the actual monitored behaviour of the structures.
While curve fitting of the deflection is an important part of the back analysis, othermonitored parameters should also be checked in the back analysis. There should be aclear evidence of improvement between computed and measured behaviour to date, i.e.from the beginning up to the stage where back analysis is carried out.
The review of design assumptions during back analyses should includeappropriateness of the models used in the original design, soil parameters, soil profilesencountered, construction sequences, drainage conditions on site and the wall stiffness.Any changes or revisions in the back analysis should not be arbitrary. There should bea clear rationale and substantiation, for example field or laboratory tests or additionalevidence from construction records, for all changes in the model parameters.
5.9 Use of Sacrificial JGP Layers
Traditionally geotechnical design parameters are selected conservatively, i.e. designvalues (strength and stiffness) are selected towards the lower bound values. For thedesign of a sacrificial jet grouted slab, it is necessary to carry out sensitivity analysesfor the upper bound strength and stiffness values of the jet grouted slab. This is to caterfor the worst loading condition for the struts above the sacrificial jet grouted slab.When the slab is removed, the load taken by it will be transferred to the struts above. Iflower bound strength and stiffness values are used, this will underestimate the strutload for the struts above the sacrificial jet grouted slab. Close monitoring of the strutsand the walls should be carried out during the removal of the sacrificial JGP layers.
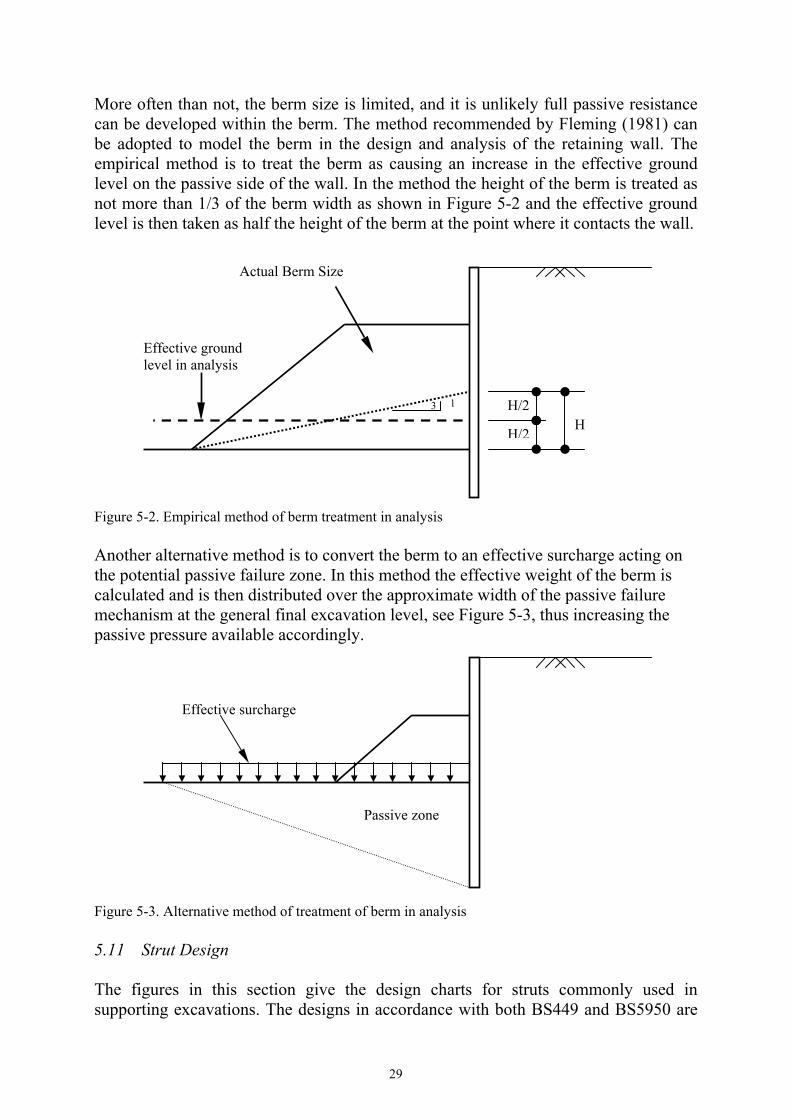
5.10 Treatment of Berm
Slope stability analysis should be carried out to ensure that the berm is stable duringthe whole period of the construction.
29
More often than not, the berm size is limited, and it is unlikely full passive resistancecan be developed within the berm. The method recommended by Fleming (1981) canbe adopted to model the berm in the design and analysis of the retaining wall. Theempirical method is to treat the berm as causing an increase in the effective groundlevel on the passive side of the wall. In the method the height of the berm is treated asnot more than 1/3 of the berm width as shown in Figure 5-2 and the effective groundlevel is then taken as half the height of the berm at the point where it contacts the wall.
Figure 5-2. Empirical method of berm treatment in analysis
Another alternative method is to convert the berm to an effective surcharge acting onthe potential passive failure zone. In this method the effective weight of the berm iscalculated and is then distributed over the approximate width of the passive failuremechanism at the general final excavation level, see Figure 5-3, thus increasing thepassive pressure available accordingly.
Figure 5-3. Alternative method of treatment of berm in analysis
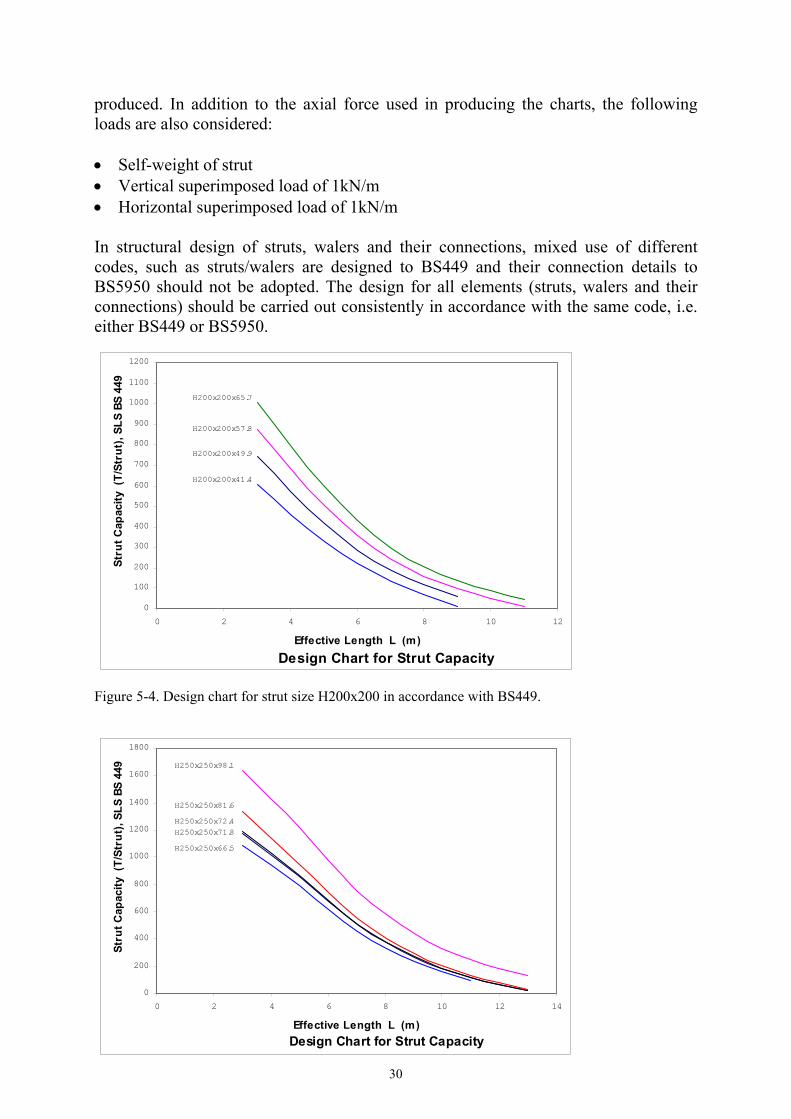
5.11 Strut Design
The figures in this section give the design charts for struts commonly used insupporting excavations. The designs in accordance with both BS449 and BS5950 are
13
HH/2
H/2
Actual Berm Size
Effective groundlevel in analysis
Passive zone
Effective surcharge
30
produced. In addition to the axial force used in producing the charts, the followingloads are also considered:
• Self-weight of strut• Vertical superimposed load of 1kN/m• Horizontal superimposed load of 1kN/m
In structural design of struts, walers and their connections, mixed use of differentcodes, such as struts/walers are designed to BS449 and their connection details toBS5950 should not be adopted. The design for all elements (struts, walers and theirconnections) should be carried out consistently in accordance with the same code, i.e.either BS449 or BS5950.
Figure 5-4. Design chart for strut size H200x200 in accordance with BS449.
Design Chart for Strut Capacity
0
100
200
300
400
500
600
700
800
900
1000
1100
1200
0 2 4 6 8 10 12
Effective Length L (m)
Stru
t Cap
acity
(T/
Stru
t), S
LS B
S 44
9
H200x200x41.4
H200x200x65.7
H200x200x57.8
H200x200x49.9
Design Chart for Strut Capacity
0
200
400
600
800
1000
1200
1400
1600
1800
0 2 4 6 8 10 12 14
Effective Length L (m)
Stru
t Cap
acity
(T/
Stru
t), S
LS B
S 44
9
H250x250x66.5
H250x250x71.8
H250x250x98.1
H250x250x81.6
H250x250x72.4
31
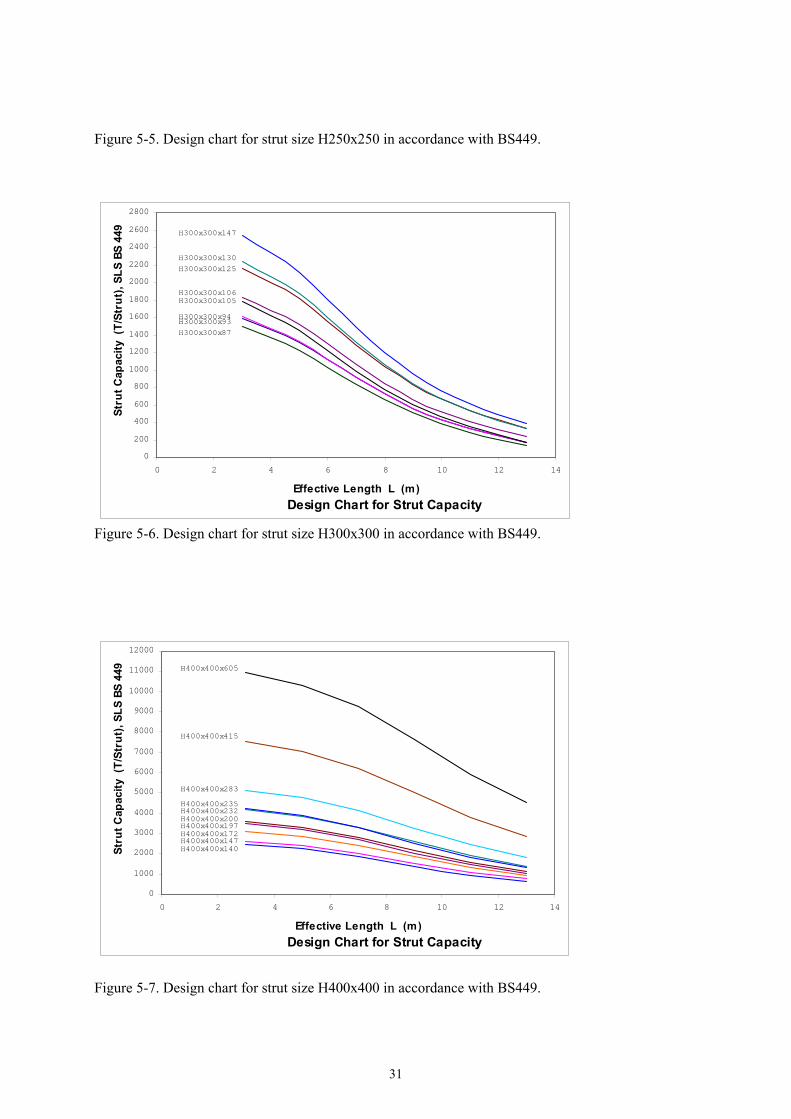
Figure 5-5. Design chart for strut size H250x250 in accordance with BS449.
Figure 5-6. Design chart for strut size H300x300 in accordance with BS449.
Figure 5-7. Design chart for strut size H400x400 in accordance with BS449.
Design Chart for Strut Capacity
0
200
400
600
800
1000
1200
1400
1600
1800
2000
2200
2400
2600
2800
0 2 4 6 8 10 12 14
Effective Length L (m)
Stru
t Cap
acity
(T/
Stru
t), S
LS B
S 44
9
H300x300x87
H300x300x93H300x300x94
H300x300x105H300x300x106
H300x300x125
H300x300x147
H300x300x130
Design Chart for Strut Capacity
0
1000
2000
3000
4000
5000
6000
7000
8000
9000
10000
11000
12000
0 2 4 6 8 10 12 14
Effective Length L (m)
Stru
t Cap
acity
(T/
Stru
t), S
LS B
S 44
9
H400x400x140H400x400x147H400x400x172H400x400x197H400x400x200H400x400x232H400x400x235
H400x400x283
H400x400x415
H400x400x605
32
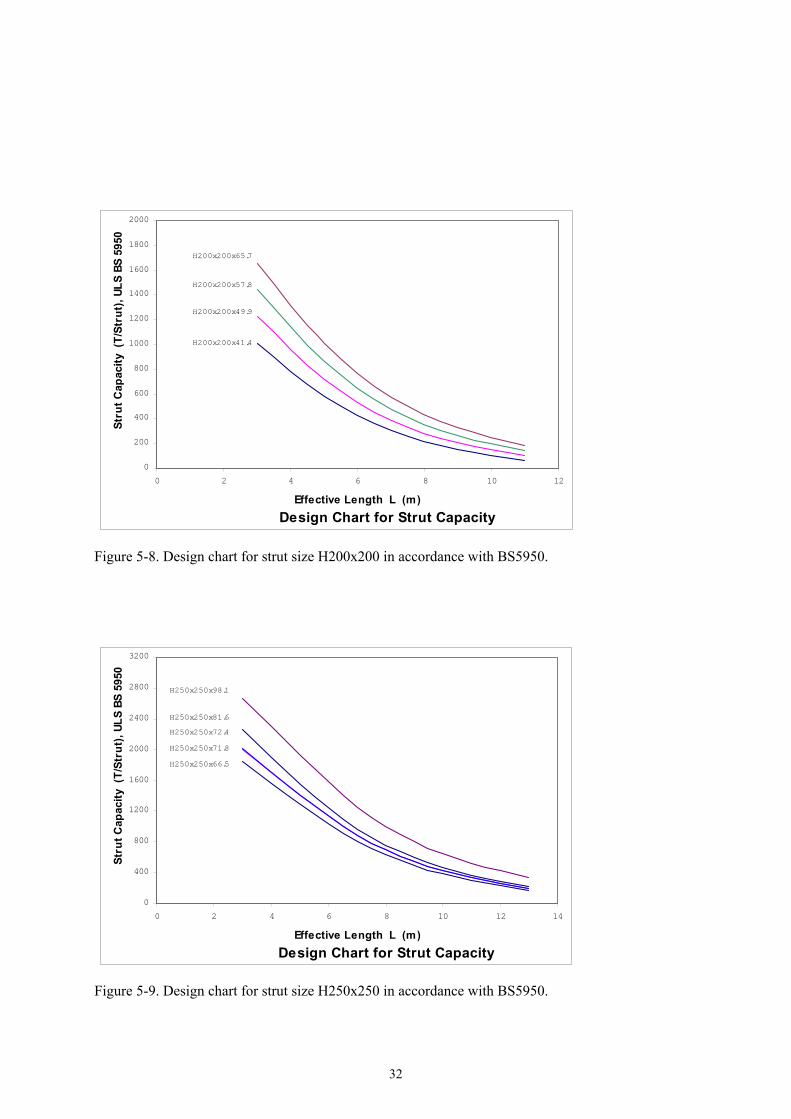
Figure 5-8. Design chart for strut size H200x200 in accordance with BS5950.
Figure 5-9. Design chart for strut size H250x250 in accordance with BS5950.
Design Chart for Strut Capacity
0
200
400
600
800
1000
1200
1400
1600
1800
2000
0 2 4 6 8 10 12
Effective Length L (m)
Stru
t Cap
acity
(T/
Stru
t), U
LS B
S 59
50
H200x200x41.4
H200x200x65.7
H200x200x57.8
H200x200x49.9
Design Chart for Strut Capacity
0
400
800
1200
1600
2000
2400
2800
3200
0 2 4 6 8 10 12 14
Effective Length L (m)
Stru
t Cap
acity
(T/
Stru
t), U
LS B
S 59
50
H250x250x66.5
H250x250x71.8
H250x250x98.1
H250x250x81.6
H250x250x72.4

33
Figure 5-10. Design chart for strut size H300x300 in accordance with BS5950.
Figure 5-11. Design chart for strut size H400x400 in accordance with BS5950.
Design Chart for Strut Capacity
0
500
1000
1500
2000
2500
3000
3500
4000
4500
5000
0 2 4 6 8 10 12 14
Effective Length L (m)
Stru
t Cap
acity
(T/
Stru
t), U
LS B
S 59
50
H300x300x87H300x300x93H300x300x94H300x300x105
H300x300x106
H300x300x125
H300x300x147
H300x300x130
Design Chart for Strut Capacity
0
2000
4000
6000
8000
10000
12000
14000
16000
18000
0 2 4 6 8 10 12 14
Effective Length L (m)
Stru
t Cap
acity
(T/
Stru
t), U
LS B
S 59
50
H400x400x140H400x400x147H400x400x172H400x400x197H400x400x200H400x400x232H400x400x235
H400x400x283
H400x400x415
H400x400x605

34
6 GROUND MOVEMENT
6.1 Prediction of ground movements
The prediction of ground settlements due to deep excavations should take into accountthe effects of wall installation and extraction where applicable, wall deflection andconsolidation settlement. Other causes, such as ground treatment, piling should also beconsidered, where appropriate.
Ground settlements due to diaphragm wall installation have been studied by Hulme etal (1989) and Wen et al (2001). It is found that typically the settlement due todiaphragm wall installation is in the order of 5 to 25mm.
The surface settlements due to wall deflection have been addressed by Clough &O’Rourke (1990). They proposed that ground surface settlements due to deepexcavations take the form of the wall deflection as shown in Figure 6-1.
This relationship has been confirmed by settlement measurements during theconstruction of the cut & cover tunnels at Race Course Road for the North East MRTLine, Wen et al (2001). Others have also reported similar correlation for deepexcavations in the Singapore marine clay, Hulme et al (1991), Nicholson (1987) andTan et al (1985). The ground surface settlements due to deep excavations in the OldAlluvium and in the residual soils of the Bukit Timah Granite Formation have beenstudied by Wong, et al (2001) and Lee et al (2001).
The prediction of movements during excavation shall be properly related to the resultsof the excavation analyses. Finite element or finite difference methods can givemisleading results for the development of ground movements outside the excavationunless the change of ground stiffness with strain is properly taken into account. All
Figure 6-1. Surface settlement due to deep excavation.
35
analytical predictions should be checked against empirical methods based onexcavations in similar ground in Singapore.
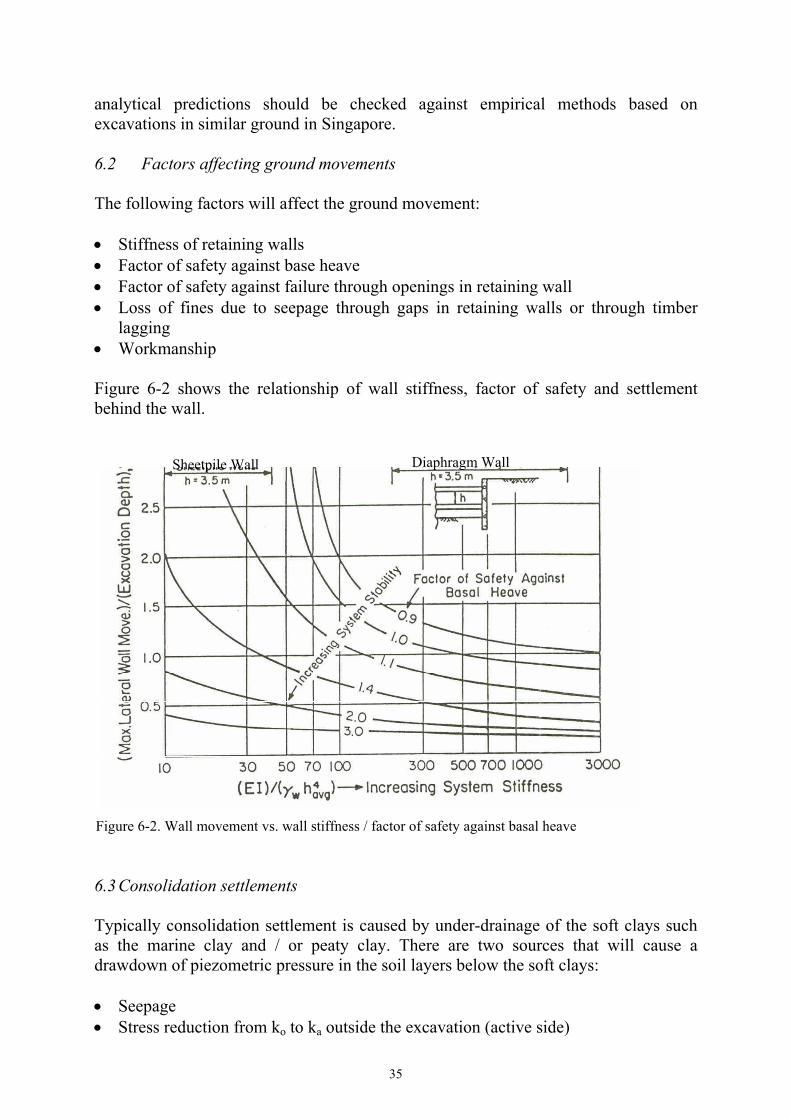
6.2 Factors affecting ground movements
The following factors will affect the ground movement:
• Stiffness of retaining walls• Factor of safety against base heave• Factor of safety against failure through openings in retaining wall• Loss of fines due to seepage through gaps in retaining walls or through timber
lagging• Workmanship
Figure 6-2 shows the relationship of wall stiffness, factor of safety and settlementbehind the wall.
6.3 Consolidation settlements
Typically consolidation settlement is caused by under-drainage of the soft clays suchas the marine clay and / or peaty clay. There are two sources that will cause adrawdown of piezometric pressure in the soil layers below the soft clays:
• Seepage• Stress reduction from ko to ka outside the excavation (active side)
Figure 6-2. Wall movement vs. wall stiffness / factor of safety against basal heave
Sheetpile Wall Diaphragm Wall

36
• Stress increase from ko toward kp inside the excavation (passive side)
BS8002:1994 gives a simplified method to establish the pore water pressure at steadystate seepage condition, see Figure 6-3.
The mechanism of piezometric head draw-down has been studied by Shirlaw & Wen(1999) and Wen & Lin (2001).
It has been shown by Hulme et al (1991) and Wen et al (2000) that consolidationsettlement can be up to 100% to 150% of the total measured settlements.
PWTPWT
jh
di
Path
Len
gth
Note: Assume head difference(h+i-j) is dissipated uniformlyalong flow path length (2d+h-i-j)
PWT = j) - i -h (2d
i) - (d j) - d (h 2 w
++ γ
Figure 6-3. Pore water pressure at steady state seepage condition, BS 8002: 1994.
37
7 DAMAGE ASSESSMENT
7.1 Classification of Damage
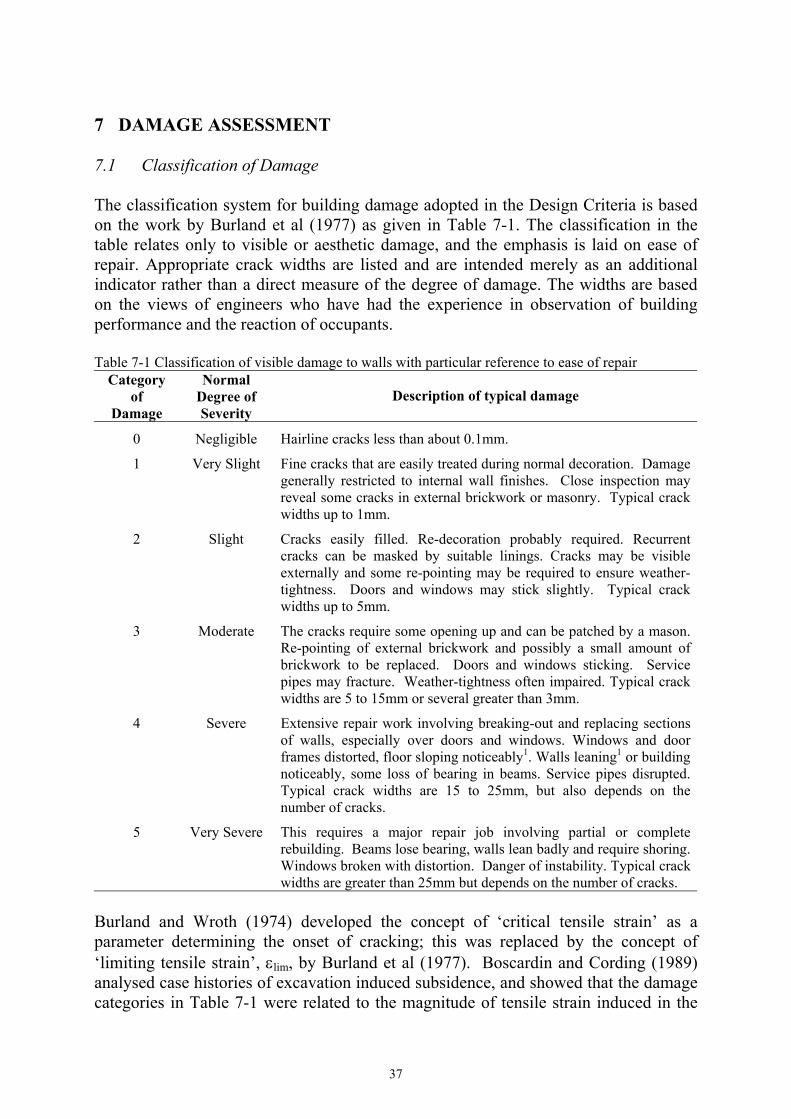
The classification system for building damage adopted in the Design Criteria is basedon the work by Burland et al (1977) as given in Table 7-1. The classification in thetable relates only to visible or aesthetic damage, and the emphasis is laid on ease ofrepair. Appropriate crack widths are listed and are intended merely as an additionalindicator rather than a direct measure of the degree of damage. The widths are basedon the views of engineers who have had the experience in observation of buildingperformance and the reaction of occupants.
Table 7-1 Classification of visible damage to walls with particular reference to ease of repairCategory
ofDamage
NormalDegree ofSeverity
Description of typical damage
0 Negligible Hairline cracks less than about 0.1mm.
1 Very Slight Fine cracks that are easily treated during normal decoration. Damagegenerally restricted to internal wall finishes. Close inspection mayreveal some cracks in external brickwork or masonry. Typical crackwidths up to 1mm.
2 Slight Cracks easily filled. Re-decoration probably required. Recurrentcracks can be masked by suitable linings. Cracks may be visibleexternally and some re-pointing may be required to ensure weather-tightness. Doors and windows may stick slightly. Typical crackwidths up to 5mm.
3 Moderate The cracks require some opening up and can be patched by a mason.Re-pointing of external brickwork and possibly a small amount ofbrickwork to be replaced. Doors and windows sticking. Servicepipes may fracture. Weather-tightness often impaired. Typical crackwidths are 5 to 15mm or several greater than 3mm.
4 Severe Extensive repair work involving breaking-out and replacing sectionsof walls, especially over doors and windows. Windows and doorframes distorted, floor sloping noticeably1. Walls leaning1 or buildingnoticeably, some loss of bearing in beams. Service pipes disrupted.Typical crack widths are 15 to 25mm, but also depends on thenumber of cracks.
5 Very Severe This requires a major repair job involving partial or completerebuilding. Beams lose bearing, walls lean badly and require shoring.Windows broken with distortion. Danger of instability. Typical crackwidths are greater than 25mm but depends on the number of cracks.
Burland and Wroth (1974) developed the concept of ‘critical tensile strain’ as aparameter determining the onset of cracking; this was replaced by the concept of‘limiting tensile strain’, εlim, by Burland et al (1977). Boscardin and Cording (1989)analysed case histories of excavation induced subsidence, and showed that the damagecategories in Table 7-1 were related to the magnitude of tensile strain induced in the

38
building, and the range of strains were identified. The range of strains is adopted bythe Design Criteria, and is re-produced in Table 7-2.
Table 7-2. Relationship between category of damage and limiting tensile strainCategory
of DamageNormal Degree
of SeverityLimiting tensile strain (∈lim)
(%)0 Negligible 0 - 0.051 Very Slight 0.05 - 0.0752 Slight 0.075 - 0.153 Moderate 0.15 - 0.3
4 to 5 Severe to Very Severe > 0.3
4.2 Methodology for Building Damage Assessment
The Design Criteria require all buildings and structures within the assessment zonesshall be assessed for damage by means of assessing the limiting tensile strains withinthe buildings and the foundations. The assessment zones are defined in Chapter 20:Assessment of Damage to Buildings and Utilities of the Design Criteria. Themethodology outlined by Mair et al (1996) can be adopted. The method of calculatingthe limiting tensile strain is based on Burland & Wroth (1974). The method treats abuilding as an idealised beam with span L and height H deforming under a maximumdeflection ∆. Expressions can be derived relating the ratio of ∆/L for the beam tomaximum bending strain (εb) and diagonal strain (εd) as follows:
+=GHLt2
EI3t12
LL∆ εb
and
+=EI18
LH1L∆ 2G εd
where:H is the height of the buildingL is the length of the buildingE and G are respectively the Young’s modulus and shear modulus of the building(assumed to be acting as a beam), E/G = 2.6 for masonary structures and E/G = 12.6for framed buildings.I is the second moment of area of the equivalent beam (i.e. H3/3)t is the furthest distance from the neutral axis to the edge of the beam (=H)
The horizontal ground strains due to horizontal ground movement also contribute topotential building damage. The average horizontal strain across a section of a buildingis more appropriate in the context of potential damage than local horizontal groundstrains. The average horizontal strain, εh, that is transferred to the building can be
39
calculated as the difference of horizontal movement at both ends of a building dividedby the span length then gives an average horizontal strain.
The average horizontal strain is added to either the bending or diagonal strain to obtainthe maximum combined tensile strain, which is then compared with the limiting valuesin Table 7-2 to assess the potential building damage.
The horizontal strain can be added directly to the bending strain giving
εbt = εh + εb
where εbt is the total bending strain.
Diagonal strains and horizontal strains can be combined by making use of a Mohr’scircle of strain. Assuming a value of Poisson’s ratio of 0.3, the total tensile strain dueto diagonal distortion,εdt, is given by
εdt = 0.35εh + [(0.65εh)2 +εd2 ]
The Design Criteria require that protective works be provided to all buildings wherethe predicted degree of severity of damage is moderate or above, with the aim torestrict damage to the “slight” category or below.
4.3 Steps for Building Damage Assessment
The building damage assessment methodology is described by Mair, Taylor & Burland(1996). A three staged building damage assessment can be adopted:
• Stage 1: If the predicted settlement is less than 10mm, no further assessment isrequired.
• Stage 2: The building is assessed based on “green field” assumption, i.e. thebuilding is assumed to be flexible and move with the ground.
• Stage 3: Detailed evaluation is carried out, taking into account the buildingstiffness and foundation.
In the detailed evaluation in Stage 3 or in a structural appraisal of a building, a holisticapproach should be adopted. Where applicable, the negative skin friction on the pilesshould be evaluated in the assessment. The framing of the superstructures, layout ofthe foundations and tie beams, reinforcement details in the structural members andconnection details should be considered as a whole.
Particular attentions should be paid to buildings on mixed foundations. Thesebuildings can be particularly sensitive to settlements. A detailed assessment needs tobe carried out for all buildings on mixed foundations.
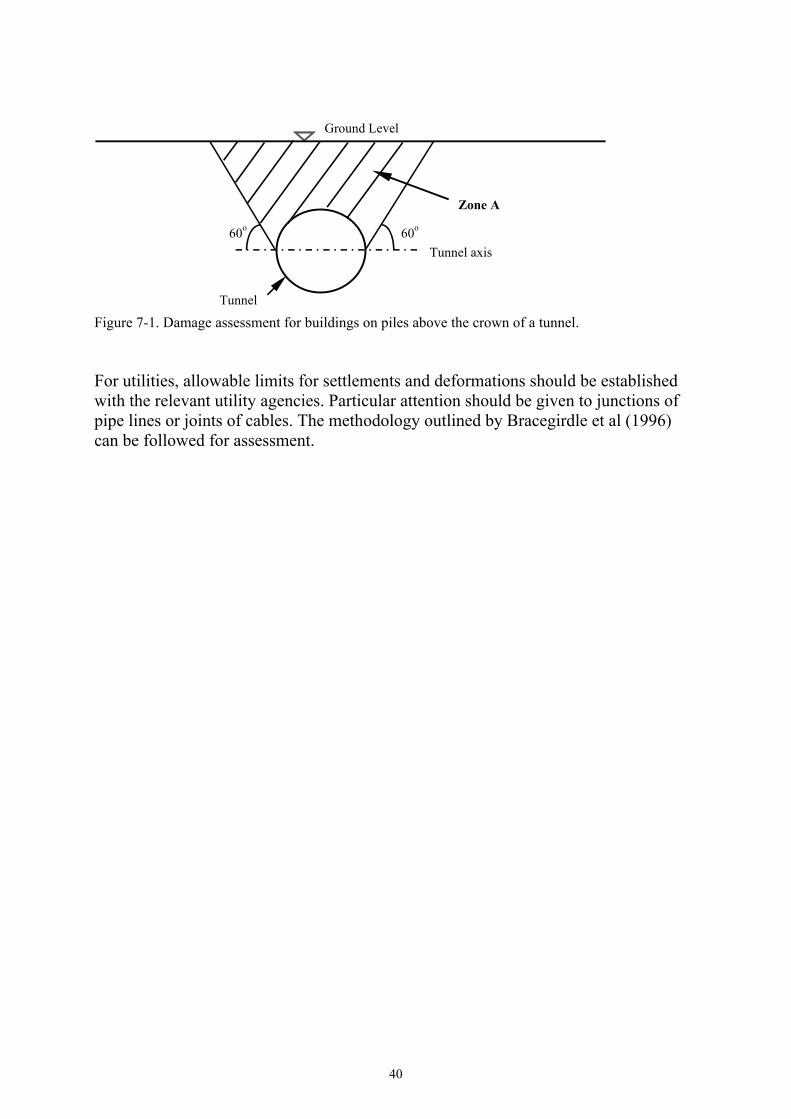
A detailed assessment should also be carried out where a building is founded on piles,and where the tip of the piles falls within a zone as defined in Figure 7-1.
40
Figure 7-1. Damage assessment for buildings on piles above the crown of a tunnel.
For utilities, allowable limits for settlements and deformations should be establishedwith the relevant utility agencies. Particular attention should be given to junctions ofpipe lines or joints of cables. The methodology outlined by Bracegirdle et al (1996)can be followed for assessment.
60o60o
Zone A
Ground Level
Tunnel axis
Tunnel
41
8 INSTRUMENTATION AND MONITORING
8.1 General
The minimum monitoring required is covered in Chapter 19 of the Design Criteria.Below are some guidelines to avoid common pitfalls in monitoring strut loads:
• Strain gauges should be mounted at the position not influenced by end effectsand also away from any joints or welds in the prop.
• The connections between strut and waling generally will result in non-uniformstresses generated in the struts close to the ends. The strain gauges should beinstalled at the middle of the strut.
• For case where bending stresses about the horizontal axis are significant theyshould be measured by additional strain gauge at the top and bottom of thestrut (i.e. 4 gauges in total). The axial load can be found by averaging all fourgauges.
• The strain gauge temperature should be read and taken together with the straingauge reading. This information is important to understand the effects oftemperature changes on the strut load.
• The strain gauge readings should be taken immediately after the strut isinstalled, when it carries no load and preferably with the strut weight beingsupported along the length (i.e. no self-weight bending). This reading willbecome the base reading and is essential to repeat the reading for 2 or 3 times.
• Readings should be taken after the strut is unloaded on removal as this cancheck on the initial base reading and hence establish the actual measured strutload.
• Strain gauges are to be protected by suitable housing as they are verysusceptible to damage.
• Excessive strut loads have been monitored in East-West Line Outram Parkstation, Hwang et al (1987) and North East Line Dhoby Ghaut stationconstruction. Both stations were constructed in the Jurong Formation. Thestruts load measured in the weathered rocks, which were sufficiently stable toallow excavation using soldier piles without loss of ground, can besignificantly higher than those measured in the soft squeezing marine clay,Shirlaw, et al (2000).
8.2 Review Levels
The Design Criteria, Chapter 19 specifies three review levels: Trigger, Design andAllowable. This will be revised to Alert (=Trigger) and Work Suspension (= Design).
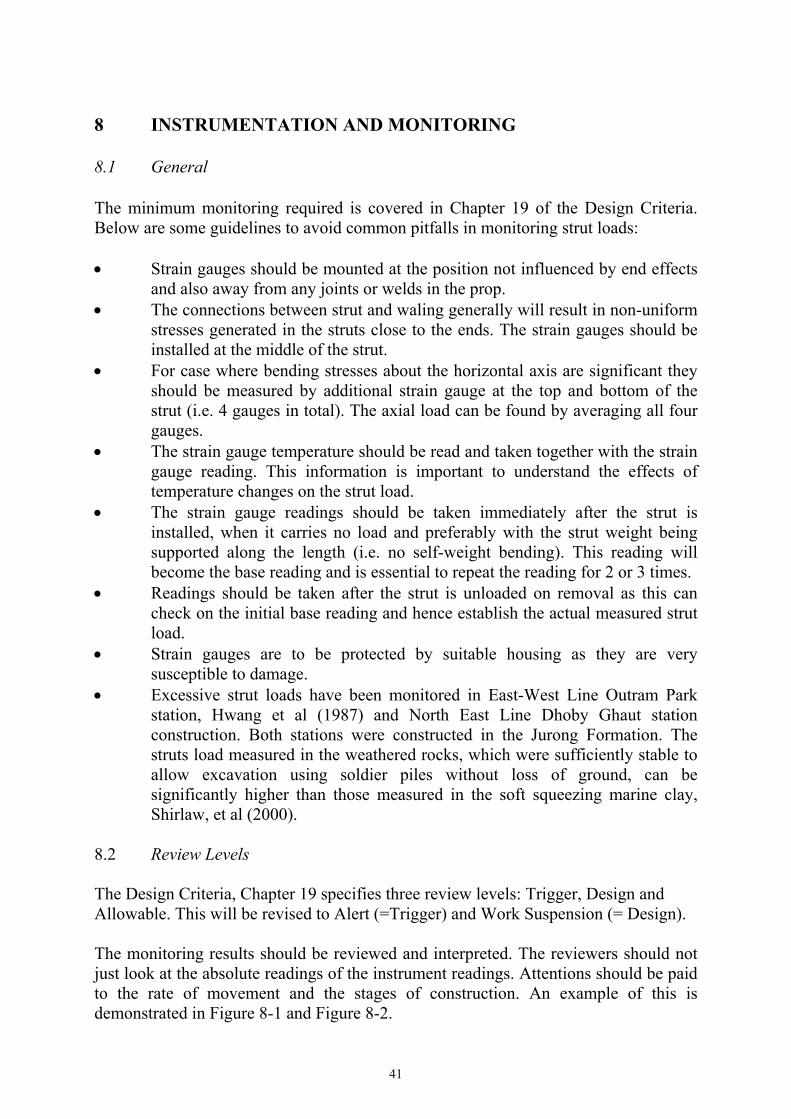
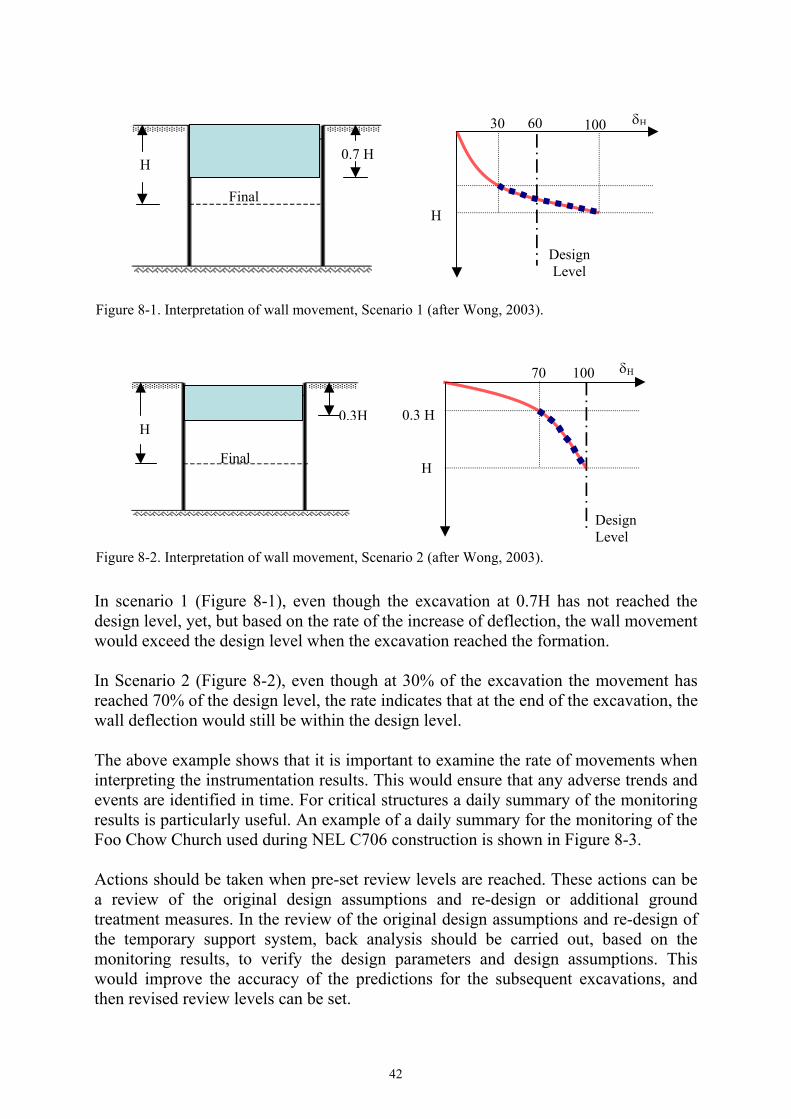
The monitoring results should be reviewed and interpreted. The reviewers should notjust look at the absolute readings of the instrument readings. Attentions should be paidto the rate of movement and the stages of construction. An example of this isdemonstrated in Figure 8-1 and Figure 8-2.
42
In scenario 1 (Figure 8-1), even though the excavation at 0.7H has not reached thedesign level, yet, but based on the rate of the increase of deflection, the wall movementwould exceed the design level when the excavation reached the formation.
In Scenario 2 (Figure 8-2), even though at 30% of the excavation the movement hasreached 70% of the design level, the rate indicates that at the end of the excavation, thewall deflection would still be within the design level.
The above example shows that it is important to examine the rate of movements wheninterpreting the instrumentation results. This would ensure that any adverse trends andevents are identified in time. For critical structures a daily summary of the monitoringresults is particularly useful. An example of a daily summary for the monitoring of theFoo Chow Church used during NEL C706 construction is shown in Figure 8-3.
Actions should be taken when pre-set review levels are reached. These actions can bea review of the original design assumptions and re-design or additional groundtreatment measures. In the review of the original design assumptions and re-design ofthe temporary support system, back analysis should be carried out, based on themonitoring results, to verify the design parameters and design assumptions. Thiswould improve the accuracy of the predictions for the subsequent excavations, andthen revised review levels can be set.
δH
H
30 10060
DesignLevel
Final
H0.7 H
Figure 8-1. Interpretation of wall movement, Scenario 1 (after Wong, 2003).
0.3 H
δH70 100
H
DesignLevel
Figure 8-2. Interpretation of wall movement, Scenario 2 (after Wong, 2003).
Final
H0.3H

43
Figure 8-3. Typical daily summary of monitoring results for critical structures.

44
9 PERFORMANCE OF TEMPORARY WORKS
9.1 General
The construction stage involves implementation of design and construction proposalsthat are manifested in the form of shop drawings, design calculations and methodstatement of works.
In the design of deep excavations the designer starts by analysing the problem withappropriate methods and soil parameters to obtain a best estimate of the forces in theretaining wall and strut loading. In the design certain assumptions will be made aboutthe ground condition, retaining system, strut arrangement and construction sequences.During construction it needs to be ensured that these assumptions made in the designare verified. The designers should be informed if the ground conditions andconstruction deviate substantially from the design.
9.2 Ground Conditions
Ground is not a man-made material with well-defined characteristics and strength. Thedistribution of different stratification, its thickness and the type of deposits depend onthe geological history. In addition, the ground conditions could be modified byactivities such as filling, cutting or excavation activities. Ground conditions cantherefore be very complex. Inevitably some assumptions and generalisation of the soilprofiles will have to be made during design stage. This generalisation of the soilprofiles for design purposes needs to be verified during construction.
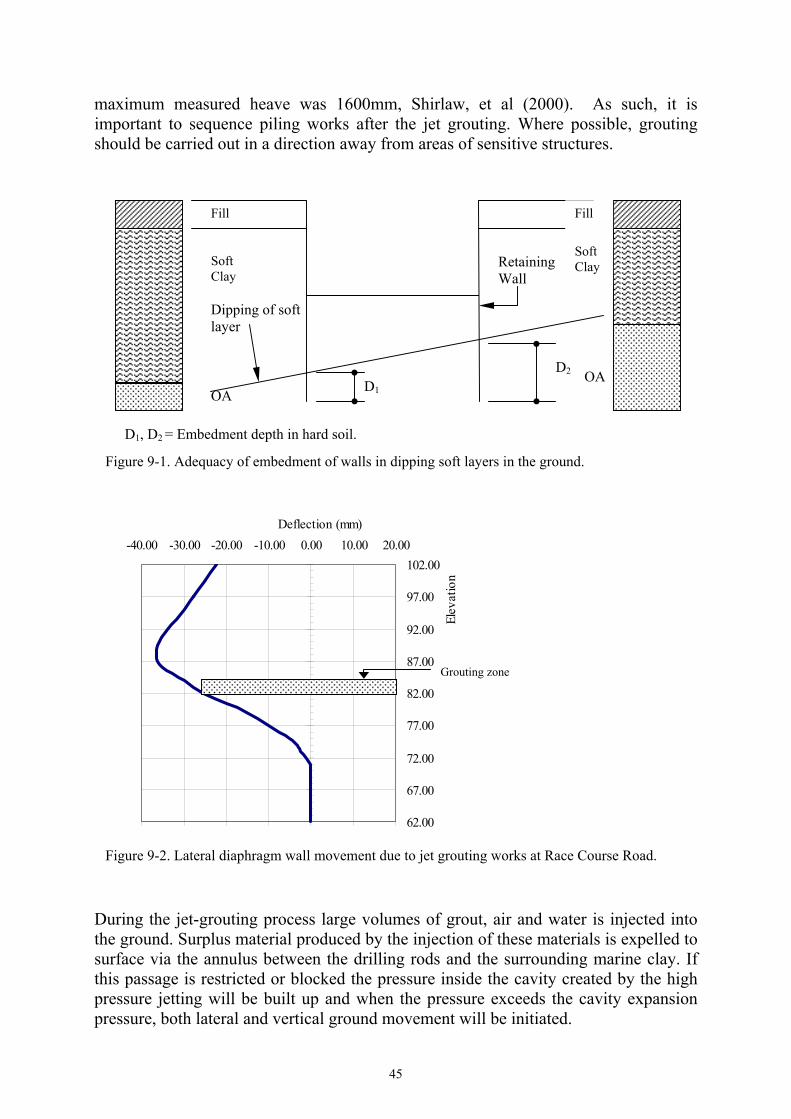
Substantial soil information will be obtained after piling or after diaphragm wallconstructions. If the depth or thickness of the soft clay layer is found to be dippingacross the section or drastically different from the design assumption, the designer ofthe retaining system should be informed. In such situations the designer should checkwhether a re-design needs to be carried out with the additional soil information, inparticular whether the designed toe-in level is adequate if the dipping soft layer mayhave resulted in a reduction in toe-in depth, see Figure 9-1. If the design is based on aembedment depth of D2, then D1 should be checked again to ensure adequateembedment of the retaining walls. This is important as inadequate toe-in will result inover-stressing of the struts, excessive bending moment in the retaining wall and kick-out of the retaining wall, causing excessive ground movement or the retaining systemto collapse.
9.3 Ground movements due to jet grouting
It is very common to use jet grouting to treat soft ground before excavations. While jetgrouting can increase the strength and stiffness of soft soils, it can also cause largeground displacements, including deflection of diaphragm walls, see Figure 9-2. AtRace Course Road, localized heave was reported to be in excess of 300mm, Maguire& Wen (1999). During the early phases of the construction of MRT lines, the
45
maximum measured heave was 1600mm, Shirlaw, et al (2000). As such, it isimportant to sequence piling works after the jet grouting. Where possible, groutingshould be carried out in a direction away from areas of sensitive structures.
During the jet-grouting process large volumes of grout, air and water is injected intothe ground. Surplus material produced by the injection of these materials is expelled tosurface via the annulus between the drilling rods and the surrounding marine clay. Ifthis passage is restricted or blocked the pressure inside the cavity created by the highpressure jetting will be built up and when the pressure exceeds the cavity expansionpressure, both lateral and vertical ground movement will be initiated.
D1
SoftClay
Fill
D2
RetainingWall
D1, D2 = Embedment depth in hard soil.
Dipping of softlayer
OA
Fill
SoftClay
OA
Figure 9-1. Adequacy of embedment of walls in dipping soft layers in the ground.
Figure 9-2. Lateral diaphragm wall movement due to jet grouting works at Race Course Road.
62.00
67.00
72.00
77.00
82.00
87.00
92.00
97.00
102.00-40.00 -30.00 -20.00 -10.00 0.00 10.00 20.00
Deflection (mm)
Elev
atio
n
Grouting zone
46
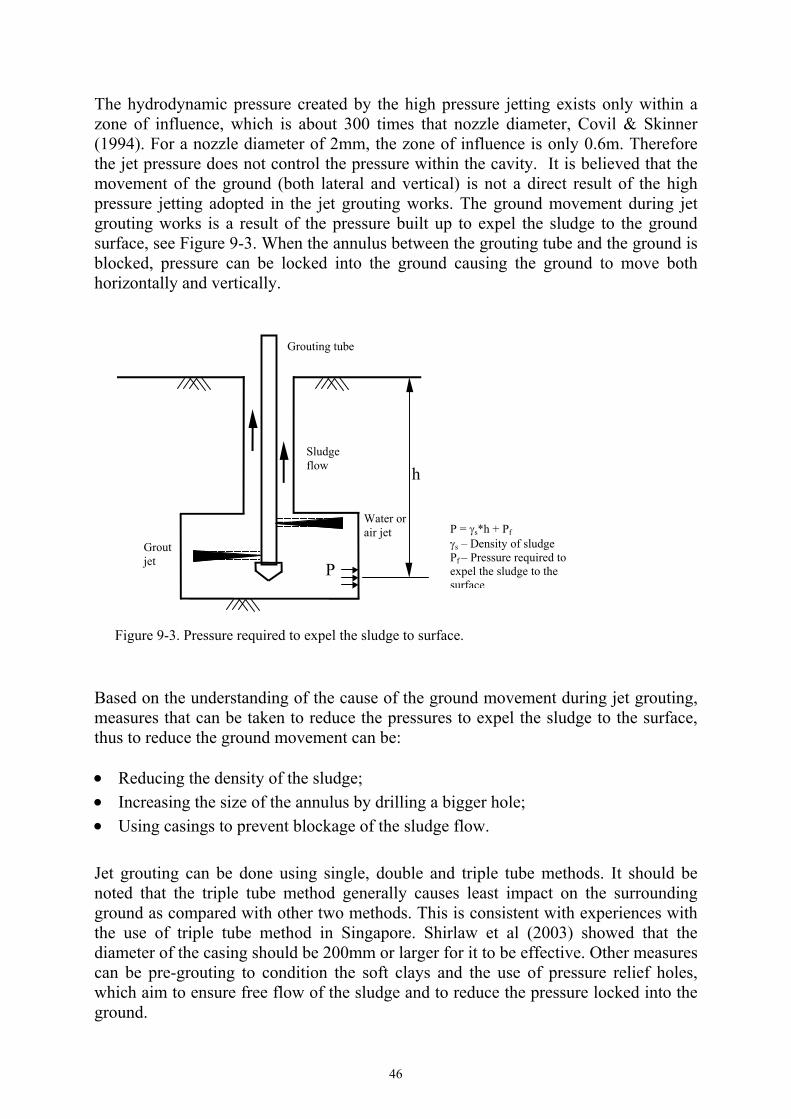
The hydrodynamic pressure created by the high pressure jetting exists only within azone of influence, which is about 300 times that nozzle diameter, Covil & Skinner(1994). For a nozzle diameter of 2mm, the zone of influence is only 0.6m. Thereforethe jet pressure does not control the pressure within the cavity. It is believed that themovement of the ground (both lateral and vertical) is not a direct result of the highpressure jetting adopted in the jet grouting works. The ground movement during jetgrouting works is a result of the pressure built up to expel the sludge to the groundsurface, see Figure 9-3. When the annulus between the grouting tube and the ground isblocked, pressure can be locked into the ground causing the ground to move bothhorizontally and vertically.
Based on the understanding of the cause of the ground movement during jet grouting,measures that can be taken to reduce the pressures to expel the sludge to the surface,thus to reduce the ground movement can be:
• Reducing the density of the sludge;• Increasing the size of the annulus by drilling a bigger hole;• Using casings to prevent blockage of the sludge flow.
Jet grouting can be done using single, double and triple tube methods. It should benoted that the triple tube method generally causes least impact on the surroundingground as compared with other two methods. This is consistent with experiences withthe use of triple tube method in Singapore. Shirlaw et al (2003) showed that thediameter of the casing should be 200mm or larger for it to be effective. Other measurescan be pre-grouting to condition the soft clays and the use of pressure relief holes,which aim to ensure free flow of the sludge and to reduce the pressure locked into theground.
P
h
Grouting tube
Sludgeflow
Water orair jet
Groutjet
P = γs*h + Pfγs – Density of sludgePf – Pressure required toexpel the sludge to thesurface
Figure 9-3. Pressure required to expel the sludge to surface.
47
9.4 Ground movements due to vibration
The driving of piles, installation of casings will often generate vibration. Vibration cancause settlements in loose sands. Buildings particularly old masonry structures aresusceptible to vibrations. Vibrations can be reduced or minimised by the use of silentpilers, casing oscillators which does not cause significant vibration.
Chiselling should be used with extreme caution in the vicinity of sensitive structures asthey can cause collapse of ground, vibration and cracking in adjacent structures.
9.5 Surcharge
Typically temporary retaining walls are designed for a nominal surcharge as auniformly distributed load behind the retaining walls. This nominal load is onlyadequate for normal construction equipment. For heavier machinery, such as cranes,and silos, etc, the nominal value is not adequate and should be considered separately.On drawings designated area should be indicated where design checks have beencarried out to allow for heavy equipment.
9.6 Soldier piles and lagging
Soldier pile with timber lagging can be used where the ground conditions arefavourable and could remain stable without support for a limit period of time while thelagging is put in place. However, where water table draw down is a concern, thismethod should not be used as the wall is not continuous.
For areas where pre-bored holes are used to install the soldier piles, attention should bepaid to how the boreholes are to be filled after the soldier piles have been placed intothe bore. Sandy infills can be washed out easily during clement weather.
How the lagging is installed behind the king posts plays an important part inminimising ground movement. There could be additional ground movement due to thevoids between the lagging and excavated face. The size of the voids depends on theworkmanship. It can be minimised by packing with concrete or cement mortar.
9.7 Gaps in retaining system due to underground services
Where utilities are not diverted, gaps may exist in the retaining system. Extra careshould be exercised in excavation. Often jet grouting columns are proposed to closethe gaps. In this method the soil within the gap is designed to arch over the gap. Itshould be noted that the stiffness of the wall at the gap will be reduced. This will resultin large ground movement behind the wall. Loads at the gap will be transferred to theadjacent retaining walls which should be checked and strengthened if necessary. Thestruts should be checked as well.
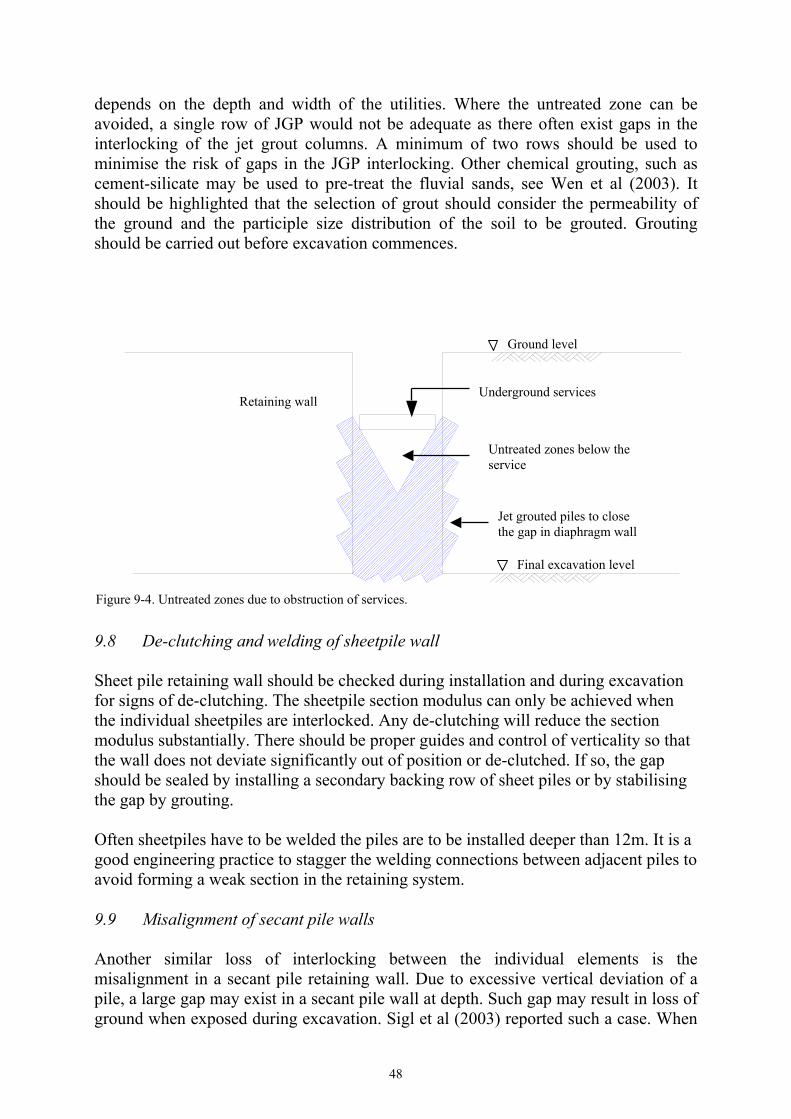
It should be highlighted that the JGP columns may not be effective because of theuntreated zone underneath the utilities, see Figure 9-4. The size of this untreated zone
48
depends on the depth and width of the utilities. Where the untreated zone can beavoided, a single row of JGP would not be adequate as there often exist gaps in theinterlocking of the jet grout columns. A minimum of two rows should be used tominimise the risk of gaps in the JGP interlocking. Other chemical grouting, such ascement-silicate may be used to pre-treat the fluvial sands, see Wen et al (2003). Itshould be highlighted that the selection of grout should consider the permeability ofthe ground and the participle size distribution of the soil to be grouted. Groutingshould be carried out before excavation commences.
9.8 De-clutching and welding of sheetpile wall
Sheet pile retaining wall should be checked during installation and during excavationfor signs of de-clutching. The sheetpile section modulus can only be achieved whenthe individual sheetpiles are interlocked. Any de-clutching will reduce the sectionmodulus substantially. There should be proper guides and control of verticality so thatthe wall does not deviate significantly out of position or de-clutched. If so, the gapshould be sealed by installing a secondary backing row of sheet piles or by stabilisingthe gap by grouting.
Often sheetpiles have to be welded the piles are to be installed deeper than 12m. It is agood engineering practice to stagger the welding connections between adjacent piles toavoid forming a weak section in the retaining system.
9.9 Misalignment of secant pile walls
Another similar loss of interlocking between the individual elements is themisalignment in a secant pile retaining wall. Due to excessive vertical deviation of apile, a large gap may exist in a secant pile wall at depth. Such gap may result in loss ofground when exposed during excavation. Sigl et al (2003) reported such a case. When
Ground level
Final excavation level
Underground services
Jet grouted piles to closethe gap in diaphragm wall
Untreated zones below theservice
Retaining wall
Figure 9-4. Untreated zones due to obstruction of services.
49
the excavation reached 24m below ground, an unexpected ingress of ground water andsoil into the excavation took place as a results of gaps between the piles due to poorverticality. The excavation had to be backfilled for 5m to implement a grouted curtainoutside the retaining wall. The cause of the failure was the misalignment of the secantpiles, leaving large gap for soil and water to flow into the excavation. The mechanismis due to the hydraulic uplift as described in Section 4.2.
9.10 Pre-loading of struts
Pre-loading is a very effective way of reducing ground movement associated withexcavation. LTA Materials and Workmanship Specification requires a minimum pre-loading of 50% of the design load on the strut at the particular stage of excavation.Even a nominal amount of pre-load will go a long way in improving the system as theslack in the load transfer system is taken up. Pre-load are usually applied ontolongitudinal and sometimes on diagonal struts. In applying the pre-load, it is importantto check that the forces in the support system are well balanced. Therefore preloadingshould be done systematically and locked off. After excavation, if the pre-load isfound to drop, the loads can be re-applied. However caution should be exercised, whenthe load trend indicates increasing loads for some and reduction for others. This maysignify an unbalanced strutting system that is not very desirable and could bepotentially unstable.
9.11 Excavation
Where the excavation is large and there is sensitive structures behind the retainingwall, excavation work could be done in compartments or area by area to minimize theexposure time and to install the support as soon as possible to restrict and minimize theground movement.
Over-excavation can occur in a number of ways. The commonest way is excavatingexceeding the designed depth prior to the installation of support or strutting. Othersinclude local excavation of pits for lift pit, sump, pile cap and etc. The design shouldcater for over-excavation and the depth should be the maximum depth including theexcavation of sumps and pile caps.
If soil berms are used, it is to be noted that the berm size is very important in limitingmovement of the ground and deflection of the wall, Powrie & Daly, 2002. Duringconstruction, the berm size should be monitored to avoid over-excavation and forstability of the berm. To ensure full passive resistance, the berm must extendsufficiently to develop the shear resistance and the slope must not fail. To preventdeterioration of slope, the slope can be shotcreted.
The excavation particularly the last stage to formation level should be planned andsequenced to minimise the ground settlement and movements. An effective way tolimit ground deformation in soft ground is to thicken the lean concrete slab at the baseof the excavation to act as temporary support at formation level.

50
Excavation in segments with strut installed within the excavated segment prior to thenext excavation is also useful in controlling the ground movement. Opening-up a longstretch without installation of struts should be avoided. The length of each segmentwill depend on the situations and practicability. 3 to 6m long are commonly adopted.
9.12 Strut removal
Backfill and compaction shall be carried out stage by stage in line with the removal ofstruts.
When the construction involve a temporary wall, and if the permanent wall is not castagainst the temporary wall, a gap will exist between the permanent wall and thetemporary wall. In the limited space available it is difficult to achieve goodcompaction during strut removal. Even when reasonable compaction has beenachieved there have been several instances on NEL projects where there has beensignificant ground movement after the top strut is removed. To limit this movement,one possible way is to entirely backfill the gap between the temporary wall andpermanent wall with lean mix concrete. Another way is to backfill the 1m below thesoffit of the struts with lean mix concrete. To limit movement, it is also a good practiceto backfill the gap between the temporary wall and the permanent wall over the fullheight of the base slab, and also the 1m below the top of the roof slab. A typicalarrangement is shown in Figure 9-5.
9.13 Detailing of Connections
The connection details are important to ensure effective transmission of strut forces,shear and moments.
Struts are basically designed as compressive members. To ensure no buckling, theymust be restrained laterally and vertically. At the interface area where there is highpoint load, the walers must also be stiffened to prevent web buckling. Typical detailsof bracing struts to the king-posts and runner beams are shown in Figure 9-6.Stiffening of walers is shown in Figure 9-7. The dimensions indicated these figures areindicative only. The use of sand bags or concrete as stifferers to walers should not beaccepted.
As far as possible, horizontal struts should be used instead of raked struts. It is difficultto pre-load the raked struts and they will also subject the wall to vertical forces. Whereraked struts are used, the connection should be detailed properly for the transmissionof forces at the wall and where the load will be resisted. It is important that the strut atthe support is properly anchored as rotation of the strut may cause interfacing areas toseparate. There are different ways of providing the support, one of which is shown inFigure 9-8.
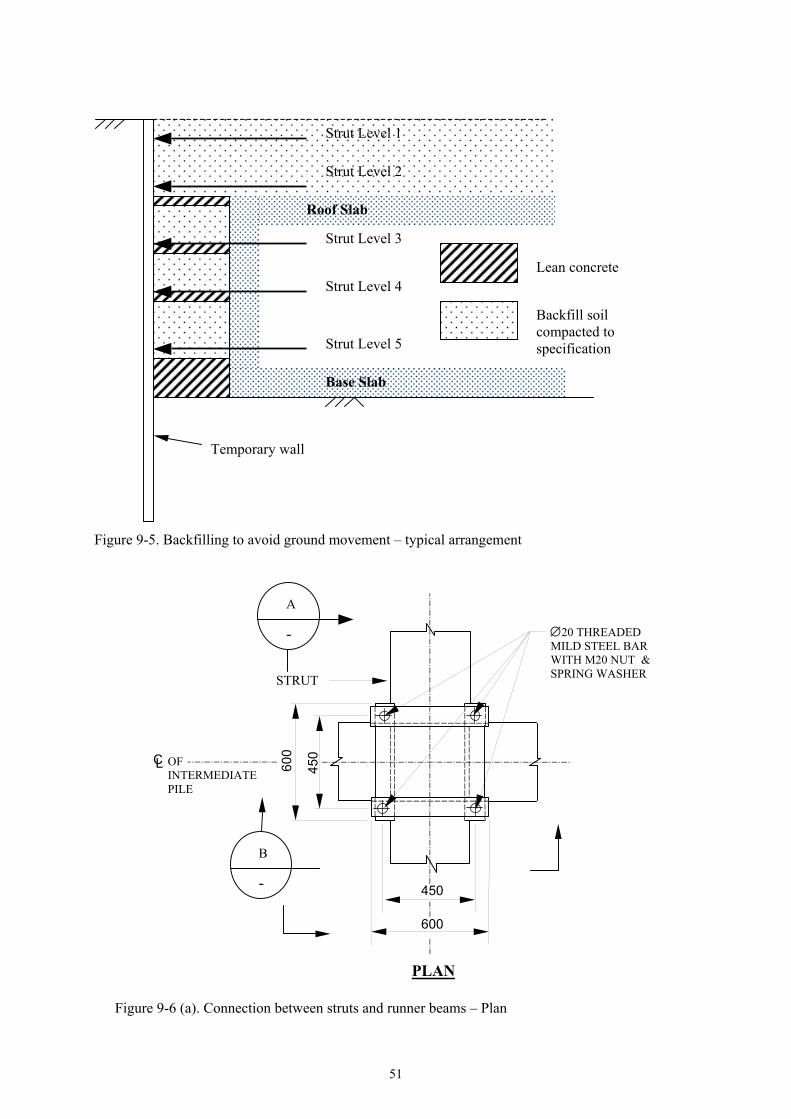
51
Figure 9-5. Backfilling to avoid ground movement – typical arrangement
Backfill soilcompacted tospecification
Lean concrete
Temporary wall
Roof Slab
Base Slab
Strut Level 1
Strut Level 2
Strut Level 3
Strut Level 4
Strut Level 5
PLAN
∅20 THREADEDMILD STEEL BARWITH M20 NUT &SPRING WASHER
A
B
STRUT
CL
450
600
450
600
-
-
OFINTERMEDIATEPILE
Figure 9-6 (a). Connection between struts and runner beams – Plan
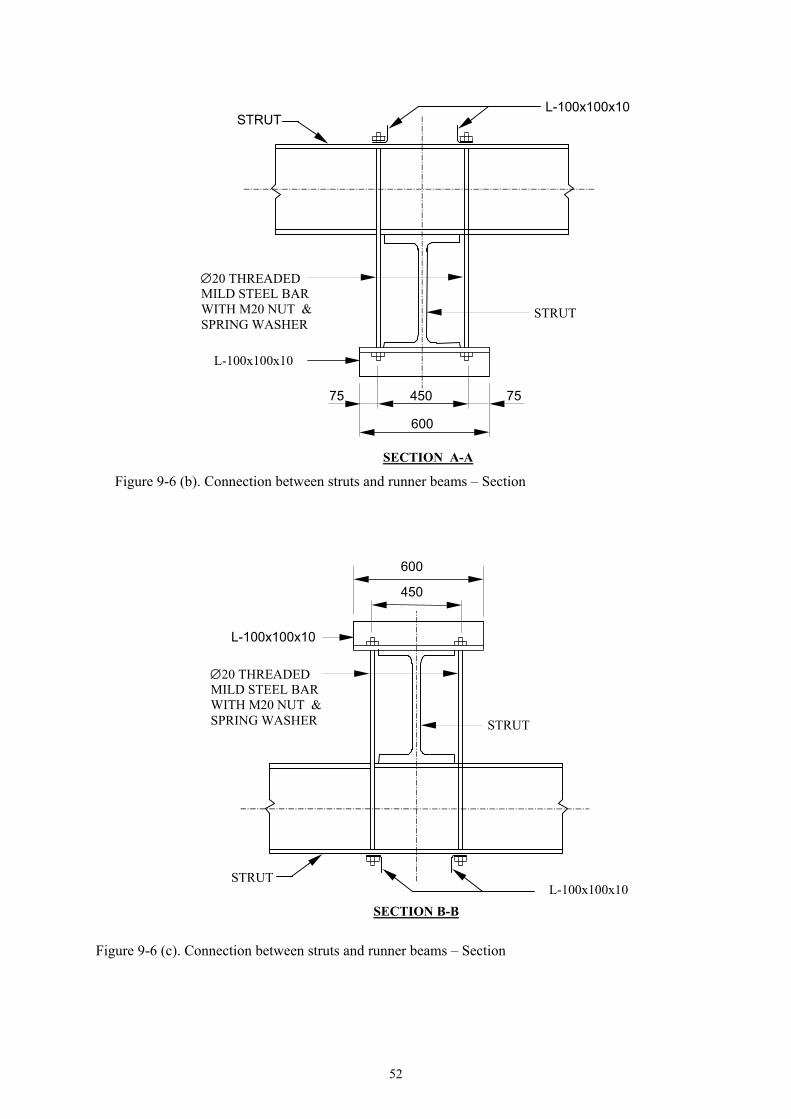
52
600
L-100x100x10
450
∅20 THREADEDMILD STEEL BARWITH M20 NUT &SPRING WASHER STRUT
L-100x100x10STRUT
SECTION B-B
Figure 9-6 (c). Connection between struts and runner beams – Section
SECTION A-A
600
L-100x100x10
450
∅20 THREADEDMILD STEEL BARWITH M20 NUT &SPRING WASHER
STRUT
L-100x100x10STRUT
7575
Figure 9-6 (b). Connection between struts and runner beams – Section
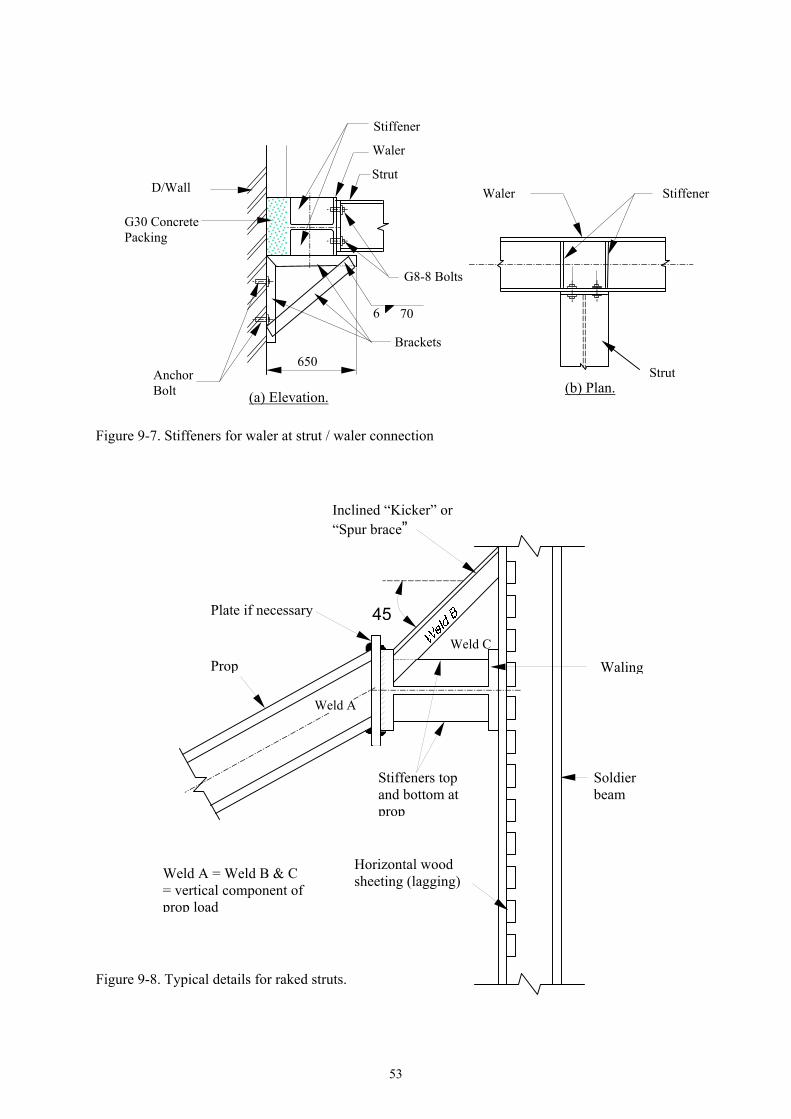
53
Weld C
Weld A
Horizontal woodsheeting (lagging)
Inclined “Kicker” or“Spur brace”
Plate if necessary 45
Prop
Stiffeners topand bottom atprop
Waling
Soldierbeam
Weld A = Weld B & C= vertical component ofprop load
Figure 9-8. Typical details for raked struts.
G8-8 Bolts
D/Wall
G30 ConcretePacking
650AnchorBolt
Stiffener
Waler
Strut
6 70
Brackets
(a) Elevation.
StiffenerWaler
Strut(b) Plan.
Figure 9-7. Stiffeners for waler at strut / waler connection
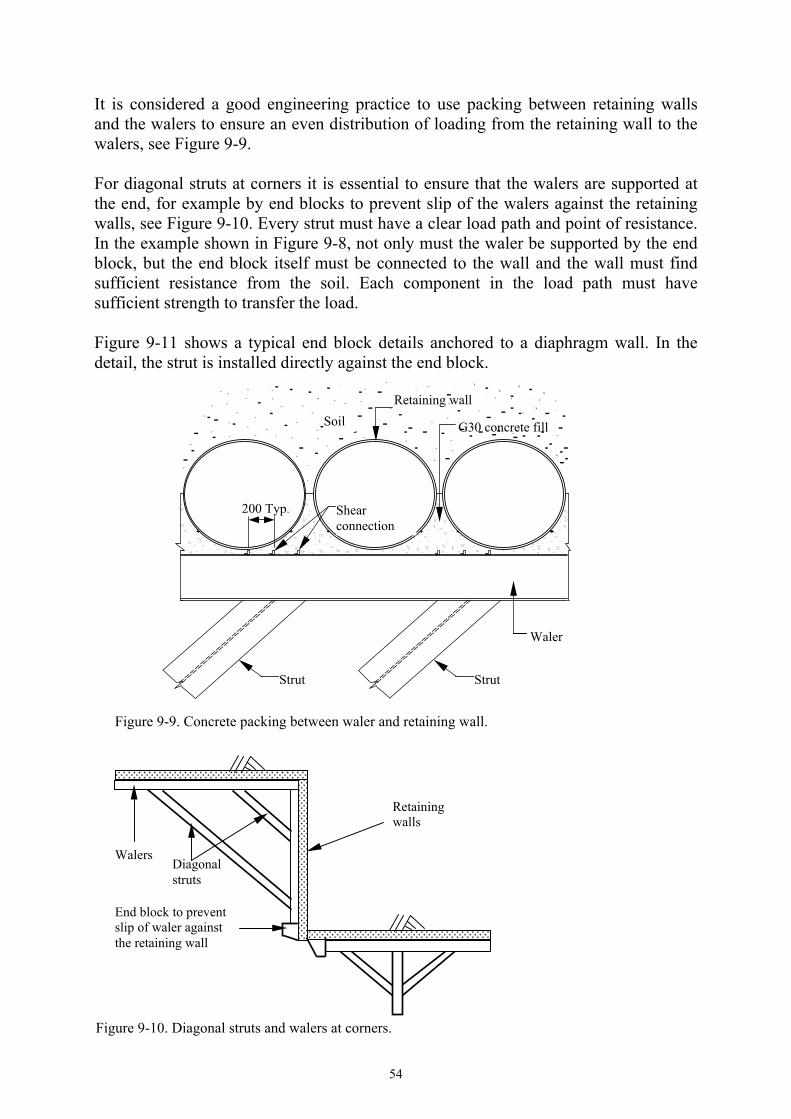
54
It is considered a good engineering practice to use packing between retaining wallsand the walers to ensure an even distribution of loading from the retaining wall to thewalers, see Figure 9-9.
For diagonal struts at corners it is essential to ensure that the walers are supported atthe end, for example by end blocks to prevent slip of the walers against the retainingwalls, see Figure 9-10. Every strut must have a clear load path and point of resistance.In the example shown in Figure 9-8, not only must the waler be supported by the endblock, but the end block itself must be connected to the wall and the wall must findsufficient resistance from the soil. Each component in the load path must havesufficient strength to transfer the load.
Figure 9-11 shows a typical end block details anchored to a diaphragm wall. In thedetail, the strut is installed directly against the end block.
Retaining wall
Strut Strut
G30 concrete fillSoil
Shearconnection
Waler
200 Typ.
Figure 9-9. Concrete packing between waler and retaining wall.
Diagonalstruts
Retainingwalls
Walers
End block to preventslip of waler againstthe retaining wall
Figure 9-10. Diagonal struts and walers at corners.
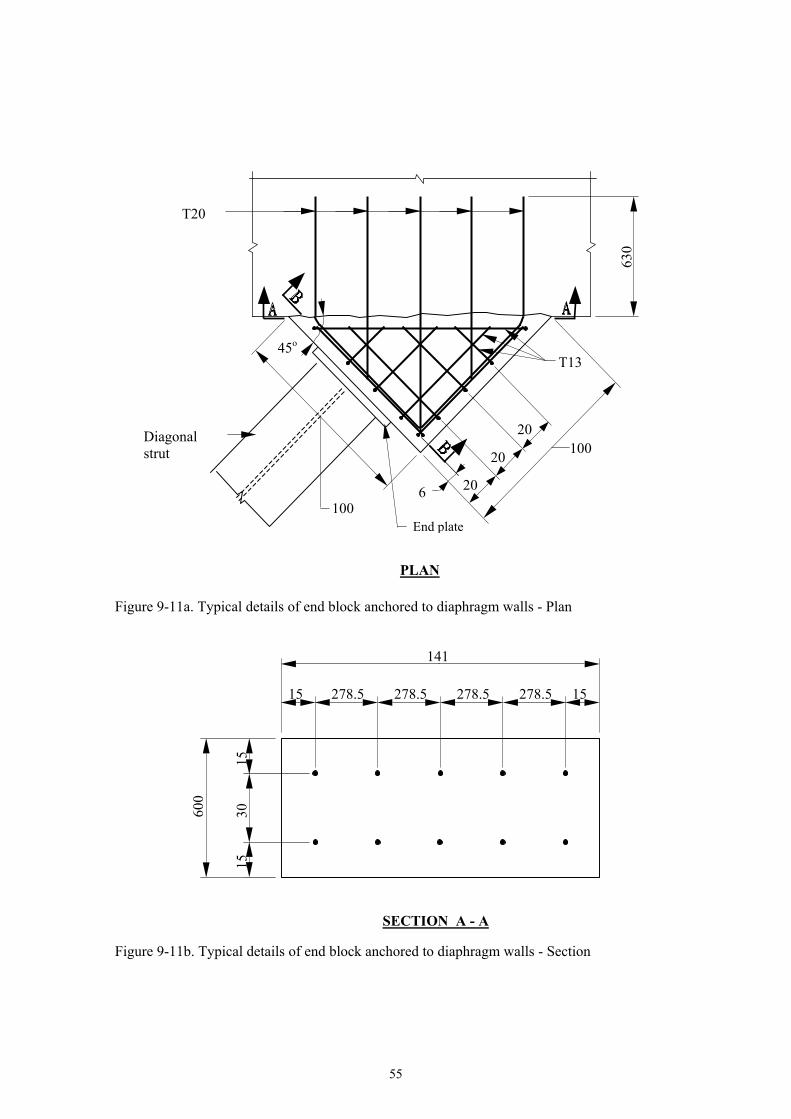
55
45o
T20
100
10020
20
206
630
Diagonalstrut
End plate
T13
PLAN
600
141
SECTION A - A
30
15 278.5 15278.5278.5278.5
1515
Figure 9-11a. Typical details of end block anchored to diaphragm walls - Plan
Figure 9-11b. Typical details of end block anchored to diaphragm walls - Section
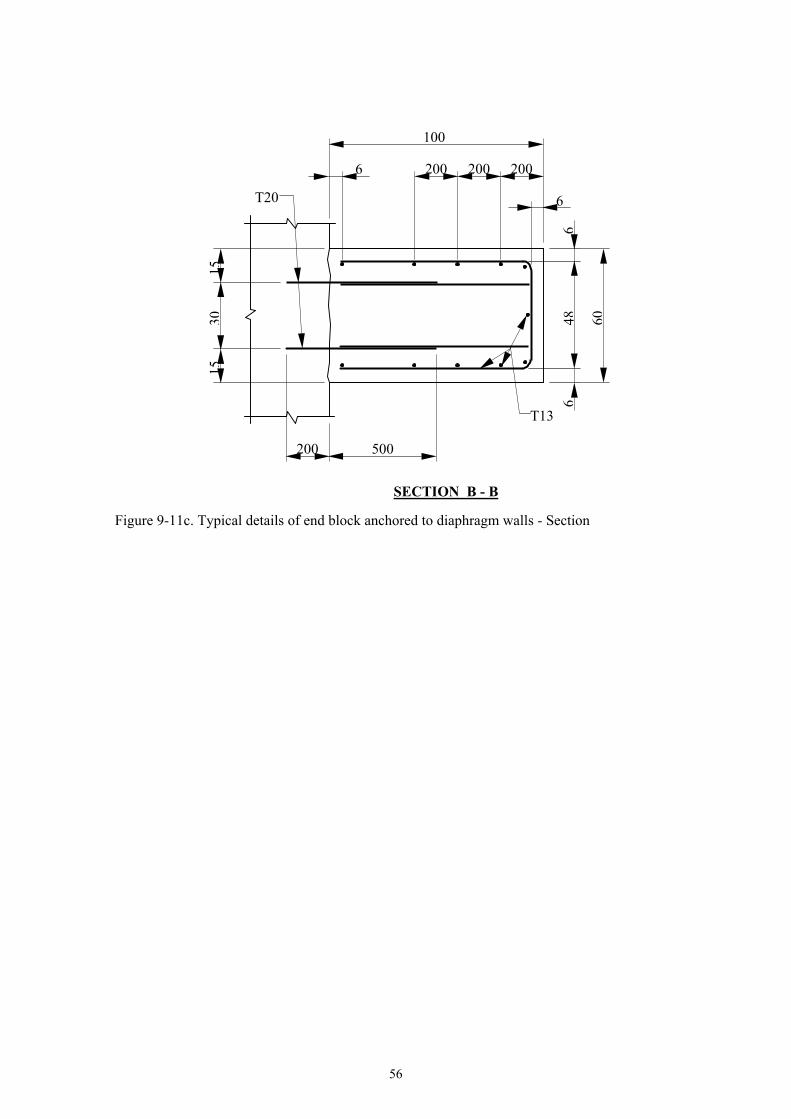
56
100
30
6 200
6
200 200
60
66
48
200 500
T2015
15
SECTION B - B
T13
Figure 9-11c. Typical details of end block anchored to diaphragm walls - Section
57
REFERENCES
Bjerrum, L. & Eide, O. (1956). Stability of strutted excavations in clay, Geotechnique, Vol. 6, No. 1,March 1956.
Boscardin, M.D. & Cording, E.J. (1989). Building response to excavation induced settlement, Journalof Geotechnical Engineering, ASCE, Vol. 115, 1989.
British Standard BS8002. (1994). Code of practice for earth retaining structures. British StandardInstitution.
Burland, J.B., Broms, B.B, & De Mello, V.F.B. (1977). Behaviour of foundations and structures,Proceedings of the 9th International Conference of Soil Mechanics and Foundation Engineering,Tokyo, 1977.
Burland, J.B. and Wroth, C.P. (1974). Alloeable and differential settlement of structures, includingdamage and soil-structure interaction, Proceedings of Conferenceon Settlement of Structures,Cambridge University,Canbridge, UK, 1974.
Chu, J., Wen, D., Kay, R.E. & Tay, T.H. (2000). Engineering properties of fluvial sand at Race CourseRoad, Proceedings of International Conference on Tunnels and Underground Structures,Singapore, 26-29 November 2000.
Clough, G.W. & Schmidt, B. (1981). Design and performance of excavations and tunnels in soft clay.Soft Clay Engineering, ed E.W. Brand and R.P.Brenner, Elsevier, Amsterdam.
Covil, C.S. & Skinner, A.E. (1994). Jet grouting, - a review of some of the operating parameters thatform the basis of the jet grouting process. Proceedings Grouting in the ground, A.L. Bell ed.,Thomas Telford.
Dames and Moore (1983). Mass Rapid Transit System, Singapore: detailed geotechnical study –interpretative report, Provisional Mass Rapid Transit Authority, Singapore.
Davies, R. V. (1984). Some geotechnical problems with foundations and basements in Singapore,Proceedings of International Conference on Tall Buildings, Singapore, 22-26 October 1984.
Flanagan, R., Schmidt, B. & Tan, B.T. (1999). Major sewer tunnel construction beneath metro tunnelsin Singapore. Proceedings of the Rapid Excavation & Tunnelling Conference, Florida.
Fleming (1981). Piling engineering, Published by John Wiley & Sons, 1981.Geotechnical Manual for Slopes, Geotechnical Control Office, Engineering Development Department,
Hong Kong, 1984.Han, K.K., Wong, K.S. Broms, B.B. & Yap, L.P. (1993a). The origin and properties of bouldery clay
in Singapore, Geotechnical Engineering, 24.Han, K.K., Wong, K.S. Broms, B.B. (1993b). Singapore bouldery clay: the origin properties and load
tests of bored and cast-in-place piles. Proceedings of 11th Southeast Asian GeotechnicalConference, May, Singapore.
Hoek E. and Brown, E.T. (1997). Practical estimates of rock mass strength. International Journal ofRock Mechanics and Mining Science, Vol. 34(8).
Hulme, T.W., Potter, L.A. & Shirlaw, J.N. (1989). Singapore Mass Rapid Transit System:construction, Proceedings of Institution of Civil Engineers, Transportation Engineering Group,Part 1, 1989.
Hulme, T. W., Chapman, P.H.J., Foo, P.H., Copsey, J.P., Kraft, B., Sripathy, P., Potter, L.A.C. &Shirlaw, J.N. (1991). Discussion, Proceedings of the Institution of Civil Engineers, TransportationEngineering Group, Vol. 90.
Hwang, R., Quah, H. P. & Buttling, S. (1987). Measurements of strut forces in braced excavations.Proceedings of the Singapore Mass Rapid Transit Conference, 6-9 April 1987, Singapore.
KarWinn, Rahardjo, H. & Seh, C.P. (2001). Characterisation of Residual Soils in Singapore.Geotechnical Engineering, 23(1).
Lee, F.H., Yong, K.Y., Quan, C.N. & Chee, K.T. (1998). Effect of corners in strutted excavations:field Monitoring and case histories. Journal of Geotechnical and Geoenvironmental EngineeringASCE, April 1998, Vol. 124, No. 4.
Lee, F.H., Tan, T.S. & Wang, X.N. (2001). Ground water effects in soldier-piled excavations inresidual soils. Proceedings of Underground Singapore 2001, Singapore, 29-30 November 2001.
58
Lim, T.T. (1995). Shear strength characteristics and rainfall-induced matric suction changes in aresidual soil slope, MEng Thesis, School of Civil & Structural Engineering, Nanyang TechnologicalUniversity, Singapore.
Lo, K.W., Leung, C.F., Hayata, K. & Lee, S.L. (1988). Stability of excavated slopes in weatheredJurong Formation of Singapore. Proceedings of 2nd Int. Conf. On Geomechanics in Tropical Soils,Singapore, 1: 277-284. Balkema: Rotterdam.
Maguire, C. & Wen, D. (1999). Practical aspects of jet grouting in Singapore marine clay.Proceedings of International Conference on Rail Transit, Singapore.
Mair, R., Taylor, R.N. & Burland, J.B. (1996). Prediction of ground movements and assessment ofrisk of building damage due to bored tunnelling, Proceedings of International Symposium onGeotechnical Aspects of Underground Construction in Soft Ground, London, 1996.
Orihara, K. and Khoo, K.S. (1998). Engineering properties of Old Alluvium in Singapore and itsparameters for bored pile and excavation design, Proceedings of 13th Asian GeotechnicalConference, Taiwan.
Orihara, K., Makino, M. & Tse, T.K.D. (1999). Excavation for construction of new Dhoby GhautMRT station. Proceedings of International Conference on Rail Transit, 11-13 March 1999,Singapore.
NAVFAC DM7.2 (1982) Foundations and Earth Structures, Design Manual 7.2, Department of theNavy, Naval Facilities Engineering Command, Alexandria, VA. 22332, USA.
Nicholson, D.P. (1987). The design and performance of the retaining walls at Newton station.Proceedings of the Singapore Mass Rapid Transit Conference, Singapore, 6-9 April 1987.
Oaimi, A.E. & Clough, G.W. (1979). Pore pressure distribution during excavation, Journal ofGeotechnical Engineering Division, ASCE, Vol. 105.
Padfield, C.J. & Mair, R.J. (1984). Design of retaining walls embedded in stiff clay. CIRIA Report104, Construction Industry Research and Information Association, London.
Pitts, J. (1984). A review of geology and engineering geology in Singapore. Quarterly JournalEngineering Geology, Vol. 17. London.
Pitts, J. (1984). A survey of engineering geology in Singapore. Geotechnical Engineering, Vo. 15.Pitts, J. (1985). Discussion on “ A review of geology and engineering geology in Singapore”.
Quarterly Journal Engineering Geology,Vol. 18,London.Potts, D.M. & Fourie, A.B. (1984). The effect of wall stiffness on the behaviour of a propped retaining
wall. Geotechnique, Vol. 35.Poh, K.B., Chua, H.L. & Tan, S.B. (1985). Residual granite soil of Singapore. Proceedings of 8th
Southeast Asian Geotechnical Conference, Kuala Lumpur.Poh, T.Y & Wong, I.H. (1998). Effects of construction of diaphragm wall panels on adjacent ground:
field trial. Journal of Geotechnical and Geoenvironmental Engineering.Powrie W. & Daly, M.P. (2002). Centrifuge model test on embedded retaining walls supported by
earth berms. Geotechnique, 52, No. 2.Rahardjo, H. (2000). Rainfall-Induced Slope Failures. NSTB 17/6/16 Main Report, Nanyang
Technological University, Singapore.Shirlaw, J.N., Poh, KB. Hwang, R.N. (1990). Properties & origins of Singapore boulder bed.
Proceedings of 10th Southeast Asian Geotechnical Conference, April, Taipei.Shirlaw, J.N. & Wen, D. (1999). Measurement of pore pressure changes and settlements due to a deep
excavation in Singapore marine clay. Proceedings of the 5th International Symposium on FieldMeasurements in Geomechanics, 1-3 December 1999, Singapore.
Shirlaw, J.N., Hencher, S.R. & Zhao, J. (2000). Design and construction issues for excavation andtunnelling in some tropically weathered rocks and soils. Proceedings of GeoEng2000, 19-24November, 2000. Melbourne, Australia.
Shirlaw, J.N., Wen, D., Nadarajah, P., Yoon, S. I. & Sugawara, S. (2000a). Construction issues relatedto jet grouted slabs at the base of excavations. Proceedings of Tunnels and Underground Structures,an International Conference, 26-29 November 2000, Singapore.
Shirlaw, N.J., Broome, P.B., Chandrasegaran, S., Daley, J., Orihara, K., Raju, G.V.R., Tang, S.K.,Wong, I.H., Wong, K.S. & Yu, K. (2003). The Fort Canning Boulder Bed. Proceedings ofUnderground Singapore 2003 and Workshop “Updating the Engineering Geology of Singapore”,27-29 November 2003, Singapore.
Shirlaw, J.N., Wen, D., Kheng, H.Y. & Osborne, N. (2003). Controlling heave during jet grouting onMarine Clay. Proceedings of the RTS Conference, Singapore.

59
Sigl, O., Jedlitschka, G. & Weheli, J.M. (2003). DTSS Shaft R2: shaft and tunnel excavation inweathered Bukit Timah Granite. Proceedings of Underground Singapore 2003, 27-29 November2003, Singapore.
Singapore Standard CP18 : 1992. Code of Practice for earthworks, Singapore Institute of Standardsand Industrial Research, 1992.
Tan, S.B., Loy, W.C. & Lee, K.W. (1980). Engineering geology of the Old Alluvium in Singapore. 6th
Southeast Asian Conference on Soil Engineering, Taipei.Tan, S.B., Tan, S.L., Lim, T.L. & Yang, K.S. (1987). Landslide problems and their control in
Singapore. Proceedings of 9th Southeast Asian Geotechnical Conference, Bangkok, Thailand.Wen, D. & Lin, K.Q. (2002). The effect of deep excavation on pore water pressure changes in the Old
Alluvium and under-drainage of marine clay in Singapore. Proceedings of the 3rd InternationalSymposium on Geotechnical Aspects of Underground Construction in Soft Ground, 23-25 October2002, Toulouse, France.
Wen, D., Ow, C.N. & Yoon S.I. (2001). The monitoring of cut and cover tunnel construction at RaceCourse Road next to Foochow Methodist Church, Proceedings of Underground Singapore 2001,Singapore, 29-30 November 2001.
Wen, D., Heng, C.H., Choo, H.Y. & Yoon, S.I. (2003) Gaps in diaphragm walls and remedialmeasures for the deep excavations at Race Course Road. Proceedings of Underground Singapore,27-29 November 2003, Singapore.
Wong, I.H., Poh, T.Y. & Chuah, H.L. (1997). Performance of excavations for depressed expresswaysin Singapore. Journal of Geotechnical Engineering and Geoenvironment Engineering, ASCE, Jult1997.
Wong, K.S., Li, W., Shirlaw, J.N., Ong, J.C.W., Wen, D. & Hsu, J.C.W. (2001). Old Alluvium:engineering properties and braced excavation performance. Proceedings of UndergroundSingapore 2001, Singapore.
Wong, K.S. (2003). Observational approach to avoid failures in temporary works, Proceedings of BCASeminar: Avoiding Failures in Excavation Works, 11 July 2003.
Wong, K.S., Goh, A.T.C. & Ganeshan, V. (2003). Design of temporary works, an in-house shortcourse for Land Transport Authority, 11 & 15 December 2003, Land Transport Authority,Singapore.
Yang, K.S. & Tang, S.K. (1997). Stabilising the slope of Bukit Gombak. Proceedings of 3YGEC,Singapore.
Yong, R.N., Chen, C.K., Sellappah, J. & Chong, T.S. (1985). The characterization of residual soils inSingapore. Proceedings of 8th Southeast Asian Geotechnical Conference, Kuala Lumpur,Malaysia.
Zhou, Y. (2001). Engineering geology and rock mass properties of the Bukit Timah Granite.Proceedings of Underground Singapore 2001, Singapore.
Zhu, H. (2000). Evaluation of load transfer behaviour of bored piles in residual soils incorporatingconstruction effects. Ph.D. Thesis, School of Civil & Structural Engineering, NanyangTechnological University, Singapore.
![[GT-PPT] Deep Excavation Presentation 20150317](https://static.documents.pub/doc/80x56/55cf91be550346f57b903750/gt-ppt-deep-excavation-presentation-20150317.jpg)


