JOINT ORGANISATIONS DATA INITIATIVE A Concrete Outcome of the Consumer - Producer Dialogue 7 th Regional JODI Training Workshop 8-10 October 2012, Rabat, Morocco Hands-on exercise using sample data Presented by Ms. Liliana Suchodolska (IEA)
Transcript
JOIN
T O
RG
AN
ISAT
ION
S D
ATA
INIT
IATI
VE
A C
oncr
ete
Out
com
e of
the
Con
sum
er -
Pro
duce
r Dia
logu
e
7th Regional JODI Training Workshop 8-10 October 2012, Rabat, Morocco
Hands-on exercise using sample data
Presented by Ms. Liliana Suchodolska (IEA)
JOIN
T O
RG
AN
ISAT
ION
S D
ATA
INIT
IATI
VE
A C
oncr
ete
Out
com
e of
the
Con
sum
er -
Pro
duce
r Dia
logu
e
7th Regional JODI Training Workshop, 8-10 October 2012, Rabat, Morocco
• Around 100 countries submits monthly JODI
• It is important that the quality of data is checked before submission
• The following exercises are based on actual submissions, where we hide the country and mask the numbers (multiplying by a constant)
Exercises
JOIN
T O
RG
AN
ISAT
ION
S D
ATA
INIT
IATI
VE
A C
oncr
ete
Out
com
e of
the
Con
sum
er -
Pro
duce
r Dia
logu
e
7th Regional JODI Training Workshop, 8-10 October 2012, Rabat, Morocco
Setting an example in the JODI Extended questionnaire:
Automatic checks to more quickly see potential discrepancies.
More product detail requested including a column for other products.
JOIN
T O
RG
AN
ISAT
ION
S D
ATA
INIT
IATI
VE
A C
oncr
ete
Out
com
e of
the
Con
sum
er -
Pro
duce
r Dia
logu
e
7th Regional JODI Training Workshop, 8-10 October 2012, Rabat, Morocco
1) Take 5 minutes to analyze the submission below and take notes. - Discuss with your colleagues - Does everything seem consistent?
JOIN
T O
RG
AN
ISAT
ION
S D
ATA
INIT
IATI
VE
A C
oncr
ete
Out
com
e of
the
Con
sum
er -
Pro
duce
r Dia
logu
e
7th Regional JODI Training Workshop, 8-10 October 2012, Rabat, Morocco
Answer:
- The Statistical Difference for Crude Oil is not calculated correctly : Calculated Refinery Intake = 1798 – 1819 – (– 44) = 23 Observed Refinery Intake = 53534 Statistical Difference = Calculated Refinery Intake – Observed Refinery Intake 23 – 53534 = – 53511 Missing imports? Underreported production? Wrong units? - NGL: negative closing stocks, no other flows reported. - The column “Total” is not equal to its components for Production, Direct Use and Statistical Difference.
Calculated Crude Oil and NGL Refinery Intake =
Production + Imports – Exports
– Direct Use – Stock Change
Note that for Other Primary Products you need to add From
Other Sources and Product Transferred/ Backflows
JOIN
T O
RG
AN
ISAT
ION
S D
ATA
INIT
IATI
VE
A C
oncr
ete
Out
com
e of
the
Con
sum
er -
Pro
duce
r Dia
logu
e
7th Regional JODI Training Workshop, 8-10 October 2012, Rabat, Morocco
1) Take 15 minutes to analyze the submission below and take notes. Discuss with your colleagues what is wrong in the following cells;
JOIN
T O
RG
AN
ISAT
ION
S D
ATA
INIT
IATI
VE
A C
oncr
ete
Out
com
e of
the
Con
sum
er -
Pro
duce
r Dia
logu
e
7th Regional JODI Training Workshop, 8-10 October 2012, Rabat, Morocco
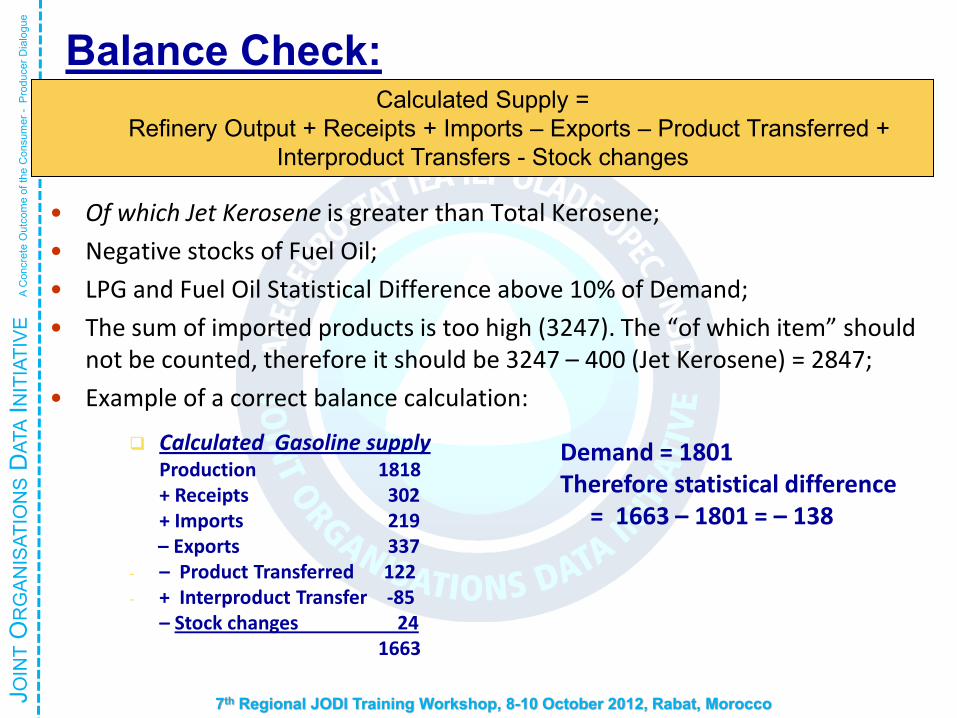
• Of which Jet Kerosene is greater than Total Kerosene; • Negative stocks of Fuel Oil; • LPG and Fuel Oil Statistical Difference above 10% of Demand; • The sum of imported products is too high (3247). The “of which item” should
not be counted, therefore it should be 3247 – 400 (Jet Kerosene) = 2847; • Example of a correct balance calculation:
– Stock changes* -102 *Closing stock (-102) - 652 Demand is also 652
For Example, Fuel Oil
JOIN
T O
RG
AN
ISAT
ION
S D
ATA
INIT
IATI
VE
A C
oncr
ete
Out
com
e of
the
Con
sum
er -
Pro
duce
r Dia
logu
e
7th Regional JODI Training Workshop, 8-10 October 2012, Rabat, Morocco
Balance Check:
Please also pay attention to the balance between the Primary and Secondary Products and to the checks below the table:
JOIN
T O
RG
AN
ISAT
ION
S D
ATA
INIT
IATI
VE
A C
oncr
ete
Out
com
e of
the
Con
sum
er -
Pro
duce
r Dia
logu
e
7th Regional JODI Training Workshop, 8-10 October 2012, Rabat, Morocco
Balance:
Other inconsistencies: - Interproduct transfer different from 0;
- Statistical Difference above 10% of Refinery Intake for Other primary products. For LPG and Fuel Oil Statistical Difference above 10% of Demand.
The refinery losses are negative = refinery gain (should be avoided). Refinery output 18% higher than refinery input 8433 / 7112 = 118% Refinery Losses = Refinery Intake of Total Products – Refinery Output
of Total Products
Interproduct transfer of Total Products should be equal to 0
JOIN
T O
RG
AN
ISAT
ION
S D
ATA
INIT
IATI
VE
A C
oncr
ete
Out
com
e of
the
Con
sum
er -
Pro
duce
r Dia
logu
e
7th Regional JODI Training Workshop, 8-10 October 2012, Rabat, Morocco
Possible Causes of Imbalance and Inconsistencies
• Missing data ≠ 0? • Hidden confidential data? • Different units? • Does a negative output represent an input to the
refineries? • Different time spans? • Inaccuracy (wrong data)? • In any way, if data is close to accurate, a considerable
amount of metadata is missing
JOIN
T O
RG
AN
ISAT
ION
S D
ATA
INIT
IATI
VE
A C
oncr
ete
Out
com
e of
the
Con
sum
er -
Pro
duce
r Dia
logu
e
7th Regional JODI Training Workshop, 8-10 October 2012, Rabat, Morocco
3) Take 5 minutes to analyze the chart below from the Beyond 2020 table and take notes. Discuss with your colleagues.
JOIN
T O
RG
AN
ISAT
ION
S D
ATA
INIT
IATI
VE
A C
oncr
ete
Out
com
e of
the
Con
sum
er -
Pro
duce
r Dia
logu
e
7th Regional JODI Training Workshop, 8-10 October 2012, Rabat, Morocco
In this example, crude oil production is a cumulative production starting at the beginning of each year
3) Take 5 minutes to analyze the chart below from the Beyond 2020 table and take notes. Discuss with your colleagues.
JOIN
T O
RG
AN
ISAT
ION
S D
ATA
INIT
IATI
VE
A C
oncr
ete
Out
com
e of
the
Con
sum
er -
Pro
duce
r Dia
logu
e
7th Regional JODI Training Workshop, 8-10 October 2012, Rabat, Morocco