Haptic perception remains a grand challenge for artificial hands. Dexterous manipulators could be enhanced by “haptic intelligence” that enables identification of objects and their features via touch alone. Haptic perception of local shape would be useful when vision is obstructed or when proprioceptive feedback is inadequate, as observed in this study. In this work, a robot hand outfitted with a deformable, bladder-type, multimodal tactile sensor was used to replay four human-inspired haptic “exploratory procedures” on fingertip-sized geometric features. The geometric features varied by type (bump, pit), curvature (planar, conical, spherical), and footprint dimension (1.25 - 20 mm). Tactile signals generated by active fingertip motions were used to extract key parameters for use as inputs to supervised learning models. A support vector classifier estimated order of curvature while support vector regression models estimated footprint dimension once curvature had been estimated. A distal-proximal stroke (along the long axis of the finger) enabled estimation of order of curvature with an accuracy of 97%. Best-performing, curvature-specific, support vector regression models yielded R2 values of at least 0.95. While a radial-ulnar stroke (along the short axis of the finger) was most helpful for estimating feature type and size for planar features, a rolling motion was most helpful for conical and spherical features. The ability to haptically perceive local shape could be used to advance robot autonomy and provide haptic feedback to human teleoperators of devices ranging from bomb defusal robots to neuroprostheses. Keywords: active touch, exploratory procedures, fingertip-sized geometric features, haptic perception, local shape, prosthetic, robotic, tactile sensing
1. INTRODUCTION Haptic perception remains a grand challenge for robots used for physically interacting with and manipulating their unstructured environments. Consider a task such as reaching into one’s pants pocket, identifying a cellphone and its orientation, and then locating and pushing the phone’s power button. Such a task is trivial for humans, but currently impossible for artificial hands. Rich tactile sensors provide information that might otherwise be unavailable in the absence of useful visual feedback, such as in low lighting conditions or when line of sight is obstructed. However, tactile sensor technology is only one piece of the puzzle. One must still make the leap from sensing of raw data to perception of high-level abstractions about object properties and features for planning purposes.
It has been shown that humans employ action-perception loops during haptic exploration of objects. In a seminal psychophysics study, Lederman and Klatzky identified a key subset of haptic “exploratory procedures” (EPs) that humans use when extracting information about object properties through touch alone1. For instance, the substance-related property of hardness is perceived by pressing into the object with one’s fingertips. The structure-related property of shape is perceived by whole hand enclosure for global shape and contour following for local shape. These exploratory actions serve to stimulate thousands of specialized mechanoreceptors in the glabrous skin of the hand2 which encode rich multimodal information about hand-object interactions. Objects typically have distinguishing geometric features that can be used for identification of the object itself as well as its orientation with respect to the hand. The present study aims to further develop artificial haptic intelligence for the structure-related property of shape.
1.1 Human discrimination of curvature
Edges and vertices have been identified as the most salient geometric properties of a 3D object3. Nonetheless, curvature plays an important role when exploring objects via single-digit contour-following. Multiple studies with human subjects have focused on curvature discrimination of objects that span the width of the finger. One study used stimuli designed to
Downloaded From: http://proceedings.spiedigitallibrary.org/ on 06/21/2014 Terms of Use: http://spiedl.org/terms
be planar (0th order), conical (1st order), and spherical (2nd order) with corresponding changes in height, slope, and curvature, respectively4. For one static exploratory condition, subjects placed the fingerpad of one to three fingers on each stimulus. For one dynamic exploratory condition, subjects stroked an index finger against the 2nd order stimulus along the short axis of the finger (radial-ulnar direction). Subjects had to report which of a presented pair was more convex. It was found that, regardless of whether a static or dynamic haptic exploratory approach was employed, curvature discrimination was based on differences in attitude (or slope) of the stimuli4. In another study, subjects scanned their fingers across Gaussian protrusions varying in height and width5. It was observed that subjects were better at discriminating sharp Gaussian surfaces (large height, small width) from smooth ones (small height, large width).
Another study investigated differences in human perception of curvature when tactile and/or visual feedback were used6. Two concave objects were presented simultaneously, and subjects were asked to state whether the objects were the same or different. During the haptic condition, subjects were instructed to move two fingers across the objects simultaneously. The experimental conditions resulted in the following ranking from highest to lowest accuracy of curvature discrimination: vision only, paired vision and touch, and touch only. However, the object dimensions were large relative to the human fingertip, which was likely an advantage for vision. Vision afforded a global representation of the objects while the smaller “aperture” of the fingertip contact area required scanning of the object and memory7.
1.2 Artificial haptic perception of object shape
Previously, artificial tactile sensors with high spatial resolution have been used to track edges8 and estimate the shapes of letters of the alphabet9, planar polyhedron faces10 and keys11 by creating static tactile images. However, the objects in these studies were relatively flat and large relative to the tactile sensor. Shapes of 3D objects have been identified using a hierarchical approach in which coarse features, such as overall dimension, were first determined via whole-hand enclosure by a robotic hand12. Finer features were then perceived using exploratory procedures such as surface contour following. Tactile and artificial proprioceptive feedback (joint angles, tendon forces) were both used during the modeling process.
Another robotics study was conducted on the characterization of curvature features as a rigid spherical fingertip was scanned over 0.5-1.5 mm diameter wires intended to represent bumps13. Geometric features were defined based on the two principal curvatures and had dimensions comparable to that of the artificial fingertip. Surprisingly, it was observed that algorithms that used tactile sensing performed worse than those that used only proprioceptive data about fingertip location. The spherical, non-deformable nature of the robot fingertip may have limited the ability of the tactile sensor to provide rich information about curvature. The authors hypothesized that the proprioceptive sensors provided less noisy information than the tactile sensors and, therefore, allowed a more accurate estimate of fingertip displacement due to the bumps.
1.3 Haptic perception of finger-sized geometric features
As geometric features of objects such as bumps and pits decrease in size, it becomes increasingly difficult for robotic systems to rely on visual and/or proprioceptive feedback for accurate perception of feature size and shape. The features can be easily occluded by the robotic finger itself. Furthermore, even a small amount of gear lash in a robot serial linkage could add noise to proprioceptive measures of fingertip location that exceed the dimensions and subtle curvature changes of the geometric feature being explored. Thus, for haptic perception of finger-sized geometric features, tactile sensing is particularly useful, especially when the small dimensions of the feature preclude exploration via multiple digits simultaneously. The literature on haptic exploration of small, finger-sized geometric features is scarce. The multimodal BioTac tactile sensor has been used to estimate radius of curvature of finger-sized spherical features via machine learning techniques14 and mathematical models15. Using artificial neural networks14, four discrete classes of radius of curvature were estimated with an accuracy of 94.7%.
Previously, we performed static and dynamic haptic exploratory procedures with a single robot fingertip outfitted with a BioTac sensor. We developed support vector regression models that enabled the perception of edge orientation with respect to a robot fingertip reference frame at discriminatory levels comparable to those of humans16. The objective of the present study was to further develop the haptic intelligence of an artificial hand by exploring geometric features whose dimensions are on the same scale as the human fingertip. It is well established that perception drives action1. In this work, we examine how action drives perception by investigating the efficiency of different haptic exploratory procedures, with an emphasis on efficient processing of tactile data as a function of the exploratory procedure.
Proc. of SPIE Vol. 9116 911605-2
Downloaded From: http://proceedings.spiedigitallibrary.org/ on 06/21/2014 Terms of Use: http://spiedl.org/terms
111-1M/MMIuontact angie, a
a) b)
2. METHODS 2.1 Robot testbed and tactile stimuli
The robot testbed consists of a multimodal tactile sensor (BioTac, SynTouch LLC) mounted to a single digit of a robot hand and arm system (BarrettHand and WAM, Barrett Technology) (Figure 1). The BioTac enables simultaneous measurement of multiple tactile sensing modalities that mimic slow- and fast-adapting mechanoreceptors in the human fingertip17. Per manufacturer specifications, the sensor measures overall internal fluid pressure and electrode impedance (for each of 19 electrodes distributed across the sensor core) at 100 Hz, and vibratory signals at 2200 Hz18. Since we were primarily interested in mechanical stimuli in this study, the temperature measurements were not used. For additional details on the robot testbed, the reader is referred to Ponce Wong, et al16.
Figure 1. The experimental setup in which the Barrett WAM, BarrettHand, and BioTac were used to explore fingertip-sized geometric features. a) The BioTac contact angle α was either 25° or 30°. b) A sample test plate with eight planar bumps is shown. The largest feature has ‘footprint’ dimensions less than twice the width of the BioTac. The global reference frame is shown in red.
We hypothesized that properties of small geometric features, including order of curvature and footprint dimension, could be extracted from the tactile signals alone. Three different 3D printed test objects, each of which had a face with bumps (protrusion in the (+) z-direction) and an opposing face with pits (depression in the (–) z-direction), were used (Figure 2). The face of each test object contained eight distinct features with a specific order of curvature: planar (0th order), conical (1st order), and spherical (2nd order). Length for planar features and diameter for conical and spherical features were 1.25, 2.5, 3.75, 5, 7.5, 10, 15, and 20 mm. The five largest features had a constant height or depth of 2.5 mm. The three smallest features had heights or depths equal to half their footprint dimension. Note that in order to maintain consistent heights across features having different orders of curvature, the equators of the spherical features were not at z = 0, the datum of the test plate (Figure 1b). The tactile stimulus was rigidly attached on top of a 6-degree-of-freedom load cell (ATI Industrial Automation, Nano-17, Figure 1a). The plates (Figure 2) were designed such that x- and y-axis spacing between features would allow for haptic exploration of a single feature with one haptic exploratory movement.
Proc. of SPIE Vol. 9116 911605-3
Downloaded From: http://proceedings.spiedigitallibrary.org/ on 06/21/2014 Terms of Use: http://spiedl.org/terms
Planar
Bumps
Conical Spherical
Pits
MillPlanar Conical Spherical
or.er (Drier ore er
a)
ors er orer ors er
b)
Figure 2. Test plates containing small geometric features with varying orders of curvature and size. A total of three plates were used, each of which contains a) bumps on one face and b) pits on the opposing face. Each plate had features with eight different footprint dimensions: 1.25, 2.5, 3.75, 5, 7.5, 10, 15, and 20 mm.
2.2 Haptic exploratory procedures
We implemented similar exploratory procedures to those introduced in our study on perception of edge orientation16. Namely, static contact (EP #1), distal-proximal stroke along the y-axis (EP #2), and radial-ulnar stroke along the x-axis (EP #3) were used. Note that the numbering scheme for the EPs in the present study was selected for clarity and is slightly different from that used in our prior study on perception of edge orientation16. An additional EP was implemented in which the finger was rotated about its longitudinal axis in order to roll back and forth over the geometric feature (EP #4). EP #4 was designed to approximate wrist supination and pronation, although actual implementation of the motion was more complex because the longitudinal axis of the BioTac sensor was not aligned with the wrist axis. The four EPs are shown in the supplementary video accompanying this work. Screenshots of the different EPs are shown in Figure 3, in which movements are indicated by red arrows. A fixed global reference frame was defined with its origin at the (x, y) center of the plane and z = 0 such that the x-y plane was coincident with the flat open area of the plate (Figure 1b). The x-axis was defined as the direction for the radial-ulnar stroke; the y-axis was defined as the direction for the distal-proximal stroke.
For EP #1, the fingertip approached the feature directly from above along the z-axis, pressed statically against the feature for 1.5 seconds, and moved away along the z-axis to release contact (Figure 3a). EP #2 consisted of the fingertip being aligned to the center of the feature along the y-axis at a location distal to the feature (Figure 3b). The fingertip approached the test plate until a predefined z-position had been reached, making contact with the plate’s surface. The fingertip would then move along the negative y-direction, stroking along the whole length of the feature until it returned back to the plate’s bare surface. Similarly, for EP #3 the fingertip was aligned along the x-axis at a location radial to the center of the feature (Figure 3c). The sensor first made contact with the plate’s surface and then stroked along the positive x-direction until the entire feature had been explored. For EP #4, the fingertip approached the feature directly from above along the z-axis (Figure 3d). Wrist supination of 45° took place while the fingertip’s x- and y-positions remained centered on the feature. Wrist pronation returned the fingertip to its original orientation, and the fingertip was moved away along the z-axis to release contact.
Proc. of SPIE Vol. 9116 911605-4
Downloaded From: http://proceedings.spiedigitallibrary.org/ on 06/21/2014 Terms of Use: http://spiedl.org/terms
a)
c) d)
Figure 3, Video 1. Haptic exploratory procedures. a) EP #1: static contact, b) EP #2: distal-proximal linear stroke along the y-axis, c) EP #3: radial-ulnar linear stroke along the x-axis, and d) EP #4: roll of the fingertip about its longitudinal axis. Fingertip movements are indicated by the red arrows. Note that x-, y-, and z-axis directions are accurately shown, but the origin of the global reference frame has been displaced for visualization purposes. http://dx.doi.org/10.1117/12.2058238.1
The contact angle α was defined as the orientation of the BioTac’s longitudinal axis with respect to the horizontal x-y plane (Figure 1a). A contact angle of 25° was chosen in order to maximize the contact area between the BioTac’s deformable skin and the tactile stimulus while simultaneously avoiding undesirable contact of the BarrettHand with the test plate for EP #1, EP #2, and EP #3. A contact angle of 30° was used for EP #4. Inspired by previous human studies19 and given the small dimensions of the geometric features, scanning speed was 1 cm/s for linear stroking motions. Thus, the fingertip trajectory velocity for EP #2 was vy = -1 cm/s while that for EP #3 was vx = +1 cm/s. For all four exploratory procedures, the commanded height for the fingertip was z = -5.5 mm such that contact was consistently made with the bottom surface of large pits without the fingertip getting stuck on large bumps.
Features were explored in experimental blocks according to the following test plate order: planar pits, planar bumps, spherical pits, spherical bumps, conical pits, and conical bumps. Features within each test plate were explored in a random order to minimize systematic variations, such as wear of the tactile sensor skin. A total of 20 replicate trials were collected per feature within each experimental block. The BioTac skin was constantly monitored to ensure that the fingerprints had not worn out. The skin was replaced once due to noticeable wear of the tactile ridges.
2.3 Processing of tactile signals
For haptic perception of the local shape of small geometric features (bumps or pits), it was important to extract tactile signals that related directly to the geometric features themselves as opposed to incidental contact with the test plate during haptic exploration. Similar to our prior study on perception of edge orientation16, the 19 impedance electrodes of the BioTac were clustered based on their spatial location on the core of the sensor. Namely, six distal-proximal clusters of electrodes associated with anatomical regions of the fingertip were used (inset of Figure 5).
2.3.1 Identifying initial contact and loss of contact with a geometric feature
For each trial, initial contact and loss of contact with the test plate were determined as the time points at which the sensor’s overall fluid pressure first exceeded and last fell below a threshold of 0.2% from baseline (non-contact state), respectively. For EP #2 and #3, in particular, it was necessary to further differentiate tactile data associated with the geometric features of interest from data recorded during incidental contact with the test plate during stroking movements. For EP #2, initial contact with the feature was defined as the time point at which electrode Cluster 1 (the most distal cluster at the fingertip, inset of Figure 5) changed after its initial rise and plateau (Figure 5). The sharp rise in this impedance signal occurred in all trials since the fingertip always contacted the plate’s surface first. Once the desired commanded height of the fingertip had been achieved, the impedance signal remained stable, even as the fingertip was
Proc. of SPIE Vol. 9116 911605-5
Downloaded From: http://proceedings.spiedigitallibrary.org/ on 06/21/2014 Terms of Use: http://spiedl.org/terms
stroked across the open, flat surface of the plate, until initial contact with a geometric feature was made. For EP #3, initial contact with the feature was defined as the time point at which electrode Cluster 2 (the ulnar cluster on the distal aspect of the fingertip, inset of Figure 5) exceeded an impedance threshold of 1 kΩ. The rise in this impedance signal occurred in all trials since the fingertip was stroked in a radial to ulnar manner. For both EP #2 and #3, loss of contact with the feature was defined as the time point at which electrode Clusters 1-3 (the most distal clusters, inset of Figure 5) stabilized for the remainder of each trial. This stabilization of impedance signals signified that the fingertip had completely traversed the geometric feature of interest and was simply stroking along the plate’s flat, open surface.
For EP #4, the Barrett WAM proprioception data (joint angles) were used to estimate the angle of roll of the finger about its longitudinal axis. To ensure that only data from the rolling motion were provided to the supervised learning models, a rotation threshold of 10° of supination was used to define the start and end time points of rolling contact with the feature. Brief periods of static contact with the feature at the start and end of the entire trial were not used, as they were not representative of tactile data generated during roll of the finger.
2.3.2 Establishing windows of interest within the feature contact period
As in our prior edge orientation study16, the contact period was subdivided into smaller windows of time in order to capture spatiotemporal trends in the tactile signals at different phases of each exploratory procedure (Figure 5 and Figure 6, Table 1). Windows were labeled according to the following format: a “W”, the number of the EP, a period, and the number of the window for that EP. “Window 1.1” (W1.1) was defined as the middle 30% of contact for EP #1. For EP #2 and EP#3, the contact period with the geometric feature was split into two equal windows of time (W2.1 and W2.2 for EP #2, W3.1 and W3.2 for EP #3). Since EP #4 consisted of a symmetric rotation about the longitudinal axis of the fingertip, the contact period was also split into two equal windows (W4.1 and W4.2). For each of these windows, mean overall pressure values were used as inputs to the supervised learning models. In addition, mean rates of change in overall pressure were calculated for the first 25% of windows W2.1, W3.1, and W4.1 associated with EPs #2-4 in which the fingertip was stroked across or rolled over the geometric feature.
Sensor skin deformation was captured by changes in electrode impedance values. Clusters of electrodes along the BioTac’s distal-proximal axis (inset of Figure 5) were used in order to minimize the number of model input parameters and computational expense. For windows associated with slow tactile signals (W1.1, W2.1-W2.2, W3.1-W3.2, W4.1-W4.2, Figure 5 and Figure 6), mean electrode impedance values for each cluster were provided to the model. Mean rates of change in electrode impedance for each cluster for the first 25% of windows W2.1, W3.1, and W4.1 were also provided.
The contact dynamics at initial contact and loss of contact with the feature were captured by the fluid vibration data. For EP #2, W2.3 and W2.4 were defined as the first 250 ms of W2.1 and final 250 ms of W2.2, respectively. For EP #3, W3.3 and W3.4 were defined as the first 250 ms of W3.1 and final 250 ms of W3.2, respectively. Similarly, for EP #4, W4.3 and W4.4 were defined as the first 250 ms of W4.1 and final 250 ms of W4.2, respectively. For features so small that windows applied to slow tactile signals (W1.1, W2.1-W2.2, W3.1-W3.2, and W4.1-W4.2) were shorter than 250 ms, the entire window of data was used to extract the model inputs. The Hilbert-Huang Transform was used to determine the mean instantaneous frequency of the first intrinsic mode function (IMF) for use as model inputs.
Proc. of SPIE Vol. 9116 911605-6
Downloaded From: http://proceedings.spiedigitallibrary.org/ on 06/21/2014 Terms of Use: http://spiedl.org/terms
SVR model to estimate
i7 footprint dimension of a
Extract 3 -class SVC model
planar (U ' oraer) Teature
SVR model to estimateexploratoryproceduremruipl innuts
to estimate » footprint dimension of aorder of curvature conical (1st order) feature
Select ari irvafi iro_cnarifir
SVR model to estimatefnnfinrinf rlimancinn of a
SVR model to estimate I spherical (2nd order) featurefootprint dimension
Table 1. Support vector classifier (SVC) and support vector regression (SVR) model input parameters for haptic exploration of small geometric features
Type of info Input to SVR model
EP #1 (static contact)
EP #2 (distal-proximal
stroke)
EP #3 (radial-ulnar
stroke)
EP #4 (finger roll)
Slow tactile signals
Overall fluid pressure
(1) W1.1
(2) W2.1, W2.2
(2) W3.1, W3.2
(2) W4.1, W4.2
Initial rates of change of overall fluid pressure
--- (1)
W2.1 (1)
W3.1 (1)
W4.1
Electrode impedance
(6) W1.1 for
Clusters 1-6
(12) W2.1, W2.2 for
Clusters 1-6
(12) W3.1, W3.2 for
Clusters 1-6
(12) W4.1, W4.2 for
Clusters 1-6 Initial rates of change of electrode impedance
--- (6)
W2.1 for Clusters 1-6
(6) W3.1 for
Clusters 1-6
(6) W4.1 for
Clusters 1-6 Fast tactile signals
Instant. freq. (of 1st IMF) of vibrations --- (2)
W2.3, W2.4 (2)
W3.3, W3.4 (2)
W4.3, W4.4 Note: Parenthetical values in red indicate the number of inputs for each type of parameter.
2.3.3 Supervised learning models
The small geometric features used in this study (Figure 2) have various properties that could be estimated via models. For instance, each feature could be simply identified as either a bump or a pit. The feature’s order of curvature could be estimated as one of three classes (i.e. 0th, 1st, and 2nd order), which differentiate the feature’s shape as planar, conical, or spherical. In addition, the “footprint” (x-y plane) dimension could be estimated. The specific height or depth (z-dimension) of the feature was not estimated in this work, but could be incorporated into future modeling efforts.
Perception of order of curvature and footprint dimension was performed according to the flow diagram shown in Figure 4. A 3-class support vector classifier (SVC) was first used to identify one of three discrete classes of order of curvature: planar, conical, and spherical. Based on the perceived order of curvature, one of three curvature-specific support vector regression (SVR) models was then used to estimate the feature’s footprint dimension from a continuous number line. The SVC and SVR models were applied in series to the same set of model inputs. That is, in practice, only a single replicate of an exploratory procedure would be necessary to perceive both order of curvature and feature size.
Each SVR model was trained using tactile model inputs specific to its corresponding order of curvature. Although only eight distinct footprint dimensions were tested due to practical reasons, regression models enable estimation along a continuous number line. We used the sign of the footprint dimension to embed information about whether the feature was a bump or a pit. A positive sign was used to indicate that the feature was a bump, while a negative sign was used to indicate that the feature was a pit.
Figure 4. Flow diagram to determine a geometric feature’s order of curvature and footprint dimension using a single set of model inputs. First, an SVC model estimates the order of curvature, and then a curvature-specific SVR model estimates footprint dimension.
When building the models, the complexity term was set to 1. Two types of polynomial kernels were used: a linear kernel and a quadratic kernel. The performance of each model was assessed using a novel test data set that was not used during
Proc. of SPIE Vol. 9116 911605-7
Downloaded From: http://proceedings.spiedigitallibrary.org/ on 06/21/2014 Terms of Use: http://spiedl.org/terms
training of the model. WEKA was used to create models using up to 76 input parameters (Table 1). Although WAM proprioception data were used to determine the initial contact and loss of contact with each feature, no proprioceptive data were provided as model inputs. Furthermore, no information about the exploratory procedure (EP # or fingertip scanning speed) was provided to the models.
In order to minimize time spent on reconfiguring the experimental set-up, trials were blocked by test plate surface. Each of the six test plate surfaces contained one of three orders of curvature (0th, 1st, 2nd) and one of two types of features (bump or pit). We collected 20 trials of tactile data for each of the eight features having different footprint dimensions. For each of the six experimental blocks, the tactile data were randomly split into a training set (90% of total trials, or 144 trials) and into a testing set (10% of total trials, or 16 trials). The SVC was trained and tested using data pooled from all six block conditions (i.e., 864 training trials, 96 testing trials). Each curvature-specific SVR model was trained and tested with the appropriate subset of the data (i.e., 288 training trials, 32 testing trials) comprised of two block conditions (bumps and pits) for each order of curvature case.
3. RESULTS 3.1 Tactile data
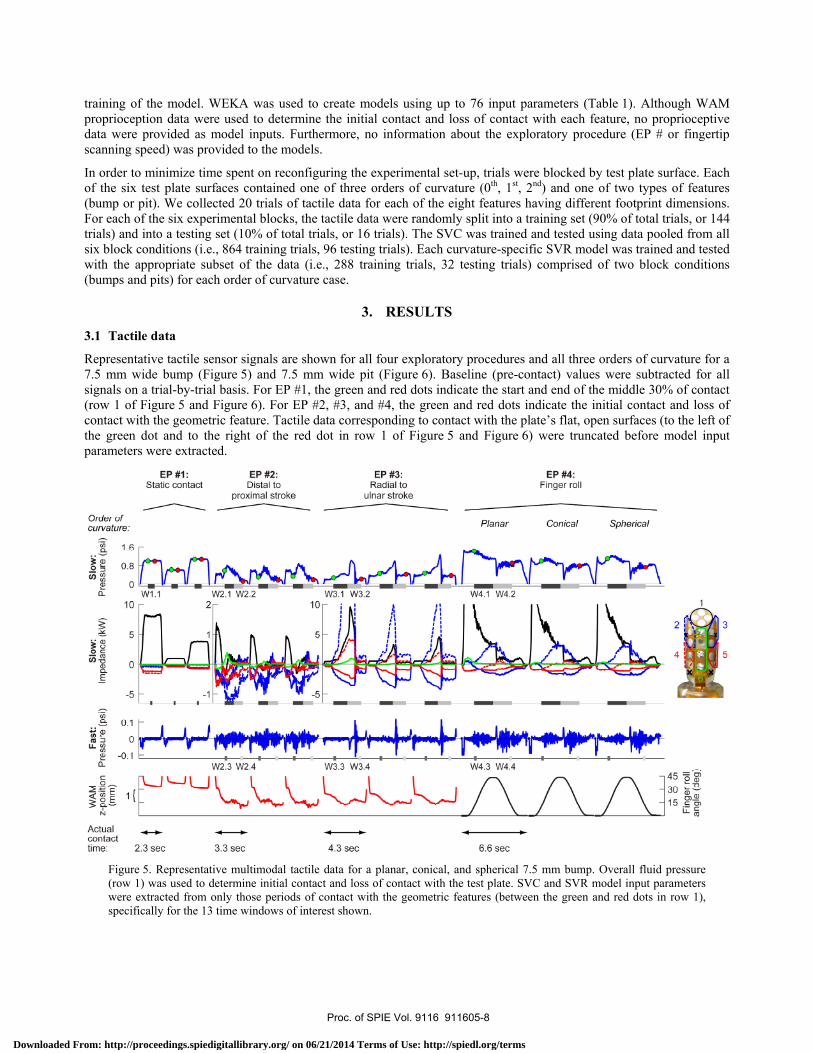
Representative tactile sensor signals are shown for all four exploratory procedures and all three orders of curvature for a 7.5 mm wide bump (Figure 5) and 7.5 mm wide pit (Figure 6). Baseline (pre-contact) values were subtracted for all signals on a trial-by-trial basis. For EP #1, the green and red dots indicate the start and end of the middle 30% of contact (row 1 of Figure 5 and Figure 6). For EP #2, #3, and #4, the green and red dots indicate the initial contact and loss of contact with the geometric feature. Tactile data corresponding to contact with the plate’s flat, open surfaces (to the left of the green dot and to the right of the red dot in row 1 of Figure 5 and Figure 6) were truncated before model input parameters were extracted.
Figure 5. Representative multimodal tactile data for a planar, conical, and spherical 7.5 mm bump. Overall fluid pressure (row 1) was used to determine initial contact and loss of contact with the test plate. SVC and SVR model input parameters were extracted from only those periods of contact with the geometric features (between the green and red dots in row 1), specifically for the 13 time windows of interest shown.
Proc. of SPIE Vol. 9116 911605-8
Downloaded From: http://proceedings.spiedigitallibrary.org/ on 06/21/2014 Terms of Use: http://spiedl.org/terms
time: 2.0 sec 3.4 sec 4.4 sec 6.4 sec
Figure 6. Representative multimodal tactile data for a planar, conical, and spherical 7.5 mm pit. Overall fluid pressure (row 1) was used to determine initial contact and loss of contact with the test plate. SVC and SVR model input parameters were extracted from only those periods of contact with the geometric features (between the green and red dots in row 1), specifically for the 13 time windows of interest shown.
Overall fluid pressure increased as the fingertip made contact with the bumps (row 1, Figure 5), but decreased slightly for pits (row 1, Figure 6). The stroking exploratory procedures (EP #2, #3) yielded increases in the pressure signal as the fingertip traversed the bumps. As expected, the direction of the fingertip trajectory directly affected the trends in the tactile data. The distal-proximal strokes of EP #2 yielded similar pressure magnitudes with slightly different downward slopes for each order of curvature. The radial-ulnar strokes of EP #3 yielded different magnitudes and trends for each order of curvature. The finger roll for all orders of curvature yielded similar trends for W4.1. Fluid pressure dropped sharply at the beginning of W4.2 when the finger started to roll back to its original 0° orientation.
The electrode impedance data (row 2, Figure 5 and Figure 6) provide information about skin deformation. While an increase in impedance corresponds to skin compression towards the core, a decrease in impedance indicates decompression or bulging of the skin away from the core. The static contact of EP #1 produced different magnitudes of skin deformation for the different orders of curvature. The linear strokes of EP #2 and #3 produced different electrode impedance values based on the order of curvature. For finger roll (EP #4), as the finger supinated about its longitudinal axis, the ulnar side of the fingertip experienced skin compression, and the radial side experienced bulging (row 2, Figure 5 and Figure 6), but electrode impedance values were not generally affected by order of curvature. The distal cluster of electrodes (Cluster 1) exhibited the most change due to order of curvature (row 2, Figure 5 and Figure 6). The vibration signals (row 3, Figure 5 and Figure 6) were not noticeably affected by order of curvature or footprint dimension (not shown) for bumps or pits.
3.2 SVC and SVR model performance
An SVC model using all 76 inputs took less than 1 sec. to be trained and built on a PC with an Intel Core i7-4500U 1.8 GHz processor. Each curvature-specific SVR model took 2 sec. to be trained for linear kernels and 9-11 sec. for quadratic kernels. Table 2 summarizes the performance of the SVC and three curvature-specific SVR models (Figure 4). When all 76 inputs (EPs #1-4 combined) were provided to the SVC model, both linear- and quadratic-kernel models
Proc. of SPIE Vol. 9116 911605-9
Downloaded From: http://proceedings.spiedigitallibrary.org/ on 06/21/2014 Terms of Use: http://spiedl.org/terms
performed well and resulted in zero misclassifications of order of curvature. The regression models for footprint dimension yielded R2 values greater than 0.98 and RMS errors smaller than 1.2 mm.
SVC and SVR models were also created using model inputs extracted from a single EP only. The performance of the single-EP models were compared to the all-EP models, and the most useful EP for estimating footprint dimension was identified for each order of curvature. As expected, the single-EP models performed slightly worse than the all-EP models because less information was provided to the models. Nonetheless, the single-EP models performed well enough that the use of a single exploratory procedure would be practical for perceiving the size and shape of small bumps and pits.
EP #2 (distal-proximal stroke) provided the most useful model inputs for perception of order of curvature for a linear-kernel SVC model (red highlights in Table 2, Figure 7a). Only three trials were misclassified when using a linear kernel, and only two were misclassified when using a quadratic kernel (Table 2). These misclassifications consisted of spherical features being perceived as conical features, which is not surprising given the similarity in the EP #3 tactile data for the conical and spherical features (Figure 5 and Figure 6). More specifically, a single trial of each, the 7.5 mm spherical bump, 7.5 mm spherical pit, and 5 mm spherical pit were misclassified by the SVC when using a linear kernel. The use of a quadratic kernel eliminated the misclassification of the single 5 mm spherical pit sample.
For estimation of footprint dimension, it was found that the most useful EP depended on the order of curvature of the feature (red highlights in Table 2). EP #3 (radial-ulnar stroke) was the most useful EP for a linear-kernel SVR model for planar features. EP #4 (finger roll) was the most useful EP for separate linear-kernel SVR models for conical and spherical features. Again, the use of a quadratic kernel improved SVR model performance, but the linear-kernel models were sufficient (Table 2). The accuracy of the SVR models is shown (in Figure 7b) for linear-kernel models that were only provided model inputs from the most useful EP for the specific order of curvature (EP #3 for planar features, EP #4 for conical and spherical features).
Table 2. Performance of SVC and SVR models for estimating order of curvature and footprint dimension, respectively.
Note: Values in red indicate performance of the most accurate linear-kernel models.
Proc. of SPIE Vol. 9116 911605-10
Downloaded From: http://proceedings.spiedigitallibrary.org/ on 06/21/2014 Terms of Use: http://spiedl.org/terms
EP #1 only EP #2 only
flth rlthI1 E 20 Estimated = 0.964*True - 0.481
_ _ QFO/ (`nnfirlonro Rni indo1st o(7 4 n
VV /V VVI1114VIIVV UV4114JPlanarConical
n
pnericai
UHL1st J stI J 0.2
W
E2nd 2nd
Oth 1 st 2nd 0th 1 st 2nd0
-LUW Pits Bumps
-20 -10 0 10 20Estimated order of curvature True footprint dimension (mm)
a) b)
Figure 7. Performance of SVC and SVR models for estimating order of curvature and footprint dimension, respectively. a) Confusion probability matrices revealed that EP #2 (distal-proximal stroke, highlighted in red) was the most useful EP when developing a single-EP, linear-kernel SVC model for order of curvature. b) Estimations of footprint dimension from the three independent SVR models using a linear kernel were plotted simultaneously (rows shown in red in Table 2). Blue, red, and green data points correspond to planar, conical, and spherical features, respectively. Data points marked with an ‘x’ had misclassified orders of curvature.
4. DISCUSSION 4.1 SVC estimation of order of curvature
We trained 3-class SVC models using tactile data from haptic interactions with features that varied in order of curvature (planar, conical, or spherical) and footprint dimensions (eight discrete feature widths). Given the good model performance achieved with simple linear kernels, the discussion is focused on the results from linear-kernel SVC and SVR models. The most accurate linear-kernel classifiers of curvature were obtained when training the models with inputs from the stroking exploratory procedures, especially the distal-proximal stroke EP #2 (Table 2, and Figure 7a). Our results suggest that fingertip motion across features provides more information about curvature than keeping the fingertip in a fixed location. While the two stroking exploratory procedures resulted in misclassifications only between conical and spherical features, static contact and finger roll led to errors between all three orders of curvature (Figure 7a). It should be noted that, for the purposes of reducing model complexity, spatial resolution of the skin deformation data was purposely reduced by creating clusters of electrodes. It may be possible that static contact could have performed better if all individual electrode impedance values had been provided to the model.
Tactile data obtained from stroking motions were most noticeably affected by order of curvature (Figure 5 and Figure 6). For instance, with EP #2, electrode impedance magnitudes (whether (+) for compression of the skin or (-) for bulging of the skin) for Clusters 1 and 6, along the long axis of the finger, were larger for planar bumps (Figure 5). Cluster 2 on the ulnar side of the finger seemed to be helpful for distinguishing between conical and spherical bumps. Lower accuracies in estimates of curvature using EP #3 as compared to EP #2 could be due to the nature of the robot testbed, as discussed in Section 4.4. Regardless of the feature being explored, a large amount of skin bulging could mask subtle changes in skin deformation associated with order of curvature (see EP #3, Cluster 1, conical and spherical). Tactile signals obtained from finger roll were very similar to one another, likely resulting in models with the least accurate estimations of order of curvature. In the case of static contact, differences in tactile data due to differences in curvature became confounded by simultaneous changes in footprint dimension.
Proc. of SPIE Vol. 9116 911605-11
Downloaded From: http://proceedings.spiedigitallibrary.org/ on 06/21/2014 Terms of Use: http://spiedl.org/terms
4.2 SVR estimation of footprint dimension
Estimation accuracy for footprint dimension (Table 2, Figure 7b) could be attributed to, among other factors, the use of curvature-specific SVR models. For instance, if a sample were classified as planar, the sample would be sent to the SVR model specifically for estimating footprint dimensions of planar features. Since acceptable curvature-specific models could be developed using inputs from a single exploratory procedure and a linear kernel function, computation time during online tasks should not be an issue. In addition to the models presented here, we developed models that simultaneously estimate curvature and footprint dimension20. However, the curvature-specific models performed better and are the focus of this paper.
Not surprisingly, the largest estimation errors in footprint dimension occurred when samples were misclassified in the first step (Figure 4, see “x” markers in Figure 7b). The percent relative error for the footprint dimension estimations was largest for features with the smallest footprint dimensions and for those trials whose order of curvature were misclassified. The residuals were no larger than 5.8 mm for the trials whose order of curvature was correctly classified. The overall SVR estimation accuracy can be observed by the near one-to-one relationship between the true and estimated footprint dimensions and the tight 95% confidence bounds (Figure 7b).
4.3 Effects of the exploratory procedure
Figure 5 and Figure 6 illustrate how each exploratory procedure affects the trends in the tactile data and, subsequently, the performance of the supervised learning models. EP #1 consists of the fingertip moving to a predefined z-position to apply a static force on the feature for a prescribed duration. The slow-adapting overall fluid pressure and electrode impedance signals were affected by the amount of contact area with the feature. The stroking exploratory procedures resulted in wider ranges of tactile signals. The compliance of the BarrettHand combined with the shape of the deformable BioTac skin, allowed much smoother movements along the distal-proximal, y-axis. Due to the kinematics of the BarrettHand finger, the BioTac did not get temporarily stuck against bumps or within pits for distal-proximal EP #2 as much as with radial-ulnar EP #3. The increased resistance that the fingertip had to overcome during the radial-ulnar EP #3 did not allow a smooth exploration of the feature, resulting in errors when discriminating between conical and spherical features.
The distal-proximal stroke (EP #2) was most efficient for estimating the order of curvature of a feature (red SVC results in Table 2 and Figure 7a). Given that this exploratory procedure moved the fingertip across each feature with the least amount of resistance, the order of curvature might be more easily encoded in the BioTac signals compared to the other exploratory procedures. The radial-ulnar stroke (EP #3) performed the second best with an accuracy of 83/96 (86%), with all misclassifications occurring between conical and spherical features. The static contact (EP #1) and finger roll (EP #4) exploratory procedures performed the worst with classification accuracies lower than 78%. Exploratory procedures involving stroking motions seemed better suited for estimation of order of curvature, although the distal-proximal stroke (EP #2) performed slightly better than the radial-ulnar stroke (EP #3).
While footprint dimensions of planar features were better estimated using a radial-ulnar stroke (EP #3), the footprint dimensions of conical and spherical features were more accurately estimated with finger roll (EP #4). The radial-ulnar stroke may have been most informative for planar features because planar bumps produced the most resistance to fingertip motion and resulted in skin deformation trends that were distinct from those for conical and spherical features (Figure 5). On the other hand, planar pits produced the least resistance to fingertip movement out of all types of features, but still yielded useful skin deformation trends for planar pits. The amplitude and duration of these step-like changes in electrode impedance apparently encoded footprint dimension of planar features well. The finding that finger roll was the most helpful for estimating footprint dimension for both conical and spherical features (Table 2) makes sense considering that the order of curvature of conical and spherical features might be perceived similarly at such small scales.
Our results highlight the importance of considering the information content of different exploratory procedures when characterizing small geometric features by touch alone. The single most useful EP always involved motion of the fingertip, regardless of whether order of curvature or footprint dimension was being estimated. That is, static contact alone was not sufficient for encoding such properties. In terms of the usefulness of each exploratory procedure, the SVR model for planar features performed best with model inputs from EP #3 (radial-ulnar stroke). The SVR model for conical features performed best with model inputs from EP #4 (finger roll). The SVR model for spherical features, performed the worst with EP #2 (distal-proximal stroke) and the best with EP #4 (finger roll).
Proc. of SPIE Vol. 9116 911605-12
Downloaded From: http://proceedings.spiedigitallibrary.org/ on 06/21/2014 Terms of Use: http://spiedl.org/terms
The effects of compliance in the robot testbed on the implementation of the different exploratory procedures should also be considered. The BarrettHand exhibits more compliance for movements along the y-axis (i.e., radial-ulnar stroke or EP #3) than movements along the x-axis (i.e., distal-proximal stroke or EP #2). Thus, EP #3 movements were not as smooth as those of EP #2 when exploring the larger geometric features. This difference in compliance based on movement direction could explain why some EPs were more useful than others for different features.
4.4 Robot testbed proprioception data
Barrett WAM proprioception data on 3D fingertip position and orientation were recorded in the form of Cartesian positions and quaternion vectors. While the quaternion vectors provided clean signals for finger roll, the z-position data were relatively noisy at the millimeter scale relevant to the geometric features (row 4, Figure 5 and Figure 6). No clear trends were observed in the fingertip position data that could have provided information about footprint dimension or height/depth (z-dimension) of the features. That is, Cartesian position changes at small scales (tallest bumps were 2.5 mm high, and deepest pits were 2.5 mm deep) could not be precisely detected by the WAM, whose z-position resolution appeared to be on the order of 2.5 mm.
The imprecision in proprioception data at the millimeter scale could be due to a number of factors. First, the fingertip sensor was deformable and small features sensed by the BioTac skin might not cause noticeable changes in WAM end-effector position. Second, there is small, but nonzero, lash in the BarrettHand fingers and WAM wrist that is noticeable in distal-proximal strokes (EP #2) and radial-ulnar strokes (EP #3), respectively. An interesting finding was that the kinematics and compliance of the actor (robot) itself could affect the implementation of exploratory procedures and, subsequently, the nature of the tactile data obtained via those exploratory procedures. Despite practical limitations in the robot testbed, SVR models could be successfully trained to perform well for this task of characterizing small geometric features. Our results suggest that tactile sensing is better suited for haptic exploration of small geometric features, especially when the robot testbed features deformable fingertips and limited precision at scales on the same order as the features of interest.
4.5 Generalizability of proposed approach to unstructured conditions
A main assumption in this study was that the 3D location and orientation of each feature with respect to the fingertip were known a priori. That is, the location of each feature on the test plate, whose global reference frame was aligned to the robot reference frame, was used to define the fingertip motion trajectories. In real world situations with unstructured environments, the location of features would not be known a priori and would need to be estimated using visual feedback or by performing a raster-like scanning for patterns21. Regardless of whether visual feedback was used initially, the fact remains that finger-sized features would be occluded during touch and that real-time visual feedback would be rendered useless at some point. The algorithms presented in this study could then be applied once a crude estimate of the position and orientation of the feature had been determined, and could even be used to update estimates of feature location and orientation with each new haptic experience.
5. SUMMARY The important process of relating known voluntary actions to perception of tactile stimuli can happen at two different levels: (i) selection of an exploratory procedure based on its efficiency and accuracy for estimating specific properties, and (ii) processing of signals specific to the exploratory procedure that generated them. Such approaches are used in biological systems all the time in the form of trial and error, model-building based on experience, and learning over one’s lifetime about which actions to take, which afferent feedback streams to pay attention to, and how those signals should be processed.
This study provides insights as to which of the different bio-inspired exploratory procedures efficiently yield the most accurate and informative tactile and proprioceptive data for haptic perception of small, finger-sized geometric features. As in our edge orientation study16, the use of a deformable, bladder-type sensor seems well-suited for advancing the haptic intelligence of robotic systems. Rigid, planar sensors might not be able to determine the curvature of small bumps or pits, for example. The top surface of conical or spherical features would appear as point-like indentations on a rigid, planar sensor. With bladder-type sensors, however, physical interactions with small geometric features would be encoded in skin deformation over the entire fingertip, and not just at small areas of direct contact.
Proc. of SPIE Vol. 9116 911605-13
Downloaded From: http://proceedings.spiedigitallibrary.org/ on 06/21/2014 Terms of Use: http://spiedl.org/terms
Future work includes the development of an approach that uses the entire time history of tactile data during an exploratory movement rather than only key time points, as implemented in a tactile sensor used for reading Braille22. In addition, an analytical solution for footprint dimension could be developed using some of the input parameters fed into the supervised learning models. In this study, contact time was normalized by splitting the tactile data into separate windows. However, actual contact duration in seconds, coupled with the known stroking speed, could potentially be used as model inputs to for estimating footprint dimension. One potential challenge is that models could get confused by irrelevant tactile data from contact with an object that is not related to the geometric feature of interest.
For implementation in robotics, learning and adaptation approaches are becoming increasingly popular. As such, algorithms such as Bayesian learning23 and reinforcement learning24 could be implemented to enhance the presented work. In addition, a wider range of features could be explored to develop more generalizable models. The features used in this study were all symmetric and their heights were constrained to no greater than 2.5 mm. Features with more complex 3D shapes such as elliptical bumps or trapezoidal pits could be explored to develop more general methods. Furthermore, estimates of height or depth could be used in conjunction with estimates of order of curvature and footprint dimension in order to calculate interior angle of conical features or radius of curvature of spherical features.
Haptic perception abilities that we take for granted (e.g., finding a USB port, power button, or screw hole without looking) remain grand challenges for artificial hands. Understanding the geometric properties of small features would be useful when vision is obstructed (such as when lighting is not appropriate or when the finger itself blocks the line of sight) and when proprioceptive feedback is inadequate for the perception task. The ability to haptically perceive local shape information could be used to provide haptic feedback to a robot operator, a sense of touch to an amputee, or tactile feedback for semi-autonomous grasp and manipulation control algorithms for teleoperated robots, ranging from wheelchair-mounted robot arms in the home to bomb defusal robots in the field.
ACKNOWLEDGEMENTS
The authors wish to thank Ismael Reveles for assistance with data collection. This work was supported in part by the National Science Foundation under Grants #0932389, #0954254, and #1208519, and the Arizona State University Graduate College.
REFERENCES
[1] Lederman, S. J.., Klatzky, R. L., “Hand Movements: A Window Into Haptic Object Recognition,” Cogn Psychol 19(3), 342–368 (1987).
[2] Johansson, R. S.., Vallbo, A. B., “Tactile sensory coding in the glabrous skin of the human hand,” Trends in NeuroSciences 6, 27–32 (1983).
[3] Plaisier, M. A., Bergmann Tiest, W. M.., Kappers, A. M. L., “Salient Features in 3-D Haptic Shape Perception,” Attention, Perception, & Psychophysics 71(2), 421–430 (2009).
[4] Pont, S. C., Kappers, A. M.., Koenderink, J. J., “Similar mechanisms underlie curvature comparison by static and dynamic touch,” Perception & Psychophysics 61(5), 874–894 (1999).
[5] Louw, S., Kappers, A. M.., Koenderink, J. J., “Haptic discrimination of stimuli varying in amplitude and width,” Experimental brain research 146(1), 32–37 (2002).
[6] Ittyerah, M.., Marks, L. E., “Intramodal and cross-modal discrimination of curvature: Haptic touch versus vision,” Curr Psychol Lett 24(1), 1–11 (2008).
[7] Millar, S., Understanding and Representing Space: Theory and Evidence from Studies With Blind and Sighted Children, Oxford University Press (1994).
[8] Berger, A. D.., Khosla, P. K., “Using Tactile Data for Real-Time Feedback,” The International Journal of Robotics Research 10(2), 88–102 (1991).
[9] Lee, H.-K., Chang, S.-I.., Yoon, E., “A Flexible Polymer Tactile Sensor: Fabrication and Modular Expandability for Large Area Deployment,” J. Microelectromech. Syst. 15(6), 1681–1686 (2006).
[10] Petriu, E. M., McMath, W. S., Yeung, S. S. K.., Trif, N., “Active Tactile Perception of Object Surface Geometric Profiles,” IEEE Transactions on Instrumentation and Measurement 41(1), 87 –92 (1992).
Proc. of SPIE Vol. 9116 911605-14
Downloaded From: http://proceedings.spiedigitallibrary.org/ on 06/21/2014 Terms of Use: http://spiedl.org/terms
[11] Mei, T., Li, W. J., Ge, Y., Chen, Y., Ni, L.., Chan, M. H., “An Integrated MEMS Three-Dimensional Tactile Sensor with Large Force Range,” Sensors & Actuators: A. Physical 80(2), 155–162 (2000).
[12] Allen, P. K.., Michelman, P., “Acquisition and interpretation of 3-D sensor data from touch,” IEEE Transactions on Robotics and Automation 6(4), 397 –404 (1990).
[13] Okamura, A. M.., Cutkosky, M. R., “Feature detection for haptic exploration with robotic fingers,” The International Journal of Robotics Research 20(12), 925–938 (2001).
[14] Wettels, N.., Loeb, G. E., “Haptic feature extraction from a biomimetic tactile sensor: Force, contact location and curvature,” 2011 IEEE International Conference on Robotics and Biomimetics (ROBIO), 2471 –2478, Phuket, Thailand (2011).
[15] Su, Z., Li, Y.., Loeb, G. E., “Estimation of Curvature Feature Using a Biomimetic Tactile Sensor,” Proc Amer Soc Biomech, Long Beach, CA (2011).
[16] Ponce Wong, R. D., Hellman, R.., Santos, V. J., “Spatial asymmetry in tactile sensor skin deformation aids perception of edge orientation during haptic exploration,” IEEE Trans on Haptics, To appear in the Special Issue on “Haptics in Rehabilitation and Neural Engineering” in April 2014. Electronic pre-print available on Oct. 21, 2013.
[17] Wettels, N., Santos, V. J., Johansson, R. S.., Loeb, G. E., “Biomimetic Tactile Sensor Array,” Advanced Robotics 22, 829–849 (2008).
[18] Fishel, J., Lin, G.., Loeb, G. E., “SynTouch LLC BioTac Product Manual, v.16” (2013). [19] Bensmaia, S. J., Hsiao, S. S., Denchev, P. V., Killebrew, J. H.., Craig, J. C., “The Tactile Perception of Stimulus
Orientation,” Somatosensory & motor research 25(1), 49–59 (2008). [20] Ponce Wong, R. D., “Towards Haptic Intelligence for Artificial Hands: Development and Use of Deformable,
Fluidic Tactile Sensors to Relate Action and Perception,” PhD dissertation, Arizona State University (2013). [21] Huynh, K., Stepp, C. E., White, L. W., Colgate, J. E.., Matsuoka, Y., “Finding a Feature on a 3D Object Through
Single-digit Haptic Exploration,” IEEE Haptics Symposium, 83–89 (2010). [22] Bologna, L. L., Pinoteau, J., Garrido, J.., Arleo, A., “Active tactile sensing in a neurorobotic Braille-reading
system,” 2012 4th IEEE RAS EMBS International Conference on Biomedical Robotics and Biomechatronics (BioRob), 1925 –1930 (2012).
[23] Fishel, J. A.., Loeb, G. E., “Bayesian Exploration for Intelligent Identification of Textures,” Front. Neurorobot. 6, 4 (2012).
[24] Pape, L., Oddo, C. M., Controzzi, M., Förster, A.., Schmidhuber, J., “Learning tactile skills through curious exploration,” Front. Neurorobot 6, 6 (2012).
Proc. of SPIE Vol. 9116 911605-15
Downloaded From: http://proceedings.spiedigitallibrary.org/ on 06/21/2014 Terms of Use: http://spiedl.org/terms