19
Hardware Performance Monitoring Unit Working Group Outbrief hpctoolkit.org CScADS Performance Tools for Extreme Scale Computing August 2011

Hardware Performance Monitoring UnitWorking Group Outbrief
hpctoolkit.org
CScADS Performance Tools for Extreme Scale Computing
August 2011

Topics• From HW-centric measurements to application understanding
— especially memory system performance analysis
• Techniques to be used with instruction sampling, including issues of statistical validity of the sampling
• Emerging kernel support for IBS
2

Diagnosing Problems Using Cycle Accounting• Cycle accounting for a thread: decompose total cycles into
— halted— unhalted
• unstalled – port saturation – function call overhead – instruction serialization – exception handling – graduated maximum rate
• stalled cycles (number of cycles with no uops retiring) – load latency, e.g. off_core_request_demand_read – bandwidth saturation – instruction starvation – instruction latency – store resource saturation – multi-thread collisions – branch non/misprediction – lock acquisition
3
each of these categories have subevents
on AMD, would need to use IBS for load latency
AMD bandwidth saturation MAB occupancy (but the right events are not provided)
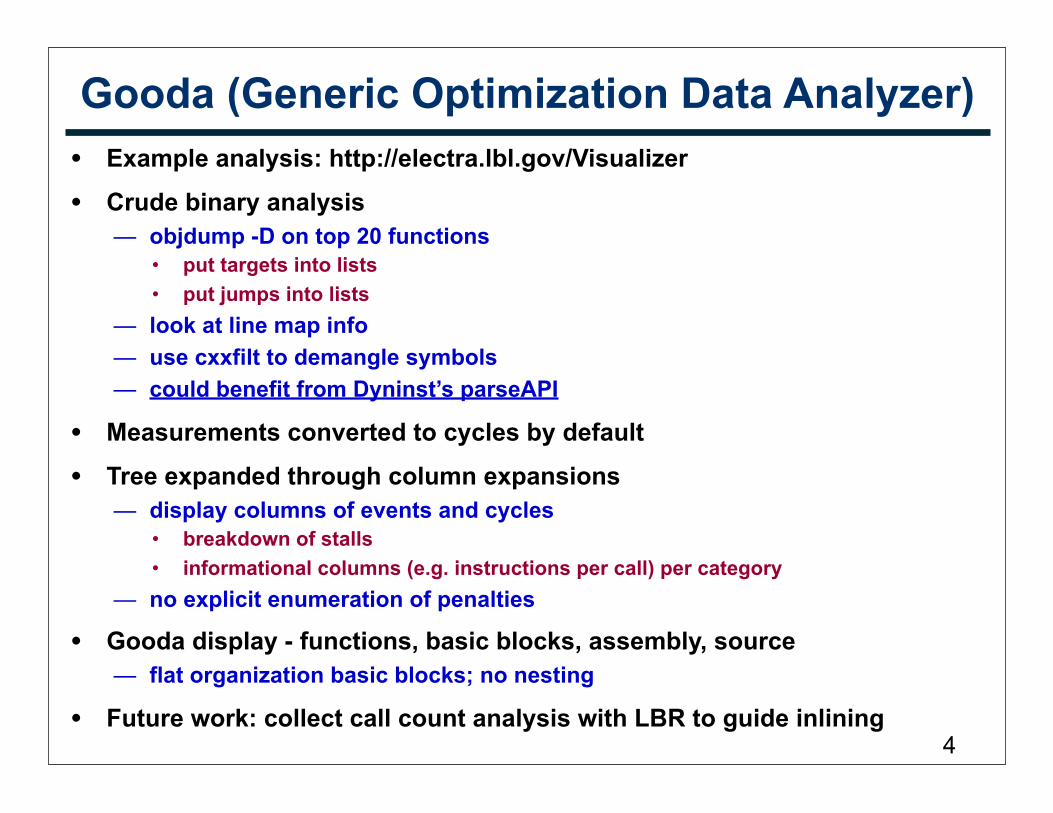
Gooda (Generic Optimization Data Analyzer)• Example analysis: http://electra.lbl.gov/Visualizer
• Crude binary analysis— objdump -D on top 20 functions
• put targets into lists• put jumps into lists
— look at line map info— use cxxfilt to demangle symbols— could benefit from Dyninst’s parseAPI
• Measurements converted to cycles by default
• Tree expanded through column expansions— display columns of events and cycles
• breakdown of stalls• informational columns (e.g. instructions per call) per category
— no explicit enumeration of penalties
• Gooda display - functions, basic blocks, assembly, source— flat organization basic blocks; no nesting
• Future work: collect call count analysis with LBR to guide inlining4
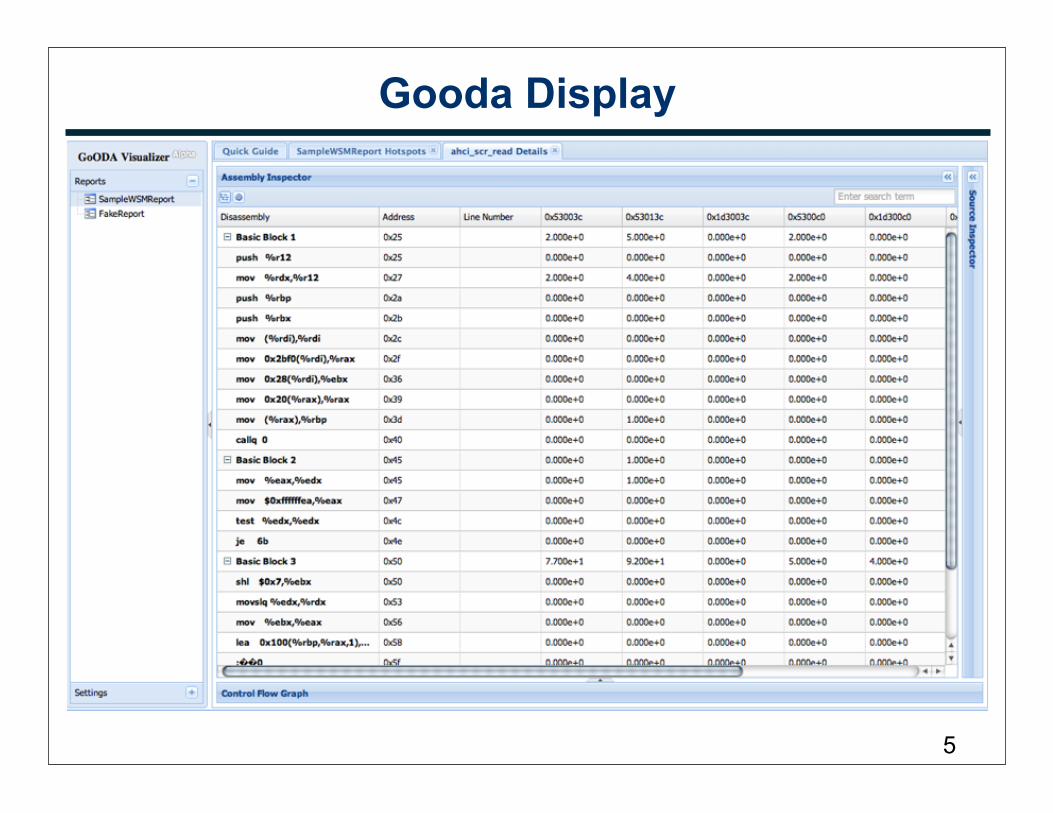
Gooda Display
5
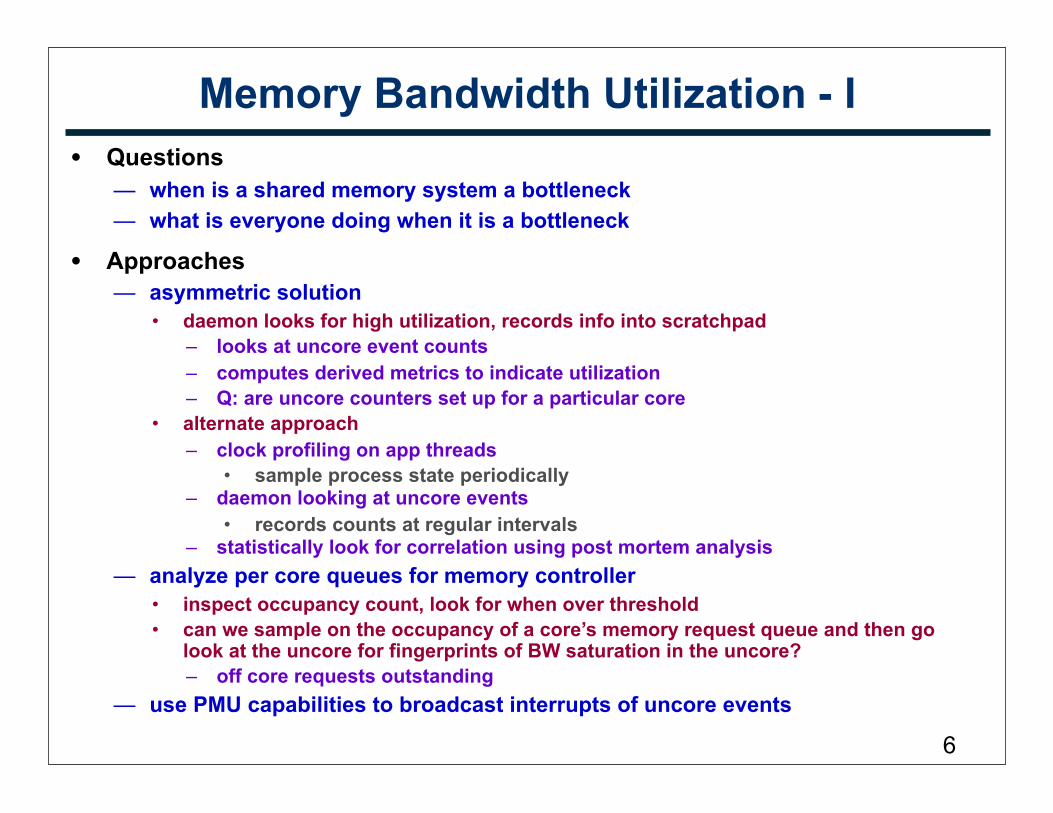
Memory Bandwidth Utilization - I• Questions
— when is a shared memory system a bottleneck— what is everyone doing when it is a bottleneck
• Approaches— asymmetric solution
• daemon looks for high utilization, records info into scratchpad – looks at uncore event counts – computes derived metrics to indicate utilization – Q: are uncore counters set up for a particular core
• alternate approach – clock profiling on app threads
• sample process state periodically – daemon looking at uncore events
• records counts at regular intervals – statistically look for correlation using post mortem analysis
— analyze per core queues for memory controller• inspect occupancy count, look for when over threshold• can we sample on the occupancy of a core’s memory request queue and then go
look at the uncore for fingerprints of BW saturation in the uncore? – off core requests outstanding
— use PMU capabilities to broadcast interrupts of uncore events
6
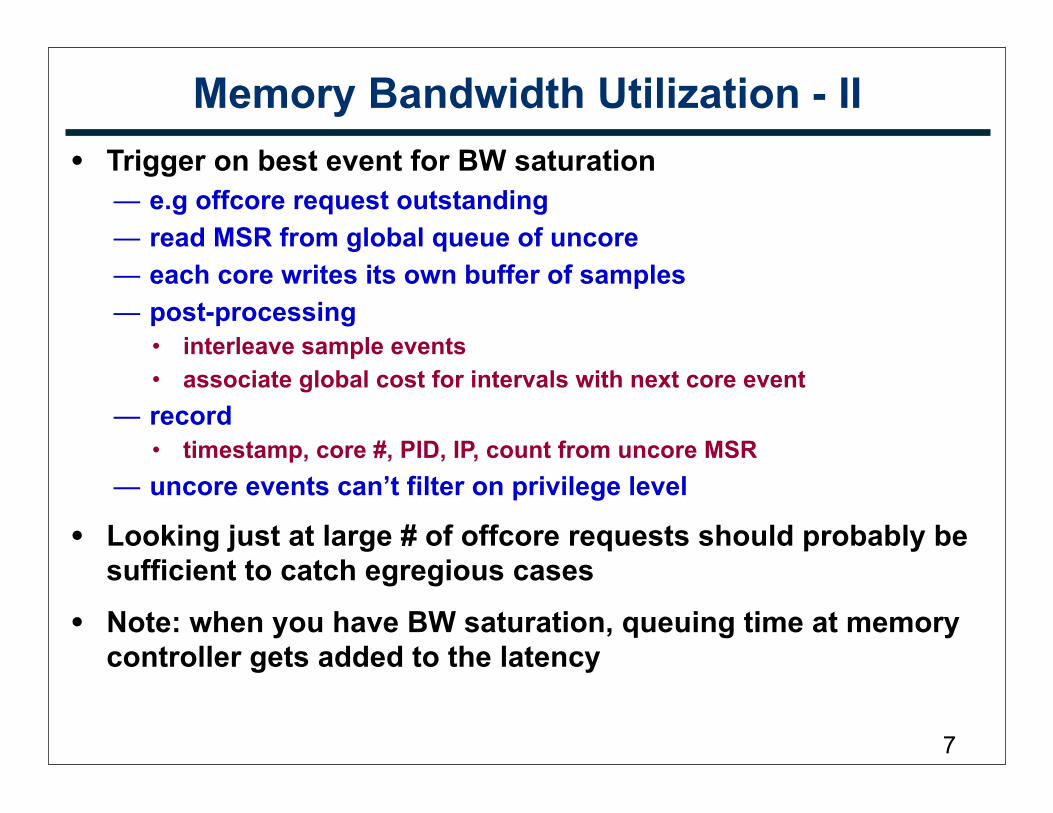
Memory Bandwidth Utilization - II• Trigger on best event for BW saturation
— e.g offcore request outstanding— read MSR from global queue of uncore— each core writes its own buffer of samples— post-processing
• interleave sample events• associate global cost for intervals with next core event
— record• timestamp, core #, PID, IP, count from uncore MSR
— uncore events can’t filter on privilege level
• Looking just at large # of offcore requests should probably be sufficient to catch egregious cases
• Note: when you have BW saturation, queuing time at memory controller gets added to the latency
7

Non-uniform Memory Access Traffic• Look for remote traffic or non-uniform traffic
— remote traffic is most costly— contention can increase latency
• PTU tool looks for sharing (both false and true)— diagnosing sharing on Intel processors
• precise HITM is a good event – capture registers, PC
• monitor HITM event and PEBS store (e.g. mem_up_retired_store)• reconstruct address from registers• look for non-overlapping addresses• sample both at very low periods or very long runs• need lots of events• look for (threadid, address) for store and HITM• shows cache line contention that costs you cycles
8
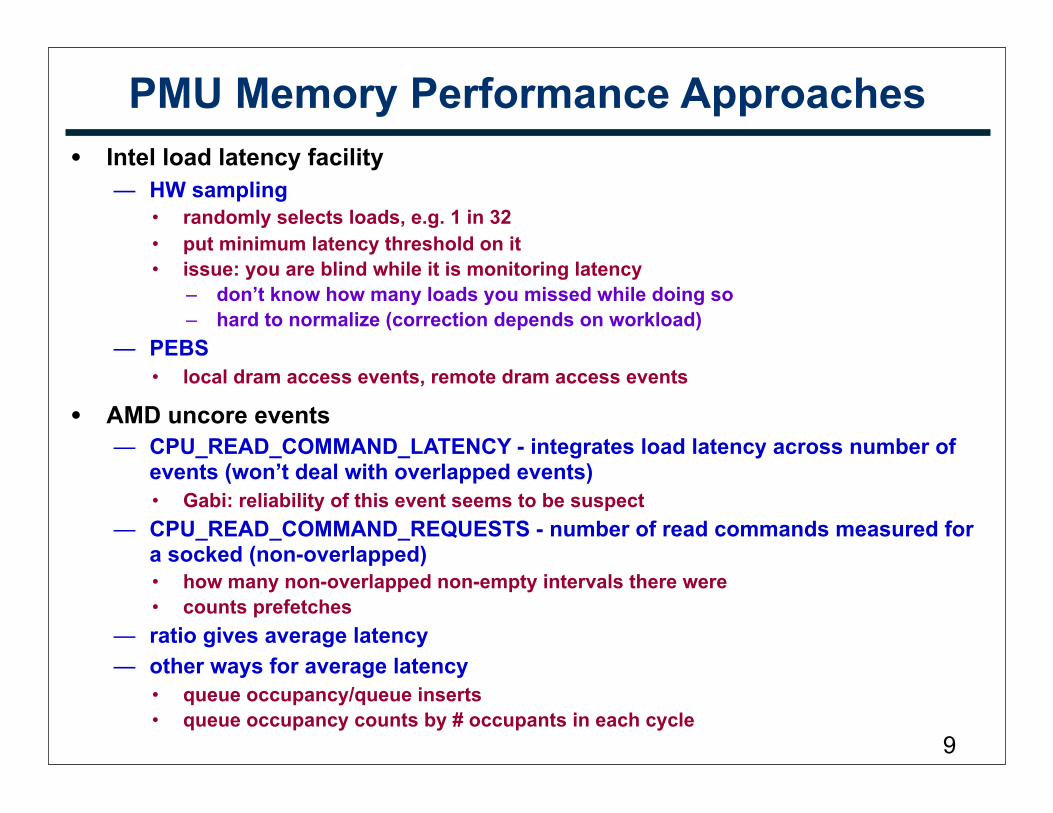
PMU Memory Performance Approaches• Intel load latency facility
— HW sampling• randomly selects loads, e.g. 1 in 32• put minimum latency threshold on it• issue: you are blind while it is monitoring latency
– don’t know how many loads you missed while doing so – hard to normalize (correction depends on workload)
— PEBS• local dram access events, remote dram access events
• AMD uncore events— CPU_READ_COMMAND_LATENCY - integrates load latency across number of
events (won’t deal with overlapped events)• Gabi: reliability of this event seems to be suspect
— CPU_READ_COMMAND_REQUESTS - number of read commands measured for a socked (non-overlapped)• how many non-overlapped non-empty intervals there were• counts prefetches
— ratio gives average latency— other ways for average latency
• queue occupancy/queue inserts• queue occupancy counts by # occupants in each cycle
9
Measuring with Lots of Counters• Levinthal multiplexes ~130 events when collecting data
— correlation between multiplexing periods does not seem to be a problem
— multiplex at about 100ms— run for about 1000s total
10
Analyzing Bandwidth in the Memory Hierarchy• Use microkernels to understand what PMU counts mean
• Approach— kernels
• triad• copies
— vary the block size— position buffers so that they reside in L2 or L3 by design— measure cache line moves per cycle— Note: avx vs. sse
• avx has more bandwidth per instruction
• Look for evidence of BW limits between the memory hierarchy
11
Diagnosing Instruction Schedule Issues• On Intel processors, monitor LBR chains
1. take a chain of 16 branches2. this gives a list of 16 basic blocks3. assume that all the data accesses are in L1 cache4. run the instruction sequence through a pipeline simulator to look
for deficiencies • e.g. Maqao - Jalby et al., http://maqao.org
12
Analyzing Performance of Shared Resources• Locks
— HW approach• look for very long latency events caused by lock contention
– set thresholds > 1000 cycles – seems like it would only work with a test-and-set (but not test-and-
test-and-set)• use IBS (or other capabilities) to identify effective address
— SW approach• PPoPP10 paper by Rice - blame shifting: transfer waiting time from
spinning threads to the lock holder – lock waiter attributes count of samples incurred while spinning to
the lock on which it spins – lock holder accepts blame for waiting threads
• swap value of “samples from waiting threads” with a 0• associates the waiting cost with the place in the code where
the lock was released
13
Performance Analysis of SMT• How do we understand performance of multiple threads?
• Throughput is more important than latency
• Evaluate whether SMT increases utilization of functional units— if not, look for evidence of resource conflicts
• e.g. are there additional cache misses due to conflicting cache footprint
• Resource stalls won’t be helped by SMT; only latency stalls will— BW bound applications won’t be helped
14
Instruction Based Sampling Issues• Need a sufficient number of samples for each of the
interesting locations in the application
• Will work in cases where the number of spots to monitor is not too large
• Can calculate the number of samples that you need to collect— if you have less than 30 samples, data is suspect; couple
hundred is better
• Data accesses to DRAM are significant, but infrequent— need to collect lots of samples in order to get enough
information
• Can end up with a problem where IBS interrupt is delivered to application late and removed from the instruction that is being sampled
15
Kernel Support for PMUs• Now support multiple PMUs in perf_events
— IBS support serves as a new PMU
• To support IBS, we will need the upstream Linux perf_events patches from Robert Richter ~3.2 approximately in ~12 weeks— details to come later from Robert
• Forthcoming capabilities— new PMU for AMD Northbridge events
• interrupt gets delivered to all cores• PMU won’t be restarted until all respond
— Li Ming’s patches for Intel processors
16
Cray CNL PMU Support Status• Cray seems to be using perf_events support from 2.6.34 in
their next CNL release based on Linux kernel 2.6.32 — early september
• Next SLES11 SP2 will contain 2.6.34 perf_events in 2.6.32 kernel— perhaps Cray can convince them to do the back ports of later
perf_events
• Requirements for IBS support in CNL— need event scheduling support— need multi-PMU support in 2.6.37— start by copying new file (perf_events.c) into old tree
• compile, see what is undefined, go from there— might be useful looking at RHEL6 RPM from Red Hat to see if the
patches will work (RHEL6 has 2.6.39 back patches for perf_events)
17

Summary• Current hardware makes it hard to get the information we need
about stalls— especially memory hierarchy
• Advanced hardware capabilities (e.g. IBS) are essential tools for measuring and attributing important costs— e.g. observed latency for memory operations
• Plans for current kernel on Cray’s systems don’t include the IBS support we want— we aim to try to influence their plans
• Blue Gene/Q— earlier engagement from tools teams than BG/P— plans to have significant performance tool support (e.g. PAPI,
HPCToolkit) tested on BG/Q before production deployment— more useful PMU support than BG/P, but still missing important
capabilities 18

Action Items• Assemble a library of microkernels for measuring performance attributes on
processors— validate counters— sources of microbenchmarks
• PACE project• McCalpin TACC• Levinthal
– check with Google management about availability of microkernels• Vince Weaver
• Work to assemble high level view of performance diagnosis— starting point: Dave Levinthal’s diagnosis trees
• augment with metrics for new capabilities/losses: e.g. transactions
• As part of DOE procurements, ask vendors to deliver plans for how they will support application-level attribution of performance losses — necessary hardware counters— understanding of how they account for stalls— strategy for attributing costs to application source code
• issues – skid – disconnect between events and operations: e.g. uncore to core – missing observability: e.g. memory controller activity
19


