PHYSICAL REVIEW B 1 MARCH 2000-IIVOLUME 61, NUMBER 10
Harmonic calculations and measurements of the irreversibility fieldusing a vibrating sample magnetometer
Ian J. Daniel and Damian P. HampshireDepartment of Physics, Superconductivity Group, University of Durham, South Road, Durham DH1 3LE, England
~Received 17 September 1999!
The effect of the field inhomogeneity of the magnet on a vibrating sample magnetometer~VSM! measure-ment of a superconductor is calculated using Bean’s model and Mallinson’s principle of reciprocity. When thesample is centered in both the magnetic field and the VSM pick-up coils, the hysteretic signal obtained in aVSM measurement, associated with the critical current density (JC), is reduced to zero when the effective acfield caused by the sample movement penetrates the entire sample and not, as is commonly assumed, when thecritical current density becomes zero. Under these conditions, an apparent phase transition is observed wherethe magnitude of the hysteresis drops to zero over a small field range. This apparent transition is solely anartifact of the measurement and cannot correctly be compared to theoretical calculations of the irreversibilityfield (BIRR), which is the phase boundary at whichJC is zero. Furthermore, the apparent reversible magneti-zation signal in high fields includes two contributions. In addition to the usual diamagnetic contribution fromthe thermodynamic reversible magnetization of the superconductor, there is a reversible paramagnetic contri-bution from the nonzeroJC . Hence values of the Ginzburg-Landau parameter~k! cannot be reliably obtainedfrom standard reversible magnetization measurements using a VSM unless it is confirmed thatJC is zero.Harmonic measurements using a VSM are reported. They confirm the results of the calculations. By applyinga large field gradient, the hysteresis in the magnetization signal at the drive frequency of the VSM is found todrop to zero more than 3 T belowBIRR . We propose methods to improve measurements ofBIRR andk. Theimplications of results presented for superconducting quantum interference device measurements are alsobriefly discussed.
elyhathlit
a
-ti-einnied.
eomma
taroitativ
V
b
tin
eter-
eldostfor
astheent
ngebe-
a-
ind
-er-nalto
oc-osst
rom
cytoen-to-
I. INTRODUCTION
Although zero resistance is probably the most widknown property of superconductors, there is little doubt ttheir magnetic properties have provided most insight intounderlying science of these materials. The irreversibifield BIRR , which is by definition the field at whichJC dropsto zero has been the focus of a great deal of theoreticalexperimental work.1–4 The earliest HTS~high temperaturesuperconductors! showed an irreversibility field well belowthe upper critical field (BC2), consistent with the short coherence length.5 Technological interest in these materials ulizes BIRR to provide a practical magnetic field limit for thmaterial’s use in superconducting applications so thatcreasingBIRR , improves a material’s utility. The connectiobetweenBIRR , the fundamental superconducting propertand the materials’ fabrication is still not fully understooAbove BIRR , reversible magnetization data on low-6 andhigh-temperature superconductors7–9 can be equated to ththermodynamic reversible magnetization obtained frGinzburg-Landau theory and the Ginzburg-Landau paraeter~k! derived.10,11The Ginzburg Landau parameter playscritical role in the theoretical description of the fundamenhigh-field properties of superconductors. This article pvides detailed calculations and measurements that facilcorrect interpretation and improvement of very high sensiity magnetic measurements on superconductors using abrating Sample Magnetometer12 ~VSM!. Harmonic VSMmeasurements are reported and methods proposed to omore reliable values ofBIRR andk.
Vibrating sample magnetometer and superconduc
PRB 610163-1829/2000/61~10!/6982~12!/$15.00
tey
nd
-
s
-
l-te-i-
tain
g
quantum interference device~SQUID! measurements are thmost widespread techniques for measuring both the hysetic and reversible magnetic response of Type-II high-fisuperconducting materials. The SQUID systems are mcommon because of their excellent sensitivity. Howevermeasurements in fields above;10 T, screening of theSQUID becomes problematic and the VSM is favored. It hlong been appreciated that the field inhomogeneity ofmagnet distorts the signal obtained in a SQUID measuremwhen the self-field of the sample is comparable to the chain the applied field the sample experiences as it movestween the SQUID pick-up coils.13,14 This is particularly sofor single crystals.15 Nevertheless because the SQUID mesurement captures data that describes thetotal flux producedby the sample, careful analysis of the voltage output canprinciple still extract the critical current even if the appliefield is inhomogeneous.16,17 The effect of field inhomogeneity in a standard VSM measurement is fundamentally diffent to that of the SQUID. In a VSM measurement, the sigis measured only at the drive frequency of the oscillationimprove the signal-to-noise ratio. Therefore signal thatcurs at harmonic frequencies is automatically lost. This lof information profoundly affects the origin of the field awhich the magnetic hysteresis drops to zero (BIRR* ) and mea-surements of the Ginzburg-Landau parameter derived freversible magnetization data in fields aboveBIRR* . In par-ticular BIRR* data obtained exclusively at the drive frequenof the oscillation of the VSM may not be directly equatedBIRR . In this article, data are reported at harmonic frequcies of the drive frequency, which maintain good signal-noise and capture the entire signal.
PRB 61 6983HARMONIC CALCULATIONS AND MEASUREMENTS OF . . .
Although much work has been completed on optimizithe geometry of the pick-up coils for a VSM,18 the effect ofthe inhomogeneity of the magnetic field in a VSM systehas not been addressed in detail. This article shows thcan play a critical role in determiningBIRR* and the reversiblemagnetization aboveBIRR* . BIRR* is the field at which theeffective ac field penetrates the entire sample and not, acommonly assumed, when the critical current densitycomes zero~i.e.,BIRR* ÞBIRR).19,20At fields close toBIRR* thehysteresis cannot be equated toJC . Indeed the rapid reduction in the hysteresis atBIRR* that is often interpreted asphase transition is in fact an artifact of the measuremWhen the sample is centered in both the pick-up coilsthe applied field, aboveBIRR* the measured reversible manetization has two components. In addition to the thermonamic reversible diamagnetic magnetization, there is anditional reversible paramagnetic contribution from tnonzeroJC . Hence although the reversible magnetizatiproperties of a superconductor probably provide the meffective way to parametrize the material within the framwork of Ginzburg-Landau theory, unless it is confirmed thJC is zero, the fundamental parameters derived from sdard reversible magnetization data are not correct.
The next section provides detailed calculations of thesponse of a Type-II superconductor within a standard Vmeasurement. It is assumed that the material has bulkning described by Bean’s model19 so the calculations canapply to both low- and high-temperature superconductMallinson’s principle of reciprocity21 is used to describe thinstantaneous voltages produced during a VSM measment. Harmonic measurements and analysis are used. Tare both well-established tools for investigating the undeing processes that produce the magnetic response of maals. In Campbell’s flux penetration technique,22 harmonicmeasurements have been used to distinguish bulk pinfrom surface pinning.23,24In susceptibility measurements, thharmonic response has been used to measure the field ddence ofJC in low fields25,26 and granularity.27 This articlereports harmonic data using a VSM. They are used to demine whether or notJC is zero aboveBIRR* and confirm theresults of the calculations. Then the implications for our geral understanding of magnetic measurements that charaize the magnetic phase diagram of superconductors amethod to improve measurements ofBIRR and k are dis-cussed. Finally our conclusions are summarized.
II. CALCULATIONS
In this section, detailed calculation of the voltages pduced during a VSM measurements are provided. The effof a magnetic field gradient and the sample not being pfectly centered in the pick-up coils are included. The callations demonstrate the important features of VSM measments in real rather than ideal conditions. Before detacalculations, consider the following estimate of the magtude of the effects addressed in this article. In a typical comercial VSM the throw distance is;0.5 mm and the fieldhomogeneity is;1024 over a 1 cmdiameter sphere. In general the field is more uniform in the central region at the peso a reasonable value for the variation in field over;0.5 mmat 10 T is;5 mT. Although this is a relatively small field
it
is-
t.d
-d-
st-tn-
-
in-
s.
e-ese-ri-
ng
en-
r-
-er-a
-tsr--e-di--
k
variation, it is approximately the same size as the self-fiproduced by a 1 mm3 sample with aJC of 43103 Am22. Fora 40mm thin film, a critical current density of;105 Am22
produces 5mT. Hence at relatively high critical current densities, the magnitude of the ac field the sample experienduring a VSM measurement, that is produced by the inmogeneity of the magnet, is equal to the self-field of tsample. The calculations below confirm that when this equity occurs, the history of the sample is completely lost aBean’s model cannot be applied assuming the applied fiehomogenous. The hysteresis in the magnetic moment foin a VSM measurement drops to zero producing an appaphase transition that is entirely an artifact of the measument.
A. Magnetic fields and mallinson fields
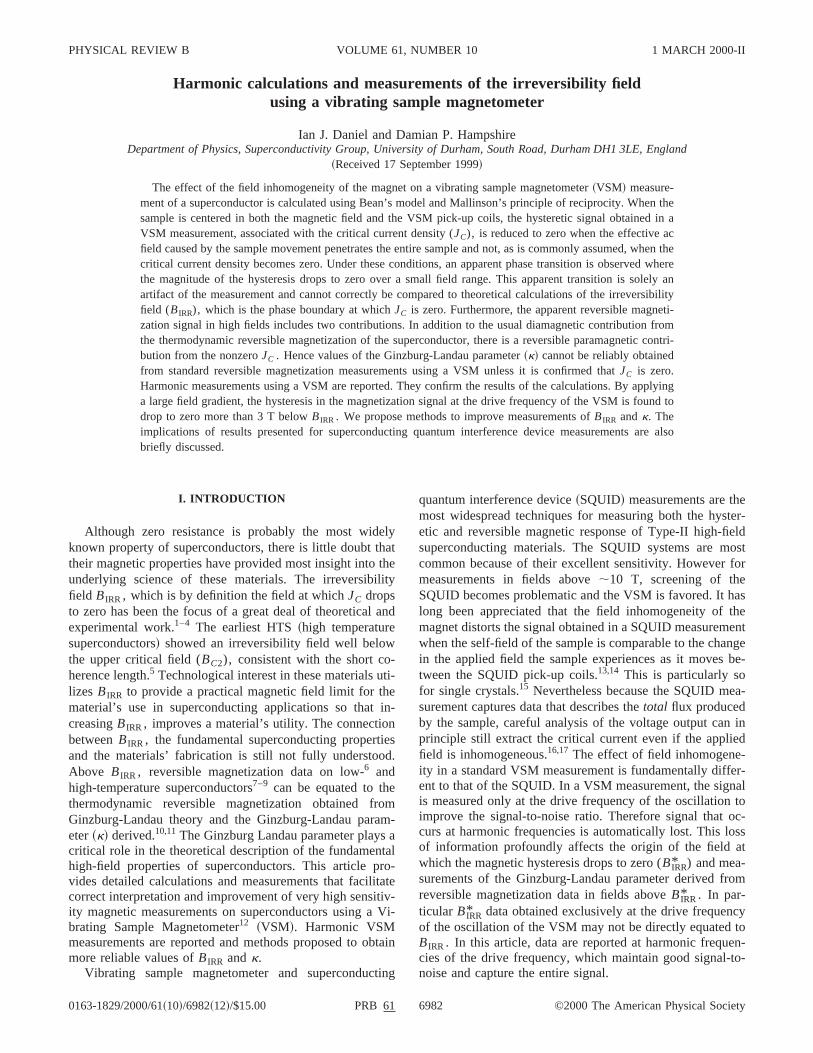
In Fig. 1~a!, the standard idealized configuration of manet and pick-up coils is shown for a VSM measurement. Tmagnetic sample oscillates up and down in thez direction,which generates a voltage across the pick-up coils. Tsample is at the center~and peak! of the magnetic field and iscentered between two oppositely wound pick-up coils. Tanalysis is simplified by assuming the magnetic field (BMag)points in thez direction and has a roof profile as shownFig. 1~a!. It is also assumed that the sample is centered rally and its oscillation is sinusoidal.
The instantaneous voltage generated across the piccoils by the sample can be calculated by applying Mallson’s principle of reciprocity. The principle states that tmutual flux linking two coils is independent of which cocarries the current. Hence the voltage produced by anemental magnetic moment oscillating between the pickcoils as shown in Fig. 1~b! is equivalent to the voltage acrosa coil of elemental area that replaces the magnetic momeunit current passes through the pick-up coils. The dotlines in Fig. 1~b! denote the Mallinson field generated by uncurrent in each pick-up coil and the solid line shown givthe net Mallinson field. The Mallinson field points in thezdirection. If the elemental moment is not centered in tpick-up coils, the instantaneous Mallinson field it expeences while it oscillates is:b0 cos(vt)1b1, whereb1 is theMallinson field at the center of the oscillation, 2b0 is thepeak-to-peak Mallinson field during the oscillation@as shownin Fig. 1~c!# andv is the angular frequency of the oscillationHence the instantaneous magnetic flux~f! linking the pickupcoils in the VSM measurement is
f5G@b0 cos~vt !1b1#m~ t !, ~1!
wherem(t) is the magnetic moment of the sample,G, b0andb1 are determined by the geometry of the pickup cob1 is also determined by how far the sample is off-set frothe center of the pick-up coils. From Fig. 1~c!, it can be seenthat the ratiob0 /b1 is the ratio of half the throw distance tthe distance the elemental moment is offset from the ceof the pick-up coils. The voltage induced in the pick-up cois given by
V52]f
]t52
]
]t$G@b0 cos~vt !1b1#m~ t !%. ~2!
ef distancet
along thed in the
6984 PRB 61IAN J. DANIEL AND DAMIAN P. HAMPSHIRE
FIG. 1. The magnet, sample, and pick-up coil configurations used in the calculations.~a! Ideal configuration—the sample oscillates in thcenter of the pick-up coils and in the center of the applied field. The axes describe the magnitude of the applied field as a function oalong thez axis. The applied field points along the positivez axis and has a roof profile.~b! The Mallinson field generated by unit currenin the oppositely wound pick-up coils. The axes describe the magnitude of the Mallinson field as a function of distance along thez axis. Thedotted lines denote the field generated by each coil separately and the solid line the net Mallinson field. The Mallinson field pointsz axis. ~c! A schematic showing the Mallinson field experienced by an elemental magnetic moment that is oscillating off-centerepick-up coils.
t ict
elagh
nth
ldn
agt-
ingotie
ti
s.e
In the idealized operation of a VSM, the magnetic momenconstant during the oscillation and the sample is perfecentered in the pick-up coils (b150). The geometry of thepick-up coils ensures that the gradient of the Mallinson fiis constant over the throw distance. A pure sine wave voltis observed at the drive frequency the magnitude of whicproportional to the magnetic moment of the sample.
B. The voltages produced by a sample oscillating in a uniformfield gradient
This section first presents the voltages generated iVSM measurement when the sample is centered inpick-up coils but offset from the center of the applied fieHence the sample is oscillating in a constant field gradieBean’s model28 is used to determine the instantaneous mnetic moment. Equation~2! is then used to calculate the volages generated during the measurement.
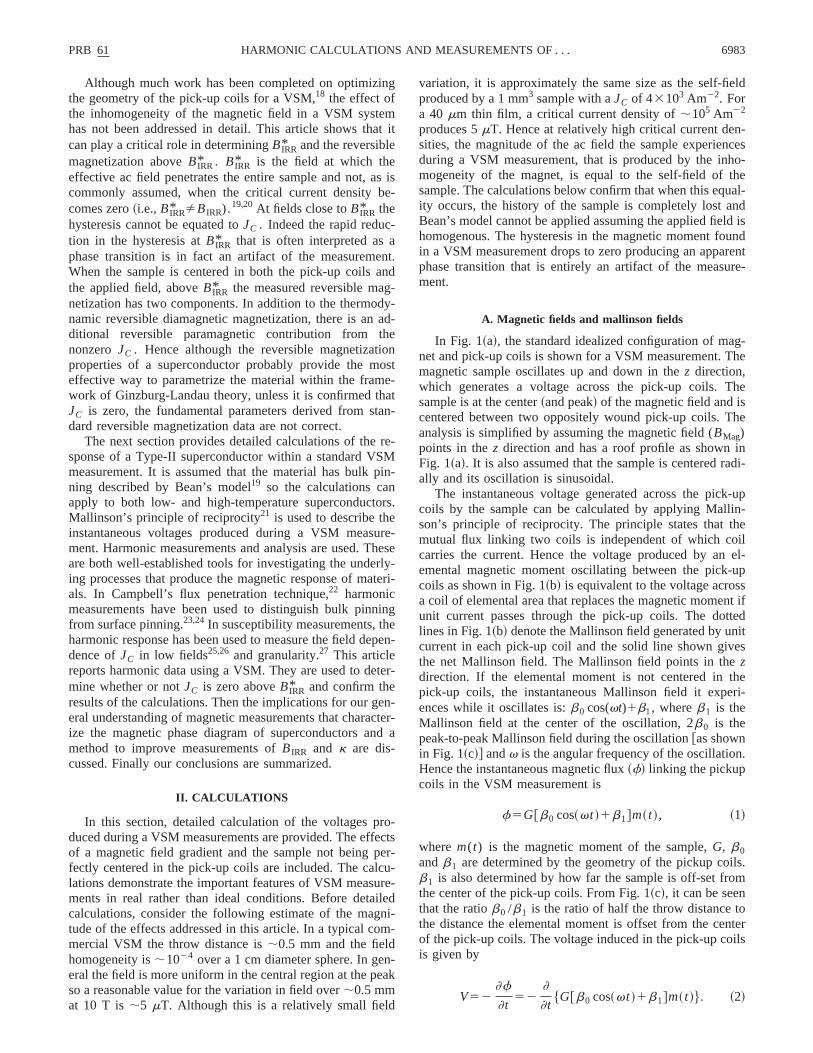
The field profiles generated within the sample usBean’s critical state model for a superconducting cylinderradius r m and lengthl, moving in a constant field gradienduring a VSM measurement are shown in Fig. 2. The fieldapplied along the axis of the cylinder. In low fields, thsample is not fully penetrated. In high fields, after a timetg ,the ac field fully penetrates the sample. A parameterg can bedefined as the ratio between the peak value of the effecac field and the sample self-field where
sly
de
is
ae
.t.-
f
s
ve
FIG. 2. Bean profiles for both the low- and high-field regimeThe radius of the sample isr m . The distance from the center of thsample that the effective ac field penetrates isr 0 . The turning pointfor the field profile is denotedr t .
r-Mten-mo
lie.
p
nm
-
ag
yo
ld
.fo-
o
thioneal
ao
th
thta
cytb-toe
heh ofcriti-
aby
ich. IV,lk
har-hen
-
for
entac
-upn-
PRB 61 6985HARMONIC CALCULATIONS AND MEASUREMENTS OF . . .
g5Bac
m0Jcr m. ~3!
In generalBac5FB whereF is a geometrical constant detemined by the magnet and the throw distance of the VSandB is the applied peak field. In the calculations presenin this article,F51023. When the sample moves in a costant field gradient,g51 separates the high-field regime frothe low-field regime. It also characterizes when the historythe sample is lost and hence the condition for the appfield to beBIRR* . In low fields, from the Bean profiles in Fig2, the magnetic moment@m(t)# is calculated by summingthe screening currents throughout the volume of the sam
m~ t !5SIA5E0
r 0JCpr 2ldr 6E
r 0
r tJCpr 2ldr 7E
r t
r mJCpr 2ldr
5JCp l
3~r 0
362r t37r m
3 7r 03!, ~4!
where the upper signs are for the first half of oscillation athe lower signs for the second half of the oscillation. FroFig. 2, Bean’s critical state model impliesr 05r m(12g) forg<1. In the low field case,r t5r m@12g(12cosvt)/2#. Inthe high-field case,m(t) is calculated in the four time domains: 0,t,t r , t r,t,p/v, p/v,t,p/v1t r , andp/v1t r,t,2p/v. Thereafter, the time dependence of the mnetic moment has been calculated as a function ofg ~orequivalentlyB!. The critical current density has arbitrarilbeen taken to follow the simple linear-field dependencethe form:29
JC5a~BC22B!, ~5!
wherea is 53105 Am22 T21, B is the applied dc field andBC2 is taken as 10 T. Clearly there is no irreversibility fiebelow BC2 for this functional form ofJC . Other functionalforms for the field dependence ofJC will be considered be-low to demonstrate the generality of the results obtainedFig. 3, the time dependence of the magnetic momentdifferent values ofg are shown. The calculations were completed using Maple V Release 4 takingb051,b l50,v5200p,l 5431023 m,r m51023 m. At very low values ofg~c.f., g50! the field gradient is small and the magnetic mment does not change during the oscillation. Forg>1, thehistory of the magnetic moment is completely lost andmean value of the magnetic moment during the oscillatdrops to zero. Figure 4 shows the equivalent voltages geated using Eq.~2!, andG50.538. These values give a signof 5 mVrms at the drive frequency whenJC is 53106 A m22 in zero field The voltage has been Fourier anlyzed into a Fourier series and calculated as a functionfield as shown in Fig. 5. The sine terms are denotedlossless voltages~or lossless magnetic moment! and the co-sine terms are the loss voltages. The calculations showwhen b0 is nonzero, a voltage occurs at the fundamenfrequency~1f! and at even multiples of the drive frequen~i.e., even harmonics: 2f, 4f, 6f,...!. We have confirmed thathe 1f lossless voltage alone, which is normally taken toproportional to the value ofJC , changes sign when the history of the applied field is changed. Furthermore it fallszero atg51. Wheng51, the effective ac field caused by th
,d
fd
le:
d
-
f
Inr
-
enr-
-fe
atl
e
movement of the sample is equal to the self-field of tsample and penetrates the sample completely. The widtthe hysteresis measured at 1f does not represent the truecal current density of the sample. AlthoughJC drops to zeroat 10 T~i.e., BC2!, the 1f hysteretic signal drops to zero atfield below 4 T. Hence the size of the hysteresis dropsmany orders of magnitude over a small field range, whcan be easily misinterpreted as a phase transition. In Secwe utilize the absence of any contribution from the bupinning to the 1 f signal aboveBIRR* in this configuration inproposing an improved measurement technique. Themonic voltages generated have also been calculated for wthe sample is not perfectly centered in the pick-up coils~b lhas been taken as22!. Theb l term produces additional voltages at odd multiples of the drive frequency~i.e., odd har-monics: 1f, 3f, 5f,...! as shown in Fig. 6.
In Table I, a summary of the extensive calculations
FIG. 3. Calculated values of the instantaneous magnetic momof the sample for different values of ac field penetration. Thefield penetration is characterized byg, whereg51023B/m0JCr m ,JC553105(BC22B) Am22, BC2510 T, l 5431023 m and r m
51023 m. Wheng51, the sample is fully penetrated.
FIG. 4. The calculated voltage waveform across the pickcoils for different values of ac field penetration. The ac field peetration is characterized byg, where g51023B/m0JCr m , JC553105(BC22B) Am22, BC2510 T, l 543103 m andr m51023 m.Wheng51, the sample is fully penetrated.
ns
th
nt
thetnu
te
f
fIncise
the
cilla-he
fl-tee
s-stheat
le.
Beanantesd in
agred
ced
l
ofoils
ar-o atesd
6986 PRB 61IAN J. DANIEL AND DAMIAN P. HAMPSHIRE
different configurations of the pick-up coils, the magnet, athe sample are presented. The first row of data describeresults shown in Fig. 5. At the fundamental frequency~1f!,the lossless voltage is zero aboveBIRR* , whereas the evenharmonic voltages are nonzero in fields up toBC2 ~consistentwith JC only dropping to zero atBC2!. If the sample is offsetin the pick-up coils, additional voltages are produced~secondrow of data, Table I!, which are all~including 1f! nonzero upto BC2 . These additional reversible components can be eipositive or negative~i.e., paramagnetic or diamagnetic! de-pending on whether the sample is above or below the ceof the pick-up coils.
C. The voltages produced by a sample oscillating about thecenter of the dc field
Calculations have also been completed for a sampleoscillates symmetrically about the center of a roof magnfield profile with a constant slope on either side. This cofiguration is considerably more complex than the previoones but of most interest to experimentalists.
In Fig. 7, the oscillation of a sample about the field cenis shown. Figure 7~a! shows how the applied field for fivedifferent points~i.e., A to E! varies with time. The parts o
FIG. 5. Calculated harmonic voltages as a function of dc mnetic field for a sample in a uniform applied field gradient, centein the pick-up coils. Upper panel—lossless voltages. All the oharmonic voltages are zero except the fundamental frequency~1f!which alone changes sign~from diamagnetic shown when the dfield is increased! to paramagnetic when the dc field is decreasAll even harmonic voltages tend to zero atBC2 . Lower panel—lossvoltages. All the odd harmonic voltages~including the fundamentathat is shown! are zero. The dotted line indicatesg51. The sampleis characterized byJC553105(BC22B) Am22, BC2510 T andl5431023 m andr m51023 m.
dthe
er
er
atic-s
r
the sample aboveA and belowE do not cross the center othe field. Their response follows that outlined in Sec. II B.the central region, the applied field depends on the prelocation within that region. Hence the parameterZ* has beenintroduced, which defines the position of any element ofsample with respect to the center of the sample. Figure 7~b!shows that in general each element sees a large-field ostion and a small-field oscillation. Figure 8 shows how tpenetration of the sample in the positive central region~i.e.,Z* .0! develops as the applied field~and hence the size othe field oscillations! increases. Initially neither the smalfield oscillation nor the large field oscillation fully penetrathe sample. Wheng51, there is the first penetration of thsample by the large-field oscillation atZ* 5D/2. In the re-gime 1,g,2, for Z* >D/g2D/2 the sample is only fullypenetrated by the large-field oscillation. ForZ* ,D/g2D/2 the sample is not fully penetrated by either field ocillation. At g52, the large-field oscillation fully penetratethe sample throughout the positive central region andsmall-field oscillation starts to penetrate the central regionZ* 50. In the regimeg.2, for Z<D(122/g)/2 both thelarge and small-field oscillations fully penetrate the sampFor Z.D(122/g)/2 only the large-field oscillation fullypenetrates the sample. Hence there are three types ofprofiles to consider. The first is related to the low-field Beprofiles of Fig. 2, where neither field oscillation penetrathe sample. The second type of Bean profiles are describe
-dd
.
FIG. 6. Calculated additional harmonic voltages as a functiondc magnetic field due to the sample not centered in the pick-up c~i.e., b1522!. Upper panel—lossless voltages. All the even hmonic voltages are zero. All odd harmonic voltages tend to zerBC2 . Lower panel—loss voltages. All the even harmonic voltagare zero. The dotted line indicatesg51. The sample is characterizeby JC553105(BC22B) Am22, BC2510 T andl 5431023 m andr m51023 m.
mplefield
mpleied
PRB 61 6987HARMONIC CALCULATIONS AND MEASUREMENTS OF . . .
TABLE I. Summary of harmonic voltages calculated for different experimental configurations. A sathat oscillates in a constant field gradient and one that oscillates symmetrically about a ‘‘flat roof’’profile are considered. The star~* ! notes that these harmonic frequencies can appear if a small sa~smaller than the throw distance of the V.S.M.! oscillates non-symmetrically about the peak in the applfield.
Experimental configurationEven Multiple ofDrive Frequency
Odd Multiples ofDrive Frequency
Sample oscillation in a constant field gradient andcentered in the pick-up coils~b0Þ0, b150!
2f, 4f, 6f, .... 1f only
Sample oscillating in a constant field gradient.Contribution from the sample not centered in thepick-up coils~b050, b1Þ0!
None 1f, 3f, 5f, ....
Sample centered in the dc applied field and centeredin the pick-up coils~b0Þ0, b150!
None* 1f, 3f, 5f, ....
Sample centered in the dc applied field.Contribution from the sample not centered in thepick-up coils.~b050, b1Þ0!
2f, 4f, 6f, ... None*
n
ce
ecil-gehe
wasforeent
olt-ges.nic
ple
w-lvennceesddal-ap-
th
epl
asthep-
Fig. 9 for Z* positive, where only the large-field oscillatiopenetrates the sample. The parameters which must becluded in the calculation aretc , which is the time when thepoint of the sample under consideration crosses the field
FIG. 7. The field experienced by a sample oscillating aboutcenter of the applied field.~a! The movement of the sample fromtime t50 to t52p/v. The center of the oscillation is fixed. ThparameterZ* describes the position of an element of the samwith respect to the center of the sample.~b! The instantaneous fieldfor points within the sample markedA to E.
in-
n-
ter andtpa andtpb, which are the times when the field profilof the sample is completely reversed by the large field oslation. The third type of profiles consider when both the larand the small oscillation fully penetrate the sample. Tmagnetic moment of each element in the central regioncalculated over the relevant time intervals and integrated2D/2,Z* ,D/2 to give the total magnetic moment of thsample. Once the time dependence of the magnetic momwas calculated as a function of field, the instantaneous vage and its Fourier component loss and lossless voltawere calculated following the procedure used in Sec. II B
In Fig. 10, the voltages generated at the even harmovoltages for the positive half of the central region~i.e., Z*.0! are shown. These results apply for a small sam~smaller than the throw distance of the VSM! that oscillatesnonsymmetrically about the peak in the applied field. Hoever theZ* positive andZ* negative sections of the centraregion described in Fig. 7 produce equal and opposite eharmonic voltages and equal odd harmonic voltages. Hethe total signal for the entire central region only producvoltages at odd harmonics of the drive frequency. The oharmonics for the central region are shown in Fig. 11. Cculations were completed for increasing and decreasing
e
eFIG. 8. A schematic showing how full penetration develops
the applied field increases for the upper part of the region ofsample~i.e., 0,Z* ,D/2! that sweeps through the peak in the aplied field.
lt-
n-ldsses
er isdcle iset,
rs-
isag-
-ting
theuebeitsits
etic
eldleeder
th
tho
ntriz
dceldils.
siblehe
fzero.
6988 PRB 61IAN J. DANIEL AND DAMIAN P. HAMPSHIRE
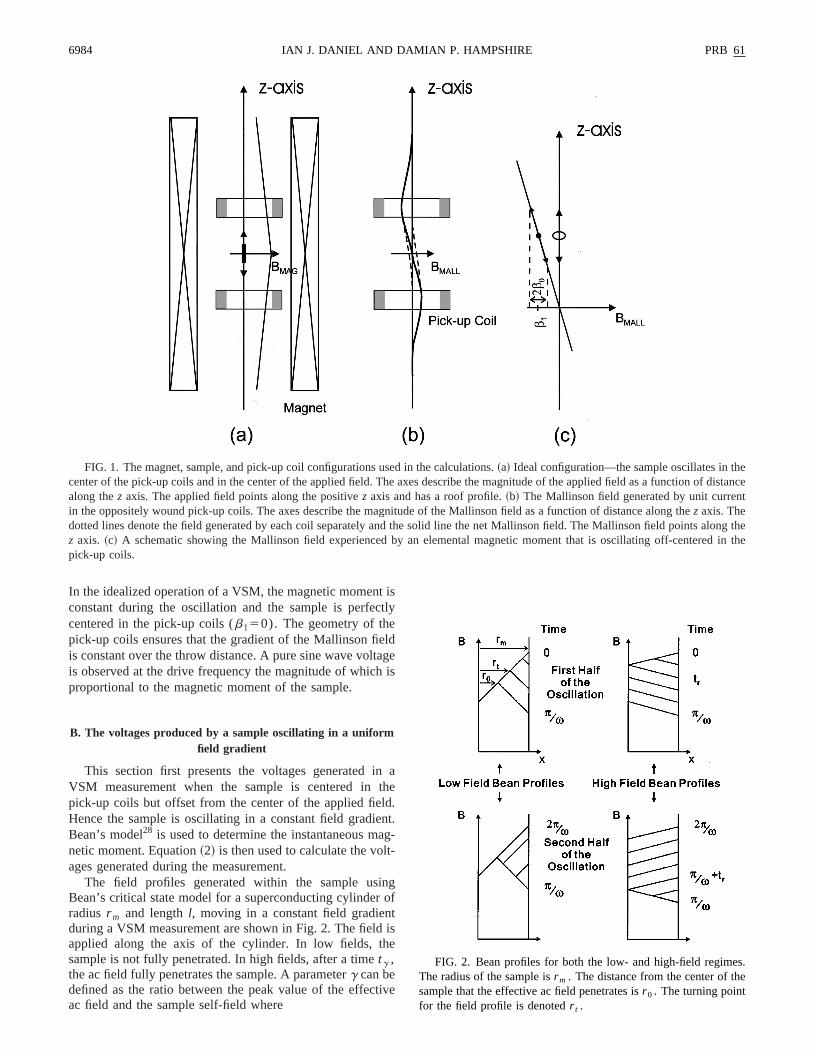
FIG. 9. The Bean profiles that occur in the intermediate firegime~i.e., 1,g,2! for the upper part of the region of the samp~i.e., 0,Z* ,D/2! that sweeps through the peak in the applifield. tc is the time when the point of the sample under considation crosses the field center andtpa and tpb are the times when thefield profile is completely reversed by the large field oscillation.
FIG. 10. Calculated values of the even harmonic voltages forupper part of the region of the sample~i.e., 0,Z* ,D/2! thatsweeps through the peak in the applied field. The lower part ofsample~i.e., 0,Z* ,2D/2! gives equal and opposite voltage sthat a sample that oscillates symmetrically about the field cegives net zero even harmonic voltages. The sample is characteby JC553105(BC22B) A.m22, BC2510 T and l 51023 m andr m51023 m.
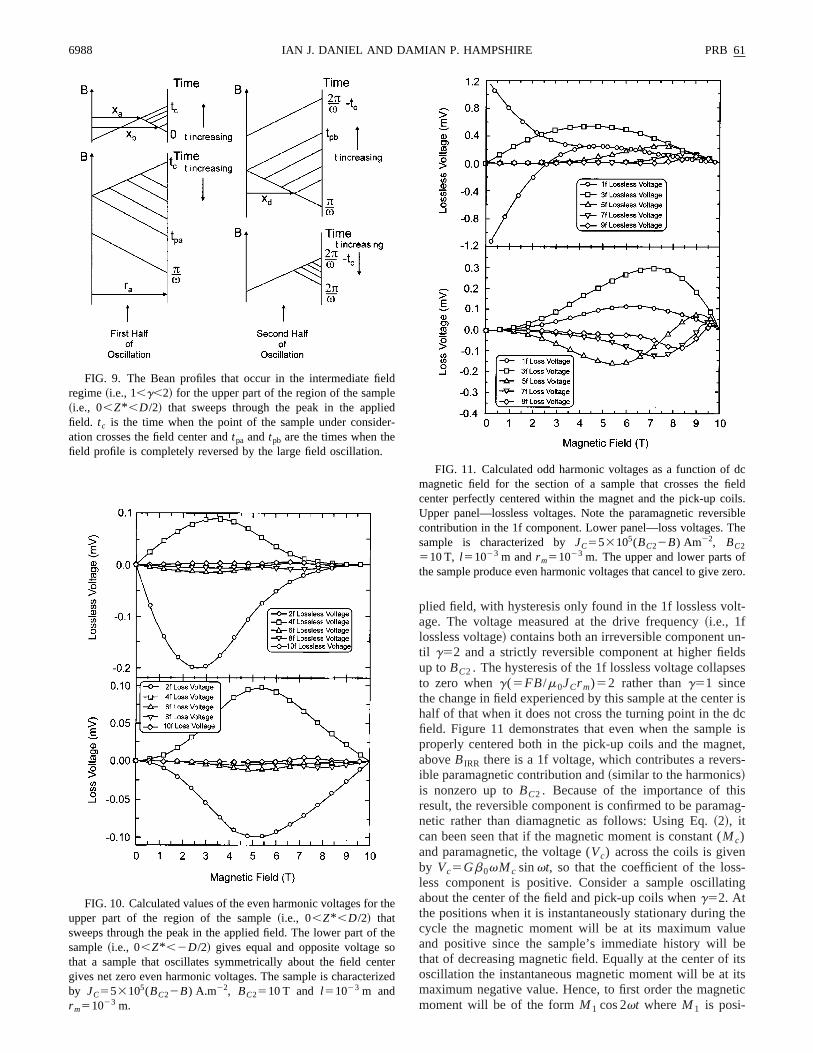
plied field, with hysteresis only found in the 1f lossless voage. The voltage measured at the drive frequency~i.e., 1flossless voltage! contains both an irreversible component util g52 and a strictly reversible component at higher fieup toBC2 . The hysteresis of the 1f lossless voltage collapto zero wheng(5FB/m0JCr m)52 rather thang51 sincethe change in field experienced by this sample at the centhalf of that when it does not cross the turning point in thefield. Figure 11 demonstrates that even when the sampproperly centered both in the pick-up coils and the magnaboveBIRR there is a 1f voltage, which contributes a reveible paramagnetic contribution and~similar to the harmonics!is nonzero up toBC2 . Because of the importance of thresult, the reversible component is confirmed to be paramnetic rather than diamagnetic as follows: Using Eq.~2!, itcan been seen that if the magnetic moment is constant (Mc)and paramagnetic, the voltage (Vc) across the coils is givenby Vc5Gb0vMc sinvt, so that the coefficient of the lossless component is positive. Consider a sample oscillaabout the center of the field and pick-up coils wheng52. Atthe positions when it is instantaneously stationary duringcycle the magnetic moment will be at its maximum valand positive since the sample’s immediate history willthat of decreasing magnetic field. Equally at the center ofoscillation the instantaneous magnetic moment will be atmaximum negative value. Hence, to first order the magnmoment will be of the formM1 cos 2vt whereM1 is posi-
-
e
e
ered
FIG. 11. Calculated odd harmonic voltages as a function ofmagnetic field for the section of a sample that crosses the ficenter perfectly centered within the magnet and the pick-up coUpper panel—lossless voltages. Note the paramagnetic revercontribution in the 1f component. Lower panel—loss voltages. Tsample is characterized byJC553105(BC22B) Am22, BC2
510 T, l 51023 m andr m51023 m. The upper and lower parts othe sample produce even harmonic voltages that cancel to give
o-ib
ue
oente
plweapticthar-lo
ee
m-
en-
es
Inper-are
nd
s
ionside
tio-urved
ionple
wero at
ym-olt-
PRB 61 6989HARMONIC CALCULATIONS AND MEASUREMENTS OF . . .
tive. Using Eq. ~2! and the vector identity cos 2vt cosvt51/2(cosvt1cos 3vt), the coefficient of the lossless compnent at the drive frequency is positive. Hence the reversmagnetic moment measured atg52, due to the nonzeroJCproduces a paramagnetic contribution.
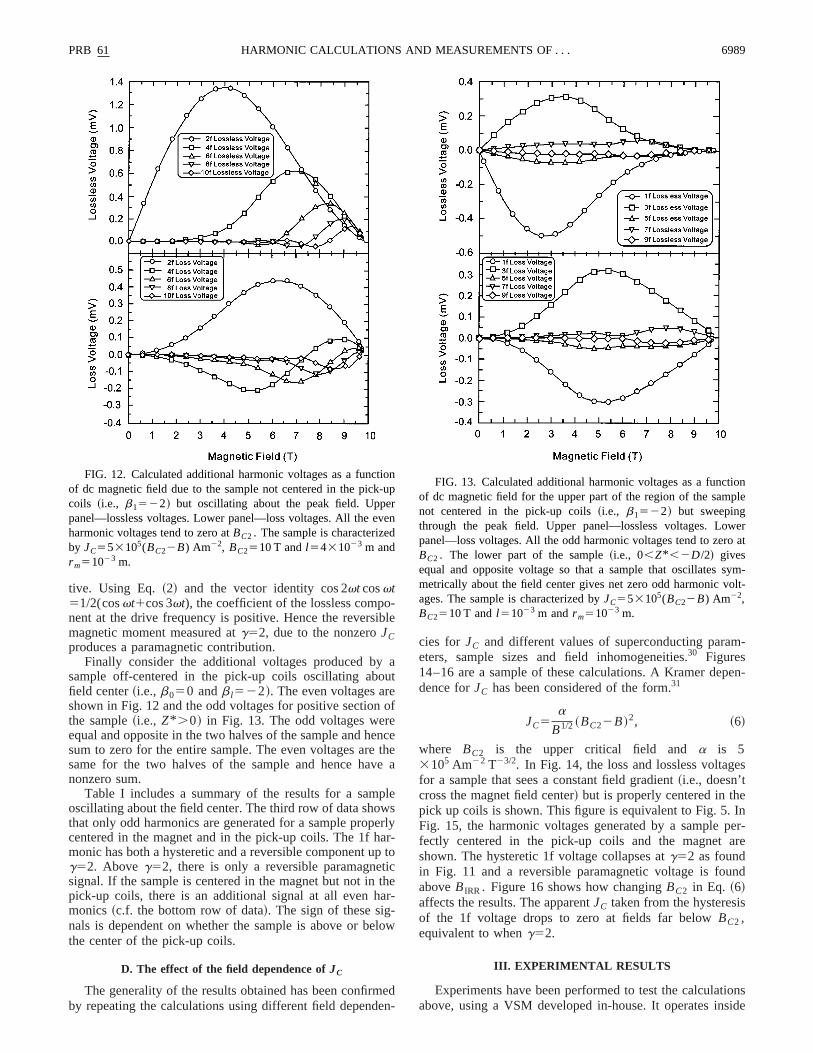
Finally consider the additional voltages produced bysample off-centered in the pick-up coils oscillating abofield center~i.e., b050 andb l522!. The even voltages arshown in Fig. 12 and the odd voltages for positive sectionthe sample~i.e., Z* .0! in Fig. 13. The odd voltages werequal and opposite in the two halves of the sample and hesum to zero for the entire sample. The even voltages aresame for the two halves of the sample and hence havnonzero sum.
Table I includes a summary of the results for a samoscillating about the field center. The third row of data shothat only odd harmonics are generated for a sample propcentered in the magnet and in the pick-up coils. The 1f hmonic has both a hysteretic and a reversible component ug52. Above g52, there is only a reversible paramagnesignal. If the sample is centered in the magnet but not inpick-up coils, there is an additional signal at all even hmonics~c.f. the bottom row of data!. The sign of these signals is dependent on whether the sample is above or bethe center of the pick-up coils.
D. The effect of the field dependence ofJC
The generality of the results obtained has been confirmby repeating the calculations using different field depend
FIG. 12. Calculated additional harmonic voltages as a funcof dc magnetic field due to the sample not centered in the pickcoils ~i.e., b1522! but oscillating about the peak field. Uppepanel—lossless voltages. Lower panel—loss voltages. All the eharmonic voltages tend to zero atBC2 . The sample is characterizeby JC553105(BC22B) Am22, BC2510 T andl 5431023 m andr m51023 m.
le
at
f
cehea
esrlyr-to
e-
w
dn-
cies for JC and different values of superconducting paraeters, sample sizes and field inhomogeneities.30 Figures14–16 are a sample of these calculations. A Kramer depdence forJC has been considered of the form.31
JC5a
B1/2~BC22B!2, ~6!
where BC2 is the upper critical field anda is 53105 Am22 T23/2. In Fig. 14, the loss and lossless voltagfor a sample that sees a constant field gradient~i.e., doesn’tcross the magnet field center! but is properly centered in thepick up coils is shown. This figure is equivalent to Fig. 5.Fig. 15, the harmonic voltages generated by a samplefectly centered in the pick-up coils and the magnetshown. The hysteretic 1f voltage collapses atg52 as foundin Fig. 11 and a reversible paramagnetic voltage is fouaboveBIRR . Figure 16 shows how changingBC2 in Eq. ~6!affects the results. The apparentJC taken from the hysteresiof the 1f voltage drops to zero at fields far belowBC2 ,equivalent to wheng52.
III. EXPERIMENTAL RESULTS
Experiments have been performed to test the calculatabove, using a VSM developed in-house. It operates ins
np
n
FIG. 13. Calculated additional harmonic voltages as a functof dc magnetic field for the upper part of the region of the samnot centered in the pick-up coils~i.e., b1522! but sweepingthrough the peak field. Upper panel—lossless voltages. Lopanel—loss voltages. All the odd harmonic voltages tend to zerBC2 . The lower part of the sample~i.e., 0,Z* ,2D/2! givesequal and opposite voltage so that a sample that oscillates smetrically about the field center gives net zero odd harmonic vages. The sample is characterized byJC553105(BC22B) Am22,BC2510 T andl 51023 m andr m51023 m.
ne
fhiereo%
Athar
daedvee
t
marhear
ress
ov
thattil
tt de-
agreent
is
g
ltag-redenzero
nic
olt-of
6990 PRB 61IAN J. DANIEL AND DAMIAN P. HAMPSHIRE
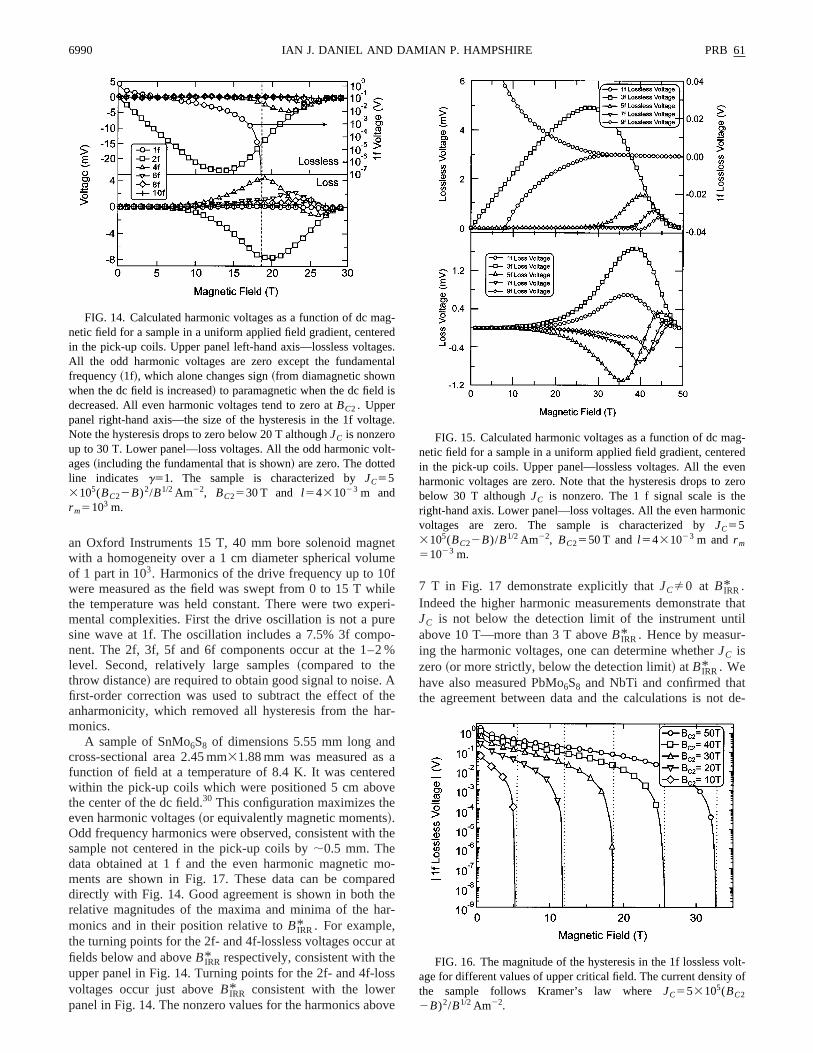
an Oxford Instruments 15 T, 40 mm bore solenoid magwith a homogeneity over a 1 cmdiameter spherical volumeof 1 part in 103. Harmonics of the drive frequency up to 10were measured as the field was swept from 0 to 15 T wthe temperature was held constant. There were two expmental complexities. First the drive oscillation is not a pusine wave at 1f. The oscillation includes a 7.5% 3f compnent. The 2f, 3f, 5f and 6f components occur at the 1–2level. Second, relatively large samples~compared to thethrow distance! are required to obtain good signal to noise.first-order correction was used to subtract the effect ofanharmonicity, which removed all hysteresis from the hmonics.
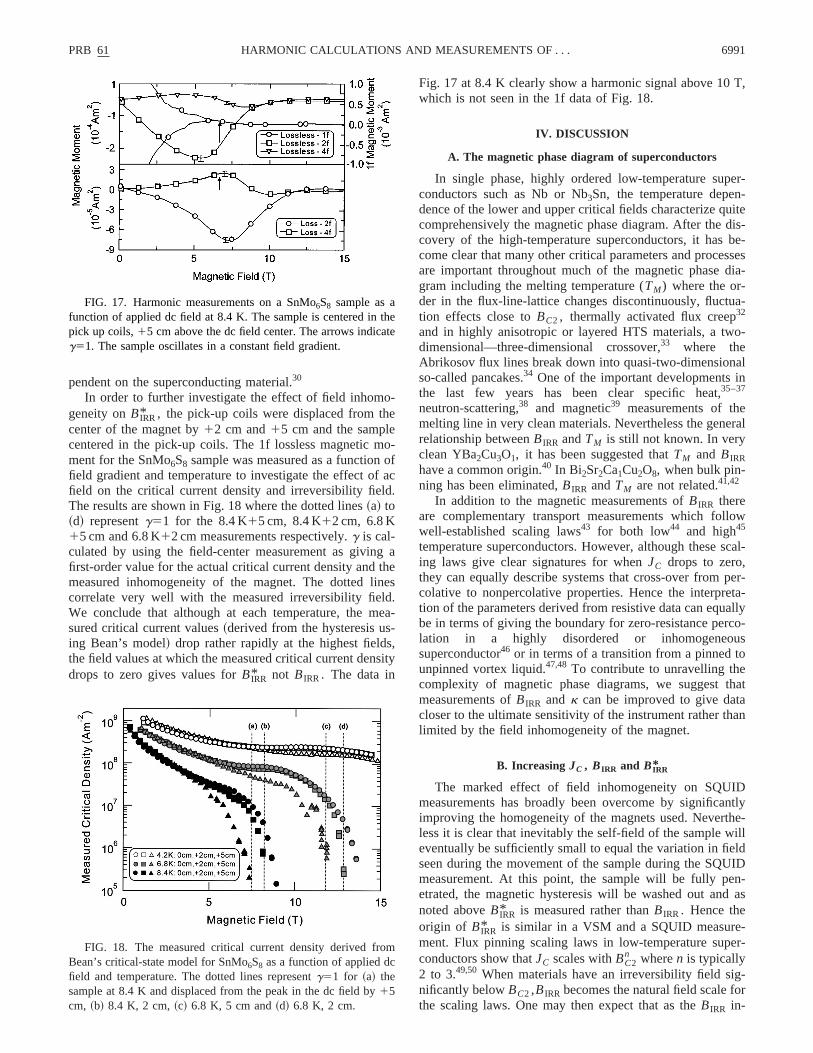
A sample of SnMo6S8 of dimensions 5.55 mm long ancross-sectional area 2.45 mm31.88 mm was measured asfunction of field at a temperature of 8.4 K. It was centerwithin the pick-up coils which were positioned 5 cm abothe center of the dc field.30 This configuration maximizes theven harmonic voltages~or equivalently magnetic moments!.Odd frequency harmonics were observed, consistent withsample not centered in the pick-up coils by;0.5 mm. Thedata obtained at 1 f and the even harmonic magneticments are shown in Fig. 17. These data can be compdirectly with Fig. 14. Good agreement is shown in both trelative magnitudes of the maxima and minima of the hmonics and in their position relative toBIRR* . For example,the turning points for the 2f- and 4f-lossless voltages occufields below and aboveBIRR* respectively, consistent with thupper panel in Fig. 14. Turning points for the 2f- and 4f-lovoltages occur just aboveBIRR* consistent with the lowerpanel in Fig. 14. The nonzero values for the harmonics ab
FIG. 14. Calculated harmonic voltages as a function of dc mnetic field for a sample in a uniform applied field gradient, centein the pick-up coils. Upper panel left-hand axis—lossless voltagAll the odd harmonic voltages are zero except the fundamefrequency~1f!, which alone changes sign~from diamagnetic shownwhen the dc field is increased! to paramagnetic when the dc fielddecreased. All even harmonic voltages tend to zero atBC2 . Upperpanel right-hand axis—the size of the hysteresis in the 1f voltaNote the hysteresis drops to zero below 20 T althoughJC is nonzeroup to 30 T. Lower panel—loss voltages. All the odd harmonic voages~including the fundamental that is shown! are zero. The dottedline indicates g51. The sample is characterized byJC553105(BC22B)2/B1/2 Am22, BC2530 T and l 5431023 m andr m5103 m.
t
leri-
-
e-
he
o-ed
-
at
e
7 T in Fig. 17 demonstrate explicitly thatJCÞ0 at BIRR* .Indeed the higher harmonic measurements demonstrateJC is not below the detection limit of the instrument unabove 10 T—more than 3 T aboveBIRR* . Hence by measur-ing the harmonic voltages, one can determine whetherJC iszero~or more strictly, below the detection limit! at BIRR* . Wehave also measured PbMo6S8 and NbTi and confirmed thathe agreement between data and the calculations is no
-ds.al
e.
-FIG. 15. Calculated harmonic voltages as a function of dc m
netic field for a sample in a uniform applied field gradient, centein the pick-up coils. Upper panel—lossless voltages. All the evharmonic voltages are zero. Note that the hysteresis drops tobelow 30 T althoughJC is nonzero. The 1 f signal scale is theright-hand axis. Lower panel—loss voltages. All the even harmovoltages are zero. The sample is characterized byJC553105(BC22B)/B1/2 Am22, BC2550 T and l 5431023 m and r m
51023 m.
FIG. 16. The magnitude of the hysteresis in the 1f lossless vage for different values of upper critical field. The current densitythe sample follows Kramer’s law whereJC553105(BC2
2B)2/B1/2 Am22.
o-e
oo
f ad.
gthned.e-
s,si
T,
er--
uitedis-be-ssesdia-
a-
o-
alin
eral
low
scal-
per-ta-allyco-uso
thataan
Dntlyhe-illldID
n-as
-er-
-r
thte
om
PRB 61 6991HARMONIC CALCULATIONS AND MEASUREMENTS OF . . .
pendent on the superconducting material.30
In order to further investigate the effect of field inhomgeneity onBIRR* , the pick-up coils were displaced from thcenter of the magnet by12 cm and15 cm and the samplecentered in the pick-up coils. The 1f lossless magnetic mment for the SnMo6S8 sample was measured as a functionfield gradient and temperature to investigate the effect ofield on the critical current density and irreversibility fielThe results are shown in Fig. 18 where the dotted lines~a! to~d! representg51 for the 8.4 K15 cm, 8.4 K12 cm, 6.8 K15 cm and 6.8 K12 cm measurements respectively.g is cal-culated by using the field-center measurement as givinfirst-order value for the actual critical current density andmeasured inhomogeneity of the magnet. The dotted licorrelate very well with the measured irreversibility fielWe conclude that although at each temperature, the msured critical current values~derived from the hysteresis using Bean’s model! drop rather rapidly at the highest fieldthe field values at which the measured critical current dendrops to zero gives values forBIRR* not BIRR . The data in
FIG. 17. Harmonic measurements on a SnMo6S8 sample as afunction of applied dc field at 8.4 K. The sample is centered inpick up coils,15 cm above the dc field center. The arrows indicag51. The sample oscillates in a constant field gradient.
FIG. 18. The measured critical current density derived frBean’s critical-state model for SnMo6S8 as a function of applied dcfield and temperature. The dotted lines representg51 for ~a! thesample at 8.4 K and displaced from the peak in the dc field by15cm, ~b! 8.4 K, 2 cm,~c! 6.8 K, 5 cm and~d! 6.8 K, 2 cm.
-fc
aes
a-
ty
Fig. 17 at 8.4 K clearly show a harmonic signal above 10which is not seen in the 1f data of Fig. 18.
IV. DISCUSSION
A. The magnetic phase diagram of superconductors
In single phase, highly ordered low-temperature supconductors such as Nb or Nb3Sn, the temperature dependence of the lower and upper critical fields characterize qcomprehensively the magnetic phase diagram. After thecovery of the high-temperature superconductors, it hascome clear that many other critical parameters and proceare important throughout much of the magnetic phasegram including the melting temperature (TM) where the or-der in the flux-line-lattice changes discontinuously, fluctution effects close toBC2 , thermally activated flux creep32
and in highly anisotropic or layered HTS materials, a twdimensional—three-dimensional crossover,33 where theAbrikosov flux lines break down into quasi-two-dimensionso-called pancakes.34 One of the important developmentsthe last few years has been clear specific heat,35–37
neutron-scattering,38 and magnetic39 measurements of themelting line in very clean materials. Nevertheless the genrelationship betweenBIRR andTM is still not known. In veryclean YBa2Cu3O1, it has been suggested thatTM and BIRRhave a common origin.40 In Bi2Sr2Ca1Cu2O8, when bulk pin-ning has been eliminated,BIRR andTM are not related.41,42
In addition to the magnetic measurements ofBIRR thereare complementary transport measurements which folwell-established scaling laws43 for both low44 and high45
temperature superconductors. However, although theseing laws give clear signatures for whenJC drops to zero,they can equally describe systems that cross-over fromcolative to nonpercolative properties. Hence the interpretion of the parameters derived from resistive data can eqube in terms of giving the boundary for zero-resistance perlation in a highly disordered or inhomogeneosuperconductor46 or in terms of a transition from a pinned tunpinned vortex liquid.47,48 To contribute to unravelling thecomplexity of magnetic phase diagrams, we suggestmeasurements ofBIRR and k can be improved to give datcloser to the ultimate sensitivity of the instrument rather thlimited by the field inhomogeneity of the magnet.
B. Increasing JC , B IRR and B IRR*
The marked effect of field inhomogeneity on SQUImeasurements has broadly been overcome by significaimproving the homogeneity of the magnets used. Nevertless it is clear that inevitably the self-field of the sample weventually be sufficiently small to equal the variation in fieseen during the movement of the sample during the SQUmeasurement. At this point, the sample will be fully peetrated, the magnetic hysteresis will be washed out andnoted aboveBIRR* is measured rather thanBIRR . Hence theorigin of BIRR* is similar in a VSM and a SQUID measurement. Flux pinning scaling laws in low-temperature supconductors show thatJC scales withBC2
n wheren is typically2 to 3.49,50 When materials have an irreversibility field significantly belowBC2 ,BIRR becomes the natural field scale fothe scaling laws. One may then expect that as theBIRR in-
e
or
n-aninthcrro
tio
threo
-b
indifdroag-u
C
taeeere
hec
firhen
geat tagciilsy
atans.theilsnli-lealsoanyainbe
netic
beenured foring,m-
ase
ce,de
in-g-g-ble
tede
re-
theare
clu-
ntsK.s-
6992 PRB 61IAN J. DANIEL AND DAMIAN P. HAMPSHIRE
creases,JC increases. There have been a number of repthat radiation increases both the irreversibility line andJC inboth YBa2Cu3O7 ~Ref. 51! and Bi2Sr2Ca2Cu3O10.
52 Howeverthis article has shown that for a given magnetic instrumeone expectsBIRR* to increase asJC increases. Equally, measurements to test for granularity by taking large samplesgrinding them into powder inevitably produce changesBIRR* simply because of the change in the dimensions ofsample. Measurements on small samples such as singletals are prone to error because of the small self-field pduced by such samples. Measurements ofk, particularlythose that show curvature in the reversible magnetizadata11 may include a contribution from non-zeroJC . Thegeneral concerns arise whether reports in the literaturereversible magnetization data can correctly be equated tooretical thermodynamic calculations of the diamagneticsponse of superconductors and furthermore whether repof BIRR are in fact reports ofBIRR* . We have shown experimentally that these parameters can differ in high fieldsmany T.
C. Measuring k, JC , and B IRR
The calculations presented are sufficiently wide-rangto allow the qualitative harmonic response of a range offerent sample sizes and geometries to be determinesamples that are much bigger or much smaller than the thdistance, or that are symmetrically oscillating about the mnetic field center or not, or that are centered in the pickcoils or not.
The basic difference in the solutions in Sec. II B and IIcan be utilized to improve measurements ofk, JC andBIRR .Consider a sample in a magnetic field aboveBIRR* that iscentered in the pick-up coils. If the sample sees a consfield gradient across the throw distance the magnetic momchanges sign twice during the cycle and the 1 f signal is z~c.f., Fig. 5!. If the sample oscillates about the field centthe magnetic moment changes sign four times and a revible magnetic component is produced~c.f. Figs 11 and 13!.We propose that if preliminary calculations show that tfield inhomogeneity in the magnetic instrument may produsignificant errors for a sample of interest, a reasonablestep would be to slightly offset the pick-up coils and tsample so that the sample does not cross the field ceduring its oscillation and remeasure it. If the data chansignificantly, we propose that the system is recenteredthat an additional coil system is added to the instrumenproduce a field gradient sufficiently large to ensure the mnetic moment only changes sign twice during a single oslation. For a sample perfectly centered in the pick-up cothis additional field gradient will significantly reduce ancontribution at 1 f from non-zeroJC aboveBIRR* ~c.f., Fig. 5!.
n,
d.
ts
t,
d
eys--
n
ofe--rts
y
g-—w-
p
ntntro,rs-
est
ters
ndo-
l-,
We propose that two sets of reversible magnetization dare obtained with the gradient field in opposite directioThe average of these data sets will cancel to first ordereffect of the sample not being centered in the pick-up coperfectly ~c.f., Fig. 6!. From these reversible magnetizatiodata obtained at the drive frequency of the VSM, more reable measurements ofk can be made than would be possibusing standard methods. If two sets of measurements aremade at higher harmonics, the reversible voltages due tononcentering of the sample in the pick-up coils are agcancelled to first order and the entire voltage signal canreconstructed from the harmonic data. Equation~2! can thenbe used to deconvolute the time dependence of the magmoment from whichJC can be extracted. OnceJC has beenaccurately measured, an accurate measurement ofBIRR isthen available.
V. CONCLUSIONS
The magnetic phase diagram of superconductors hasmuch debated, particularly with respect to high-temperatsuperconductors. Many explanations have been proposethe region of phase space that appears to have no pinnyet is still superconducting. VSM measurements are comonly used in high magnetic fields to determine the phboundary whenJC is zero.20 However,BIRR* is determined bysample geometry, field inhomogeneity and throw distanand cannot be equated toBIRR . When the sample is centerein both the magnetic field and the VSM pick-up coils, threversible signal at the drive frequency in high fieldscludes two contributions. In addition to the usual diamanetic contribution from the thermodynamic reversible manetization of the superconductor, there is a reversiparamagnetic contribution from the nonzeroJC . HenceaboveBIRR* , the reversible magnetization cannot be equato the thermodynamic reversible magnetization, and henckcannot be reliably derived, unless it is shown thatJC is neg-ligible. We have proposed a method to improve measuments of k, JC and BIRR by adding a coil system to theinstrument that produces a constant field gradient overthrow distance of the sample. Harmonics measurementsproposed to improve the accuracy ofJC andBIRR data. Ex-perimental data have been presented to support the consions of this work.
ACKNOWLEDGMENTS
The authors thank the E.P.S.R.C. and Oxford InstrumePlc for providing support for this work and R. Luscombe,Brazier, D. N. Zheng, and N. Cheggour for helpful discusions.
.ett.
ett.
1E. H. Brandt, Int. J. Mod. Phys. B5, 751 ~1991!.2G. Blatter, M. V. Feigelman, V. B. Geshkenbein, A. I. Larki
and V. M. Vinokur, Rev. Mod. Phys.66, 1125~1994!.3Y. Yeshurun, A. P. Malozemoff, and A. Shaulov, Rev. Mo
Phys.68, 911 ~1996!.
4L. F. J. Cohen and H. J. Jensen, Rep. Prog. Phys.60, 1581~1997!.5M. K. Wu, J. R. Ashburn, C. J. Torng, P. H. Hor, R. L. Meng, L
Gao, Z. J. Huang, Y. Q. Wang, and C. W. Chu, Phys. Rev. L58, 908 ~1987!.
6M. Suenaga, G. Ghosh, Y. Xu, and D. O. Welch, Phys. Rev. L
ys
J
-
.
-
m
n,
Eu-
C.
.
a,
c.
ys.
.
c-w
F.
o,
PRB 61 6993HARMONIC CALCULATIONS AND MEASUREMENTS OF . . .
66, 1777~1991!.7D. N. Zheng, H. D. Ramsbottom, and D. P. Hampshire, Ph
Rev. B52, 1 ~1995!.8D. N. Zheng, A. M. Campbell, and R. S. Liu, Phys. Rev. B48,
6519 ~1993!.9J. Y. Genoud, G. Triscone, A. Junod, T. Tsukamoto, and
Muller, Physica C242, 143 ~1995!.10V. L. Ginzburg and L. D. Landau, Zh. Eksp. Teor. Fiz.20, 1064
~1950!.11Z. Hao, J. R. Clem, M. W. McElfresh, L. Civale, A. P. Maloz
emoff, and F. Holtzberg, Phys. Rev. B43, 2844~1991!.12S. Foner, Rev. Sci. Instrum.30, 548 ~1959!.13S. Libbrecht, E. Osquiguil, and Y. Bruynseraede, Physica C225,
337 ~1994!.14G. Ravikumaret al., Physica C276, 9 ~1997!.15A. Schilling, H. R. Ott, and T. Wolf, Phys. Rev. B46, 14 253
~1992!.16L. Pust, D. Dlought, and M. Jirsa, Supercond. Sci. Technol9,
814 ~1996!.17I. Hlasnik, M. Majoros, and L. Jansak,Handbook of Applied Su
perconductivity~Institute of Physics, Bristol, 1998!.18A. Zieba and S. Foner, Rev. Sci. Instrum.53, 1344~1982!.19C. P. Bean, Rev. Mod. Phys.36, 31 ~1964!.20J. R. Cave,Handbook of Applied Superconductivity~Ref. 17!.21J. Mallinson, J. Appl. Phys.37, 2514~1966!.22A. M. Campbell, J. Phys. C2, 1492~1969!.23A. M. Campbell and J. E. Evetts, Adv. Phys.21, 199 ~1972!.24H. D. Ramsbottom and D. P. Hampshire, J. Appl. Phys.85, 3732
~1999!.25L. Ji, R. H. Sohn, G. C. Spalding, C. J. Lobb, and M. Tinkha
Phys. Rev. B40, 10 936~1989!.26S. K. Ghatak, A. Mitra, and D. Sen, Phys. Rev. B45, 951~1992!.27R. B. Goldfarb, A. F. Clark, A. I. Braginski, and A. J. Panso
Cryogenics27, 475 ~1987!.28C. P. Bean, Phys. Rev. Lett.8, 250 ~1962!.29R. G. Hampshire and M. T. Taylor, J. Phys. F: Met. Phys.2, 89
~1972!.30I. J. Daniel, Ph.D. thesis, Durham University, 1999.31E. J. Kramer, J. Appl. Phys.44, 1360~1977!.
.
.
,
32Y. Yeshurun and A. P. Malozemoff, Phys. Rev. Lett.60, 2202~1988!.
33L. I. Glazman and A. E. Koshelev, Phys. Rev. B43, 2835~1991!.34J. R. Clem, Phys. Rev. B43, 7837~1991!.35M. Roulin, A. Junod, and E. Walker, Science273, 1210~1996!.36M. Roulin, A. Junod, A. Erb, and E. Walker, Phys. Rev. Lett.80,
1722 ~1998!.37B. Revaz, A. Junod, and A. Erb, Phys. Rev. B58, 11 153~1998!.38R. Cubittet al., Nature~London! 365, 407 ~1993!.39B. Revaz, G. Triscone, L. Fabrega, A. Junod, and J. Muller,
rophys. Lett.33, 701 ~1996!.40J. R. Cooper, J. W. Loram, J. D. Johnson, J. W. Hodby, and
Changkang, Phys. Rev. Lett.79, 1730~1997!.41E. Zeldov, D. Majer, M. Konczykowski, V. B. Geshkenbein, V
M. Vinokur, and H. Shtrikman, Nature~London! 375, 373~1995!.
42D. Majer, E. Zeldov, and M. Konczykowski, Phys. Rev. Lett.75,1166 ~1995!.
43R. H. Koch, V. Foglietti, W. J. Gallagher, G. Koren, A. Guptand M. P. A. Fisher, Phys. Rev. Lett.63, 1511~1989!.
44N. Cheggour and D. P. Hampshire, inApplied Superconductivity1997, edited by H. Rogalla and D. H. A. Blank, IOP Conf. ProNo. 158~Institute of Physics, London, 1997!, p. 1275.
45K. Yamafuji and T. Kiss, Physica C290, 9 ~1997!.46D. C. Harris, S. T. Herbert, D. Stroud, and J. C. Garland, Ph
Rev. Lett.67, 3606~1991!.47R. Prozorov, M. Konczykowski, B. Schmidt, Y. Yeshurun, A
Shaulov, C. Villard, and G. Koren, Phys. Rev. B54, 15 530~1996!.
48M. V. Indenbom, C. J. vander Beek, V. Berseth, M. Konzykowski, N. Motohira, H. Berger, and W. Benoit, J. LoTemp. Phys.105, 1117~1996!.
49W. A. Fietz and W. W. Webb, Phys. Rev.178, 657 ~1969!.50D. Dew-Hughes, Philos. Mag.30, 293 ~1974!.51L. Civale, A. D. Marwick, T. K. Worthington, M. A. Kirk, J. R.
Thompson, L. Krusin-Elbaum, Y. Sun, J. R. Clem, andHoltzberg, Phys. Rev. Lett.67, 648 ~1991!.
52Q. Li, Y. Fukumoto, Y. Zhu, M. Suenaga, T. Kaneko, K. Satand C. Simon, Phys. Rev. B54, R788~1996!.