11 Harmonic Distortion in Renewable Energy Systems: Capacitive Couplings Miguel García-Gracia, Nabil El Halabi, Adrián Alonso and M.Paz Comech CIRCE (Centre of Research for Energy Resources and Consumption) University of Zaragoza Spain 1. Introduction Renewable energy systems such as wind farms and solar photovoltaic (PV) installations are being considered as a promising generation sources to cover the continuous augment demand of energy. With the incoming high penetration of distributed generation (DG), both electric utilities and end users of electric power are becoming increasingly concerned about the quality of electric network (Dugan et al., 2002). This latter issue is an umbrella concept for a multitude of individual types of power system disturbances. A particular issue that falls under this umbrella is the capacitive coupling with grounding systems, which become significant because of the high-frequency current imposed by power converters. The major reasons for being concerned about capacitive couplings are: a. Increase the harmonics and, thus, power (converters) losses in both utility and customer equipment. b. Ground capacitive currents may cause malfunctioning of sensitive load and control devices. c. The circulation of capacitive currents through power equipments can provoke a reduction of their lifetime and limits the power capability. d. Ground potential rise due to capacitive ground currents can represent unsafe conditions for working along the installation or electric network. e. Electromagnetic interference in communication systems and metering infrastructure. For these reasons, it has been noticed the importance of modelling renewable energy installations considering capacitive coupling with the grounding system and thereby accurately simulate the DC and AC components of the current waveform measured in the electric network. Introducing DG systems in modern distribution networks may magnify the problem of ground capacitive couplings. This is because DG is interfaced with the electric network via power electronic devices such as inverters. These capacitive couplings are part of the electric circuit consisting of the wind generator, PV arrays, AC filter elements and the grid impedance, and its effect is being appreciated in most large scale DG plants along the electric network (García-Gracia et al., 2010). www.intechopen.com
Transcript
11
Harmonic Distortion in Renewable Energy Systems: Capacitive Couplings
Miguel García-Gracia, Nabil El Halabi, Adrián Alonso and M.Paz Comech
CIRCE (Centre of Research for Energy Resources and Consumption) University of Zaragoza
Spain
1. Introduction
Renewable energy systems such as wind farms and solar photovoltaic (PV) installations are
being considered as a promising generation sources to cover the continuous augment
demand of energy.
With the incoming high penetration of distributed generation (DG), both electric utilities
and end users of electric power are becoming increasingly concerned about the quality of
electric network (Dugan et al., 2002). This latter issue is an umbrella concept for a multitude
of individual types of power system disturbances. A particular issue that falls under this
umbrella is the capacitive coupling with grounding systems, which become significant
because of the high-frequency current imposed by power converters.
The major reasons for being concerned about capacitive couplings are: a. Increase the harmonics and, thus, power (converters) losses in both utility and customer
equipment. b. Ground capacitive currents may cause malfunctioning of sensitive load and control
devices. c. The circulation of capacitive currents through power equipments can provoke a
reduction of their lifetime and limits the power capability. d. Ground potential rise due to capacitive ground currents can represent unsafe
conditions for working along the installation or electric network. e. Electromagnetic interference in communication systems and metering infrastructure. For these reasons, it has been noticed the importance of modelling renewable energy
installations considering capacitive coupling with the grounding system and thereby
accurately simulate the DC and AC components of the current waveform measured in the
electric network.
Introducing DG systems in modern distribution networks may magnify the problem of
ground capacitive couplings. This is because DG is interfaced with the electric network via
power electronic devices such as inverters.
These capacitive couplings are part of the electric circuit consisting of the wind generator,
PV arrays, AC filter elements and the grid impedance, and its effect is being appreciated in
most large scale DG plants along the electric network (García-Gracia et al., 2010).
www.intechopen.com
Power Quality Harmonics Analysis and Real Measurements Data
262
Power electronic devices, as used for DG, might be able to cause harmonics. The magnitude and the order of harmonic currents injected by DC/AC converters depend on the technology of the converter and mode of its operation (IEC Std. 61000-4-7, 2010, IEEE Std. 519-1992, 1992). Due to capacitive coupling between the installation and earth, potential differences imposed
by switching actions of the converter inject a capacitive ground current which can cause
significant electromagnetic interferences, grid current distortion, losses in the system, high-
noise level in the installation and unsafe work conditions (Chicco et al., 2009).
Several renewable system installations analyses have been reported (Bellini, 2009, Conroy, 2009, Luna, 2011, Sukamonkol, 2002, Villalva, 2009), where most theoretical analysis and experimental verifications have been performed for small-scale installations without considering capacitive coupling. Power electronics models and topologies also have been studied, but without considering the amount of losses produced by the capacitive current that appears due to the switching actions (Zhow, 2010, Chayawatto, 2009, Kim, 2009). In (Iliceto & Vigotti, 1998), the total conversion losses of a real 3 MW PV installation have been studied considering reflection losses, low radiation and shadow losses, temperature losses, auxiliary losses, array losses and converters losses. The latter two factors sum a total of 10% of the rated power where part of these losses is due to the capacitive coupling that was neglected. Therefore, for an accurate study of power quality, it is important to model DG installations
detailing the capacitive coupling of the electric circuit with the grounding system, which are
detailed for PV installations and wind farms in Sections 2 and 3, respectively. These models
allow analyzing the current distortion, ground losses and Ground Potential Rise (GPR) due
to the capacitive coupling. The combined effect of several distributed generation sources
connected to the same electric network has been simulated, and results have been presented
together with solutions based on the proposed model to minimize the capacitive ground
current for meeting typical power quality regulations concerning to the harmonic distortion
and safety conditions.
2. Capacitive coupling in solar-photovoltaic installation
The region between PV modules and PV structure essentially acts as an insulator between
layers of PV charge and ground. Most shunt capacitive effects that may be ignored at very
low frequencies can not be neglected at high frequencies for which the reactance will
become relatively small due to the inverse proportionality with frequency f and, therefore, a
low impedance path is introduced between power elements and ground.
This effect is present in PV installations because of the high frequency switching carried out
by the converters stage, which arises different capacitive coupling between modules and
ground. Thus, the capacitive effect must be represented as a leakage loop between PV
arrays, cables and electronic devices and the grounding system. By means of this leakage
loop, capacitive currents are injected into the grounding system creating a GPR along the PV
installation which introduces current distortion, electromagnetic interference, noise and
unsafe work conditions. For this reason, an accurate model of these capacitive couplings are
requiered for PV installations.
2.1 Equivalent electric circuit for ground current analysis
Depending on the switching frequency, the harmonics produced may be significant according to the capacitive coupling and the resonant frequency inside the PV installation.
www.intechopen.com
Harmonic Distortion in Renewable Energy Systems: Capacitive Couplings
263
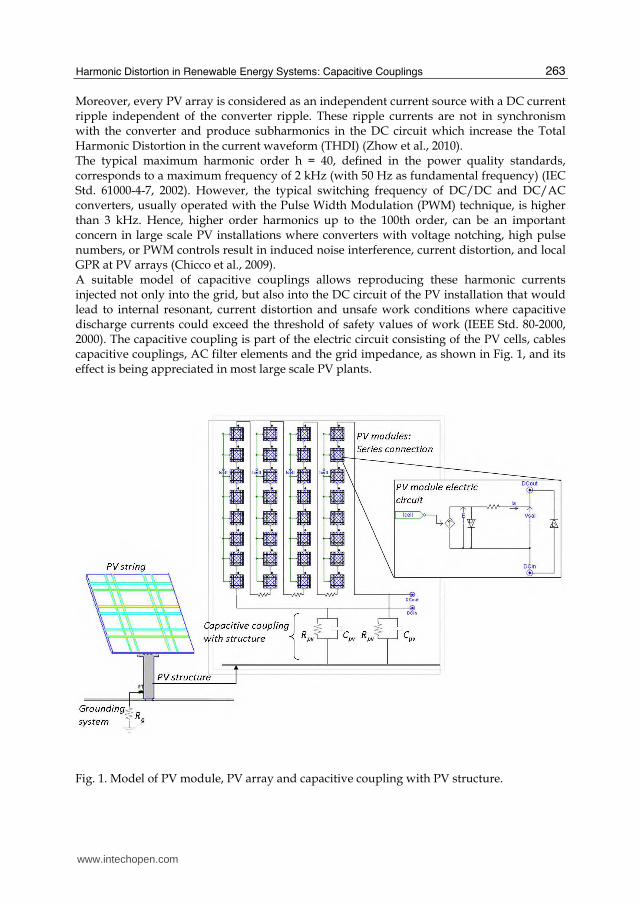
Moreover, every PV array is considered as an independent current source with a DC current ripple independent of the converter ripple. These ripple currents are not in synchronism with the converter and produce subharmonics in the DC circuit which increase the Total Harmonic Distortion in the current waveform (THDI) (Zhow et al., 2010). The typical maximum harmonic order h = 40, defined in the power quality standards, corresponds to a maximum frequency of 2 kHz (with 50 Hz as fundamental frequency) (IEC Std. 61000-4-7, 2002). However, the typical switching frequency of DC/DC and DC/AC converters, usually operated with the Pulse Width Modulation (PWM) technique, is higher than 3 kHz. Hence, higher order harmonics up to the 100th order, can be an important concern in large scale PV installations where converters with voltage notching, high pulse numbers, or PWM controls result in induced noise interference, current distortion, and local GPR at PV arrays (Chicco et al., 2009). A suitable model of capacitive couplings allows reproducing these harmonic currents injected not only into the grid, but also into the DC circuit of the PV installation that would lead to internal resonant, current distortion and unsafe work conditions where capacitive discharge currents could exceed the threshold of safety values of work (IEEE Std. 80-2000, 2000). The capacitive coupling is part of the electric circuit consisting of the PV cells, cables capacitive couplings, AC filter elements and the grid impedance, as shown in Fig. 1, and its effect is being appreciated in most large scale PV plants.
Fig. 1. Model of PV module, PV array and capacitive coupling with PV structure.
www.intechopen.com
Power Quality Harmonics Analysis and Real Measurements Data
264
2.2 Behavior of the PV installation considering capacitive coupling Normally, numerous PV modules are connected in series on a panel to form a PV array as it is shown in Fig. 1. The circuit model of the PV module (Kim et al., 2009) is composed of an ideal current source, a diode connected in parallel with the current source and a series resistor. The output current of each PV module is determined as follows:
·· exp
·s
sc d sc oT
V I RI I I I I
nV
(1)
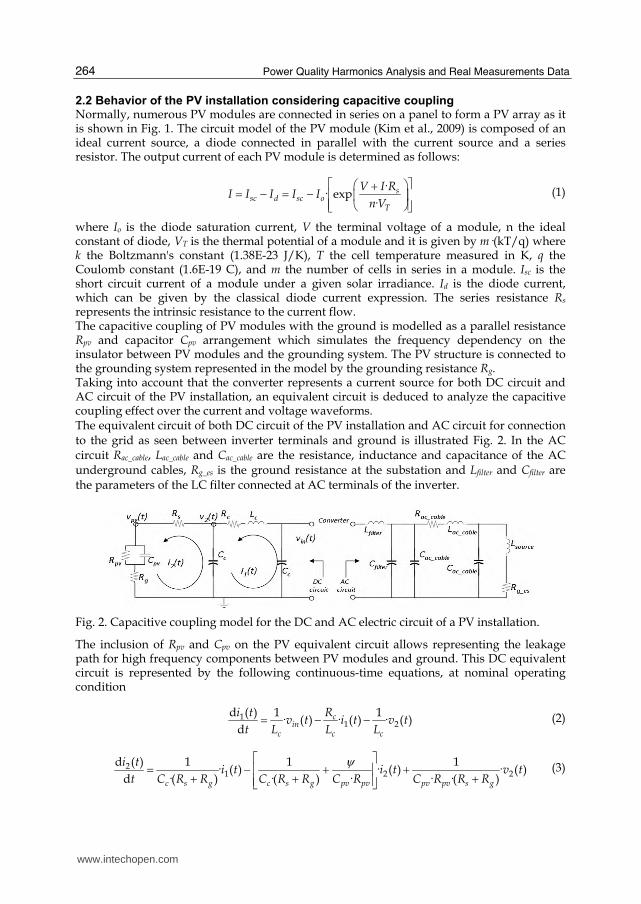
where Io is the diode saturation current, V the terminal voltage of a module, n the ideal constant of diode, VT is the thermal potential of a module and it is given by m·(kT/q) where k the Boltzmann's constant (1.38E-23 J/K), T the cell temperature measured in K, q the Coulomb constant (1.6E-19 C), and m the number of cells in series in a module. Isc is the short circuit current of a module under a given solar irradiance. Id is the diode current, which can be given by the classical diode current expression. The series resistance Rs represents the intrinsic resistance to the current flow. The capacitive coupling of PV modules with the ground is modelled as a parallel resistance Rpv and capacitor Cpv arrangement which simulates the frequency dependency on the insulator between PV modules and the grounding system. The PV structure is connected to the grounding system represented in the model by the grounding resistance Rg. Taking into account that the converter represents a current source for both DC circuit and AC circuit of the PV installation, an equivalent circuit is deduced to analyze the capacitive coupling effect over the current and voltage waveforms. The equivalent circuit of both DC circuit of the PV installation and AC circuit for connection to the grid as seen between inverter terminals and ground is illustrated Fig. 2. In the AC circuit Rac_cable, Lac_cable and Cac_cable are the resistance, inductance and capacitance of the AC underground cables, Rg_es is the ground resistance at the substation and Lfilter and Cfilter are the parameters of the LC filter connected at AC terminals of the inverter.
Fig. 2. Capacitive coupling model for the DC and AC electric circuit of a PV installation.
The inclusion of Rpv and Cpv on the PV equivalent circuit allows representing the leakage path for high frequency components between PV modules and ground. This DC equivalent circuit is represented by the following continuous-time equations, at nominal operating condition
11 2
d ( ) 1 1· ( ) · ( ) · ( )
dc
inc c c
Ri tv t i t v t
t L L L (2)
21 2 2
d ( ) 1 1 1· ( ) · ( ) · ( )
d ·( ) ·( ) · · ·( )c s g c s g pv pv pv pv s g
i ti t i t v t
t C R R C R R C R C R R R
(3)
www.intechopen.com
Harmonic Distortion in Renewable Energy Systems: Capacitive Couplings
265
21 2
d ( ) 1 1· ( ) · ( )
d c c
v ti t i t
t C C (4)
1 2
2
d ( ) ·· ( ) · ( )
d ·( ) · ·( ) ·
1· ( ) · ( )
· ·( ) ·
pv g pv g g g
c s g pv pv c s g pv pv
gpv
pv pv s g pv pv
v t R R R R Ri t i t
t C R R C R C R R C R
Rv t v t
C R R R C R
(5)
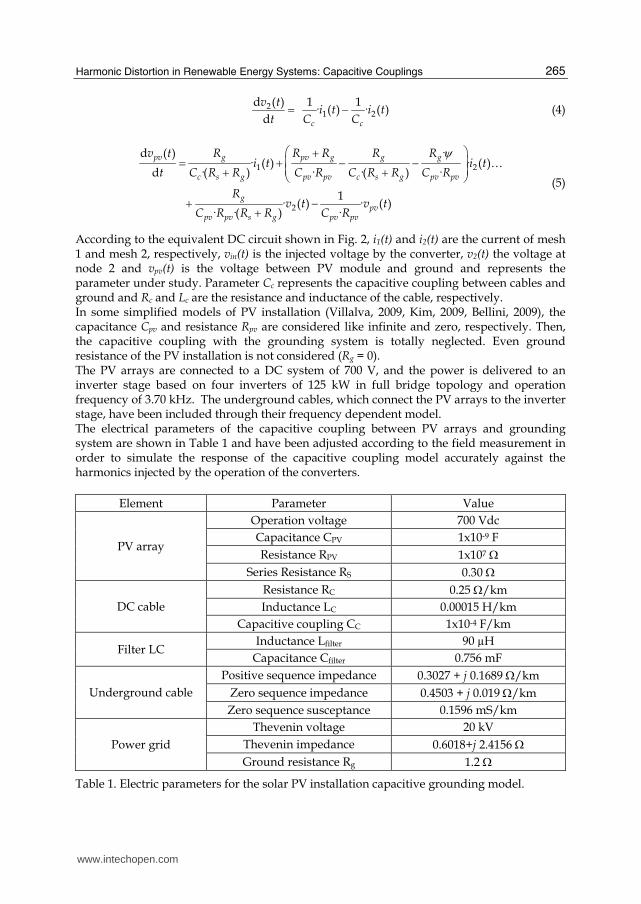
According to the equivalent DC circuit shown in Fig. 2, i1(t) and i2(t) are the current of mesh 1 and mesh 2, respectively, vin(t) is the injected voltage by the converter, v2(t) the voltage at node 2 and vpv(t) is the voltage between PV module and ground and represents the parameter under study. Parameter Cc represents the capacitive coupling between cables and ground and Rc and Lc are the resistance and inductance of the cable, respectively. In some simplified models of PV installation (Villalva, 2009, Kim, 2009, Bellini, 2009), the capacitance Cpv and resistance Rpv are considered like infinite and zero, respectively. Then, the capacitive coupling with the grounding system is totally neglected. Even ground resistance of the PV installation is not considered (Rg = 0). The PV arrays are connected to a DC system of 700 V, and the power is delivered to an inverter stage based on four inverters of 125 kW in full bridge topology and operation frequency of 3.70 kHz. The underground cables, which connect the PV arrays to the inverter stage, have been included through their frequency dependent model. The electrical parameters of the capacitive coupling between PV arrays and grounding system are shown in Table 1 and have been adjusted according to the field measurement in order to simulate the response of the capacitive coupling model accurately against the harmonics injected by the operation of the converters.
Element Parameter Value
PV array
Operation voltage 700 Vdc
Capacitance CPV 1x10⁻⁹ F
Resistance RPV 1x10⁷
Series Resistance RS 0.30
DC cable
Resistance RC 0.25 /km
Inductance LC 0.00015 H/km
Capacitive coupling CC 1x10⁻⁴ F/km
Filter LC Inductance Lfilter 90 µH
Capacitance Cfilter 0.756 mF
Underground cable
Positive sequence impedance 0.3027 + j 0.1689 /km
Zero sequence impedance 0.4503 + j 0.019 /km
Zero sequence susceptance 0.1596 mS/km
Power grid
Thevenin voltage 20 kV
Thevenin impedance 0.6018+j 2.4156
Ground resistance Rg 1.2
Table 1. Electric parameters for the solar PV installation capacitive grounding model.
www.intechopen.com
Power Quality Harmonics Analysis and Real Measurements Data
266
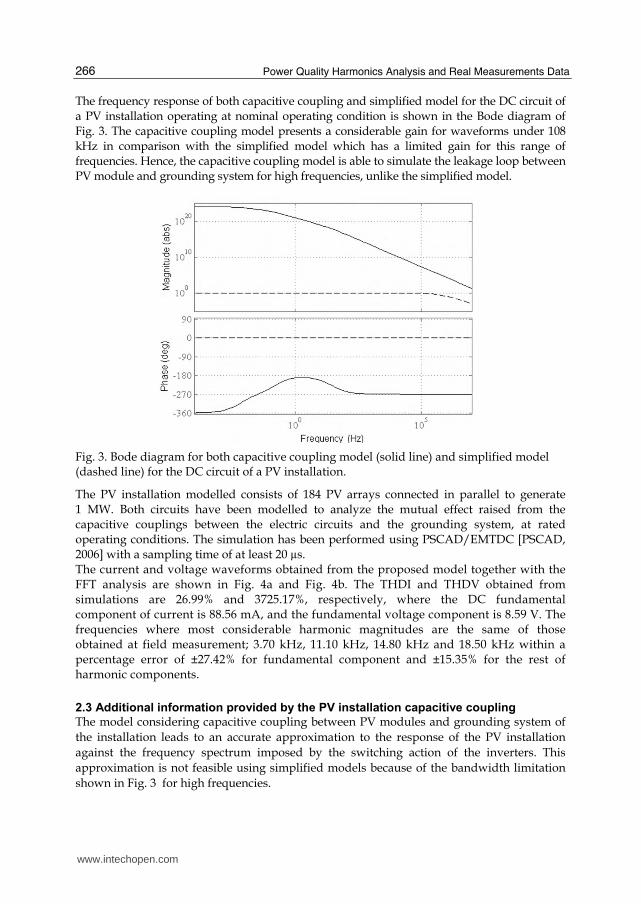
The frequency response of both capacitive coupling and simplified model for the DC circuit of a PV installation operating at nominal operating condition is shown in the Bode diagram of Fig. 3. The capacitive coupling model presents a considerable gain for waveforms under 108 kHz in comparison with the simplified model which has a limited gain for this range of frequencies. Hence, the capacitive coupling model is able to simulate the leakage loop between PV module and grounding system for high frequencies, unlike the simplified model.
Fig. 3. Bode diagram for both capacitive coupling model (solid line) and simplified model (dashed line) for the DC circuit of a PV installation.
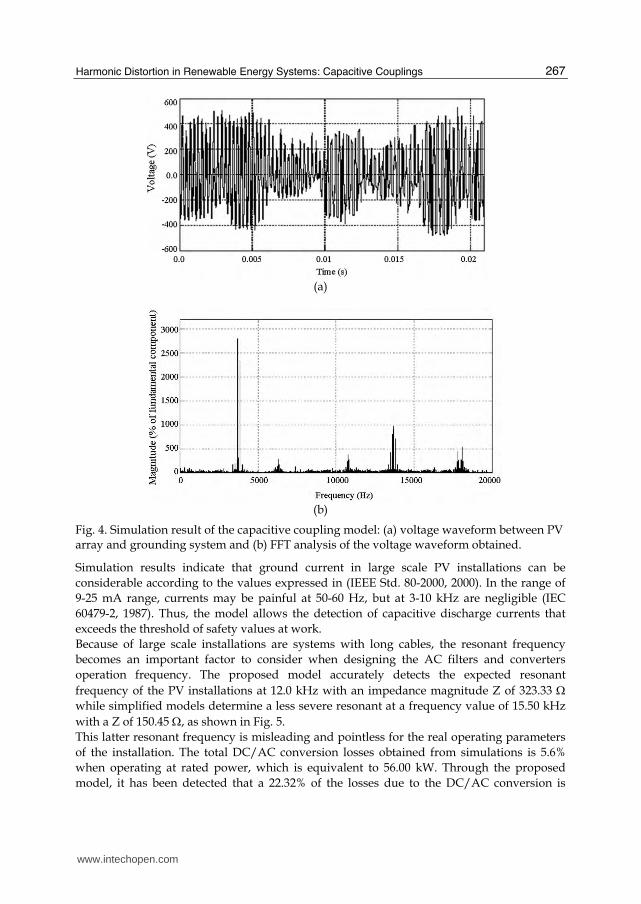
The PV installation modelled consists of 184 PV arrays connected in parallel to generate 1 MW. Both circuits have been modelled to analyze the mutual effect raised from the capacitive couplings between the electric circuits and the grounding system, at rated operating conditions. The simulation has been performed using PSCAD/EMTDC [PSCAD, 2006] with a sampling time of at least 20 µs. The current and voltage waveforms obtained from the proposed model together with the FFT analysis are shown in Fig. 4a and Fig. 4b. The THDI and THDV obtained from simulations are 26.99% and 3725.17%, respectively, where the DC fundamental component of current is 88.56 mA, and the fundamental voltage component is 8.59 V. The frequencies where most considerable harmonic magnitudes are the same of those obtained at field measurement; 3.70 kHz, 11.10 kHz, 14.80 kHz and 18.50 kHz within a percentage error of ±27.42% for fundamental component and ±15.35% for the rest of harmonic components.
2.3 Additional information provided by the PV installation capacitive coupling
The model considering capacitive coupling between PV modules and grounding system of
the installation leads to an accurate approximation to the response of the PV installation
against the frequency spectrum imposed by the switching action of the inverters. This
approximation is not feasible using simplified models because of the bandwidth limitation
shown in Fig. 3 for high frequencies.
www.intechopen.com
Harmonic Distortion in Renewable Energy Systems: Capacitive Couplings
267
(a)
(b)
Fig. 4. Simulation result of the capacitive coupling model: (a) voltage waveform between PV array and grounding system and (b) FFT analysis of the voltage waveform obtained.
Simulation results indicate that ground current in large scale PV installations can be
considerable according to the values expressed in (IEEE Std. 80-2000, 2000). In the range of
9-25 mA range, currents may be painful at 50-60 Hz, but at 3-10 kHz are negligible (IEC
60479-2, 1987). Thus, the model allows the detection of capacitive discharge currents that
exceeds the threshold of safety values at work.
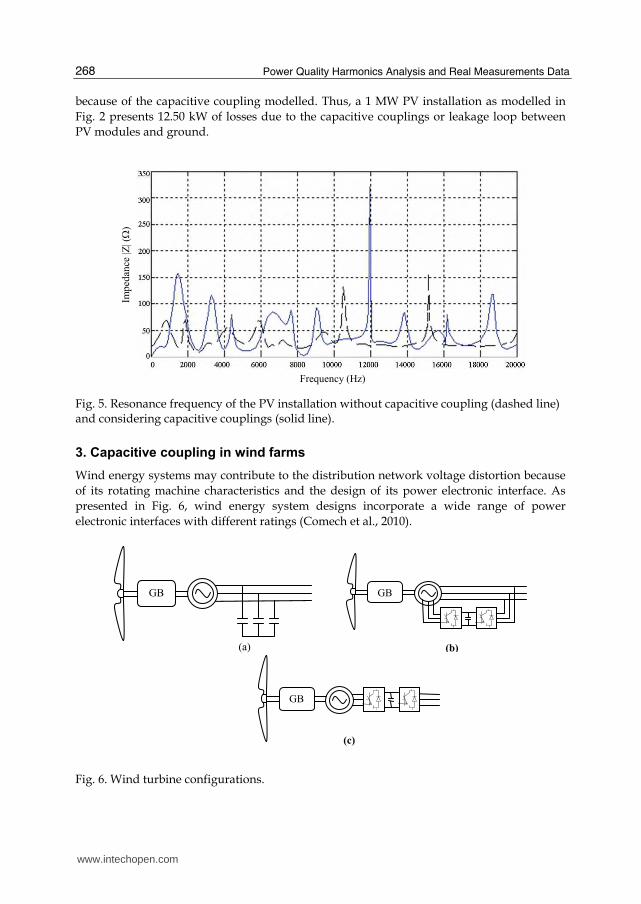
Because of large scale installations are systems with long cables, the resonant frequency
becomes an important factor to consider when designing the AC filters and converters
operation frequency. The proposed model accurately detects the expected resonant
frequency of the PV installations at 12.0 kHz with an impedance magnitude Z of 323.33
while simplified models determine a less severe resonant at a frequency value of 15.50 kHz
with a Z of 150.45 , as shown in Fig. 5.
This latter resonant frequency is misleading and pointless for the real operating parameters
of the installation. The total DC/AC conversion losses obtained from simulations is 5.6%
when operating at rated power, which is equivalent to 56.00 kW. Through the proposed
model, it has been detected that a 22.32% of the losses due to the DC/AC conversion is
www.intechopen.com
Power Quality Harmonics Analysis and Real Measurements Data
268
because of the capacitive coupling modelled. Thus, a 1 MW PV installation as modelled in
Fig. 2 presents 12.50 kW of losses due to the capacitive couplings or leakage loop between
PV modules and ground.
Imp
edan
ce|Z
| ()
Frequency (Hz)
Fig. 5. Resonance frequency of the PV installation without capacitive coupling (dashed line) and considering capacitive couplings (solid line).
3. Capacitive coupling in wind farms
Wind energy systems may contribute to the distribution network voltage distortion because
of its rotating machine characteristics and the design of its power electronic interface. As
presented in Fig. 6, wind energy system designs incorporate a wide range of power
electronic interfaces with different ratings (Comech et al., 2010).
Fig. 6. Wind turbine configurations.
(b)
GB
(a)
GB
GB
(c)
www.intechopen.com
Harmonic Distortion in Renewable Energy Systems: Capacitive Couplings
269
Fig. 6a shows the fixed-speed wind turbine with asynchronous squirrel cage induction
generator (SCIG) directly connected to the grid via transformer. Fig. 6b represents the
limited variable speed wind turbine with a wound rotor induction generator and partial
scale frequency converter on the rotor circuit known as doubly fed induction generator
(DFIG). Fig. 6c shows the full variable speed wind turbine, with the generator connected to
the grid through a full-scale frequency converter.
These power electronic interfaces are rated as a percentage of the machine power, hence
larger systems are accountable for higher distortions. Recent investigations based on wind
energy systems suggests that frequency converters (with a typical pulse width modulated
with 2.5 kHz of switching frequency) can, in fact, cause harmonics in the line current,
leading to harmonic voltages in the network (Conroy & Watson, 2009).
Moreover, most simplified models of wind farms consider a simple series impedance model
for underground cables that connect wind turbines with the network grid. Thus, capacitive
couplings with ground through cables are not considered for different frequencies
components.
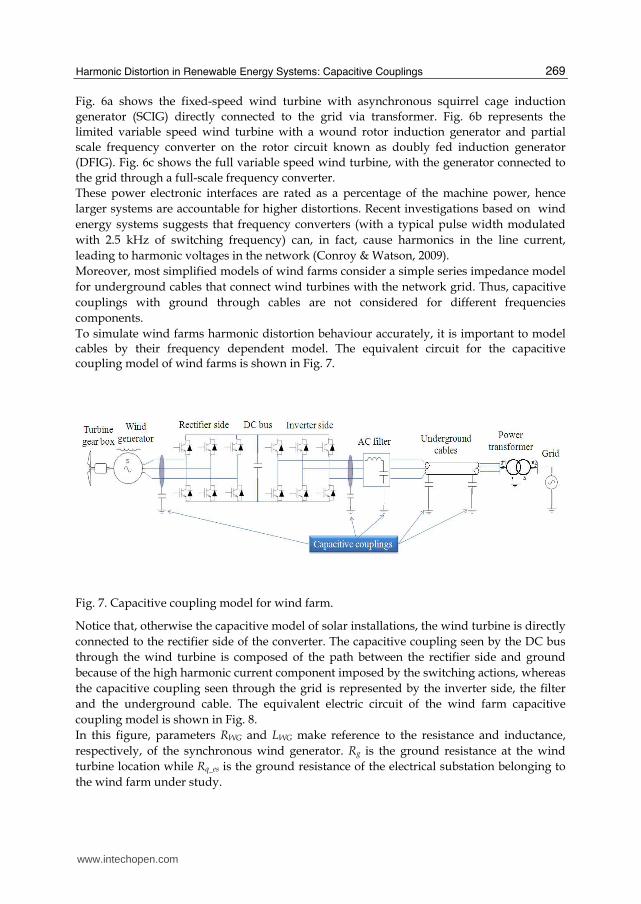
To simulate wind farms harmonic distortion behaviour accurately, it is important to model cables by their frequency dependent model. The equivalent circuit for the capacitive coupling model of wind farms is shown in Fig. 7.
Fig. 7. Capacitive coupling model for wind farm.
Notice that, otherwise the capacitive model of solar installations, the wind turbine is directly
connected to the rectifier side of the converter. The capacitive coupling seen by the DC bus
through the wind turbine is composed of the path between the rectifier side and ground
because of the high harmonic current component imposed by the switching actions, whereas
the capacitive coupling seen through the grid is represented by the inverter side, the filter
and the underground cable. The equivalent electric circuit of the wind farm capacitive
coupling model is shown in Fig. 8.
In this figure, parameters RWG and LWG make reference to the resistance and inductance,
respectively, of the synchronous wind generator. Rg is the ground resistance at the wind
turbine location while Rq_es is the ground resistance of the electrical substation belonging to
the wind farm under study.
www.intechopen.com
Power Quality Harmonics Analysis and Real Measurements Data
270
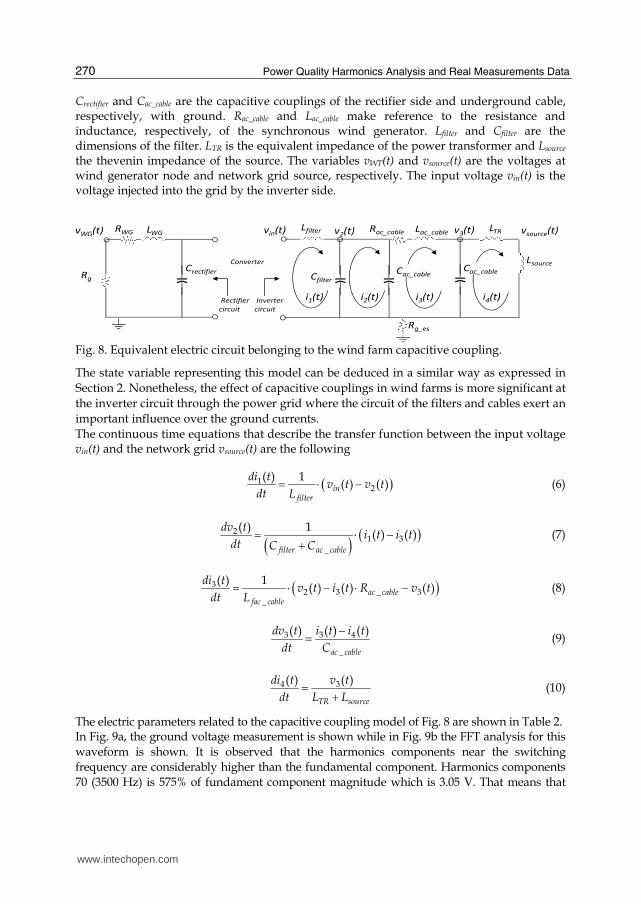
Crectifier and Cac_cable are the capacitive couplings of the rectifier side and underground cable, respectively, with ground. Rac_cable and Lac_cable make reference to the resistance and inductance, respectively, of the synchronous wind generator. Lfilter and Cfilter are the dimensions of the filter. LTR is the equivalent impedance of the power transformer and Lsource the thevenin impedance of the source. The variables vWT(t) and vsource(t) are the voltages at wind generator node and network grid source, respectively. The input voltage vin(t) is the voltage injected into the grid by the inverter side.
Rg_es
Rg
RWG LWG
Crectifier
Lfilter Rac_cable Lac_cable
LsourceConverter
Rectifier
circuit
Inverter
circuit
vin(t)
i3(t)
vWG(t)LTR vsource(t)
i4(t)i1(t)
Cfilter
i2(t)
Cac_cableCac_cable
v2(t) v3(t)
Fig. 8. Equivalent electric circuit belonging to the wind farm capacitive coupling.
The state variable representing this model can be deduced in a similar way as expressed in
Section 2. Nonetheless, the effect of capacitive couplings in wind farms is more significant at
the inverter circuit through the power grid where the circuit of the filters and cables exert an
important influence over the ground currents.
The continuous time equations that describe the transfer function between the input voltage vin(t) and the network grid vsource(t) are the following
12
( ) 1( ) ( )in
filter
di tv t v t
dt L (6)
21 3
_
( ) 1( ) ( )
filter ac cable
dv ti t i t
dt C C (7)
32 3 _ 3
_
( ) 1( ) ( ) ( )ac cable
fac cable
di tv t i t R v t
dt L (8)
3 3 4
_
( ) ( ) ( )
ac cable
dv t i t i t
dt C
(9)
34 ( )( )
TR source
v tdi t
dt L L (10)
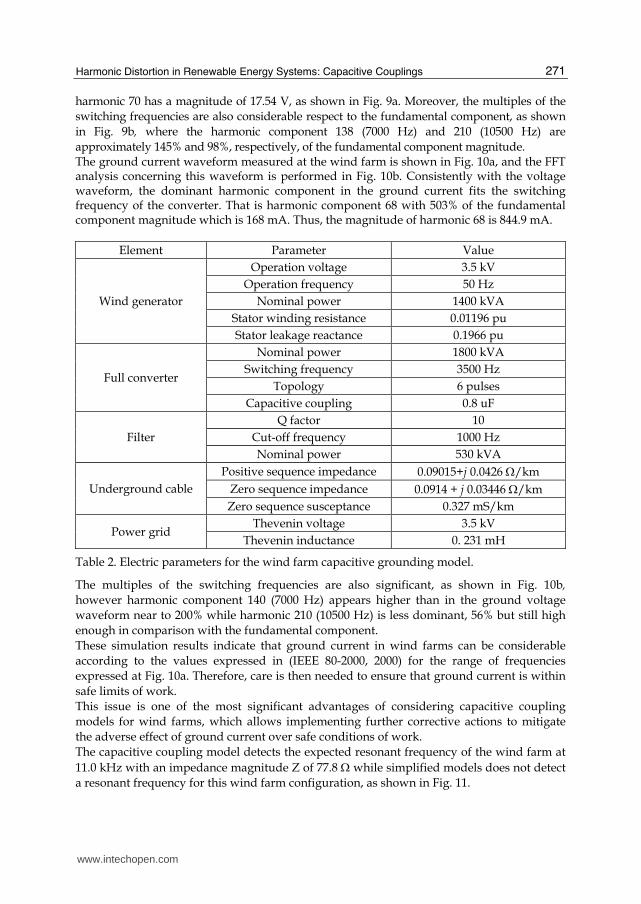
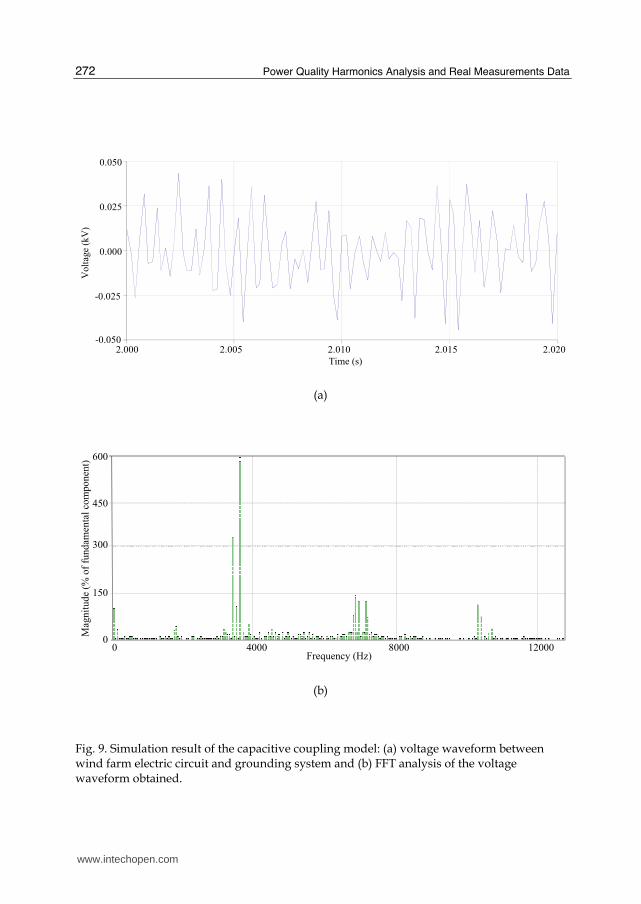
The electric parameters related to the capacitive coupling model of Fig. 8 are shown in Table 2. In Fig. 9a, the ground voltage measurement is shown while in Fig. 9b the FFT analysis for this
waveform is shown. It is observed that the harmonics components near the switching
frequency are considerably higher than the fundamental component. Harmonics components
70 (3500 Hz) is 575% of fundament component magnitude which is 3.05 V. That means that
www.intechopen.com
Harmonic Distortion in Renewable Energy Systems: Capacitive Couplings
271
harmonic 70 has a magnitude of 17.54 V, as shown in Fig. 9a. Moreover, the multiples of the
switching frequencies are also considerable respect to the fundamental component, as shown
in Fig. 9b, where the harmonic component 138 (7000 Hz) and 210 (10500 Hz) are
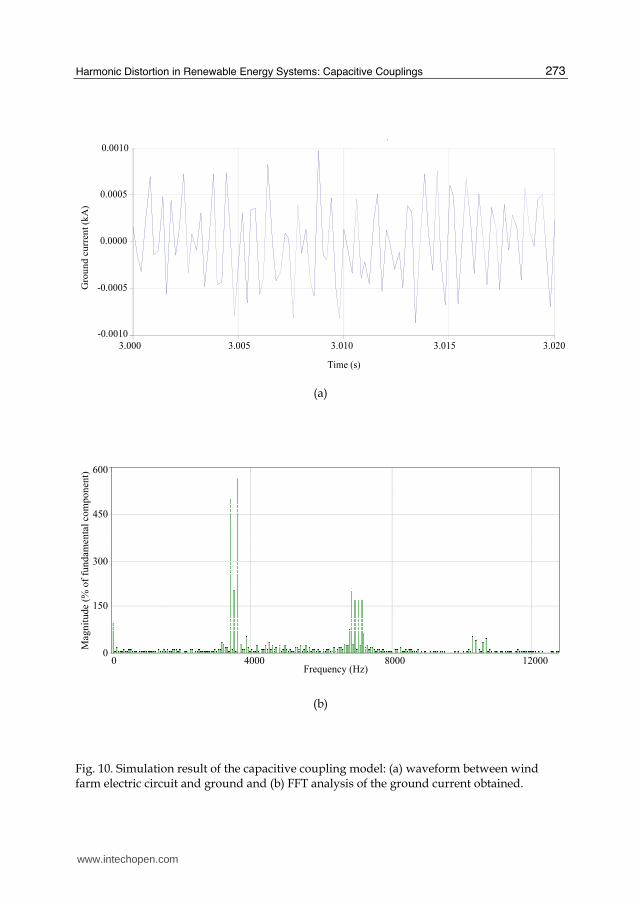
approximately 145% and 98%, respectively, of the fundamental component magnitude. The ground current waveform measured at the wind farm is shown in Fig. 10a, and the FFT analysis concerning this waveform is performed in Fig. 10b. Consistently with the voltage waveform, the dominant harmonic component in the ground current fits the switching frequency of the converter. That is harmonic component 68 with 503% of the fundamental component magnitude which is 168 mA. Thus, the magnitude of harmonic 68 is 844.9 mA.
Element Parameter Value
Wind generator
Operation voltage 3.5 kV
Operation frequency 50 Hz
Nominal power 1400 kVA
Stator winding resistance 0.01196 pu
Stator leakage reactance 0.1966 pu
Full converter
Nominal power 1800 kVA
Switching frequency 3500 Hz
Topology 6 pulses
Capacitive coupling 0.8 uF
Filter
Q factor 10
Cut-off frequency 1000 Hz
Nominal power 530 kVA
Underground cable
Positive sequence impedance 0.09015+j 0.0426 /km
Zero sequence impedance 0.0914 + j 0.03446 /km
Zero sequence susceptance 0.327 mS/km
Power grid Thevenin voltage 3.5 kV
Thevenin inductance 0. 231 mH
Table 2. Electric parameters for the wind farm capacitive grounding model.
The multiples of the switching frequencies are also significant, as shown in Fig. 10b,
however harmonic component 140 (7000 Hz) appears higher than in the ground voltage
waveform near to 200% while harmonic 210 (10500 Hz) is less dominant, 56% but still high
enough in comparison with the fundamental component.
These simulation results indicate that ground current in wind farms can be considerable
according to the values expressed in (IEEE 80-2000, 2000) for the range of frequencies
expressed at Fig. 10a. Therefore, care is then needed to ensure that ground current is within
safe limits of work.
This issue is one of the most significant advantages of considering capacitive coupling
models for wind farms, which allows implementing further corrective actions to mitigate
the adverse effect of ground current over safe conditions of work.
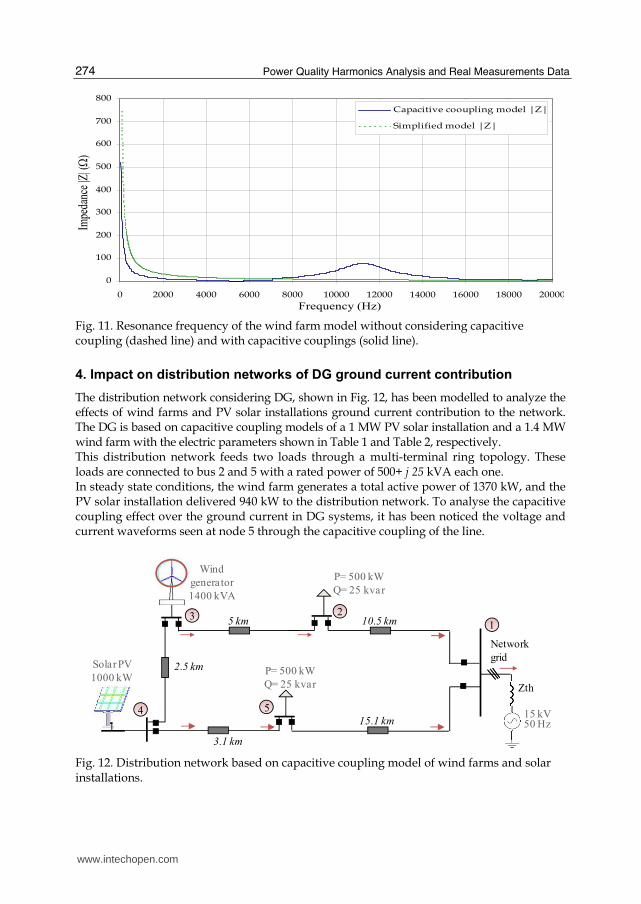
The capacitive coupling model detects the expected resonant frequency of the wind farm at
11.0 kHz with an impedance magnitude Z of 77.8 while simplified models does not detect
a resonant frequency for this wind farm configuration, as shown in Fig. 11.
www.intechopen.com
Power Quality Harmonics Analysis and Real Measurements Data
272
2.000 2.005 2.010 2.015 2.020-0.050
-0.025
0.000
0.025
0.050
Volt
age
(kV
)
Time (s)
(a)
Mag
nit
ud
e(%
of
fund
amen
tal
com
po
nen
t)
Frequency (Hz)0 4000 8000 12000
600
450
300
150
0
(b)
Fig. 9. Simulation result of the capacitive coupling model: (a) voltage waveform between wind farm electric circuit and grounding system and (b) FFT analysis of the voltage waveform obtained.
www.intechopen.com
Harmonic Distortion in Renewable Energy Systems: Capacitive Couplings
273
3.000 3.005 3.010 3.015 3.020
-0.0010
-0.0005
0.0000
0.0005
0.0010
Gro
un
dcu
rren
t(k
A)
Time (s)
(a)
Mag
nit
ude
(% o
f fu
ndam
enta
l com
pon
ent)
Frequency (Hz)0 4000 8000 12000
600
450
300
150
0
(b)
Fig. 10. Simulation result of the capacitive coupling model: (a) waveform between wind farm electric circuit and ground and (b) FFT analysis of the ground current obtained.
www.intechopen.com
Power Quality Harmonics Analysis and Real Measurements Data
Fig. 11. Resonance frequency of the wind farm model without considering capacitive coupling (dashed line) and with capacitive couplings (solid line).
4. Impact on distribution networks of DG ground current contribution
The distribution network considering DG, shown in Fig. 12, has been modelled to analyze the effects of wind farms and PV solar installations ground current contribution to the network. The DG is based on capacitive coupling models of a 1 MW PV solar installation and a 1.4 MW wind farm with the electric parameters shown in Table 1 and Table 2, respectively. This distribution network feeds two loads through a multi-terminal ring topology. These loads are connected to bus 2 and 5 with a rated power of 500+ j 25 kVA each one. In steady state conditions, the wind farm generates a total active power of 1370 kW, and the PV solar installation delivered 940 kW to the distribution network. To analyse the capacitive coupling effect over the ground current in DG systems, it has been noticed the voltage and current waveforms seen at node 5 through the capacitive coupling of the line.
15 kV50 Hz
Zth
Network
grid
5 km
3.1 km
Solar PV
1000 kW
Wind
generator
1400 kVA
P= 500 kW
Q= 25 kvar
P= 500 kW
Q= 25 kvar
3 2
4 5
2.5 km
10.5 km
15.1 km
1
Fig. 12. Distribution network based on capacitive coupling model of wind farms and solar installations.
www.intechopen.com
Harmonic Distortion in Renewable Energy Systems: Capacitive Couplings
275
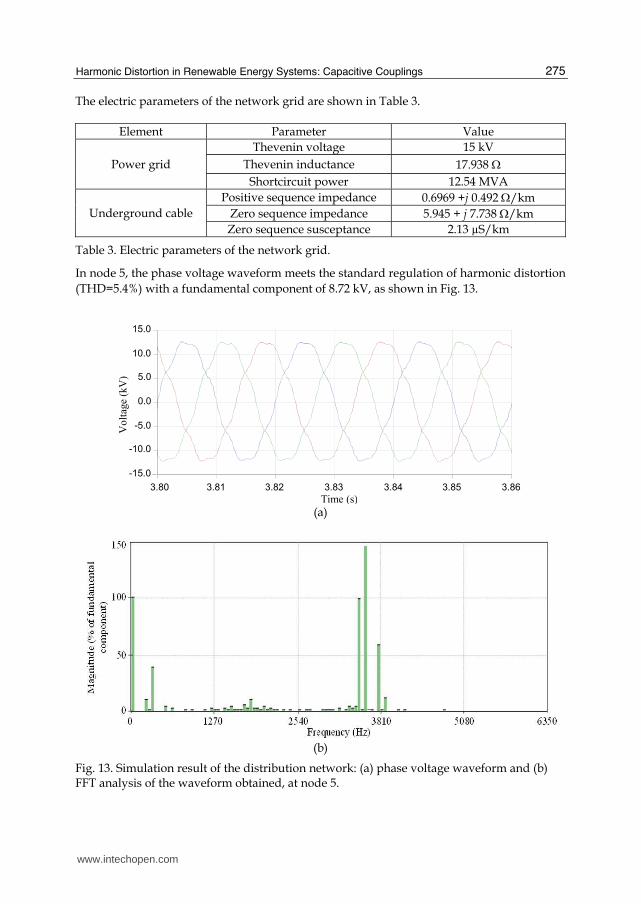
The electric parameters of the network grid are shown in Table 3.
Element Parameter Value
Power grid
Thevenin voltage 15 kV
Thevenin inductance 17.938
Shortcircuit power 12.54 MVA
Underground cable
Positive sequence impedance 0.6969 +j 0.492 /km
Zero sequence impedance 5.945 + j 7.738 /km
Zero sequence susceptance 2.13 µS/km
Table 3. Electric parameters of the network grid.
In node 5, the phase voltage waveform meets the standard regulation of harmonic distortion
(THD=5.4%) with a fundamental component of 8.72 kV, as shown in Fig. 13.
3.80 3.81 3.82 3.83 3.84 3.85 3.86
-15.0
-10.0
-5.0
0.0
5.0
10.0
15.0
Vo
ltag
e(k
V)
Time (s)
(a)
(b)
Fig. 13. Simulation result of the distribution network: (a) phase voltage waveform and (b) FFT analysis of the waveform obtained, at node 5.
www.intechopen.com
Power Quality Harmonics Analysis and Real Measurements Data
276
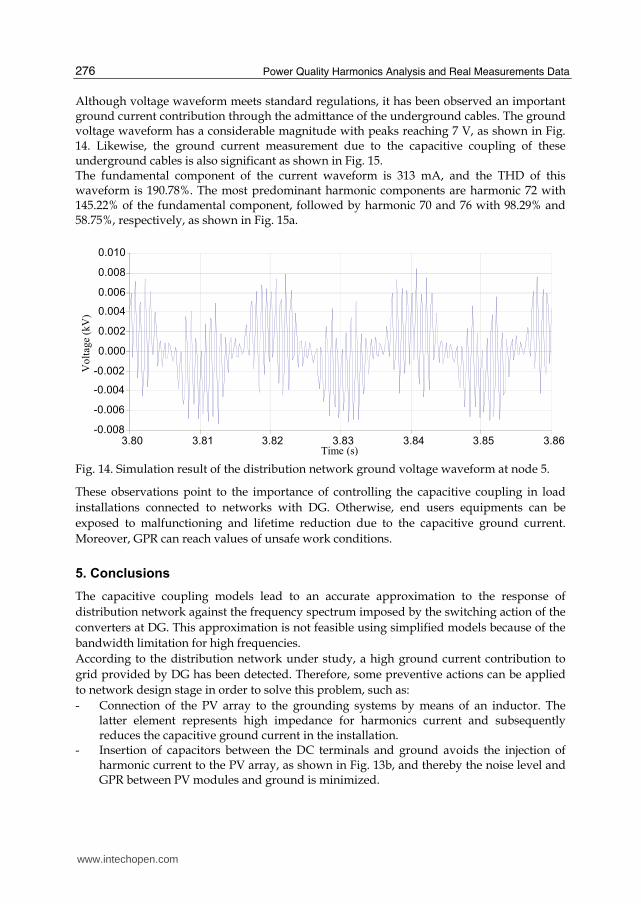
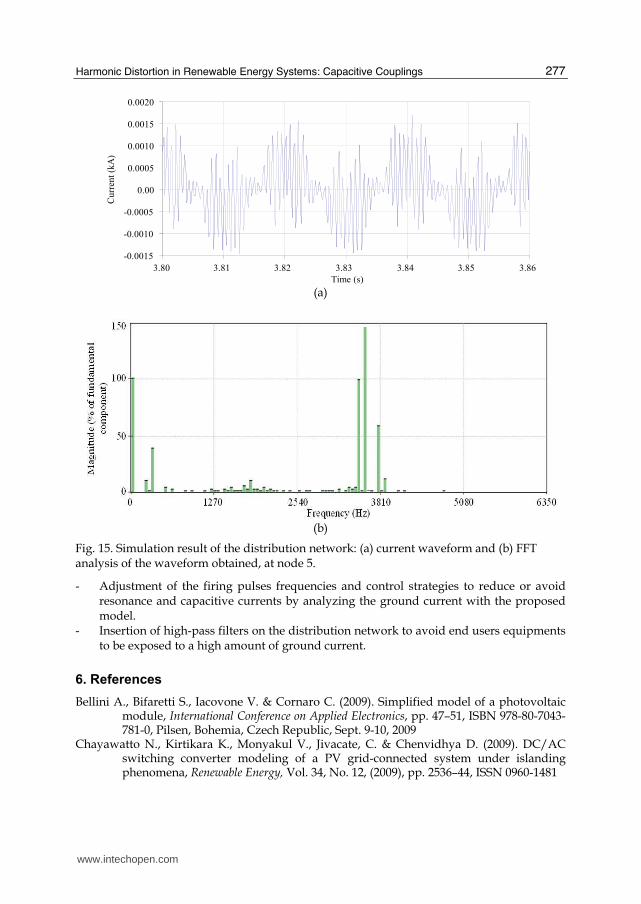
Although voltage waveform meets standard regulations, it has been observed an important ground current contribution through the admittance of the underground cables. The ground voltage waveform has a considerable magnitude with peaks reaching 7 V, as shown in Fig. 14. Likewise, the ground current measurement due to the capacitive coupling of these underground cables is also significant as shown in Fig. 15. The fundamental component of the current waveform is 313 mA, and the THD of this waveform is 190.78%. The most predominant harmonic components are harmonic 72 with 145.22% of the fundamental component, followed by harmonic 70 and 76 with 98.29% and 58.75%, respectively, as shown in Fig. 15a.
3.80 3.81 3.82 3.83 3.84 3.85 3.86
-0.008
-0.006
-0.004
-0.002
0.000
0.002
0.004
0.006
0.008
0.010
Vo
ltag
e(k
V)
Time (s)
Fig. 14. Simulation result of the distribution network ground voltage waveform at node 5.
These observations point to the importance of controlling the capacitive coupling in load
installations connected to networks with DG. Otherwise, end users equipments can be
exposed to malfunctioning and lifetime reduction due to the capacitive ground current.
Moreover, GPR can reach values of unsafe work conditions.
5. Conclusions
The capacitive coupling models lead to an accurate approximation to the response of
distribution network against the frequency spectrum imposed by the switching action of the
converters at DG. This approximation is not feasible using simplified models because of the
bandwidth limitation for high frequencies.
According to the distribution network under study, a high ground current contribution to
grid provided by DG has been detected. Therefore, some preventive actions can be applied
to network design stage in order to solve this problem, such as:
- Connection of the PV array to the grounding systems by means of an inductor. The latter element represents high impedance for harmonics current and subsequently reduces the capacitive ground current in the installation.
- Insertion of capacitors between the DC terminals and ground avoids the injection of harmonic current to the PV array, as shown in Fig. 13b, and thereby the noise level and GPR between PV modules and ground is minimized.
www.intechopen.com
Harmonic Distortion in Renewable Energy Systems: Capacitive Couplings
277
3.80 3.81 3.82 3.83 3.84 3.85 3.86
-0.0015
-0.0010
-0.0005
0.00
0.0005
0.0010
0.0015
0.0020 C
urr
ent
(kA
)
Time (s) (a)
(b)
Fig. 15. Simulation result of the distribution network: (a) current waveform and (b) FFT analysis of the waveform obtained, at node 5.
- Adjustment of the firing pulses frequencies and control strategies to reduce or avoid resonance and capacitive currents by analyzing the ground current with the proposed model.
- Insertion of high-pass filters on the distribution network to avoid end users equipments to be exposed to a high amount of ground current.
6. References
Bellini A., Bifaretti S., Iacovone V. & Cornaro C. (2009). Simplified model of a photovoltaic module, International Conference on Applied Electronics, pp. 47–51, ISBN 978-80-7043-781-0, Pilsen, Bohemia, Czech Republic, Sept. 9-10, 2009
Chayawatto N., Kirtikara K., Monyakul V., Jivacate, C. & Chenvidhya D. (2009). DC/AC switching converter modeling of a PV grid-connected system under islanding phenomena, Renewable Energy, Vol. 34, No. 12, (2009), pp. 2536–44, ISSN 0960-1481
www.intechopen.com
Power Quality Harmonics Analysis and Real Measurements Data
278
Chicco G., Schlabbach J. & Spertino F., (2009). Experimental assessment of the waveform distortion in grid-connected photovoltaic installations, Solar Energy, Vol. 83, No. 1, pp.1026–39, (2009), ISSN 0038-092X
Comech, M.P., García-Gracia, M., Borroy, S., Villén, M.T. (2010). Protection in Distributed Generation, In: Distributed Generation, D. N. Gaonkar, pp. 289-310, In-Teh, ISBN 978-953-307-046-9, Olajnica, Vukovar, Croatia
Conroy, J. & Watson, R. (2009). Aggregate modelling of wind farms containing full-converter wind turbine generators with permanent magnet synchronous machines: transient stability studies, IET Renewable Power Generation, Vol. 3, No. 1, (2009), pp. 39–52, ISSN 1752-1424
Dugan, R. C., McGranaghan, M. F., Santoso, S. & Wayne Beaty, H. (2002). Electrical Power Systems Quality, McGraw-Hill, (2nd Ed.), ISBN 0-07-138622-X, New York, USA
García-Gracia, M., El Halabi, N., Khodr, H.M. & Sanz, J. F. (2010). Improvement of large scale solar installation model for ground current analysis, Applied Energy, Vol. 87, No. 11, (2010), pp. 3467-3474, ISSN 0306-2619
IEC 60479-2 (1987). Effect of current passing through human body. Part II: special aspects. The International Electrotechnical Commission, 1987.
IEC Std. 61000-4-7 (2002). Electromagnetic compatibility (EMC). Part 4-7: Testing and measurement techniques. General guide on harmonics and interharmonics measurements and instrumentation for power supply and equipment connected thereto, International Electrotechnical Commission, (2002)
IEC Std. 61400-21 (2008), Wind turbines. Part 21: Measurement and assessment of power quality characteristics of grid connected wind turbine, International Electrotechnical Commission, (2008).
IEEE Std 519-1992 (1992). (1992). IEEE recommended practices and requirements for harmonic control in electrical power systems, Power Engineering Society, 1992
IEEE Std. 80-2000 (2000). IEEE guide for safety in AC substation grounding, IEEE Power Engineering Society, 2000
Iliceto A. & Vigotti R. (1998). The largest PV installation in Europe: perspectives of multimegawatt PV, Renewable Energy, Vol. 15, No. 1-4, (1998), pp. 48–53, ISSN 0960-1481
Kim S-K., Jeon J-H., Cho C-H., Kim E-S., Ahn J-B. (2009). Modelling and simulation of a grid-connected PV generation system for electromagnetic transient analysis, Solar Energy, Vol. 83, No. 5, (2009), pp. 664–78, ISSN 0038-092X
Luna, A., De Araujo, F., Santos, D., Rodriguez, P., Watanabe, E. & Arnaltes, S. (2011). Simplified Modeling of a DFIG for Transient Studies in Wind Power Applications, IEEE Transactions on Industrial Electronics, Vol. 58, No. 1, (2011), pp. 9–20, ISSN 0278-0046
Sukamongkol SCY & Ongsakul W. (2002), A simulation model for predicting the performance of a solar photovoltaic system with alternating current loads, Renewable Energy, Vol. 27, No. 2, pp. 237–58, (2002), ISSN 0960-1481
Villalva M., Gazoli J, Filho E. (2009), Comprehensive approach to modeling and simulation of photovoltaic arrays, IEEE Transactions Power Electronics, Vol. 24, No. 5, pp. 1198–208, (2009), ISSN 0885-8993
Zhou, W., Lou, C., Li, Z., Lu, L., & Yang, H. (2010). Current status of research on optimum sizing of stand-alone hybrid solar-wind power generation systems, Applied Energy, Vol. 87, No. 2, pp. 380–389, ISSN 0306-2619
www.intechopen.com
Power Quality Harmonics Analysis and Real Measurements DataEdited by Prof. Gregorio Romero
ISBN 978-953-307-335-4Hard cover, 278 pagesPublisher InTechPublished online 23, November, 2011Published in print edition November, 2011
InTech ChinaUnit 405, Office Block, Hotel Equatorial Shanghai No.65, Yan An Road (West), Shanghai, 200040, China
Phone: +86-21-62489820 Fax: +86-21-62489821
Nowadays, the increasing use of power electronics equipment origins important distortions. The perfect ACpower systems are a pure sinusoidal wave, both voltage and current, but the ever-increasing existence of non-linear loads modify the characteristics of voltage and current from the ideal sinusoidal wave. This deviationfrom the ideal wave is reflected by the harmonics and, although its effects vary depending on the type of load,it affects the efficiency of an electrical system and can cause considerable damage to the systems andinfrastructures. Ensuring optimal power quality after a good design and devices means productivity, efficiency,competitiveness and profitability. Nevertheless, nobody can assure the optimal power quality when there is agood design if the correct testing and working process from the obtained data is not properly assured at everyinstant; this entails processing the real data correctly. In this book the reader will be introduced to theharmonics analysis from the real measurement data and to the study of different industrial environments andelectronic devices.
How to referenceIn order to correctly reference this scholarly work, feel free to copy and paste the following:
Miguel Garcia-Gracia, Nabil El Halabi, Adria n Alonso and M.Paz Comech (2011). Harmonic Distortion inRenewable Energy Systems: Capacitive Couplings, Power Quality Harmonics Analysis and RealMeasurements Data, Prof. Gregorio Romero (Ed.), ISBN: 978-953-307-335-4, InTech, Available from:http://www.intechopen.com/books/power-quality-harmonics-analysis-and-real-measurements-data/harmonic-distortion-in-renewable-energy-systems-capacitive-couplings