20
Harmonization of CBC evaluation criteria for European EQAS Mohamed Rida Soumali 1

Harmonization of CBC evaluation criteria
for European EQAS
Mohamed Rida Soumali
1
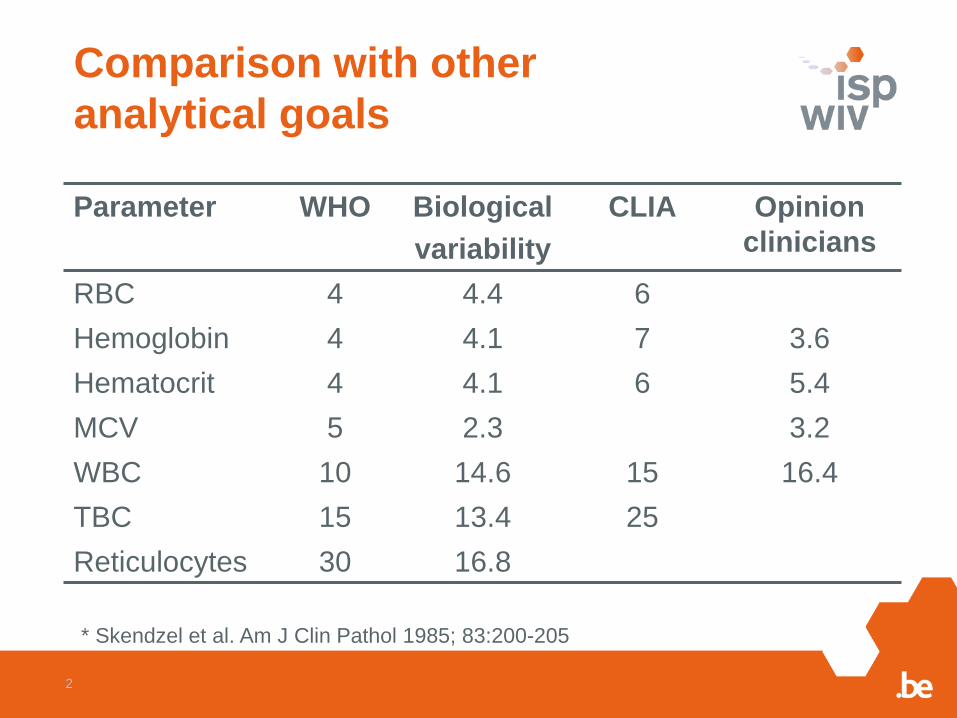
Parameter WHO Biological
variability
CLIA Opinion
clinicians
RBC 4 4.4 6
Hemoglobin 4 4.1 7 3.6
Hematocrit 4 4.1 6 5.4
MCV 5 2.3 3.2
WBC 10 14.6 15 16.4
TBC 15 13.4 25
Reticulocytes 30 16.8
* Skendzel et al. Am J Clin Pathol 1985; 83:200-205
2
Comparison with other
analytical goals

3
435018 data collected from the different EQA
organizers participating in the study.
422454 data left after blank results and rarely
used analysers were removed.
279935 data left after removal of peer groups
with multimodality.
273840 data free from outliers (6095 outliers
were deleted)
Peer groups with at least 10 results (238933
data left)
Data analysis was performed with 238933
results.
Data cleaning and checking

Number of results and samples
per EQA organizer
EQA organizer Number of results Number of samples
ANSM (France) 19030 1 CSCQ (Switzerland) 161267 201
CTCB (France) 4476 8 DEKS (Denmark) 680 1
PNAEQ (Portugal) 18002 24 SEHH (Spain) 53980 20
UKNEQAS (England) 148834 36 WIV-ISP (Belgium) 16185 10
Total 422454 301
4

Number of analysers and
results per parameter
Parameter Number of analysers Number of results
RBC 128 73404 HCT 140 75179 Hb 144 79025
MCV 138 57659 WBC 133 74445
RETIC(NBR) 41 11300 RETIC(%) 29 5633
TBC 124 45809 Total - 422454
5

Statistical tools
6
Characteristic function
Quantile regression

Characteristic function
0 200 400 600
24
68
TBC
median concentration (10e9/L)
me
dia
n o
f u
-sco
res (
%)
P99 158721.4median 2 9.02
Thompson (2011, 2012)
𝑆𝐷 = 𝛼2 + 𝛽2𝑐𝑜𝑛𝑐𝑒𝑛𝑡𝑟𝑎𝑡𝑖𝑜𝑛2
𝐶𝑉 =𝑆𝐷
𝑐𝑜𝑛𝑐𝑒𝑛𝑡𝑟𝑎𝑡𝑖𝑜𝑛
=𝛼2
𝑐𝑜𝑛𝑐𝑒𝑛𝑡𝑟𝑎𝑡𝑖𝑜𝑛2+ 𝛽2
Determines relation for
low concentrations.
Determines relation for
high concentrations.
7
(*100 to express in %)

Characteristic function:
comments
𝐶𝑉 =𝛼2
𝑐𝑜𝑛𝑐𝑒𝑛𝑡𝑟𝑎𝑡𝑖𝑜𝑛2+ 𝛽2
high
𝛼
𝛽 low
𝛼
𝛽 𝛼 = 0
concentration
CV
concentration
CV
concentration
CV
Curvature depends on 𝛼
𝛽
The higher 𝛼
𝛽, the more curved
(*100 to express in %)
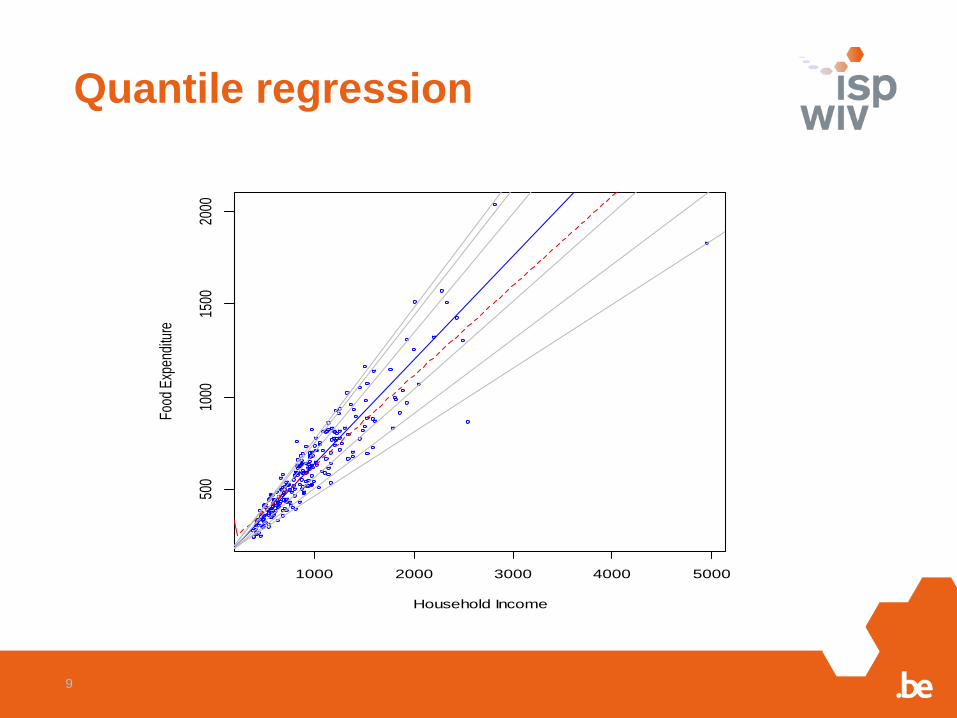
Quantile regression
1000 2000 3000 4000 5000
500
1000
1500
2000
Household Income
Food
Exp
endi
ture
9

Red Blood Cells
10
𝑃99 = 7.11
𝑃95 =49.53
𝑚𝑒𝑑𝑖𝑎𝑛2 + 18.38
𝑃90 =28.82
𝑚𝑒𝑑𝑖𝑎𝑛2 + 11.03
7% for the 99th percentile
5% for the 95th percentile
4% for the 90th percentile

Hemoglobin
11
𝑃99 = 11.77
𝑃95 =285032.4
𝑚𝑒𝑑𝑖𝑎𝑛2 + 29.35
𝑃90 =125771.3
𝑚𝑒𝑑𝑖𝑎𝑛2 + 14.76
12% for the 99th percentile
95th P : 8% for concentrations
above 140g/L and up to 10%
for lower concentrations.
90th P : 5% for concentrations
above 140g/L and up to 7%
for lower concentrations.

Hematocrit
12
𝑃99 =1.18
𝑚𝑒𝑑𝑖𝑎𝑛2 + 53.35
𝑃95 =0.46
𝑚𝑒𝑑𝑖𝑎𝑛2 + 24.67
𝑃90 =0.35
𝑚𝑒𝑑𝑖𝑎𝑛2 + 14.99
9% for the 99th percentile
6% for the 95th percentile
5% for the 90th percentile

White Blood Cells
13
𝑃99 = 25.61
𝑃95 =184.2
𝑚𝑒𝑑𝑖𝑎𝑛2 + 119.78
𝑃90 =66.29
𝑚𝑒𝑑𝑖𝑎𝑛2 + 60.05
26% for the 99th percentile
95th P : 12% for concentrations
above 3.109/L and up to 17% for
lower concentrations.
90th P : 9% for concentrations
above 3.109/L and up to 11% for
lower concentrations.

Thrombocytes
𝑃99 =10044482
𝑚𝑒𝑑𝑖𝑎𝑛2 + 278.42
𝑃95 =3506488
𝑚𝑒𝑑𝑖𝑎𝑛2 + 110.83
𝑃90 =1755171
𝑚𝑒𝑑𝑖𝑎𝑛2 + 69.08
14
99th P : 20% for concentrations
above 300.109/L and up to 70%
for lower concentrations.
95th P : 12% for concentrations
above 300.109/L and up to 43%
for lower concentrations.
90th P : 10% for concentrations
above 300.109/L and up to 28%
for lower concentrations.

MCV
15
𝑃99 =397601
𝑚𝑒𝑑𝑖𝑎𝑛2 − 22.08
𝑃95 =159279.9
𝑚𝑒𝑑𝑖𝑎𝑛2 − 6.38
𝑃90 =90491.66
𝑚𝑒𝑑𝑖𝑎𝑛2 − 2.61

Reticulocytes (% RBC)
16
𝑃99 = 44.09
𝑃95 =334.75
𝑚𝑒𝑑𝑖𝑎𝑛2 + 666.98
𝑃90 =200.03
𝑚𝑒𝑑𝑖𝑎𝑛2 + 395.32
44% for the 99th percentile
95th P : 28% for concentrations
above 2.5% and up to 42% for
lower concentrations.
90th P : 21% for concentrations
above 2.5% and up to 32% for
lower concentrations.
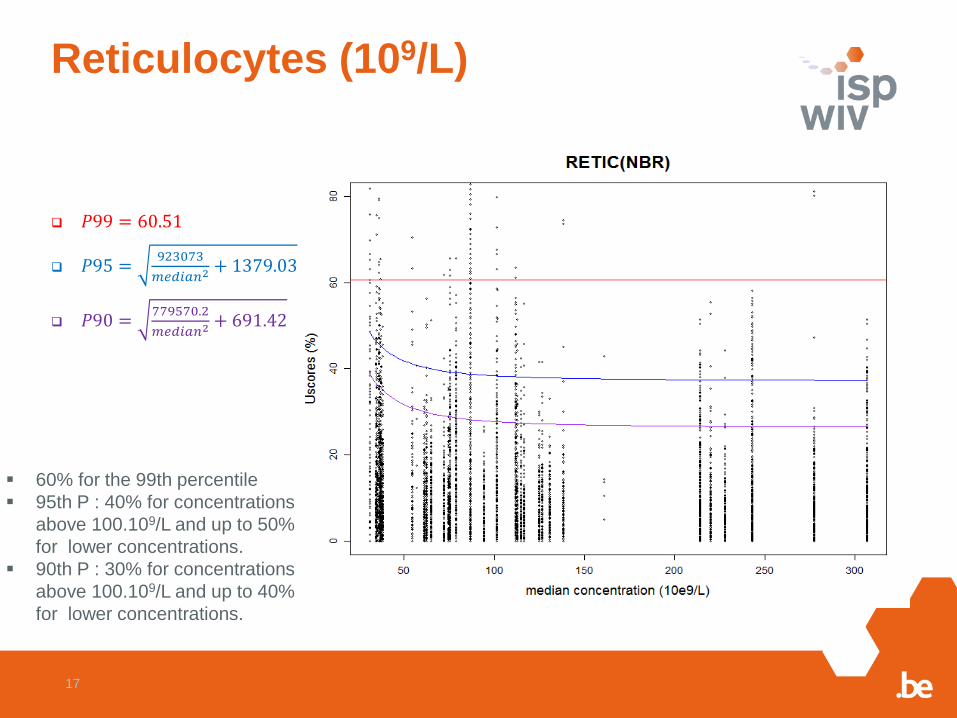
Reticulocytes (109/L)
17
𝑃99 = 60.51
𝑃95 =923073
𝑚𝑒𝑑𝑖𝑎𝑛2 + 1379.03
𝑃90 =779570.2
𝑚𝑒𝑑𝑖𝑎𝑛2 + 691.42
60% for the 99th percentile
95th P : 40% for concentrations
above 100.109/L and up to 50%
for lower concentrations.
90th P : 30% for concentrations
above 100.109/L and up to 40%
for lower concentrations.

Percentage of flagged results Parameter EQA limits P99 P95 P90
RBC 1238 (1.7%) 1756 (2.4%)
3925 (5.4%)
6999 (9.7%)
HCT 1982 (2.7%) 2030 (2.8%)
4791 (6.6%)
8155 (11.2%)
Hb 2373 (5.1%) 1450 (3.1%) 2500 (5.4%) 4124 (8.9%)
MCV 927 (1.7%)
1078 (2%)
3200 (6%)
5972 (11.2%)
WBC 1563 (2.1%)
1011 (1.4%)
3080 (4.2%)
5965 (8.1%)
RETIC(NBR) 2548 (22.9%)
443 (4%)
860 (7.7%)
1367 (12.3%)
RETIC(%) 2053 (41.1%)
183 (3.7%)
350 (7%)
551 (11%)
TBC 2242 (5%)
1100 (2.5%)
2772 (6.2%)
4797 (10.8%)
Total 14926 9051 21478 37930
18

Still to be done
19
comparing the percentage of bad
performers per instrumentation.
Matching our limits with the evaluation
procedure currently used by EQA
organizers.
……

20
Thank you for your
attention


