158
POWER OF THE EARTH HARNESSING THE ANNUAL REPORT 2003

POWER OF THE EARTHHARNESSING THE
ANNUAL REPORT 2003

CONTENTSGroup structure 1Foldout: Operational areas
Group review at a glance Summary of business operations
Group profile 2Our values 4Business objectives 6Chairman’s statement 8Chief executive’s review 12Financial review 18Business operations review 25Growth opportunities 36Review of mineral resources and reserves 38Legislative compliance 40Executive committee 43Directorate 44Corporate governance 46Risk management 52
Shareholders’ information 54Shareholders’ analysis 56Economic summary 58Safety, health and environment summary 59Social summary 66Way forward 73Independent review report 74Index to Global Reporting Initiative Indicators 76Group cash value added statement 81Selected group financial data 82Definitions 83Financial index 84Notice of annual general meeting 144Short biographies of Kumba directors seeking re-election 147Administration and Shareholders’ diary 148Voting instruction form 149Form of proxy 151
www.kumbaresources.com
DETERMINED TO UPLIFTOUR PEOPLE
CREATING BALANCE INOUR ENVIRONMENT
A NEW GENERATIONMINING COMPANY
A STEPPING STONE OF OPPORTUNITY FOR SOUTH AFRICA
Annual Report 2003
OUR VISIONKumba's vision is to outperform the mining and mineral sector in creating valuefor all stakeholders through exceptional people and superior processes.
KUMBA RESOURCES’FOOTPRINT
FOCUS ONSTAKEHOLDERPROSPERITY

GROUP STRUCTURE
Kumba holds 100% unless otherwise indicated.
IRON ORE
SISHENMINE
FERRO-SILICON
GLENDOUGLAS
MINE
ZnERGY85%
HONGYE ZINC
REFINERY60%
(China)
ROSHPINAH MINE
95%(Namibia)
TICOR SA60%
TICORLTD
(Australia)51,4%
THABAZIMBIMINE
GROOTE-GELUK MINE
LEEUWPANMINE
TSHIKON-DENIMINE
HEAVYMINERALS
BASEMETALS
INDUSTRIALMINERALS
KUMBARESOURCES
COAL
Heavy minerals – Ticor Limited Iron ore – Sishen mine
1
ZINCORREFINERY
Heavy minerals – Ticor SA smelter Base metals – Zincor refinery Industrial minerals – Glen Douglas mine
40%
Coal – Grootegeluk mine

Australia
Southern African
operations
China
Namibia
South Africa
OPERATIONAL AREAS
Tshikondeni coal mine
Grootegeluk coal mine
Thabazimbi iron ore mine
Zincor refinery
Glen Douglas mine
Leeuwpan coal mine
Ticor SA smelter
Hillendale heavy minerals mine
Sishen iron ore mine
Rosh Pinah zinc mine
4
3
2
6
10
5
8
9
1
7
17
89
23 4
6
510

GROUP REVIEW AT A GLANCE
INCOME STATEMENTSREVENUE 17,6 7 469 7 182 5 404
NET OPERATING PROFIT 44,1 1 212 1 683 584Financing costs (244) (242) (271)Investment and equity income 2 83 137Exceptional items 72Impairment charges (2) (101)Goodwill amortisation (21) 26 (27)Taxation (229) (465) (107)Minority interest (8)Add back items for headline earnings 66 122 123
HEADLINE EARNINGS 23,9 784 1 098 511
HEADLINE EARNINGS PER SHARE (CENTS) 16,3 264,0 385,3 195,0
DIVIDENDS PER SHARE (CENTS) PAID IN RESPECT OF THE 2002 YEAR 85
CASH FLOW STATEMENTSCash flow from normal operations 780 2 184Proceeds on sale of assets 44 25Capital expenditure (1 386) (1 085)Increase in cash resources on acquisition of a controlling interest in subsidiaries 366Acquisition of joint ventures and associates (34)Investments (36) (50)Foreign currency translations 28 (9)Shares issued 393Unbundling costs (44)Cash flows included above relating to non-interesting-bearing debt 2Non-cash flow movements in net debt of the group arising from currency translation differences (199) (16)Increase in net debt on acquisition of a controlling interest in subsidiaries (891)Loans from minority shareholders 95
(INCREASE)/DECREASE IN NET DEBT (1 231) 1398
BALANCE SHEETSASSETSNon-current assetsProperty, plant and equipment 28,3 8 205 5 710 4 987Intangible asset 98Goodwill (80) 23 47Investments in associates and joint ventures 118 1 184 810Deferred taxation 485 423Financial assets 272 212 294Current assetsCash and cash equivalents 964 679Inventories, trade- and other receivables 2 724 1 977 1 577
TOTAL ASSETS 28,7 12 786 10 208 7 715
EQUITY AND LIABILITIESCAPITAL AND RESERVESShareholders’ funds 22,7 4 921 4 816 3 270Minority interest 1 191 487 349
TOTAL SHAREHOLDERS’ INTEREST 30,0 6 112 5 303 3 619Non-current liabilitiesInterest-bearing borrowings 2 801 882 1 242Other long-term payables 388 178Non-current provisions 501 389 398Deferred taxation 1 384 1 204 727Current liabilitiesInterest-bearing borrowings 537 940 1 299Other 1 063 1 312 430
TOTAL EQUITY AND LIABILITIES 28,7 12 786 10 208 7 715
NET DEBT (3,3) 2 374 1 143 2 541
ANALYSIS PER SHARENumber of shares in issue (million) 297 297 272Weighted average number shares in issue (million) 297 285 262Earnings per ordinary share– Attributable earnings (cents) 241,8 342,5 148,1– Headline earnings (cents) 264,0 385,3 195,0Dividend per ordinary share (cents)2 85Dividend cover (times)3 3,9Net asset value per ordinary share (cents) 1 657 1 622 1 202Attributable cash flow per ordinary share (cents) 266,2 761,5
1. Compound annual growth rate.2. Declared in August and paid in September 2003 in respect of the year ended 30 June 2002.3. Previous year’s earnings divided by the dividend paid in the reporting year. The dividend of 60 cents per share declared in August and paid in September 2003 in respect of the
year ended 30 June 2003 is covered 4,0 times by the earnings of that year.
Two-year Years ended 30 June UnauditedCAGR1 2003 2002 pro forma
ABRIDGED FINANCIAL STATEMENTS rate % Rm Rm 2001

Two-year Years ended UnauditedCAGR ** 30 June pro forma
rate % 2003 2002 2001
RATIOSProfitability and asset managementReturn on net assets (%) 3,5 15 27 14Return on ordinary shareholders’ equity– Attributable earnings (%) 11,8 15 20 12– Headline earnings (%) 16 23 16Return on invested capital (%) 8,0 14 24 12Return on capital employed (%) 11,8 15 27 12Operating margin (%) 20,6 16 23 11
Solvency and liquidityNet financing cost cover (times) – EBITDA 44,5 7,1 8,8 3,4Current ratio (times) 59,9 2,3 1,2 0,9Net debt-to-equity (%) (25,4) 39 22 70Net debt to earnings before interest, tax, depreciation and amortisation (times) (29,7) 1,36 0,53 2,75Number of years to repay interest-bearing debt 3,13 0,83
ProductivityAverage number of employees (9,1) 9 674 9 636 11 694Revenue per employee excluding Ticor Limited (R’000) 26,9 744 745 462Cash value added (Rm) 2 954 3 883
** Compound annual growth rate.
25
20
15
10
5
0
OPERATING MARGIN (%)
’02
* Pro forma
’01* ’03
10
8
6
4
2
0
NET FINANCING COST COVER – EBITDA(TIMES)
’02
* Pro forma
’01* ’03
14 000
12 000
10 000
8 000
6 000
4 000
2 000
0
REVENUE AND TOTAL ASSETS (RM)
* Pro forma
’03’02’01*
Revenue Total assets
3,0
2,5
2,0
1,5
1,0
0,5
0
NET DEBT TO EBITDA (TIMES)
’02
* Pro forma
’01* ’03
3 000
2 500
2 000
1 500
1 000
500
0
NET DEBT AND NET DEBT-TO-EQUITY RATIO
80
70
60
50
40
30
20
10
0’01* ’03’02
* Pro forma
Net debt (Rm) Net debt-to-equity ratio (%)
Rm %
30
25
20
15
10
5
0
RETURN ON EQUITY, INVESTED CAPITALAND CAPITAL EMPLOYED (%)
’02
* Pro forma
Return onequity
’01* ’03
Return oninvested capital
Return oncapital employed
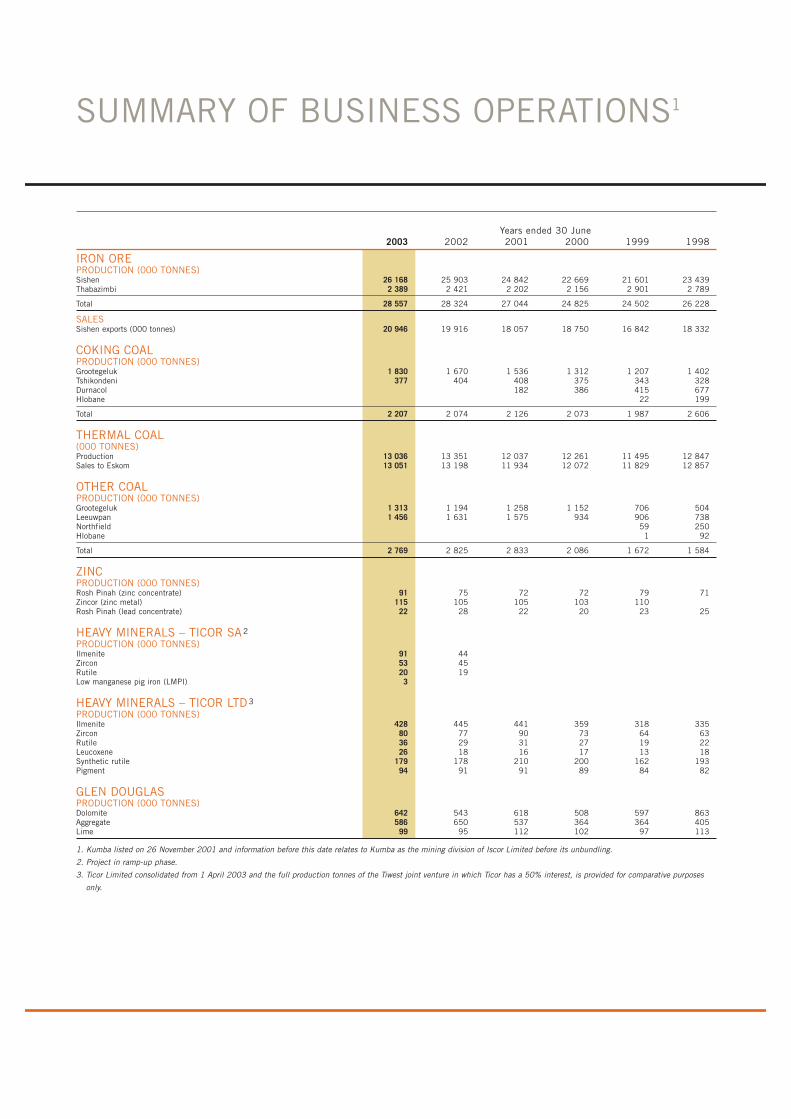
SUMMARY OF BUSINESS OPERATIONS1
IRON OREPRODUCTION (000 TONNES)Sishen 26 168 25 903 24 842 22 669 21 601 23 439Thabazimbi 2 389 2 421 2 202 2 156 2 901 2 789
Total 28 557 28 324 27 044 24 825 24 502 26 228
SALESSishen exports (000 tonnes) 20 946 19 916 18 057 18 750 16 842 18 332
COKING COALPRODUCTION (000 TONNES)Grootegeluk 1 830 1 670 1 536 1 312 1 207 1 402Tshikondeni 377 404 408 375 343 328Durnacol 182 386 415 677Hlobane 22 199
Total 2 207 2 074 2 126 2 073 1 987 2 606
THERMAL COAL(000 TONNES)Production 13 036 13 351 12 037 12 261 11 495 12 847Sales to Eskom 13 051 13 198 11 934 12 072 11 829 12 857
OTHER COALPRODUCTION (000 TONNES)Grootegeluk 1 313 1 194 1 258 1 152 706 504Leeuwpan 1 456 1 631 1 575 934 906 738Northfield 59 250Hlobane 1 92
Total 2 769 2 825 2 833 2 086 1 672 1 584
ZINCPRODUCTION (000 TONNES)Rosh Pinah (zinc concentrate) 91 75 72 72 79 71Zincor (zinc metal) 115 105 105 103 110Rosh Pinah (lead concentrate) 22 28 22 20 23 25
HEAVY MINERALS – TICOR SA2
PRODUCTION (000 TONNES)Ilmenite 91 44Zircon 53 45Rutile 20 19Low manganese pig iron (LMPI) 3
HEAVY MINERALS – TICOR LTD3
PRODUCTION (000 TONNES)Ilmenite 428 445 441 359 318 335Zircon 80 77 90 73 64 63Rutile 36 29 31 27 19 22Leucoxene 26 18 16 17 13 18Synthetic rutile 179 178 210 200 162 193Pigment 94 91 91 89 84 82
GLEN DOUGLASPRODUCTION (000 TONNES)Dolomite 642 543 618 508 597 863Aggregate 586 650 537 364 364 405Lime 99 95 112 102 97 113
1. Kumba listed on 26 November 2001 and information before this date relates to Kumba as the mining division of Iscor Limited before its unbundling.
2. Project in ramp-up phase.
3. Ticor Limited consolidated from 1 April 2003 and the full production tonnes of the Tiwest joint venture in which Ticor has a 50% interest, is provided for comparative purposes
only.
Years ended 30 June2003 2002 2001 2000 1999 1998
2
Sishen
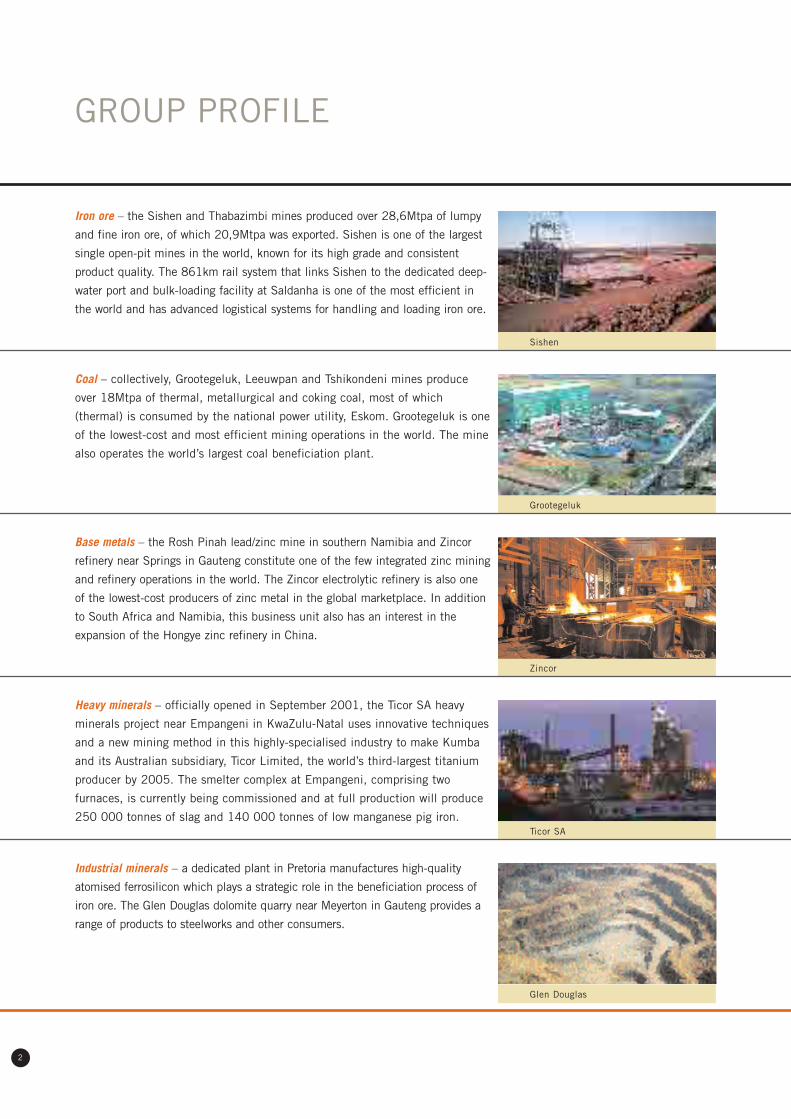
GROUP PROFILE
Iron ore – the Sishen and Thabazimbi mines produced over 28,6Mtpa of lumpy
and fine iron ore, of which 20,9Mtpa was exported. Sishen is one of the largest
single open-pit mines in the world, known for its high grade and consistent
product quality. The 861km rail system that links Sishen to the dedicated deep-
water port and bulk-loading facility at Saldanha is one of the most efficient in
the world and has advanced logistical systems for handling and loading iron ore.
Coal – collectively, Grootegeluk, Leeuwpan and Tshikondeni mines produce
over 18Mtpa of thermal, metallurgical and coking coal, most of which
(thermal) is consumed by the national power utility, Eskom. Grootegeluk is one
of the lowest-cost and most efficient mining operations in the world. The mine
also operates the world’s largest coal beneficiation plant.
Grootegeluk
Base metals – the Rosh Pinah lead/zinc mine in southern Namibia and Zincor
refinery near Springs in Gauteng constitute one of the few integrated zinc mining
and refinery operations in the world. The Zincor electrolytic refinery is also one
of the lowest-cost producers of zinc metal in the global marketplace. In addition
to South Africa and Namibia, this business unit also has an interest in the
expansion of the Hongye zinc refinery in China.
Heavy minerals – officially opened in September 2001, the Ticor SA heavy
minerals project near Empangeni in KwaZulu-Natal uses innovative techniques
and a new mining method in this highly-specialised industry to make Kumba
and its Australian subsidiary, Ticor Limited, the world’s third-largest titanium
producer by 2005. The smelter complex at Empangeni, comprising two
furnaces, is currently being commissioned and at full production will produce
250 000 tonnes of slag and 140 000 tonnes of low manganese pig iron.
Industrial minerals – a dedicated plant in Pretoria manufactures high-quality
atomised ferrosilicon which plays a strategic role in the beneficiation process of
iron ore. The Glen Douglas dolomite quarry near Meyerton in Gauteng provides a
range of products to steelworks and other consumers.
Zincor
Ticor SA
Glen Douglas
3
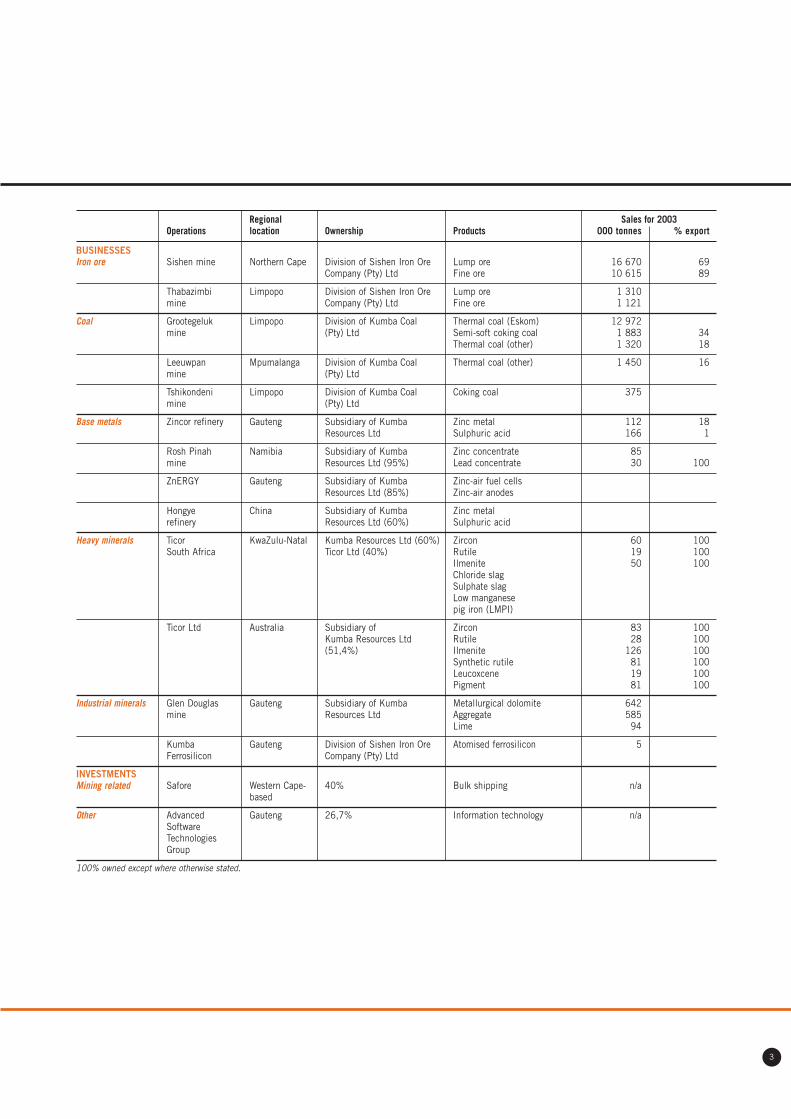
Regional Sales for 2003Operations location Ownership Products 000 tonnes % export
BUSINESSESIron ore Sishen mine Northern Cape Division of Sishen Iron Ore Lump ore 16 670 69
Company (Pty) Ltd Fine ore 10 615 89
Thabazimbi Limpopo Division of Sishen Iron Ore Lump ore 1 310mine Company (Pty) Ltd Fine ore 1 121
Coal Grootegeluk Limpopo Division of Kumba Coal Thermal coal (Eskom) 12 972mine (Pty) Ltd Semi-soft coking coal 1 883 34
Thermal coal (other) 1 320 18
Leeuwpan Mpumalanga Division of Kumba Coal Thermal coal (other) 1 450 16mine (Pty) Ltd
Tshikondeni Limpopo Division of Kumba Coal Coking coal 375mine (Pty) Ltd
Base metals Zincor refinery Gauteng Subsidiary of Kumba Zinc metal 112 18Resources Ltd Sulphuric acid 166 1
Rosh Pinah Namibia Subsidiary of Kumba Zinc concentrate 85mine Resources Ltd (95%) Lead concentrate 30 100
ZnERGY Gauteng Subsidiary of Kumba Zinc-air fuel cellsResources Ltd (85%) Zinc-air anodes
Hongye China Subsidiary of Kumba Zinc metalrefinery Resources Ltd (60%) Sulphuric acid
Heavy minerals Ticor KwaZulu-Natal Kumba Resources Ltd (60%) Zircon 60 100South Africa Ticor Ltd (40%) Rutile 19 100
Ilmenite 50 100Chloride slagSulphate slagLow manganesepig iron (LMPI)
Ticor Ltd Australia Subsidiary of Zircon 83 100Kumba Resources Ltd Rutile 28 100(51,4%) Ilmenite 126 100
Synthetic rutile 81 100Leucoxcene 19 100Pigment 81 100
Industrial minerals Glen Douglas Gauteng Subsidiary of Kumba Metallurgical dolomite 642mine Resources Ltd Aggregate 585
Lime 94
Kumba Gauteng Division of Sishen Iron Ore Atomised ferrosilicon 5Ferrosilicon Company (Pty) Ltd
INVESTMENTSMining related Safore Western Cape- 40% Bulk shipping n/a
based
Other Advanced Gauteng 26,7% Information technology n/aSoftwareTechnologiesGroup
100% owned except where otherwise stated.
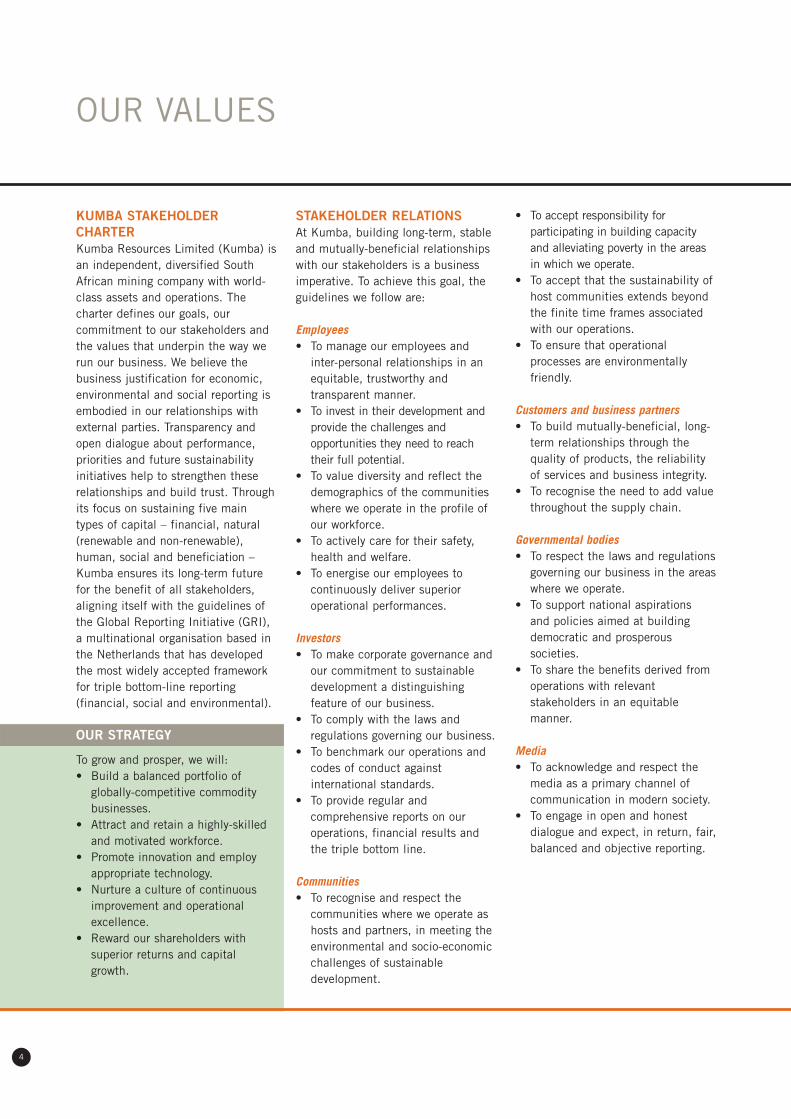
KUMBA STAKEHOLDERCHARTERKumba Resources Limited (Kumba) isan independent, diversified SouthAfrican mining company with world-class assets and operations. Thecharter defines our goals, ourcommitment to our stakeholders andthe values that underpin the way werun our business. We believe thebusiness justification for economic,environmental and social reporting isembodied in our relationships withexternal parties. Transparency andopen dialogue about performance,priorities and future sustainabilityinitiatives help to strengthen theserelationships and build trust. Throughits focus on sustaining five maintypes of capital – financial, natural(renewable and non-renewable),human, social and beneficiation –Kumba ensures its long-term futurefor the benefit of all stakeholders,aligning itself with the guidelines ofthe Global Reporting Initiative (GRI),a multinational organisation based inthe Netherlands that has developedthe most widely accepted frameworkfor triple bottom-line reporting(financial, social and environmental).
OUR STRATEGY
To grow and prosper, we will:• Build a balanced portfolio of
globally-competitive commoditybusinesses.
• Attract and retain a highly-skilledand motivated workforce.
• Promote innovation and employappropriate technology.
• Nurture a culture of continuousimprovement and operationalexcellence.
• Reward our shareholders withsuperior returns and capitalgrowth.
STAKEHOLDER RELATIONSAt Kumba, building long-term, stableand mutually-beneficial relationshipswith our stakeholders is a businessimperative. To achieve this goal, theguidelines we follow are:
Employees• To manage our employees and
inter-personal relationships in anequitable, trustworthy andtransparent manner.
• To invest in their development andprovide the challenges andopportunities they need to reachtheir full potential.
• To value diversity and reflect thedemographics of the communitieswhere we operate in the profile ofour workforce.
• To actively care for their safety,health and welfare.
• To energise our employees tocontinuously deliver superioroperational performances.
Investors• To make corporate governance and
our commitment to sustainabledevelopment a distinguishingfeature of our business.
• To comply with the laws andregulations governing our business.
• To benchmark our operations andcodes of conduct againstinternational standards.
• To provide regular andcomprehensive reports on ouroperations, financial results andthe triple bottom line.
Communities• To recognise and respect the
communities where we operate ashosts and partners, in meeting theenvironmental and socio-economicchallenges of sustainabledevelopment.
• To accept responsibility forparticipating in building capacityand alleviating poverty in the areasin which we operate.
• To accept that the sustainability ofhost communities extends beyondthe finite time frames associatedwith our operations.
• To ensure that operationalprocesses are environmentallyfriendly.
Customers and business partners• To build mutually-beneficial, long-
term relationships through thequality of products, the reliabilityof services and business integrity.
• To recognise the need to add valuethroughout the supply chain.
Governmental bodies• To respect the laws and regulations
governing our business in the areaswhere we operate.
• To support national aspirationsand policies aimed at buildingdemocratic and prosperoussocieties.
• To share the benefits derived fromoperations with relevantstakeholders in an equitablemanner.
Media• To acknowledge and respect the
media as a primary channel ofcommunication in modern society.
• To engage in open and honestdialogue and expect, in return, fair,balanced and objective reporting.
OUR VALUES
4
5
OUR VALUES
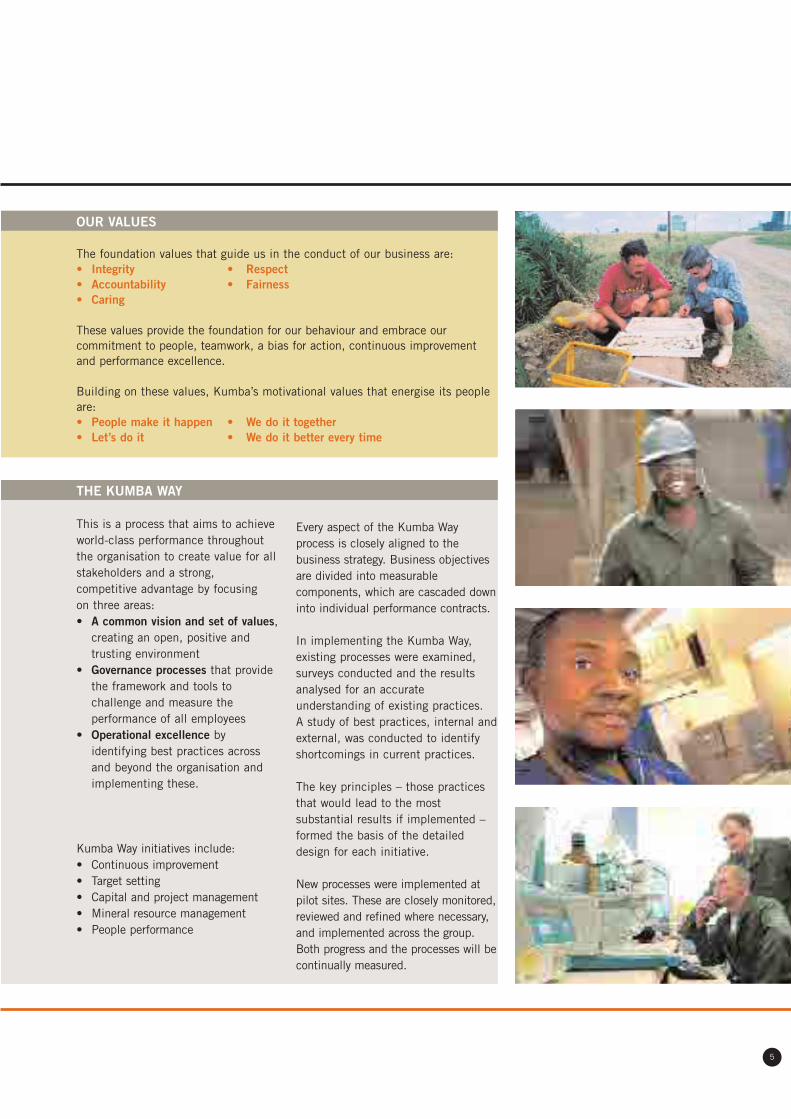
The foundation values that guide us in the conduct of our business are:• Integrity • Respect• Accountability • Fairness• Caring
These values provide the foundation for our behaviour and embrace ourcommitment to people, teamwork, a bias for action, continuous improvementand performance excellence.
Building on these values, Kumba’s motivational values that energise its peopleare:• People make it happen • We do it together• Let’s do it • We do it better every time
THE KUMBA WAY
This is a process that aims to achieveworld-class performance throughoutthe organisation to create value for allstakeholders and a strong,competitive advantage by focusingon three areas:• A common vision and set of values,
creating an open, positive andtrusting environment
• Governance processes that providethe framework and tools tochallenge and measure theperformance of all employees
• Operational excellence byidentifying best practices acrossand beyond the organisation andimplementing these.
Kumba Way initiatives include:• Continuous improvement• Target setting• Capital and project management• Mineral resource management• People performance
Every aspect of the Kumba Wayprocess is closely aligned to thebusiness strategy. Business objectivesare divided into measurablecomponents, which are cascaded downinto individual performance contracts.
In implementing the Kumba Way,existing processes were examined,surveys conducted and the resultsanalysed for an accurateunderstanding of existing practices.A study of best practices, internal andexternal, was conducted to identifyshortcomings in current practices.
The key principles – those practicesthat would lead to the mostsubstantial results if implemented –formed the basis of the detaileddesign for each initiative.
New processes were implemented atpilot sites. These are closely monitored,reviewed and refined where necessary,and implemented across the group.Both progress and the processes will becontinually measured.

6
The Kumba vision has been translated into a series of business objectives that can be actively measured. These
objectives are translated into specific financial and operational targets as well as selected non-financial targets.
ActualFinancial targets Target 2003
• Return on equity (ROE) (%) over the cycle 20 15
Operational targets
• Business improvement initiatives 2% cost Cost increasesreduction below inflation
(real)
Non-financial targets
• Safety
– number of fatalities 0 4
– lost time injury frequency rate 2,5 3,07
• International environmental certifications (number) 9 2
BUSINESS OBJECTIVES

7
KUMBA RESOURCES’ FOOTPRINT
As a true and proud
South African resources
company, we have chosen
a path that reflects the
richness of our land.
Our aim is to harness
the power of the earth,
empower our people,
and ensure a culture of
continuous improvement
and operational excellence.
CHAIRMAN’S STATEMENT
8
It is with great pleasure that I presentthe chairman’s statement for Kumbain this, the second annual reportsince the group’s listing in November 2001.
Despite the tough market conditionswhich prevailed during the yearunder review, Kumba has deliveredsolid results. I am pleased that theboard was able to declare adividend of 60 SA cents per share.I believe these results are testimonyto the ability of management tofocus on the business andimplement value-enhancinginitiatives at a time when severalmacro and other issues potentiallythreatened that focus.
Legislation and regulation introducedduring the year have redefined theindustry, specifically the Mineral andPetroleum Resources DevelopmentAct (Minerals Act), with its attendantmining charter and scorecard, and theproposed Mineral and PetroleumRoyalty Bill (Royalties Bill).
Kumba supports the underlyingprinciples and objectives of theMinerals Act and the group’scommitment to empowerment is clearand focused. Our empowermentpartners, Tiso Kgalagadi Consortium,came on board shortly after Kumbalisted, well ahead of the currentlegislation. This has been followed bythe formalisation of the company’s
relationship with Eyesizwe Coal, ablack-owned company, and the jointventure in the Kalbasfontein coalmining project. Our empowermentstrategy strives to be integrated,balanced and takes a long-term viewso that we can effectively measureour progress towards sustainablebroad-based socio-economicempowerment. Opportunities forfurthering empowerment are beingpursued across the group, in allaspects of our business. In terms ofthe mining charter scorecard, I ampleased to report that substantialprogress has been made to fulfil allthe requirements of the charter.
The New Africa Mining Fund waslaunched in October 2002 as aprivate equity investment fund aimedat developing new sustainable juniormining opportunities on the Africancontinent. An initiative of the miningindustry and government, the fundfacilitates access to capital for juniormining entrepreneurs, while providinginvestors with the prospect ofcompetitive returns on the fundsinvested. Kumba pledged R20 milliontowards the fund, which now exceedsR560 million, to be drawn down overa six-year period.
On the proposed Royalties Bill,Kumba has been an active participantin the interaction with governmentand other interested parties to seekthe most equitable form of royaltypayments. However, Kumba believesit is more appropriate for royalties tobe based on profit as opposed torevenue. Equally, the possibility offuture variations needs to be clarifiedto instil long-term confidence in the
Dawn Marole – Chairman
process. It would be desirable thatdeveloping rural communitiesassociated with the projects orresources from which it originates,benefit most from the royalty regime.This can be achieved by permittinginvestments made in “labour-sending”communities and those around miningoperations, to be directly offsetagainst royalty payments.
Moving to currency issues – given thatthe bulk of Kumba’s revenue isUS dollar-denominated, the iron orestrategic business unit in particular,and the group in general, are highlygeared to the exchange rate. Mostimportantly, Kumba, the localminerals industry, and South Africa ingeneral will benefit from a stable randwhich underpins strong export growthand supports local expansion.
At the same time as theunprecedented rand strength,Kumba and the mining industryhave also had to contend with non-negotiable cost increases, especiallythose emanating from parastatals.An example is the large increases inSpoornet’s general freight rail tariffson certain domestic routes whichaffected our coal exports. Such inputcost increases are dauntingchallenges to management at theoperations at a time when costreductions and increased productivityare the only controllable drivers tomaintaining profitability.
The sharp increase in the oil priceas a result of the ongoing conflict inIraq has also had a major impact onKumba’s performance, as the groupis one of the country’s largest users
of petroleum-related products – ata cost of some R300 million peryear. The slower than anticipatedreturn to normal production levelsin Iraq since the end of the war mayresult in oil prices remaining highfor some time.
As the largest iron ore operator inthe Northern Cape, Kumba’s positionon rationalisation in that industryis clear: • to capitalise on the considerable
release of value in that area• to ensure optimal exploitation of
the resource base in a sustainablemanner
• to realise the maximum synergiesthat exist between current regionalassets and achieve the mosteffective use of the logisticalinfrastructure. In this regard, theresolve to enhance the transportcapacity of the Sishen-Saldanharail and the Saldanha port storageand loading infrastructure as wellas the potential use of the Port ofNgqura (Coega) for iron ore exports,are of paramount importance.
At Richards Bay, the South DunesCoal Terminal Company, in whichKumba is a major participant,negotiated an agreement withRichards Bay Coal Terminal to takeup 6,5Mtpa from the terminal’s10,0Mtpa Phase V coal exportexpansion project at the port. Thisbreakthrough, largely facilitated byKumba, will create the opportunityfor access of more than 3Mtpato export markets for empowerment-related coal production. Unfortunately,the go-ahead for the Phase Vexpansion project is currently being
delayed by the dispute between theSA Ports Authority and Richards BayCoal Terminal on the allocation of asmall amount of current throughputcapacity to black economic empow-erment companies. Ironically, theunintended consequence of thisimpasse has led to an escalation incapital costs and could potentiallyjeopardise the viability of the entireproject, to the detriment of the verypeople it was designed to benefit.
Anglo American Plc (Anglo) increasedits shareholding in Kumba to 20,1%and acquired an option on a further10,01%. For most of the year, thishas been the subject of a highly-publicised dispute between Anglo andIndustrial Development Corporationwhile under the consideration of thecompetition authorities.
The ruling of the Competition Tribunalhas now provided greater clarity forthe group. It is important that wecontinue to follow the consistentapproach we adopted throughout theprocess, namely that the responsibilityof the Kumba board and managementis to consider the best interests of thegroup at all times. It is appropriatethat I take this opportunity to commendboard members and management ontheir ability to remain focused duringthis period to continue to run robustoperations delivering maximumbenefit from the group’s assets forall stakeholders.
DEVELOPMENTS IN AFRICAThe New Partnership for Africa’sDevelopment (Nepad) heralds a newchapter in the emerging era of Africanself-determination. Nepad’s peer
RESULTS AND PROGRESS REFLECT THE TALENT AND COMMITMENTOF KUMBA’S PEOPLE AT ALL LEVELS
9

review mechanism will assist to ensurethat a more attractive environment iscreated for investment in Africaneconomies. These developments arefully supported by Kumba. Kumba ispursuing business interests in Africabeyond South Africa and Namibia,which include the Faléme iron oreproject in Senegal, the Kipushizinc/copper and Kamoto copper/cobaltprojects in the Democratic Republicof Congo, and a mineral sandsdevelopment at Tulear insouth-western Madagascar.
SUSTAINABILITY REPORTINGThis is Kumba’s first integrated report,covering the financial, environmentaland social performance of the group.It demonstrates that consideration forpeople, the environment and theeconomy is closely tied to Kumba’sfinancial sustainability. We firmlybelieve that being a sustainableorganisation makes business sense forthe financial bottom line. In severalareas of our non-financial reporting,targets have been set. In other areas,they are still being established.However, it is a process to which we arecommitted and a promise we make toall our stakeholders – that we care aboutminimising the impact of our operationsand optimising the development of allthe people around us.
HIV/AIDSWith the support of Kumba’srecognised unions, the board approvedthe group’s HIV/AIDS policy and theintroduction of pilot anti-retroviraltherapy programmes at the Grootegelukcolliery and Zincor refinery. If successful,the therapy will be implemented atremaining operations.
DIRECTORATEHans Smith retired as non-executivechairman and member of the Kumbaboard and I was appointed as non-executive chairman in November2002. Hans was a key figure inKumba’s formation and an enthusiasticsupporter of Kumba’s proactive anddynamic approach. On behalf of theboard, I thank him most sincerely forthe wise counsel and support he gaveKumba in its critically important firstperiod as an independent entity.
Kumba is proud of its boardindependence, with six of ten non-executive board members beingindependent.
APPRECIATIONKumba has made great strides for acompany in its infancy, progress thatreflects the talent and commitmentof its people at all levels. Particularly,I thank my fellow directors whoseconstructive views are so important inguiding the group, and the dedicatedchairmen of the board committees.In Dr Fauconnier, Kumba is privilegedto have a chief executive whoseleadership is inspirational and whoheads a management team that isarguably one of the best in the industry.
Since listing, we have establishedclose relationships with seniormembers of relevant governmentdepartments and industry bodies,relationships that we value greatlyand will continue to nurture.
PROSPECTSIt is my responsibility to help charta course for this group that not onlyensures superior shareholder returns,but is also beneficial to all otherstakeholders, including the employeesof Kumba.
We expect another year of solidperformance in our underlyingoperations. The strength of the randwill pose greater challenges for somecommodities than others, but we areconfident that our people will continueto rise to these challenges. The initialsuccess of our sizeable heavy mineralsproject also inspires confidence andbodes well for the future.
Investors have bought into Kumbabecause they perceive value in thecompany. We will continue to striveto create the environment which willdeliver that value in the best interestsof the company, its shareholders andits people.
Dawn MaroleChairman10 September 2003
Chairman’s statement continued
10
CONSULTATIVE HIV/AIDSPOLICY IN PLACE, ANTI-RETROVIRALTHERAPY BEING PILOTEDAT TWO SITES

11
A NEW GENERATION MINING COMPANY
We are a diversified South African-based resources
company at the forefront of innovation and technology.
To maintain this position going forward, we will continue to
develop new innovations that generate shared rewards.

CHIEF EXECUTIVE’S REVIEW
12
OVERVIEWKumba’s second year as an
independent entity was again marked
by stable operational performance
and an increased focus on cost
containment and production
efficiency. While turnover rose by
4%, attributable earnings decreased
by 26%, due mainly to the sustained
strengthening of the rand, lower
iron ore prices for nine months of
the financial year, and a severely
depressed market for zinc.
Fortunately, as from 1 April 2003,
the iron ore prices increased by 8,9%
for lump ore and 9,0% for fine ore.
These prices will remain in force until
the end of March 2004.
Kumba has taken great strides in its
reporting standards in that we have
embraced sustainability reporting.
We believe that triple bottom-line
reporting actually has a fourth
dimension – using our mineral
resources wisely and in a
sustainable manner, both through
technology and innovative and
responsible management.
As the chairman has noted, a volatile
domestic currency affects the ability of
most commodity companies to plan
ahead, apart from the immediate effect
of currency volatility on earnings. We
will manage this risk proactively by
increasing efficiencies to support
earnings in the 2004 financial year,
given our expectation that the rand will
continue to be stronger than in the
previous year.
While we accept the views of both
the Reserve Bank and government
that South Africa needs to adjust
to a stronger rand environment, it
must be recognised that many of
the revenue and cost pressures
making it difficult for local exporters
to survive in a strong rand
environment are beyond the control
of industry. For example:
• In the commodity business,
exporters are price takers and
cannot pass domestic cost
increases on to customers.
• In South Africa, almost half of
the fixed capital assets of the
economy is controlled by
government either directly through
parastatals or municipalities and
the like. Business, therefore, has
either limited or no choice in
the procurement of certain goods
and services and often has to
contend with extraordinary cost
increases. In Kumba’s case,
the group contends with the
following situations:
– General freight line tariffs for
coal exports increased by 80%
since 1 July 2002. This
increase, coupled to the
current dollar market prices
and strong rand exchange rate,
has rendered coal exports
uneconomical.
– Government set a precedent
for the country’s annual wage
Con Fauconnier – Chief Executive
STABLE OPERATIONAL PERFORMANCE, INCREASED FOCUS ONCOST CONTAINMENT AND PRODUCTION EFFICIENCY
13
negotiations with the relatively
high wage increases it granted
to its employees, the second
consecutive year that this has
occurred.
• The war in Iraq and ongoing conflict
has left a legacy of relatively high
oil prices. This seriously affects the
cost structure of Kumba’s highly
mechanised operations, which
consume six million litres of diesel
and other fuel products per month.
If exporters are to cope with the
strong rand environment, all service
providers, including government,
will have to remain focused on
cost containment and efficiency
improvement, otherwise the inevitable
result will be the demise of exporters,
particularly in the minerals industry.
A strong case must be made here for
close cooperation between industry
and the various government agencies
to ensure that solutions are found
that serve the interests of South
Africa best in the long run. A sterling
example of such cooperation in recent
years has been the excellent results
achieved by Kumba and Spoornet in
terms of improvements in efficiency
levels on the Orex rail line. This has
led to huge benefits for both parties
and the country in general.
The issue of rationalisation of iron
ore interests in the Northern Cape
has been under discussion and
negotiation for some time. Kumba
supports the concept of a full
amalgamation, with due regard to
the interests of other parties, as
we believe a consolidated operation
would release the maximum
synergistic value for all stakeholders
through optimal development of the
assets. However, we have in recent
months concentrated on an exchange
of mineral rights and the so-called
North-South model, which also has
the potential to unlock substantial,
albeit lesser, value for both sets of
shareholders. In the meantime,
we have continued to plan the
development of the proposed Sishen
South mine. Our preferred option, as
presented to government and other
stakeholders, involves the optimal
sustainable development of the
resource base, extracting maximum
synergies that exist between current
regional assets, and the most
efficient use of rail infrastructure,
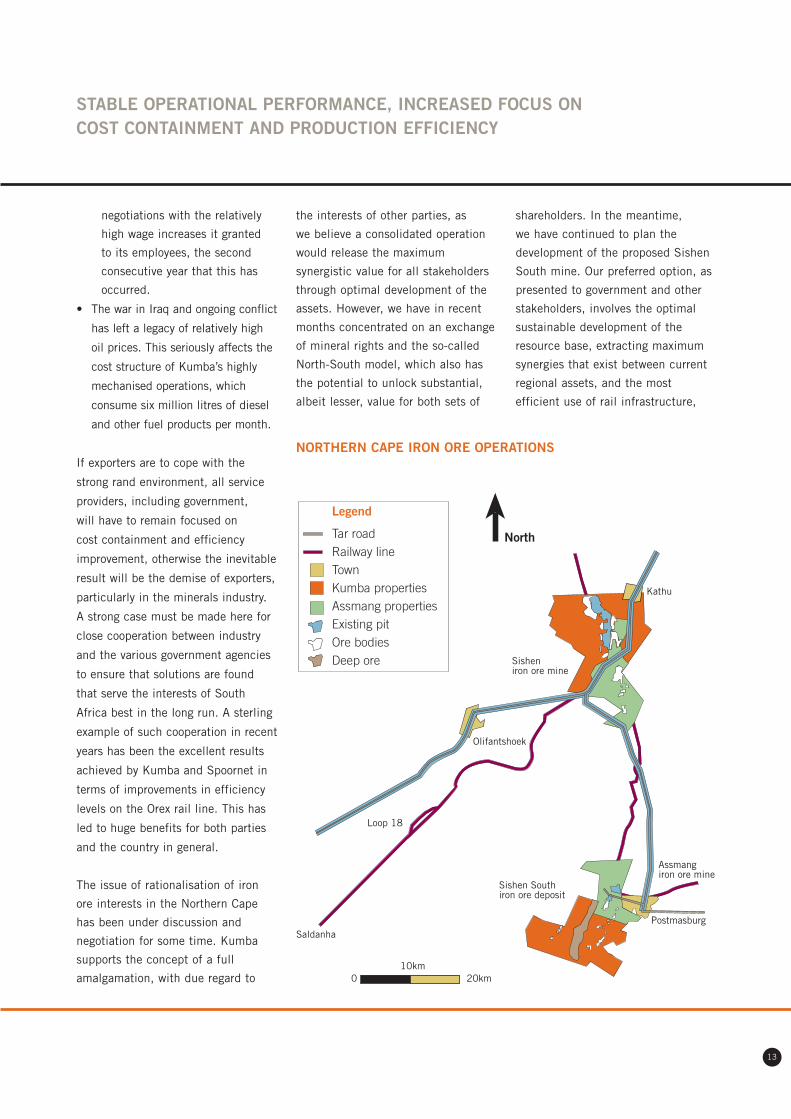
NorthTar roadRailway lineTownKumba propertiesAssmang propertiesExisting pitOre bodiesDeep ore
Legend
010km
20km
Kathu
Sisheniron ore mine
Olifantshoek
Saldanha
Loop 18
Assmangiron ore mine
Postmasburg
Sishen Southiron ore deposit
NORTHERN CAPE IRON ORE OPERATIONS

including the expansion of the
Sishen-Saldanha rail and port
infrastructure and the possible use of
the general freight line for iron ore
exports through the Port of Ngqura
(Coega) near Port Elizabeth in the
Eastern Cape. We believe that by
managing and operating the regional
assets and exploiting the iron ore
reserves as a single business unit,
best practices could be applied
across the production sites to
achieve additional savings on
overheads. This model would also
maximise profits arising from
optimal product and logistical
configuration, a single railway line
user and would facilitate significant
empowerment ownership.
Delays in the implementation of
the project to expand the Sishen-
Saldanha rail line and port to
29Mtpa by June 2005 have the
potential to curtail hard currency
inflow into the country and the
creation of jobs, by limiting exports.
These expansions will allow Kumba
to rail about 23,5Mtpa of which
1,8Mtpa is to Saldanha Steel
(Iscor Limited).
Concurrently, Kumba, Spoornet and SA
Port Operations are also exploring the
feasibility of a further increase in the
capacity of the Sishen-Saldanha rail line
and the Saldanha port by at least
8,5Mtpa to 38Mtpa to cater for the
expansion of Kumba’s iron ore
production in the Northern Cape through
its Sishen South project or some
variation of the North-South model.
The Chinese market demand for
iron ore continues to expand at
unprecedented rates. If South Africa is
to maintain its position in this rapidly
expanding market, it is essential that
the implementation of the expansion
programme at the port of Saldanha
and the plans to increase the Orex rail
line’s annual capacity to 38Mtpa be
completed as soon as possible.
The negative effect of very high
general freight rail tariff increases
during the year has made certain of
Kumba’s products, particularly coal,
uneconomical in the export market.
This highlights the importance of
the Richards Bay Coal Terminal
Phase V (South Dunes Coal
Terminal) expansion to be given the
go-ahead with the concomitant
resolution of the common user
tonnage issues. Phase V stands on
its own merit and we firmly believe
it should not be delayed by broader
issues concerning Richards Bay Coal
Terminal and SA Ports Authority. As
was indicated by our chairman, we
contend that this would seriously
jeopardise the very empowerment
that government is seeking to
encourage and promote.
At the time of the group’s formation,
Kumba chose to position itself as a
South African-based company in the
true spirit of citizenship. This is the
foundation on which we built our
approach and engagement with all
stakeholders, particularly with the
major changes happening in the
legislative environment.
Kumba has embraced the concept of
corporate citizenship on its journey
towards sustainability. This initiative
aims to integrate all activities
currently undertaken across the group
in areas of social investment, safety,
health, environment, human resources
development, employment equity,
preferential procurement and black
economic empowerment.
The mining charter and its attendant
mining scorecard developed during
the course of the year under review
form an integral part of the Minerals
Act. The charter requires that the
industry assists companies owned by
historically disadvantaged South
Africans (HDSAs) to secure financing
to fund their participation in an
amount of R100 billion within the
first five years. This equates to
roughly 15% of the value of the
industry, and is in pursuance of a
longer-term (ten-year) target of
26% based on a willing buyer –
willing seller basis, at fair market
value. Kumba is already well down
the track in meeting the
requirements of the charter. We view
all the targets as realistic and
achievable, and they are in line with
the strategy we set for ourselves from
the outset when we created the
group. In some cases, such as
empowering women, we have already
met the set requirements and will
continue to strive to reach even
higher levels. We are confident of
achieving our empowerment targets
sooner rather than later, however
timing of the conversion of our
Chief executive’s review continued
14
EMBRACED THE CONCEPT OF CORPORATE CITIZENSHIP ON OUR JOURNEYTOWARDS SUSTAINABILITY
15
mineral rights depends on the final
outcome of the Royalties Bill.
HIGHLIGHTS• In March 2003, in line with the
strategy of developing our heavy
minerals business through Ticor
Limited (Ticor), Kumba increased
its shareholding in the Australian-
listed heavy minerals group to
51,4%, making it a subsidiary of
the group. Accordingly, Ticor’s
results are now fully consolidated
(since 1 April 2003), and Ticor’s
financial year end will change
from December to June to reflect
that of its holding company,
Kumba. The partnership between
Kumba and Ticor has made a
significant contribution to the
latter’s success in the heavy
minerals industry in both Australia
and South Africa.
• Our investment in the Ticor SA
heavy minerals project is
beginning to reap dividends, with
the first furnace of the Empangeni
smelter starting up on schedule
and commissioning beginning in
March 2003. Production at the
mine and minerals separation
plant has already yielded excellent
results. This division has very
promising prospects and is likely
to become the second-largest
contributor to Kumba’s revenue
and earnings after iron ore by
2006.
• The development of Sishen,
specifically Sishen South, is at an
important stage. The Sishen South,
project’s technical feasibility study
has been completed and is
currently being evaluated. Kumba
is thus well placed to participate
in regional industry rationalisation,
as noted earlier. Should a North-
South model or some other form
of rationalisation emerge from
the current negotiations in the
Northern Cape as being
economically more favourable,
the planned capacity expansion
could be achieved through
implementation of the revised
configuration.
• In China, the joint venture
between our base metals division,
the Chifeng Hongye Zinc
Smelting Company and the
Baiyinnuoer Lead Zinc Mine
Company Limited received final
approval from the Kumba board
in February 2003. This has
signalled the start of the
expansion and joint operation of
the Hongye zinc refinery and the
roaster at Lindong (as detailed in
the review of growth opportunities).
It will give Kumba a better
understanding and stronger
foothold in China, which is the
world’s most important market
for base metals.
• Kumba has made significant
progress in enhancing its risk
management systems, which are
now on par with best practice in
our industry. These systems are
reviewed regularly, from operational
to corporate level and results are
reported to the board bi-annually.
• Our determination to make our
value system a tangible reality was
entrenched in November 2002,
with the launch of the Kumba
Way, which embodies
commitment, teamwork, a shared
vision, seeking better ways to do
things and encouraging the
aspirations of all. The Kumba Way
is founded on identifying best
practices throughout the group
or externally and using these to
realise our goal and practice of
continuous improvement.
• In April 2003, our subsidiary
ZnERGY (Zinc-air Energy Systems),
started manufacturing zinc-air
fuel cells at a plant site in
Pretoria. This project was
announced at the World Summit
for Sustainable Development
in Johannesburg in 2002.
Manufacturing under licence from
a German firm, ZOXY Energy
Systems AG (ZOXY), ZnERGY will
meet the growing demand for high-
density, long-life and low-cost
battery systems. It is a practical
and recyclable means of energy
storage that will help reduce the
environmental impact of using
conventional batteries to generate
power, particularly in areas with
little or no access to conventional
electricity. ZOXY has achieved
great success in breaking into the
European uninterrupted power
supply markets.

• Sustainable development and
corporate citizenship are now a
fundamental part of Kumba’s
strategy. As detailed in the
summary reports on pages 58
to 72, Kumba is committed to
ensuring that, at all times and in
all our operations, the operating
standards we maintain and the
legacy we leave behind is positive
for the surrounding communities
and the environment.
• Kumba continued to honour its
commitment to training and
development of its employees as
part of the group’s socio-economic
empowerment strategy and to
further improve efficiency levels.
During the year, Kumba invested
R62,2 million in training and devel-
oping employees, equating to 5,7%
of total payroll. This is above the
Mining Qualifications Authority’s
average of 3,8% for mining
companies with more than 5 000
employees. Kumba is proud to have
trained 24% of the total number of
artisan trainees in the mining indus-
try during the year under review.
APPRECIATIONIn just two years, Kumba has taken
truly giant strides, underpinned by
one of the best teams in the mining
industry – people determined to
make it happen. Our technical and
managerial competencies compare
with the best in the industry. The
integrity, the ethics by which our
people live and work set us apart
and I thank them most sincerely.
Special tribute also needs to be
paid to our customers for their loyal
support, to our suppliers from whom
we have enjoyed excellent service
delivery and to our trade unions
with whom we maintain sound
relationships and who have
supported all the major initiatives
in the group.
On behalf of management, I thank
our board of directors for their
support, independence and
commitment to good corporate
governance. In particular, our
chairman, Dawn Marole, is adding
tremendous value to the group and
we look forward to continued
guidance and counsel from the
board under her leadership.
OUTLOOKKumba faces a challenging year
ahead, but there are several positive
factors that we believe will assist our
performance, including the increase
negotiated for iron ore prices until
March 2004. Equally, following the
successful ramp-up of heavy minerals
production, the first shipments of
titanium slag will be made soon.
Kumba will benefit from the expected
reduction in interest rates as we are
in a net borrowed position. Finally,
underscoring the fundamental
strength of the group, all our
operations are expected to produce
good physical performance during
the new financial year.
As noted, sustained rand strength
affects all exporters, and Kumba
is no exception. The global outlook
for commodities, other than iron ore,
is expected to remain weak to muted.
This outlook, coupled to input cost
structure increases such as rail tariffs
and high oil prices, will test the mettle
of all Kumba’s people to further
improve efficiencies.
Earnings are expected to remain
under pressure in the new financial
year. However, we are clearly focused
on steps that can be taken to ensure
that we continue to operate efficiently
and are confident of again producing
outstanding operating results that
should underpin earnings in these
tough market conditions.
Con Fauconnier
Chief Executive
10 September 2003
Chief executive’s review continued
16
FOCUS ON STAKEHOLDER PROSPERITY
We will continue to create wealth for all stakeholders
by doing what we do better than anybody else.
Our vision, values and governing principles ensure
that stakeholder prosperity will be enhanced.
17
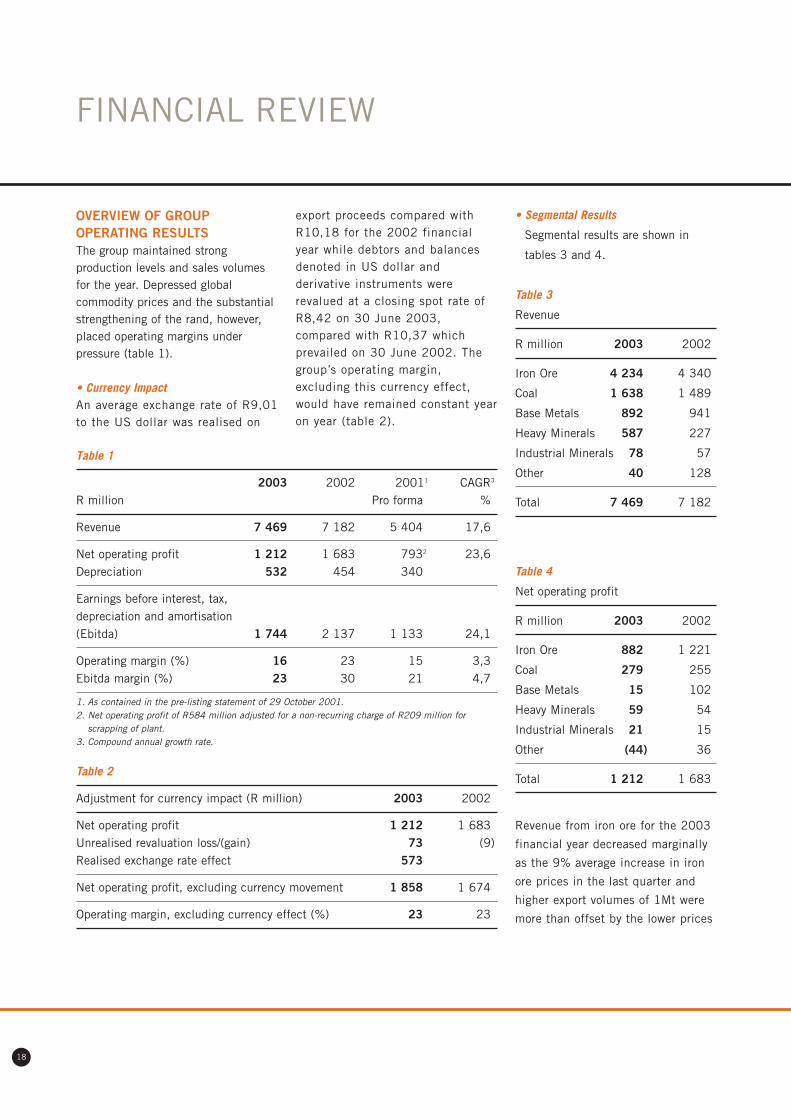
OVERVIEW OF GROUPOPERATING RESULTSThe group maintained strongproduction levels and sales volumesfor the year. Depressed globalcommodity prices and the substantialstrengthening of the rand, however,placed operating margins underpressure (table 1).
• Currency ImpactAn average exchange rate of R9,01to the US dollar was realised on
export proceeds compared withR10,18 for the 2002 financialyear while debtors and balancesdenoted in US dollar andderivative instruments wererevalued at a closing spot rate ofR8,42 on 30 June 2003,compared with R10,37 whichprevailed on 30 June 2002. Thegroup’s operating margin,excluding this currency effect,would have remained constant yearon year (table 2).
FINANCIAL REVIEW
18
• Segmental Results
Segmental results are shown in
tables 3 and 4.
Table 3
Revenue
R million 2003 2002
Iron Ore 4 234 4 340
Coal 1 638 1 489
Base Metals 892 941
Heavy Minerals 587 227
Industrial Minerals 78 57
Other 40 128
Total 7 469 7 182
Table 4
Net operating profit
R million 2003 2002
Iron Ore 882 1 221
Coal 279 255
Base Metals 15 102
Heavy Minerals 59 54
Industrial Minerals 21 15
Other (44) 36
Total 1 212 1 683
Revenue from iron ore for the 2003
financial year decreased marginally
as the 9% average increase in iron
ore prices in the last quarter and
higher export volumes of 1Mt were
more than offset by the lower prices
Table 1
2003 2002 20011 CAGR3
R million Pro forma %
Revenue 7 469 7 182 5 404 17,6
Net operating profit 1 212 1 683 7932 23,6Depreciation 532 454 340
Earnings before interest, tax, depreciation and amortisation (Ebitda) 1 744 2 137 1 133 24,1
Operating margin (%) 16 23 15 3,3Ebitda margin (%) 23 30 21 4,7
1. As contained in the pre-listing statement of 29 October 2001.2. Net operating profit of R584 million adjusted for a non-recurring charge of R209 million for
scrapping of plant.3. Compound annual growth rate.
Table 2
Adjustment for currency impact (R million) 2003 2002
Net operating profit 1 212 1 683Unrealised revaluation loss/(gain) 73 (9)Realised exchange rate effect 573
Net operating profit, excluding currency movement 1 858 1 674
Operating margin, excluding currency effect (%) 23 23

in the first nine months (an average
decrease of 4% from the previous
year) and the strong rand. This,
together with higher production
volumes and increased stripping of
overburden, insurance premiums
and environmental provisions,
resulted in a 28% decrease in net
operating profit to R882 million.
Higher coal prices accounted for a
10% increase in revenue as sales
volumes were maintained despite
a major generator failure at the
Matimba power station. Net
operating profit improved by 9% to
R279 million notwithstanding the
increased costs of planned
maintenance programmes and
higher insurance premiums.
Despite the record production and
sales volumes at both the Rosh
Pinah mine and the Zincor refinery,
the stronger currency, a lower zinc
price of 13% in rand terms together
with substantially lower globally
based zinc concentrate treatment
charges paid to refineries, resulted
in revenue decreasing by 5% to
R892 million and net operating
profit from R102 million to
R15 million.
At the Ticor SA heavy minerals
operation, production of ilmenite,
zircon and rutile increased
substantially with both zircon and
rutile fully sold. Market conditions for
ilmenite remained unfavourable and
crude ilmenite was largely
being stockpiled for smelting and
processing into titanium slag and
pig iron.
Revenue increased by 159% to
R587 million mainly as a
consequence of the consolidation of
the Australian heavy minerals and
pigment producer, Ticor. Net
operating profit increased marginally
from R54 million to R59 million as
the consolidation effect of Ticor was
largely offset by the impact of
the stronger rand on Ticor SA, a
higher depreciation charge and the
costs of the mining operation being
charged to the income statement as
it was brought into substantial
operating use.
Industrial minerals continued to
benefit from favourable market
conditions in the steel and
construction sectors, resulting in
a significant improvement in both
revenue and net operating profit.
NET FINANCING COSTSNet financing costs consist of
interest expense, net of interest
earned and interest capitalised on
project developments.
The average monthly effective cost
of borrowings increased from
10,5% pa to 12,63% pa in line with
an upward interest rate cycle. Net
financing costs increased marginally
to R244 million and were covered
STRONG PRODUCTION LEVELS AND SALES VOLUMES AFFECTED BYDEPRESSED GLOBAL COMMODITY PRICES AND A STRONG RAND
19
REVENUE
Coal 22%
Heavy minerals 8%
Industrial minerals 1%
Other 1%
Base metals 12%
Iron ore 56%
NET OPERATING PROFIT
Coal 23%
Heavy minerals 5%
Industrial minerals 2%
Other (4)%
Base metals 1%
Iron ore 73%

allocation of debt upon the
unbundling of Kumba from Iscor
Limited in November 2001. Although
regarded as a non-core investment
for our business, AST is an important
information technology service
provider to the Kumba group. Kumba,
accordingly, together with AST’s
banker and other creditors, agreed
to a major business improvement and
financial restructuring programme to
restore AST to profitability with a
focus on its core business areas.
Kumba will underwrite R35 million
of a rights issue of R89 million to be
undertaken by AST in October 2003
which could potentially increase our
shareholding to 34,3% should all
other shareholders of AST not follow
their rights.
EARNINGSA lower net operating profit and the
significant reduction in income from
equity accounted investments, offset
to some extent by a lower tax charge,
resulted in a decline in both
attributable profit and headline
earnings (table 6).
TAXATIONThe tax charge for the year reduced to
R229 million in line with the decline
in operating profits.
The effective tax rate of 24% is mainly
the result of a tax write-off on the
acquisition of certain mining equipment.
Financial review continued
20
seven times by Ebitda compared with
nine times in the 2002 financial year.
Interest cost of R32 million was
capitalised, mainly in respect of the
project loan facilities taken up for
the Ticor SA project, compared
with no capitalisation in the
2002 financial year.
INCOME FROM EQUITYACCOUNTED INVESTMENTSOur share of attributable profit from
investments, before tax, has
decreased significantly as a con-
sequence of the loss reported by AST
Group Limited (AST) which offset other
equity accounted income (table 5).
We have a 26,7% interest in AST
which we acquired as part of the
Table 5
R million 2003 2002
Ticor Limited* 57 72
AST (73) (8)
Trans Orient
Ore Supplies 15 17
Other 3 2
Total 2 83
* Equity accounted for 9 months of the year.
Table 6
R million 2003 2002 %
Attributable earnings 718 976 (26)
Adjusted for:
• Net (surplus)/deficit on disposal or
scrapping of operating assets (3) 4
• Impairment charges 2 101
• Goodwill amortisation 21 (26)
• Our share of associates’ goodwill
amortisation and exceptional items 45 52
• Tax effect on the above items 1 (9)
Headline earnings 784 1 098 (29)

DIVIDEND OF 60 CENTS PER SHARE DECLARED
21
CONSOLIDATION OF TICORLIMITEDFollowing the increase of our
shareholding in Ticor to 50,12% in
March, we consolidated Ticor from
1 April 2003. The effect of the
consolidation is shown in table 7.
We have subsequently increased our
shareholding in Ticor to 51,38% as at
30 June 2003.
DIVIDENDSThe effect of the challenging market
conditions on the group’s operating
results and cash flow necessitated a
review of the level of the maiden
dividend of 85 cents per share that was
declared in August and paid in
September 2002, based on the group’s
exceptional results in a weak currency
environment in the 2002 financial year.
The board accordingly approved a
dividend of 60 cents per share in
South African currency for the
financial year ended 30 June 2003
payable in September 2003. The
dividend is covered 4 times by
attributable earnings.
It remains our aim to declare regular
dividends annually in August, payable
in September. The level of dividend
payments is reviewed against prevailing
trading conditions, our balance sheet
structure and available cash flow,
taking cognisance of value adding
growth opportunities.
CASH FLOWThe lower earnings before interest, tax,
depreciation and amortisation,
increased working capital requirements
(mainly in respect of the Ticor SA
project and as a consequence of the
consolidation of Ticor), finance charges
and dividend and tax payments,
resulted in a reduced cash flow from
operating activities from R2 184
million to R780 million (table 8).
Cash flow, before the investment intothe Ticor SA project development, wasR319 million positive.
Table 7
R million Consolidated group Ticor effect
Revenue 7 469 2751
Net operating profit 1 212 351
Equity accounted income
before tax 2 572
Attributable profit 718 49
Headline earnings 784 46
Net debt 2 374 432
1. For the quarter ended 30 June 2003.
2. For the nine months ended 31 March 2003.
Note 23 to the financial statements contains a detailed analysis of the business combination effect.
Table 8
R million 2003 2002
Cash flow from operating activities 780 2 184
Cash used in investing activities
• Capital expenditure – Ticor SA project (923) (631)
• Capital expenditure – other (463) (454)
• Proceeds on disposal of property, plant and equipment 44 25
• Increase in cash resources on acquisition of a
controlling interest in subsidiaries 366
• Acquisition of joint ventures and associates (34)
Other (8) (59)
Net cash (outflow)/inflow (238) 1 065

DIVESTMENT OF NON-COREINTERESTSSubsequent to 30 June 2003, we
divested of our 30,13% interest in
Mincor Resources NL, a listed
Australian mining and exploration
company into which our gold and
exploration assets were vended in
1999. The proceeds of the sale,
before tax, at a price of 41 Australian
cents per share, were AUD21 million
(R103 million).
Negotiations are presently taking
place with the objective to sell our
40% interest in two bulk ore carriers
while our position as a major share-
holder in AST will be regularly
reviewed.
FINANCIAL STRUCTURENet borrowings increased by
R1 231 million to R2 374 million
mainly as a result of the high level
of capital investment in the Ticor
SA project, and the consolidation
of the net debt of Ticor Limited,
Australia.
The group’s debt to equity ratio was
39% with net debt 1,4 times Ebitda.
The composition of Kumba’s net debt,
and the redemption profile of the long
term interest-bearing borrowings, is
shown in table 9.
The group is presently assessing
alternative funding sources with the
objective of refinancing a portion of
the loan maturities up to 2006 with
a well spread redemption profile.
CAPITAL EXPENDITURETable 10 shows a comparison of
estimated and actual capital
expenditure for the 2003 year,
together with an estimate for the
next year.
Financial review continued
22
The group’s capital expenditure over
the last two financial years has been
dominated by the investment in both
the mining and smelting heavy
minerals operations of the Ticor SA
project in KwaZulu-Natal.
Table 9
Redemption
Drawn Available profile
Loan composition Rm Rm Year Rm
Long term
• Corporate 1 404 2004 407
• Ticor SA project 1 060 60 2005 697
• Ticor Ltd 744 2006 1 126
3 208 60 2007 273
Thereafter 705
3 208
Short term 130 1 820
Total 3 338 1 880
Cash balances (964)
Net debt 2 374
Table 10
2004 2003 2002
R million Estimate Estimate* Actual Actual
Sustaining capital 347 446 247 283
Expansions 257 146 203 146
Environmental 47 43 13 25
Ticor SA project 480 1 156 923 631
Total 1 131 1 791 1 386 1 085
*2002 annual report estimate.

POST-RETIREMENT BENEFITLIABILITYThe three accredited medical aid
funds are structured to exclude any
employer liability for post-retirement
medical benefits in respect of either
existing or past employees.
Our retirement benefit funds comprise
a number of defined contribution
funds and two closed defined benefit
funds. These funds were adequately
funded as per the last actuarial
valuation.
SHARE PRICE PERFORMANCEA year-on-year comparison shows that
the volume weighted average share
price for the year under review was
R33,79 against R43,31 for the
previous year, while daily trade in
shares averaged 623 513 in 2003
compared with 1 268 534 in the
corresponding period. In the current
financial year, the share peaked at
R49,05 in July 2002 (against a high
of R59,00 in the previous financial
year) and bottomed at R24,13 in
April 2003.
Since listing, Kumba has
outperformed both the Alsi 40 and
Resources indices. However, during
the second half of the year under
review, the relative rand strength
and volatility has had a negative
impact on resource shares in general
and our share price in particular,
so much so that share price
CAPITAL EXPENDITURE IN THE PAST TWO YEARS DOMINATED BYINVESTMENT IN TICOR SA
23
performance up to the 52-week low
on 25 April 2003 (corresponding
with a 2,5 year high in the rand
against the US dollar) under-
performed the JSE Resources index
by 27%. Since then, relative rand
stability and general investor
appetite for resources shares have
seen Kumba outperforming the
index by 20%.
RELATIVE SHARE PRICE PERFORMANCE SINCE LISTING
Nov’01
Jan’02
Mar’02
Jul’02
May’02
Sep’02
Nov’02
Jan’03
Mar’03
May’03
60
55
50
45
40
35
30
25
20
15
10
5
0
KMB ALSI 40 Resources Index
SHARE PRICE AGAINST DAILY TRADING VOLUMES
Nov’01
Jan’02
Mar’02
Jul’02
May’02
Sep’02
Nov’02
Jan’03
Mar’03
May’03
10 050 000
8 050 000
6 050 000
4 050 000
2 050 000
50 000
70
60
50
40
30
20
10
0 Feb’02
Apr’02
Jun’02
Aug’02
Oct’02
Dec’02
Feb’03
Apr’03
R29.08
R59.00R55.87
R33.41R29.83
R24.13
R30.20
Volume traded Share price
R49,05
A STEPPING STONE OF OPPORTUNITYFOR SOUTH AFRICA
A common purpose is the upliftment of our country and
its people. Kumba is firmly anchored in South African
soil and our commitment to the country enables us
to act as a stepping stone to a brighter future.
24

OVERVIEW
The positive operational results of the five strategic business units (SBUs)
reflect the strong drive for people performance and operational excellence.
Very high levels of world steel production, supported by phenomenal growth
in Chinese iron ore imports, resulted in strong demand for iron ore. Good
domestic demand from the steel, ferroalloy and power utility sectors
supported the strong sales of coal and industrial minerals products.
The heavy minerals business enjoyed good sales of zircon and, during
the year, offtake agreements for titanium dioxide slag were finalised. The
zinc business remained depressed, with metal prices and treatment charges
at record lows, exacerbated by the strength of the rand.
The safety, health, environmental and quality performance reflects a
substantial improvement and the number of fatalities has been halved to
four from the previous year’s eight. The goal remains an injury-free
environment and the loss of four colleagues is deeply regretted.
Several of our operations have now been accredited with international
standards for safety, OSHAS 18001, and environment, ISO 14001, and
a programme to have all operations accredited is under way, with completion
scheduled for December 2004.
OPERATIONAL EXCELLENCEAchievements: The programme to
improve performance through
initiatives focused on people,
processes and operational excellence
brought about a number of excellent
results:
• Record iron ore production output
of 26,2Mt from Sishen mine
• Record of 26,1Mt of iron ore
railed from Sishen to the
Saldanha port
• The ramp-up of the first furnace
at the Ticor SA heavy minerals
business is progressing according
to schedule
• Record annual coal sales at the
Grootegeluk mine
• Record annual production of
zinc metal of 115 000 tonnes
from Zincor
• Record annual production of zinc
concentrate of 91 229 tonnes
from the Rosh Pinah mine
• Increased sales volumes to the
value of R429 million
• Cost containment below inflation
Targets: Challenging targets have
been set:
• Increase in sales tonnages of 2%
to the value of R426 million in
the 2004 financial year
• A reduction in real production costs
of 2% to the value of R123 million
in the 2004 financial year
• Business improvement
programmes at Base Metals to
realise value of R115 million by
the 2005 financial year
BUSINESS OPERATIONS REVIEW
25

The iron ore strategic business unit
(SBU) is one of the world’s major high-
grade lump iron ore producers.
It operates two mines in South Africa,
Sishen in the Northern Cape and
Thabazimbi in Limpopo. Sishen
accounts for 4% (21Mt) of global
seaborne trade and 85% of local
production, while all of Thabazimbi’s
production is supplied to Iscor on a cost
recovery basis plus a management fee
of 3% of such cost. Actual tonnage sold
for the year increased by 6% due to
high demand and the good performance
of the total business logistical chain.
During the review period, Sishen
and Thabazimbi produced record
tonnages of iron ore with Sishen
accounting for 92% of the total
production. Sishen exported 76%
of its production through Saldanha
Bay to 34 major steel producers in
12 countries around the world, while
24% was railed to Iscor, Saldanha
Steel mill and other domestic
consumers.
material feedstock into furnaces when
blended with other ores due to its
high iron content and superior
physical properties.
Sishen continuously focuses on
maximising production and
distribution volumes. Having
implemented sophisticated production
management systems and through
plant modifications, Sishen is
expected to reach 27Mtpa capacity by
December 2004. The new up-current
classifier plant will add 300 000tpa
of fine ore capacity. The utilisation of
improved primary feed systems as
well as focused measurement of the
production process will facilitate a
further 700 000tpa capacity. These
initiatives will also improve the ore
extraction efficiency and the mine’s
competitive position.
Concurrently, the rail and port
infrastructure associated with exports
is being upgraded by Transnet.
Negotiations between Kumba and
Transnet for additional rail line and
iron ore export capacity through the
port of Saldanha Bay started during
the year. A project team will determine
the ultimate capacity of the
infrastructure before the allocation of
capacity can be finalised. Technical
studies are under way to evaluate and
determine the feasibility of a number
of options to increase local iron ore
production by up to 8,5Mtpa within
five years. The domestic and other
growth opportunities in Australia are
discussed in the growth opportunities
review on page 36.
Business operations review continued
26
2003 Y-O-Y
Physical information 000t* %
Total production 28 557 +1
Total sales 29 716 +6
Exports 20 946 +5
Domestic 8 770 +7
Capital expenditure (R million) 211 -17
* = metric tonnes
Y-O-Y = year-on-year
IRON ORE
In April 2003, global iron ore prices
increased by 9,0% for fine and 8,9%
for lump ore, reflecting the influence
of Chinese demand and were fixed
for 12 months. China is the most
important growth factor in the iron ore
market and has indicated a demand
for increased quantities of Sishen iron
ore. Sishen ore is highly sought after
as it improves the quality of the raw
REVENUE
RSA 21%
UK 10%
Germany 7%
Austria 7%
Japan 15%
China 32%
Other 8%

Cost containment is an ongoing priority
at Sishen and various programmes
have been launched. Selective mining
techniques that will have a positive
effect on waste removal have been
implemented, and ore gains have
already been experienced.
Programmes to contain the cost of
maintenance, especially the cost
of wear and tear and consumption of
steel in the crushers as well as wear
on the conveyer belts, have been
successfully implemented.
Highlights of the review period
include a decrease in the lost day
injury rate at Thabazimbi from
2,78 to 1,21 and final approval of
the Sishen environmental
management plan. Sishen also
received a golden award from the
National Productivity Institute,
while its mine sampling laboratory
received internationally-recognised
ISO 17025 accreditation.
CAPITAL EXPENDITUREActual Estimate
R million 2003 2004
Sustaining 76 166
Environmental 2 24
Expansion 133 51
Total 211 241
RECORD PRODUCTION FROM ONE OF THE WORLD’S MAJOR HIGH-GRADELUMP IRON ORE PRODUCERS
27
Iron ore operations
and new housing
development at
the Sishen and
Thabazimbi mines.

Business operations review continued
28
The coal SBU operates three collieries
in South Africa and is the country’s
fifth-largest coal producer.
Grootegeluk mine in Limpopo and
Leeuwpan in Mpumalanga, are
conventional open-pit operations.
Tshikondeni, in Limpopo, is an
underground mine that supplies its
entire production to Iscor at cost plus
a management fee of 3% of
such cost.
During the year, the collieries
produced 18Mt of thermal,
metallurgical and coking coal with
Grootegeluk accounting for 90% of
the total production.
Overall, both operational and financial
performance were boosted by a
continued focus on cost efficiency
resulting in an annual average
decrease in costs of 1,9% (real) for
the past three years. The SBU also
focused on maximising throughput to
higher margin market segments, such
as the metals market, into which
record sales were realised.
Production at Grootegeluk was affected
by a turbine failure on one of the six
units at Matimba, one of Eskom’s
major power stations, which persisted
for the greater part of the year. The
relatively high volumes of thermal coal
supplied to this market despite the
turbine failure were achieved through
improved availability and utilisation
of power station supply equipment.
A strong focus in improving the
efficiencies of a logistical rail
bottleneck at Grootegeluk has resulted
in a record volume of coal dispatched
of some 3,1Mt against a previous
record of 2,8Mt.
Leeuwpan recorded a solid performance
in terms of operations and cost control
despite the negative impact on
production, having encountered an
unexpected area of devolatilised coal
seams during the year.
Tshikondeni’s re-engineering
programme has led to the development
and implementation of a new mine
plan, which is on schedule.
The SBU is strategically positioned in
the market to supply coal to Eskom
and is the fourth-largest supplier to
the utility. The geographical location
of Leeuwpan relative to the Majuba
and Thutuka power stations which
experienced shortages of coal supply
and the mine’s ability to supply
timeously a product of consistent
quality, has resulted in Eskom showing
an interest in coal supply from
Leeuwpan. As an interim arrangement
the mine has started to supply the
power station with coal during the last
quarter of the financial year.
Total sales to the metals segment were
1,5Mt for the year, which were in line
with sales for the previous year. Some
64% of sales prices are US dollar-
based and an average increase of 4%
in dollar terms was realised during the
year. On the remaining 36% of sales
that are rand-based, an increase of
8% was realised.
Export volumes of 1,1Mt were in line
with the previous year. Average US
dollar prices were approximately 9%
higher, but rand income was lower
due to the stronger exchange rate,
higher distribution costs and the cost
of export allocation through the
Richards Bay Coal Terminal.
A brownfield project planned by the
SBU is a second-stage beneficiation
2003 Y-O-Y
Physical information 000t* %
Total production 18 012 -1
Total sales 18 000 0
Eskom 13 051 -1
Other domestic 3 821 +3
Exports 1 128 -4
Capital expenditure (R million) 125 +26
* = metric tonnes
Y-O-Y = year-on-year
COAL

RECORD PRODUCTION HIGHLIGHTS THE SUCCESS OF A MULTI-FACETEDCONTINUOUS IMPROVEMENT PROGRAMME
29
project at Grootegeluk where suitable
products will be produced for ultimate
consumption in the coke market
sector.
CAPITAL EXPENDITUREActual Estimate
R million 2003 2004
Sustaining 96 84
Environmental 8 21
Expansion 21 100
Total 125 205
Above: The Grootegeluk mine with the
Matimba power station in the distance.
Left and below: Operations at Grootegeluk.

The base metals SBU comprises the
Zincor and Rosh Pinah operations.
Rosh Pinah in southern Namibia is
an underground lead zinc mine that
produced a record of 91 229 tonnes
of zinc-containing concentrates.
These concentrates account for 37%
of Zincor’s annual requirements.
Lead-containing concentrates, which
amounted to 30 000 tonnes during
the year, were exported through
Walvis Bay. Increased production
resulted primarily from higher feed
grades and de-bottlenecking.
The global zinc market remained in
oversupply throughout the year,
resulting in weak US dollar prices,
which traded between $740 and
$800 per tonne. During the first half
of the year, the SBU was shielded
from the effect of a low price by
a weaker local currency. The
strengthening of the rand resulted in
a sharp reduction in the realised rand
zinc price to approximately R6 200
per tonne.
Although local zinc metal sales were
relatively soft during the year,
increased exports resulted in record
sales for Zincor while Rosh Pinah
achieved higher sales of lead
concentrates.
The Zincor zinc refinery has long-term
offtake agreements with its major
customers, and produced 115 000
tonnes of zinc metal during the year.
This capacity will increase as
de-bottlenecking activities continue.
The record production was achieved
through the utilisation of imported
concentrates with higher grades and
increased plant availability. Zincor is
the leading supplier of zinc in east
Africa, with well-established markets
in Kenya and Tanzania.
In an effort to increase the per
capita consumption of zinc in
South Africa, the SBU has been
instrumental in founding the southern
African branch of the International
Zinc Association (IZASA). The aim is
to promote the use of zinc through
various technical and marketing
initiatives into the primary industries
that consume zinc metal.
To protect declining margins resulting
from the continued depressed zinc
price and the strength of the rand,
Business operations review continued
30
2003 Y-O-YPhysical information 000t* %
Total production 228 +10
Zinc concentrate 91 +21Zinc metal 115 +10Lead concentrate 22 -21
Total salesZinc metal 112 +4
Domestic 92 -2Exports 20 +43
Lead concentrate 30 +20Capital expenditure (R million) 73 -19
* = metric tonnes
Y-O-Y = year-on-year
BASE METALS

the SBU has embarked upon a
business improvement programme.
This cost reduction and revenue
enhancement initiative targets an
operating profit improvement of some
R115 million by June 2005.
CAPITAL EXPENDITUREActual Estimate
R million 2003 2004
Sustaining 22 19
Environmental 3 2
Expansion 48 106
Total 73 127
The higher capital expenditure in
respect of project developments is
mainly as a consequence of the
expansion of the Hongye refinery in
China which is dealt with in the
growth opportunities review on
page 36.
ONE OF THE FEW INTEGRATED ZINC MINING AND SMELTINGOPERATIONS IN THE WORLD
31
Base metals operations at the Zincor
refinery, and ZnERGY plant (below
and right).

Business operations review continued
32
Physical information Ticor SA Ticor Ltd1
2003 Y-O-Y 2003 Y-O-YTotal production 000t* % 000t* %
Ilmenite 91 +107% 428 -4%Zircon 53 +18% 80 +4%Rutile 20 +5% 36 +24%Low manganese pig iron (LMPI) 3 100%Leucoxcene 26 +44%Synthetic rutile 179 +1%Pigment 94 +3%
Total salesIlmenite 50 +39% 126 -22%Zircon 60 +82% 83 -5%Rutile 19 +58% 28 -3%Leucoxcene 19 -21%Synthetic rutile 81 -13%Pigment 81 -9%
1. Tonnages reflect 100% of the production and sales volumes of the Tiwest joint
venture in which Ticor Ltd has a 50% interest.
* = metric tonnes
Y-O-Y = year-on-year
HEAVY MINERALS
Through its strategic investment inTicor Limited and Ticor SA, the SBUis positioned to become the thirdlargest producer of slag feedstock by2005, when both furnaces at Ticor SAare at full production.
During the year under review, the SBUhad to contend with the continueddownturn in the world economy andongoing downward pressure ontitanium feedstock prices. Demandfor zircon remained strong, withsignificant potential in the Chinesemarket. Sales of zircon and rutile fromTicor SA increased by 82% and 58%year-on-year respectively. Ilmeniteprices were negatively affected by the
depressed market conditions andcompetition from Indian producers,although sales for the year were higher.A long-term off-take agreement forilmenite was concluded early in 2003.
At the Ticor SA operations, most ofthe crude ilmenite continued to bestockpiled for feedstock to thesmelter. The increase in production ofthe various products was the result ofthe successful commissioning of theup-front desliming cyclone andincreased efficiencies at the primarywet and mineral separation plants.
The first furnace of the smelter wascommissioned in March 2003 and its
ramp-up programme is on schedule.The construction of the secondfurnace is more than 95% complete.
Phase 1 of the Ticor SA project,consisting of the Hillendale mine andthe mineral separation plant, hasreached full production capacity andwas completed on schedule andwithin its budget of R738 million.The first furnace (phase 2 of theproject) has also been completed onschedule and within its budget ofR916 million. Construction of thesecond furnace is on schedule andwithin its budget of R361 million.
The project’s total fundingrequirements of R3 500 million,which includes the development ofthe Fairbreeze mine and workingcapital requirements, are funded by:
R million
Shareholders: 2 200Kumba 1 300Ticor Ltd 900
Project finance loans 1 300
Fundingrequirements 3 500
The operations of Ticor Ltd inAustralia include a mine at Cooljarloo,a synthetic rutile plant at Chandala, apigment plant at Kwinana and acyanide plant at Gladstone. Thecyanide plant is 100% owned whilethe heavy minerals operation consistsof the mine, and synthetic rutile andpigment plants which are ownedjointly with Kerr McGee. The Tiwest

ON TRACK TO BE THE THIRD-LARGEST PRODUCER OF HEAVY MINERALSFEEDSTOCK BY 2005
33
joint venture is one of the few fullyintegrated mines to pigment producers.
During the year Ticor Ltd completedthe acquisition of Magnetic MineralsLtd through which it securedadditional heavy minerals reserves inWestern Australia. This will extend thelife of mining operations of Ticor Ltd.
Ticor SA continues to evaluateresources in the Eastern Cape(Centane) and in KwaZulu-Natal(Port Durnford), and the prospect ofacquiring prospecting rights inMadagascar (Tulear).
Market consensus is that feedstockdemand is expected to grow at2,6% pa with the main growth inthe chloride slag sector, which isanticipated to remain in oversupplyuntil 2005. Ticor SA has concludedlong-term off-take agreements for themajor portion of its chloride slagproduction.
Ticor SA is on schedule to deliver itsfirst consignment of chloride slagtowards the second quarter of the2004 financial year. The firstshipment of low manganese pig iron(LMPI) occurred in August 2003.
CAPITAL EXPENDITUREActual Estimate
R million 2003 2004
Sustaining 28 32Environmental – –Expansion 923 480
Total 951 512
Ticor SA’s Empangeni operations.

The SBU comprises the Glen Douglas
open-cast mine producing
metallurgical dolomite, aggregate and
small quantities of agricultural lime;
a ferrosilicon plant in Pretoria
producing a superior gas-atomised
ferrosilicon powder; and a 50%
interest in the Bridgetown
dolomite mining joint venture in
the Western Cape.
The Glen Douglas mine supplies the
requirements of the domestic steel
industry, in particular the demand for
metallurgical dolomite from Iscor, and
maintains its market share of some
10% in the aggregate business in
southern Gauteng. The operations
benefited from positive growth in the
steel and construction industry during
the year.
The Bridgetown joint venture supplies
dolomite to the Saldanha Steel mill.
The ferrosilicon operations are
strategically positioned to meet the
beneficiation needs of Kumba’s iron
ore mines with some 75% of output
supplied to the mines and an
increased market penetration in the
diamond, chrome and export markets.
Business operations review continued
34
2003 Y-O-Y
Physical information 000t* %
Total dolomite production 1 327 +3
Total dolomite sales 1 321 +1
Metallurgical 642 +15
Aggregate 585 -10
Lime 94 0
Total ferrosilicon production 5 0
Total ferrosilicon sales 5 +25
Capital expenditure (R million) 5 +56
* = metric tonnes
Y-O-Y = year-on-year
INDUSTRIAL MINERALS

OPERATIONS BENEFITED FROM POSITIVE GROWTH IN THE STEEL ANDCONSTRUCTION INDUSTRY
35
The Glen Douglas dolomite mine
situated in Gauteng and its social
responsibility programmes.

IRON ORESishen South is an important ironore project in the Kgalagadi regionof the Northern Cape, and 70kmsouth of Sishen mine.
A R55-million study to confirm thetechnical and economic potential ofthe project in a bankable format isnearing completion and this, togetherwith the environmental and socialimpact assessments required tosecure a mining permit, will becompleted by December 2003.
If treated on a stand-alone basis,Sishen South would be developedas an 8-10Mtpa open-pit mine ata capital cost of around R2 billion,including beneficiation facilities thatwould render its output compatiblewith the high-grade ore producedfrom Sishen. Under this scenario,Sishen South ore would be railedvia Sishen to the export terminal atSaldanha Bay.
Alternative development scenariosinvolve the exchange or amalgamationof iron ore assets owned by the twomain operators in the region, and arethe subject of continuing discussionbetween the parties concerned.Subsequent to the year end, a heads ofagreement was signed with Assmang.
Conversion to bankable status of thetechnical feasibility study into theHope Downs iron ore project in thePilbara district of Western Australiahas continued since the completionof a value-engineering exercise earlyin 2003. The project is a jointventure between Kumba and HancockProspecting (Pty) Limited, a Perth-based company that discovered and
undertook the initial evaluation ofthe property.
The present study commenced in1998 on the assumption that accessto existing privately-owned railinfrastructure could be securedthat would facilitate the export of10-15Mtpa of high-grade MarraMamba ore from Hope Downs viaone of three terminals along theAustralian west coast, some 350kmdistant. When it became apparentthat this option might be difficultto achieve, the rail owners beingcompeting iron ore producers, thestudy was extended to includeprovision for the construction of newrail infrastructure and a terminal atPort Hedland. This resulted in anincrease in the capital cost of theproject to its current level of AUD1,6 billion, necessitating in turn,an increase in the scale of operationsto 25Mtpa. The reserve base of450Mt, with substantial additionaladjacent resources, would besufficient to sustain an operation ofthis size; and forecast market growthwould be able to accommodate suchoutput without difficulty.
The project team is currently compilingan information memorandum, whichselected potential equity investorswill be invited to receive during the
second half of 2003. In the meantime,efforts continue to be made to identifymutually-beneficial rail-accessagreements with the owners of existinginfrastructure.
In West Africa, a due diligence studyon three iron ore deposits in Gabonconcluded that resource quality andthe absence of rail and portinfrastructure detract from theirdevelopment potential. Other depositsin closer proximity to existing railinfrastructure are currently underinvestigation.
In Senegal, a due diligence studyof the Faléme deposit showed thatthe property could have commercialpotential only if infrastructuredevelopment were to be fundedby government or internationalorganisations. Discussions in thisregard are continuing.
COALKumba’s coal business unit andempowerment company, EyesizweCoal, have concluded an agreementto develop jointly an open-pit coalmine at Kalbasfontein, north-eastof Witbank in Mpumalanga, for anexpected capital investment ofR300 million. Development of themine, which is planned to produce1,0Mtpa of export-quality steam coal,will commence as soon as the long-awaited approval of the portauthorities has been obtained forthe phase V expansion of the coalterminal at Richards Bay.
A feasibility study was undertakento determine the viability of second-stage washing in the number 2beneficiation plant at Grootegeluk
GROWTH OPPORTUNITIES
36
Pilbara
Australia

to increase production of semi-softcoking coal. The project envisagesthe production of an additional0,7Mtpa of material destined forsupply to the coke-making facilitiesof Suprachem, as well as to otherdomestic and international customers.A decision to proceed with themodification of the plant will be takenonce Suprachem confirms its ownexpansion plans.
A pre-feasibility investigation into theproduction of char/formed coke, alsoat Grootegeluk, is nearing completionand it is expected that a fullfeasibility study will be conductedduring the coming year. The scopeof this project includes the open-castand possible high wall undergroundmining of benches 11 and 13 in thecurrent Grootegeluk pit, together withthe construction of a separatebeneficiation plant and three char-manufacturing facilities. The latterwould cater for the reductantrequirements of the ferrochrome,ferromanganese and titanium slagindustries. A second phase willconsider the manufacture of formedcoke for the ferroalloy sector. At fullproduction, the overall project couldproduce 0,6Mtpa of char and 0,4Mtpa of formed coke.
A strategy to develop additional coalreserves in the Waterberg Field in aphased programme has been draftedand is currently being discussed withrelevant government departments andpotential partners.
BASE METALSExploration for further ore bodiesto augment the reserves availableto Rosh Pinah mine continued, with
significant new resources discoveredduring the past year.
In China, work on the expansion ofthe Hongye zinc refinery at Chifengin Inner Mongolia is progressing wellfollowing the approval of the Kumbaboard to proceed with the project.This entails doubling the capacity ofthe refinery to 50 000 tonnes of zincmetal per annum, a target that isscheduled to be met towards the endof 2004. Kumba’s 60% participationin the venture, which includesconstruction of a roasting plant andoverall management of the totalbusiness, limits its total exposure toYuan140 million (R125 million);other participants are the owners ofthe Hongye refinery and the principalsuppliers of concentrate feedstock.
Despite continued efforts on the partof the South African government andother brokers to halt hostilities in theDemocratic Republic of Congo (DRC),it has so far proved impossible tosecure the unqualified support ofall protagonists. This, together with thereluctance of important constituencieswithin the DRC to accept the newmining code developed by thegovernment in collaboration withWorld Bank, has delayed a return toconditions conducive to investment.Consequently, it has not beenpossible either to proceed with afeasibility study on the refurbishmentof the Kipushi zinc/copper mine orwith an update of the feasibilitystudy conducted in 1998 on theKamoto copper/cobalt mine duringthe last year.
The ZnERGY plant in which Kumbahas a 85% interest was established
late in the financial year and is in theprocess of ramping up to fullproduction. The R16 million plant,with an annual design capacity inexcess of 200 000 units, producesenvironmentally friendly zinc-air fuelcells under licence from ZOXY EnergySystems AG of Germany. The productis destined predominantly for Europe,while the African market, for whichthe company has exclusive marketingrights, is developed.
HEAVY MINERALSDuring July, Kumba’s Australiansubsidiary Ticor Limited announcedthat it had concluded an agreementwith Madagascar Resources NL toconduct feasibility studies on theTulear mineral sands deposits insouth-western Madagascar.Preliminary indications are that theextent of mineralisation at Tulear hasthe potential to support an expansionof the Empangeni smelting operationnear Richards Bay.
IFCON™In the previous annual report,reference was made to research beingundertaken on the development ofa new process technology, IFCON™,that appeared to have potential forthe low-cost production of metalsfrom a variety of feedstock. Duringthe last year, this work continuedto the point where a demonstrationfurnace, designed to test thecommercial viability of the process,was commissioned at the close ofthe reporting period. A number ofsmelting campaigns are scheduledfor the coming year, with particularemphasis on determining theapplication of the process to ferroalloymanufacture.
37

38
The mineral resources and reserves
attributed to Kumba’s current
operations and development projects
are summarised in the tables on
page 39. All projects are being re-
evaluated to establish their status and
relevance under the conditions
created by the new Mineral and
Petroleum Resources Development
Act No 28 of 2002.
Resource and reserve estimates listed
in the tables have been compiled in
accordance with the SAMREC code
in respect of southern African
properties and the JORC code in
respect of Australian properties.
Estimates were determined using
internationally-accepted methods
by competent persons as defined by
the SAMREC code. The figures have
been reviewed and endorsed by the
competent person within Kumba
responsible for mineral resources and
reserves estimates, HJ van der Berg,
the undersigned.
HJ van der Berg
Manager, Geological Services
Kumba believes that although a
mineral deposit is, by definition, a
finite and exhaustible resource no
matter how large it may appear, the
economical life of a resource can be
comprehensively extended through
responsible and skilful exploitation
ethics. It is therefore the group’s
explicit policy to enhance mineral
resource management at all its
operations through responsible
exploitation, innovative practices and
creative development.
Kumba has access to high-quality
resources in all its core commodities
and the two principal operations,
Sishen iron ore mine and
Grootegeluk coal mine, are both
founded on extensive mineral
resources. Nevertheless, in both
cases, as well as at the smaller
mines, the principle of optimal
utilisation of the mineral resource
through innovative geological,
metallurgical and mining initiatives
has been implemented as part of the
total process philosophy from the
exploration phase through to delivery
of final product to the client.
At Sishen, the use of geostatistical
and geophysical methods to qualify
and quantify ore more accurately is
showing very promising results, and
projects to utilise previously
unsuitable ore are well advanced.
Grootegeluk is focusing strongly on the
development of high-value products
from selected coal units in the
succession. Thabazimbi has extended
the life of its reserves beyond
expectation by the ingenious
implementation of selective mining.
Tshikondeni, by being creative in the
adaptation of mining techniques, has
succeeded in mining coal originally
regarded as unmineable; consci-
entious marketing efforts have led to
the creation of niche markets for
previously underrated, low-volatile coal
from the Leeuwpan pit; and at Rosh
Pinah, careful blending of ores of
widely varying zinc:lead ratios had
ensured acceptable feedstock for the
plant that optimises the available
resource base.
The mineral resource at Sishen South
has increased significantly by the
acquisition and exploration of two
adjacent properties. The limited
drilling completed to date indicates
there is good potential to find more
ore of high quality and the programme
is continuing. Planned exploration
drilling in the vicinity of the Leeuwpan
coal mine in the immediate future
should add valuable reserves to the
life-of-mine plan. Exploration of the
area surrounding Rosh Pinah mine has
intensified, following the discovery of
significant new mineralisation during
the last year.
REVIEW OF MINERAL RESOURCESAND RESERVES

39
Estimated mineral resources Estimated mineral reserves
in situ resources (Mt) Probable (Mt) Proved (Mt) Total (Mt)
Cut-off Average
Commodity Mine Inferred Indicated Measured Total grade RoM Saleable RoM Saleable RoM Saleable grade
Base metals Rosh Pinah mine 0,89 3,83 2,01 6,73 4% Zn+Pb 3,74 – 1,61 – 5,35 – 10,2% Zn
Iron ore Sishen mine 248,47 411,08 974,77 1 634,32 60% Fe 131,80 102,46 655,46 525,29 787,26 627,75 61,1% Fe
Thabazimbi mine 24,38 26,15 40,44 90,97 60% Fe 5,22 4,41 15,04 12,72 20,26 17,13 62,8% Fe
Heavy Hillendale minea – – 70,40 70,40 1,5% llm – – 57,13 – 57,13 – 4,1% llm
minerals Fairbreeze (A+B+C)a – 75,22 139,85 215,07 1,5% llm 37,85 – 120,15 – 158,00 – 3,3% llm
Gravelotte (sand)a – – 75,06 75,06 3,0% llm – – 52,35 – 52,35 – 11,0% llm
Coal Grootegeluk mine 2 512,94 2 075,28 1 520,91 6 109,12 raw coal 66,97 33,31 768,08 387,08 835,05 420,39
Leeuwpan mine – 29,80 159,92 189,72 raw coal 47,60 18,22 86,80 39,49 134,40 57,71
Tshikondeni mine – 10,10 30,02 40,12 raw coal – – 9,67 4,91 9,67 4,91
Industrial Glen Douglas mine
minerals – metallurgical
dolomite 117,34 – 186,74 304,08 < 2,5% SIO2 – – 34,91 – 34,91 –
– aggregate
dolomite – – – – raw material – – 18,37 – 18,37 –
– aggregate outside
mine plan 145,06 – – 145,06 raw material – – – – – –
Bridgetown
dolomite mine 12,7 – 7,57 20,27 < 2,5% SIO2 – –– 7,29 3,65 7,29 3,65
Mineral reserves are included within mineral resources
Mineral resources and reserves have been compiled according to the SAMREC code
aHeld as a 60:40 joint venture with Ticor Limited
Estimated mineral resources Estimated mineral reserves
in situ resources (Mt) Probable (Mt) Proved (Mt) Total (Mt)
Total Average Average Cut-off
Commodity Project* Inferred Indicated Measured (Mt) grade RoM Saleable RoM Saleable RoM Saleable grade grade
Iron ore Hope Downs
(Hope 1)b 29 291 199 519 61,5% Fe 259 190 449 61,4% Fe 57%
Sishen South 86,92 126,01 129,85 342,78 64,76% Fe
Zandrivierspoort – 447,0 – 447,0 35,0% Fe
Coal Kalbasfonteinc – – 15,26 15,26 raw coal
Strehlac – 22,52 – 22,52 raw coal
Moranbah Southd 123,73 586,46 – 710,19 raw coal
Heavy KwaZulu-Natala, e – 83,99 4,45 88,44 2,5% llm
minerals Eastern Capea, f – – 232,94 232,94 4,5% llm
Limpopo Province
(sand)a, g 31,30 – 12,50 43,80 5,9% llm
Limpopo Province
(rock)a, h 112,30 53,60 – 165,90 22,4% llm
* Project is defined by the undertaking of at least pre-feasibility study work.
Mineral resources are SAMREC code compliant except for Hope 1 and Moranbah (JORC code compliant)
a Held as a 60:40 joint venture with Ticor Limitedb Joint venture with Hancock Prospecting (Pty) Ltd, Australiac Thermal coald Queensland, Australiae Includes Braeburn, Fairbreeze D, Block P and KwaZulu-Natal depositsf The Centane depositsg Includes Gravelotte pebble deposit and Letsitele sand deposith Includes Gravelotte and Letsitele rock deposits

40
LEGISLATIVE COMPLIANCE
PROGRESS IN ACCORDANCE WITH THE SCORECARD FOR THE BROAD-BASED SOCIO-ECONOMICEMPOWERMENT CHARTER FOR THE SOUTH AFRICAN MINING INDUSTRY
CROSSREQUIREMENTS PROGRESS REFERENCE
Human resources development
• Has the company offered the opportunity • Fully company sponsored, voluntary ABET Pages 68 – 69
to be functionally literate and numerate programmes running at all mines
by the year 2005 and are employees • Leeuwpan and Corporate Office 100% literate
being trained? • Screening and counselling of all ABET candidates
to take informed decisions about participation
in ABET is undertaken
• Incentive scheme to make ABET more attractive
is being implemented
• Has the company implemented career • Human Resources Development (HRD) policy Pages 68 – 69
paths for HDSA employees including in place dealing with accelerated development
skills development plans? • Formal succession planning and individual
development plans rigorously used for all
management and professional categories
• HDSA employees receive special career planning
consideration and mentor support
• Has the company developed systems • Concluded an employee exchange development/
through which empowerment groups can operational exposure agreement with Tiso Capital,
be mentored? an empowerment company
• Concluded a 50% joint venture with Eyesizwe Coal
for development of Kalbasfontein reserves.
Agreement includes skills transfer through
mentorship and service level agreement
• Kumba trains 24% of all apprentices in the
South African mining industry of which the
majority are HDSA
Employment equity
• Has the company published its • Plans submitted to Department of Labour and Page 67
employment equity plan and reported on published on Kumba website
its annual progress in meeting that plan?
• Has the company established a plan to • Employment equity plans in place, supported Page 67
achieve a target for HDSA participation in by strategies in the HRD policy
management of 40% within five years and • Measured and monitored up to board level
is it implementing the plan? on quarterly basis
• Plans monitored per business unit
• Current HDSA management categories: 20%
• Current executive management categories: 33%
• Has the company identified a talent pool • Formal performance management and succession Page 69
and is it fast tracking it? planning processes make it easy to fast-track all
management levels
• HDSA talent pool catered for in succession
planning process
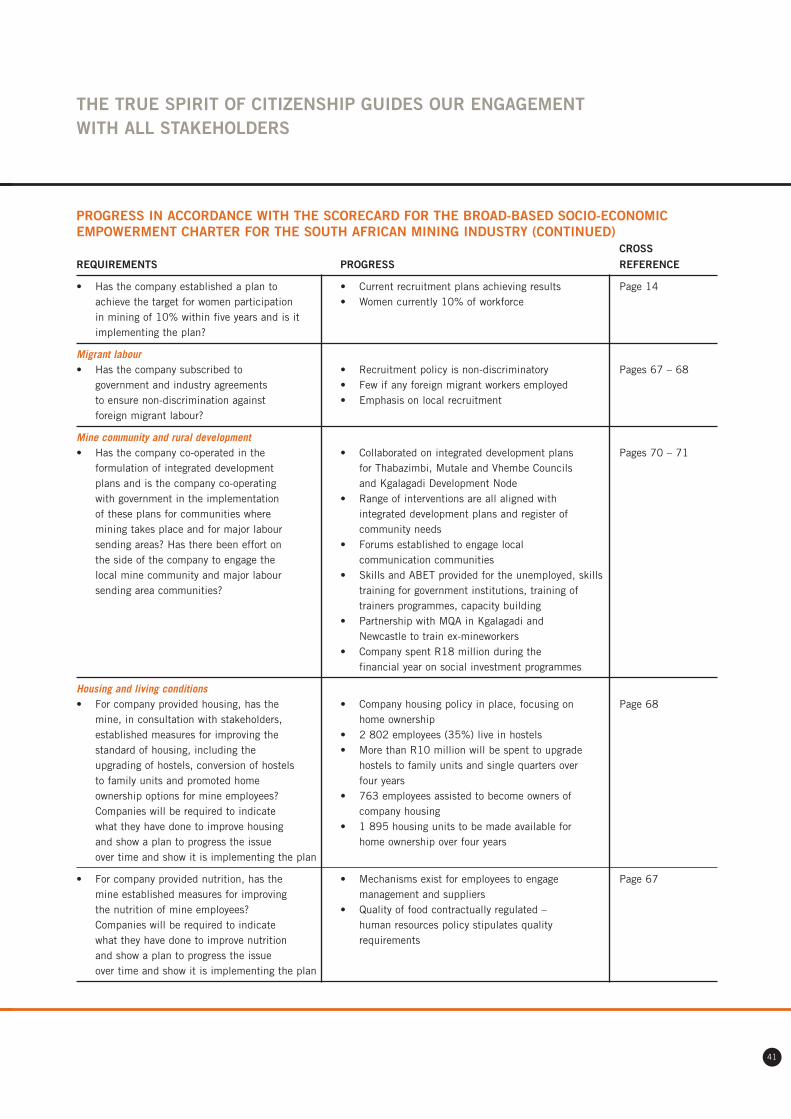
41
PROGRESS IN ACCORDANCE WITH THE SCORECARD FOR THE BROAD-BASED SOCIO-ECONOMICEMPOWERMENT CHARTER FOR THE SOUTH AFRICAN MINING INDUSTRY (CONTINUED)
CROSSREQUIREMENTS PROGRESS REFERENCE
• Has the company established a plan to • Current recruitment plans achieving results Page 14achieve the target for women participation • Women currently 10% of workforcein mining of 10% within five years and is itimplementing the plan?
Migrant labour• Has the company subscribed to • Recruitment policy is non-discriminatory Pages 67 – 68
government and industry agreements • Few if any foreign migrant workers employedto ensure non-discrimination against • Emphasis on local recruitment foreign migrant labour?
Mine community and rural development• Has the company co-operated in the • Collaborated on integrated development plans Pages 70 – 71
formulation of integrated development for Thabazimbi, Mutale and Vhembe Councils plans and is the company co-operating and Kgalagadi Development Nodewith government in the implementation • Range of interventions are all aligned with of these plans for communities where integrated development plans and register of mining takes place and for major labour community needssending areas? Has there been effort on • Forums established to engage local the side of the company to engage the communication communitieslocal mine community and major labour • Skills and ABET provided for the unemployed, skills sending area communities? training for government institutions, training of
trainers programmes, capacity building• Partnership with MQA in Kgalagadi and
Newcastle to train ex-mineworkers• Company spent R18 million during the
financial year on social investment programmes
Housing and living conditions• For company provided housing, has the • Company housing policy in place, focusing on Page 68
mine, in consultation with stakeholders, home ownershipestablished measures for improving the • 2 802 employees (35%) live in hostelsstandard of housing, including the • More than R10 million will be spent to upgrade upgrading of hostels, conversion of hostels hostels to family units and single quarters over to family units and promoted home four yearsownership options for mine employees? • 763 employees assisted to become owners of Companies will be required to indicate company housingwhat they have done to improve housing • 1 895 housing units to be made available for and show a plan to progress the issue home ownership over four yearsover time and show it is implementing the plan
• For company provided nutrition, has the • Mechanisms exist for employees to engage Page 67mine established measures for improving management and suppliersthe nutrition of mine employees? • Quality of food contractually regulated – Companies will be required to indicate human resources policy stipulates quality what they have done to improve nutrition requirements and show a plan to progress the issue over time and show it is implementing the plan
THE TRUE SPIRIT OF CITIZENSHIP GUIDES OUR ENGAGEMENTWITH ALL STAKEHOLDERS

42
PROGRESS IN ACCORDANCE WITH THE SCORECARD FOR THE BROAD-BASED SOCIO-ECONOMICEMPOWERMENT CHARTER FOR THE SOUTH AFRICAN MINING INDUSTRY (CONTINUED)
CROSSREQUIREMENTS PROGRESS REFERENCE
Procurement
• Has the company given HDSAs preferred • Policy, guidelines and systems in place to Page 8
supplier status? promote procurement from HDSA companies
• Preference is given to black-owned and
black empowerment suppliers
• Has the company identified current level • An auditable system is in place and performance Page 8
of procurement from HDSA companies in is tracked
terms of capital goods, consumables • 4,3% discretionary procurement to HDSAs during
and services? the year and 15% target by 2004 financial year
• Has the company indicated a commitment • Kumba has developed policies in this regard since Page 8
to a progression of procurement from 2001 and is committed to a progression over time
HDSA companies over a three to five-year • Co-founder of SA National Preferential
time frame in terms of capital goods, Procurement Forum
consumables, and to what extent has the • 4,3% discretionary procurement to HDSAs during
commitment been implemented? the year and 15% target by 2004 financial year
Ownership and joint venture
• Has the mining company achieved • Ownership implementation framework developed Page 8
HDSA participation in terms of ownership and approved and all strategic business units
for equity or attributable units of mandated to achieve specific objectives at asset
production of 15% in HDSA hands within level to ensure Kumba meets 15%
five years and 26% in ten years? and 26% targets within required timeframe
• Tiso Kgalagadi Consortium’s 4,8% equity stake in
Kumba facilitated through a 10% discount
• 50% joint venture development of
Kalbasfontein coal mine with Eyesizwe Coal
Beneficiation
• Has the mining company identified its • Baseline level established for various Supply agreement
current level of beneficiation? commodities with Iscor
• Has the mining company established its • New beneficiation projects identified and Pages 26 – 29
base line level of beneficiation and evaluation of potential ongoing
indicated the extent that this will have to • Kumba has a specific case to make for
be grown in order to qualify for an offset? beneficiation credits based on its unique supply
agreements with the steel industry, covering
iron ore, coal, zinc and dolomite
Reporting
• Has the company reported on an annual • Extensive reporting on progress through the 2003 annual report
basis its progress towards achieving its scorecard and various areas of this report
commitments in its annual report?
Legislative compliance continued

EXECUTIVE COMMITTEE
1 Marie Viljoen2 Dr Con Fauconnier3 Pat Mdoda4 Richard Wadley5 Trevor Arran6 Charles Meintjes7 Ras Myburgh8 Neels Howatt9 Dirk van Staden10 Mike Kilbride
43
87 10
69
5
3 4
21
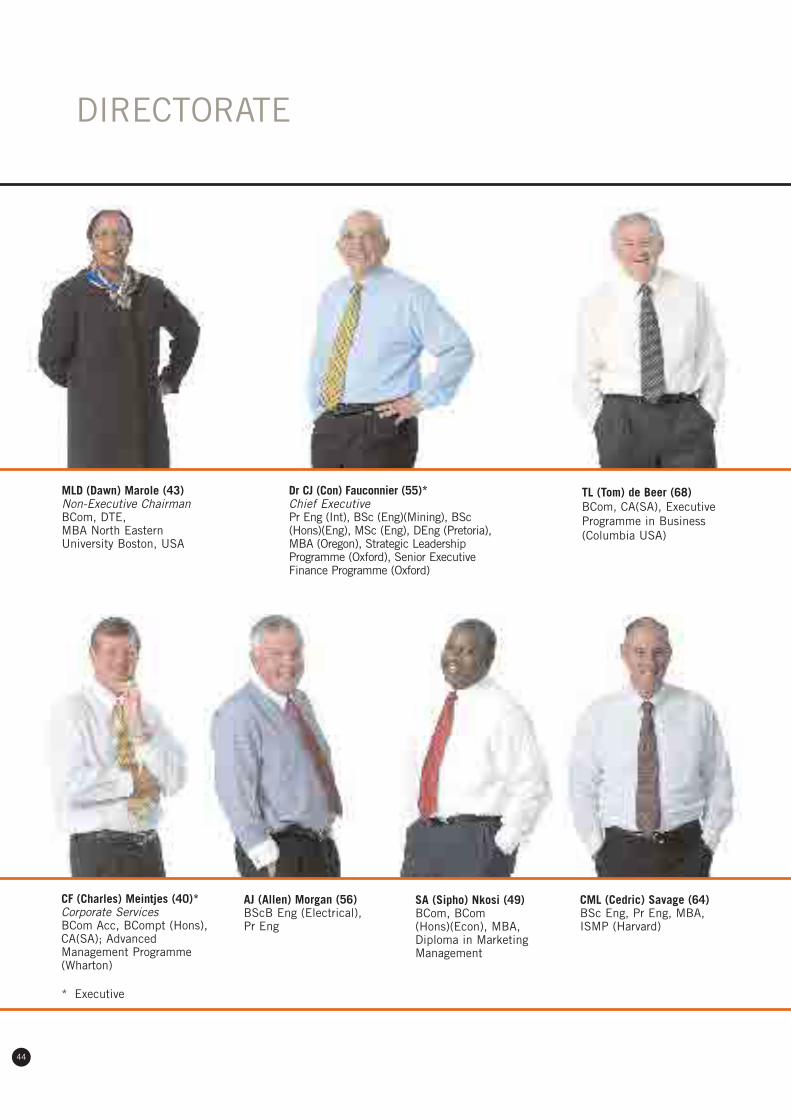
44
DIRECTORATE
MLD (Dawn) Marole (43)Non-Executive ChairmanBCom, DTE, MBA North EasternUniversity Boston, USA
TL (Tom) de Beer (68)BCom, CA(SA), ExecutiveProgramme in Business(Columbia USA)
AJ (Allen) Morgan (56)BScB Eng (Electrical),Pr Eng
SA (Sipho) Nkosi (49)BCom, BCom(Hons)(Econ), MBA,Diploma in MarketingManagement
CML (Cedric) Savage (64)BSc Eng, Pr Eng, MBA,ISMP (Harvard)
* Executive
CF (Charles) Meintjes (40)*Corporate ServicesBCom Acc, BCompt (Hons),CA(SA); AdvancedManagement Programme(Wharton)
Dr CJ (Con) Fauconnier (55)*Chief ExecutivePr Eng (Int), BSc (Eng)(Mining), BSc(Hons)(Eng), MSc (Eng), DEng (Pretoria),MBA (Oregon), Strategic LeadershipProgramme (Oxford), Senior ExecutiveFinance Programme (Oxford)
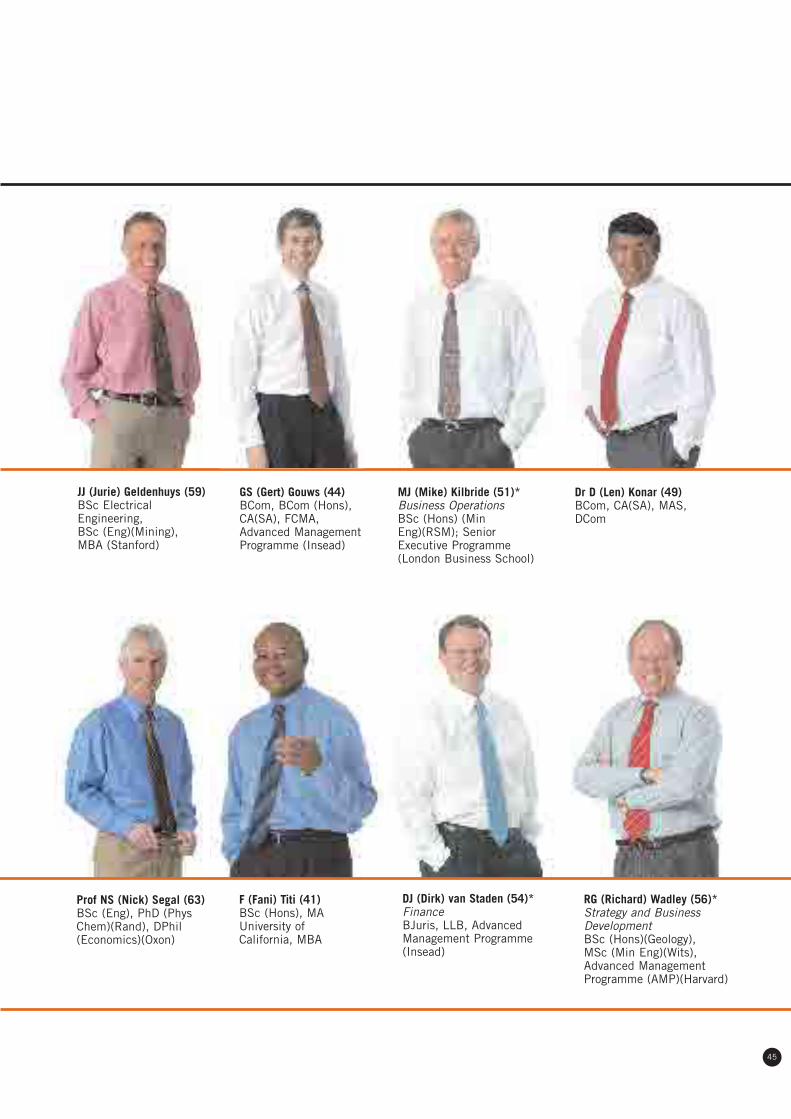
45
JJ (Jurie) Geldenhuys (59)BSc ElectricalEngineering,BSc (Eng)(Mining),MBA (Stanford)
Prof NS (Nick) Segal (63)BSc (Eng), PhD (PhysChem)(Rand), DPhil(Economics)(Oxon)
GS (Gert) Gouws (44)BCom, BCom (Hons),CA(SA), FCMA,Advanced ManagementProgramme (Insead)
Dr D (Len) Konar (49)BCom, CA(SA), MAS,DCom
MJ (Mike) Kilbride (51)*Business OperationsBSc (Hons) (MinEng)(RSM); SeniorExecutive Programme(London Business School)
F (Fani) Titi (41)BSc (Hons), MAUniversity ofCalifornia, MBA
DJ (Dirk) van Staden (54)*FinanceBJuris, LLB, AdvancedManagement Programme(Insead)
RG (Richard) Wadley (56)*Strategy and BusinessDevelopmentBSc (Hons)(Geology),MSc (Min Eng)(Wits),Advanced ManagementProgramme (AMP)(Harvard)

Kumba is committed to conforming to
good corporate governance principles
and is in compliance with all the key
requirements of South Africa’s King II
Report on corporate governance, and
that of the JSE Securities Exchange
South Africa.
The chairman of the King committee
on corporate governance states, and
Kumba endorses, that good corporate
governance rules, however, do not
necessarily result in good boards. The
board has long recognised that good
corporate governance is essentially
about leadership. Therefore, corporate
governance within Kumba, in effect,
consists of the cumulative
consequences of a multitude of
quality decisions over time on all
levels on a large variety of issues
affecting companies.
The key principles underpinning this
philosophy have been put into
practice through the board charter,
which provides a framework to
discharge its principal duties, namely:
Direction: Formulating the strategic
direction for the group’s sustainability
in the long term.
In a recent annual self-assessment
process, the directors evaluated the
board itself to be effective in its
consideration and acceptance of
strategic plans and direction. To
determine that the group’s strategy is
well formulated and executed, non-
executive directors contribute to the
annual process of establishing
strategic direction. The board focuses
on maintaining a balance between the
interests of stakeholders and the
collective good of the group.
Accountability: Recognising and
balancing the interests of all
stakeholders for the collective good
of the group.
The board accepts its duty to
address matters of significant
interest and concern to all
stakeholders, taking into account the
greater demands for transparency and
accountability. It strives to present
a balanced and understandable
assessment of the group’s position
so that all stakeholders with a
legitimate interest can obtain a full,
fair and honest account of the
group’s performance.
Supervision: Monitoring and
overseeing management performance
to ensure that Kumba’s businesses
are managed with integrity and
compare with best international
practices.
Executive action and its supervision
is achieved by a variety of governance
structures. The functioning of the
board is facilitated through the use
of various board committees and by
proper assessment of risk and the
maintenance of sound internal
controls. Appropriate committees,
internal and external auditors
implement safeguards to ensure that
internal systems and controls are well
designed and which monitor and
report on compliance with the group’s
strategies and with the country’s laws.
Effective controls, checks and
balances are in operation.
Outlined below are the systems and
processes through which Kumba’s
operative governance is managed.
BOARD POLICIES ANDPROCEDURESIn a recent assessment of its own
efficiency, the board determined that
it is in full and effective control
over the group, and that the group’s
compliance record and activities are
excellent.
The existing systems of internal
control are based on established
organisational structures, together
with written policies and procedures,
including budgeting and forecasting
disciplines and the comparison of
actual results against these budgets
and forecasts. All company policies,
procedures and practices and
substantive matters are dealt with at
board level.
The group has a formal practice and
procedure in place to prohibit dealing
in its securities by directors, officers
and other selected employees, during
closed periods as defined in the
JSE Securities Exchange Listings
Requirements.
In as much as a code consists of a
set of rules, policies and principles,
the group has, although not codified,
various policies and procedures to
CORPORATE GOVERNANCE
46

47
address conflicts of interests.
These cover areas such as share
interests and directorships of
Kumba directors in companies with
which Kumba has contractual
relationships and outside interests
by managers which could possibly
lead to conflicts of interests.
BOARD COMPOSITIONThe board has evaluated its
composition as complementary, with
a strong contingent of independent
non-executive directors. They
contribute to an independent view
to matters under consideration and
add to the breadth and depth of
experience of the board, exercising
significant influence at board
meetings. Kumba has non-executive
director representation of two to one
executive director. There are six
independent non-executive directors.
Existing practices and procedures
require the board to engage in selecting
its own members and in planning for
its own succession and continuity of
experience and knowledge.
To ensure efficient staggering of
director rotation, the group has a
programme in place, giving effect to
the arrangement that directors are
subject to retirement and may be
nominated for re-election every
three years.
In its self-assessment, the board has
satisfied itself regarding the defining
of appropriate levels of materiality
and reservation of detailed and
specific powers and authorities to
itself. Consequently the board takes
all key decisions.
Further information in respect of
directors appears on page 51.
CHAIRMAN AND CHIEFEXECUTIVEFrom inception, Kumba has main-
tained separation of the operational
role of the chief executive and the
chairman’s role to facilitate the
smooth and efficient functioning of
the board.
To maintain a high standard of
performance in the chairman’s role,
the performance of the chairman
is formally appraised from time to
time. The board is in the process
of developing appropriate
performance criteria that can be
measured relative to stakeholder
performance objectives.
A board policy has been formulated
to assist the chairman to formally
appraise the performance of the chief
executive annually, in consultation
with the respective chairmen of the
safety, health and environment,
human resources and remuneration,
and audit committees.
BOARD OF DIRECTORSCorporate governance, as formulated
in the King Report, requires a board to
assist in ensuring there is an
appropriate balance of power and
authority on the board. The directors
have judged the balance of power and
authority on the board to be very good.
The non-executive directors are
sufficiently credible, skilled and
experienced and bring appropriate
judgement to bear, independent of
management, on the main corporate
issues. The board has satisfied itself
that the group’s procedures and
practices in regard to succession
planning ensure that the best
potential managers are identified,
developed and suitably fast-tracked.
Directors have in terms of company
policy, free access to the company
secretary, and to independent
professional advisers, whether in
legal, technical or accounting areas,
at the group’s expense. All directors
have unrestricted access to all
company information and records, as
well as to management officials.
The company secretary provides a
central source of guidance and
advice to the board, and within the
group, on matters of ethics and
good governance. Practices and
procedures have been established
in liaison with the company secretary
to familiarise directors with the
group’s operations, senior manage-
ment, and the business environment
and to induct them in their fiduciary
duties and responsibilities. To improve
the process, directors visit operational
centres to better familiarise themselves
with business operations.
A company policy on attendance
by Kumba directors and board
committee chairmen at shareholder
meetings has been formulated.

The board recently evaluated the
relationship between non-executive
directors and the group’s chief
executive and executive management
as excellent.
BOARD MEETINGSThe full board meets formally at
least five times per year and, if
necessary, more frequently.
During the 2002/3 financial year,
the board met eight times.
Apart from the ongoing process of
the board considering information
supplied at each meeting, the board
in its annual self-assessment process
specifically addresses the provision
of information. The board has
judged and satisfied itself that the
operational and financial information
it receives regularly is outstanding.
As for ad hoc and other information
needs, the board fully considers its
needs and decides on the additional
information it requires, if any.
The board, through the process of
annual self-assessment and reviews,
identifies issues needing attention
and requiring improvement as regards
compliance with its duties and
responsibilities and its ability to add
value to company business.
BOARD COMMITTEESKumba has established four standing
board committees, namely the
chairman committee, audit
committee, human resources and
remuneration committee and the
safety, health and environment
committee. All Kumba board
committees have received detailed
formal mandates from the board, with
their duties and responsibilities fully
aligned with those of the board.
The audit committee consists
entirely of non-executive directors
and the other committees consist
of a majority of non-executive
directors. Experienced, knowledgeable
non-executive directors chair all
Kumba board committees.
Arrangements are in place to
ensure that board committees are
free to take independent, professional,
external advice as and when
necessary. The purpose of this is
to ensure that board committee
members are, at all times, comfortable
with the pool of specialised knowledge
available and accessible to them.
Board committees are subject to
regular evaluation by the board.
The board specifically addresses the
matter of efficiency of the committees
as part of the annual board self-
assessment process. The minutes of
each of the board committee
meetings are submitted to the
board for information and discussion
if necessary. These minutes reflect
the proceedings at these meetings
and the decisions taken by
the committees.
AUDIT COMMITTEEThis committee comprises three
independent non-executive directors,
with one director acting as chairman.
Its primary responsibility is to assist
the board in discharging its duty
relating to the group’s:
• Accounting policies
• Financial reporting practices
• Internal control and safeguarding
of assets
• Identification and evaluation of
significant risks.
The committee met four times
during the year for these purposes.
The chief executive, directors of
finance, operations and corporate
services, the manager of the
outsourced audit and advisory services
and the external auditors attend
meetings by invitation. They have
unrestricted access to the chairman
and members of the committee.
The committee is satisfied that the
external auditors have remained
independent throughout the year in
completion of their duties.
HUMAN RESOURCES ANDREMUNERATION COMMITTEEThis committee consists of four non-
executive directors and the chiefexecutive and is chaired by a non-
executive director. Four meetings are
scheduled annually, with ad hoc
meetings convened when required.
The executive director finance and
general manager human resources
attend meetings by invitation. The
committee has a clearly-defined
mandate from the board directed at:
• Ensuring the group’s chairman,
directors and senior executives are
fairly rewarded for their individual
contributions to overall
performance.
Corporate governance continued
48
TRANSPARENCY IS ONE OF KUMBA’S KEY PILLARS, DRIVEN BY ANINDEPENDENT BOARD
49
• Ensuring the group’s remuneration
strategies, packages and schemes
are related to performance, are
suitably competitive and give
due regard to the interests of
shareholders and the financial
and commercial soundness of
the group.
• Ensuring appropriate human
resources strategies, policies and
practices.
• Reviewing executive succession
and the development plans and
recommending candidates for
senior positions to the board.
In discharging its responsibilities, the
committee consults widely within
the group and draws extensively on
external surveys and independent
advice and information.
SAFETY, HEALTH ANDENVIRONMENT (SHE)COMMITTEEThis committee, chaired by an
independent non-executive director,
consists of two other non-executive
directors, the chief executive and the
executive director of operations. It is
responsible for formulating and
recommending policies, strategies
and programmes in all matters
affecting safety, health and
environment throughout the group to
the board. The general manager SHE
and land management attends all
meetings by invitation. Members of
the executive committee and general
managers of the business units attend
meetings by invitation.
The committee is responsible for
ensuring that these policies and
programmes are in line with
legislation, are effectively
implemented and that SHE
performance is regularly measured
and evaluated.
CHAIRMAN COMMITTEEThe committee, consisting of the
chairman and the respective
chairmen of the audit, human
resources and remuneration and
SHE committees, was formed in
November 2002 to create an
effective communication forum
between these chairmen. The
principal purpose of the committee
is to enhance the business of the
board by means of:
• Assuming shared leadership to
aid and assist the directors in
diagnosing issues for
comprehensive evaluation by
the board.
• Reviewing the role and function of
the chairman and that of the chief
executive.
• Bridging the gap between
respective committees in the light
of the move from single to triple
bottom-line reporting concept.
• Providing a central source of
guidance and advice to the
board on matters of ethics and
good governance.
The committee will also make
recommendations on any potential
conflict of interest or questionable
situations of a material nature.
The committee is subject to regular
review and has not been granted any
additional or delegated board powers.
ACCOUNTING AND AUDITINGThe board is satisfied that there is an
efficient independent internal audit
function in the group.
The group has established procedures
and practices to facilitate the
achievement of objectives in the
following categories:
• Effectiveness and efficiency of
operations
• Reliability of financial reporting
• Compliance with applicable laws,
regulations and standards
Close cooperation, consultation and
coordination on audits between
external and internal auditors support
this process.
The board has formulated principles for
the execution of non-audit functions
and services to avoid conflicts of
interest by external auditors.
The board has delegated the
responsibility of making
recommendations to the board for
the appointment of the external
auditor to the audit committee.
The board has introduced a
procedure for recording, in the
board meeting minutes, the facts
and assumptions used in the
assessment of the going concern
status of the group at year end.
FINANCIAL AND OPERATIONALREPORTING DISCLOSUREKumba utilises a broad range of
channels to distribute financial
information, such as the Securities
Exchange News Service (SENS), the
Internet for its interim and annual
results, presentations to fund managers
and analysts, paid press reports, the
annual report and news releases to
newspapers and news agencies.
RELATIONS WITHSHAREHOLDERS ANDSTAKEHOLDERSAt Kumba, building long-term and
mutually-beneficial relationships
with our stakeholders is a business
imperative. Kumba’s stakeholder charter
forms part of an ethics base that
encompasses its code of ethics, the
Kumba Way and the code of conduct.
The group proactively manages
its relations with stakeholders, and
maintains the highest standards of
integrity and behaviour in all its
dealings with stakeholders and
society at large. Kumba maintains a
position of impartiality and in principle
does not support party-political causes.
ORGANISATIONAL INTEGRITYAND ETHICSIn pursuit of Kumba’s vision to
outperform the mining and mineral
sector in creating value for all
stakeholders through exceptional
people and superior processes, the
conduct of its businesses and its
employees is characterised by the
following fundamental values:
• integrity
• respect
• accountability
• fairness
• caring
These values have been developed
for the benefit of the group and its
employees to guide the moral way of
acceptable and responsible behaviour
without which business cannot be
sustained.
Kumba’s board of directors, employees
and the unions have endorsed the
group’s code of ethics.
In addition to Kumba’s other
compliance and enforcement
activities, a fraud prevention policy
has been established as a mechanism
through which all stakeholders can
report suspected fraud or corruption
with guaranteed anonymity.
REMUNERATION POLICIESNon-executive directors
The human resources and
remuneration committee considers
and submits recommendations to the
Kumba board on the fees to be paid
to each non-executive director. Any
changes to fees are approved by the
board and submitted to shareholders
at the annual general meeting for
approval prior to implementation and
payment. The level of fees is, among
others, determined according to the
median remuneration paid by
comparable companies.
Non-executive directors are not bound
by service contracts.
Executive directors and Kumba
employees
The aim of the group’s remuneration
policy is to ensure that executive
directors and employees who are not
in the bargaining unit are rewarded in
a way that enables the group to
attract and retain employees of the
highest quality – people who are
motivated to achieve performance
superior to competitors, which serves
the best interests of shareholders.
Kumba’s performance-driven
remuneration policy, governed by
the human resources and
remuneration committee, is to
position the total remuneration of
executive directors and employees at
or near the median compared to
companies with which it is competing
for talent. Challenging performance
criteria are used, tied to performance
and efforts rather than general market
fluctuations. A significant part of the
remuneration of these employees is
linked to company performance.
Above-average rewards and career
advancement are achieved by
employees who accept the challenge
of our business objectives and who
excel in accomplishing them. Details
on remuneration paid to executive
directors is published on page 88.
All employees, including executive
directors, are entitled to participate
in an annual bonus and gain-share
Corporate governance continued
50

51
scheme, based on achieving and
exceeding performance targets
set by the human resources and
remuneration committee. Senior
management and staff specialists
are eligible to participate in the
Kumba management share
option scheme.
All executive directors’ normal service
contracts are subject to one month’s
notice. In terms of a retention
arrangement approved by the human
resources and remuneration
committee, executive directors may
become entitled to a severance
package of one year’s remuneration if
their services are terminated before
1 July 2004. There are no restraints
of trade associated with the contracts.
SUSTAINABILITY REPORTINGWithin the group, sustainability
issues are considered a vital business
element. Kumba has been selected
as a participant of the Edward Nathan
& Friedland (ENF) Sustainability
Index for its achievements in, and
ongoing commitment to, good
corporate citizenship and
sustainability. During the financial
year under review, Kumba was ranked
number two on the ENF Sustainability
Assessment and is number 16 on the
ENF Sustainability Index in terms of
market capitalisation.
Kumba is committed to the
implementation of triple bottom-line
reporting in terms of the GRI as it
accepts that good governance and
social and environment issues are
integral to the group’s profitability
and creation of long-term
sustainability.
BOARD AND BOARD COMMITTEE ATTENDANCE REGISTER
Safety, health and Human resources
Board/special Chairman Audit environment and remuneration
meetings (8#) committee (3#) committee (4#) committee (3#) committee (5#)
Board of directors Attendance Composition Attendance Composition Attendance Composition Attendance Composition Attendance
MLD Marole† 7 Chairman 3 By invitation 2 – – Member 4
Dr CJ Fauconnier* 8 Member 3 By invitation 4 Member 2 Member 4
TL de Beer† 7 Member 2 Member 4 – – Chairman 5
JJ Geldenhuys† 8 Member 3 – – Chairman 3 Member 5
GS Gouws 7 – – – – – –
MJ Kilbride* 7 By invitation 2 Member 2 – –
Dr D Konar† 8 Member 3 Chairman 4 – – – –
CF Meintjes* 7 By invitation 4 – – – –
AJ Morgan† 7 – – Member 3 – –
SA Nkosi 7 – – Member 2 – –
CML Savage 8 – – – – – –
Prof NS Segal† 7 Member 4 – – – –
F Titi 8 – – – – Member 2
DJ van Staden* 7 By invitation 4 – – By invitation 4
RG Wadley* 7 – – – – – –
Ms Marole, Messrs Kilbride, Meintjes, Van Staden and Wadley’s attendance was not required at one of the eight meetings held as the meeting was
specifically scheduled to approve the appointment of Ms Marole as chairman.
Messrs Nkosi and Titi were appointed to serve as members on respective committees from 1 May 2003
# Number of meetings per annum
† Independent non-executive director
* Executive director
RECOGNISING AND BALANCING THE INTERESTS OF ALL STAKEHOLDERS FORTHE COLLECTIVE GOOD OF THE GROUP

RISK MANAGEMENT
52
Pure risks are identified and risk
awareness is promoted at all business
units and at the corporate centre.
The group insures against losses
arising from catastrophic events
which include fire, flood, explosion,
earthquake and machinery
breakdown, and business interruption
from these events.
Kumba accepts internal insurance
deductibles that vary in line with the
nature of the risk, and insures a
further layer with captive insurance
companies through whom the group
thereafter purchases cover from local
and international third-party
insurance companies. An aggregate
limit also exists.
The group renews its insurance
annually on 1 July. Placement of
cover has become more difficult with
significantly higher premiums due
to a substantial hardening of the
insurance market, particularly in
relation to mining assets.
Credit risk in relation to:
• trading activities are low due to a
high proportion of term supply
arrangements with long-standing
clients, mitigated further where
dictated by customer
creditworthiness or country risk
assessment, through a combination
of confirmed letters of credit and
credit risk insurance. Kumba’s bad
debt write-offs are negligible.
• counter-party exposures arising
from money market investments,
foreign currency, interest rate and
zinc price hedging operations are
controlled by dealing only with
financial institutions of high credit
standing. The credit exposure to
any one counter-party is managed
by setting transaction limits.
Exchange rate exposure on loans and
capital expenditure is fully covered.
Hedging of expected net foreign
currency receipts from exports less
trading imports is undertaken on a
limited shorter-term forward basis.
Variations to this policy are subject to
board approval.
At year-end Kumba had a currency
forward sales book of US$8 million at
an average rate of R7,71 to a US dollar
spread out until November 2003.
Interest rate risks are addressed by
maintaining a mix of fixed and
floating rate loan facilities, with 71%
of term loans financed on a fixed
basis at year-end. The group actively
manages the ratio of fixed to floating
rates in the light of interest rate
expectations and the risk profile of
projects.
Liquidity risk is managed by
maintaining a high proportion of net
debt in longer-term facilities and
substantial standby bank facilities as
more fully reported on in the
discussion of our financial structure
in financial review.
Price hedging is undertaken on a
limited scale in respect of zinc metal
for which an international hedging
market is accessible. Hedging of the
US dollar zinc price and
corresponding exchange rate exposure
during the year resulted in an average
price of R7 475/tonne being realised
compared with an average market
price of R6 949/tonne. Prices for
other commodities are established on
commercial terms with customers and
suppliers, other than the 6,25Mtpa
of iron ore supplied by Sishen mine
at its cost of production, to the steel
mills of Iscor. The Thabazimbi iron
ore and Tshikondeni coking coal
mines are contracted to sell their full
production to Iscor. The total costs of
running the captive mines and capital
expenditure incurred, are recovered
from Iscor. A management fee of 3%
is added to these costs.
Technology risks are addressed as
follows:
• Annual audits are conducted to
review the security of SAP R3 as
our main business system and
standard operating procedures
exist.
• Disaster recovery programmes are
in place for this and all other
major systems.
• Process technology risk, in general,
is low.
• Internally developed technology is
protected by patents, where
appropriate.
Safety, health and environmental risks
are assessed and control measures
implemented on an ongoing basis
as more fully described on
pages 59 to 64.

53
ENABLING ENHANCED DECISION-MAKING THROUGH GREATER INSIGHTINTO RISKS AND THEIR IMPACT
HIGH-LEVEL BUSINESS RISKSProbability
Risk Impact of occurence Control measures
• Impact of continued rand High High • Sustained focus on continuous improvementstrength combined with soft • Specific cost reduction initiatives of 2% per annum commodity prices in real terms to protect margins
• Erosion of margins as a result of increased cost trends
• Interests of key shareholders High High • Pursue maximum value release initiatives and focusmay affect optimum value on operational excellence in the best interests of release for the group the group and all its stakeholders
• Financing of growth High Medium • Capital allocation linked to project prioritisationopportunities • Strategic equity partners for major projects
• Capital raising
• Compliance with mining High Medium • Anchor empowerment agreement with the charter/scorecard Tiso Kgalagadi consortium
• Agreement with Eyesizwe Coal on development ofKalbasfontein
• Empowerment framework developed to facilitateequity/asset based ownership transactions
• Programme for compliance with mining legislation
• Achieving the ramp-up schedule High Medium • Best available resources committed and technology of the heavy minerals smelter applied to the smelter phasephase of Ticor SA • Ramp-up of first furnace and targeted
commissioning of second furnace on schedule
• Plant breakdown or bottlenecks Medium Medium • Continuous constructive engagement between in the logistics chain affecting Kumba and Transnet on operational efficiency and the group’s iron ore exports infrastructure expansionwhich account for 73% of net • New port equipment currently being installed with operating income Kumba Technology participation
• Record export shipments for the past two yearsachieved
• Prevalence of HIV/AIDS Medium Medium • Corporate AIDS strategy in place, includingawareness campaign, knowledge/attitude/practicesstudies, know-your-status campaigns
• Two pilot sites have been identified foradministering anti-retroviral treatment (ART) ofinfected employees

SHAREHOLDERS’ INFORMATION
54
MARKET LISTINGS AND SHAREPRICESKumba Resources Limited
The principal market for Kumba is the
JSE Securities Exchange South Africa
(JSE). As a constituent of the All
Share Top 40 index (ALSI 40 index),
Kumba shares trade through the
STRATE system.
STRATE is the authorised Central
Securities Depositary (CSD) for
equities in South Africa that
incorporates an electronic settlement
system. STRATE achieves secure,
electronic settlement of share
transactions on the JSE and for off-
market trades. Shares in companies
listed on the JSE can no longer be
bought or sold unless they have been
dematerialised onto the STRATE
system. This process involves
submitting paper share certificates to
a custodian bank or JSE member firm
(‘broker’) for conversion into an
electronic record, an exercise referred
to as ‘dematerialisation’.
The introduction of the JSE Equity
Trading (JET) system a few years ago
highlighted the deficiencies in the
JSE’s paper-based settlement system.
Shares were no longer traded on a
trading floor, and this contributed to a
massive leap in the number of trades
each day. Back-office support services
were incapable of handling this
increase in daily transactions
efficiently in a paper-based
environment. The transition to an
efficient settlement system has
increased market activity and will
improve the international perception
of the South African market by
reducing settlement and operational
risk in the market, increasing
efficiency and ultimately reducing
costs. Accordingly, by heightening
investor appeal, STRATE enables
South Africa to compete effectively
with other international markets, and
not just those of emerging countries.
For additional information please
refer to the STRATE website:
www.strate.co.za
Closing JSE share prices are
published in most national and
regional South African newspapers
and are available during the day on
the Kumba and other websites. Share
prices are also available on I-Net
Bridge, Reuters and Bloomberg.
Kumba has an Over-the-Counter
(OTC) American Depositary
Receipt (ADR) facility with
The Bank of New York (BoNY)
under a deposit agreement.
ADR holders
ADR holders may instruct BoNY as to
how the shares represented by their
ADRs should be voted. Registered
holders of ADRs will have the annual
and interim reports mailed to them
at their record address. Brokers
or financial institutions, which hold
ADRs for shareholder clients, are
responsible for forwarding
shareholder information to their
clients and will be provided with
copies of the annual and interim
reports for this purpose.
DIVIDEND DETERMINATIONDividends are determined in South
African rand (ZAR) and are then
declared payable in the same
currency by the group. ADR
shareholders are paid in US dollar
by the group’s ADR BoNY. BoNY
effects the conversion of ZAR-
determined dividend in US dollar
on behalf of its US ADR
shareholders. Contact Computershare
(ZAR dividend) or BoNY (ADR
dividend) for further details.
SUPPLEMENTARYINFORMATIONGeneral shareholder enquiries
Computershare (Pty) Limited
(Computershare) are the registrars
for Kumba. All enquiries and
correspondence concerning
shareholdings (other than shares held
in ADR form) should be directed to
the registrar. Computershare’s contact
details are listed in Kumba
administration on page 148.
Shareholders must notify
Computershare promptly in writing
of any change of address.
All enquiries concerning shares held
in ADR form should be directed to
BoNY, whose contact details are also
given in Kumba administration on
page 148 or alternatively visit their
website at: www.adrbny.com
Shareholders can obtain details about
their own shareholding on the
Internet. Full details, including how
to gain secure access to this
personalised enquiry facility, are

55
provided for on the Computershare
website: www.computershare.com
Consolidation of share certificates
If your certificated shareholding in
Kumba is represented by several
individual share certificates, you may
wish to have these replaced by one
consolidated certificate; there is no
charge for this service. You should
send your share certificates to
Computershare together with a letter
of instruction.
Publication of financial statements
Shareholders wishing to receive the
annual report and/or the interim
announcement in electronic rather
than paper form should register their
instruction on the Kumba website at:
www.kumbaresources.com
Major shareholders
As far as is known, Kumba was
not directly or indirectly controlled
by another corporation or by
any institution at year-end. As at
30 June 2003, the two entities
known to Kumba as owning more
than 10% of its shares were Anglo
American Plc (Anglo) and Industrial
Development Corporation with
89 369 924 and 41 498 165
shares, representing 30,1% and
14,0% respectively. As of 30 June
2003, the total amount of the voting
securities owned by the directors of
Kumba was 192 220 ordinary
shares representing about 0,06%
of the number of shares in issue.
SHARE PRICE ANALYSIS (SA CENTS PER SHARE)
Year ended 30 June High Low Median
2003 4 905 2 413 3 379
2002 5 837 2 770 4 331
2003First quarter 4 905 3 341 4 007
Second quarter 3 913 2 983 3 498
Third quarter 3 466 2 508 3 098
Fourth quarter 3 399 2 413 2 875
2002First quarter na na na
Second quarter 3 535 2 770 3 110
Third quarter 5 837 3 183 4 292
Fourth quarter 5 587 3 974 4 822
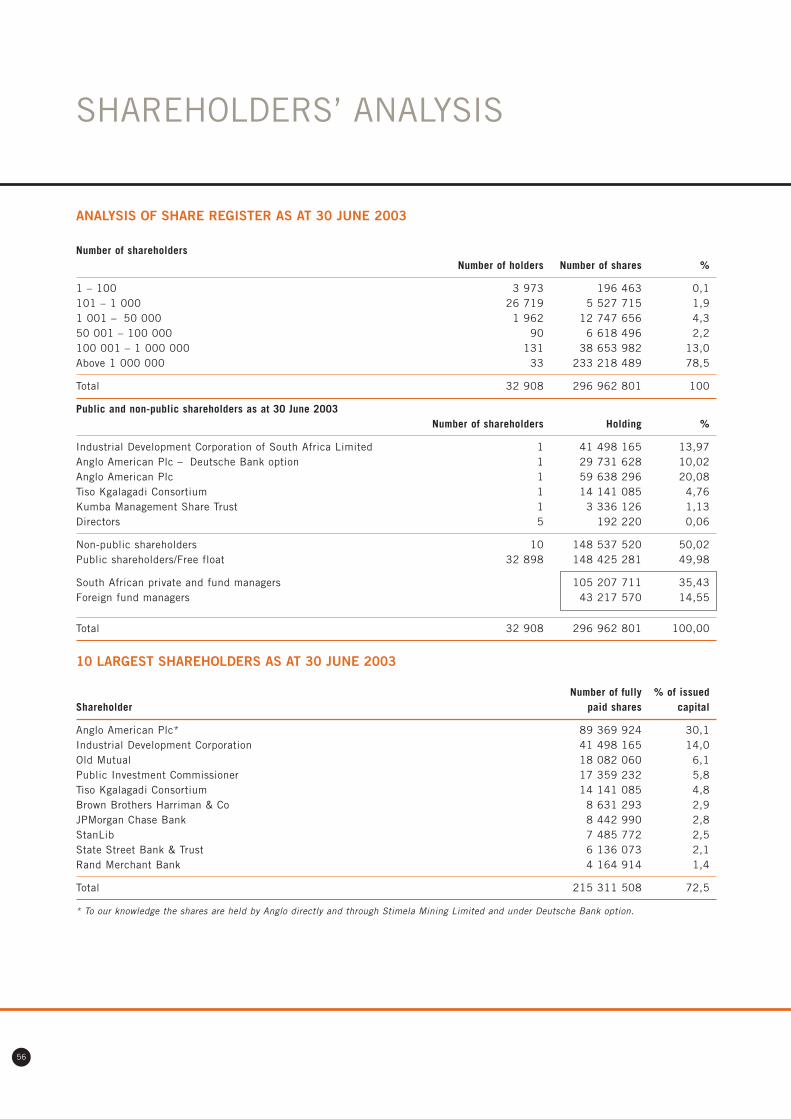
SHAREHOLDERS’ ANALYSIS
56
ANALYSIS OF SHARE REGISTER AS AT 30 JUNE 2003
Number of shareholdersNumber of holders Number of shares %
1 – 100 3 973 196 463 0,1101 – 1 000 26 719 5 527 715 1,91 001 – 50 000 1 962 12 747 656 4,350 001 – 100 000 90 6 618 496 2,2100 001 – 1 000 000 131 38 653 982 13,0Above 1 000 000 33 233 218 489 78,5
Total 32 908 296 962 801 100
Public and non-public shareholders as at 30 June 2003Number of shareholders Holding %
Industrial Development Corporation of South Africa Limited 1 41 498 165 13,97Anglo American Plc – Deutsche Bank option 1 29 731 628 10,02Anglo American Plc 1 59 638 296 20,08Tiso Kgalagadi Consortium 1 14 141 085 4,76Kumba Management Share Trust 1 3 336 126 1,13Directors 5 192 220 0,06
Non-public shareholders 10 148 537 520 50,02Public shareholders/Free float 32 898 148 425 281 49,98
South African private and fund managers 105 207 711 35,43Foreign fund managers 43 217 570 14,55
Total 32 908 296 962 801 100,00
10 LARGEST SHAREHOLDERS AS AT 30 JUNE 2003
Number of fully % of issuedShareholder paid shares capital
Anglo American Plc* 89 369 924 30,1Industrial Development Corporation 41 498 165 14,0Old Mutual 18 082 060 6,1Public Investment Commissioner 17 359 232 5,8Tiso Kgalagadi Consortium 14 141 085 4,8Brown Brothers Harriman & Co 8 631 293 2,9JPMorgan Chase Bank 8 442 990 2,8StanLib 7 485 772 2,5State Street Bank & Trust 6 136 073 2,1Rand Merchant Bank 4 164 914 1,4
Total 215 311 508 72,5
* To our knowledge the shares are held by Anglo directly and through Stimela Mining Limited and under Deutsche Bank option.

57
CREATING BALANCE IN OURENVIRONMENT
As we extract value from our operations, we constantly
rehabilitate the earth. Just as these pebbles are in perfect
balance, we create harmony today for a sustainable planet
tomorrow.
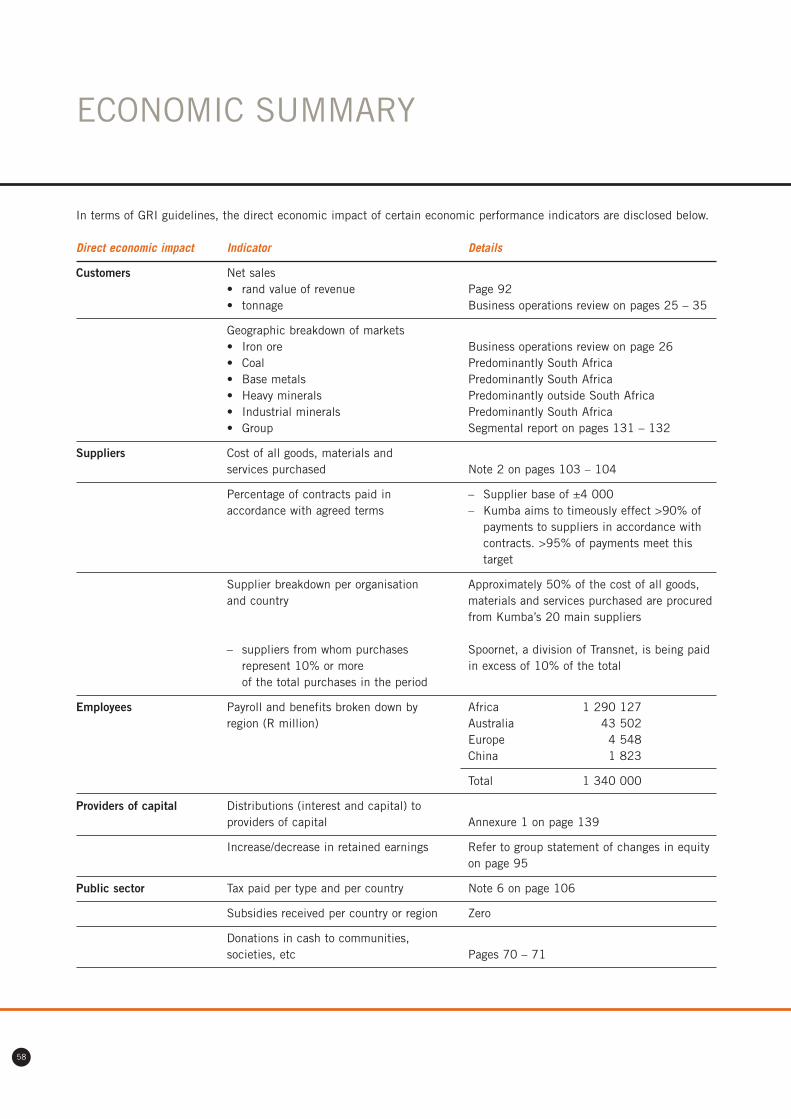
In terms of GRI guidelines, the direct economic impact of certain economic performance indicators are disclosed below.
Direct economic impact Indicator Details
Customers Net sales• rand value of revenue Page 92• tonnage Business operations review on pages 25 – 35
Geographic breakdown of markets• Iron ore Business operations review on page 26• Coal Predominantly South Africa• Base metals Predominantly South Africa• Heavy minerals Predominantly outside South Africa• Industrial minerals Predominantly South Africa• Group Segmental report on pages 131 – 132
Suppliers Cost of all goods, materials and services purchased Note 2 on pages 103 – 104
Percentage of contracts paid in – Supplier base of ±4 000accordance with agreed terms – Kumba aims to timeously effect >90% of
payments to suppliers in accordance withcontracts. >95% of payments meet thistarget
Supplier breakdown per organisation Approximately 50% of the cost of all goods, and country materials and services purchased are procured
from Kumba’s 20 main suppliers
– suppliers from whom purchases Spoornet, a division of Transnet, is being paid represent 10% or more in excess of 10% of the totalof the total purchases in the period
Employees Payroll and benefits broken down by Africa 1 290 127region (R million) Australia 43 502
Europe 4 548China 1 823
Total 1 340 000
Providers of capital Distributions (interest and capital) to providers of capital Annexure 1 on page 139
Increase/decrease in retained earnings Refer to group statement of changes in equityon page 95
Public sector Tax paid per type and per country Note 6 on page 106
Subsidies received per country or region Zero
Donations in cash to communities, societies, etc Pages 70 – 71
ECONOMIC SUMMARY
58

SAFETY, HEALTH ANDENVIRONMENTALMANAGEMENT (SHE)Kumba is active in mining and
mineral-related operations and, by
complying with all applicable SHE
legislation and relevant international
obligations, is committed to consult
with stakeholders, achieve high
standards of environmental
performance, implement
internationally-accepted standards
for occupational health, safety
and environmental management and
continuously improve operations
regarding safety, health and
environmental performance and
SHE management systems.
The safety and health of our
employees and the responsible
management of the natural
resources form an integral part
of our commitment to sustainable
development.
Overall responsibility for SHE
monitoring and performance rests with
the Kumba board, exercised through
the SHE committee and consulting
forums at corporate level and at each
business unit. SHE policies and
management standards are revised
bi-annually with inputs from all
relevant stakeholders.
During the latter part of the year, the
responsibility for leadership and
direction of quality management
processes was added to the safety,
health and environmental
management of Kumba.
SAFETY AND HEALTHKumba aspires to a zero injury rate
at all its activities and the four fatal
accidents reported for the year are
unacceptable. The following safety
targets have been set for the company
for the 2004 financial year:
• zero fatalities
• a 30% improvement on the lost
day injury frequency rate (LDIFR)
• a 30% improvement in the severity
rate of injuries
Incidents and statistics are reported
to the relevant authorities in
accordance with the prescribed
standards. The indicators used are
aligned with the industry initiative for
uniform parameters.
Although the LDIFR of 3,07 for 2003
is a slight improvement from the
previous year and compares well
with the best in the South African
mining industry, it falls short of the
target of 2,5 that was set for the
financial year.
In health management, the focus
is on hygiene monitoring and
appropriate measures to reduce
exposure levels, together with risk-
driven medical surveillance to reduce
reportable health cases.
The effect HIV/AIDS might have on
the incidence of occupational
diseases is still unknown.
Of the 90 cases of occupational
diseases reported for the year
(comparably a mid to low aggregate),
57 were noise-induced hearing
loss, seven were cases of tuberculosis
and 26 were due to occupational-
related lung diseases. Eight
occupational diseases reported were
accepted as compensatable diseases
by the Compensation Commissioner.
The group makes every effort to keep
disabled employees in service even if
they are accommodated in alternative
positions. Currently, the company
employs 41 people with disabilities.
Legal assessment forms part of the
ISO/OHSAS certification process and
all business units established a legal
register. No legal action for non-
compliance occurred over the last
financial year.
The SHE management process is
based on sound risk management
principles. Processes and working
areas are broken down into units,
where baseline risk assessments are
followed by issue-based risk
assessments. All operational teams are
trained in applying risk assessment on
new projects and tasks.
Control measures to reduce risk are
implemented according to the
following sequence:
• Engineering design
• Engineering control and safety
devices
• Warning devices
• Administrative control (eg
procedures, training and
inspections)
• Personal protective equipment.
SAFETY, HEALTH AND ENVIRONMENT SUMMARY
59
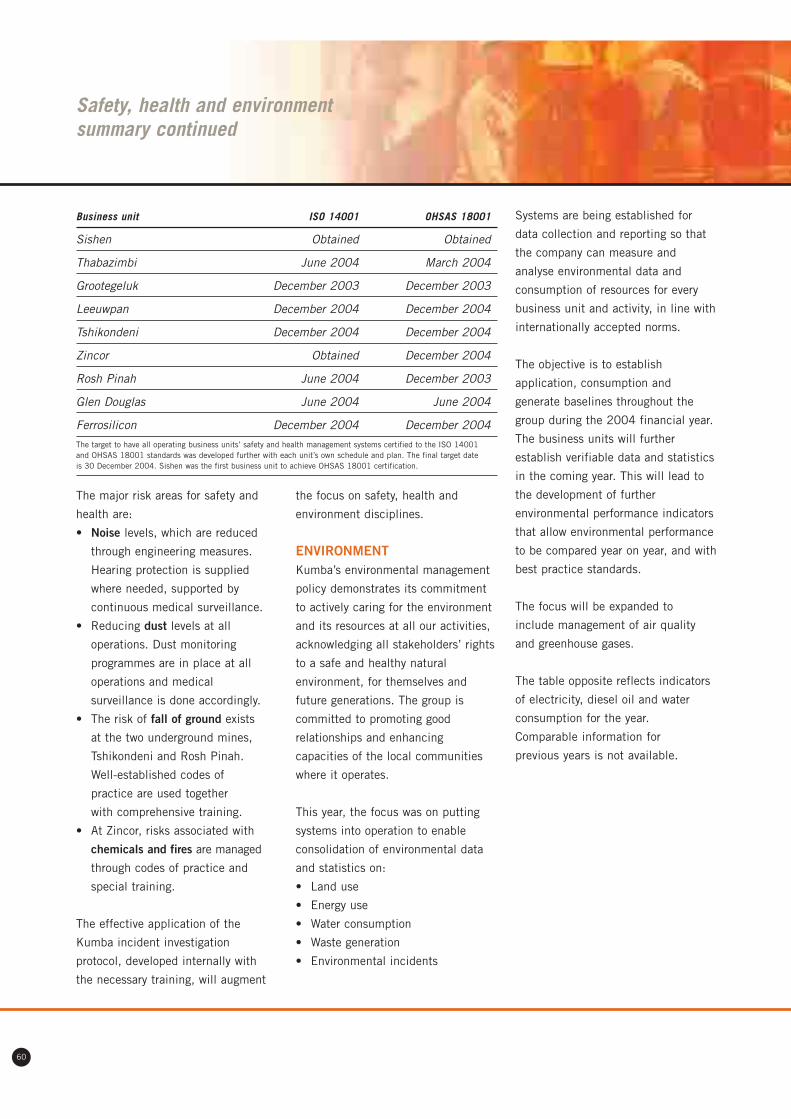
The major risk areas for safety and
health are:
• Noise levels, which are reduced
through engineering measures.
Hearing protection is supplied
where needed, supported by
continuous medical surveillance.
• Reducing dust levels at all
operations. Dust monitoring
programmes are in place at all
operations and medical
surveillance is done accordingly.
• The risk of fall of ground exists
at the two underground mines,
Tshikondeni and Rosh Pinah.
Well-established codes of
practice are used together
with comprehensive training.
• At Zincor, risks associated with
chemicals and fires are managed
through codes of practice and
special training.
The effective application of the
Kumba incident investigation
protocol, developed internally with
the necessary training, will augment
the focus on safety, health and
environment disciplines.
ENVIRONMENTKumba’s environmental management
policy demonstrates its commitment
to actively caring for the environment
and its resources at all our activities,
acknowledging all stakeholders’ rights
to a safe and healthy natural
environment, for themselves and
future generations. The group is
committed to promoting good
relationships and enhancing
capacities of the local communities
where it operates.
This year, the focus was on putting
systems into operation to enable
consolidation of environmental data
and statistics on:
• Land use
• Energy use
• Water consumption
• Waste generation
• Environmental incidents
Systems are being established for
data collection and reporting so that
the company can measure and
analyse environmental data and
consumption of resources for every
business unit and activity, in line with
internationally accepted norms.
The objective is to establish
application, consumption and
generate baselines throughout the
group during the 2004 financial year.
The business units will further
establish verifiable data and statistics
in the coming year. This will lead to
the development of further
environmental performance indicators
that allow environmental performance
to be compared year on year, and with
best practice standards.
The focus will be expanded to
include management of air quality
and greenhouse gases.
The table opposite reflects indicators
of electricity, diesel oil and water
consumption for the year.
Comparable information for
previous years is not available.
Safety, health and environment summary continued
60
Business unit ISO 14001 OHSAS 18001
Sishen Obtained Obtained
Thabazimbi June 2004 March 2004
Grootegeluk December 2003 December 2003
Leeuwpan December 2004 December 2004
Tshikondeni December 2004 December 2004
Zincor Obtained December 2004
Rosh Pinah June 2004 December 2003
Glen Douglas June 2004 June 2004
Ferrosilicon December 2004 December 2004
The target to have all operating business units’ safety and health management systems certified to the ISO 14001and OHSAS 18001 standards was developed further with each unit’s own schedule and plan. The final target dateis 30 December 2004. Sishen was the first business unit to achieve OHSAS 18001 certification.
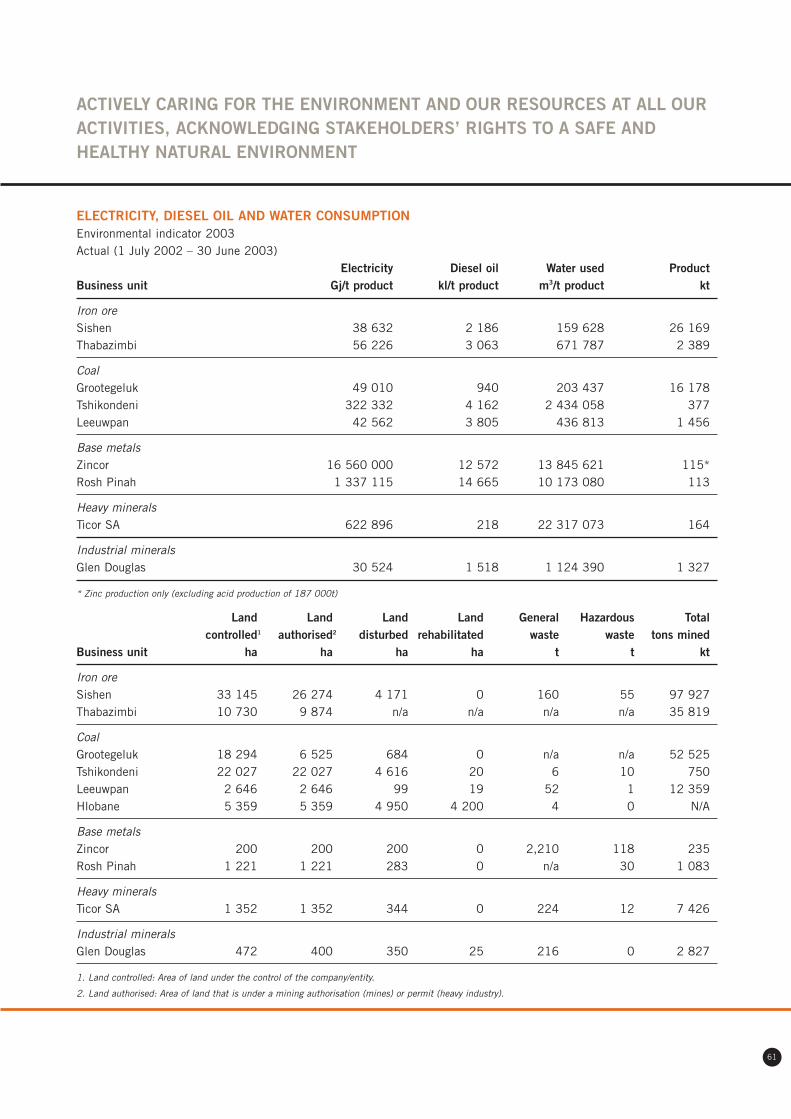
ELECTRICITY, DIESEL OIL AND WATER CONSUMPTIONEnvironmental indicator 2003Actual (1 July 2002 – 30 June 2003)
Electricity Diesel oil Water used ProductBusiness unit Gj/t product kl/t product m3/t product kt
Iron oreSishen 38 632 2 186 159 628 26 169Thabazimbi 56 226 3 063 671 787 2 389
CoalGrootegeluk 49 010 940 203 437 16 178Tshikondeni 322 332 4 162 2 434 058 377Leeuwpan 42 562 3 805 436 813 1 456
Base metalsZincor 16 560 000 12 572 13 845 621 115*Rosh Pinah 1 337 115 14 665 10 173 080 113
Heavy mineralsTicor SA 622 896 218 22 317 073 164
Industrial mineralsGlen Douglas 30 524 1 518 1 124 390 1 327
* Zinc production only (excluding acid production of 187 000t)
Land Land Land Land General Hazardous Total controlled1 authorised2 disturbed rehabilitated waste waste tons mined
Business unit ha ha ha ha t t kt
Iron oreSishen 33 145 26 274 4 171 0 160 55 97 927Thabazimbi 10 730 9 874 n/a n/a n/a n/a 35 819
CoalGrootegeluk 18 294 6 525 684 0 n/a n/a 52 525Tshikondeni 22 027 22 027 4 616 20 6 10 750Leeuwpan 2 646 2 646 99 19 52 1 12 359Hlobane 5 359 5 359 4 950 4 200 4 0 N/A
Base metalsZincor 200 200 200 0 2,210 118 235Rosh Pinah 1 221 1 221 283 0 n/a 30 1 083
Heavy mineralsTicor SA 1 352 1 352 344 0 224 12 7 426
Industrial mineralsGlen Douglas 472 400 350 25 216 0 2 827
1. Land controlled: Area of land under the control of the company/entity.
2. Land authorised: Area of land that is under a mining authorisation (mines) or permit (heavy industry).
ACTIVELY CARING FOR THE ENVIRONMENT AND OUR RESOURCES AT ALL OURACTIVITIES, ACKNOWLEDGING STAKEHOLDERS’ RIGHTS TO A SAFE ANDHEALTHY NATURAL ENVIRONMENT
61
ENVIRONMENTAL RISKSFormal environmental risk
assessments were performed at all
business units. The highest environ-
mental risks for the open-cast mines
are dust generation, air pollution,
mine waste dump rehabilitation and
groundwater pollution.
At the Sishen mine, the effect of
dewatering at the mine on the
groundwater tables of adjacent farms
poses a risk of water shortages.
Noise and vibration levels at the Glen
Douglas mine and the Leeuwpan
mine, although within acceptable
levels, may have residential
complaints as a consequence.
Both underground mining operations,
Tshikondeni and Rosh Pinah, indicate
a risk in the disposal of process
water. Rosh Pinah has identified, as
a potential risk, lead pollution along
the transport route of the lead
concentrate.
At Zincor, the highest potential risks
are groundwater pollution, air pollution
and surface water management.
All risks are being managed as high
priority through proper environmental
management actions and follow-up
risk assessments will be performed.
ENVIRONMENTALMANAGEMENT SYSTEMSKumba has chosen the ISO 14001
internationally accepted standard
for the group’s environmental
management systems.
Zincor obtained ISO 14001
certification during the year under
review. Together with Sishen, two
of the nine business units of the
company now have ISO 14001 certi-
fication. All other units are scheduled
for certification by December 2004.
REHABILITATIONMajor mine closure rehabilitation
activities are being performed at the
Hlobane and Durnacol collieries in
KwaZulu-Natal.
The freshwater dam wall and spillway
at Hlobane was redesigned and
upgraded to ensure dam safety and
to protect the dam for the community.
Surface fractures are being sealed to
prevent clean water from entering
old underground mine workings.
This forms part of an integrated
water management plan that is being
implemented to manage decanting
mine water. Silviculture practices
have been improved to enhance
the rehabilitation of land disturbed
by mining.
At Durnacol, final closure
rehabilitation is progressing.
Demolition of the mining
infrastructure commenced during
the year. Extensive reshaping of a
coal discard dump is under way.
Slimes dams are being transferred to
the dump and cleaned up to reduce
the footprint. Maintenance of
buildings and infrastructure required
in the end-use plan is being
maintained while community
structures have been put in place
to transfer properties and rights to
the local community.
All mining operations have updated the
estimated final closure liabilities as well
as immediate closure liabilities (if
applicable) during the year. Provision
for the cost of closure and post-closure
liabilities for all mines is managed
through an independent rehabilitation
trust fund with an investment balance
of R143 million at year end. In addi-
tion, the group had raised provisions
totalling R362 million at year end.
ENVIRONMENTALPERFORMANCEClose attention is being directed
towards the development and
implementation of proper environ-
mental management systems at all
business units which will conform with
internationally-accepted standards.
Iron ore
The land area controlled by Sishen
is 33 200ha, of which 4 200ha are
disturbed by mining activities. As a
result of quality control for the
specifications of final products, many
ore faces are required to be exposed
and therefore negligible final
rehabilitation can be undertaken at
this stage of the mining programme.
Several environmental management
projects are being implemented at
Sishen to comply with the environ-
mental management programme report.
The Sishen South project is in
the feasibility phase at present. During
Safety, health and environment summary continued
62
the pre-feasibility study, ecologically-
sensitive areas were identified. The
pans in the areas are part of the
Western Ghaap Panveld ecosystem
– a general habitat that occurred over
a very limited area and, as such,
represented a unique setting. Initial
investigations indicated that less
than 60% of the original ecosystem
remains in relatively good condition.
The impact of the project would have
reduced this to less than 20%.
A twofold study was initiated – the
primary objective was the optimisation
of the mine plan to preserve as many
pans as possible, and a secondary
phase focused on a more accurate
delineation of the ecosystem. As a
result, the revised mine plan would
leave more than 40% of the original
ecosystem intact. Additional work
is under way to identify areas for
dedicated future conservation of the
Western Ghaap Panveld.
There have been no significant
environmental incidents at any of the
iron ore operations. No fines have
been imposed by any environmental
regulatory authority.
Coal
At all three mines, regular contact
with interested and affected parties
takes place, with particular focus at
Tshikondeni, which is partially inside
a protected area.
At the Hlobane colliery, on closure,
4 200ha of the 5 359ha have been
rehabilitated while final closure
activities continue.
There have been no significant envi-
ronmental incidents at any of the coal
operations. No fines have been
imposed by any environmental
regulatory authority.
Base metals
The Zincor refinery annually generates
2 210 tonnes of general domestic
waste and 120 tonnes of hazardous
waste. Hazardous waste, such as
cadmium cake, is being partially stored
using the permitted method while most
of it is shipped to customers in east
Asia observing the Basel Convention
requirements.
Being next to the Blesbokspruit
(a Ramsar site), Zincor is managing
and contributing to extensive bio-
monitoring on the borders of the plant
area to manage potential impacts
immediately.
Zincor continuously monitors sulphur
dioxide concentrations in stack
emissions, with the purpose of making
data available to the general public
through an environmental room.
Complaints from the public are
handled through this facility.
At Rosh Pinah, studies are being
conducted to determine whether the
transportation of lead concentrate
could cause pollution.
Prior to the investment, detailed
environmental management evaluations
and legislation studies were conducted
at the zinc refinery company in Hongye,
China, to identify major environmental
risks and liabilities and to assess the
capacity and capabilities to manage
those risks properly.
There have been no significant
environmental incidents at any of
the base metals operations. No fines
have been imposed for non-compliance
with any relevant international,
national, regional or local regulations
in respect of environmental matters.
Heavy minerals
At the heavy minerals mining and
smelting company, Ticor SA, operating
near Empangeni in KwaZulu-Natal,
the area under control is 1 352ha, of
which 344ha are disturbed by mining
or industrial activities.
Kumba aims to establish an industry
benchmark in the heavy minerals
industry, and a set of performance
indicators has been developed to
measure and drive progress in the
critical area of environmental
management, including rehabilitation.
Apart from upgrading the environ-
mental management organisational
structure, the environmental
programmes have been reviewed
during the year, namely air quality
management, water quality
management, environmental
awareness training, internal auditing
and environmental incident reporting.
One environmental incident (overflow
of storm water) that was required to be
reported to the relevant regulator has
been classified as a significant
ENVIRONMENTAL MANAGEMENT SYSTEMS WHICH CONFORM TO INTERNATIONALLY ACCEPTED STANDARDS
63

environmental incident. As a
consequence of a heavy downpour
during a thunderstorm in July 2002,
the water in the stormwater dam at
Hillendale mine overflowed into the
neighbouring residential area. This
resulted in claims for compensation for
damage caused. The necessary steps
and actions have been taken to prevent
further incidents.
Industrial minerals
The land area controlled by the Glen
Douglas dolomite mine is 472ha of
which 350ha are disturbed by mining
activities – 25ha have been rehabilitated.
Complaints relating to dust and noise
impacts were resolved through the
well-established and developed
interested-and-affected-party forum
that meets regularly.
There have been no significant
environmental incidents at any of
the industrial minerals operations.
No fines have been imposed by any
environmental regulatory authority.
Safety, health and environment summary continued
64
65
DETERMINED TO UPLIFT OUR PEOPLE
We will create a sustainable future by ensuring the
development of Kumba’s people and the communities
which are affected by our operations.

SOCIAL SUMMARY
66
EMPLOYMENTCurrently, Kumba employs
9 674 permanent employees which
excludes the employees of Ticor
Limited, Australia. Various contractors
and suppliers support the company’s
operations, creating an additional
4 000 jobs. Kumba will report on net
job creation per region in the 2004
annual report.
HUMAN RIGHTSKumba is a responsible employer
that complies with all labour
legislation in South Africa, eg the
constitution, Labour Relations Act,
Employment Equity Act, Skills
Development Bill and Basic
Conditions of Employment Act.
Accordingly, Kumba ensures that:
• Child labour is not tolerated
• Forced and compulsory labour are
not practised
• Employees are educated about
human rights in accordance with
the noted legislation
• Security personnel are educated in
and respect human rights. This is
reinforced through agreements with
security companies
• The guidelines of the International
Labour Organisation are
complied with.
HIV/AIDSThe Kumba HIV/AIDS policy was
finalised on 18 March 2003 when the
agreement with recognised unions
was signed. The policy was developed
with the involvement of shop stewards
from all business units, union
officials from their respective head
However, Kumba has developed a
comprehensive HIV/AIDS strategy,
regarded as one of the best in the
country in terms of proactive approach.
In an evaluation done by a global
investment bank, UBS, this year on risk
exposure of South African companies to
HIV/AIDS, Kumba was rated second
overall in terms of strategy.
Graph C indicates Kumba’s prevalence
in terms of the mining industry.
offices and representatives from all
business units.
Measurement
A knowledge, attitude and practice
(KAP) survey was conducted at all
business units during 2002. Actuaries
and consultants also conducted a
financial impact analysis in the
second half of 2002.
One of the outcomes of the impact
analysis was the savings that could be
realised with a prevention and
treatment programme.
Graph A indicates the amounts that
could be saved by Kumba over an
18 year period (2003 to 2020).
The cumulative savings will be
R373 651 000.
Graph B indicates Kumba’s
estimated HIV prevalence without
any intervention. This shows that
by 2020 about 18,2% of our
workforce will be HIV positive and
4,6% will be HIV sick if no
interventions are made.
35
30
25
20
15
10
5
0
ESTIMATED HIV PREVALENCEBY INDUSTRY 2003 (%)
GRAPH C
S Mi i f Mi l d E 4 J l 2003
Gol
d
Pla
tinu
m
Coa
l
Dia
mon
ds
Kum
ba
35
30
25
20
15
10
5
0
ESTIMATED HIV PREVALENCE (%)
HIV positive HIV sick
GRAPH B
2003 2005 2010 2015 2020
30 000
20 000
10 000
0
-10 000
-20 000
-30 000
ANNUAL TOTAL SAVINGS AFTERINTERVENTIONS (Rm)
’04
GRAPH A
’06 ’08 ’10 ’12 ’14 ’16 ’18’02 ’20

factor to the success and efficiency
of the group.
Kumba follows an approach of
constructive engagement of all
stakeholders in matters pertaining
to the employment relationship.
This approach focuses and supports
the group’s strategic objectives by
creating a working environment
where the employment relationship
will assist to bring about a more
competitive company.
Effective participation structures exist
at corporate and business unit level,
where interaction with organised labour
on matters regarding the employment
relationship takes place regularly.
A total of 88,35% of employees in
the bargaining unit at Kumba are
unionised. The main trade union role
and 33% of general managers are
employment equity candidates.
Concerted efforts are being made
to increase the number of equity
candidates, with special emphasis
on middle management levels.
Labour relations
Kumba accepts that sound labour
relations is a major contributory
WE HAVE DEVELOPED A COMPREHENSIVE HIV/AIDS STRATEGY REGARDED ASONE OF THE BEST IN THE COUNTRY IN TERMS OF PROACTIVE APPROACH
67
Prevalence studies have been
completed at Sishen, Northern Cape
(11,0%) and Glen Douglas, Gauteng
(14,6%). The prevalence rates as
modelled by NMG-Levy are estimated
at 11% for Kumba. This prevalence
rate means that Kumba is
underexposed relative to the mining
industry as a whole.
HIV/AIDS management
Programmes are in place or planned
at all business units and the
corporate office, which include
voluntary counselling and testing,
peer education, wellness programmes
and community-based programmes
and treatment of sexually-transmitted
diseases. Anti-retroviral pilot
programmes are being implemented
at two business units in October
2003. If successful, the programme
will be extended to more operations.
EMPLOYMENT EQUITYKumba has embarked on a process
for the development and promotion
of historically disadvantaged South
Africans (HDSAs), women and people
with disabilities.
At the end of June 2003, 65%
of the total workforce was black,
coloured or Asian.
To realise its employment equity goals,
detailed employment equity plans
have been compiled for every business
unit. Employment equity (Graph D)
progress is being actively managed in
the management categories where
currently 27% of the Kumba board
45
40
35
30
25
20
15
10
5
0
EMPLOYMENT EQUITY PROGRESS:MANAGEMENT CATEGORIES (%)
2003 2005 2008
HDSA A – G Roles Women
GRAPH D

players are the National Union of
Mineworkers with 63,19%, Solidarity
with 15,34% and the Building Allied
and Construction Workers Union with
6,64% membership.
The group again experienced no
labour unrest or strikes in the year
covered by this report.
Various policies regarding the employ-
ment relationship (eg disciplinary and
grievance procedures, disability and
retrenchment policies) are constantly
reviewed, with consultation or nego-
tiation with the trade unions to create
the optimal working environment.
WORK ENVIRONMENTSince listing, Kumba has been rated
by credible, independent publications
and institutions as being among the
top 40 companies in South Africa on
elements such as salary and benefits,
incentive schemes, and education,
training and development.
HOUSINGKumba’s approach is to focus on
home ownership and enabling
strategies to make this possible,
driven by a joint housing forum at
each business unit.
Kumba spent R17 million on
housing for employees during the
financial year under review, and
will spend an additional R10 million
in the 2004 financial year. The
current status of housing Kumba’s
personnel at business units is
summarised as follows:
Housing statistics
Number of
Description employees %
Home ownership
Kumba
houses bought 1 256 12,98
Rental
Kumba units 1 672 17,28
Hostels 2 779 28,73
Other* 3 967 41,01
Total 9 674 100,00
* People who own or rent non-Kumba housing.
The housing programme conforms to
the requirements of the mining
charter and will be fully implemented
by 2008. Rental houses will be sold
at market value to employees and,
where feasible, hostels will be
converted into single units.
RECRUITMENTKumba applies a policy of
non-discriminatory recruitment. The
general approach of business units is
to employ residents from local
communities, except where specific
skills are not available. About 70%
of employees at business units are
employed from local communities.
HUMAN RESOURCESDEVELOPMENTKumba is committed to the
development of its employees. It has
maintained its position among industry
employers who invest significantly in
training and developing their people.
During the past financial year, the
group invested R62,2 million in
training and developing employees.
This equates to 5,7% of total payroll,
well ahead of the Mining Qualifications
Authority’s average of 3,8% for mining
companies with over 5 000 employees.
More than 63% of the company’s
employees benefited from training
during the year.
Beneficiaries of training
Category % trained
Plant and machine
operator/professional 99
Craft and related trade workers 97
Technician and associated
professionals 92
Labourer and related workers 78
The average number of training
interventions to which Kumba’s
employees were exposed is more than
one training intervention per
employee. Again, this index was
exceptionally high in the case of the
plant and machine operator (an
average 4,5 training interventions per
employee), craft and related trade
workers (average of 3,5 training
interventions per employee), and the
technician and associated
professionals (average of 3,4 training
interventions per employee).
Graduates-in-training, bursars
programme and bridging school
Kumba is committed to ensuring a
steady stream of suitably-qualified
professionals in a skills-deficient
market. The group continues to fund
bursaries, mainly for engineering and
geology studies. Kumba invested
R23 million in the bursary and
Social summary continued
68

graduate-in-training programmes for
the review period. This investment
includes the bridging school where
grade 12 learners are provided the
opportunity to improve their entry
qualifications for universities.
Currently, there are 25 full-time
learners and 127 bursary holders
studying at South African universities.
Of these, 60% are black, coloured or
Asian. Sixty-five graduates are in
training, with 41% being black,
coloured or Asian.
Learnerships
Kumba has 412 apprentices
(recently converted to learnerships
through the Mining Qualifications
Authority) in training, all on a
bursary scheme. This represents
24% of all apprentices trained in
the mining industry. The technical
training centres at Ellisras and
Sishen were accredited as training
providers by the Mining Qualifications
Authority during the year.
Leadership development and
transformation
The attraction, retention and devel-
opment of current and future leaders
remain priorities. This is achieved
through a number of initiatives,
including a comprehensive succession
planning process, and enhancing
strategic leadership competencies.
School of finance
The Kumba School of Finance is
an accredited training organisation
with the South African Institute of
Chartered Accountants and provides
training outside of public practice
(TOPP) to employees aspiring to
attain the associate general
accountant (AGA) or chartered
accountant (CA) qualification.
Thirty-one employees are currently
enrolled in the TOPP programme,
with 77% from the designated
groups.
In addition, two HDSA bursars are
currently studying at South African
universities towards qualifications as
chartered accountants.
Mining Qualifications Authority (MQA)
involvement
Kumba’s human resources
development professionals are
contributing significantly to the
national and sectoral transformation
process through their membership
and participation in bodies such as
the National Skills Authority, the
National Board for Further Education,
Business South Africa’s committee
for education and training, and the
MQA’s sector skills planning
committee. Kumba professionals
are also playing a prominent role
in unit standards generation and
qualification design processes of
the MQA.
SOCIAL INVESTMENT ANDCOMMUNITY DEVELOPMENTResponsible corporate governance
and the management of the
company’s impact on society and its
relationships with stakeholders are
playing an increasingly important
role in the successful achievement of
the company’s vision and business
goals. Kumba fully acknowledges
that it has a crucial role to play in
supporting the philosophy of
sustainable development and
building prosperous societies. The
group has made an unequivocal
commitment to the concept of
sustainable development and
subscribes to the socio-economic
transformation of the mining industry
as defined in the Minerals Act and
attendant mining charter.
Kumba’s areas of focus are:
• Education, training and skills
development
• Healthcare promotion, particularly
HIV/AIDS programmes
• Job creation
• Small, medium and micro
enterprise development
• Conservation of environment,
including awareness programmes
• Infrastructure development
Corporate social investment (CSI)
programmes, managed as an integral
1,8% OF PRE-TAX PROFITS SPENT ON CORPORATE SOCIAL INVESTMENT
69
70
60
50
40
30
20
10
0
KUMBA SPEND IN 2002/03
Edu
cati
onan
d tr
aini
ng
Rm
Hou
sing
Bur
sari
es

part of the group’s business, are
tangible evidence of its commitment
to social development and reflect
directly on its values of social
investment. Kumba spends no less
than 1% of its consolidated pre-tax
profit, based on a three-year rolling
average, on CSI programmes. In the
year under review, Kumba spent
R18 million on its investment
programmes which translates to
1,8% of pre-tax profits. Healthcare,
education, training and skills
development receive the larger portion
of the budget allocation. Through CSI
initiatives, Kumba continues to
ensure that its host communities
value corporate citizenship by
partnering them with other relevant
stakeholders and government in
implementing sustainable community
development programmes. Most of
the business units meet the
requirements of the mining charter
relating to the delivery of socio-
economic development such as
cooperating in the development of
integrated development programmes,
representative decision-making
structures and programmes for labour-
sending areas.
In partnership with the communities,
Kumba has built schools, houses and
clinics around areas of its operations;
it takes care of the natural and social
environment; and cooperates
rigorously in the fight against the
scourge of HIV/AIDS and other
diseases. The Lephalale section
21 company established at
Grootegeluk with the sole aim of
providing total wellness at HIV/AIDS-
infected residences at Lephalale
demonstrates the commitment to
working with communities to fight
the adverse effects of AIDS.
Kumba’s school development
programme is a focal point in the field
of education, with special emphasis on
science, mathematics, engineering and
technology. The bursary scheme and
bridging school programmes have
provided opportunities for young
people to improve entry requirements
in universities and colleges to follow
their challenging careers. The recent
partnership with the Northern Cape
Department of Education in the launch
of the National Institute for Higher
Education illustrates how Kumba
values the contribution of institutions
in education and training for science.
The high rate of unemployment
among the host communities is great
cause for concern. In addressing this
problem, various technical training
and skills development programmes
have been implemented around all
areas of operations. Through such
programmes, more than 65 students
have acquired artisan skills at
Grootegeluk and 49% of them are
employed at the mine. The Itereleng
skills development centre at
Thabazimbi in Limpopo was upgraded
to provide much-needed skills in the
community such as bricklaying,
carpentry, craftwork, knitting and
dressmaking. These skills provide
support to the community’s
sustainable livelihood. The Tshipi
training centre in Sishen, Northern
Cape, conducts programmes that
reflect Kumba’s commitment to skills
development, education, training
and job creation.
In alleviating poverty among its host
communities, Kumba has engaged in
various private-public partnership
programmes that aim to reduce high
unemployment levels and enhance
business skills so that the host
communities become independent
and contribute towards creating jobs
for themselves. As such, programmes
initiated include entrepreneur
promotion, infrastructure development
with special focus on labour-intensive
projects. The Ticor SA operation in
KwaZulu-Natal plays an important
role in the support of women in
mining through its involvement and
support of the regional structure of
the South African Women in Mining
Association (SAWIMA).
Caring for the environment and
natural resources is an additional
responsibility. Working with local
authorities and following the
recognised principles of sustainable
development, Kumba strives to limit
its impact on the environment while
promoting conservation of natural
resources and biodiversity. Kumba
does this to ensure that its footprints
are covered with extensive
rehabilitation and conservation
programmes. Through the
commitment to maintain the
environment and its ecological
integrity, it ensures that direct
Social summary continued
70

benefits such as skills development
and the creation of job opportunities
that enhance the environmental
knowledge of communities are
also established.
In supporting conservation and
maintenance of South Africa’s
biological diversity, Kumba has
committed itself to an investment of
R10 million over 10 years for the
creation of Peace Parks. This
investment intends to promote
conservation objectives and to extend
the involvement to large-scale projects
that care for the environment while
providing sustainable job opportunities
for communities. The Peace Parks
Foundation facilitates the
establishment of transfrontier
conservation areas, thereby supporting
sustainable economic development,
the conservation of biodiversity and
regional peace and stability.
A Blesbokspruit Trust for Environment
project has been launched at Zincor in
partnership with the communities.
This has resulted in positive spin-offs
in the nature conservation and
environmental management initiatives.
In partnership with the MQA and
other mining houses, Kumba is
participating in two projects, to the
value of R10 million, in the poverty
nodes of Majuba in Newcastle and
Kgalagadi near Sishen, to train and
build capacity in projects by former
employees and their dependants.
Kumba is a member of the Business
Trust, a joint programme between
private sector and government to
stimulate job creation through
targeted programmes and capacity
building. The trust sought to provide
socio-economic consolidation of the
political gains ushered in by the
1994 dispensation.
With these programmes and
initiatives, Kumba establishes its
commitment to the principles of the
new Minerals Act, which requires that
all mining companies develop a social
and labour plan. All business units
and mining operations are preparing
their own social and labour policies
which will ensure that Kumba’s
operations meet the objectives and
principles of the plan. Kumba has,
however, subscribed to the principles
during the closure of the Durnacol
and Hlobane collieries.
SUPPORTING THE PHILOSOPHY OF SUSTAINABLE DEVELOPMENT ANDBUILDING PROSPEROUS COMMUNITIES
71
CSI SPEND YEAR 2002/3
SMME development 10%
Infrastructure development 15%
Health – HIV/AIDS 10%
Education 50%
Leadership development 1%
Environment 9%
Job creation 5%

Social case studies
72
BRIDGING SCHOOL“Without financial support, your
dreams could remain dreams.” Those
were the words of Rasai Ntsoelengoe,
a young learner from Gauteng who
faced a bleak future in 1994. So did
Venon Ngubo. Both young men
successfully attended the Kumba
Resources bridging school in 1995.
Both were offered bursaries to study
the degree of their choice. Both
elected metallurgical engineering at
Wits University and graduated in
2001, completing their experiential
training at various Kumba operations.
Both face considerably brighter
futures today, thanks to their hard
work and the stepping stone of the
bridging school.
Faced with the challenge of finding
sufficient learners with the potential
to succeed at tertiary level, Kumba
initiated its bridging school in 1995,
focusing on historically disadvantaged
learners from its operational areas.
The school enables learners to
improve in their results in
mathematics and physical science to
enrol for tertiary education in
engineering and geology. Students
also receive life skills, computer
skills, language proficiency and
technical drawing skills.
Since 1995, 219 learners have
notched up 147 A and B symbols in
mathematics with 101 A and B
symbols in science. Of these
students, 105 received bursaries from
Kumba for tertiary study, while 90%
of the balance received bursaries from
other mining companies. To date,
35 bridging school learners have
been employed as qualified engineers
or geologists at Kumba, while some
60% of Kumba’s bursary holders have
come through the bridging school.
DURNACOLWhen the chief employer in a remote
rural area reaches the end of
operations, it can often be the end of
the surrounding community as well.
Not so at Kumba’s Durnacol colliery
in northern KwaZulu-Natal. Knowing
in the early 1990s that the mine had
just another decade, Durnacol
developed a R22 million social plan
to mitigate the impact of closing in
December 2000.
Some 1 800 people faced
retrenchment on closure, a serious
issue for the community.
Redeployment to other Kumba
operations and surrounding labour-
intensive industries and using
retrenched people in the
environmental rehabilitation
programme secured jobs for some,
but not enough.
For 1 200 other retrenched
employees, a R3 million training
programme developed an array of
skills, from driving licences to
entrepreneurial ventures.
But Kumba had a greater aim than
just its skills programme. The project
initiated in 1995 with broad
consultation ensured that Durnacol
would be a fully-functional and self-
sustainable township in its own right,
built on the existing facilities and
resources of the mining operation,
donated by Kumba. In the process,
over 400 people are now proud
home owners, some assisted by the
state RDP fund, with the proceeds
of the sales being reinvested in
community projects.
The proclamation of Durnacol as a
town is expected before the end of
calendar 2003, a fitting testimony
to Kumba’s commitment to
sustainability and the communities
in which it operates.
73
Sustainability accounting and
reporting is an integral element of
Kumba’s group-wide strategic plan.
It is an ongoing process and our
commitment to develop both its
accounting and reporting will be
evident in future years.
Constructive engagement and
feedback from stakeholders will
assist in ensuring that Kumba
reports can add value to a broad
range of stakeholders.
The Kumba vision is to make
sustainability the business of all
employees. Sustainability risks are
dealt with via the board throughout
the organisation. In this way, an
organisational transformation
WAY FORWARD
process is under way to secure
attitudinal changes as well as
systems changes.
In the year under review, an
assessment of the company’s
performance in the management of
corporate citizenship was done with
the assistance of the African Institute
of Corporate Citizenship. This audit
examined the practices, formalisation
integration across the organisation
and the extent to which it is
embedded into departments and
structures. This assessment is
followed by a process to update
strategies in sustainability
management and the focus on
reporting in accordance with the
GRI requirements.
Systems to supply the required
information are developed on a
priority basis. For safety and health,
the upgrade and centralisation of the
Site Safe four system will cater for all
the statistical needs while the Pivot
system now implemented will cater
for environmental information needs.
Measurements and indices will be
identified on a priority basis and
targets set where appropriate. We
expect it will take another two years
to have all systems in place to comply
with all the requirements of GRI.
A process of consultation with identified
stakeholders to determine information
needs and means of communication
will form part of the strategy process.

74
INTRODUCTIONEdward Nathan & Friedland (Pty)
Limited (ENF) was engaged by Kumba
Resources Limited (Kumba) to review
its sustainability reporting in its
annual report. Under the terms of
engagement, the review would focus
on selected social, economic and
environmental performance indicators
that are reported in the Kumba annual
report of 2003. In accordance with
the terms of engagement, the purpose
of this report is to verify the systems
and processes used to obtain the
information in the annual report as
well as to assure that the information
contained therein is correct.
This review is made solely to Kumba.
ENF, to the fullest extent permitted
by law, does not accept or assume
any responsibility or liability to any
third person in respect of any
information, including the
conclusions, provided in this review.
SCOPE OF REVIEWKumba instructed ENF to:
• Review its annual report
• Identify a selection of
sustainability performance
indicators
• Provide a review that includes a
verification of the systems and
processes used for compiling the
information and the correctness of
the indicators.
ENF duly selected the indicators for
review, taking account of the key risks
facing Kumba as discussed in its
annual report. The 2003 group
performance indicators that were the
subject of review are as follows:
1. HIV/AIDS prevalence and policies
2. Training and development spend
and programmes
3. Labour union membership and
labour relations
4. Payroll and benefits
5. Foundation spend
6. Water usage
7. Land usage and rehabilitation
8. SHE structures, polices and
responsibilities
9. Governance processes, structures
and policies.
RESPONSIBILITIES OFDIRECTORS OF KUMBA The directors are responsible for the
preparation of the annual report and
the information and assessments
contained therein. They are also
responsible for determining the
group’s objectives in respect of
sustainable development/sustainability
performance as well as for establishing
and maintaining appropriate
performance management and internal
control systems from which the
reported information is derived.
RESPONSIBILITY OF THEREVIEWERENF’s responsibility, as reviewer, is
to report on the selected 2003
performance indicators and state-
ments. The manner in which this was
done is set out below. Within ENF’s
responsibility is the obligation to
report on any disclosures in the report
relating to the selected 2003
performance indicators and
INDEPENDENT REVIEW REPORT
EDWARD NATHAN
& FRIEDLANDCORPORATE LAW ADV ISERS & CONSULTANTS
associated statements that ENF may
consider to be inconsistent. ENF is
also obliged to report the absence of
any information and/or explanations
required to conduct the review, as
well as any additional information
that may come to light, the omission
of which may result in the selected
2003 performance indicators together
with the associated statements being
materially misleading.
BASIS OF REVIEWThere are no generally accepted
standards for the reporting or review of
sustainability performance. The review
is therefore based upon the emerging
best practices for such reviews and
includes the use of the Global
Reporting Initiative Guidelines for
non-financial performance reporting.
The review process included:
• Obtaining an understanding of the
systems used to generate, aggre-
gate and report the selected 2003
performance indicators
• Conducting interviews with
management to obtain an under-
standing of the consistency of the
reporting process compared with
the prior year and to obtain
explanations for performance trends
• Testing the accuracy of the
aggregation process for the
selected 2003 performance
indicators at group level
• Reviewing the presentation of the
selected 2003 performance
indicators and associated state-
ments in the report, in light of
the findings and our cumulative
knowledge of the industry and the
group’s operations.
The ENF review does not constitute
an audit and, accordingly, provides
limited assurance on the reliability
of the selected 2003 performance
indicators and associated statements.
CONCLUSIONSHaving reviewed each of the
indicators listed above, as stated in
the annual report 2003, the ENF
review found that the management
and board structures in place to
manage sustainability issues are
fundamentally sound. The ENF review
also found that the systems and
processes used were suitable and that
the information used to compile the
reviewed indicators, in the report, was
accurate. There was no indication
that any of the information reported
about the selected 2003 performance
indicators was materially misstated or
misleading or that any material
information had been omitted. ENF
commends Kumba on its commitment
to sustainability reporting.
Review certification:
ENF EnviroLaw & Sustainability
Services
Edward Nathan & Friedland
(Pty) Limited
9 September 2003
75

INDEX TO GLOBAL REPORTINGINITIATIVE INDICATORS
76
SECTION IN THIS GRI ELEMENT TOPIC PAGE REPORT
Vision and strategy1.1 Vision and strategy 4 Our values
1.2 Key elements of the report Contents
Profile2.1 Name Front cover
2.2 Major products 2 Group profile
2.3 Operational structure 1 Group structure
2.4 Major divisions and joint ventures 1 Group structure
2.5 Countries of operation 1 Operational areas
2.6 Nature of ownership 54 Shareholder information
2.7 Nature of markets served 2 Group profile
2.8 Scale of organisation 2, 25 Group profile, Businessoperations review
2.9 Stakeholders 4 Our values
2.10 Contact details 148 Kumba administration
2.11 Reporting period 84 Financial Index
2.12 Date of previous report Published September 2002
2.13 Boundaries of report 25 Business operations review
2.14 Significant changes on prior year 25 Business operations review
2.15 Basis for reporting on joint ventures, etc 25 Business operations review
2.16 Explanation of restatements n/a
2.17 Decisions not to apply GRI principles n/a
2.18 Definitions 83 Financial definitions
2.19 Significant changes in measurement methods on key economic, environmental and social information n/a
2.20 Policies and practices to ensure accuracy 74 Independent review report
2.21 Policy and practice on independent assurance 74 Independent review report
2.22 Additional information www.kumbaresources.com
Governance structure and management systems3.1 Governance structure 46 Corporate governance
3.2 Independent non-executive directors 46 Corporate governance
3.3 Expertise of board members 46 Corporate governance
3.4 Supervisory board processes 46 Corporate governance
3.5 Link between executive compensation and achievement of goals 6 Business objectives
3.6 Organisational structure and key Group structure,responsible individuals 1, 43, 46 Executive committee,
Corporate governance
3.7 Principles and policies on economic, environment and social performance 4 Our values
3.8 Mechanisms for shareholder interaction with board members 148 Shareholders’ diary
na – not available n/a – not applicable

77
SECTION IN THIS GRI ELEMENT TOPIC PAGE REPORT
3.9 Identification of stakeholders 4 Our values
3.10 Stakeholder consultation 4 Our values
3.11 Information from stakeholder consultation Annual report
3.12 Use of information from stakeholder consultation Annual report and website
3.13 Precautionary approach n/a
3.14 External principles endorsed 4 Our values
3.15 Industry, business and advocacy organisations 66 Social summary
3.16 Upstream and downstream impacts– outsourcing/supplier management– product and service stewardship 4 Our values
3.17 Indirect impacts 59, 66 SHE and social summaries
3.18 Major changes in locations or operations 36 Growth opportunities
3.19 Programmes and procedures in economic, environmental and social performance– priority and target setting 6 Business objectives– major improvement programmes 4 Kumba Way– internal communication and training 66 Social summary– performance monitoring 4, 18, 66 Kumba Way, Financial review
and Social summary– internal and external audit 46 Corporate governance– senior management review 46 Corporate governance
3.20 Certification of management systems 46, 59 Corporate governance,SHE summary
GRI content index4.1 Index 76 Global Reporting Initiative Index
Performance indicatorsEconomic CustomersEC1 Net sales 58 Economic summary
EC2 Geographic breakdown 58 Economic summary
SuppliersEC3 Cost of procurement 58 Economic summary
EC4 Percentage paid on contracted terms 58 Economic summary
EC11 Supplier breakdown 58 Economic summary
EmployeesEC5 Total payroll and benefits 58 Economic summary
Providers of capitalEC6 Distributions 58 Economic summary
EC7 Retained earnings 58 Economic summary
Public sector EC8 Total taxes paid 58 Economic summary
EC9 Subsidies received 58 Economic summary
EC10 Donations 58 Economic summary
EC12 Total spent on non-core business infrastructure development n/a
Indirect impactsEC13 Indirect economic impacts n/a
* Performance indicators are provided in order of core indicator and additional indicator in the GRI Reporting Guidelines.
na – not available n/a – not applicable

78
Index to Global Reporting Initiative indicators continued
SECTION IN THIS GRI ELEMENT TOPIC PAGE REPORT
EnvironmentalEN1 Materials used other than water 59 SHE summary
EN2 Materials waste from external sources na
EN3 Direct energy use 59 SHE summary
EN4 Indirect energy use na
EN17 Renewable energy sources na
EN18 Energy consumption 59 SHE summary
EN19 Indirect (up/downstream) energy use na
EN5 Total water use 59 SHE summary
EN20 Water use and ecosystems affected na
EN21 Withdrawals of ground and surface water na
EN22 Recycling of water na
EN6 Land in biodiversity-rich habitats na
EN7 Impacts on biodiversity in terrestrial, fresh water and marine habitats na
EN23 Land for production activities or extractive use 59 SHE summary
EN24 Impermeable surface of land na
EN25 Impacts on protected or sensitive areas na
EN26 Changes to natural habitats from activities and habitats protected or restored na
EN27 Objectives for protecting and restoring ecosystems na
EN28 Protected species with habitats in operational areas na
EN29 Business units in or around protected or sensitive areas 59 SHE summary
EN8 Greenhouse gas emissions na
EN9 Ozone-depleting substances na
EN10 Other significant air emissions na
EN11 Waste by type and definition na
EN12 Discharges to water na
EN13 Spills of chemicals, oils and fuels na
EN30 Indirect greenhouse gas emissions na
EN31 Hazardous waste 59 SHE summary
EN32 Ecosystems/habitats affected by water run-off na
EN33 Performance of suppliers na
EN14 Impacts of products and services na
EN15 Products reclaimable na
EN16 Fines for environmental non-performance na
EN34 Impacts of transportation used for logistical purposes na
EN35 Total environmental expenditure by type na
* Performance indicators are provided in order of core indicator and additional indicator in the GRI Reporting Guidelines.
na – not available n/a – not applicable

79
SECTION IN THIS GRI ELEMENT TOPIC PAGE REPORT
Social EmploymentLA1 Breakdown of workforce 66 Social summary
LA2 Net job creation and average turnover segmented by region/country 131 Segmental report
LA12 Employee benefits beyond legal mandate n/a
Labour/management relationsLA3 Employees represented by trade unions,
bona fide employee representatives or covered by collective bargaining agreements 66 Social summary
LA4 Information, consultation and negotiation with employees over changes in operations 66 Social summary
LA13 Formal worker representation in decision-making or management, including corporate governance 66 Social summary
Health and safetyLA5 Recording and notification of occupational
accidents and diseases 59 SHE summary
LA6 Formal health and safety committees 46, 59 Corporate governance, with management and worker representation SHE summary
LA7 Standard injury, lost day and absentee rates and work-related fatalities Corporate governance, (including sub-contracted workers) 46, 59 SHE summary
LA8 Policies or programmes on HIV/AIDS 66 Social summary
LA14 Compliance with ILO guidelines 66 Social summary
LA15 Agreements with trade unions or employee representatives covering health and safety at work 66 Social summary
LA9 Training and educationAverage hours of training per year per employee by category 66 Social summary
LA16 Programmes to support continued employability of employees and to manage career endings 66 Social summary
LA17 Programmes for skills management or lifelong learning 66 Social summary
Diversity and opportunityLA10 Equal opportunities and monitoring systems 66 Social summary
LA11 Senior management and corporate governance bodies, including male/female Corporate governance, ratio and cultural diversity 46, 66 Social summary
Human rightsHR1 Human rights and operations, including
monitoring mechanisms 66 Social summary
HR2 Human rights impacts on investment and procurement 66 Social summary
HR3 Human rights within supply chain including monitoring systems 66 Social summary
HR8 Employee training on human rights in operations 66 Social summary
* Performance indicators are provided in order of core indicator and additional indicator in the GRI Reporting Guidelines.
na – not available n/a – not applicable
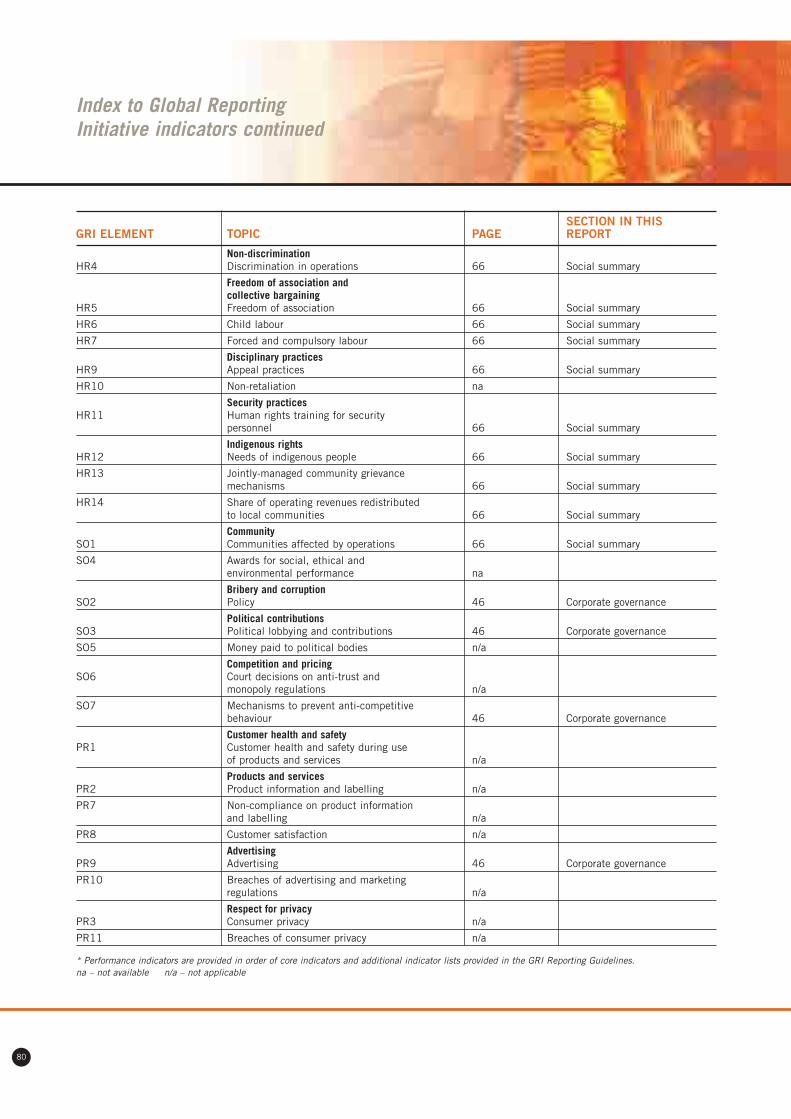
SECTION IN THIS GRI ELEMENT TOPIC PAGE REPORT
Non-discriminationHR4 Discrimination in operations 66 Social summary
Freedom of association and collective bargaining
HR5 Freedom of association 66 Social summary
HR6 Child labour 66 Social summary
HR7 Forced and compulsory labour 66 Social summary
Disciplinary practicesHR9 Appeal practices 66 Social summary
HR10 Non-retaliation na
Security practicesHR11 Human rights training for security
personnel 66 Social summary
Indigenous rightsHR12 Needs of indigenous people 66 Social summary
HR13 Jointly-managed community grievance mechanisms 66 Social summary
HR14 Share of operating revenues redistributed to local communities 66 Social summary
CommunitySO1 Communities affected by operations 66 Social summary
SO4 Awards for social, ethical and environmental performance na
Bribery and corruptionSO2 Policy 46 Corporate governance
Political contributionsSO3 Political lobbying and contributions 46 Corporate governance
SO5 Money paid to political bodies n/a
Competition and pricingSO6 Court decisions on anti-trust and
monopoly regulations n/a
SO7 Mechanisms to prevent anti-competitive behaviour 46 Corporate governance
Customer health and safetyPR1 Customer health and safety during use
of products and services n/a
Products and servicesPR2 Product information and labelling n/a
PR7 Non-compliance on product information and labelling n/a
PR8 Customer satisfaction n/a
AdvertisingPR9 Advertising 46 Corporate governance
PR10 Breaches of advertising and marketing regulations n/a
Respect for privacyPR3 Consumer privacy n/a
PR11 Breaches of consumer privacy n/a
* Performance indicators are provided in order of core indicators and additional indicator lists provided in the GRI Reporting Guidelines.na – not available n/a – not applicable
80
Index to Global Reporting Initiative indicators continued

81
GROUP CASH VALUE ADDED STATEMENTFOR THE YEAR ENDED 30 JUNE 2003
CASH GENERATED
Cash derived from sales and services 7 136 6 963
Income from investments and interest received 49 47
Paid to suppliers for materials and services (4 231) (3 127)
CASH VALUE ADDED 2 954 100 3 883 100
CASH UTILISED TO
Remunerate employees for services 1 513 51 1 238 32
Pay direct taxes to the state 312 11 149 4
Provide lenders with a return on borrowings 349 12 312 8
CASH DISBURSED AMONG STAKEHOLDERS 2 174 74 1 699 44
CASH RETAINED IN THE GROUP TO MAINTAIN
AND DEVELOP OPERATIONS 780 26 2 184 56
NOTES TO THE GROUP CASH VALUE ADDED STATEMENT
1. TAXATION CONTRIBUTION
Direct taxes (as above) 312 149
Value added taxes levied on purchases of goods and services 883 530
Regional service council levies 10 7
Rates and taxes paid to local authorities 11 7
GROSS CONTRIBUTIONS 1 216 693
2. ADDITIONAL AMOUNTS COLLECTED BY THE GROUP
ON BEHALF OF GOVERNMENT
Value added tax and other duties charged on turnover 596 488
Employees’ tax deducted from remuneration paid 345 208
941 696
Wealth Wealth2003 created 2002 created
Rm % Rm %
The value added statement shows the wealth the group has created through mining, beneficiation, trading and investing operations.The statement below summarises the total cash wealth created and how it was disbursed among the group’s stakeholders, leavinga retained amount which was re-invested in the group for the replacement of assets and further development of operations.

SELECTED GROUP FINANCIAL DATATRANSLATED INTO US DOLLARSFOR THE YEAR ENDED 30 JUNE 2003
82
INCOME STATEMENTREVENUE 827 704Operating expenses (693) (539)
NET OPERATING PROFIT 134 165Net financing costs (27) (24)Income from equity accounted investments 8Impairment charges (10)Goodwill amortisation (2) 3
PROFIT BEFORE TAXATION 105 142Taxation (25) (46)
NET PROFIT ATTRIBUTABLETO ORDINARY SHAREHOLDERS 80 96
ATTRIBUTABLE EARNINGS PER SHARE (US CENTS) 26,8 33,6
BALANCE SHEETASSETSNON-CURRENT ASSETSProperty, plant and equipment 1 105 551Intangible assets 13Goodwill (11) 2Investments in associates and joint ventures 16 114Deferred taxation 65 41Financial assets 37 24CURRENT ASSETSCash and cash equivalents 130 65Other 367 188
TOTAL ASSETS 1 722 985
EQUITY AND LIABILITIESSHAREHOLDERS’ FUNDS 663 465MINORITY INTEREST 160 47NON-CURRENT LIABILITIESInterest-bearing borrowings 377 85Deferred taxation and provisions 306 171CURRENT LIABILITIESInterest-bearing borrowings 73 91Other 143 126
TOTAL EQUITY AND LIABILITIES 1 722 985
Net debt (refer to definitions on page 83) 320 111
CASH FLOW STATEMENTCash available from operations 86 213Proceeds on disposal of assets 5 2Investments– Acquisition of subsidiary 41– Acquisition of joint ventures and associates (4)– Other (1) (5)Capital expenditure– Heavy minerals (102) (62)– Other (51) (45)
NET CASH (OUTFLOW)/INFLOW (26) 103
The group statements on this page have been expressed in US dollars for information purposes. The average US dollar/rand forthe year US$1: R9,0275 (US$1: R10,19) has been used to translate the income and cash flow statements, while the balancesheet has been translated at the closing rate at the last day of the reporting period at US$1: R7,425 (US$1: R10,367).
2003 2002USD USD
million million
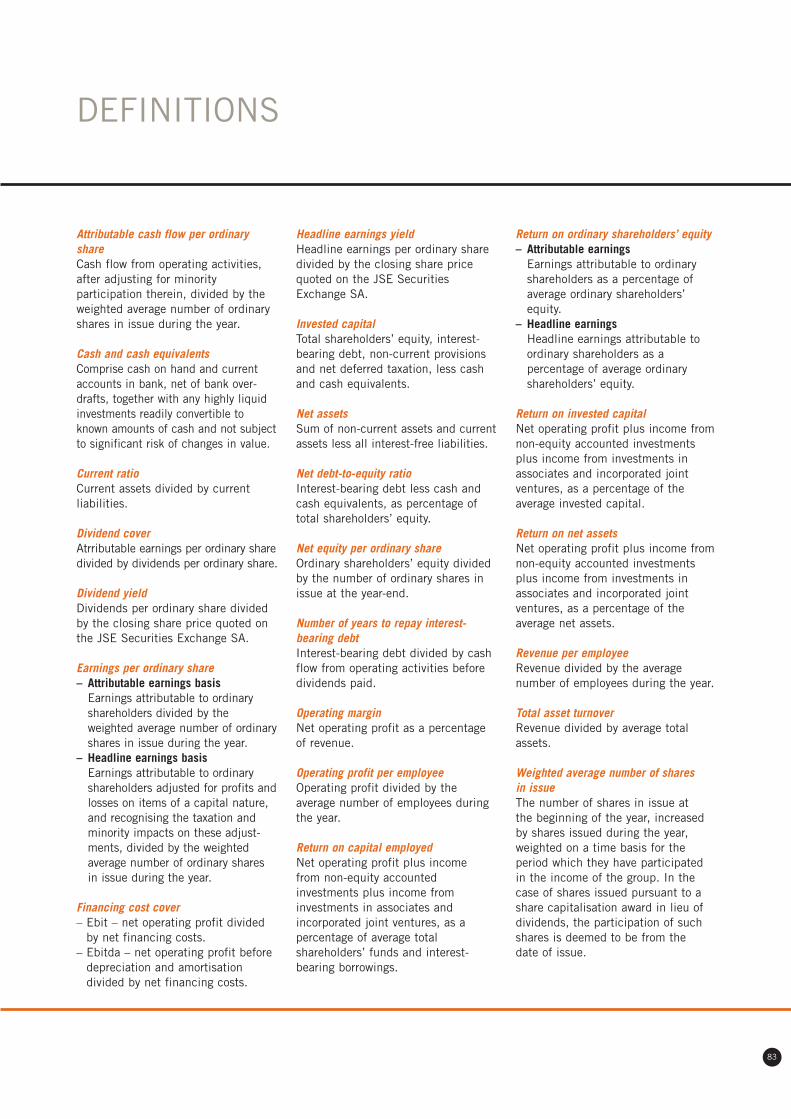
83
Attributable cash flow per ordinaryshareCash flow from operating activities,after adjusting for minorityparticipation therein, divided by theweighted average number of ordinaryshares in issue during the year.
Cash and cash equivalentsComprise cash on hand and currentaccounts in bank, net of bank over-drafts, together with any highly liquidinvestments readily convertible toknown amounts of cash and not subjectto significant risk of changes in value.
Current ratioCurrent assets divided by currentliabilities.
Dividend coverAtrributable earnings per ordinary sharedivided by dividends per ordinary share.
Dividend yieldDividends per ordinary share dividedby the closing share price quoted onthe JSE Securities Exchange SA.
Earnings per ordinary share– Attributable earnings basis
Earnings attributable to ordinaryshareholders divided by theweighted average number of ordinaryshares in issue during the year.
– Headline earnings basisEarnings attributable to ordinaryshareholders adjusted for profits andlosses on items of a capital nature,and recognising the taxation andminority impacts on these adjust-ments, divided by the weightedaverage number of ordinary sharesin issue during the year.
Financing cost cover– Ebit – net operating profit divided
by net financing costs.– Ebitda – net operating profit before
depreciation and amortisationdivided by net financing costs.
Headline earnings yieldHeadline earnings per ordinary sharedivided by the closing share pricequoted on the JSE SecuritiesExchange SA.
Invested capitalTotal shareholders’ equity, interest-bearing debt, non-current provisionsand net deferred taxation, less cashand cash equivalents.
Net assetsSum of non-current assets and currentassets less all interest-free liabilities.
Net debt-to-equity ratioInterest-bearing debt less cash andcash equivalents, as percentage oftotal shareholders’ equity.
Net equity per ordinary shareOrdinary shareholders’ equity dividedby the number of ordinary shares inissue at the year-end.
Number of years to repay interest-bearing debtInterest-bearing debt divided by cashflow from operating activities beforedividends paid.
Operating marginNet operating profit as a percentageof revenue.
Operating profit per employeeOperating profit divided by theaverage number of employees duringthe year.
Return on capital employedNet operating profit plus incomefrom non-equity accountedinvestments plus income frominvestments in associates andincorporated joint ventures, as apercentage of average totalshareholders’ funds and interest-bearing borrowings.
Return on ordinary shareholders’ equity– Attributable earnings
Earnings attributable to ordinaryshareholders as a percentage ofaverage ordinary shareholders’equity.
– Headline earningsHeadline earnings attributable toordinary shareholders as apercentage of average ordinaryshareholders’ equity.
Return on invested capitalNet operating profit plus income fromnon-equity accounted investmentsplus income from investments inassociates and incorporated jointventures, as a percentage of theaverage invested capital.
Return on net assetsNet operating profit plus income fromnon-equity accounted investmentsplus income from investments inassociates and incorporated jointventures, as a percentage of theaverage net assets.
Revenue per employeeRevenue divided by the averagenumber of employees during the year.
Total asset turnoverRevenue divided by average totalassets.
Weighted average number of sharesin issueThe number of shares in issue atthe beginning of the year, increasedby shares issued during the year,weighted on a time basis for theperiod which they have participatedin the income of the group. In thecase of shares issued pursuant to ashare capitalisation award in lieu ofdividends, the participation of suchshares is deemed to be from thedate of issue.
DEFINITIONS

KUMBA FINANCIAL REPORTING 2003
FINANCIAL INDEX
CONTENTSPage
Directors’ responsibility for financial reporting 85
Certificate by company secretary 85
Report of the independent auditors 86
Report of the directors 87
Directors’ remuneration 88 – 91
Income statements 92
Balance sheets 93
Cash flow statements 94
Group statement of changes in equity 95
Company statement of changes in equity 96
Notes to the annual financial statements 97
ANNEXURES
1. Non-current interest-bearing borrowings 139
2. Investments in associates, joint ventures
and other investments 140 – 141
3. Investments in subsidiaries 142 – 143
www.kumbaresources.com
84

85
TO THE MEMBERS OF KUMBA RESOURCESLIMITEDThe directors of the company are responsible for maintainingadequate accounting records, the preparation of the annualfinancial statements of the company and group, and to developand maintain a sound system of internal control to safeguardshareholders’ investments and the group’s assets. Inpresenting the accompanying financial statements, SouthAfrican statements of Generally Accepted Accounting Practiceand International Accounting Standards have been followed,applicable accounting policies have been used while prudentjudgements and estimates have been made.
For the directors to discharge their responsibilities,management has developed and continues to maintain asystem of internal control aimed at reducing the risk of error orloss in a cost-effective manner. Such systems can providereasonable but not absolute assurance against materialmisstatement or loss. The directors, primarily through theaudit committee which consists of non-executive directors,meet periodically with the external and internal auditors, aswell as executive management to evaluate matters concerningaccounting policies, internal control, auditing and financialreporting. The group’s internal auditors independently evaluatethe internal controls and co-ordinate their audit coverage withthe external auditors. The external auditors are responsible forreporting on the financial statements. The external andinternal auditors have unrestricted access to all records,property and personnel as well as to the audit committee. Thedirectors are not aware of any material breakdown in thefunctioning of these controls and systems during the yearunder review.
The directors are of the opinion, based on the information andexplanations given by management and the internal auditors,and on comment by the external auditors on the results of theiraudit conducted for the purpose of expressing their opinion,that the internal accounting controls are adequate, so thatthe financial records may be relied on for preparing thefinancial statements and maintaining accountability for assetsand liabilities.
As the directors have reviewed the group’s financial budgetswith their underlying business plans for the period to 30 June2004, and in the light of the current financial position andexisting borrowing facilities, they consider it appropriate thatthe annual financial statements be prepared on the going-concern basis.
Against this background, the directors of the company acceptresponsibility for the annual financial statements, which wereapproved by the board of directors on 19 August 2003 and aresigned on its behalf by
MLD Marole Dr CJ Fauconnier DJ van StadenChairman Chief Executive Director
The external auditors have audited the annual financialstatements of the company and group and their unqualifiedreport appears on page 86.
Directors’ responsibility for financial reporting
In terms of the Companies Act 61 of 1973 of South Africa, as
amended, I, Marie Viljoen, in my capacity as company
secretary, confirm that for the year ended 30 June 2003, the
company has lodged with the Registrar of Companies all such
returns as are required of a public company in terms of this
Act and that all such returns are true, correct and up to date.
M Viljoen
Company Secretary
19 August 2003
Certificate by company secretary

86 KUMBA FINANCIAL REPORTING 2003
Report of the independent auditors
TO THE MEMBERS OF KUMBA RESOURCESLIMITEDWe have audited the annual financial statements and the group
annual financial statements of Kumba Resources Limited set
out on pages 87 to 143 for the year ended 30 June 2003.
These financial statements are the responsibility of the
company’s directors. Our responsibility is to express an opinion
on these financial statements based on our audit.
SCOPEWe conducted our audit in accordance with statements of
South African auditing standards. Those standards require
that we plan and perform the audit to obtain reasonable
assurance that the financial statements are free of material
misstatement.
An audit includes:
– examining on a test basis, evidence supporting the amounts
and disclosures in the financial statements;
– assessing the accounting principles used and significant
estimates made by management; and
– evaluating the overall financial statement presentation.
We believe that our audit provides a reasonable basis for
our opinion.
AUDIT OPINIONIn our opinion, the financial statements fairly present, in all
material respects, the financial position of the company and of
the group at 30 June 2003 and the results of their operations
and cash flows for the year then ended in accordance with
South African Statements of Generally Accepted Accounting
Practice and International Financial Reporting Standards, and
in the manner required by the Companies Act 61 of 1973 of
South Africa, as amended.
KPMG Inc.
Registered Accountants and Auditors
Chartered Accountants (SA)
Johannesburg
19 August 2003

87
Report of the directors
The directors have pleasure in presenting the annual financialstatements for Kumba Resources Limited (Kumba) and thegroup for the year ended 30 June 2003.
NATURE OF BUSINESSKumba, incorporated in South Africa, is a mining group ofcompanies focusing on extracting and processing a range ofminerals and metals including iron ore, coal, heavy minerals,base metals and selected industrial minerals.
REGISTRATION DETAILSKumba is a listed company on the JSE Securities Exchange SAin the resource sector. The company registration number is2000/011076/06. The registered office is Roger Dyason Road,Pretoria West, Pretoria, 0002, Republic of South Africa.
ACTIVITIES AND FINANCIAL RESULTSDetailed reports on the activities and performance of the groupand the various business operations are provided in thebusiness operations review.
PROPERTY, PLANT AND EQUIPMENTCapital expenditure for the year amounted to R1 386 million(2002: R1 085 million).
SHAREHOLDERS’ RESOLUTIONSAt the second annual general meeting of shareholders, held on18 November 2002, the following resolutions were passed:– placing of unissued shares under the control of the directors
subject to the conditions set out in note 16;– granting of authority to directors to issue the unissued shares
for cash; and– granting of general authority to the company and its
subsidiaries from time to time, being authorised theretoby their respective articles, to acquire in terms of sections85 and 89 of the Companies Act and the listingrequirements of the JSE Securities Exchange SA, sharesissued by the company.
The group or its subsidiaries have passed no other special orordinary shareholders’ resolutions of material interest or of asubstantive nature.
SHARE CAPITALThe group did not issue any shares during the year.
SHAREHOLDERSAn analysis of shareholders and shareholding is provided in theshareholders’ analysis.
DIVIDENDDividend number 2 of 60 cents per share has been declared inSouth African currency in respect of the year ended 30 June2003. The dividend will be paid on Monday, 29 September2003 to shareholders recorded in the books of the company atthe close of business on 26 September 2003. To comply with
the requirements of STRATE the last day to trade cum dividendis Thursday, 18 September 2003. The shares will commencetrading ex dividend on Friday, 19 September 2003 and therecord date is Friday, 26 September 2003.
No shares may be dematerialised or rematerialised betweenFriday, 19 September 2003 and Friday, 26 September 2003,both days inclusive.
INVESTMENTS AND SUBSIDIARIESThe financial information in respect of investments, andinterests in subsidiaries of the company, is disclosed inannexures 2 and 3 to the financial statements.
During the year Kumba acquired the following investments:– Ticor Limited (Ticor) (titanium dioxide company listed in
Australia)Kumba increased its shareholding in Ticor to 50,12%thereby acquiring a controlling interest. Ticor has beenconsolidated effective from 1 April 2003. During June 2003the group further increased its interest in Ticor to 51,38%by acquiring an additional 1,26%.
– Magnetic Minerals Limited (acquisition and exploration ofmineral tenements prospectives)On 1 April 2003 Ticor acquired a controlling interest inMagnetic Minerals Limited resulting in the consolidationthereof from such date.
– ZnERGY (Proprietary) Limited (project for the production ofzinc-air fuel cells)On 30 November 2002 the group acquired an additional8,5% of the issued share capital of ZnERGY (Pty) Ltd.A further acquisition of 30% was made on 1 April 2003bringing the interest of the group at 30 June 2003 to 85%.
Kumba announced on 28 July 2003 that it has disposed of itsstake in Australian nickel miner Mincor Resources NL on 25 July2003. The shares were sold for R103 million (AUD21 million) toa range of Australian and overseas financial institutions. Theprofit on the disposal will be reflected in the 2004 financial year.(Refer to annexure 2 for carrying amount at 30 June 2003.)
DIRECTORATE AND SHAREHOLDINGSThe names of the directors in office at the date of this reportare provided in the annual report.
During the current financial year, the following retirement andappointment took place:Mr HJ Smith Retired 1 November 2002Ms MLD Marole Appointed chairman 1 November 2002
At the forthcoming annual general meeting, Ms MLD Marole,Messrs GS Gouws, AJ Morgan, BE Davison and Prof NS Segalwill retire by rotation and, being eligible, will offer themselvesfor re-election.
INDEPENDENT AUDITORSThe auditors of the company, KPMG Inc, will continue in officein accordance with section 270(2) of the Companies Act,1973, of South Africa.

88 KUMBA FINANCIAL REPORTING 2003
Directors’ remuneration
This report on remuneration and related matters covers issueswhich are the concern of the board as a whole in addition tothose which were dealt with by the human resources andremuneration committee.
REMUNERATION POLICYThe human resources and remuneration committee have aclearly defined mandate from the board aimed at:– ensuring that the company’s chairman, directors and senior
executives are fairly rewarded for their individualcontributions to the company’s overall performance; and
– ensuring that the company’s remuneration strategies andpackages, including the remuneration schemes, are relatedto performance, are suitably competitive and give due regardto the interests of the shareholders and the financial andcommercial health of the company.
The human resource and remuneration committee considersand submits recommendations to the Kumba board concerning
the fees to be paid to each non-executive director. Anychanges to the fees will be approved by the board andsubmitted to the shareholders in a general meeting forapproval prior to implementation and payment. The level offees will among others be determined according to the medianremuneration paid by comparable companies.
DIRECTORS’ SERVICE CONTRACTSService contracts of executive directors are subject to onecalendar month’s notice. In terms of a retention arrangementimplemented by the company, executive directors may becomeentitled to a severance package of one year’s remuneration iftheir services are terminated before 1 July 2004. There are norestraints of trade associated with the contracts. Non-executive directors are not bound by service contracts.
SUMMARY OF REMUNERATIONPension Medical
Per- Gain Benefit fund fund Gains onBasic Fees for formance share and contri- contri- sharesalary services bonus1 incentive1 allowances2 butions butions scheme3 Other Total
FOR THE YEAR ENDED 30 JUNE 2003Executive directorsDr CJ Fauconnier 1 801 817 193 894 524 914 10 296 10 450 2 541 371MJ Kilbride 1 080 404 125 117 421 005 123 356 10 296 7 145 1 767 323CF Meintjes 1 026 742 111 393 309 971 110 027 10 296 121 344 6 887 1 696 660DJ van Staden 1 044 872 115 120 336 563 114 377 10 296 6 633 1 627 861RG Wadley 1 034 908 119 658 400 984 119 179 6 947 1 681 676
9 314 891Less gains on share scheme (121 344)
Total remuneration paid by Kumba 9 193 547
Non-executive directorsTL de Beer 167 000 3 766 170 766JJ Geldenhuys 167 000 2 518 169 518GS Gouws4 60 518 6 305 66 823Dr D Konar 135 500 1 872 137 372MLD Marole (Chairman) 144 833 2 256 147 089AJ Morgan 104 000 546 104 546SA Nkosi 72 500 1 695 74 194Prof NS Segal 101 750 101 750F Titi4 83 373 3 776 87 149CML Savage 67 500 67 500
1 126 707
FOR THE YEAR ENDED 30 JUNE 2002Executive directorsDr CJ Fauconnier 1 542 955 174 700 592 891 554 289 8 760 6 705 967 651 9 580 213MJ Kilbride 942 207 113 354 384 697 418 589 109 928 8 760 1 166 278 651 3 144 464CF Meintjes 901 162 101 416 344 182 316 318 98 238 8 760 1 921 031 651 3 691 758DJ van Staden 907 061 103 629 351 692 336 987 102 504 8 760 1 407 523 651 3 218 807RG Wadley 916 963 106 898 362 787 366 329 106 355 765 027 651 2 625 010
22 260 252Less gains on share scheme (11 965 826)
Total remuneration paid by Kumba 10 294 426
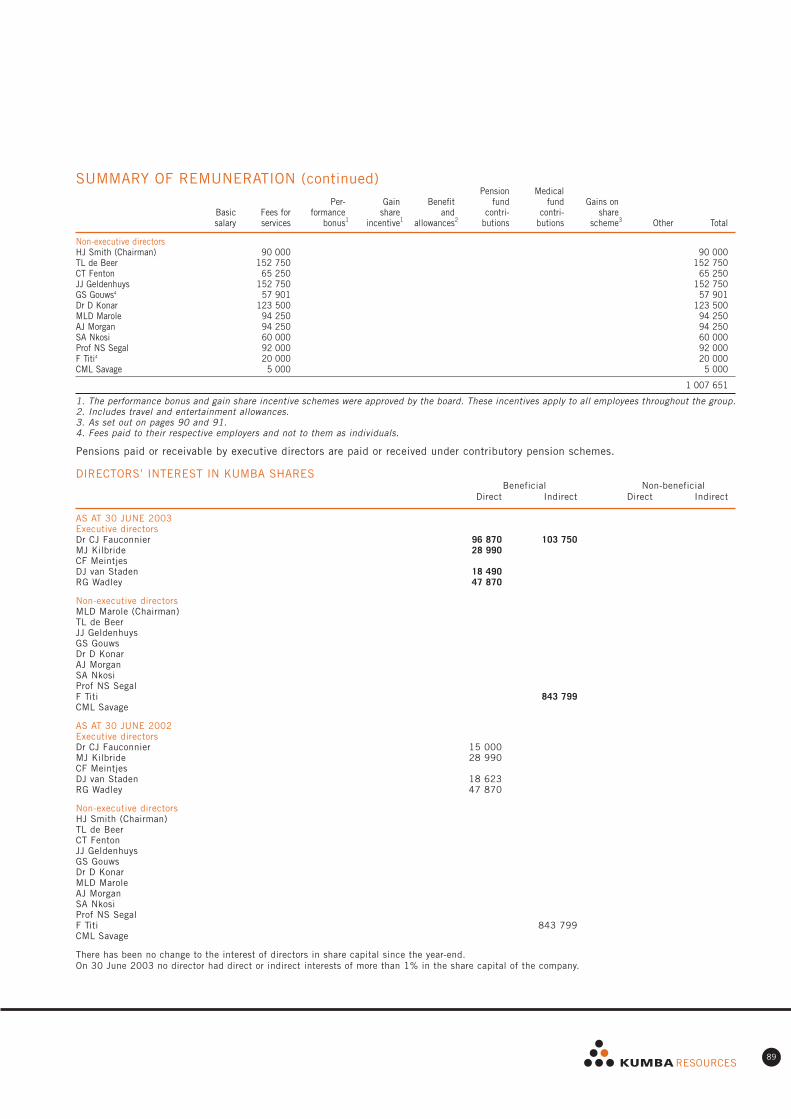
89
DIRECTORS’ INTEREST IN KUMBA SHARESBeneficial Non-beneficial
Direct Indirect Direct Indirect
AS AT 30 JUNE 2003Executive directorsDr CJ Fauconnier 96 870 103 750MJ Kilbride 28 990CF MeintjesDJ van Staden 18 490RG Wadley 47 870
Non-executive directorsMLD Marole (Chairman)TL de BeerJJ GeldenhuysGS GouwsDr D KonarAJ MorganSA NkosiProf NS SegalF Titi 843 799CML Savage
AS AT 30 JUNE 2002Executive directorsDr CJ Fauconnier 15 000MJ Kilbride 28 990CF MeintjesDJ van Staden 18 623RG Wadley 47 870
Non-executive directorsHJ Smith (Chairman)TL de BeerCT FentonJJ GeldenhuysGS GouwsDr D KonarMLD MaroleAJ MorganSA NkosiProf NS SegalF Titi 843 799CML Savage
There has been no change to the interest of directors in share capital since the year-end.On 30 June 2003 no director had direct or indirect interests of more than 1% in the share capital of the company.
SUMMARY OF REMUNERATION (continued)Pension Medical
Per- Gain Benefit fund fund Gains onBasic Fees for formance share and contri- contri- sharesalary services bonus1 incentive1 allowances2 butions butions scheme3 Other Total
Non-executive directorsHJ Smith (Chairman) 90 000 90 000TL de Beer 152 750 152 750CT Fenton 65 250 65 250JJ Geldenhuys 152 750 152 750GS Gouws4 57 901 57 901Dr D Konar 123 500 123 500MLD Marole 94 250 94 250AJ Morgan 94 250 94 250SA Nkosi 60 000 60 000Prof NS Segal 92 000 92 000F Titi4 20 000 20 000CML Savage 5 000 5 000
1 007 651
1. The performance bonus and gain share incentive schemes were approved by the board. These incentives apply to all employees throughout the group.2. Includes travel and entertainment allowances.3. As set out on pages 90 and 91.4. Fees paid to their respective employers and not to them as individuals.
Pensions paid or receivable by executive directors are paid or received under contributory pension schemes.
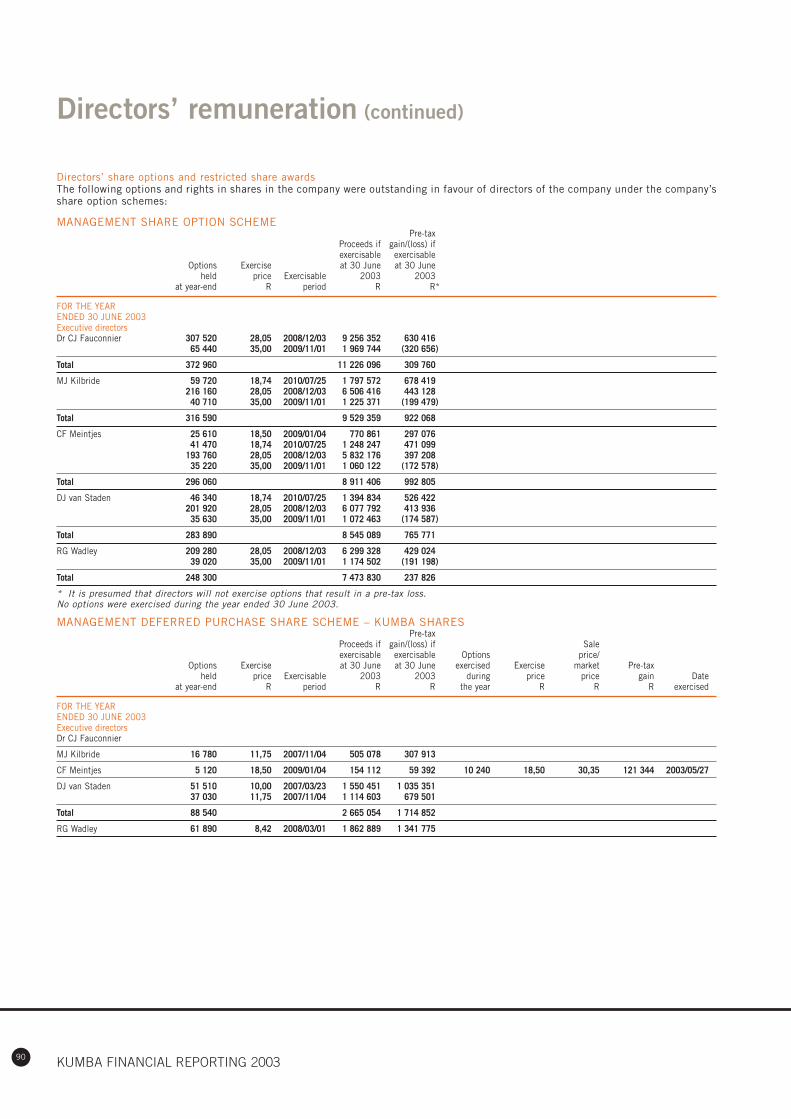
90 KUMBA FINANCIAL REPORTING 2003
Directors’ remuneration (continued)
Directors’ share options and restricted share awardsThe following options and rights in shares in the company were outstanding in favour of directors of the company under the company’sshare option schemes:
MANAGEMENT SHARE OPTION SCHEMEPre-tax
Proceeds if gain/(loss) ifexercisable exercisable
Options Exercise at 30 June at 30 Juneheld price Exercisable 2003 2003
at year-end R period R R*
FOR THE YEAR ENDED 30 JUNE 2003Executive directorsDr CJ Fauconnier 307 520 28,05 2008/12/03 9 256 352 630 416
65 440 35,00 2009/11/01 1 969 744 (320 656)
Total 372 960 11 226 096 309 760
MJ Kilbride 59 720 18,74 2010/07/25 1 797 572 678 419216 160 28,05 2008/12/03 6 506 416 443 12840 710 35,00 2009/11/01 1 225 371 (199 479)
Total 316 590 9 529 359 922 068
CF Meintjes 25 610 18,50 2009/01/04 770 861 297 07641 470 18,74 2010/07/25 1 248 247 471 099
193 760 28,05 2008/12/03 5 832 176 397 20835 220 35,00 2009/11/01 1 060 122 (172 578)
Total 296 060 8 911 406 992 805
DJ van Staden 46 340 18,74 2010/07/25 1 394 834 526 422201 920 28,05 2008/12/03 6 077 792 413 93635 630 35,00 2009/11/01 1 072 463 (174 587)
Total 283 890 8 545 089 765 771
RG Wadley 209 280 28,05 2008/12/03 6 299 328 429 02439 020 35,00 2009/11/01 1 174 502 (191 198)
Total 248 300 7 473 830 237 826
* It is presumed that directors will not exercise options that result in a pre-tax loss.No options were exercised during the year ended 30 June 2003.
MANAGEMENT DEFERRED PURCHASE SHARE SCHEME – KUMBA SHARESPre-tax
Proceeds if gain/(loss) if Saleexercisable exercisable Options price/
Options Exercise at 30 June at 30 June exercised Exercise market Pre-taxheld price Exercisable 2003 2003 during price price gain Date
at year-end R period R R the year R R R exercised
FOR THE YEAR ENDED 30 JUNE 2003Executive directorsDr CJ Fauconnier
MJ Kilbride 16 780 11,75 2007/11/04 505 078 307 913
CF Meintjes 5 120 18,50 2009/01/04 154 112 59 392 10 240 18,50 30,35 121 344 2003/05/27
DJ van Staden 51 510 10,00 2007/03/23 1 550 451 1 035 35137 030 11,75 2007/11/04 1 114 603 679 501
Total 88 540 2 665 054 1 714 852
RG Wadley 61 890 8,42 2008/03/01 1 862 889 1 341 775

91
MANAGEMENT SHARE OPTION SCHEMEPre-tax
Proceeds if gain/(loss) ifexercisable exercisable
Options Exercise at 30 June at 30 Juneheld price Exercisable 2002 2002
at year-end R period R R
FOR THE YEAR ENDED 30 JUNE 2002Executive directorsDr CJ Fauconnier 307 520 28,05 2008/12/03 14 514 944 5 889 008
MJ Kilbride 59 720 18,74 2010/07/25 2 818 784 1 699 631216 160 28,05 2008/12/03 10 202 752 4 139 464
Total 275 880 13 021 536 5 839 095
CF Meintjes 25 610 18,50 2009/01/04 1 208 792 735 00741 470 18,74 2010/07/25 1 957 384 1 180 236
193 760 28,05 2008/12/03 9 145 472 3 710 504
Total 260 840 12 311 648 5 625 747
DJ van Staden 46 340 18,74 2010/07/25 2 187 248 1 318 836201 920 28,05 2008/12/03 9 530 624 3 866 768
Total 248 260 11 717 872 5 185 604
RG Wadley 209 280 28,05 2008/12/03 9 878 016 4 007 712
* No options were exercised during the year ended 30 June 2002.
MANAGEMENT DEFERRED PURCHASE SHARE SCHEME – KUMBA SHARESPre-tax
Proceeds if gain/(loss) if Saleexercisable exercisable Options price/
Options Exercise at 30 June at 30 June exercised Exercise market Pre-taxheld price Exercisable 2002 2002 during price price gain Date
at year-end R period R R the year R R R exercised
FOR THE YEAR ENDED 30 JUNE 2002Executive directorsDr CJ Fauconnier 65 620 11,75 2007/11/04 3 097 264 2 326 229 93 740 10,00 29,00 1 781 060 2001/12/05
120 000 10,00 2007/03/23 5 664 000 4 464 000 26 260 10,00 28,97 498 152 2001/12/0543 740 11,75 28,97 753 203 2001/12/05
4 300 10,00 48,50 208 550 2002/05/2415 000 10,00 48,60 729 000 2002/05/24
5 700 10,00 48,70 277 590 2002/05/2410 000 10,00 50,75 507 500 2002/05/2810 000 10,00 51,00 510 000 2002/05/28
Total 185 620 8 761 264 6 790 229 5 265 055
MJ Kilbride 16 780 11,75 2007/11/04 792 016 594 851
CF Meintjes 15 360 18,50 2009/01/04 724 992 440 832 10 240 18,50 51,00 332 800 2002/06/05
DJ van Staden 51 510 10,00 2007/03/23 2 431 272 1 916 17237 030 11,75 2007/11/04 1 747 816 1 312 714
Total 88 540 4 179 088 3 228 886
RG Wadley 61 890 8,42 2008/03/01 2 921 208 2 400 094

92 KUMBA FINANCIAL REPORTING 2003
Income statementsFOR THE YEAR ENDED 30 JUNE 2003
REVENUE 7 469 7 182 8
Operating expenses 2 (6 257) (5 499) 91 (18)
NET OPERATING PROFIT/(LOSS) 1 212 1 683 99 (18)
Net financing costs 3 (244) (242) (182) (213)
Income from investments 4 529 196
Income from equity accounted investments 11 2 83
Impairment charges 5 (2) (101)
Goodwill amortisation 10 (21) 26
PROFIT/(LOSS) BEFORE TAXATION 947 1 449 446 (35)
Taxation 6 (229) (465) (29) 8
PROFIT/(LOSS) FROM ORDINARY ACTIVITIES 718 984 417 (27)
Minority interest (8)
NET PROFIT/(LOSS) ATTRIBUTABLE TO ORDINARY SHAREHOLDERS 718 976 417 (27)
RECONCILIATION OF HEADLINE EARNINGSNet profit attributable to ordinary shareholders 718 976
Adjusted for:
– impairment charges 5 2 101
– share of associates goodwill amortisation 11 38 40
– goodwill amortisation 10 21 (26)
– share of associates exceptional items 11 7 12
– net deficit on disposal or
scrapping of property, plant and equipment (3) 4
Taxation effect of adjustments 1 (9)
HEADLINE EARNINGS 784 1 098
HEADLINE EARNINGS PER SHARE (CENTS) 7
– basic 264,0 385,3
– diluted 262,2 376,0
ATTRIBUTABLE EARNINGS PER SHARE (CENTS) 7
– basic 241,8 342,5
– diluted 240,1 334,2
Dividend paid per share (cents) 85,0
GROUP COMPANY
2003 2002 2003 2002Notes Rm Rm Rm Rm

93
Balance sheetsAT 30 JUNE 2003
GROUP COMPANY
2003 2002 2003 2002Notes Rm Rm Rm Rm
ASSETSNon-current assets
Property, plant and equipment 8 8 205 5 710 38 39
Intangible assets 9 98
Goodwill 10 (80) 23
Investments in associates
and joint ventures 11 118 1 184 93 59
Investments in subsidiaries 12 4 158 3 732
Deferred taxation 20 485 423 31 12
Financial assets 13 272 212 32 29
Total non-current assets 9 098 7 552 4 352 3 871
Current assets
Inventories 14 1 369 955
Trade and other receivables 15 1 355 1 022 78 163
Cash and cash equivalents 964 679 156 341
Total current assets 3 688 2 656 234 504
Total assets 12 786 10 208 4 586 4 375
EQUITY AND LIABILITIESCapital and reserves
Share capital 16 2 680 2 680 2 680 2 680
Non-distributable reserves 230 703 113 131
Retained income/(loss) 2 011 1 433 151 (21)
Ordinary shareholders’ equity 4 921 4 816 2 944 2 790
Minority interest 1 191 487
Total shareholders’ interest 6 112 5 303 2 944 2 790
Non-current liabilities
Interest-bearing borrowings 17 2 801 882 1 032 474
Other long-term payables 18 388 178
Non-current provisions 19 501 389 30 25
Deferred taxation 20 1 384 1 204 11 1
Total non-current liabilities 5 074 2 653 1 073 500
Current liabilities
Trade and other payables 21 941 1 050 120 235
Interest-bearing borrowings 17 537 940 446 853
Taxation 94 223 3 (3)
Current provisions 19 28 39
Total current liabilities 1 600 2 252 569 1 085
Total equity and liabilities 12 786 10 208 4 586 4 375
Net debt 2 374 1 143 1 322 986

94 KUMBA FINANCIAL REPORTING 2003
Cash flow statementsFOR THE YEAR ENDED 30 JUNE 2003
CASH FLOWS FROM OPERATING ACTIVITIESCash retained from operations 22.1 1 567 2 522 (68) 67Income from equity accounted investments 22.2 49 47Income from investments 529 196Net financing costs 22.3 (240) (236) (182) (212)Dividends paid 22.4 (286) (252)Normal taxation paid 22.5 (310) (149) (32)
780 2 184 (5) 51
CASH FLOWS FROM INVESTING ACTIVITIESInvestment to maintain operations 22.6 (264) (303) (14) (6)Investment to expand operations 22.7 (1 122) (782)Proceeds from disposal of property,plant and equipment 44 25 6Investment in other non-current assets 22.8 (36) (50) (108) 409Increase in cash resources on acquisition of a controlling interest in subsidiaries 23 366Acquisition of joint ventures and associates (34)Foreign currency translations 22.9 28 (9) (37) 98
(1 018) (1 119) (153) 501
NET CASH (OUTFLOW)/INFLOW (238) 1 065 (158) 552
CASH FLOWS FROM FINANCING ACTIVITIESNon-current interest-bearing borrowings raised 2 094 406 379 (99)Non-current interest-bearing borrowings repaid (1 241) (359)Current interest-bearing borrowings repaid (425) (706) (406) (278)Proceeds from issuance of share capital 349 349Increase in loans from minority shareholders 95
523 (310) (27) (28)
NET INCREASE IN CASH AND CASH EQUIVALENTS 285 755 (185) 524CASH AND CASH EQUIVALENTS AT BEGINNING OF YEAR 679 (76) 341 (183)
CASH AND CASH EQUIVALENTS AT END OF YEAR 964 679 156 341
CALCULATION OF MOVEMENT IN NET DEBTNet cash (outflow)/inflow (238) 1 065Add:– shares issued 393– unbundling costs (44)– cash flows included above relating to non-interest-bearing debt 2– loans from minority shareholders 95– increase in net debt on acquisition of a controlling interest
in subsidiaries 23 (891)– non-cash flow movement in net debt applicable
to special purpose entities (18)– non-cash flow movements in net debt applicable
to currency translation differences of transactions denominated in foreign currency (11)
– non-cash flow movements in net debt applicable to currency translation differences of net debt items of foreign entities 22.9 (170) (16)
(INCREASE)/DECREASE IN NET DEBT (1 231) 1 398
GROUP COMPANY
2003 2002 2003 2002Notes Rm Rm Rm Rm

95
NON-DISTRIBUTABLE RESERVES
Attributablereservesof equity Foreign Financial
Share Share accounted currency instruments Insurance Retainedcapital premium investments translation revaluation reserve income Total
Rm Rm Rm Rm Rm Rm Rm Rm
OPENING BALANCEAS AT 1 JULY 2001Unbundling 271 363 15 751 1 400Net (losses)/gains not recognised in income statement2 (220) 204 52 (276) (240)
Currency translation differences (115) 204 (276) (187)Financial instruments fair valuemovements recognised in equity1 (105) 52 (53)
Net profit2 976 976Issue of share capital 3 2 721 2 724Unbundling costs (44) (44)Transfer of equity accountedearnings 16 (16)Transfer to insurance reserve 2 (2)
BALANCE AT 30 JUNE 2002 3 2 677 67 567 67 2 1 433 4 816Net (losses)/gains not recognised in income statement2 (18) (414) (6) 77 (361)
Currency translation differences (19) (414) 1 (432)Financial instruments fair valuemovements recognised in equity1
– recognised in current year income (42) (42)– recognised in equity 57 57– fair value adjustment 77 (21) 56Realised in associate andjoint venture (76) 76
Net profit2 718 718Dividend paid3 (252) (252)Transfer of equity accountedearnings (38) 38Transfer to insurance reserve 3 (3)
BALANCE AT 30 JUNE 2003 3 2 677 11 153 61 5 2 011 4 921Dividends declared afterbalance sheet date (including STC)4 (200) (200)
EFFECT OF DIVIDENDS DECLARED AFTER BALANCE SHEET DATE ON EQUITY 3 2 677 11 153 61 5 1 811 4 721
1. Attributable reserves of equity accounted investments includes share of associates’ debt hedging reserve R nil million (2002: R105 million).
2. Total recognised gains and losses R357 million (2002: R736 million).
3. The group paid a dividend of R252 million during September 2002, the STC applicable was R32 million.
4. Dividend declared after balance sheet date amounts to 60 cents per share. STC at 12,5% is payable on all distributions to shareholders.
Group statement of changes in equityFOR THE YEAR ENDED 30 JUNE 2003

96 KUMBA FINANCIAL REPORTING 2003
Company statement of changes in equityFOR THE YEAR ENDED 30 JUNE 2003
OPENING BALANCEAS AT 1 JULY 2001Unbundling 9 6 15
Net gains not
recognised in income
statement1 122 122
Currency translation differences 122 122
Net loss1 (27) (27)
Issue of share capital 3 2 721 2 724
Unbundling costs (44) (44)
BALANCE AT 30 JUNE 2002 3 2 677 131 (21) 2 790
Net (losses)/gains not recognised in
income statement1 (11) (7) 7 (11)
Currency translation differences (11) (11)
Financial instruments fair value
movements recognised in equity (7) (7)
Realised in joint venture 7 7
Net profit1 417 417
Dividend paid2 (252) (252)
BALANCE AT 30 JUNE 2003 3 2 677 120 (7) 151 2 944
Investment income – dividend declared by
subsidiaries after balance sheet date 200 200
Dividends declared after
balance sheet date (including STC)3 (200) (200)
EFFECT OF DIVIDENDS DECLARED AFTERBALANCE SHEET DATE ON EQUITY 3 2 677 120 (7) 151 2 944
1. Total recognised gains and losses R406 million (2002: R95 million).
2. The group paid a dividend of R252 million during September 2002, the STC applicable was R32 million.
3. Dividend per share amounts to 60 cents. STC at 12,5% is payable on all distributions to shareholders.
NON-DISTRIBUTABLERESERVES
Foreign FinancialShare Share currency instruments Retained
capital premium translation revaluation income TotalRm Rm Rm Rm Rm Rm
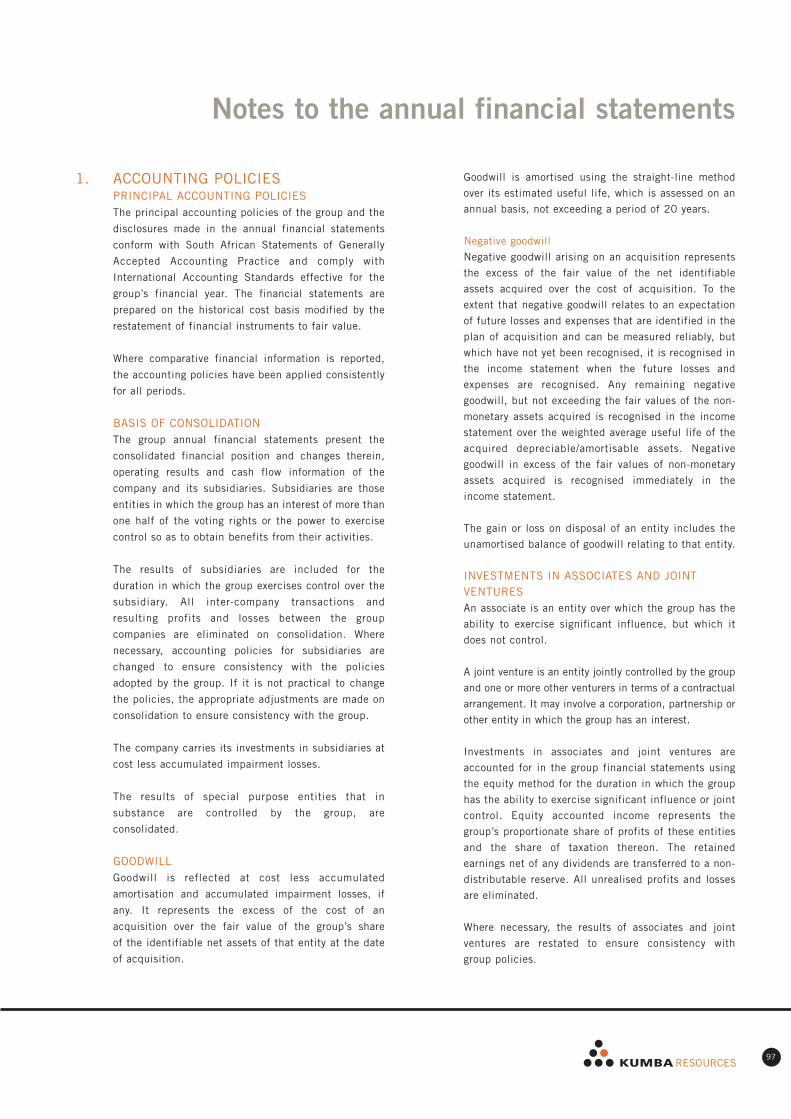
97
Notes to the annual financial statements
1. ACCOUNTING POLICIESPRINCIPAL ACCOUNTING POLICIESThe principal accounting policies of the group and the
disclosures made in the annual financial statements
conform with South African Statements of Generally
Accepted Accounting Practice and comply with
International Accounting Standards effective for the
group’s financial year. The financial statements are
prepared on the historical cost basis modified by the
restatement of financial instruments to fair value.
Where comparative financial information is reported,
the accounting policies have been applied consistently
for all periods.
BASIS OF CONSOLIDATIONThe group annual financial statements present the
consolidated financial position and changes therein,
operating results and cash flow information of the
company and its subsidiaries. Subsidiaries are those
entities in which the group has an interest of more than
one half of the voting rights or the power to exercise
control so as to obtain benefits from their activities.
The results of subsidiaries are included for the
duration in which the group exercises control over the
subsidiary. All inter-company transactions and
resulting profits and losses between the group
companies are eliminated on consolidation. Where
necessary, accounting policies for subsidiaries are
changed to ensure consistency with the policies
adopted by the group. If it is not practical to change
the policies, the appropriate adjustments are made on
consolidation to ensure consistency with the group.
The company carries its investments in subsidiaries at
cost less accumulated impairment losses.
The results of special purpose entities that in
substance are controlled by the group, are
consolidated.
GOODWILLGoodwill is reflected at cost less accumulated
amortisation and accumulated impairment losses, if
any. It represents the excess of the cost of an
acquisition over the fair value of the group’s share
of the identifiable net assets of that entity at the date
of acquisition.
Goodwill is amortised using the straight-line method
over its estimated useful life, which is assessed on an
annual basis, not exceeding a period of 20 years.
Negative goodwill
Negative goodwill arising on an acquisition represents
the excess of the fair value of the net identifiable
assets acquired over the cost of acquisition. To the
extent that negative goodwill relates to an expectation
of future losses and expenses that are identified in the
plan of acquisition and can be measured reliably, but
which have not yet been recognised, it is recognised in
the income statement when the future losses and
expenses are recognised. Any remaining negative
goodwill, but not exceeding the fair values of the non-
monetary assets acquired is recognised in the income
statement over the weighted average useful life of the
acquired depreciable/amortisable assets. Negative
goodwill in excess of the fair values of non-monetary
assets acquired is recognised immediately in the
income statement.
The gain or loss on disposal of an entity includes the
unamortised balance of goodwill relating to that entity.
INVESTMENTS IN ASSOCIATES AND JOINTVENTURESAn associate is an entity over which the group has the
ability to exercise significant influence, but which it
does not control.
A joint venture is an entity jointly controlled by the group
and one or more other venturers in terms of a contractual
arrangement. It may involve a corporation, partnership or
other entity in which the group has an interest.
Investments in associates and joint ventures are
accounted for in the group financial statements using
the equity method for the duration in which the group
has the ability to exercise significant influence or joint
control. Equity accounted income represents the
group’s proportionate share of profits of these entities
and the share of taxation thereon. The retained
earnings net of any dividends are transferred to a non-
distributable reserve. All unrealised profits and losses
are eliminated.
Where necessary, the results of associates and joint
ventures are restated to ensure consistency with
group policies.

98 KUMBA FINANCIAL REPORTING 2003
Notes to the annual financial statements (continued)
The group’s interest in associates and joint ventures is
carried in the balance sheet at an amount that reflects
its share of the net assets and the unamortised portion
of goodwill on acquisition. Goodwill on the acquisition
of associates and joint ventures is treated in
accordance with the group’s accounting policy for
goodwill. Carrying amounts of investments in
associates and joint ventures are reduced to their
recoverable amount where this is lower than their
carrying amount.
Where the group’s share of losses of an associate or
joint venture exceeds the carrying amount of the
associate or joint venture, the associate or joint venture
is carried at nil. Additional losses are only recognised
to the extent that the group has incurred obligations in
respect of the associate or joint venture.
PROPERTY, PLANT AND EQUIPMENTLand and extensions under construction are stated at
cost and are not depreciated. Buildings, including
certain non-mining residential buildings and all other
items of property, plant and equipment are reflected at
cost less accumulated depreciation and accumulated
impairment losses.
Depreciation is charged on a systematic basis over the
estimated useful lives of the assets after taking into
account the estimated residual value of the assets.
Useful life is either the period of time over which the
asset is expected to be used or the number of
production or similar units expected to be obtained
from the asset.
Moulds and refractory furnace relines are depreciated
based on the usage thereof.
The estimated maximum useful lives of items of
property, plant and equipment are:
Buildings and infrastructure
(including residential buildings) 25 years
Fixed plant and equipment 25 years
Mobile equipment, built-in process
computers, underground mining
equipment and reconditionable spares 15 years
Loose tools and computer equipment 5 years
Development costs 5 years
Refractory reline 8 years
Site preparation, mining development
and exploration 20 years
Mineral properties 25 years
Maintenance and repairs which neither materially add
to the value of assets nor appreciably prolong their
useful lives are charged against income.
Where an item of plant and equipment comprises major
components with different useful lives, the
components are accounted for as separate items of
property, plant and equipment.
Directly attributable expenses relating to mining and
other major capital projects, site preparations and
exploration are capitalised until the asset is brought to
a working condition for its intended use. These costs
include dismantling and site restoration costs to the
extent these are recognised as a provision.
Financing costs directly associated with the
construction or acquisition of qualifying assets are
capitalised at interest rates relating to loans
specifically raised for that purpose, or at the average
borrowing rate where the general pool of group
borrowings was utilised. Capitalisation of borrowing
costs ceases when the asset is substantially complete.
Directly attributable costs associated with the
acquisition, development and installation of certain
software are capitalised. Such assets are depreciated
using the amortisation methods and periods applicable
to computer equipment.
Surpluses and deficits on the disposal of property,
plant and equipment are taken to income.
LEASED ASSETSLeases involving plant and equipment whereby the
lessor provides finance to the group with the asset as
security and where the group assumes substantially all
the benefits and risks of ownership are classified as
finance leases. Assets acquired in terms of finance
leases are capitalised at the lower of fair value and the
present value of the minimum lease payments at
inception of the lease and depreciated over the useful
life of the asset. The capital element of future
obligations under the leases is included as a liability in
the balance sheet. Each lease payment is allocated
between the liability and finance charges so as to
achieve a constant rate on the finance balance
outstanding. The interest element of the finance
charge is charged against income over the lease period
using the effective interest rate method.

99
For a sale and leaseback transaction that results in a
finance lease, any excess of sales proceeds over the
carrying amount is deferred and recognised on a
straight-line basis over the period of the lease.
Leases of assets to the group under which all the risks
and benefits of ownership are effectively retained by the
lessor, are classified as operating leases. Payments made
under operating leases are charged against income on a
straight-line basis over the period of the lease.
INTANGIBLE ASSETSAn intangible asset is recognised at cost if it is
probable that future economic benefits will flow to
the enterprise. Amortisation is charged on a
systematic basis over the estimated useful lives of the
intangible assets.
The estimated maximum useful lives of intangible
assets are:
Patents, licence and franchise 20 years
Subsequent expenditure on capitalised intangible
assets is capitalised only if it increases the future
benefits embodied in the specific asset to which
it relates.
RESEARCH, DEVELOPMENT AND EXPLORATIONCOSTSResearch, development and exploration costs are
charged against income until they result in projects
that are evaluated as being technically or commercially
feasible, the group has sufficient resources to
complete development and can demonstrate how the
asset will generate future economic benefits, in which
event these costs are capitalised and amortised on the
straight-line basis over the estimated useful life of the
project/asset.
IMPAIRMENT OF ASSETSThe carrying amounts of assets mentioned in the
accounting policy notes are reviewed at each balance
sheet date to determine whether there is any indication
of impairment. If any such indication exists, the
recoverable amount is estimated as the higher of net
selling price and value in use.
In assessing value in use, the expected future cash
flows are discounted to their present value using a pre-
tax discount rate that reflects current market
assessments of the time value of money and the
risks specific to the asset. An impairment loss is
recognised whenever the carrying amount exceeds the
recoverable amount.
For an asset that does not generate cash inflows largely
independent of those from other assets, the
recoverable amount is determined for the cash-
generating unit to which the asset belongs. An
impairment loss is recognised whenever the carrying
amount of the cash-generating unit exceeds its
recoverable amount.
A previously recognised impairment loss is reversed if
there has been a change in the estimates used to
determine the recoverable amount, however not to an
amount higher than the carrying amount that would
have been determined (net of depreciation) had no
impairment loss been recognised in prior years. For
goodwill a recognised impairment loss is not reversed,
unless the impairment loss was caused by a specific
external event of an exceptional nature that is not
expected to recur and the increase relates clearly to
the reversal of the effect of that specific event.
FINANCIAL INSTRUMENTSMeasurement
Financial instruments are initially measured at cost,
which includes transaction costs. Subsequent to
initial recognition these instruments are measured as
set out below.
Investments
Marketable securities are carried at market value,
which is calculated by reference to Securities Exchange
quoted selling prices at the close of business on the
balance sheet date. Other investments are shown at fair
value. Gains and losses are recognised in income.
Trade and other receivables
Trade and other receivables originated by the group are
stated at cost less provision for doubtful debts.
Cash and cash equivalents
Cash and cash equivalents are measured at fair value.
Financial liabilities
Financial liabilities are recognised at amortised cost,
namely original debt less principal payments and
amortisations, except for derivatives which are
measured at fair value.

100 KUMBA FINANCIAL REPORTING 2003
Notes to the annual financial statements (continued)
Derivative instruments
Derivative instruments are measured at fair value.
Gains and losses on subsequent measurement
Gains and losses on subsequent measurement are
recognised as follows:
– gains and losses arising from a change in the fair
value of financial instruments that are not part of a
hedging relationship are included in net profit or loss
for the period in which it arises.
– gains and losses from measuring fair value hedging
instruments, including fair value hedges for foreign
currency denominated transactions, are recognised
immediately in net profit or loss.
– effective portion of gains and losses from
remeasuring cash flow hedging instruments,
including cash flow hedges for forecast foreign
currency denominated transactions and for interest
rate swaps, are initially recognised directly in equity.
Should the hedged firm commitment or forecast
transaction result in the recognition of an asset or a
liability, then the cumulative amount recognised in
equity is adjusted against the initial measurement of
the asset or liability. For other cash flow hedges, the
cumulative amount recognised in equity is included
in net profit or loss in the period when the
commitment or forecast transaction affects profit
or loss.
– when a hedging instrument or hedge relationship is
terminated but the hedged transaction still is
expected to occur, the cumulative unrealised gains or
losses at that point remains in equity and are
recognised in accordance with the above policy when
the transaction occurs. If the hedged transaction is
no longer probable, the cumulative unrealised gain or
loss recognised in equity is recognised in the income
statement immediately.
Offset
Where a legally enforceable right of offset exists for
recognised financial assets and financial liabilities,
and there is an intention to settle the liability and
realise the asset simultaneously, or to settle on a net
basis, all related financial effects are offset.
INVENTORIESInventories are valued at the lower of cost, determined
on a moving average basis, or net realisable value. The
cost of finished goods and work-in-progress comprises
raw materials, direct labour, other direct costs and
fixed production overheads, but excludes interest
charges. Fixed production overheads are allocated on
the basis of normal capacity.
Writedowns
Writedowns to net realisable value and inventory losses
are expensed in the period in which the writedowns or
losses occur.
FOREIGN CURRENCIESTransactions and balances
Transactions denominated in foreign currencies are
translated at the rate of exchange ruling at the
transaction date. Monetary items denominated in foreign
currencies are translated at the rate of exchange ruling
at the balance sheet date. Gains or losses arising on
translation are credited to or charged against income.
Foreign entities
The financial statements of foreign entities are
translated into South African rand as follows:
– assets and liabilities at rates of exchange ruling at
balance sheet date;
– income, expenditure and cash flow items at weighted
average rates; and
– goodwill and fair value adjustments arising on
acquisition at rates of exchange ruling at balance
sheet date.
All resulting exchange differences are reflected as part
of shareholders’ equity. On disposal, such translation
differences are recognised in the income statement as
part of the cumulative gain or loss on disposal.
Foreign currency hedges
Foreign currency hedges are dealt with in the financial
instruments accounting policy.
REVENUE RECOGNITIONRevenue, which excludes value added tax and sales
between group companies, represents the gross value
of goods invoiced. Export revenues are recorded
according to the relevant sales terms, when the risks
and rewards of ownership are transferred.
Revenue from the sale of goods is recognised when
significant risks and rewards of ownership of the goods
are transferred to the buyer.
Revenue arising from services and royalties is
recognised on an accrual basis in accordance with the
substance of the relevant agreements.
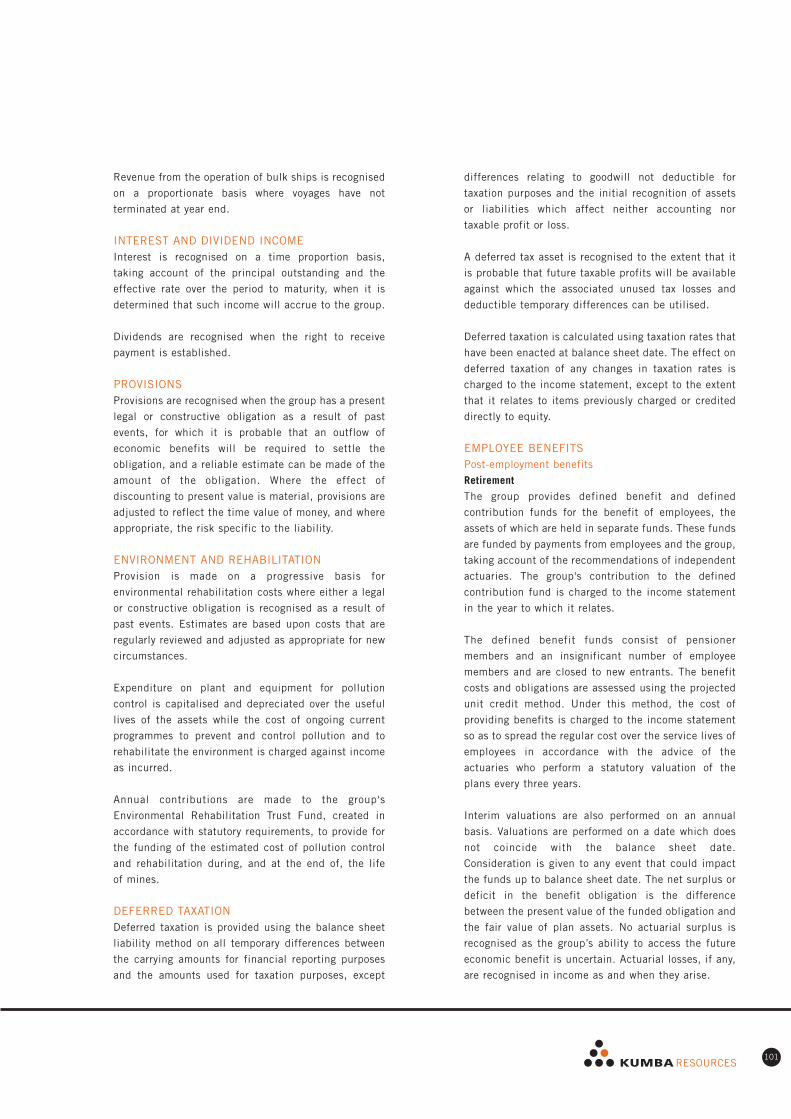
101
Revenue from the operation of bulk ships is recognised
on a proportionate basis where voyages have not
terminated at year end.
INTEREST AND DIVIDEND INCOMEInterest is recognised on a time proportion basis,
taking account of the principal outstanding and the
effective rate over the period to maturity, when it is
determined that such income will accrue to the group.
Dividends are recognised when the right to receive
payment is established.
PROVISIONSProvisions are recognised when the group has a present
legal or constructive obligation as a result of past
events, for which it is probable that an outflow of
economic benefits will be required to settle the
obligation, and a reliable estimate can be made of the
amount of the obligation. Where the effect of
discounting to present value is material, provisions are
adjusted to reflect the time value of money, and where
appropriate, the risk specific to the liability.
ENVIRONMENT AND REHABILITATIONProvision is made on a progressive basis for
environmental rehabilitation costs where either a legal
or constructive obligation is recognised as a result of
past events. Estimates are based upon costs that are
regularly reviewed and adjusted as appropriate for new
circumstances.
Expenditure on plant and equipment for pollution
control is capitalised and depreciated over the useful
lives of the assets while the cost of ongoing current
programmes to prevent and control pollution and to
rehabilitate the environment is charged against income
as incurred.
Annual contributions are made to the group's
Environmental Rehabilitation Trust Fund, created in
accordance with statutory requirements, to provide for
the funding of the estimated cost of pollution control
and rehabilitation during, and at the end of, the life
of mines.
DEFERRED TAXATIONDeferred taxation is provided using the balance sheet
liability method on all temporary differences between
the carrying amounts for financial reporting purposes
and the amounts used for taxation purposes, except
differences relating to goodwill not deductible for
taxation purposes and the initial recognition of assets
or liabilities which affect neither accounting nor
taxable profit or loss.
A deferred tax asset is recognised to the extent that it
is probable that future taxable profits will be available
against which the associated unused tax losses and
deductible temporary differences can be utilised.
Deferred taxation is calculated using taxation rates that
have been enacted at balance sheet date. The effect on
deferred taxation of any changes in taxation rates is
charged to the income statement, except to the extent
that it relates to items previously charged or credited
directly to equity.
EMPLOYEE BENEFITSPost-employment benefits
Retirement
The group provides defined benefit and defined
contribution funds for the benefit of employees, the
assets of which are held in separate funds. These funds
are funded by payments from employees and the group,
taking account of the recommendations of independent
actuaries. The group's contribution to the defined
contribution fund is charged to the income statement
in the year to which it relates.
The defined benefit funds consist of pensioner
members and an insignificant number of employee
members and are closed to new entrants. The benefit
costs and obligations are assessed using the projected
unit credit method. Under this method, the cost of
providing benefits is charged to the income statement
so as to spread the regular cost over the service lives of
employees in accordance with the advice of the
actuaries who perform a statutory valuation of the
plans every three years.
Interim valuations are also performed on an annual
basis. Valuations are performed on a date which does
not coincide with the balance sheet date.
Consideration is given to any event that could impact
the funds up to balance sheet date. The net surplus or
deficit in the benefit obligation is the difference
between the present value of the funded obligation and
the fair value of plan assets. No actuarial surplus is
recognised as the group’s ability to access the future
economic benefit is uncertain. Actuarial losses, if any,
are recognised in income as and when they arise.

102 KUMBA FINANCIAL REPORTING 2003
Notes to the annual financial statements (continued)
DIVIDENDDividends paid are recognised by the company when
the shareholders’ right to receive payment is
established. These dividends are recorded and
disclosed as dividends paid in the statement of
changes in equity. Dividends proposed or declared
subsequent to the year end are not recognised at the
balance sheet date, but are disclosed in the statement
of changes in equity to show the effect the dividend
would have had on equity.
Taxation costs incurred on dividends are included in
the taxation line in the income statement in the year in
which they are declared.
DISCONTINUING OPERATIONSDiscontinuing operations are significant,
distinguishable components of an enterprise that has
been sold, abandoned or is the subject of formal
plans for disposal or discontinuance.
The profit or loss on the sale or abandonment of a
discontinuing operation is determined from the
formalised discontinuance date.
SEGMENT REPORTINGThe primary business segments are iron ore, coal, base
metals, heavy minerals and industrial minerals.
On a secondary segment basis, significant geographic
marketing regions have been identified.
The basis of segment reporting is representative of the
internal structure used for management reporting.
CASH AND CASH EQUIVALENTSFor the purpose of the cash flow statement, cash and
cash equivalents comprise cash on hand, deposits held
on call, and investments in money market instruments,
net of bank overdrafts, all of which are available for use
by the group unless otherwise stated.
COMPARATIVESWhere necessary, comparative figures have been
adjusted to conform with changes in presentation in
the current year.
Medical
No contributions are made to the medical aid of retired
employees.
Short and long-term benefits
The cost of all short-term employee benefits, such as
salaries, bonuses, housing allowances, medical and
other contributions, is recognised during the period in
which the employee renders the related service.
The vesting portion of long-term benefits is recognised
and provided for at balance sheet date, based on
current salary rates.
Termination benefits
Termination benefits are payable whenever an
employee’s employment is terminated before the normal
retirement date or whenever an employee accepts
voluntary redundancy in exchange for these benefits.
The group recognises termination benefits when it has
demonstrated its commitment to either terminate the
employment of current employees according to a
detailed formal plan without possibility of withdrawal
or to provide termination benefits as a result of an offer
made to encourage voluntary redundancy. If the
benefits fall due more than 12 months after balance
sheet date, they are discounted to present value.
Equity compensation benefits
Senior management, including executive directors,
have been granted share options. Grants are based on
existing ordinary shares and can be purchased or the
purchase can be deferred. The option or purchase price
equals market price on the date preceding the date of
the grant.
When the options are exercised they can either be:
– purchased and if vesting according to the rules of the
scheme, recorded in share capital and share
premium at the amount of the option price; or
– payment can be deferred resulting in no increase in
share capital or share premium until paid for and
vesting according to the rules of the scheme.
EXCEPTIONAL ITEMSExceptional items are material items which derive from
events or transactions that fall within the ordinary
activities of the group and which individually or, if of a
similar type, in aggregate, need to be disclosed by
virtue of their size or incidence.

103
GROUP COMPANY
2003 2002 2003 2002Rm Rm Rm Rm
2. OPERATING EXPENSESCOST BY TYPE– raw materials and consumables 1 224 1 045 57 38
– staff costs
– salaries and wages 1 340 1 380 187 242
– termination benefits 1 1 1 1
– pension and medical costs 128 83 14
– general charges 1 155 819 160 199
– railage and transport 1 237 1 247 1 1
– repairs and maintenance 768 703 20 8
– energy 237 174 4 3
– depreciation on property, plant and equipment 529 454 5 7
– amortisation of intangible assets 3
– movement in inventories (194) (282)
– own work capitalised (154) (110)
– cost recoveries (537) (478)
– sublease received (17) (15) (3) (3)
6 257 5 499 (91) 18
COST BY FUNCTION– Costs of goods sold 5 016 4 286 (88) 21
– Selling and distribution costs 1 258 1 228
– Sublease rent received (17) (15) (3) (3)
6 257 5 499 (91) 18
The above costs are stated after including:
Depreciation and amortisation
– residential buildings 6 6
– buildings and infrastructure 60 51 1 1
– machinery, plant and equipment 376 296 4 6
– site preparation, mining development exploration
and rehabilitation 51 51
– mineral properties 30 27
– leased assets under finance leases 5 22
– rehabilitation 1 1
– amortisation of intangible assets 3
Reconditionable spares usage 8 8
Research and development costs 4 1
Consultancy fees 89 64 30 32
Operating lease rentals expenses
– property 35 26 9 13
– equipment 41 47 19 11
Operating sublease rentals received
– property (17) (14) (3)
Contingent rentals received (2) (2) (2)

104 KUMBA FINANCIAL REPORTING 2003
Notes to the annual financial statements (continued)
2. OPERATING EXPENSES (continued)Net (profit)/deficit on disposal or scrapping of
property, plant and equipment (3) (4) 5 7
Auditors’ remuneration
– audit fees 7 4 3 1
– other services 1
Net realised losses/(gains) on currency exchange differences 193 (164) 35 (60)
Net unrealised losses/(gains) on currency exchange differences 92 (5) 13 1
Net realised (gains)/losses on the revaluation of
derivative instruments (144) 51 1 (6)
Net unrealised gains on the revaluation of
derivative instruments (19) (4) (11) (2)
Directors’ emoluments (refer to the report of the directors)
– executive directors
– remuneration received as directors of the company 9 10 9 10
– non-executive directors
– remuneration received as directors of the company 1 1 1 1
Note:
Pensions
Pensions paid or receivable by executive directors are paid or
received under contributory pension schemes.
Operating lease arrangements – contingent rent received
The basis to determine contingent rent received is 25% of all
extraordinary maintenance of the building.
GROUP COMPANY
2003 2002 2003 2002Rm Rm Rm Rm

105
GROUP COMPANY
2003 2002 2003 2002Rm Rm Rm Rm
3. NET FINANCING COSTSInterest expense and loan costs 309 309 243 260
Finance leases 8 3
Interest income (77) (76) (61) (48)
Net interest expense 240 236 182 212
Interest adjustment on non-current provisions 4 6 1
244 242 182 213
Financing costs of R32 million have been capitalised during
the year (2002: R nil million).
Financing costs capitalised relates to funds specifically
borrowed for the purposes of obtaining a qualifying asset.
4. INCOME FROM INVESTMENTSSUBSIDIARIESUnlisted shares
– dividends 354
– net interest received 175 196
529 196
5. IMPAIRMENT CHARGESImpairment of shipping assets (refer note 8) (80)
Impairment of other assets (1)
Impairment of investment in associates (2)
Impairment of investment in joint ventures (2)
Impairment of other investments (18)
(2) (101)
Taxation effect 7
Net effect on attributable earnings (2) (94)
The carrying amount of certain investments was greater than
the market value thereof. This is considered to be of a
permanent nature and was impaired.
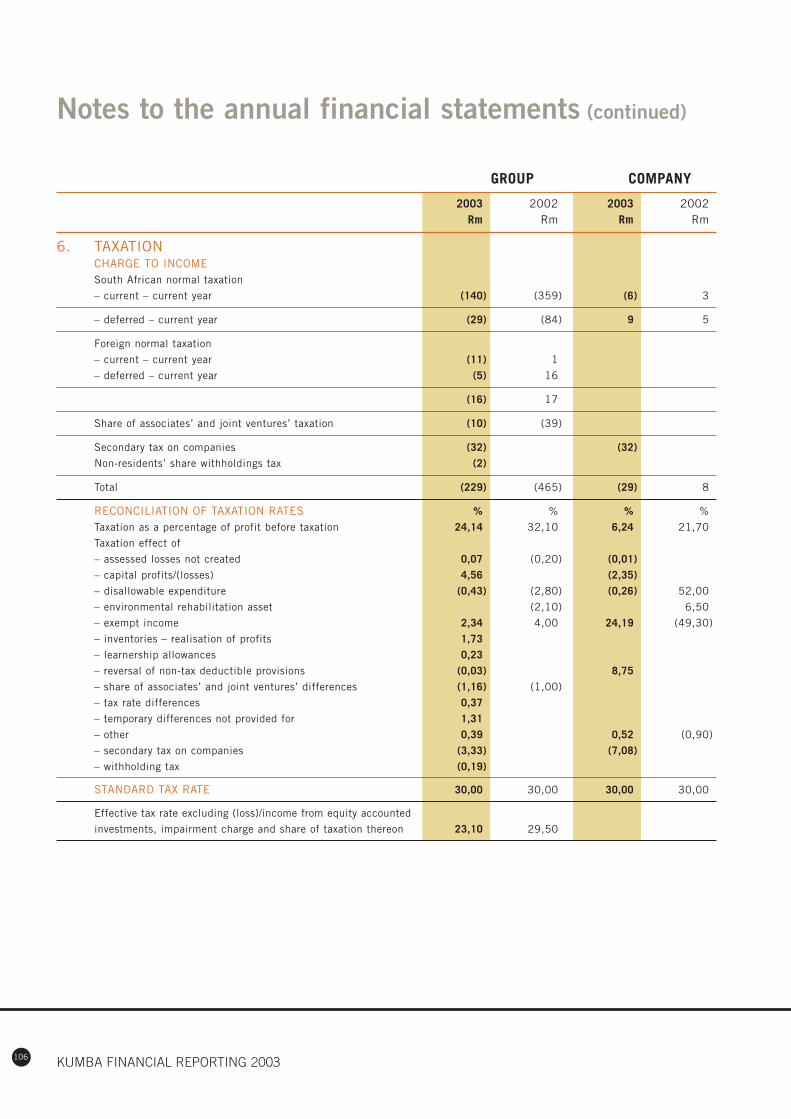
106 KUMBA FINANCIAL REPORTING 2003
Notes to the annual financial statements (continued)
6. TAXATIONCHARGE TO INCOMESouth African normal taxation
– current – current year (140) (359) (6) 3
– deferred – current year (29) (84) 9 5
Foreign normal taxation
– current – current year (11) 1
– deferred – current year (5) 16
(16) 17
Share of associates’ and joint ventures’ taxation (10) (39)
Secondary tax on companies (32) (32)
Non-residents’ share withholdings tax (2)
Total (229) (465) (29) 8
RECONCILIATION OF TAXATION RATES % % % %
Taxation as a percentage of profit before taxation 24,14 32,10 6,24 21,70
Taxation effect of
– assessed losses not created 0,07 (0,20) (0,01)
– capital profits/(losses) 4,56 (2,35)
– disallowable expenditure (0,43) (2,80) (0,26) 52,00
– environmental rehabilitation asset (2,10) 6,50
– exempt income 2,34 4,00 24,19 (49,30)
– inventories – realisation of profits 1,73
– learnership allowances 0,23
– reversal of non-tax deductible provisions (0,03) 8,75
– share of associates’ and joint ventures’ differences (1,16) (1,00)
– tax rate differences 0,37
– temporary differences not provided for 1,31
– other 0,39 0,52 (0,90)
– secondary tax on companies (3,33) (7,08)
– withholding tax (0,19)
STANDARD TAX RATE 30,00 30,00 30,00 30,00
Effective tax rate excluding (loss)/income from equity accounted
investments, impairment charge and share of taxation thereon 23,10 29,50
GROUP COMPANY
2003 2002 2003 2002Rm Rm Rm Rm

107
GROUP
2003 2002
7. EARNINGS PER SHAREBasic headline earnings per share is calculated by dividing the headline earnings by the
weighted average number of ordinary shares in issue during the year.
Headline earnings (R million) 784 1098
Weighted average number of ordinary shares in issue (million) 297 285
Headline earnings per share (cents) 264,0 385,3
For the diluted headline earnings per share the weighted average number of ordinary
shares is adjusted to assume conversion of not yet released purchased shares and options
under the management share scheme, net of shares held by the scheme for releasing
purposes. Diluted headline earnings per share is calculated by dividing headline earnings
by the adjusted weighted average number of shares in issue.
Weighted average number of ordinary shares in issue (million) 297 285
Adjusted for options and net purchased shares in terms of the
management share scheme (million) 2 7
Weighted average number for diluted headline earnings per share (million) 299 292
Diluted headline earnings per share (cents) 262,2 376,0
Basic attributable earnings per share is calculated by dividing the net profit attributable
to shareholders by the weighted average number of ordinary shares in issue during the year.
Net profit attributable to ordinary shareholders (R million) 718 976
Weighted average number of ordinary shares in issue (million) 297 285
Basic earnings per share (cents) 241,8 342,5
For the diluted attributable earnings per share the weighted average number of
ordinary shares is adjusted as above
Diluted earnings per share (cents) 240,1 334,2
For the current year, shares under option had an effect on the adjusted weighted average
number of shares in issue as the average option price attached to the option shares was
lower than the average market price.

108 KUMBA FINANCIAL REPORTING 2003
Notes to the annual financial statements (continued)
8. PROPERTY, PLANT AND EQUIPMENTGROUPGross carrying amount
At beginning of year 107 685 126 1 029 4 662 676 975 8 260
Additions 21 6 165 660 37 497 1 386
Non-cash flow additions 1 3 24 24 103 155
Acquisition of subsidiary 20 357 3 187 1 427 311 44 2 349
Disposals (9) (3) (10) (3) (65) (4) (94)
Exchange differences
on translation 1 7 5 (80) 9 (58)
Other movements 1 4 223 515 18 (761)
At end of year 141 1 056 120 1 609 7 143 1 071 858 11 998
Accumulated depreciation
At beginning of year 27 73 296 1 785 288 2 469
Depreciation charges 30 6 60 381 52 529
Acquisition of subsidiary 66 65 556 98 785
Accumulated depreciation
on disposals (8) (1) (41) (3) (53)
Exchange differences
on translation 2 2 (35) 3 (28)
At end of year 125 71 422 2 646 438 3 702
Impairment of assets
At beginning of year 80 1 81
Impairment charges 10 10
90 1 91
NET CARRYING AMOUNT AT END OF YEAR 141 931 49 1 187 4 407 632 858 8 205
Sitepreparation,
miningdevelopment,
Residential Buildings Machinery, explor- ExtensionsLand and Mineral land and and infra- plant and ation and under Totalbuildings properties buildings structure equipment rehabilitation construction 2003
Rm Rm Rm Rm Rm Rm Rm Rm
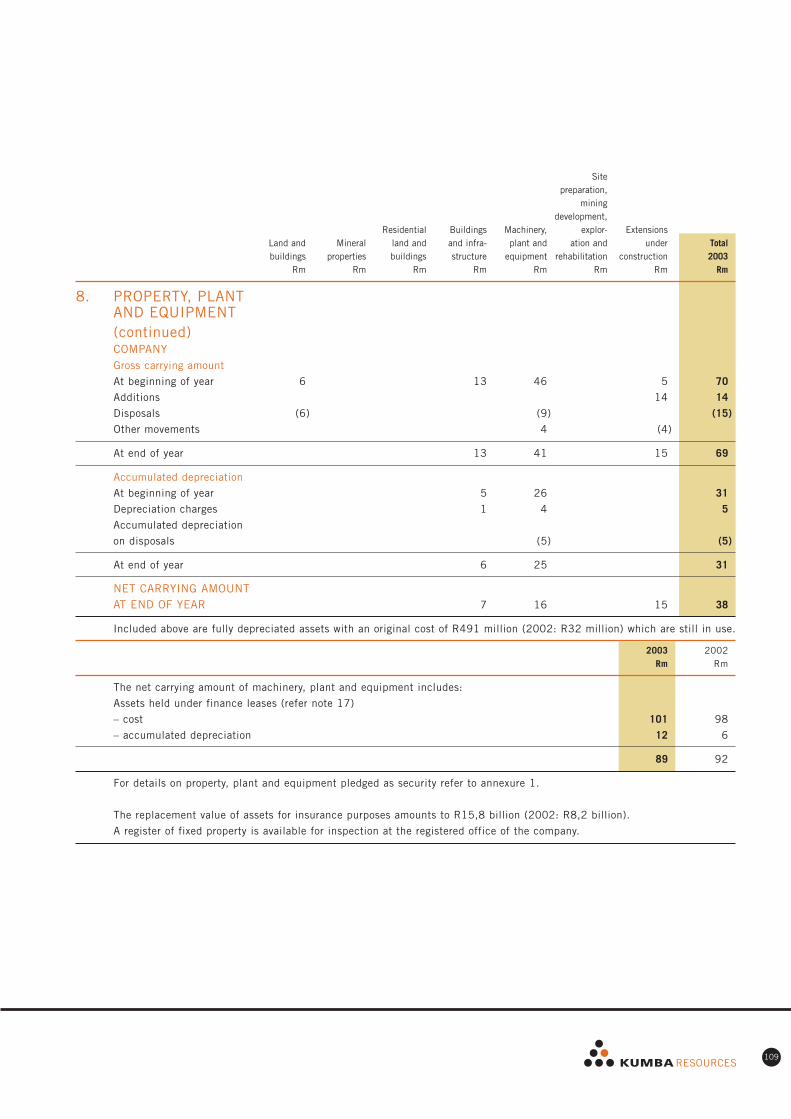
109
Sitepreparation,
miningdevelopment,
Residential Buildings Machinery, explor- ExtensionsLand and Mineral land and and infra- plant and ation and under Totalbuildings properties buildings structure equipment rehabilitation construction 2003
Rm Rm Rm Rm Rm Rm Rm Rm
8. PROPERTY, PLANT AND EQUIPMENT(continued)COMPANYGross carrying amount
At beginning of year 6 13 46 5 70
Additions 14 14
Disposals (6) (9) (15)
Other movements 4 (4)
At end of year 13 41 15 69
Accumulated depreciation
At beginning of year 5 26 31
Depreciation charges 1 4 5
Accumulated depreciation
on disposals (5) (5)
At end of year 6 25 31
NET CARRYING AMOUNT AT END OF YEAR 7 16 15 38
Included above are fully depreciated assets with an original cost of R491 million (2002: R32 million) which are still in use.
2003 2002Rm Rm
The net carrying amount of machinery, plant and equipment includes:
Assets held under finance leases (refer note 17)
– cost 101 98
– accumulated depreciation 12 6
89 92
For details on property, plant and equipment pledged as security refer to annexure 1.
The replacement value of assets for insurance purposes amounts to R15,8 billion (2002: R8,2 billion).
A register of fixed property is available for inspection at the registered office of the company.
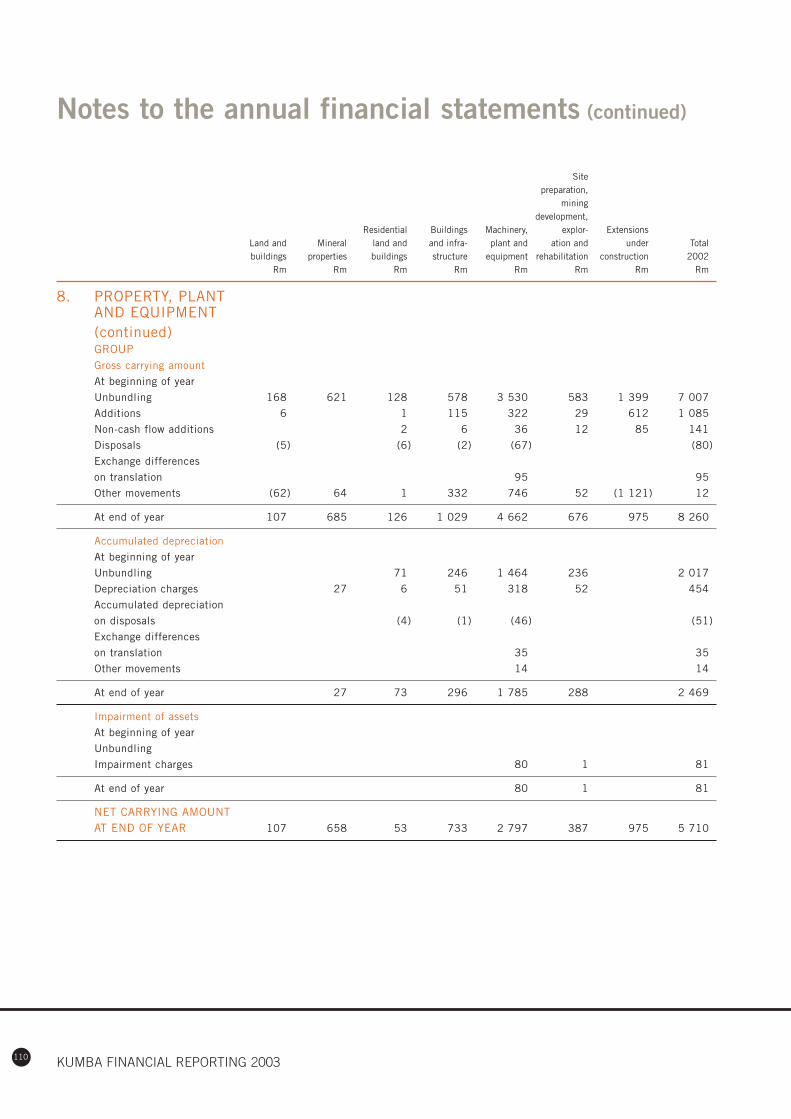
110 KUMBA FINANCIAL REPORTING 2003
Notes to the annual financial statements (continued)
8. PROPERTY, PLANT AND EQUIPMENT(continued)GROUPGross carrying amount
At beginning of year
Unbundling 168 621 128 578 3 530 583 1 399 7 007
Additions 6 1 115 322 29 612 1 085
Non-cash flow additions 2 6 36 12 85 141
Disposals (5) (6) (2) (67) (80)
Exchange differences
on translation 95 95
Other movements (62) 64 1 332 746 52 (1 121) 12
At end of year 107 685 126 1 029 4 662 676 975 8 260
Accumulated depreciation
At beginning of year
Unbundling 71 246 1 464 236 2 017
Depreciation charges 27 6 51 318 52 454
Accumulated depreciation
on disposals (4) (1) (46) (51)
Exchange differences
on translation 35 35
Other movements 14 14
At end of year 27 73 296 1 785 288 2 469
Impairment of assets
At beginning of year
Unbundling
Impairment charges 80 1 81
At end of year 80 1 81
NET CARRYING AMOUNT AT END OF YEAR 107 658 53 733 2 797 387 975 5 710
Sitepreparation,
miningdevelopment,
Residential Buildings Machinery, explor- ExtensionsLand and Mineral land and and infra- plant and ation and under Totalbuildings properties buildings structure equipment rehabilitation construction 2002
Rm Rm Rm Rm Rm Rm Rm Rm

111
Sitepreparation,
miningdevelopment,
Residential Buildings Machinery, explor- ExtensionsLand and Mineral land and and infra- plant and ation and under Totalbuildings properties buildings structure equipment rehabilitation construction 2002
Rm Rm Rm Rm Rm Rm Rm Rm
8. PROPERTY, PLANT AND EQUIPMENT(continued)COMPANYGross carrying amount
At beginning of year
Unbundling 8 14 50 3 75
Additions 4 2 6
Disposals (2) (8) (10)
Other movements (1) (1)
At end of year 6 13 46 5 70
Accumulated depreciation
At beginning of year
Unbundling 4 23 27
Depreciation charges 1 6 7
Accumulated depreciation
on disposals (3) (3)
At end of year 5 26 31
NET CARRYING AMOUNT AT END OF YEAR 6 8 20 5 39
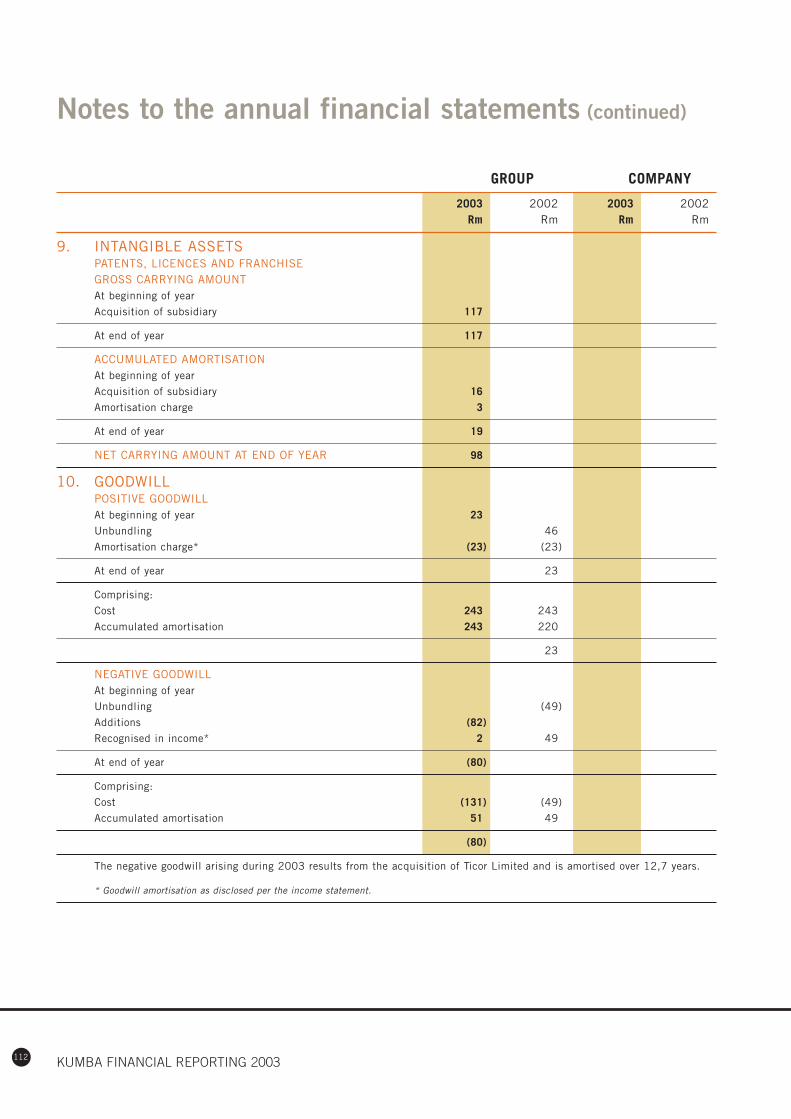
112 KUMBA FINANCIAL REPORTING 2003
Notes to the annual financial statements (continued)
9. INTANGIBLE ASSETSPATENTS, LICENCES AND FRANCHISEGROSS CARRYING AMOUNTAt beginning of year
Acquisition of subsidiary 117
At end of year 117
ACCUMULATED AMORTISATIONAt beginning of year
Acquisition of subsidiary 16
Amortisation charge 3
At end of year 19
NET CARRYING AMOUNT AT END OF YEAR 98
10. GOODWILLPOSITIVE GOODWILLAt beginning of year 23
Unbundling 46
Amortisation charge* (23) (23)
At end of year 23
Comprising:
Cost 243 243
Accumulated amortisation 243 220
23
NEGATIVE GOODWILLAt beginning of year
Unbundling (49)
Additions (82)
Recognised in income* 2 49
At end of year (80)
Comprising:
Cost (131) (49)
Accumulated amortisation 51 49
(80)
The negative goodwill arising during 2003 results from the acquisition of Ticor Limited and is amortised over 12,7 years.
* Goodwill amortisation as disclosed per the income statement.
GROUP COMPANY
2003 2002 2003 2002Rm Rm Rm Rm

113
GROUP COMPANY
2003 2002 2003 2002Rm Rm Rm Rm
11. INVESTMENTS IN ASSOCIATES AND JOINT VENTURESASSOCIATED COMPANIES– listed 100 1 152 86 51
– unlisted 1 3 1
101 1 155 86 52
JOINT VENTURES (UNLISTED)– incorporated 10 19
– unincorporated 7 10 7 7
17 29 7 7
Total 118 1 184 93 59
Refer to annexure 2 for market and directors’ valuations of investments.
ASSOCIATED COMPANIES JOINT VENTURES
Investments Loans Total Investments Loans Total
2003 2003 2003 2003 2003 2003
Rm Rm Rm Rm Rm Rm
GROUPAt beginning of year 1 142 13 1 155 29 29
Additional interests acquired 44 44
Acquisition of controlling interest
in associate, now consolidated (966) (966)
Movement in indebtedness to/from
associated companies/repayments 28 28
Disposals (1) (1)
Net share of results
– share of results before taxation
as per income statement* 32 32 15 15
– share of exceptional items* (7) (7)
– share of goodwill* (38) (38)
– share of taxation (refer note 6) (7) (7) (3) (3)
Dividends paid (33) (33) (16) (16)
Exchange difference adjustments (179) (2) (181) (8) (8)
Share of reserve movements in the year 77 77
Impairment loss (2) (2)
AT END OF YEAR (ANNEXURE 2) 62 39 101 17 17
COMPANYAt beginning of year 51 1 52 7 7
Movement in indebtedness to/from
associated companies/repayments 34 34
AT END OF YEAR (ANNEXURE 2) 51 35 86 7 7

114 KUMBA FINANCIAL REPORTING 2003
Notes to the annual financial statements (continued)
11. INVESTMENTS IN ASSOCIATES AND JOINT VENTURES(continued)GROUPAt beginning of year
Unbundling 857 12 869 6 6
Additional interests acquired 94 94 7 7
Movement in indebtedness to/from
associated companies/repayments (2) (2)
Net share of results
– share of results before taxation
as per income statement* 116 116 19 19
– share of exceptional items* (12) (12)
– share of goodwill* (40) (40)
– share of taxation (refer note 6) (35) (35) (4) (4)
Dividends paid (47) (47)
Exchange difference adjustments 316 3 319 1 1
Share of reserve movements in the year (105) (105)
Impairment loss (2) (2)
AT END OF YEAR (ANNEXURE 2) 1 142 13 1 155 29 29
COMPANYAt beginning of year
Unbundling 51 51
Additional interests acquired 7 7
Movement in indebtedness to/from
associated companies/repayments 1 1
AT END OF YEAR (ANNEXURE 2) 51 1 52 7 7
* Income from equity accounted investments as disclosed in the income statement, amounts to R2 million (2002: R83 million).
2003 2002
Rm Rm
Aggregate post-acquisition reserves:
– associated companies 3 24
– joint ventures 8 43
TOTAL 11 67
ASSOCIATED COMPANIES JOINT VENTURES
Investments Loans Total Investments Loans Total
2002 2002 2002 2002 2002 2002
Rm Rm Rm Rm Rm Rm
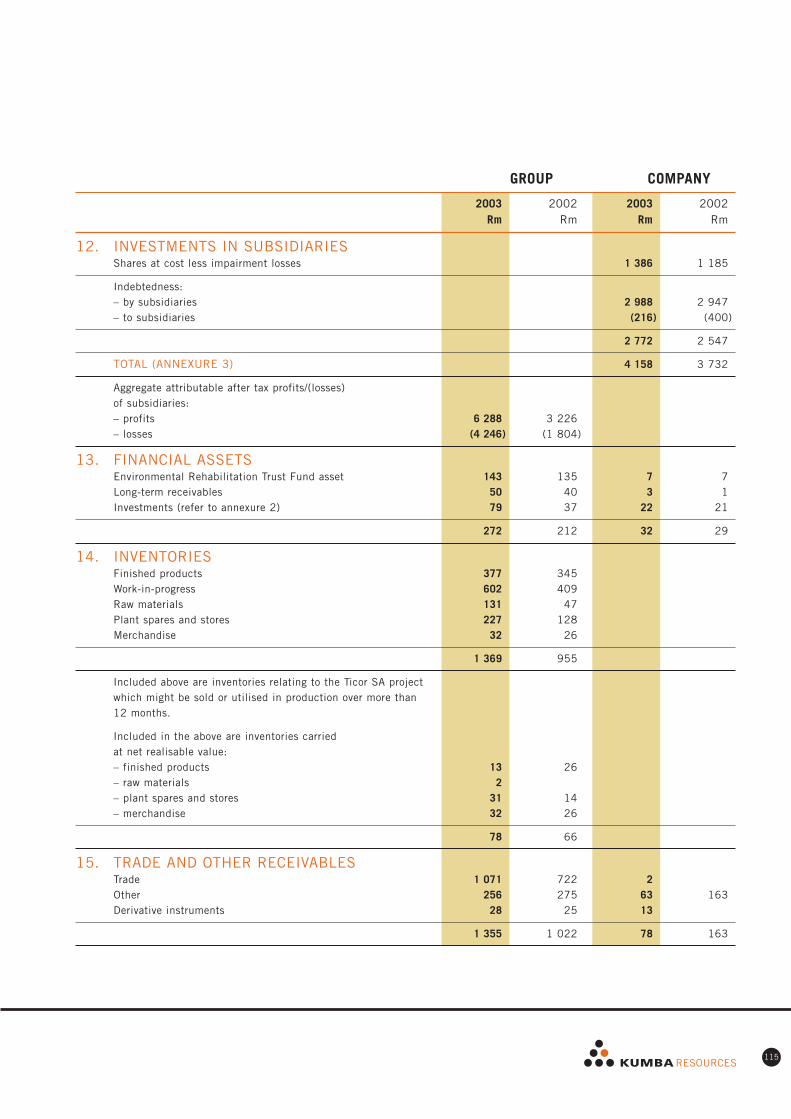
115
GROUP COMPANY
2003 2002 2003 2002Rm Rm Rm Rm
12. INVESTMENTS IN SUBSIDIARIESShares at cost less impairment losses 1 386 1 185
Indebtedness:– by subsidiaries 2 988 2 947– to subsidiaries (216) (400)
2 772 2 547
TOTAL (ANNEXURE 3) 4 158 3 732
Aggregate attributable after tax profits/(losses)of subsidiaries:– profits 6 288 3 226– losses (4 246) (1 804)
13. FINANCIAL ASSETSEnvironmental Rehabilitation Trust Fund asset 143 135 7 7Long-term receivables 50 40 3 1Investments (refer to annexure 2) 79 37 22 21
272 212 32 29
14. INVENTORIESFinished products 377 345Work-in-progress 602 409Raw materials 131 47Plant spares and stores 227 128Merchandise 32 26
1 369 955
Included above are inventories relating to the Ticor SA project which might be sold or utilised in production over more than 12 months.
Included in the above are inventories carried at net realisable value:– finished products 13 26– raw materials 2– plant spares and stores 31 14– merchandise 32 26
78 66
15. TRADE AND OTHER RECEIVABLESTrade 1 071 722 2Other 256 275 63 163Derivative instruments 28 25 13
1 355 1 022 78 163

116 KUMBA FINANCIAL REPORTING 2003
Notes to the annual financial statements (continued)
16. SHARE CAPITALSHARE CAPITAL AT PAR VALUEAuthorised
500 000 000 ordinary shares of R0,01 each 5 5 5 5
Issued
296 962 801 ordinary shares of R0,01 each 3 3 3 3
Share premium 2 677 2 677 2 677 2 677
TOTAL 2 680 2 680 2 680 2 680
RECONCILIATION OF AUTHORISED SHARESNumber of authorised ordinary shares
at beginning of year (million) 203 500 203 500
Number of shares issued during the year (million) 297 297
Number of outstanding authorised shares at end of year 203 203 203 203
The unissued ordinary shares are under the control of the directors until the forthcoming annual general meeting subject to
the following conditions:
– the authority is valid until the next annual general meeting but shall not extend beyond 15 months;
– a paid press announcement giving full details, including the impact on net asset value and earnings per share, be published
after any issue representing, on a cumulative basis within one financial year, 5% or more of the number of shares in issue
prior to the issue concerned;
– that the issue in aggregate in one financial year shall not exceed 15% of the number of shares of the company’s issued
ordinary share capital; and
– that, in determining the price at which an issue of shares for cash will be made in terms of this authority, the maximum
discount permitted shall be 10% of the weighted average trading price of the ordinary shares on the JSE Securities Exchange
SA (adjusted for any dividend declared but not yet paid or for any capitalisation award made to shareholders) over the
30 business days prior to the date that the price of the issue is determined or agreed by the directors of the company.
GROUP COMPANY
2003 2002 2003 2002Rm Rm Rm Rm

117
GROUP COMPANY
2003 2002 2003 2002Rm Rm Rm Rm
17. INTEREST-BEARING BORROWINGSNON-CURRENT BORROWINGSSummary of loans by financial year of redemption2003 931 8442004 407 221 292 1382005 697 124 200 362006 1 126 86 6222007 273 71 992008 onwards 705 380 111 300
Total non-current borrowings (annexure 1) 3 208 1 813 1 324 1 318Current portion included in current liabilities (407) (931) (292) (844)
Total 2 801 882 1 032 474
Details of interest rates payable on borrowings are shown in annexure 1.
INTEREST-BEARING BORROWINGSNon-current borrowings 2 801 882 1 032 474
Short-term borrowings 130 9 154 9Current portion of non-currentborrowings 407 931 292 844
Total short-term borrowings 537 940 446 853
Total 3 338 1 822 1 478 1 327
Included in the above interest-bearing borrowings are obligations relating to finance leases. Details are:Minimum lease payments:– less than 1 year 30 44– more than 1 year and less than 5 years 27 55– more than 5 years
– total 57 99– less future finance charges 7 16
Present value of lease liabilities 50 83
Representing lease liabilities:– current 25 40– non-current (more than 1 year and less than 5 years) 25 43– non-current (more than 5 years)
Total 50 83
18. OTHER LONG-TERM PAYABLESOther long-term payables: Iscor captive mines 386 178Other long-term payables 2
388 178
Iscor has funded the capital expenditure at the Thabazimbi and Tshikondeni captive mines in terms of supply agreements. Thefunds are repayable over the life of the assets as specified in the supply agreements.

118 KUMBA FINANCIAL REPORTING 2003
Notes to the annual financial statements (continued)
19. PROVISIONSGROUPFor the year ended 30 June 2002
At beginning of year
Unbundling 290 106 21 417
Charge to income statement 11 44 13 68
Additional provisions 5 47 13 65
Interest adjustment 6 6
Unused amounts reversed (3) (3)
Utilised during year (15) (40) (2) (57)
At end of year 286 110 32 428
Current portion included
in current liabilities (22) (17) (39)
Total non-current provisions 264 110 15 389
For the year ended 30 June 2003
At beginning of year 286 110 32 428
Charge to income statement 78 66 144
Additional provisions 20 41 61
Acquisition of subsidiary 39 27 66
Provisions capitalised to property, plant and equipment 15 15
Interest adjustment 4 4
Unused amounts reversed (2) (2)
Utilised during year (2) (30) (11) (43)
At end of year 362 146 21 529
Current portion included
in current liabilities (18) (10) (28)
Total non-current provisions 344 146 11 501
Environmental Leave pay
rehabilitation benefits Restructuring Total
Rm Rm Rm Rm
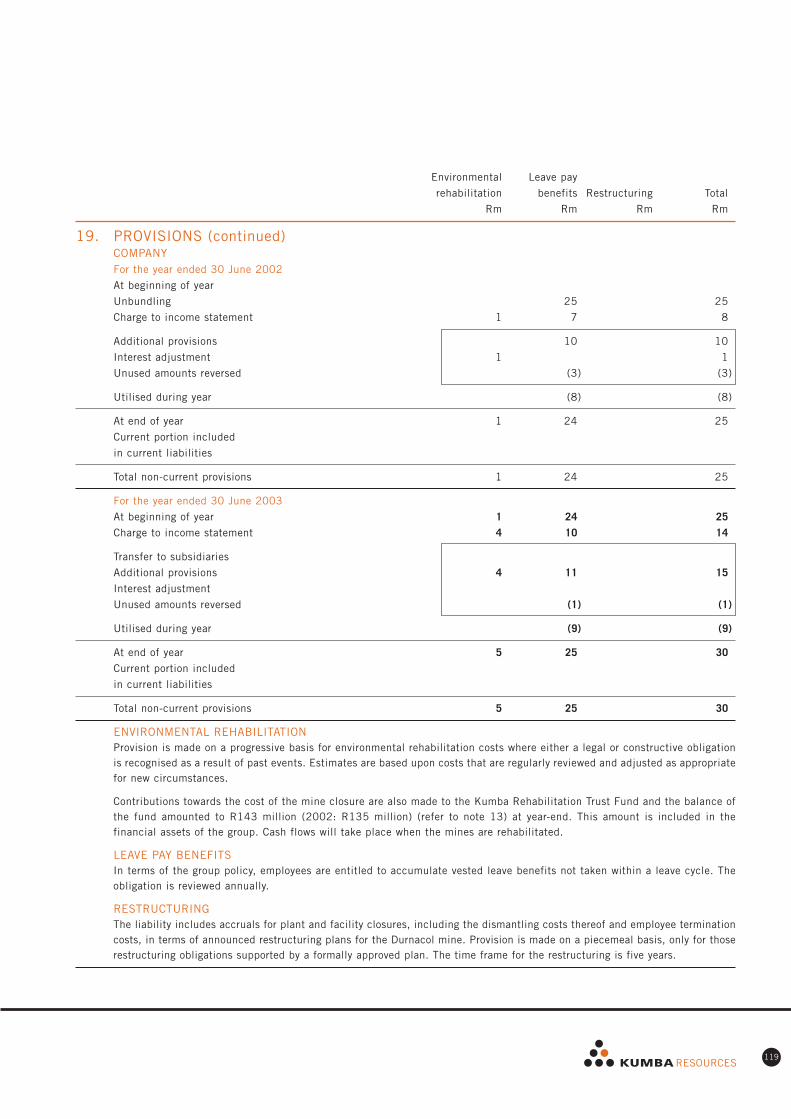
119
Environmental Leave pay
rehabilitation benefits Restructuring Total
Rm Rm Rm Rm
19. PROVISIONS (continued)COMPANYFor the year ended 30 June 2002
At beginning of year
Unbundling 25 25
Charge to income statement 1 7 8
Additional provisions 10 10
Interest adjustment 1 1
Unused amounts reversed (3) (3)
Utilised during year (8) (8)
At end of year 1 24 25
Current portion included
in current liabilities
Total non-current provisions 1 24 25
For the year ended 30 June 2003
At beginning of year 1 24 25
Charge to income statement 4 10 14
Transfer to subsidiaries
Additional provisions 4 11 15
Interest adjustment
Unused amounts reversed (1) (1)
Utilised during year (9) (9)
At end of year 5 25 30
Current portion included
in current liabilities
Total non-current provisions 5 25 30
ENVIRONMENTAL REHABILITATIONProvision is made on a progressive basis for environmental rehabilitation costs where either a legal or constructive obligationis recognised as a result of past events. Estimates are based upon costs that are regularly reviewed and adjusted as appropriatefor new circumstances.
Contributions towards the cost of the mine closure are also made to the Kumba Rehabilitation Trust Fund and the balance ofthe fund amounted to R143 million (2002: R135 million) (refer to note 13) at year-end. This amount is included in thefinancial assets of the group. Cash flows will take place when the mines are rehabilitated.
LEAVE PAY BENEFITSIn terms of the group policy, employees are entitled to accumulate vested leave benefits not taken within a leave cycle. Theobligation is reviewed annually.
RESTRUCTURINGThe liability includes accruals for plant and facility closures, including the dismantling costs thereof and employee terminationcosts, in terms of announced restructuring plans for the Durnacol mine. Provision is made on a piecemeal basis, only for thoserestructuring obligations supported by a formally approved plan. The time frame for the restructuring is five years.

120 KUMBA FINANCIAL REPORTING 2003
Notes to the annual financial statements (continued)
20. DEFERRED TAXATIONThe movement on the deferred taxation account is as follows:
At beginning of year 781 (11)
Unbundling 713 (6)
Acquisition of subsidiary 49
Non-distributable reserve charge 35
Income statement charge (note 6) 34 68 (9) (5)
At end of year 899 781 (20) (11)
Comprising:
Deferred taxation liabilities
– property, plant and equipment 1 473 1 167 1 (1)
– foreign taxation to be set-off for group tax entity (147)
– inventories 17 6
– environmental rehabilitation trust fund asset 23 31 2 2
– prepayments 17 8
– unrealised profits 1
1 384 1 204 11 1
Deferred taxation assets
– provisions (110) (94) (14) (12)
– property, plant and equipment (26) (6)
– inventories (1)
– other (1)
– taxation losses carried forward (248) (255) (11)
– foreign taxation losses carried forward (246) (74)
– foreign taxation losses to be set-off for group tax entity 147
(485) (423) (31) (12)
899 781 (20) (11)
CALCULATED TAXATION LOSSESAvailable for set-off against future South African taxable
income included above 827 850 37
21. TRADE AND OTHER PAYABLESTrade 533 470 25 29
Other 391 627 89 208
Derivative instruments 17 (47) 6 (2)
941 1 050 120 235
GROUP COMPANY
2003 2002 2003 2002Rm Rm Rm Rm

121
GROUP COMPANY
2003 2002 2003 2002Rm Rm Rm Rm
22. NOTES TO THE CASH FLOW STATEMENT22.1 CASH RETAINED FROM OPERATIONS
Net operating income/(loss) 1 212 1 683 99 (18)Adjusted for non-cash movements– depreciation 523 454 5 7– provisions 59 62 14 7– foreign exchange revaluations 72 (44) 2 (37)– reconditionable spares usage 8 8– net deficit on disposal or scrapping of property,
plant and equipment (12) (4) 5 7– net deficit on disposal or scrapping of investments (127) 39Working capital movements– increase in inventories (108) (135)– decrease/(increase) in trade and other receivables 21 (182) 44 117– decrease/(increase) in non-current financial assets 32 30 17 (26)– (decrease)/increase in trade and other payables (212) 707 (118) (21)– utilisation of provisions (note 19) (28) (57) (9) (8)
1 567 2 522 (68) 67
22.2 INCOME FROM EQUITY ACCOUNTED INVESTMENTSIncome from equity accounted investments as per income statement 2 83Dividends received from equity accounted investments 49 47Less: Non-cash flow income from equity accounted investments (2) (83)
49 47
22.3 NET FINANCING COSTSNet financing costs as per income statement (244) (242) (182) (213)Financing costs not involving cash flow (note 19) 4 6 1
(240) (236) (182) (212)
22.4 DIVIDENDS PAIDAmounts unpaid at beginning of yearDividends declared and paid (252) (252)Dividends declared and paid by subsidiaries to minorities (34)Amounts unpaid at end of year
(286) (252)
22.5 NORMAL TAXATION PAIDAmounts unpaid at beginning of year (223) 3Unbundling (12)
Adjusted opening balance (223) (12) 3Amounts charged to the income statement (183) (358) (38) 3Arising on translation of foreign entities 2 (2)Amounts unpaid at end of year 94 223 3 (3)
(310) (149) (32)
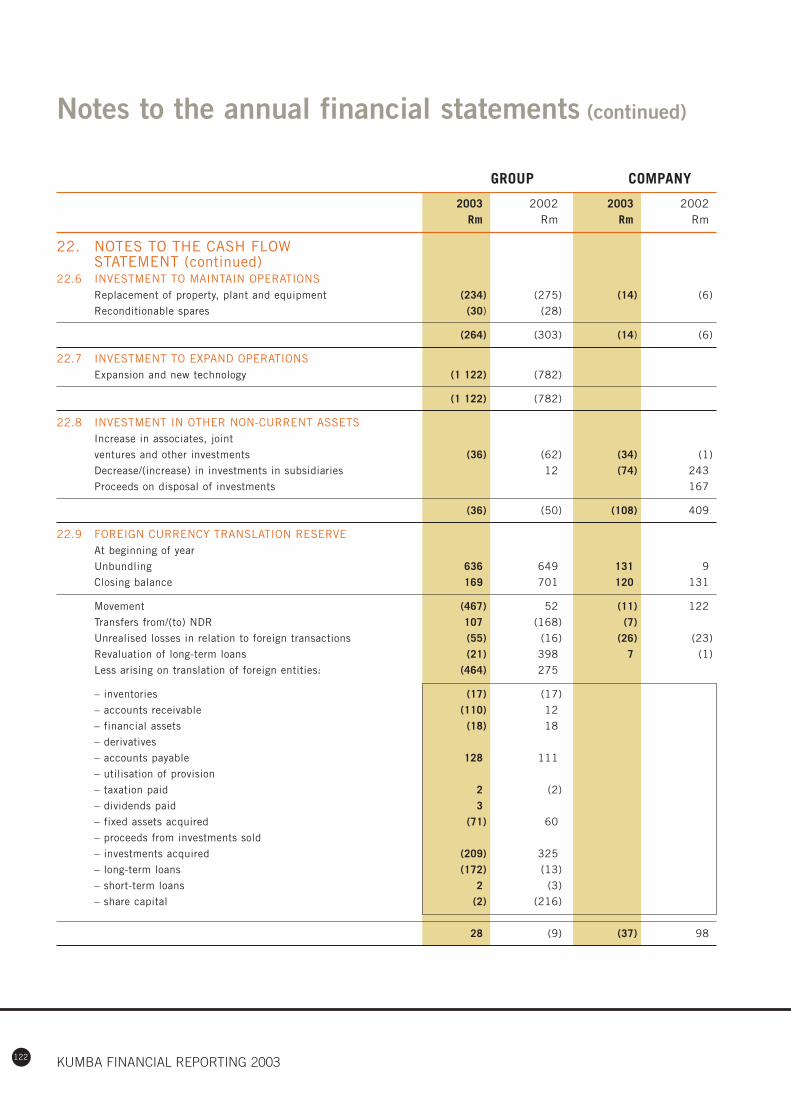
122 KUMBA FINANCIAL REPORTING 2003
Notes to the annual financial statements (continued)
22. NOTES TO THE CASH FLOW STATEMENT (continued)
22.6 INVESTMENT TO MAINTAIN OPERATIONSReplacement of property, plant and equipment (234) (275) (14) (6)
Reconditionable spares (30) (28)
(264) (303) (14) (6)
22.7 INVESTMENT TO EXPAND OPERATIONSExpansion and new technology (1 122) (782)
(1 122) (782)
22.8 INVESTMENT IN OTHER NON-CURRENT ASSETSIncrease in associates, joint
ventures and other investments (36) (62) (34) (1)
Decrease/(increase) in investments in subsidiaries 12 (74) 243
Proceeds on disposal of investments 167
(36) (50) (108) 409
22.9 FOREIGN CURRENCY TRANSLATION RESERVEAt beginning of year
Unbundling 636 649 131 9
Closing balance 169 701 120 131
Movement (467) 52 (11) 122
Transfers from/(to) NDR 107 (168) (7)
Unrealised losses in relation to foreign transactions (55) (16) (26) (23)
Revaluation of long-term loans (21) 398 7 (1)
Less arising on translation of foreign entities: (464) 275
– inventories (17) (17)
– accounts receivable (110) 12
– financial assets (18) 18
– derivatives
– accounts payable 128 111
– utilisation of provision
– taxation paid 2 (2)
– dividends paid 3
– fixed assets acquired (71) 60
– proceeds from investments sold
– investments acquired (209) 325
– long-term loans (172) (13)
– short-term loans 2 (3)
– share capital (2) (216)
28 (9) (37) 98
GROUP COMPANY
2003 2002 2003 2002Rm Rm Rm Rm

123
23. ACQUISITIONSTICOR LIMITED (AUSTRALIA)On 1 April 2003, the group acquired an additional 0,21% of the issued share capital of Ticor Ltd, bringing the interest of thegroup to 50,12% which infers control. Ticor is included in the heavy minerals business segment. On 27 June 2003, anadditional 1,26% was acquired bringing the interest of the group to 51,38% at 30 June 2003. The acquired businesscontributed revenues of R275 million and operating profits of R35 million to the group for the period from 1 April 2003 to30 June 2003.
MAGNETIC MINERALS LIMITEDOn 1 April 2003 Ticor Ltd acquired a controlling interest in Magnetic Minerals Ltd resulting in the consolidation thereof fromsuch date.
ZnERGY (PROPRIETARY) LIMITEDOn 30 November 2002 the group acquired an additional 8,5% of the issued share capital of ZnERGY (Pty) Ltd, which isincluded in the base metals segment. An additional 30% was acquired on 1 April 2003 bringing the interest of the group at30 June 2003 to 85%. The acquired business contributed revenues of R nil million and operating profits of R nil million tothe group for the period from 1 December 2002 to 30 June 2003.
MagneticTicor Minerals ZnERGY
Ltd Ltd (Pty) Ltd TotalRm Rm Rm Rm
Details of assets acquired and goodwill are as followsPurchase consideration:– cash paid on acquisition (943) (111) (1 054)– additional interest of fair value of assets acquired 1 147 111 1 258
Negative goodwill 204 204
The assets and liabilities arising from the acquisition are as follows:– cash and cash equivalents 370 4 374– property, plant and equipment 1 442 113 9 1 564– financial assets 9 9– investments 823 823– intangible assets 87 2 12 101– inventories 254 254– trade and other receivables 480 480– trade and other payables (238) (12) (6) (256)– interest-bearing borrowings (876) (15) (891)– non-current provisions (59) (59)– current provisions (7) (7)– deferred taxation (49) (49)
Fair value of net assets 2 236 107 2 343Negative goodwill (204) (204)Minority interest (1 085) (1 085)
Total purchase consideration 947 107 1 054Less:– cash and cash equivalents in subsidiary acquired (370) (4) (374)– value of shares held before consolidation (943) (103) (1 046)
Cash inflow on acquisition of controlling interest(refer to cash flow statement) (366) (366)

124 KUMBA FINANCIAL REPORTING 2003
Notes to the annual financial statements (continued)
24. FINANCIAL INSTRUMENTSThe centralised corporate treasury function provides services to all the businesses in the group, co-ordinates access to
domestic and international financial markets, and manages the financial risks relating to the group’s operations.
The group’s objective in using financial instruments is to reduce the uncertainty over future cash flows arising from movements
in currency, interest rates and base metal prices. Currency and interest rate exposure is managed within board-approved
policies and guidelines, which restrict the use of derivatives to the hedging of specific underlying currency, interest rate and
base metal price exposures. Compliance with group policies and exposure limits is reviewed by the internal auditors on a
continuous basis and reports to the board audit committee.
24.1 FOREIGN CURRENCY RISK MANAGEMENTThe group undertakes transactions denominated in foreign currencies, hence exposures to exchange rate fluctuations arise.
Exchange rate exposures are managed within approved policy parameters utilising forward exchange contracts (FECs), currency
options and currency swap agreements.
Material FECs and currency options, which relate to specific balance sheet items or do not form part of a hedging relationship
at 30 June 2003 and 30 June 2002, are summarised as follows:
FOREIGN CURRENCYMarket Recognised
related Contract fair value
Foreign value value gains/(losses)
amount Rm Rm Rm
2003Exports
United States dollar – FECs 68 516 530 14
2002Exports
United States dollar – FECs 21 218 221 3
United States dollar – Put options 12 138 130 (8)
United States dollar – Call options 33 346 350 4
Imports
United States dollar – FECs 1 10 10

125
24. FINANCIAL INSTRUMENTS (continued)24.1 FOREIGN CURRENCY RISK MANAGEMENT (continued)
The group has entered into certain forward exchange contracts, which relate to specific foreign commitments not yet due and export
earnings of which the proceeds are not yet receivable. Details of the contracts at 30 June 2003 and 30 June 2002 are as follows:
FOREIGN CURRENCYMarket Recognised
related Contract fair value
Foreign value value in equity
amount Rm Rm Rm
2003Exports1
United States dollar – FECs 88 653 701 48United States dollar – Put optionsUnited States dollar – Call options 14 104 112 8Attributable to minorities (27)
Loans2
United States dollar – FECs 5 41 37 4
Imports2
United States dollar – FECs 16 117 128 (11)Euro – FECs 8 66 72 (6)Japanese yen – FECs 6 1 1Danish krona – FECs 7 8 9 (1)Australian dollars – FECs 1 1
Note: Unrealised exchange gains or losses amounting to R45 million arising from the revaluation of Ticor Limited’s foreigncurrency loans which are a natural hedge against specific future export sales revenue, are recognised in equity as hedgeaccounting has been applied.
FOREIGN CURRENCYMarket Recognised
related Contract fair value
Foreign value value in equity
amount Rm Rm Rm
2002Exports1
United States dollar – FECs 9 91 90 (1)United States dollar – Put options 3 31 31United States dollar – Call options 9 91 94 (3)
Loans2
United States dollar – FECs 6 70 45 25
Imports2
United States dollar – FECs 10 51 48 3Euro – FECs 22 224 181 42Swedish krona – FECs 2 2 2Danish krona – FECs 7 10 9 1Great Britain pounds – FECs 1 1
1. Recognised fair value in equity to be released to income statement within six months.
2. Recognised fair value in equity to be released to income statement within three years.
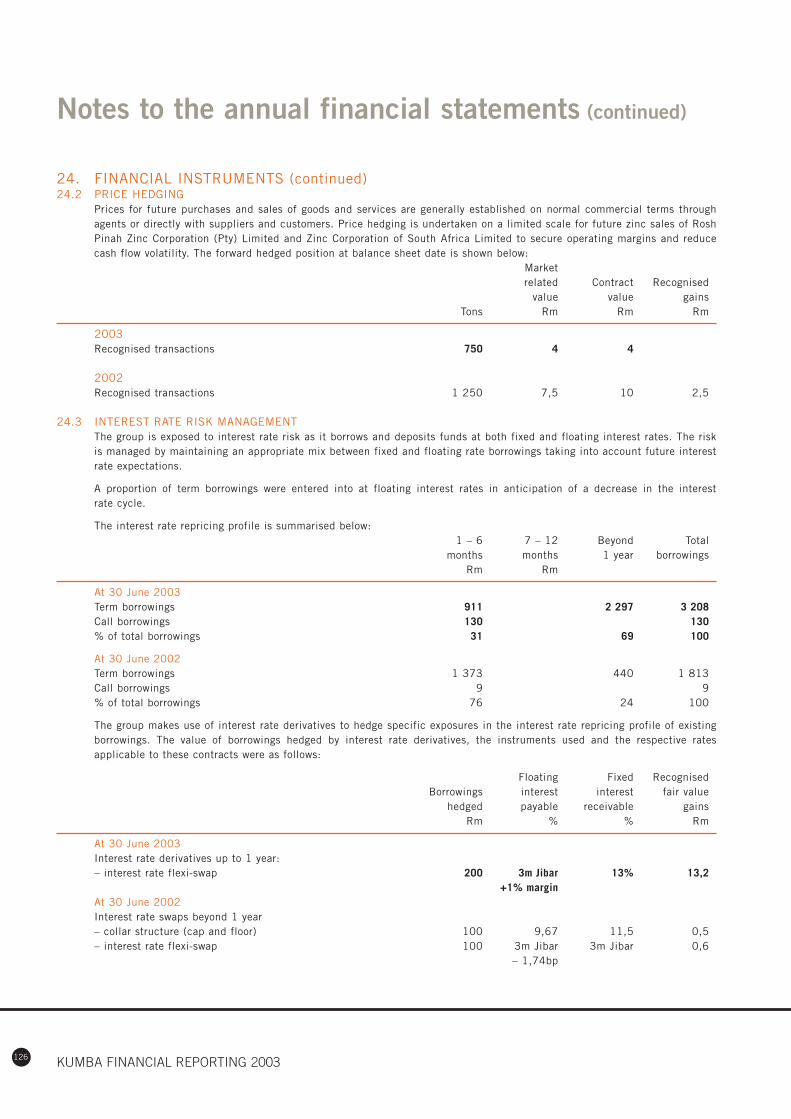
126 KUMBA FINANCIAL REPORTING 2003
Notes to the annual financial statements (continued)
24. FINANCIAL INSTRUMENTS (continued)24.2 PRICE HEDGING
Prices for future purchases and sales of goods and services are generally established on normal commercial terms throughagents or directly with suppliers and customers. Price hedging is undertaken on a limited scale for future zinc sales of RoshPinah Zinc Corporation (Pty) Limited and Zinc Corporation of South Africa Limited to secure operating margins and reducecash flow volatility. The forward hedged position at balance sheet date is shown below:
Marketrelated Contract Recognised
value value gainsTons Rm Rm Rm
2003Recognised transactions 750 4 4
2002Recognised transactions 1 250 7,5 10 2,5
24.3 INTEREST RATE RISK MANAGEMENTThe group is exposed to interest rate risk as it borrows and deposits funds at both fixed and floating interest rates. The riskis managed by maintaining an appropriate mix between fixed and floating rate borrowings taking into account future interestrate expectations.
A proportion of term borrowings were entered into at floating interest rates in anticipation of a decrease in the interestrate cycle.
The interest rate repricing profile is summarised below:1 – 6 7 – 12 Beyond Total
months months 1 year borrowingsRm Rm
At 30 June 2003Term borrowings 911 2 297 3 208Call borrowings 130 130% of total borrowings 31 69 100
At 30 June 2002Term borrowings 1 373 440 1 813Call borrowings 9 9% of total borrowings 76 24 100
The group makes use of interest rate derivatives to hedge specific exposures in the interest rate repricing profile of existingborrowings. The value of borrowings hedged by interest rate derivatives, the instruments used and the respective ratesapplicable to these contracts were as follows:
Floating Fixed RecognisedBorrowings interest interest fair value
hedged payable receivable gainsRm % % Rm
At 30 June 2003Interest rate derivatives up to 1 year:– interest rate flexi-swap 200 3m Jibar 13% 13,2
+1% marginAt 30 June 2002Interest rate swaps beyond 1 year– collar structure (cap and floor) 100 9,67 11,5 0,5– interest rate flexi-swap 100 3m Jibar 3m Jibar 0,6
– 1,74bp

127
24. FINANCIAL INSTRUMENTS (continued)24.4 MATURITY PROFILE OF FINANCIAL INSTRUMENTS
The maturity profiles of financial assets and liabilities at 30 June 2003 and 30 June 2002 are summarised as follows:(The derivative instruments reflect the contract amounts)
0 – 12 1 – 2 3 – 5 > 5
months years years years Total
Rm Rm Rm Rm Rm
At 30 June 2003
Assets
Financial assets 129 143 272
Cash and cash equivalents 964 964
Trade and other receivables 1 355 1 355
Liabilities
Interest-bearing borrowings 537 697 1 399 705 3 338
Trade and other payables 941 941
841 (568) (1 399) (562) (1 688)
Percentage profile (%) (50) 34 83 33 100
At 30 June 2002
Assets
Financial assets 40 172 212
Cash and cash equivalents 679 679
Trade and other receivables 1 022 1 022
Liabilities
Interest-bearing borrowings 940 221 210 451 1 822
Trade and other payables 1 050 1 050
(289) (181) (210) (279) (959)
Percentage profile (%) 30 19 22 29 100
Derivative instruments as at 30 June 2003
(included in the above)
Recognised transactions
– buy
– sell 530 530
Forecasted transactions
– buy 222 5 26 253
– sell 330 371 112 813
Derivative instruments as at 30 June 2002
(included in the above)
Recognised transactions
– buy 10 10
– sell 701 701
Forecasted transactions
– buy 251 10 25 286
– sell 215 215

128 KUMBA FINANCIAL REPORTING 2003
Notes to the annual financial statements (continued)
24. FINANCIAL INSTRUMENTS (continued)24.5 FAIR VALUE OF FINANCIAL INSTRUMENTS
At 30 June 2003 the carrying amounts of cash and cash equivalents, trade and other receivables and trade and other payablesapproximate their fair values due to the short-term maturities of these assets and liabilities.
CARRYING VALUE FAIR VALUE
2003 2002 2003 2002Rm Rm Rm Rm
Assets
Financial assets 272 212 272 212
Cash and cash equivalents 964 679 964 679
Trade and other receivables 1 355 1 022 1 355 1 022
Liabilities
Non-current interest-bearing borrowings 2 801 882 2 855 876
Current interest-bearing borrowings 537 940 560 938
Trade and other payables 941 1 050 941 1 050
LIABILITIESThe fair value of long and medium-term borrowings is calculated using quoted prices, or where such prices are not available,discounted cash flow analyses using the applicable yield curve for the duration of the borrowing.
DERIVATIVE INSTRUMENTSComprise forward exchange contracts, currency options, interest rate collars and swaps as well as zinc forward contracts. Thefair value of derivative instruments, included in hedging assets and liabilities are calculated using quoted prices. Where suchprices are not available use is made of discounted cash flow analyses using the applicable yield curve for the duration of theinstruments.
At 30 June 2003, the R70 million (2002: R72 million) fair value of instruments is made up of:
2003 2002
Rm Rm
Favourable contracts 88 83
Unfavourable contracts 18 11
When an anticipated future transaction has been hedged and the underlying position has not been recognised in the financial
statements, any change in fair value of the hedging instrument is recognised directly in equity.
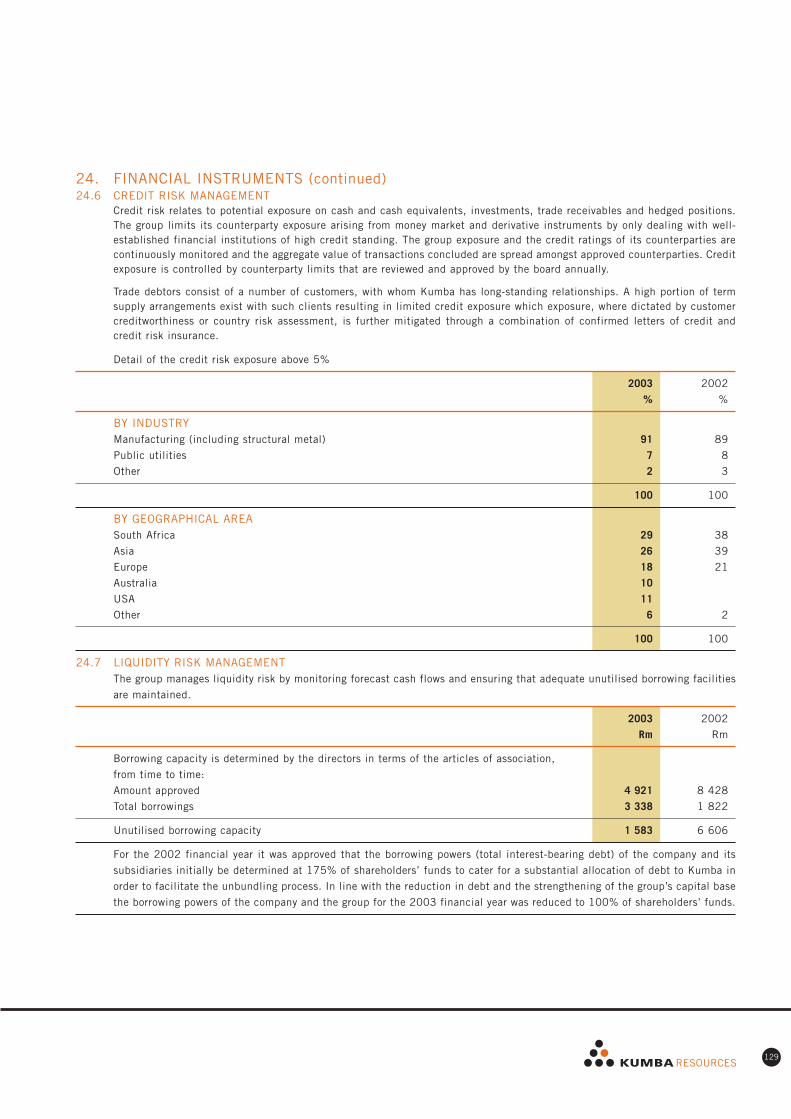
129
24. FINANCIAL INSTRUMENTS (continued)24.6 CREDIT RISK MANAGEMENT
Credit risk relates to potential exposure on cash and cash equivalents, investments, trade receivables and hedged positions.The group limits its counterparty exposure arising from money market and derivative instruments by only dealing with well-established financial institutions of high credit standing. The group exposure and the credit ratings of its counterparties arecontinuously monitored and the aggregate value of transactions concluded are spread amongst approved counterparties. Creditexposure is controlled by counterparty limits that are reviewed and approved by the board annually.
Trade debtors consist of a number of customers, with whom Kumba has long-standing relationships. A high portion of termsupply arrangements exist with such clients resulting in limited credit exposure which exposure, where dictated by customercreditworthiness or country risk assessment, is further mitigated through a combination of confirmed letters of credit andcredit risk insurance.
Detail of the credit risk exposure above 5%
2003 2002
% %
BY INDUSTRYManufacturing (including structural metal) 91 89
Public utilities 7 8
Other 2 3
100 100
BY GEOGRAPHICAL AREASouth Africa 29 38
Asia 26 39
Europe 18 21
Australia 10
USA 11
Other 6 2
100 100
24.7 LIQUIDITY RISK MANAGEMENTThe group manages liquidity risk by monitoring forecast cash flows and ensuring that adequate unutilised borrowing facilities
are maintained.
2003 2002
Rm Rm
Borrowing capacity is determined by the directors in terms of the articles of association,
from time to time:
Amount approved 4 921 8 428
Total borrowings 3 338 1 822
Unutilised borrowing capacity 1 583 6 606
For the 2002 financial year it was approved that the borrowing powers (total interest-bearing debt) of the company and its
subsidiaries initially be determined at 175% of shareholders’ funds to cater for a substantial allocation of debt to Kumba in
order to facilitate the unbundling process. In line with the reduction in debt and the strengthening of the group’s capital base
the borrowing powers of the company and the group for the 2003 financial year was reduced to 100% of shareholders’ funds.

130 KUMBA FINANCIAL REPORTING 2003
Notes to the annual financial statements (continued)
25. RELATED-PARTY TRANSACTIONSDuring the year the company and its subsidiaries, in the ordinary course of business, entered into various sale and purchase
transactions with associates and joint ventures. These transactions occurred under terms that are no less favourable than those
arranged with third parties.
ASSOCIATES AND JOINT VENTURESDetails of investments in associates and joint ventures are disclosed in note 11 and annexure 2 whilst income is disclosed in
note 11. Interest income from joint ventures of R nil million (2002: R nil million) is included in net financing costs (note 3).
The group purchased goods and services to the value of R123 million (2002: R82 million) from, and sold goods to the value
of R nil million (2002: R nil million) to associates and joint ventures.
The outstanding balances at year-end are as follows:
– included in trade and other receivables (note 15) R4 million (2002: R2 million)
– included in trade and other payables (note 21) R8 million (2002: R8 million)
– included in cash and cash equivalents R nil million (2002: R nil million)
– included in the carrying value of associates and joint ventures (note 11) are long-term loans of R39 million (2002:
R13 million)
– included in long-term debtors R nil million (2002: R nil million)
SUBSIDIARIESDetails of income from, and investments in subsidiaries are disclosed in notes 4 and 12 respectively, and annexure 3.
SPECIAL PURPOSE ENTITIESThe group has an interest in the following special purpose entities which are consolidated unless otherwise indicated:
Entity Nature of business
Ferrosure (Isle of Man) Insurance Company Limited Offshore insurance captive
Ferrosure (SA) Insurance Company Limited Insurance captive
Kumba Environmental Rehabilitation Fund Trust fund for mine closure
Minco Leasing Limited Financing company
Oreco Leasing Limited Financing company
Vulcan Leasing Limited Financing company
Kumba Resources Management Share Trust (not consolidated) Management share incentive trust
DIRECTORSDetails relating to directors’ emoluments and shareholdings (including options) in the company are disclosed in the report
of the directors.
SENIOR EMPLOYEESDetails relating to option and share transactions are disclosed in note 27.
SHAREHOLDERSThe principal shareholders of the company are provided in the annual report.
CONTINGENT LIABILITIESDetails are disclosed in note 28.

131
26. SEGMENT REPORTINGIron Base Heavy Industrial
ore Coal metals minerals minerals Other Total
2003 2002 2003 2002 2003 2002 2003 2002 2003 2002 2003 2002 2003 2002
Rm Rm Rm Rm Rm Rm Rm Rm Rm Rm Rm Rm Rm Rm
BUSINESSSEGMENTATIONSegment revenue
– total turnover 4 234 4 334 1 638 1 489 892 941 587 227 103 77 52 114 7 506 7 182
– inter-group 6 (25) (20) (12) 14 (37)
External 4 234 4 340 1 638 1 489 892 941 587 227 78 57 40 128 7 469 7 182
Segment net operating
profit/(loss) 882 1 221 279 255 15 102 59 54 21 15 (44) 36 1 212 1 683
Depreciation 235 215 137 130 41 29 92 47 6 6 21 27 532 454
Income/(loss) from equity
accounted investments 15 17 58 73 2 (71) (9) 2 83
Impairment charge 2 1 18 82 2 101
Goodwill amortisation 24 23 (3) (49) 21 (26)
Cash inflow from operations 1 160 1 364 304 400 11 234 109 62 25 22 (42) 440 1 567 2 522
Other non-cash flow items 51 (1) 9 50 8 (7) 41 2 18 (22) 127 22
Capital expenditure
– cash flow 211 254 125 99 73 90 947 631 5 3 25 8 1 386 1 085
– non-cash flow 104 108 50 33 154 141
315 362 175 132 73 90 947 631 5 3 25 8 1 540 1 226
Segment assets and liabilities
– assets per balance sheet 4 251 4 160 1 666 1 576 293 422 4 676 1 238 67 47 1 715 1 581 12 668 9 024
– investments in associates
and joint ventures 10 19 1 2 1 004 3 107 156 118 1 184
– liabilities per balance sheet 1 455 1 473 834 810 107 129 2 538 796 24 24 1 717 1 673 6 674 4 905
Number of employees (number) 4 312 4 153 2 675 2 927 1 127 1 187 1 3951 340 133 161 932 868 10 574 9 636
1. Includes the employees of Ticor Limited, Australia.

132 KUMBA FINANCIAL REPORTING 2003
Notes to the annual financial statements (continued)
26. SEGMENT REPORTING (continued)Additions Additions
Additions Additions to to
Carrying Carrying to to property, property,
amount amount property, property, plant and plant and
of of plant and plant and equipment equipment
Segment Segment segment segment equipment equipment (Non- (Non-
revenue revenue assets assets (Cash flow) (Cash flow) cash flow) cash flow)
2003 2002 2003 2002 2003 2002 2003 2002
Rm Rm Rm Rm Rm Rm Rm Rm
GEOGRAPHICALSEGMENTATION– South Africa 3 112 2 856 9 387 7 712 1 328 1 050 154 141
– Africa 134 92 456 168 25 35
– Europe 1 423 1 510 1 994 752
– Asia 2 347 2 471 733 137
– Australia 122 (309) 1 016
– Other 331 253 525 33
Total segment 7 469 7 182 12 786 9 785 1 386 1 085 154 141
Total segment revenue, which excludes value-added tax and sales between group companies, represent the gross value of
goods invoiced. Export revenues are recorded according to the relevant sales terms, when the risks and rewards of ownership
are transferred.
Total segment revenue further includes operating revenues directly and reasonably allocable to the segments. Segment revenue
includes sales made between segments. These sales are made on a commercial basis.
Segment net operating profit equals segment revenue less segment expenses. Segment expenses represent direct or reasonably
allocable operating expenses on a segment basis. Segment expenses exclude interest, losses on investments and income tax
expenses, but include head office expense allocations.
Segment assets and liabilities include directly and reasonably allocable operating assets, investments in associates and joint
ventures and liabilities.

133
27. EMPLOYEE BENEFITSRETIREMENT FUNDSIndependent funds provide retirement and other benefits for all permanent employees, retired employees, and their
dependants. At the end of the financial year, the main funds to which Kumba was a participating employer are as follows:
– Iscor Pension Fund, operating as a defined benefit fund. This fund is closed to new entrants.
– Iscor Retirement Fund, operating as a defined benefit fund. This fund is closed to new entrants.
– Iscor Selector Pension Fund and Iscor Selector Provident Fund, both operating as defined contribution funds.
– Iscor Employees’ Provident Fund, operating as a defined contribution fund.
Members pay a contribution of 7%, with the employer’s contribution of 10% to the above funds being expensed as incurred.
All funds are governed by the South African Pension Funds Act of 1956.
DEFINED CONTRIBUTION FUNDSMembership of each fund at 30 June 2003 and employer contributions to each fund were as follows:
Working Working Employer Employer
members members contributions contributions
2003 2002 2003 2002
Number Number Rm Rm
Iscor Selector Funds 3 836 3 723 51 44
Iscor Employees’ Provident Fund 4 622 4 654 24 21
Other funds 64 80 3 3
8 522 8 457 78 68
Due to the nature of these funds the accrued liabilities by definition equates to the total assets under control of these funds.
DEFINED BENEFIT FUNDSStatutory actuarial valuations are performed at intervals of not more than three years. The valuations are performed as at the
financial year-end of the funds in question which is 31 December. At the last statutory valuation of the funds within the group
(Iscor Pension Fund at 31 December 2001 and the Iscor Retirement Fund at 31 December 2000) and at the interim valuation
at 31 December 2002 for the Iscor Pension Fund and 31 December 2001 for the Iscor Retirement Fund, the actuaries
were of the opinion that the funds were adequately funded.

134 KUMBA FINANCIAL REPORTING 2003
Notes to the annual financial statements (continued)
27. EMPLOYEE BENEFITS (continued)FUNDED STATUSThe funded status of the two defined retirement benefit funds (Iscor Pension Fund at 31 December 2002 and Iscor Retirement
Fund at 31 December 2001) for both Iscor and Kumba members was as follows:
2002 2001
Rm Rm
Fair value of plan assets 6 856 7 160
Present value of funded obligation (6 701) (6 814)
Net asset 155 346
Surplus not recognised (155) (346)
Net liability as per balance sheet
The pension plan assets consist primarily of equity (local and offshore), interest-bearing stock and property.
The actual return on the assets in the Iscor Pension Fund as at 31 December 2002 amounted to R285 million.
Principal actuarial assumptions (expressed as weighted averages) at 31 December 2001 were as follows:
Iscor Pension Fund Iscor Retirement Fund
Interim Statutory Interim
valuation valuation valuation
2002 2001 2001
% % %
Pre-retirement discount rate 10,0 10,0 10,0
Post-retirement discount rate 5,0 5,0 4,5
Expected real after tax return on fund’s assets 2,5 2,5 n/a#
Future general and merit salary increases 7,5* 7,5* n/a#
Future pension increases were allowed for the extent that the investment return exceeds the post-retirement discount rate.
* Excluding merit increases according to age.
# Not applicable.
MEDICAL FUNDSThe group and company contribute to defined benefit medical aid schemes for the benefit of permanent employees and their
dependants. The contributions charged against income amounted to R47 million (2002: R40 million). Kumba has no post-
retirement medical aid obligation for current or retired employees.
EQUITY COMPENSATION BENEFITS
Kumba operates the Kumba Management Deferred Purchase Share Scheme and the Kumba Management Share Option Scheme
for senior employees and executive directors of Kumba.
The Kumba Management Deferred Purchase Share Scheme consists of a combination of an option scheme, a purchase scheme
and a deferred purchase scheme and governs to maturity the existing share scheme rights and obligations of employees
transferred from Iscor to Kumba on unbundling.
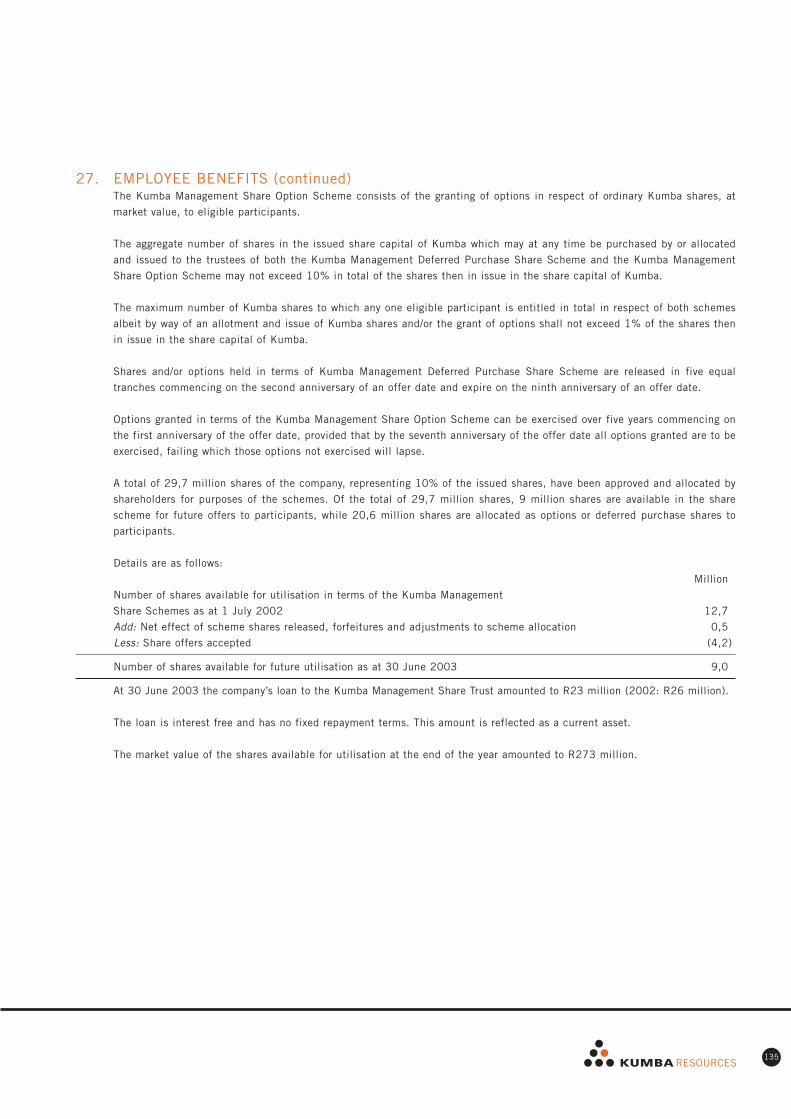
135
27. EMPLOYEE BENEFITS (continued)The Kumba Management Share Option Scheme consists of the granting of options in respect of ordinary Kumba shares, at
market value, to eligible participants.
The aggregate number of shares in the issued share capital of Kumba which may at any time be purchased by or allocated
and issued to the trustees of both the Kumba Management Deferred Purchase Share Scheme and the Kumba Management
Share Option Scheme may not exceed 10% in total of the shares then in issue in the share capital of Kumba.
The maximum number of Kumba shares to which any one eligible participant is entitled in total in respect of both schemes
albeit by way of an allotment and issue of Kumba shares and/or the grant of options shall not exceed 1% of the shares then
in issue in the share capital of Kumba.
Shares and/or options held in terms of Kumba Management Deferred Purchase Share Scheme are released in five equal
tranches commencing on the second anniversary of an offer date and expire on the ninth anniversary of an offer date.
Options granted in terms of the Kumba Management Share Option Scheme can be exercised over five years commencing on
the first anniversary of the offer date, provided that by the seventh anniversary of the offer date all options granted are to be
exercised, failing which those options not exercised will lapse.
A total of 29,7 million shares of the company, representing 10% of the issued shares, have been approved and allocated by
shareholders for purposes of the schemes. Of the total of 29,7 million shares, 9 million shares are available in the share
scheme for future offers to participants, while 20,6 million shares are allocated as options or deferred purchase shares to
participants.
Details are as follows:
Million
Number of shares available for utilisation in terms of the Kumba Management
Share Schemes as at 1 July 2002 12,7
Add: Net effect of scheme shares released, forfeitures and adjustments to scheme allocation 0,5
Less: Share offers accepted (4,2)
Number of shares available for future utilisation as at 30 June 2003 9,0
At 30 June 2003 the company’s loan to the Kumba Management Share Trust amounted to R23 million (2002: R26 million).
The loan is interest free and has no fixed repayment terms. This amount is reflected as a current asset.
The market value of the shares available for utilisation at the end of the year amounted to R273 million.

136 KUMBA FINANCIAL REPORTING 2003
Notes to the annual financial statements (continued)
27. EMPLOYEE BENEFITS (continued)EQUITY COMPENSATION BENEFITS (continued)
Details of the option/purchase schemes are:
Options Deferred purchase
2003 2002 2003 2002
Million Million Million Million
Outstanding at beginning of year 15,0 1,0 2,0 3,2
Issued 4,2 14,3
Conversion to deferred purchase scheme
Exercised (0,1) (0,3) (0,1)
Lapsed/cancelled (0,2) (1,2)
Outstanding at end of year 18,9 15,0 1,9 2,0
Details of issues during the year are as follows:
Expiry date 2009/2010 2008/2009
Exercise price (share price range) (R) 24,50 – 51,50 28,05 – 46,90
Total proceeds if options are immediately exercised/deferred
purchase shares immediately paid (R million) 150 395
Details of options/deferred purchase shares exercised during
the year are as follows:
Exercise price per share (Share price range) (R) 26,10 – 47,00 27,60 – 55,00 27,50 – 41,30 28,25 – 59,00
Total proceeds if shares are issued (R million) 4 4 3 14
Terms of the options and deferred purchase shares outstanding at year-end are as follows:
Options Deferred purchase
Exercise price Outstanding Exercise price Outstanding
Expiry date R ’000 R ’000
2006 19,85 – 19,85 15
2007 10,88 – 13,10 254 8,89 – 13,10 1 260
2008 12,07 – 28,05 13 348 8,42 – 18,90 256
2009 9,17 – 51,50 4 227 8,06 – 20,80 214
2010 13,66 – 32,55 721 10,00 – 23,26 168
2011
Total 18 550 1 913
Deferred
Options purchase Total
’000 ’000 ’000
Number of shares vesting at beginning of year 14 969 2 005 16 974
Net change during year 3 880 (91) 3 789
Number of shares vesting at end of year 18 849 1 914 20 763
DIRECTORS’ INTERESTS IN SHARESFor details refer to the report of the directors.

137
GROUP COMPANY
2003 2002 2003 2002Rm Rm Rm Rm
28. CONTINGENT LIABILITIESContingent liabilities at balance sheet date, not
otherwise provided for in these annual financial statements,
arising from:
– guarantees in the normal course of business from which it is
anticipated that no material liabilities will arise:
– related parties 5 2
– other 31 54 636 256
– other1 14 36 14
1. Includes the group’s share of contingent liabilities of associates and joint ventures of R nil million (2002: R23 million).
Included in the company’s guarantees are guarantees relating to the Ticor SA project loans as provided by the company. On
consolidation the project loans are included in net debt, and the contingent liability of the company eliminated.
These contingent liabilities have no tax impact.
The timing of any possible outflows are uncertain.
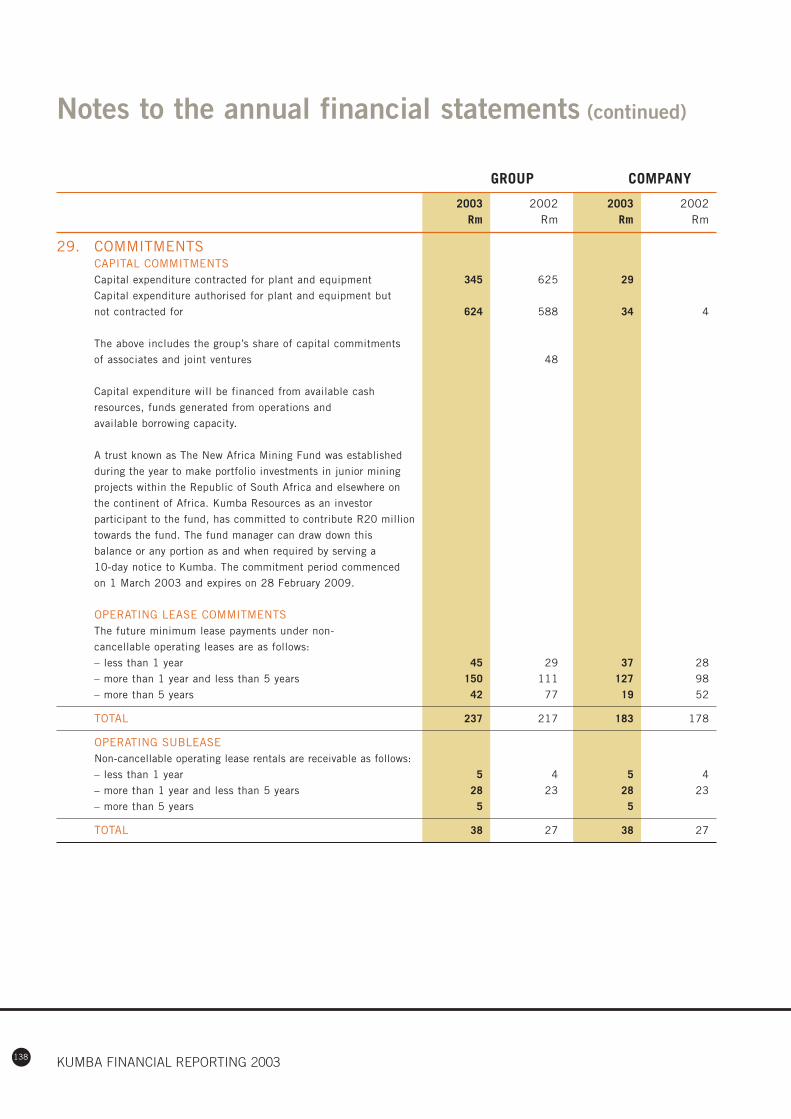
138 KUMBA FINANCIAL REPORTING 2003
Notes to the annual financial statements (continued)
29. COMMITMENTSCAPITAL COMMITMENTSCapital expenditure contracted for plant and equipment 345 625 29
Capital expenditure authorised for plant and equipment but
not contracted for 624 588 34 4
The above includes the group’s share of capital commitments
of associates and joint ventures 48
Capital expenditure will be financed from available cash
resources, funds generated from operations and
available borrowing capacity.
A trust known as The New Africa Mining Fund was established
during the year to make portfolio investments in junior mining
projects within the Republic of South Africa and elsewhere on
the continent of Africa. Kumba Resources as an investor
participant to the fund, has committed to contribute R20 million
towards the fund. The fund manager can draw down this
balance or any portion as and when required by serving a
10-day notice to Kumba. The commitment period commenced
on 1 March 2003 and expires on 28 February 2009.
OPERATING LEASE COMMITMENTSThe future minimum lease payments under non-
cancellable operating leases are as follows:
– less than 1 year 45 29 37 28
– more than 1 year and less than 5 years 150 111 127 98
– more than 5 years 42 77 19 52
TOTAL 237 217 183 178
OPERATING SUBLEASENon-cancellable operating lease rentals are receivable as follows:
– less than 1 year 5 4 5 4
– more than 1 year and less than 5 years 28 23 28 23
– more than 5 years 5 5
TOTAL 38 27 38 27
GROUP COMPANY
2003 2002 2003 2002Rm Rm Rm Rm

139
Annexure 1: Non-current interest-bearing borrowings
Final Rate of interest Rate of interestrepayment per year (payable per year (payable
date half-yearly) half-yearly)2003 2002 GROUP COMPANY
Fixed Floating Fixed Floating 2003 2002 2003 2002% % % % Rm Rm Rm Rm
LOCALUNSECURED LOANS
2002/03 12,581 140 140
2002/03 12,711 200 200
2002/03 13,963 150 150
2002/03 13,650 150 150
2003/04 15,030 13,963 75 225 75 225
2004/05 10,340 6,040 99 153 99 153
2005/06 13,210 200 200
2005/06 12,300 250 250
2005/06 14,220 250 250
2007/08 12,410 450 450
2007/08 11,670 300 300
1 324 1 318 1 324 1 318
SECURED LOAN2003/04 14,760 14,678 1 5 22
2005/06 14,939 14,939 2 43 59
2007/08 13,830 13,830 3 319 360
2010/11 14,200 4 741
1 108 441
FOREIGNUNSECURED LOANS (USD)
2005/06 2,310 2,8755 32 54
2013/14 7,300 6 744
776 54
TOTAL NON-CURRENT INTEREST-BEARING BORROWINGS (note 17) 3 208 1 813 1 324 1 318
1. Capitalised lease agreement secured by machinery, plant and equipment with a book value of R34 million (2002: R37 million), payable monthly.
2. Capitalised lease agreement secured by machinery, plant and equipment with a book value of R53 million (2002: R55 million), payable monthly.
3. Dedicated project finance facility for Ticor South Africa KZN (Pty) Limited and Ticor South Africa (Pty) Limited secured by notarial bond over
property, plant and equipment with a book value of R968 million (2002: R943 million).
4. Dedicated project finance facility secured by notarial bond over property, plant and equipment with a book value of R1 414 million.
5. Payable semi-annually and varies with LIBOR.
6. US$100 million senior notes issued by Ticor Finance (ACT) (Pty) Limited, an entity controlled by Ticor Limited.

140 KUMBA FINANCIAL REPORTING 2003
Annexure 2: Investments in associates, joint venturesand other investments
ASSOCIATED COMPANIESLISTEDAST Group Limited C 180 000 000 26,74 30,73 69 94 86 51Mincor Resources NL (Australian) A 52 251 000 30,13 34,11 31 54Ticor Limited (Australian)(2) A 49,15 1 004 31 DecemberUNLISTEDManganore Iron Mining Limited A 25 000 50,00 50,00 2South Dunes Coal Terminal Co (Pty) Limited A 1 333 33,00 33,00 1ZnERGY (Pty) Limited(3) M 93 46,50 1 1
TOTAL ASSOCIATED COMPANIES (note 11) 101 1 155 86 52
JOINT VENTURESINCORPORATEDUNLISTEDPietersburg Iron Company (Pty) Limited A 4 000 50,00 50,00 3 3Safore (Pty) Limited B 400 40,00 40,00 31 DecemberSishen Shipping (Pty) Limited B 400 40,00 40,00 31 DecemberTrans Orient Ore Supplies (Pty) Limited D 4 000 50,00 50,00 7 16
10 19
UNINCORPORATEDBridgetown Dolomite Mine A 50,00 50,00 7 10 7 7 28 FebruarySafore B 40,00 40,00
7 10 7 7
TOTAL JOINT VENTURES (note 11) 17 29 7 7
INVESTMENTCOMPANIESMineral Deposits Limited A 11 299 000 15,37 15,37 7 9Other 72 28 22 21
TOTAL OTHER INVESTMENTS (note 13) 79 37 22 21
TOTAL INVESTMENT 197 1 221 115 80
Market value of listed shares as at 30 June 138 1 340 29 149Directors’ valuation of unlistedshares and joint ventures 108 60 7 31
Where the above entities’ financial year-ends are not coterminous with that of the company, financial information has beenobtained from published information or management accounts as appropriate.
1. A – Mining, B – Shipping charter, C – Service, D – Iron ore merchant, M – Manufacturing.2. Ticor Limited consolidated from 1 April 2003.3. Previously Cross Continental Energy Storage System (Pty) Limited, consolidated from 1 December 2002.
Number Group Company Year-end
Nature of of shares Percentage carrying carrying other than
business1 held holding amount amount 30 June
2003 2002 2003 2002 2003 2002
% % Rm Rm Rm Rm
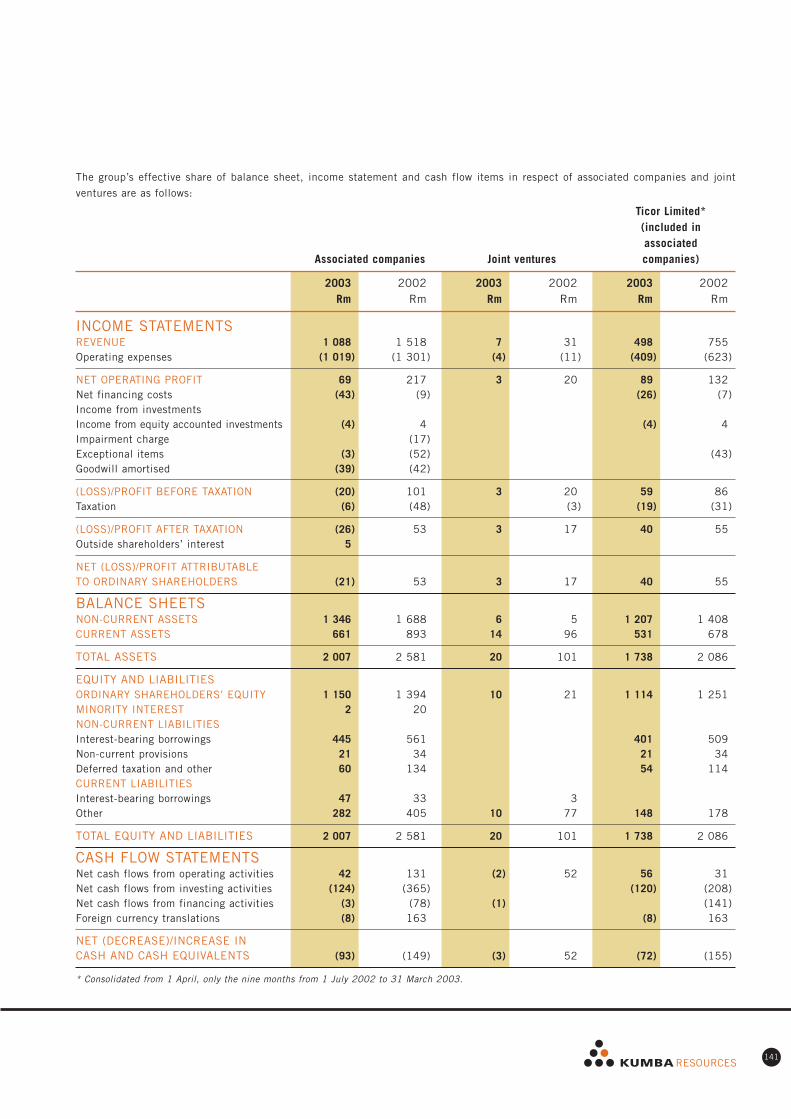
141
INCOME STATEMENTSREVENUE 1 088 1 518 7 31 498 755Operating expenses (1 019) (1 301) (4) (11) (409) (623)
NET OPERATING PROFIT 69 217 3 20 89 132Net financing costs (43) (9) (26) (7)Income from investmentsIncome from equity accounted investments (4) 4 (4) 4Impairment charge (17)Exceptional items (3) (52) (43)Goodwill amortised (39) (42)
(LOSS)/PROFIT BEFORE TAXATION (20) 101 3 20 59 86Taxation (6) (48) (3) (19) (31)
(LOSS)/PROFIT AFTER TAXATION (26) 53 3 17 40 55Outside shareholders’ interest 5
NET (LOSS)/PROFIT ATTRIBUTABLETO ORDINARY SHAREHOLDERS (21) 53 3 17 40 55
BALANCE SHEETSNON-CURRENT ASSETS 1 346 1 688 6 5 1 207 1 408CURRENT ASSETS 661 893 14 96 531 678
TOTAL ASSETS 2 007 2 581 20 101 1 738 2 086
EQUITY AND LIABILITIESORDINARY SHAREHOLDERS’ EQUITY 1 150 1 394 10 21 1 114 1 251MINORITY INTEREST 2 20NON-CURRENT LIABILITIESInterest-bearing borrowings 445 561 401 509Non-current provisions 21 34 21 34Deferred taxation and other 60 134 54 114CURRENT LIABILITIESInterest-bearing borrowings 47 33 3Other 282 405 10 77 148 178
TOTAL EQUITY AND LIABILITIES 2 007 2 581 20 101 1 738 2 086
CASH FLOW STATEMENTSNet cash flows from operating activities 42 131 (2) 52 56 31Net cash flows from investing activities (124) (365) (120) (208)Net cash flows from financing activities (3) (78) (1) (141)Foreign currency translations (8) 163 (8) 163
NET (DECREASE)/INCREASE IN CASH AND CASH EQUIVALENTS (93) (149) (3) 52 (72) (155)
* Consolidated from 1 April, only the nine months from 1 July 2002 to 31 March 2003.
Ticor Limited*(included inassociated
Associated companies Joint ventures companies)
2003 2002 2003 2002 2003 2002Rm Rm Rm Rm Rm Rm
The group’s effective share of balance sheet, income statement and cash flow items in respect of associated companies and joint
ventures are as follows:
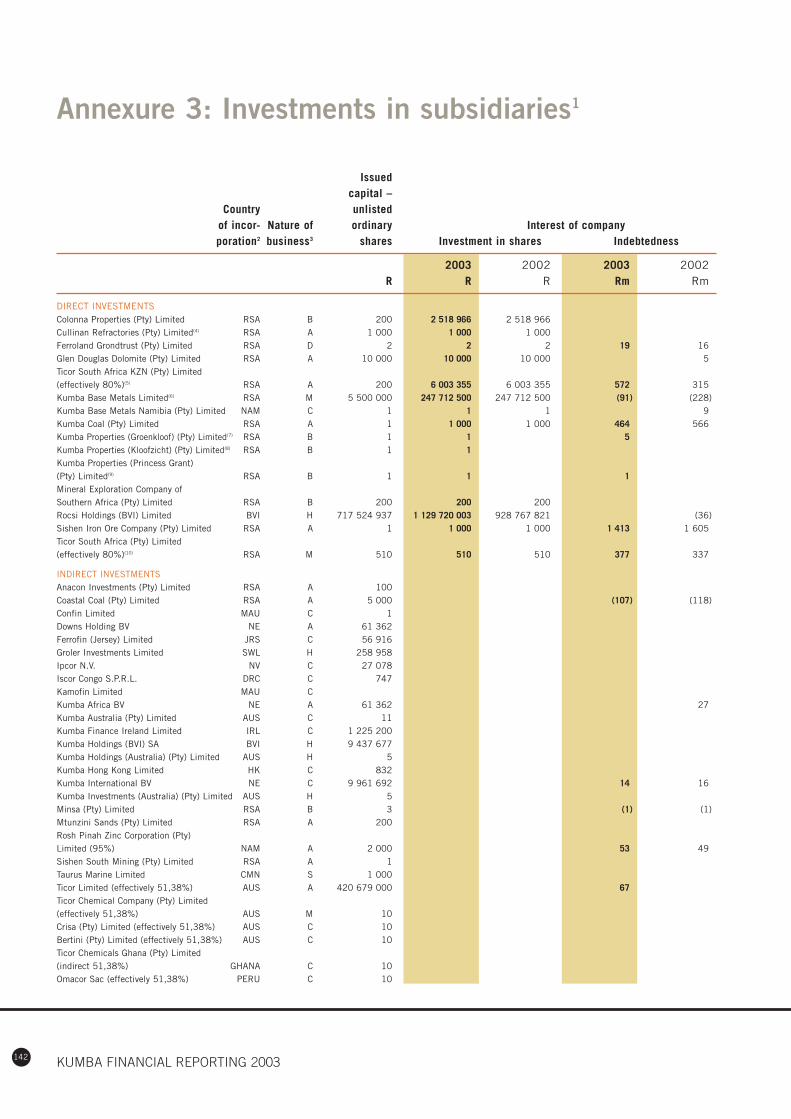
142 KUMBA FINANCIAL REPORTING 2003
Annexure 3: Investments in subsidiaries1
DIRECT INVESTMENTSColonna Properties (Pty) Limited RSA B 200 2 518 966 2 518 966Cullinan Refractories (Pty) Limited(4) RSA A 1 000 1 000 1 000Ferroland Grondtrust (Pty) Limited RSA D 2 2 2 19 16Glen Douglas Dolomite (Pty) Limited RSA A 10 000 10 000 10 000 5Ticor South Africa KZN (Pty) Limited (effectively 80%)(5) RSA A 200 6 003 355 6 003 355 572 315Kumba Base Metals Limited(6) RSA M 5 500 000 247 712 500 247 712 500 (91) (228)Kumba Base Metals Namibia (Pty) Limited NAM C 1 1 1 9Kumba Coal (Pty) Limited RSA A 1 1 000 1 000 464 566Kumba Properties (Groenkloof) (Pty) Limited(7) RSA B 1 1 5Kumba Properties (Kloofzicht) (Pty) Limited(8) RSA B 1 1Kumba Properties (Princess Grant) (Pty) Limited(9) RSA B 1 1 1Mineral Exploration Company of Southern Africa (Pty) Limited RSA B 200 200 200Rocsi Holdings (BVI) Limited BVI H 717 524 937 1 129 720 003 928 767 821 (36)Sishen Iron Ore Company (Pty) Limited RSA A 1 1 000 1 000 1 413 1 605Ticor South Africa (Pty) Limited (effectively 80%)(10) RSA M 510 510 510 377 337
INDIRECT INVESTMENTSAnacon Investments (Pty) Limited RSA A 100Coastal Coal (Pty) Limited RSA A 5 000 (107) (118)Confin Limited MAU C 1Downs Holding BV NE A 61 362Ferrofin (Jersey) Limited JRS C 56 916Groler Investments Limited SWL H 258 958Ipcor N.V. NV C 27 078Iscor Congo S.P.R.L. DRC C 747Kamofin Limited MAU CKumba Africa BV NE A 61 362 27Kumba Australia (Pty) Limited AUS C 11Kumba Finance Ireland Limited IRL C 1 225 200Kumba Holdings (BVI) SA BVI H 9 437 677Kumba Holdings (Australia) (Pty) Limited AUS H 5Kumba Hong Kong Limited HK C 832Kumba International BV NE C 9 961 692 14 16Kumba Investments (Australia) (Pty) Limited AUS H 5Minsa (Pty) Limited RSA B 3 (1) (1)Mtunzini Sands (Pty) Limited RSA A 200Rosh Pinah Zinc Corporation (Pty) Limited (95%) NAM A 2 000 53 49Sishen South Mining (Pty) Limited RSA A 1Taurus Marine Limited CMN S 1 000Ticor Limited (effectively 51,38%) AUS A 420 679 000 67Ticor Chemical Company (Pty) Limited (effectively 51,38%) AUS M 10Crisa (Pty) Limited (effectively 51,38%) AUS C 10Bertini (Pty) Limited (effectively 51,38%) AUS C 10Ticor Chemicals Ghana (Pty) Limited(indirect 51,38%) GHANA C 10Omacor Sac (effectively 51,38%) PERU C 10
Issuedcapital –
Country unlistedof incor- Nature of ordinary Interest of companyporation2 business3 shares Investment in shares Indebtedness
2003 2002 2003 2002R R R Rm Rm

143
INDIRECT INVESTMENTS (continued)Ticor Resources (Pty) Limited (effectively 51,38%) AUS H 180 337 136Magnetic Minerals Limited (effectively 51,38%) AUS A 31 740 964TiO2 Corporation NL (effectively 51,38%) AUS A 85 101 240Tific (Pty) Limited (effectively 51,38%) AUS H 10Yalgoo Minerals (Pty) Limited (effectively 51,38%) AUS H 48 216 010Pigment Holdings (Pty) Limited (effectively 51,38%) AUS C 10Synthetic Rutile Holdings (Pty) Limited (effectively 51,38%) AUS C 10Senbar Holdings (Pty) Limited (effectively 51,38%) AUS C 10Ticor (Overseas) Holdings (Pty) Limited (effectively 51,38%) AUS H 10Ticor Titanium Australia (Pty) Limited (effectively 51,38%) AUS H 10Rocit Investments (Pty) Limited (effectively 51,38%) RSA H 3 157 714Ticor (Bermuda) Holdings Limited (effectively 51,38%) BER H 74 836Ticor (Bermuda) Minerals Limited (effectively 51,38%) BER H 74 836Ticor Finance (A.C.T.) (Pty) Limited (effectively 51,38%) AUS F 10Ticor Energy (Pty) Limited (effectively 51,38%) AUS F 10The Durban Navigation Collieries (Pty) Limited RSA A 516 000 (17) (17)The Vryheid (Natal) Railway Coal andIron Company Limited RSA A 3 675 3 2Trojan Bulk Shipping Limited CMN S 1 000Tshikondeni Mining Company (Pty) Limited RSA A 2ZnERGY (Pty) Limited (85%) RSA M 240
TOTAL INVESTMENTS IN SUBSIDIARIES (note 12) 1 385 968 540 1 185 016 355 2 772 2 547
1. At 100% holding except where otherwise indicated.2. RSA – Republic of South Africa, AUS – Australia, NAM – Namibia, DRC – Democratic Republic of Congo, MOZ – Mozambique, HK – Hong Kong, UK – United Kingdom,
NV – Netherlands Antilles, BVI – British Virgin Islands, CMN – Cayman Islands, IRL – Ireland, JRS – Jersey, MAU – Mauritius, NE – Netherlands, BER – Bermuda.3. A – Mining, B – Property, C – Service, D – Land management, F – Finance, H – Holdings, M – Manufacturing, S – Shipping.4. Previously Kumba Base Metals Limited.5. Previously IHM Heavy Minerals (Pty) Limited.6. Previously Zinc Corporation of SA Limited.7. Previously Vicva Investments Fifty Nine (Pty) Limited.8. Previously Vicva Investments Sixty Six (Pty) Limited.9. Previously Vicva Investments Fifty Six (Pty) Limited.10. Previously Tiscor (Pty) Limited.
Issuedcapital –
Country unlistedof incor- Nature of ordinary Interest of companyporation2 business3 shares Investment in shares Indebtedness
2003 2002 2003 2002R R R Rm Rm
144 KUMBA FINANCIAL REPORTING 2003
Notice of annual general meeting
Notice is hereby given that the third annual general meeting of
members of Kumba Resources Limited will be held at the
Kumba Corporate Centre, Roger Dyason Road, Pretoria West,
South Africa, at 14:30 on Wednesday, 19 November 2003 for
the following business:
ORDINARY BUSINESS1. To receive and adopt the annual financial statements for
the year ended 30 June 2003, including the directors’
report and the report of the auditors.
2. To re-elect the following directors of the company in
accordance with the provisions of the articles of association:
Ms MLD Marole, Messrs BE Davison, GS Gouws, AJ Morgan
and Professor NS Segal.
3. To approve the remuneration of the non-executive directors
for the year ended 30 June 2003.
4. To approve the following annual fees as the maximum
non-executive directors’ remuneration for the period
1 July 2003 to 30 June 2004:
Chairman: R250 000
Director: R125 000
Audit committee chairman: R 80 000
Audit committee member: R 40 000
Board committee chairman: R 60 000
Board committee member: R 30 000
5. To authorise the directors to determine the auditors’ fees
for the year ended 30 June 2003.
6. To consider and, if thought fit, to pass, with or without
modification, the following resolution as an ordinary resolution:
“That subject to the provisions of the Companies Act 61 of
1973, as amended (the Act), and the Listings
Requirements of the JSE Securities Exchange South Africa
(JSE), the directors are hereby authorised to allot and issue
at their discretion all the remaining authorised but
unissued ordinary shares of one cent each in the capital of
the company for such purposes as they may determine,
after setting aside so many shares as may be required to be
allotted and issued by the company pursuant to the share
incentive scheme (the scheme).”
7. To consider and, if thought fit, to pass, with or without
modification, the following resolution as an ordinary resolution:
“That in terms of the Listings Requirements of the JSE, the
directors are hereby authorised to issue the unissued
ordinary shares of one cent each in the capital of the
company, after setting aside so many shares as may be
required to be allotted and issued by the company pursuant
to the scheme for cash, without restrictions to any public
shareholder, as defined by the Listings Requirements of the
JSE, as and when suitable opportunities arise, subject to
the following conditions:
7.1 that this authority will only be valid until the next
annual general meeting but will not extend beyond 15
months from the date of this general meeting;
7.2 that a paid press announcement giving full details,
including the impact on net asset value and earnings
per share, be published after any issue representing,
on a cumulative basis within one financial year, 5% or
more of the number of shares in issue prior to the
issue concerned;
7.3 that the issues in the aggregate in any one financial
year will not exceed 15% of the number of shares of
the company’s issued ordinary share capital; and
7.4 that, in determining the price at which an issue of
shares for cash will be made in terms of this authority,
the maximum discount permitted will be 10% of the
weighted average traded price of the ordinary shares
on the JSE (adjusted for any dividend declared but not
yet paid or for any capitalisation award made to
shareholders) over the 30 business days prior to the
date that the price of the issue is determined or
agreed by the directors of the company.”
A 75% majority is required of the votes cast by shareholders
present or represented by a proxy at the meeting for the
approval of this ordinary resolution.
SPECIAL BUSINESS8. To consider and, if thought fit, to pass, with or without
modification, the following resolution as a special resolution:
“That by way of a general authority, the company; and any
of its subsidiaries from time to time through their directors,
being authorised thereto in terms of the articles of association
of the company and the subsidiaries respectively, are
authorised in terms of sections 85 and 89 of the Act, and the
Listings Requirements of the JSE, to acquire from time to
time shares issued by the company, provided that:
8.1 any such acquisition of shares will be implemented on
the JSE (the open market);
8.2 this approval will be valid only until the next annual
general meeting of the company; and will not extend
beyond 15 months from the date of this general

145
meeting; and may be varied or revoked by special
resolution by any general meeting of the company at
any time prior to such annual general meeting;
8.3 an announcement containing full details of such
acquisition will be published as soon as the company,
or the subsidiaries respectively, have acquired shares
issued by the company constituting, on a cumulative
basis, not less than 3% of the number of shares in
the company in issue as at the date of this approval;
and an announcement will be published in respect
of each subsequent acquisition by either the company
or by the subsidiaries respectively, as the case may
be, of shares issued by the company, constituting, on
a cumulative basis, not less than 3% of the number
of shares in the company in issue as at the date of
this approval;
8.4 the company and its subsidiaries respectively will not
be entitled to acquire shares issued by the company
constituting, on a cumulative basis, more than 20% of
the number of shares in the company in issue as at the
date of this approval; and
8.5 shares issued by the company may not be acquired at
a price greater than 10% above the weighted average
traded price of the company’s shares for the five
business days immediately preceding the date of the
relevant acquisition.
9. To transact such other business as may be transacted at an
annual general meeting.
The reasons for and the effects of the resolutions are set out
in the explanatory notes that form part of this notice.
By order of the board
MS Viljoen
Company Secretary
30 September 2003
NOTESFORMS OF PROXY/VOTING INSTRUCTION FORMS
Kumba shareholders
A member entitled to attend and vote at the annual general
meeting may appoint one or more proxies to attend, speak and,
on a poll, vote in his/her stead. A proxy need not be a member
of the company. A form of proxy, as well as a voting instruction
form, accompany this notice. The transfer secretaries must
receive duly completed forms of proxy not less than 48 hours
before the time of meeting. The attention of shareholders is
directed to the additional notes contained in the forms of
proxy, relating to the completion and timeous submission of
forms of proxy.
Members who have already appointed a CSDP (Central
Securities Depositary Participant) or broker may use the
enclosed voting instruction form for the purpose of advising
their CSDP or broker of their voting instructions. Members
should contact their CSDP or broker with regard to the cut-off
time for lodging of voting instruction forms. If, however, such
members wish to attend the annual general meeting in person,
they will need to request their CSDP or broker to provide them
with the necessary authority in terms of the custody agreement
entered into between the shareholder and the CSDP or broker.
Should members require assistance in appointing a CSDP or a
broker to hold the electronic shareholding balances, and settle or
receive money or shares on their behalf, the company’s transfer
secretaries can be contacted for assistance in this regard.
ADR holders
Kumba has an Over-the-Counter American Depositary Receipt
(ADR) facility with The Bank of New York (BoNY) under a
deposit agreement.
ADR holders may instruct BoNY as to how the shares
represented by their ADRs should be voted.
Enquiries
Computershare (Pty) Ltd
www.computershare.com, +27 (0)11 370 5000
American Depositary Receipt Facility (ADR)
www.adrbny.com, [email protected]
+(1) 888 269 2377

146 KUMBA FINANCIAL REPORTING 2003
Notice of annual general meeting (continued)
SPECIAL BUSINESSSPECIAL RESOLUTION: GENERAL AUTHORITY TO
PERMIT THE REPURCHASE OF SHARES
The reason for the special resolution is to grant the directors
of the company a general authority for the acquisition of the
company’s shares by the company, or a subsidiary of the
company.
The effect of the special resolution will be to authorise the
directors of the company to procure that the company or any of
its subsidiaries may purchase shares issued by the company.
The directors, after considering the effect of a repurchase, up
to the maximum limit, of the company's issued shares, are of
the opinion that if such repurchases were implemented:
• the company and the group will be able in the ordinary
course of business to pay its debts for a period of
12 months after the date of the notice issued in respect of
the annual general meeting;
• the assets of the company and the group will be in excess
of the liabilities of the company and the group for a period
of 12 months after the date of the notice issued in respect
of the annual general meeting. For this purpose, the assets
and liabilities will be recognised and measured in
accordance with the accounting policies used in the latest
audited group annual financial statements;
• the share capital and reserves of the company and the group
will be adequate for a period of 12 months after the date of
notice issued in respect of the annual general meeting; and
• the working capital of the company and the group will be
adequate for a period of 12 months after the date of notice
issued in respect of the annual general meeting.
The sponsor’s working capital letter in terms of section 2.12 of
the Listings Requirements of the JSE, shall be submitted prior
to the date upon which the company enters into the market.
At the present time the directors have no specific intention
with regard to the utilisation of this authority, which will only
be used if the circumstances are appropriate.
EXPLANATORY NOTES TO RESOLUTIONSFOR CONSIDERATION AT THE ANNUALGENERAL MEETINGORDINARY BUSINESS
RESOLUTION 1: CONSIDERATION OF ANNUAL FINANCIAL
STATEMENTS
The directors must present to shareholders at the annual general
meeting the annual financial statements incorporating the
directors’ report and the report of the auditors, for the year ended
30 June 2003. These are contained within the annual report.
RESOLUTION 2: RE-ELECTION OF DIRECTORS
Under the articles of association, one third of the directors are
required to retire at each annual general meeting and may offer
themselves for re-election. In addition, any person appointed to
fill a casual vacancy on the board of directors, or as an addition
thereto, is similarly required to retire and is eligible for re-
election at the next annual general meeting. Biographical
details of the directors who retire and, being eligible, are
offering themselves for re-election appear on page 147.
RESOLUTION 3 AND 4: REMUNERATION OF NON-
EXECUTIVE DIRECTORS
Unless the remuneration has been determined at a previous
meeting for a number of years, the company in general
meeting as per the articles of association shall from time to
time determine the remuneration of directors.
RESOLUTION 5: AUDITORS’ FEES
It is usual for this matter to be left to the directors, as they will
be conversant with the amount of work that was involved in the
audit. The chairman will therefore move a resolution to this
effect authorising the directors to attend to this matter.
RESOLUTIONS 6 AND 7: DIRECTORS’ CONTROL OF
UNISSUED ORDINARY SHARES
The existing authorities relating to resolutions 6 and 7 are due
to expire at the forthcoming annual general meeting, unless
renewed. The directors consider it advantageous to renew these
authorities to enable the company to take advantage of business
opportunities which might arise in the future.

147
Short biographies of Kumba directors seeking re-electionName: Marion Lesego Dawn Marole (43)
Academic qualifications: BCom, DTE, MBA North Eastern University Boston, USA.
Experience: Dawn worked as auditor for the Bophuthatswana Government Auditor-General department. In 1984, she joined SetlogeloTechnikon as lecturer. Since 1995, she has held various posts with the Development Bank of Southern Africa, Nedbank in thecorporate credit department and was a founder executive director of Thebe Health Care. She joined Fabcos Investment Holdings in1999 and acted as deputy chief executive officer of Fabvest Investment Holdings until August 2003.
Current directorships: Tsogo Sun Investment Limited, Tsogo Investment (Pty) Limited, Premier Foods (Pty) Limited, Anchor YeastZimbabwe (Pty) Limited.
Name: Barry Erskine Davison (58)
Academic qualifications: BA (Wits), Graduates Commerce diploma (Birmingham University), Advanced CIS diploma, AdvancedExecutives Programme (UNISA).
Occupation: Chairman of Anglo American Platinum Corporation Limited, president of the Chamber of Mines of South Africa and anon-executive director of Nedcor Ltd and Nedbank Ltd.
Experience: Barry was Anglo Platinum’s chief executive from 1997 until June 2003. In 1986 he joined the board of Anglo AmericanCorporation of South Africa Limited. Appointed to Anglo American Plc board on 15 May 2001. He has extensive mining industryexperience, with a career starting at Johannesburg Consolidated Investment Company Limited, Consolidated Metallurgical IndustriesLimited, Consolidated Murchison Limited and Rustenburg Platinum Mines Limited.
Current directorships: Anglo American Plc, Anglo American Corporation of South Africa Limited, Anglo American Platinum CorporationLimited, Lebowa Platinum Mines Limited, Potgietersrust Platinum Limited, Rustenburg Platinum Mines Limited and Precious MetalsRefiners (Pty) Limited.
Name: Gert Stephanus Gouws (44)
Academic qualifications: BCom, BCom (Hons), CA(SA), FCMA, Advanced Management Programme (Insead).
Occupation: Executive vice-president and chief financial officer, Industrial Development Corporation SA Limited (IDC).Experience: Held various positions in the IDC since 1983.
Current directorships: IDC (alternate), Algorax (Pty) Limited (chairman), Atlantis Business Park (Pty) Limited (chairman),DMC Catalyst (Pty) Limited, The Export-Import Finance Corporation of South Africa, Findevco (Pty) Limited, Impofin (Pty) Limited,Kindoc Nominees (Pty) Limited, Konbel (Pty) Limited, Konoil (Pty) Limited, OMG Automotive Catalysts SA (Pty) Limited (chairman).
Name: Allen John Morgan (56)
Academic qualifications: BScB Eng (Electrical), Pr Eng.
Occupation: Director of companies.
Experience: Allen started his career as an electrical engineer with Eskom in 1971. He was promoted to regional manager of EskomOrange Free State in 1986. In 1988, he was appointed distribution division manager and, in the same year, he was promoted todeputy general manager, distribution and marketing. He was appointed to Eskom’s board in 1992 and served as executive directormarketing and electrification, executive director sales and customer service and Eskom chief executive (1994 – 2000).
Current directorships: Eskom Holdings Limited (non-executive director), Murray & Roberts Holdings Limited (non-executive director).
Name: Nick Saul Segal (63)
Academic qualifications: BSc (Eng), PhD (Phys Chem)(Rand), DPhil (Economics)(Oxon).
Occupation: Director of the Graduate School of Business, University of Cape Town.
Experience: From 1970 to 1974, Nick was employed by the World Bank as the senior economist on India. In 1978, he joined Coopers& Lybrand in the city of London as associate director. He founded international economic and public policy consultants, Segal QuinceWicksteed Limited in 1983 in the UK. In 1992, he joined JCI Limited as group consultant, becoming a director in 1995. From 1997to 1998, he served as an executive director of Anglovaal Limited. In 1999, he took up the position of director of the Graduate Schoolof Business, University of Cape Town. He was president of the Chamber of Mines (1996-97), deputy chair of the organised businessrepresentative body, Business South Africa (1996-98), a member of the Presidential Labour Market Commission (1995-96), and amember of the Council on Higher Education (1998-2002).

148 KUMBA FINANCIAL REPORTING 2003
Kumba administration
Secretary and registered office
MS Viljoen
Kumba Resources Limited
Roger Dyason Road
Pretoria West, Pretoria, 0002
(PO Box 9229, Pretoria, 0001, South Africa)
Company registration number: 2000/011076/06
Share code: KMB
ISIN code: ZAE000034310
Auditors
KPMG Inc
KPMG Crescent
85 Empire Road
Parktown, 2193
Commercial bankers
Absa Bank Limited
Corporate law advisers
CLS Consulting Services (Pty) Limited
United States ADR Depositary
The Bank of New York
ADR Department
101 Barclay Street
New York, NY 10286
United States of America
Sponsor
JP Morgan Equities Limited
1 Fricker Road
Illovo
Johannesburg, 2196
Transfer secretaries
Computershare (Pty) Limited
70 Marshall Street
Johannesburg, 2001
(PO Box 61051, Marshalltown, 2107)
Shareholders’ diary
FINANCIAL YEAR-END 30 June
ANNUAL GENERAL MEETING November
REPORTS AND ACCOUNTS Published
Interim report for the half-year ending 31 December February
Announcement of annual results August
Annual Report September
DISTRIBUTIONDividend declaration August
Payment September

149
ONLY FOR USE BY REGISTERED MEMBERS WHO HAVE APPOINTED A CENTRAL SECURITIES DEPOSITARYPARTICIPANT (CSDP) OR BROKER
For use in respect of the annual general meeting of the company to be held at 14:30 on Wednesday, 19 November 2003, at theKumba Corporate Centre, Roger Dyason Road, Pretoria West, South Africa, or at any adjournment thereof.
Members who have already appointed a CSDP or broker may use this form to advise their CSDP or broker of their voting instructionson the proposed resolutions in the spaces provided below. However, should such members wish to attend the annual general meetingin person, they will need to request their CSDP or broker to provide them with the necessary authority in terms of the custodyagreement entered into between the shareholders and the CSDP or broker.
I/We
being a member(s) of the company holding shares hereby indicate in the spaces provided below tomy/our CSDP/broker my/our voting instructions on the resolutions to be proposed at the annual general meeting of the company to beheld at 14:30 on Wednesday, 19 November 2003 or at any adjournment thereof:
VOTING INSTRUCTIONS
For Against Abstain
Ordinary businessResolution 1 – Adoption of 2003 audited financial statements
Resolution 2 – Re-election of directors
Ms MLD Marole
Mr BE Davison
Mr GS Gouws
Mr AJ Morgan
Professor NS Segal
Resolution 3 – Non-executive directors’ remuneration for the year ended 30 June 2003
Resolution 4 – Non-executive directors’ remuneration for the period 1 July 2003 to 30 June 2004
Resolution 5 – Directors’ authorisation to determine auditors’ fees for the year ended 30 June 2003
Resolution 6 – Directors’ authorisation to allot and issue unissued ordinary shares
Resolution 7 – Directors’ authorisation to allot and issue ordinary shares for cash
Special businessSpecial Resolution – Directors’ authorisation to repurchase shares
Signed at this day of 2003
Signature
Assisted by me, where applicable (name and signature)
Notes1. Please indicate in the appropriate spaces the number of votes to be cast. Each share carries the right to one vote.2. All the votes need not be exercised neither need all votes be cast in the same way, but the total of the votes cast and in respect
of which abstention is directed may not exceed the total of the votes exercisable.3. The signatory must initial any alteration or correction made to this voting instruction form.4. When there are joint holders of shares, any one holder may sign the voting instruction form.5. Completed voting instruction forms should be forwarded to the shareholder’s CSDP or broker. Members should contact their CSDP
or broker with regard to the cut-off time for lodging of voting instruction forms.
Voting instruction form KUMBA RESOURCES LIMITED(Incorporated in the Republic of South Africa)
(Registration No. 2000/011076/06)(Kumba or the company)
JSE share code: KMB
151
ONLY FOR USE BY REGISTERED MEMBERS WHO HAVE NOT APPOINTED A CENTRAL SECURITIESDEPOSITARY PARTICIPANT (CSDP) OR BROKER
For completion by registered members of Kumba unable to attend the annual general meeting of the company to be held at 14:30 onWednesday, 19 November 2003, at the Kumba Corporate Centre, Roger Dyason Road, Pretoria West, South Africa, or at anyadjournment thereof.I/We
of (address)
being the holder/s of shares in the company, do hereby appoint:
1 or, failing him/her
2 or, failing him/her
the chairman of the annual general meeting as my/our proxy to attend, speak and, on a poll, vote on my/our behalf at the annualgeneral meeting of members to be held on Wednesday, 19 November 2003 at 14:30, at Kumba Corporate Centre, Roger Dyason Road,Pretoria West, South Africa or at any adjournment, and to vote or abstain from voting as follows on the ordinary and special resolutionsto be proposed at such meeting:
For Against Abstain
Ordinary businessResolution 1 – Adoption of 2003 audited financial statements
Resolution 2 – Re-election of directors
Ms MLD Marole
Mr BE Davison
Mr GS Gouws
Mr AJ Morgan
Professor NS Segal
Resolution 3 – Non-executive directors’ remuneration for the year ended 30 June 2003
Resolution 4 – Non-executive directors’ remuneration for the period 1 July 2003 to 30 June 2004
Resolution 5 – Directors’ authorisation to determine auditors’ fees for the year ended 30 June 2003
Resolution 6 – Directors’ authorisation to allot and issue unissued ordinary shares
Resolution 7 – Directors’ authorisation to allot and issue ordinary shares for cash
Special businessSpecial Resolution – Directors’ authorisation to repurchase shares
Signed at this day of 2003
Signature
Assisted by me, where applicable (name and signature)
Notes1. By marking the appropriate spaces, the member acknowledges that the vote of his/her proxy may be exercised at the discretion of
the chairman.2. A member entitled to attend and vote at the annual general meeting may appoint a proxy or proxies to attend, speak and, on a poll,
vote in his/her stead. A proxy need not be a member of the company.3. Every person present and entitled to vote at the annual general meeting as a registered member or as a representative of a body
corporate will on a show of hands have one vote only, irrespective of the number of shares such person holds or represents, but inthe event of a poll, every share shall have one vote.
4. Forms of proxy must be lodged at, posted or faxed to Computershare (Pty) Ltd (+27 (0)11 370 5000), to be received not laterthan 48 hours before the time fixed for the meeting.
Form of proxy KUMBA RESOURCES LIMITED(Incorporated in the Republic of South Africa)
(Registration No. 2000/011076/06)(Kumba or the company)
JSE share code: KMB
Visit us at www.kumbaresources.com
G R A P H I C O R 2 9 1 8 4
Visit us at www.kumbaresources.com


