Harnessing the Wind: Recent Developments in Wind Energy Julie K. Lundquist Prof., University of Colorado at Boulder & Scientist, National Wind Technology Center, National Renewable Energy Laboratory Teaching About Energy in Geoscience Courses: Current Research and Pedagogy
Transcript
Harnessing the Wind: Recent Developments in Wind Energy
Julie K. Lundquist
Prof., University of Colorado at Boulder &
Scientist, National Wind Technology Center, National Renewable Energy Laboratory
Teaching About Energy in Geoscience Courses: Current Research and Pedagogy
30 October 2010
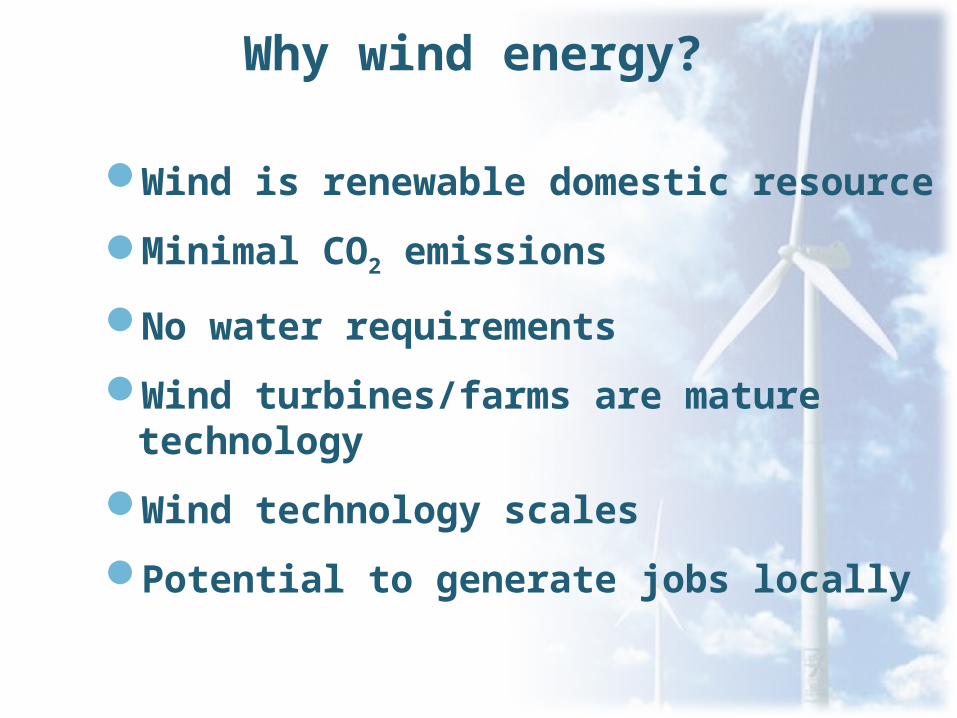
Wind is renewable domestic resource
Minimal CO2 emissions
No water requirements
Wind turbines/farms are mature technology
Wind technology scales
Potential to generate jobs locally
Why wind energy?
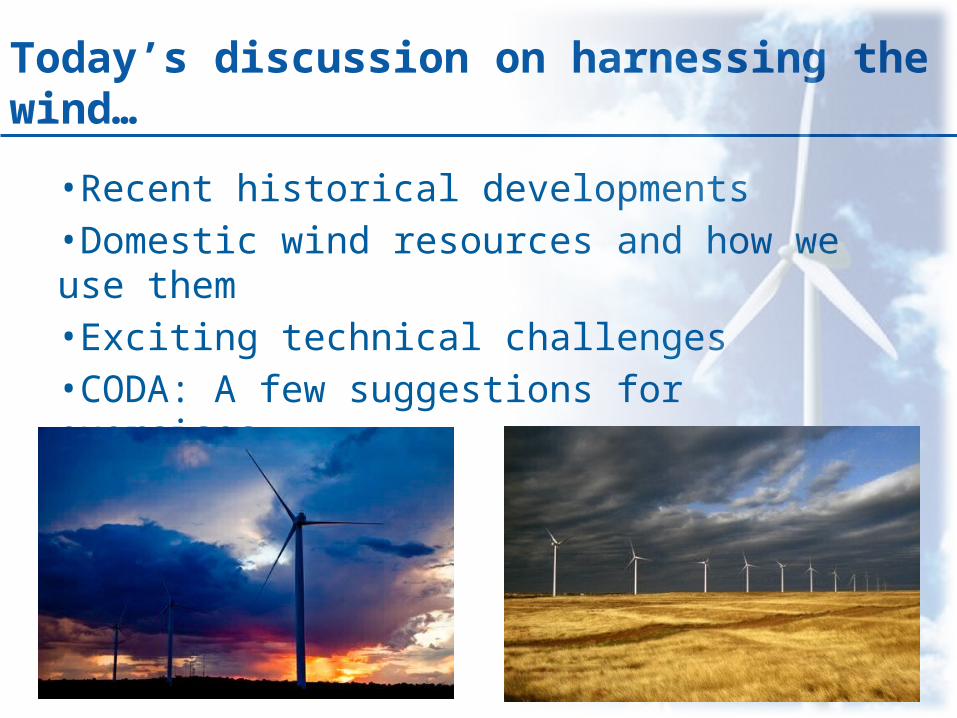
Today’s discussion on harnessing the wind…
•Recent historical developments•Domestic wind resources and how we use them•Exciting technical challenges•CODA: A few suggestions for exercises
Early electric wind turbines helped electrify remote farms in the early
1900’s
Figure courtesy Richard Lawrence & Joe Rand, www.kidwind.org
National Renewable Energy Laboratory Innovation for Our Energy Future
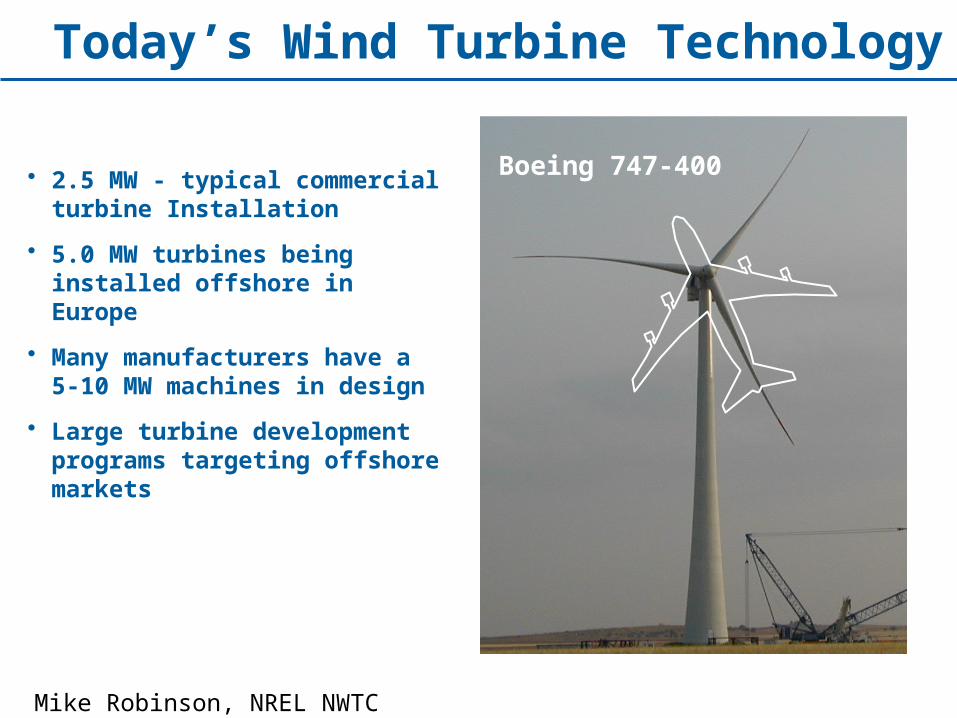
• 5.0 MW turbines being installed offshore in Europe
• Many manufacturers have a 5-10 MW machines in design
• Large turbine development programs targeting offshore markets
Today’s Wind Turbine Technology
Boeing 747-400
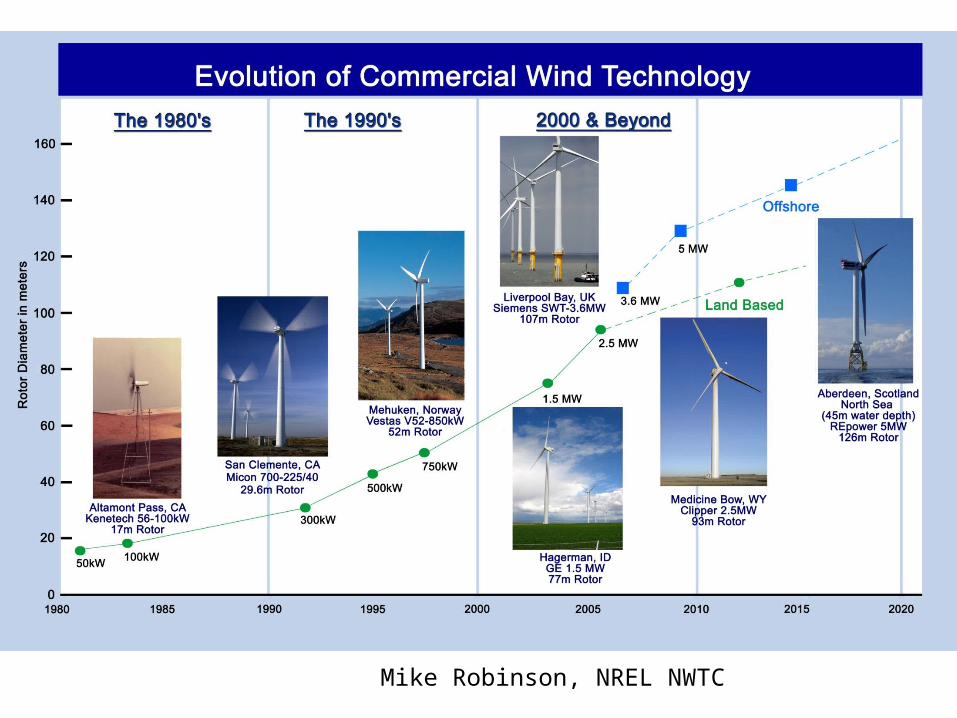
Mike Robinson, NREL NWTC
National Renewable Energy Laboratory Innovation for Our Energy Future
Jan 2009 Cumulative MW = 115,016
Rest of World = 23,711
North America = 27,416 MW
U.S 25,170 Canada 2,246
Europe = 63,889 MW
Growth of Wind Energy Capacity WorldwideM
W In
stalle
d
Sources: BTM World Market Update 2007; AWEA, January 2009; Windpower Monthly, January 2009
Pacific
Actual Projected
Pacific
Rest of the World Rest of the World
Asia Asia
North America North America
Europe Europe
EUUS
AsiaRest of the World
Pacific
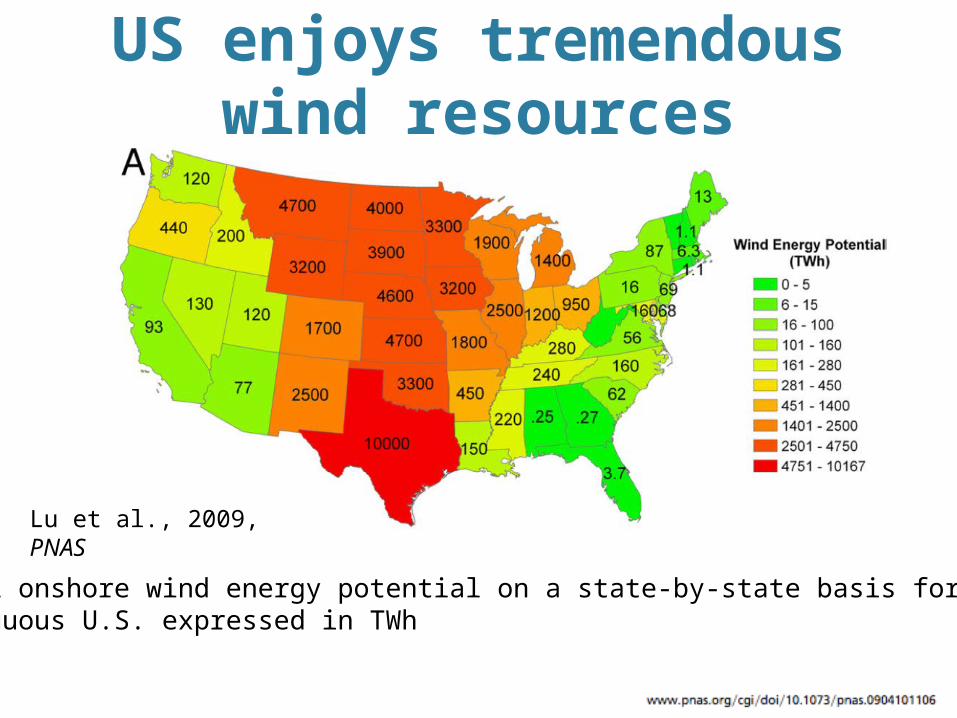
US enjoys tremendous wind resources
Lu et al., 2009, PNAS
Annual onshore wind energy potential on a state-by-state basis for the contiguous U.S. expressed in TWh
US enjoys tremendous wind resources
Lu et al., 2009, PNAS
Annual onshore wind energy potential on a state-by-state basis for the contiguous U.S. expressed as a ratio with respect to retail sales in the states in 2006.
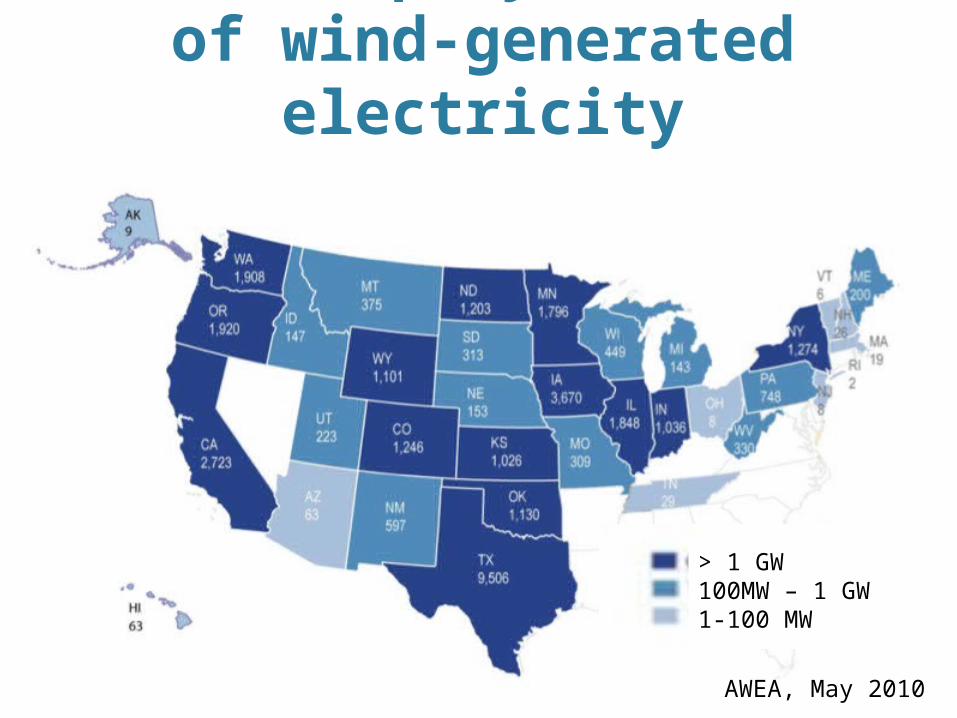
US has deployed > 36 GW of wind-generated
electricity
> 1 GW100MW – 1 GW1-100 MW
AWEA, May 2010
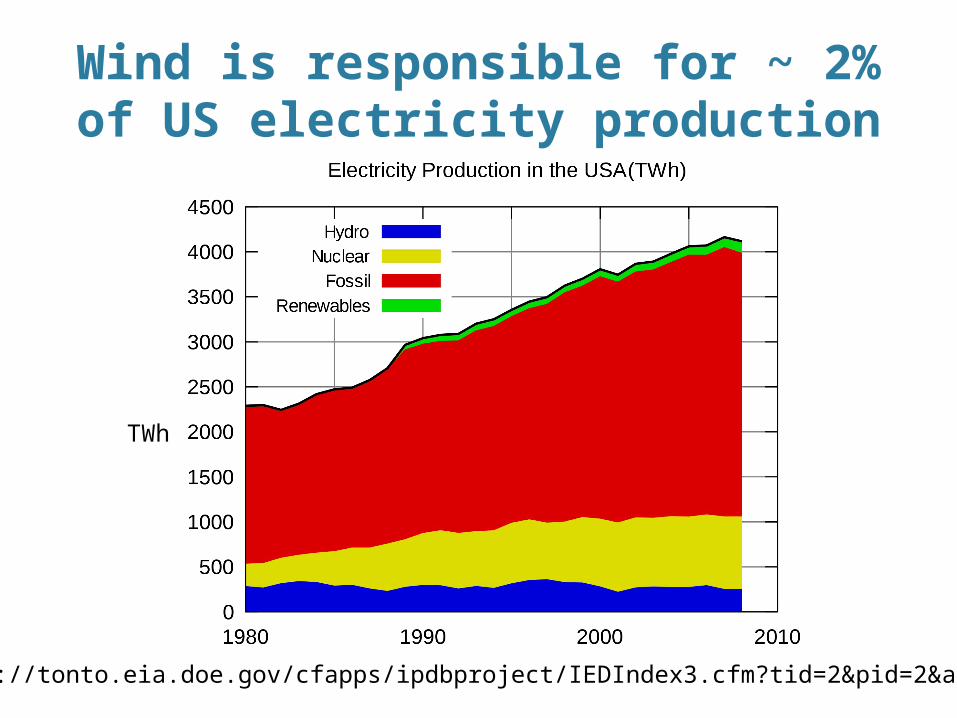
Wind is responsible for ~ 2% of US electricity production
of 2MW, hub height of 80 m and rotor diameter of about 80 m
Mark Z. Jacobson and Mark A. Delucchi, 2009: Evaluating the Feasibility of a Large-Scale Wind, Water, and Sun Energy Infrastructure.” Scientific American, October 26, 2009.
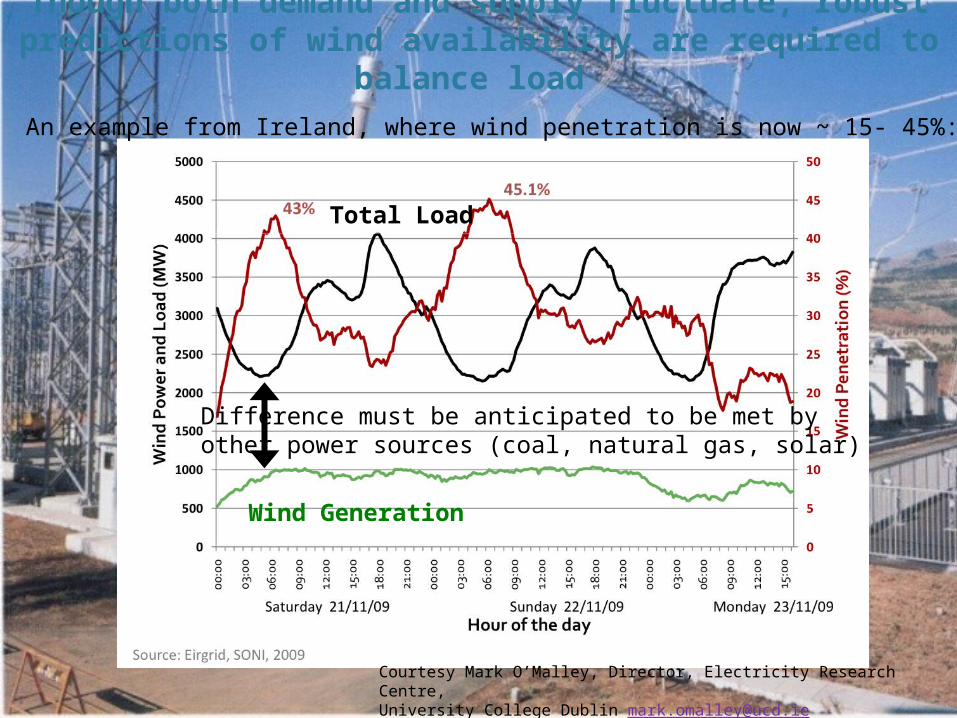
Could the grid be balanced with only renewables?
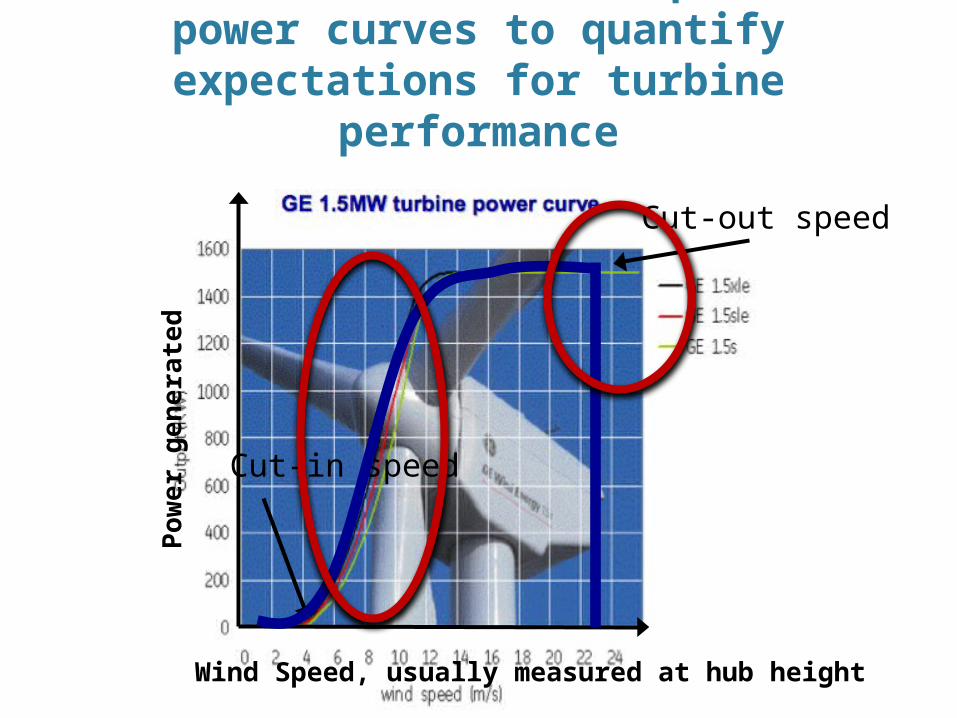
Turbine manufacturers provide power curves to quantify expectations for turbine
performance
Wind Speed, usually measured at hub height
Pow
er
gen
era
ted
Cut-in speed
Cut-out speed
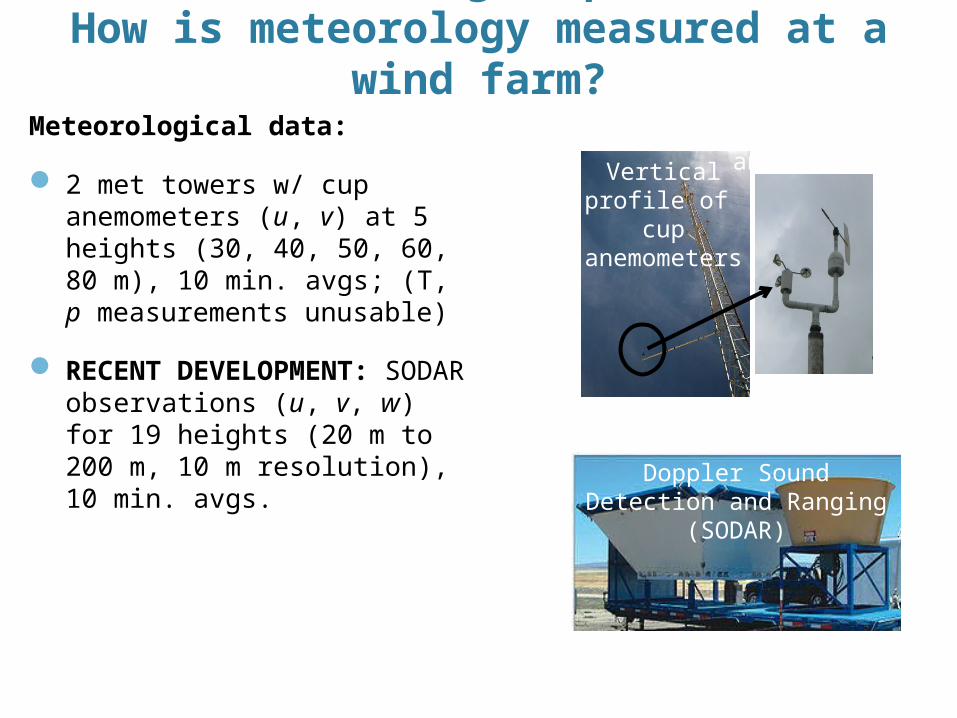
Power forecasting requires data – How is meteorology measured at a wind farm?
Meteorological data:
2 met towers w/ cup anemometers (u, v) at 5 heights (30, 40, 50, 60, 80 m), 10 min. avgs; (T, p measurements unusable)
RECENT DEVELOPMENT: SODAR observations (u, v, w) for 19 heights (20 m to 200 m, 10 m resolution), 10 min. avgs.
Vertical profile of
cup anemometer
s
Doppler Sound Detection and Ranging (SODAR)
sonic anemometer
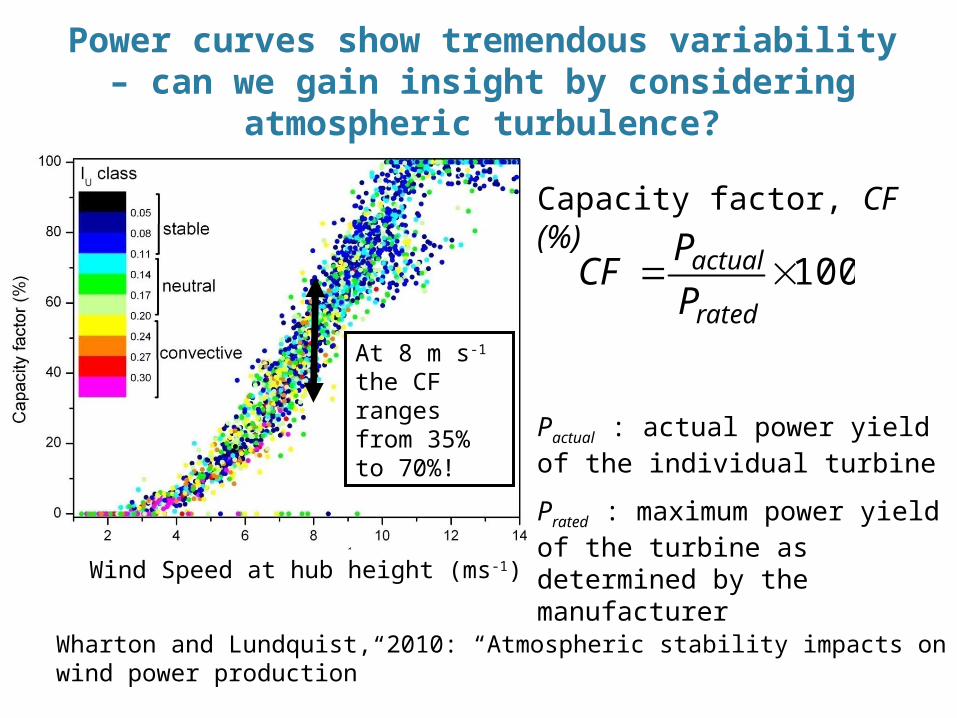
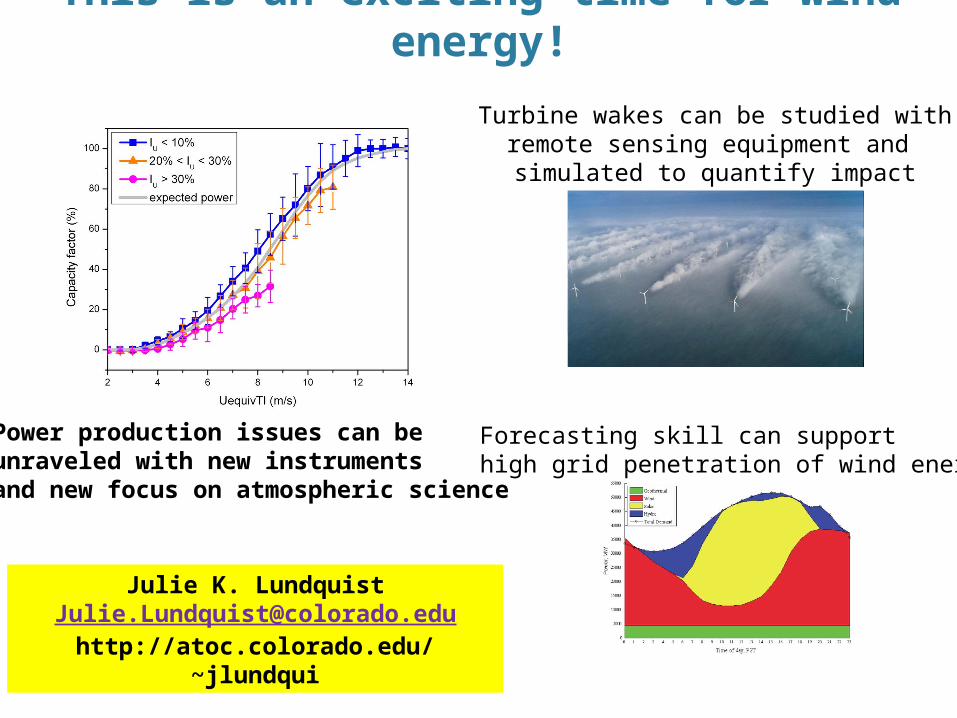
Power curves show tremendous variability – can we gain insight by considering atmospheric
turbulence?
Capacity factor, CF (%)
Pactual : actual power yield of the individual turbine
Prated : maximum power yield of the turbine as determined by the manufacturer
100rated
actual
P
PCF
At 8 m s-1
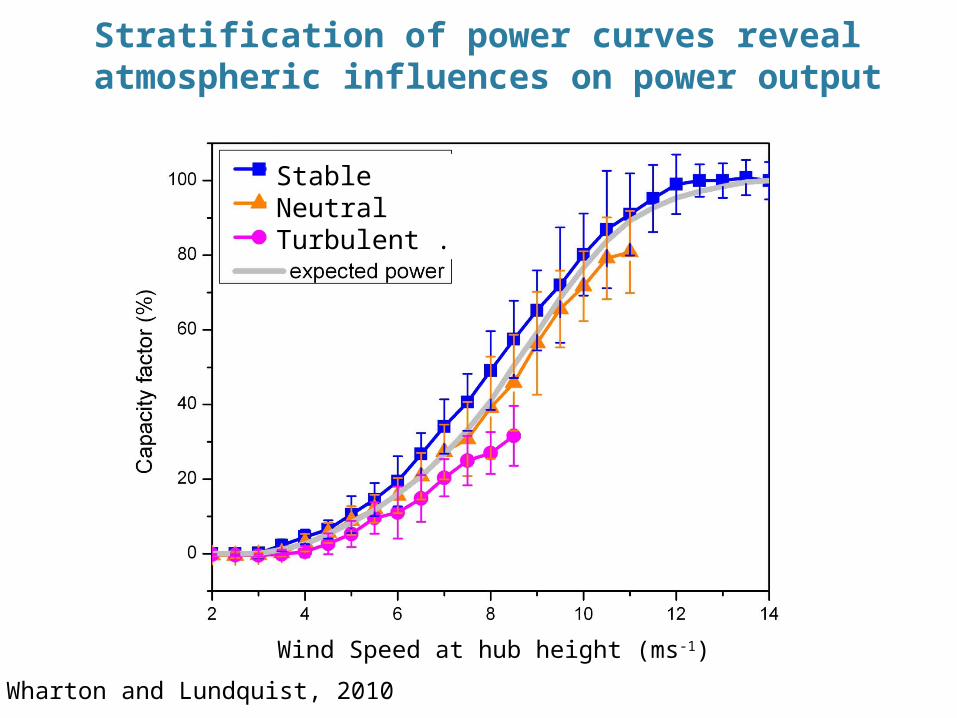
the CF ranges from 35% to 70%!
Wind Speed at hub height (ms-1)
Wharton and Lundquist, 2010: “Atmospheric stability impacts on wind power production”
Stratification of power curves reveal atmospheric influences on power output
Lawrence Livermore National Laboratory
Wind Speed at hub height (ms-1)
StableNeutralTurbulent .
Wharton and Lundquist, 2010
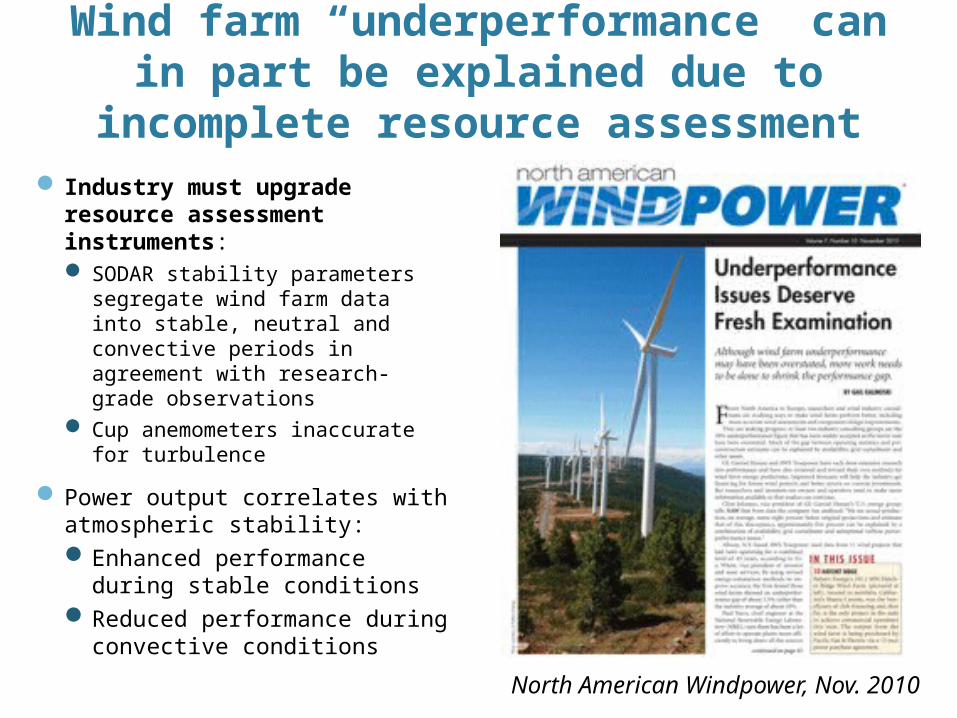
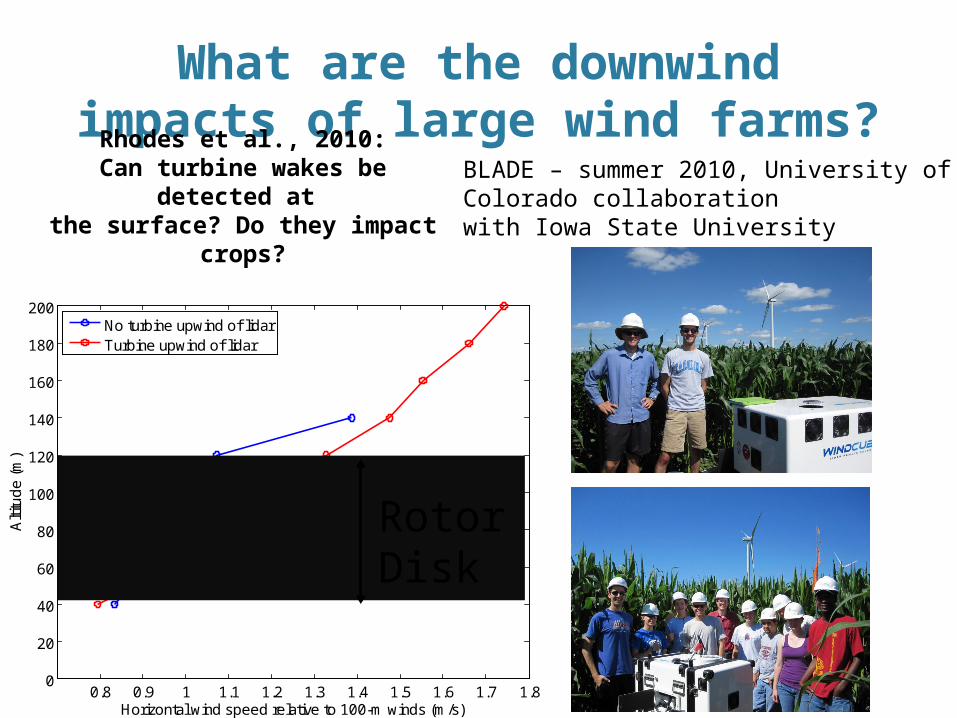
Wind farm “underperformance” can in part be explained due to incomplete