FEDERAL TRADE COMMISSION DEPARTMENT OF JUSTICE BUREAU OF COMPETITION ANTITRUST DIVISION hart-scott-rodino annual report Fiscal Year 2017 Section 7A of the Clayton Act Hart-Scott-Rodino Antitrust Improvements Act of 1976 (Fortieth Annual Report) Maureen K. Ohlhausen Makan Delrahim Acting Chairman Assistant Attorney General Federal Trade Commission Antitrust Division
Transcript
FEDERAL TRADE COMMISSION DEPARTMENT OF JUSTICE
BUREAU OF COMPETITION ANTITRUST DIVISION
hart-scott-rodino annual report Fiscal Year 2017
Section 7A of the Clayton Act Hart-Scott-Rodino Antitrust Improvements Act of 1976
(Fortieth Annual Report)
Maureen K Ohlhausen Makan DelrahimActing Chairman Assistant Attorney General
Federal Trade Commission Antitrust Division
INTRODUCTION
The Hart-Scott-Rodino Antitrust Improvements Act of 1976 Pub L No 94-435 (ldquoHSR Actrdquo or ldquothe Actrdquo) together with Section 13(b) of the Federal Trade Commission Act and Section 15 of the Clayton Act enables the Federal Trade Commission (ldquoFTCrdquo or ldquoCommissionrdquo) and the Antitrust Division of the Department of Justice (ldquoAntitrust Divisionrdquo or ldquoDivisionrdquo) to obtain effective preliminary relief against anticompetitive mergers and to prevent interim harm to competition and consumers The premerger notification program was instrumental in alerting the Commission and the Division to transactions that became the subjects of the numerous enforcement actions brought in fiscal year 20171 to protect consumersmdashindividual business and governmentmdashagainst anticompetitive mergers
The Commission and the Antitrust Division continue their efforts to protect competition by identifying and investigating those mergers and acquisitions that raise potentially significant competitive concerns In fiscal year 2017 2052 transactions were reported under the HSR Act representing about a 120 percent increase from the 1832 transactions reported in fiscal year 2016 (See Figure 1 below) Over the past five years the number of HSR reportable transactions has increased significantly ndash in FY2013 1326 HSR transactions were reported and in FY2017 2052 HSR transactions were reported an increase of over 50 This is in the face of flat or effectively decreasing budgets and restrictions on hiring
Num
ber of Transactions
HSR Merger Transactions Reported Fiscal Years 2008-2017
1 Fiscal year 2017 covered the period of October 1 2016 through September 30 2017
During fiscal year 2017 the Commission brought 21 merger enforcement challenges2 including 14 in which it accepted consent orders for public comment all of which resulted in final orders six in which the transaction was abandoned or restructured as a result of antitrust concerns raised during the investigation and one in which the Commission initiated administrative or federal court litigation These enforcement actions preserved competition in numerous sectors of the economy including consumer goods and services pharmaceuticals healthcare high tech and industrial goods and energy
Of note the Commission successfully concluded its merger challenge of DraftKings and FanDuel the two largest daily fantasy sports sites The Commission initiated an administrative action and together with attorney generals from six states sought a temporary restraining order and a preliminary injunction in federal court alleging that the combined firm would control more than 90 percent of the US market for paid daily fantasy sports contests Shortly after the Commission filed its complaint the parties abandoned the merger
Again this year most of the Commissionrsquos merger enforcement actions were resolved by a negotiated settlement For instance the Commission required divestitures to resolve competitive concerns arising from Sherwin-Williams Cos proposed $113 billion acquisition of Valspar Corporation The Commissions complaint alleged that the proposed acquisition would have reduced competition in the North American market for industrial wood coatings used to make furniture kitchen cabinets and building products where Sherwin-Williams and Valspar were two of the top three industrial wood coatings manufacturers The Commission also moved to preserve competition in local gasoline and diesel markets challenging Alimentation Couche-Tard Incrsquos proposed $44 billion acquisition of CST Brands Inc Alimentation Couche-Tard operates convenience stores and retail fuel stations worldwide including nearly 4700 in United States primarily under the Circle K and Kangaroo Express banners CST operates 1146 convenience stores and retail fuel stations in the United States under the Corner Store banner The Commissionrsquos order required divestitures in 71 local markets located in Arizona Colorado Florida Georgia Louisiana New Mexico Ohio and Texas
The Commission also took action to preserve competition in the worldwide market for fibre channel switches which are part of storage area networks that transfer data between servers and storage arrays in data centers To resolve concerns that semiconductor manufacturer Broadcom Limitedrsquos vertical acquisition of Brocade Communications Systems Inc would reduce competition or slow innovation for fibre channel switches the Commissionrsquos order prevents Broadcomrsquos business unit from sharing the confidential information of its customer Cisco Systems Inc with Brocade Ciscorsquos rival
During fiscal year 2017 the Antitrust Division challenged 18 merger transactions including 11 with filed complaints in US district court In nine of these 11 the Division simultaneously filed a proposed settlement In the remaining two the complaint was initiated as litigation In six of the remaining challenges the parties abandoned the proposed transaction and in the last the parties restructured the transaction to resolve the Divisionrsquos concerns
2 To avoid double-counting this Report includes only those merger enforcement actions in which the Commission or the Antitrust Division took its first public action during fiscal year 2017
2
In one of the two filed litigation complaints the Division sued to block EnergySolutions Incrsquos (ES) proposed acquisition of Waste Control Specialists LLC from Andrews County Holdings Inc The US District Court for the District of Delaware found in favor of the Division and blocked ESrsquos proposed acquisition because the proposed merger would have substantially lessened competition in the markets for disposal of higher-activity low-level radioactive waste (LLRW) and lower-activity LLRW in violation of Section 7 of the Clayton Act The parties abandoned the transaction and agreed to reimburse the Division for more than $165000 in litigation costs
In two significant matters the Division challenged transactions where contractual relationships with a third-party not the partiesrsquo overlapping assets increased the likelihood that the proposed acquisitions would substantially lessen competition In the first the Division challenged Alaska Air Group Incrsquos proposed acquisition of Virgin America Inc because Alaskarsquos extensive codeshare relationship with American Airlines would have decreased Alaskarsquos incentive to compete against American post-merger on the routes on which Virgin and American competed Under the terms of the final judgment filed simultaneously with the complaint Alaska agreed to significantly reduce the scope of its codeshare agreement with American In the second matter the Division challenged Danone SArsquos acquisition of The WhiteWave Foods Company Inc Post-merger Danonersquos long-term strategic partnership and supply and licensing agreements with WhiteWaversquos primary competitor CROPP Cooperative would have provided incentives and opportunities for cooperative behavior between the two leading purchasers of raw organic milk in the northeastern United States and the producers of the only three national fluid organic milk brands Under the terms of the final judgment filed simultaneously with the complaint Danone agreed to divest its Stonyfield Farms business which included all its contracts with CROPP
The Divisionrsquos investigation also led to a competition-protecting outcome when Lam Research Corporation and KLA-Tencor Corporation abandoned their plans to merge In that matter the Division informed the parties that it had serious concerns about the impact the transaction would have on competition KLA-Tencorrsquos leading position in several semiconductor metrology and inspection markets could have allowed Lam Research to foreclose its competitors by reducing their timely access to key KLA-Tencor equipment and related services
Finally the Division reinforced the importance of partiesrsquo compliance with the terms of a proposed final judgment in its challenge to General Electric Corsquos (GE) proposed acquisition of Baker Hughes Inc Under the terms of a proposed final judgment filed simultaneously with the complaint GE agreed to divest its refinery process chemicals and services unit by the end of September 2017 or if it was granted an extension the end of 2017 However after it consummated its merger with Baker Hughes GE informed the United States that it would be unable to complete the divestiture by the agreed-upon deadline due to complications with international aspects of divestitures On October 16 2017 the court entered a modified final judgment that added two provisions imposing financial obligations upon GE including incentive payments to encourage quick divestiture and attorneysrsquo fees to the Division to cover the costs associated with modifying and enforcing the decree until the divestiture is completed
3
In fiscal year 2017 the Commissionrsquos Premerger Notification Office (PNO) continued to respond to thousands of questions seeking information about the reportability of transactions under the HSR Act and the details involved in completing and filing the Notification and Report Form (the filing form) The PNO continued to provide information necessary for the notification process on its PNO website3 which serves as a HSR practitionersrsquo primary source of information on the HSR form and instructions for completing the form rules current filing thresholds notices of grants of early termination filing fee instructions and procedures for submitting post-consummation filings The website also provides training materials for new practitioners information on scheduled HSR events frequently asked questions regarding HSR filing requirements and contact information for PNO staff In addition the website also includes a catalog of informal interpretation letters giving the public ready access to PNO staff interpretations of the HSR Act and rules Finally PNO staff continued to provide tips for HSR practitioners in blog posts on the Commissionrsquos Competition Matters blog4 As always PNO staff is available to help HSR practitioners comply with HSR notification requirements
BACKGROUND OF THE HSR ACT
Section 201 of the HSR Act amended the Clayton Act by adding a new Section 7A 15 USC sect 18a In general the HSR Act requires that certain proposed acquisitions of voting securities non-corporate interests or assets be reported to the Commission and the Antitrust Division prior to consummation The parties must then wait a specified period usually 30 days (or 15 days in the case of a cash tender offer or bankruptcy sale) before they may complete the transaction Whether a particular acquisition is subject to these requirements depends on the value of the acquisition and in certain acquisitions the size of the parties as measured by their sales and assets Acquisitions valued below a certain threshold acquisitions involving parties with assets and sales below a certain threshold and certain classes of acquisitions that are less likely to raise antitrust concerns are excluded from the Actrsquos coverage
The Commission with the concurrence of the Assistant Attorney General for the Antitrust Division promulgated final rules implementing the premerger notification program on July 31 1978 At that time a comprehensive Statement of Basis and Purpose also was published containing a section-by-section analysis of the rules and an item-by-item analysis of the filing form5 The program became effective on September 5 1978 The Commission with the concurrence of the Assistant Attorney General has amended the rules and the filing form on many occasions over the years to improve the programrsquos effectiveness and to lessen the burden of complying with the rules6
The primary purpose of the statutory scheme as the legislative history makes clear is to provide the antitrust enforcement agencies with the opportunity to review mergers and
3 See httpswwwftcgovenforcementpremerger-notification-program 4 See httpswwwftcgovnews-eventsblogsterms368 5 43 Fed Reg 33450 (July 31 1978) 6 See httpswwwftcgovenforcementpremerger-notification-programstatute-rules-and-formal-interpretationsstatements-basis-purpose
4
acquisitions before they occur The premerger notification program with its filing and waiting period requirements provides the agencies with both the time and the information necessary to conduct this antitrust review Much of the information for a preliminary antitrust evaluation is included in the notification filed with the agencies by the parties to the proposed transactions
If either reviewing agency determines during the waiting period that further inquiry is necessary the agency is authorized by Section 7A(e) of the Clayton Act to issue a request for additional information and documentary material (Second Request)7 The Second Request extends the waiting period for a specified period of time (usually 30 days but 10 days in the case of a cash tender offer or bankruptcy sale) after all parties have complied with the Second Request (or in the case of a tender offer or bankruptcy sale after the acquiring person complies) This additional time provides the reviewing agency with the opportunity to analyze the information and to take appropriate action before the transaction is consummated If the reviewing agency believes that a proposed transaction may substantially lessen competition it may seek an injunction in federal district court to prohibit consummation of the transaction The Commission also may challenge the transaction in administrative litigation
A STATISTICAL PROFILE OF THE PREMERGER NOTIFICATION PROGRAM
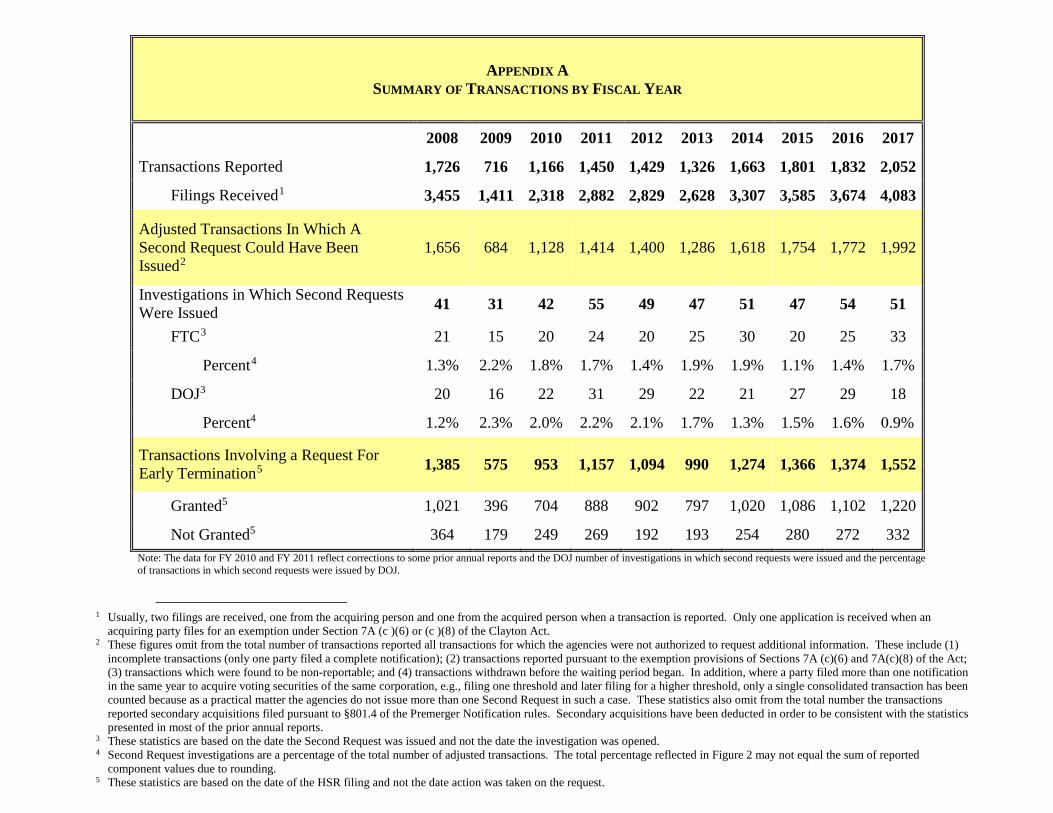
The appendices to this Report provide a statistical summary of the operation of the premerger notification program Appendix A shows for the ten-year period covering fiscal years 2008-2017 the number of transactions reported the number of filings received the number of merger investigations in which Second Requests were issued and the number of transactions in which requests for early termination of the waiting period were received granted and not granted8 Appendix A also shows the number of transactions in which Second Requests could have been issued as well as the percentage of transactions in which Second Requests were issued Appendix B provides a month-by-month comparison of the number of transactions reported and the number of filings received for fiscal years 2008 through 2017
The statistics set out in these appendices show that the number of transactions reported in fiscal year 2017 increased 120 percent from the number of transactions reported in fiscal year 2016 In fiscal year 2017 2052 transactions were reported while 1832 were reported in fiscal year 20169 The statistics in Appendix A also show that the number of merger investigations in which Second Requests were issued in fiscal year 2017 decreased from the previous year Second Requests were issued in 51 merger investigations in fiscal year 2017 (33 issued by the
7 15 USC sect18a(e)(1)(a) (ldquoThe Federal Trade Commission or the Assistant Attorney General may prior to the expiration of the 30-day waiting period (or in the case of a cash tender offer the 15-day waiting period)helliprequire the submission of additional information or documentary material relevant to the proposed acquisitionrdquo) 8 The term ldquotransactionrdquo as used in Appendices A and B and Exhibit A to this Report does not refer only to individual mergers or acquisitions A particular merger joint venture or acquisition may be structured such that it involves more than one filing that must be made under the HSR Act 9 This Report like previous Reports also includes annual data on ldquoadjusted transactions in which a Second Request could have been issuedrdquo (ldquoadjusted transactionsrdquo) See Appendix A amp Appendix A n2 (explaining calculation of that data) There were 1992 adjusted transactions in fiscal year 2017 and the data presented in the Tables and the percentages discussed in the text of this Report (eg percentage of transactions resulting in Second Requests) are based on this figure
5
~
~ ~ ~
-
LZ7 ~
~
~ - ~
~
-
-
-
-
-_I__ _I_ _ I _I_ ~7 -
FTC and 18 issued by the Antitrust Division) while Second Requests were issued in 54 merger investigations in fiscal year 2016 (25 issued by the FTC and 29 issued by the Antitrust Division) The percentage of transactions in which a Second Request was issued decreased from 30 percent in fiscal year 2016 to 26 percent in fiscal year 2017 See Figure 2 below
Percentage of Transactions Resulting in Second Request Fiscal Years 2008-2017
50
45
40
35
30
25
20
15
10
05
00
The statistics in Appendix A also show that early termination of the waiting period is requested in the majority of transactions In fiscal year 2017 early termination was requested in 779 percent (1552) of the adjusted transactions reported In fiscal year 2016 early termination was requested in 775 percent (1374) of the transactions reported The percentage of requests granted out of the total requested decreased from 802 percent in fiscal year 2016 to 786 percent in fiscal year 2017
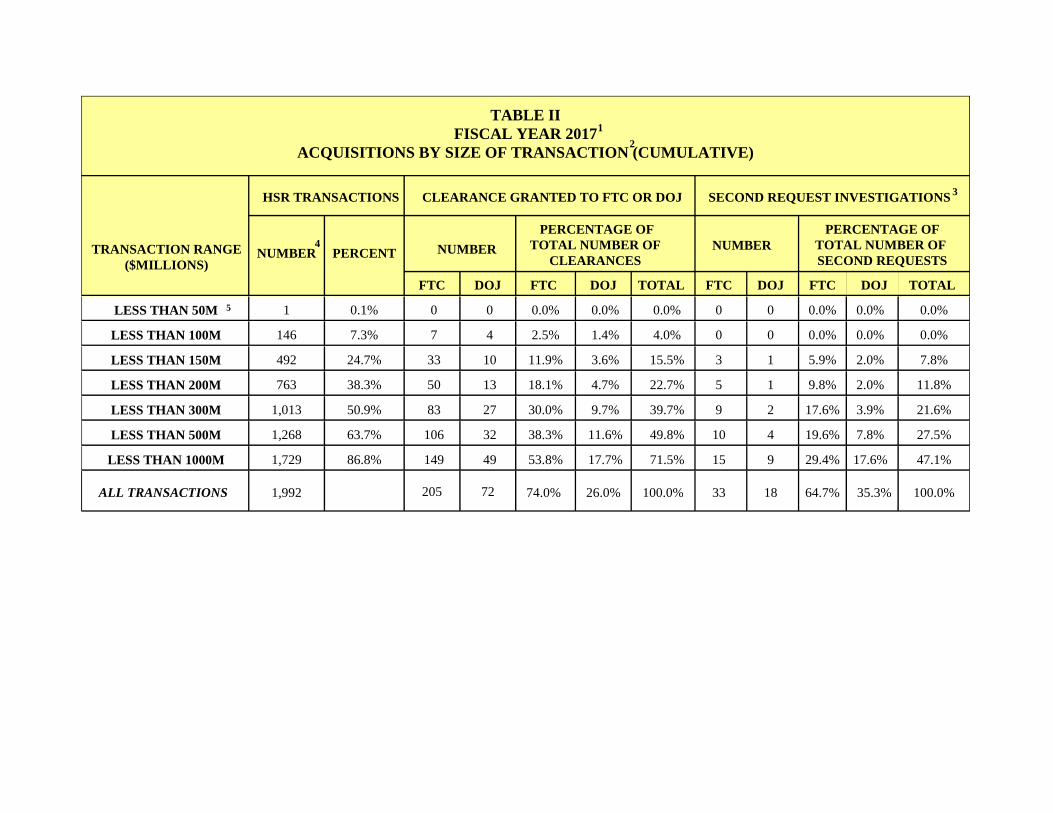
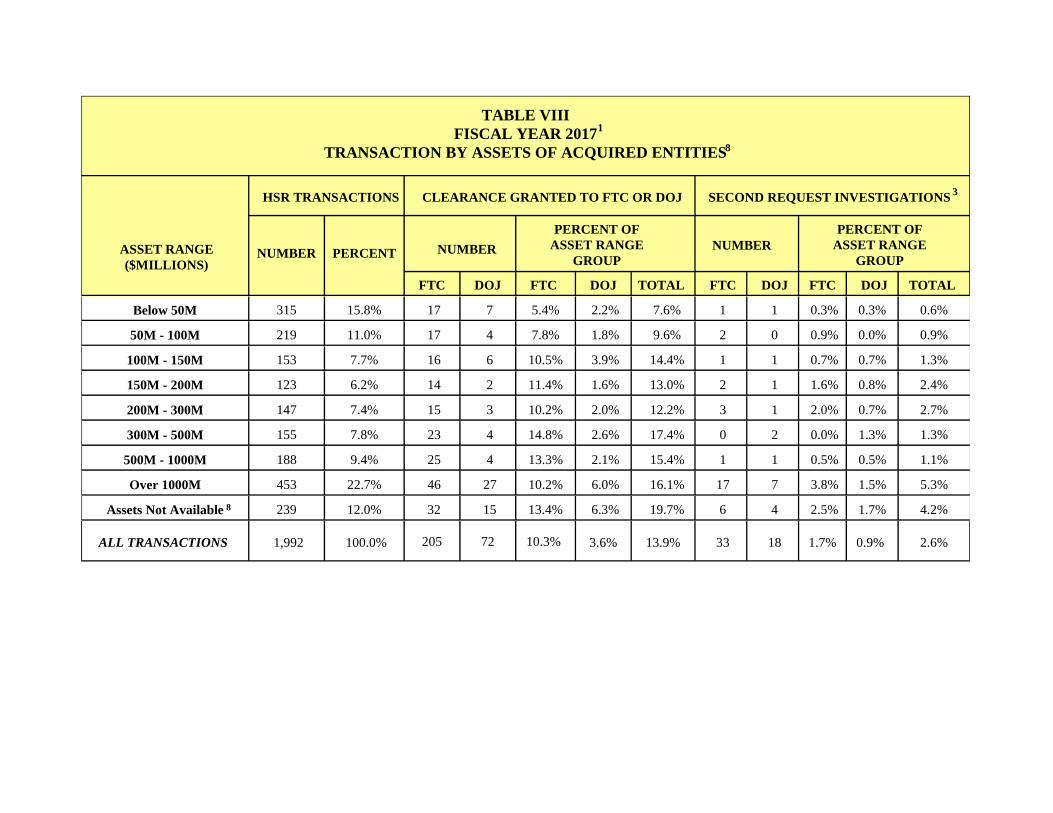
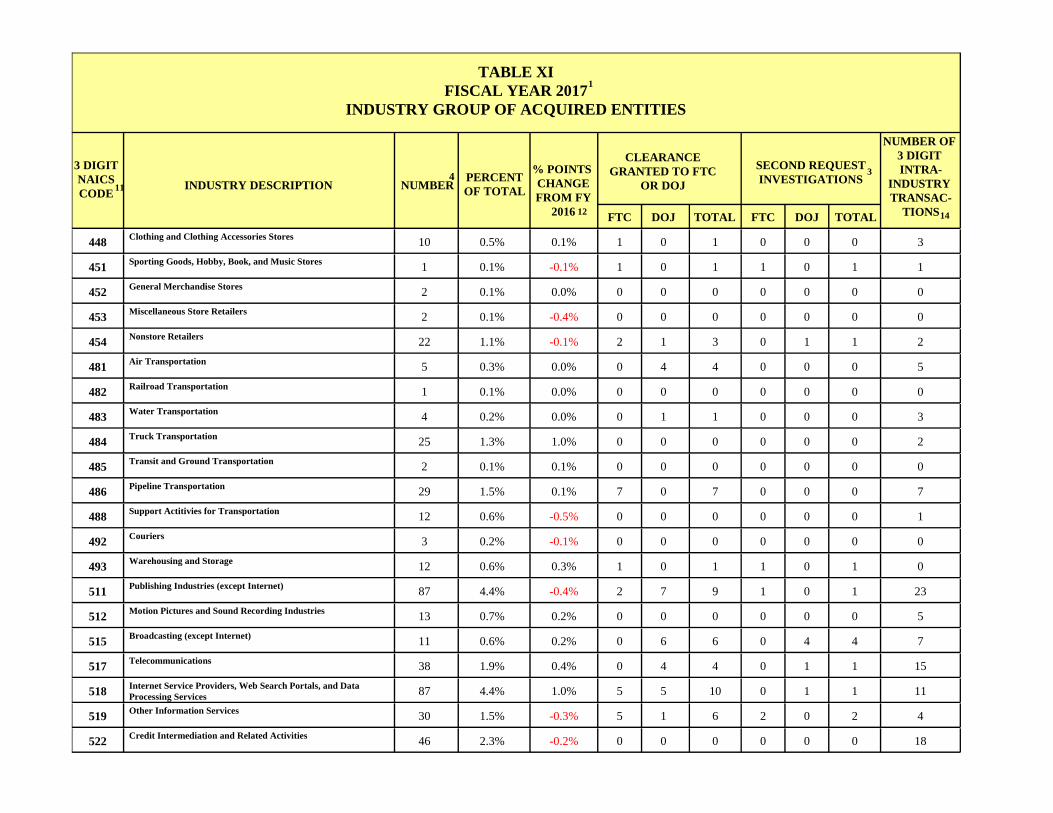
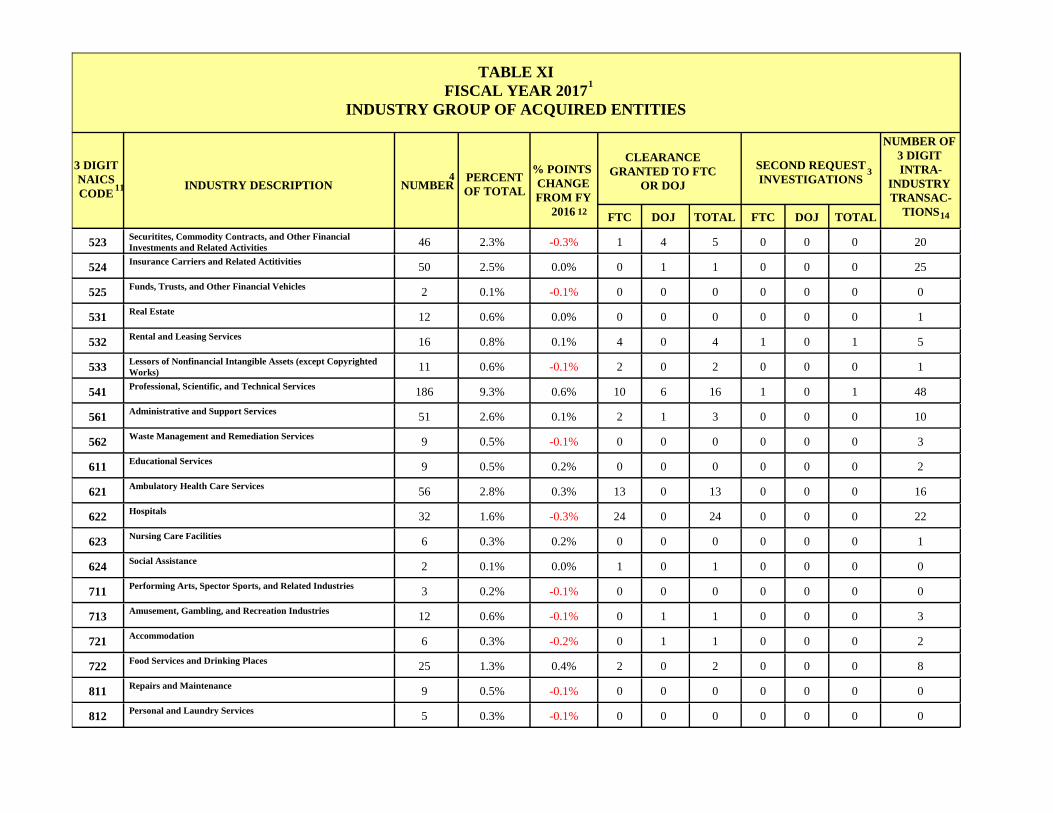
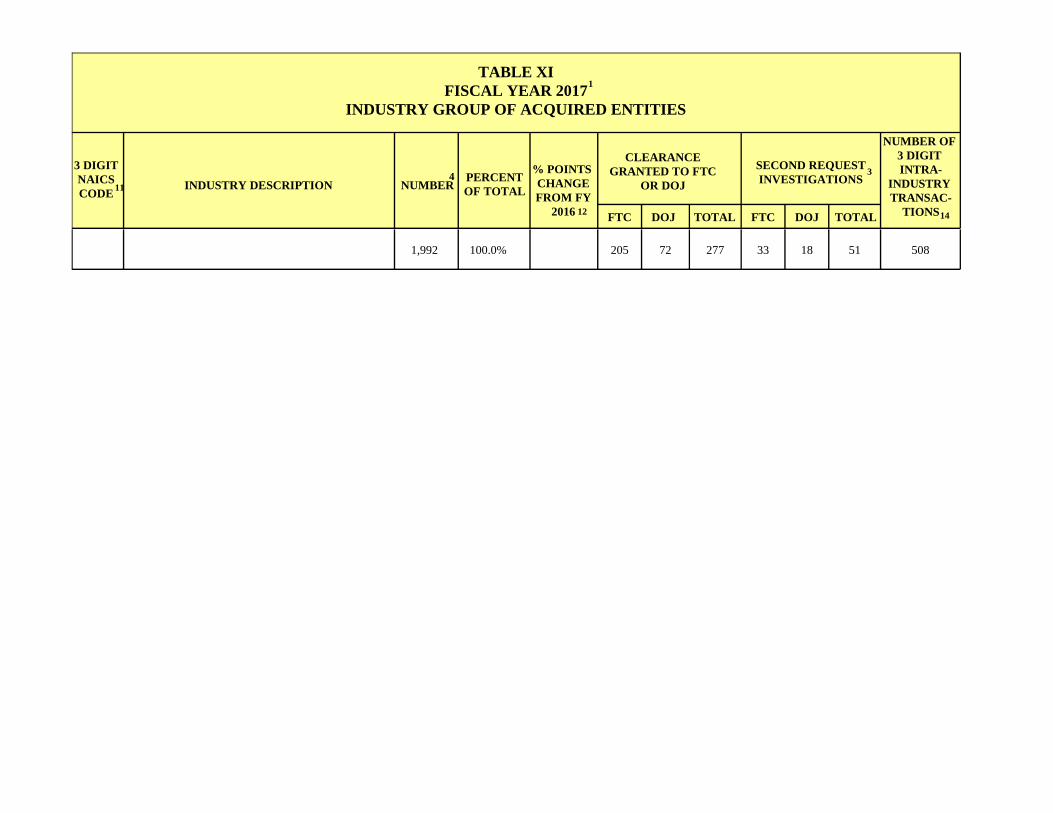
The tables (Tables I through XI) in Exhibit A contain information regarding the agenciesrsquo enforcement activities for transactions reported in fiscal year 2017 The tables provide for example various characteristics of transactions the number and percentage of transactions in which one antitrust agency granted the other clearance to commence an investigation and the number of merger investigations in which either agency issued Second Requests Table III of Exhibit A shows that in fiscal year 2017 the agencies received clearance to conduct an initial investigation in 139 percent of the total number of transactions reported The tables also provide the number of transactions based on the dollar value of transactions reported and the
reporting threshold indicated in the notification report In fiscal year 2017 the aggregate dollar value of reported transactions was $18 trillion10
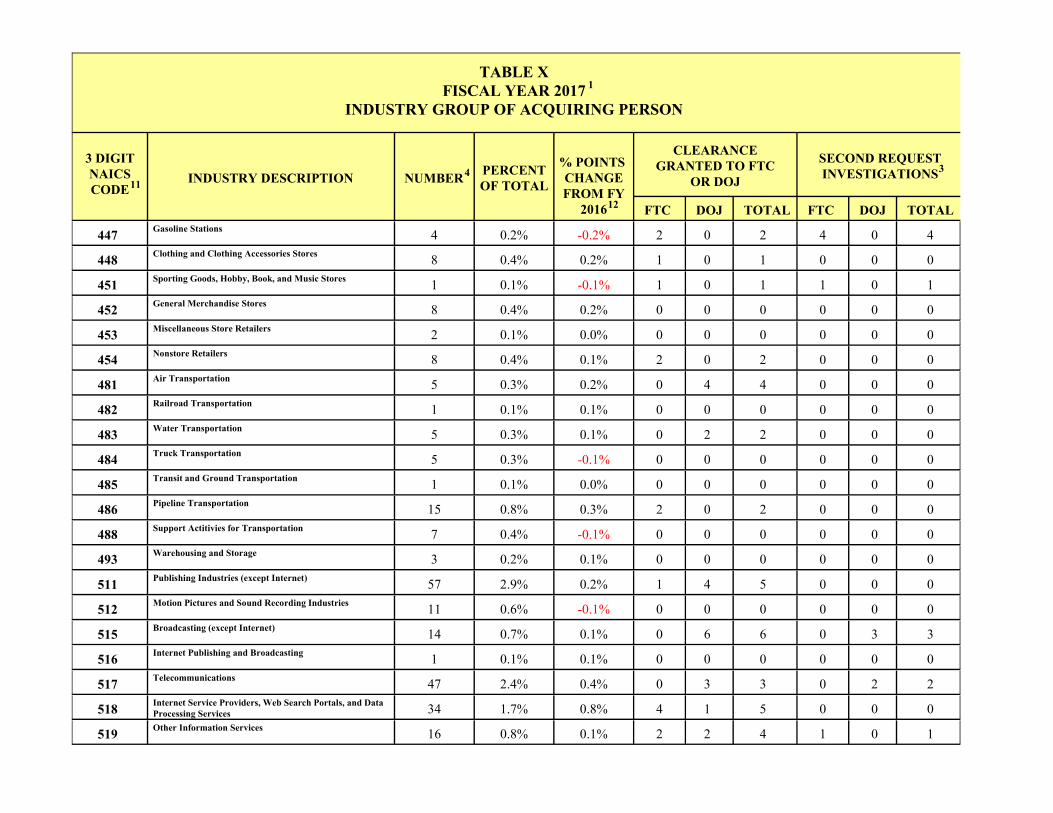
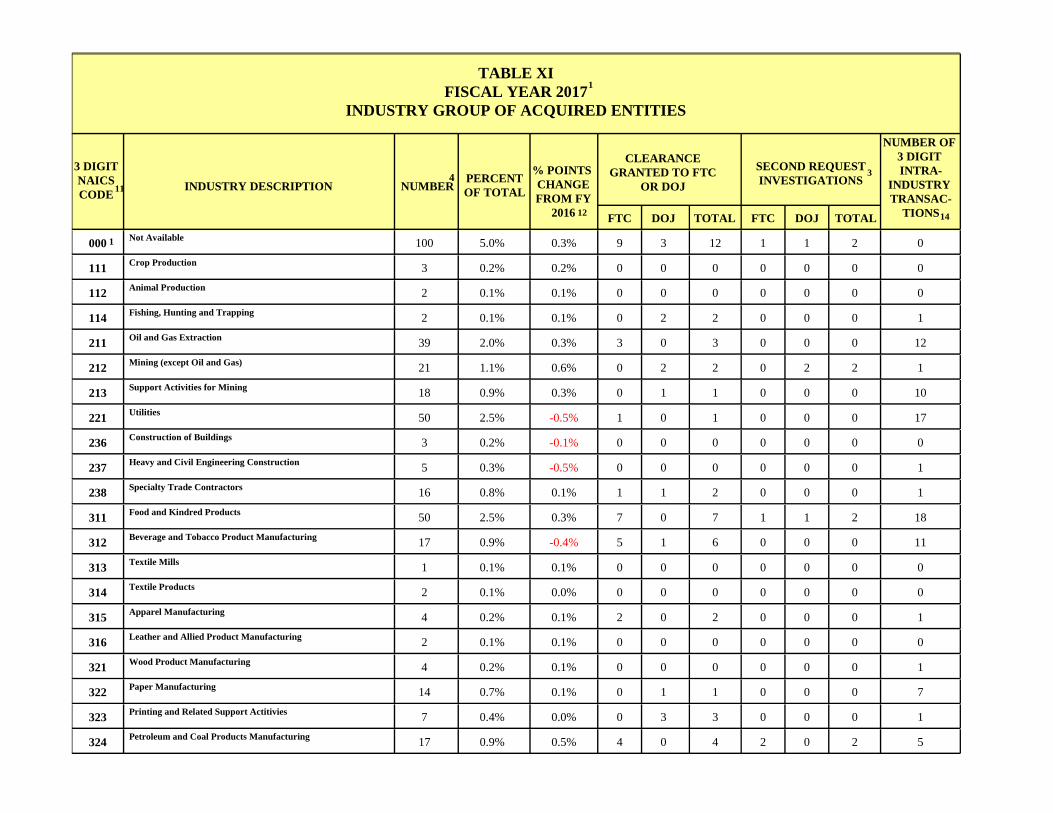
Tables X and XI provide the number of transactions by industry group in which the acquiring person or the acquired entity derived the most revenue Figure 3 illustrates the percentage of reportable transactions within industry groups for fiscal year 2017 based on the acquired entityrsquos operations11
Percentage of Transactions By Industry Group of Acquired EntityFiscal Year 2017
Chemicals amp Health Services Pharmaceuticals Transportation
Energy amp Natural Consumer Goods amp Resources 73 Services 259
(Figure 3)
Other 194
Banking amp Insurance 78
Information Technology 107
48 59 39
Manufacturing 144
10 The information on the value of reported adjusted transactions for fiscal year 2017 is drawn from a database maintained by the Premerger Notification Office 11 The category designated as ldquoOtherrdquo consists of industry segments that include construction educational services performing arts recreation and other non-classifiable businesses
7
DEVELOPMENTS WITHIN THE PREMERGER PROGRAM
1 Threshold Adjustments
The 2000 amendments to the HSR Act require the Commission to publish adjustments to the Actrsquos jurisdictional and filing fee thresholds in the Federal Register annually for each fiscal year beginning on September 30 2004 based on the change in the gross national product in accordance with Section 8(a)(5) of the Clayton Act The Commission amended the rules in 2005 to provide a method for future adjustments as required by the 2000 amendments and to reflect the revised thresholds contained in the rules The Commission publishes the revised thresholds annually in January and they become effective 30 days after publication
On January 26 2017 the Commission published a notice12 to reflect adjustment of the reporting thresholds as required by the 2000 amendments13 to Section 7A of the Clayton Act 15 USC sect 18a The revised thresholds including an increase in the size of transaction threshold from $782 million to $808 million became effective February 27 2017
2 Compliance
The Commission and the Antitrust Division continued to monitor compliance with the premerger notification programrsquos filing and waiting period requirements and initiated a number of compliance investigations in fiscal year 2017 The agencies use several methods to oversee compliance including monitoring news outlets and industry publications for transactions that may not have been reported in accordance with the HSR Actrsquos requirements Industry sources such as competitors customers and suppliers interested members of the public and in certain cases the parties themselves also provide the agencies with information about transactions and possible violations of the Actrsquos requirements
Under Section 7A(g)(1) of the Act any person that fails to comply with the Actrsquos notification and waiting period requirements is liable for a civil penalty of up to $40654 for each day the violation continues14 The antitrust agencies examine the circumstances of each violation to determine whether to seek penalties15 During fiscal year 2017 50 post-consummation ldquocorrectiverdquo filings were received and the agencies brought four enforcement actions resulting in $22 million in civil penalties
12 82 Fed Reg 8524 (Jan 26 2017) 13 15 USC sect18a(a) See Pub L No 106-553 114 Stat 2762 14 Dollar amounts specified in civil monetary penalty provisions within the Commissionrsquos jurisdiction are adjusted for inflation in accordance with the Federal Civil Penalties Inflation Adjustment Act Improvements Act of 2015 Pub L No 114-7 (Nov 2 2015) The adjustments have included an increase in the maximum civil penalty from $10000 to $11000 for each day during which a person is in violation of Section 7A(g)(1) (61 Fed Reg 54548 (Oct 21 1996) corrected at 61 Fed Reg 55840 (Oct 29 1996)) to $16000 effective February 10 2009 (74 Fed Reg 857 (Jan 9 2009)) to $40000 effective August 1 2016 (81 Fed Reg 42476 (June 30 2016)) and to $40654 effective January 24 2017 (81 Fed Reg 8135 (Jan 24 2017)) 15 If parties inadvertently fail to file the agencies generally will not seek penalties so long as the parties promptly submit corrective filings after discovering the failure to file submit an acceptable explanation of their failure to file and have not previously violated the Act
8
In United States v Duke Energy Corp16 the complaint alleged that Duke Energy Corporation violated the HSR Act when after agreeing to purchase the Osprey Energy Center from Calpine Corporation Duke took control of Ospreyrsquos business before filing required HSR Act notifications and waiting for the expiration of the mandatory waiting period At the same time that Duke had agreed to purchase Osprey Duke entered into a so-called ldquotolling agreementrdquo that immediately gave Duke control over Ospreyrsquos output and gave Duke the right to receive the day-to-day profits and losses from Ospreyrsquos business As a result from the moment the tolling agreement went into effect Osprey ceased to be an independent competitor Under the terms of a proposed final judgment filed January 18 2017 Duke Energy agreed to pay a $600000 civil penalty to resolve the lawsuit On April 7 2017 the court entered the final judgment
In United States v Mitchell P Rales17 the complaint alleged that investor Mitchell P Rales violated the HSR Act in October 2011 by failing to report voting shares valued in excess of $1319 million that his wife acquired in Colfax The complaint also alleged that Mr Rales violated the HSR Act in January 2008 by failing to report voting shares valued in excess of $5979 million that he acquired in Danaher Although Mr Rales contended that the violations were inadvertent the Commission determined to seek penalties because as noted in the complaint Mr Rales had paid civil penalties to settle an earlier HSR enforcement action brought by the Department of Justice in 1991 Under the terms of a proposed final judgment filed at the same time as the complaint Mr Rales agreed to pay a $720000 civil penalty to resolve the lawsuit On April 12 2017 the court entered the final judgment
In United States v Ahmet H Okumus18 the complaint alleged that hedge fund founder Ahmet H Okumus violated the HSR Act in June 2016 by failing to report voting shares valued in excess of $1563 million that his hedge fund Okumus Opportunistic Value Fund Ltd acquired in Webcom Although the Commission found Mr Okumusrsquos HSR violation to be inadvertent it sought penalties because as noted in the complaint this was Mr Okumusrsquos second HSR violation in two years regarding Webcom Under the terms of a proposed final judgment filed at the same time as the complaint Mr Okumus agreed to pay a $180000 civil penalty to resolve the lawsuit On April 21 2017 the court entered the final judgment
In United States v Fayez Sarofim19 the complaint alleged that Fayez Sarofim violated the HSR Act in 2001 2006 and 2012 by failing to report voting shares of Kinder Morgan valued in excess of $15 million in 2001 $1134 million in 2006 and $6821 million in 2012 The complaint also alleged that Mr Sarofim violated the HSR Act in May 2007 by failing to report voting shares valued in excess of $598 million that he acquired in Unitrin which later changed its name to Kemper The Commission found that Mr Sarofim was not entitled to rely upon the ldquoinvestment-onlyrdquo exemption which exempts acquisitions of up to ten percent of voting
16 United States v Duke Energy Corporation No 117-cv-00116 (DDC filed Jan 18 2017) available at httpswwwjusticegovatrcaseus-v-duke-energy-corporation 17 United States v Mitchell P Rales No 117-cv-00103 (DDC filed Jan 17 2017) available at httpswwwftcgovenforcementcases-proceedings161-0135mitchell-p-rales 18 United States v Ahmet H Okumus No 117-cv-00104 (DDC filed Jan 17 2017) available at httpswwwftcgovenforcementcases-proceedings161-0189ahmet-h-okumus 19 United States v Fayez Sarofim No 116-cv-02156 (DDC filed Oct 28 2016) available at httpswwwftcgovenforcementcases-proceedings151-0064united-states-federal-trade-commission-v-fayez-sarofim
9
securities if they are made solely for investment purposes This exemption however is not available to individuals who serve on the board of directors of the issuer at the time the shares are acquired and Mr Sarofim served on Kinder Morgans and Unitrins board before he made the securities purchases at issue Under the terms of a proposed final judgment filed at the same time as the complaint Mr Sarofim agreed to pay a $720000 civil penalty to resolve the lawsuit On January 26 2017 the court entered the final judgment
MERGER ENFORCEMENT ACTIVITY20
1 The Department of Justice
During fiscal year 2017 the Antitrust Division challenged 18 merger transactions that it concluded would have substantially lessened competition if allowed to proceed as proposed In 11 of these challenges the Antitrust Division filed a complaint in US district court In nine of these court challenges the Division filed settlement papers simultaneously with the complaint The remaining two court challenges were initiated as litigation In one after a trial on its merits the court found in favor of the Division and blocked the merger In the other the parties reached a settlement with the Division before the trial commenced Of the seven fiscal 2017 challenges where the Division did not file suit the parties abandoned the proposed transaction in six instances and in the remaining instance the parties restructured the transaction resolving the Divisionrsquos concerns21
In United States v Westinghouse Air Brake Technologies Corp and Faiveley Transport SA and Faiveley Transport North America22 the Division challenged the proposed acquisition of Faiveley Transport SA including its wholly-owned subsidiary Faiveley Transport North America (collectively Faiveley) by Westinghouse Air Brake Technologies Corporation (Wabtec) The complaint alleged that the transaction as originally structured would have substantially lessened competition for the development manufacture and sale of various freight railcar brake components by eliminating Faiveley as one of only three major companies supplying freight car brake components in the US The transaction would have also eliminated future competition for control valves by preventing Faiveleyrsquos entry into this market and would have thus maintained a century-old duopoly between Wabtec and its only other control valve rival A proposed final judgment filed simultaneously with the complaint on October 26 2016 required Wabtec to divest Faiveleyrsquos entire US freight car brakes business including all assets relating to Faiveleyrsquos freight car control valve development project (known as the FTEN) to
20 The cases listed in this section were not necessarily reportable under the premerger notification program Given the confidentiality of information obtained pursuant to the Act it would be inappropriate to identify the cases initiated under the program except in those instances in which that information has already been disclosed 21 (1) Lam Research Corporationrsquos proposed acquisition of KLA-Tencor Corporation (semiconductor fabrication tools) (2) Proposed slots exchange between American Airlines and United Airlines (3) Republic Airways Holding Inc proposed restructuring from bankruptcy by granting equity shares to American Airlines Group Inc Delta Air Lines Inc and United Continental Holdings Inc (4) Qatar Airways proposed acquisition of a stake in American Airlines (5) Proposed joint venture between First Data Corporation and FleetCor Technologies Inc(prepaid card processing) (6) tronc Incrsquos (owner of the Chicago Tribune) proposed acquisition of the Chicago Sun-Times from Wrapports Inc and (7) Raycom Media Incrsquos proposed acquisition of certain broadcast television stations from Calkins Media Inc 22 United States v Westinghouse Air Brake Technologies Corp Faiveley Transport SA and Faiveley Transport North America No 116-cv-02147 (DDC filed Oct 26 2016)
10
Amsted Rail Company Inc The divestiture was completed on November 30 2016 and the Court entered the final judgment on April 10 2017
In United States v Energy Solutions Inc Rockwell Holdco Inc Andrews County Holdings Inc and Waste Control Specialists LLC23 the Division filed suit to enjoin Energy Solutions Inc (ES) a wholly-owned subsidiary of Rockwell Holdco Inc from acquiring Waste Control Specialists LLC (WCS) a wholly-owned subsidiary of Andrews County Holdings Inc The complaint alleged that the transaction would have combined the only two licensed commercial low-level radioactive waste (LLRW) disposal facilities for 36 states Puerto Rico and the District of Columbia There are only four licensed LLRW disposal facilities in the United States Two of these facilities however did not accept LLRW from the relevant states The complaint alleged that ESrsquos Clive facility in Utah and WCSrsquos Andrews facility in Texas were the only two significant disposal alternatives available in the relevant states for the commercial disposal of higher-activity and lower-activity LLRW At trial one of the defenses asserted by the defendants was that that WCS was a failing firm and absent the transaction its assets would imminently exit the market The Division argued that the defendants did not show that WCSrsquos assets would in fact imminently exit the market given its failure to make good-faith efforts to elicit reasonable alternative offers that might be less anticompetitive than its transaction with ES On June 21 2017 after a 10-day trial the US District Court for the District of Delaware ruled in favor of the Division
In United States v Alaska Air Group Inc and Virgin America Inc24 the Division challenged Alaska Air Group Incrsquos proposed acquisition of Virgin America Inc While the combined company would have become only the fifth-largest domestic airline Alaskarsquos codeshare agreement with American Airlines Group Inc threatened to curb important competition supplied by Virgin on routes where it competed with American once these routes became part of Alaskarsquos network A codeshare agreement allows each airline to market tickets for certain flights operated by the other airline The complaint alleged that the codeshare agreement with American would have incentivized Alaska to cooperate rather than compete with American on each of the twenty nonstop routes on which Virgin and American competed resulting in a reduction of service decreased service quality increased prices andor ceased operations on the Virgin-American overlap routes Under the terms of a proposed final judgment filed simultaneously with the complaint on December 6 2016 Alaska agreed to significantly reduce the scope of its codeshare agreement with American The proposed final judgment prohibited Alaska and American from codesharing on routes where Alaska offered competing nonstop service with American on routes where Virgin and American competed pre-merger and on routes where Alaska would otherwise be likely to launch new service in competition with American following the merger On June 23 2017 the court entered the final judgment
In United States v AMC Entertainment Holdings Inc and Carmike Cinemas Inc25 the Division challenged AMC Entertainment Holdings Incrsquos proposed acquisition of Carmike
23 United States v Energy Solutions Inc Rockwell Holdco Inc Andrews County Holdings Inc and Waste Control Specialists LLC No 116-cv-01056 (D Del filed Nov 16 2016) 24 United States v Alaska Air Group Inc and Virgin America Inc No 116-cv-02377 (DDC filed Dec 6 2016) 25 US v AMC Entertainment Holdings Inc and Carmike Cinemas Inc No 1-16-cv-02475 (DDC filed Dec 20 2016)
11
Cinemas Inc AMC and Carmike were the second-largest and fourth-largest movie theatre chains respectively in the United States Additionally AMC owned significant equity in National CineMedia LLC (NCM) and Carmike owned significant equity in SV Holdco LLC a holding company that owns and operates Screenvision Exhibition Inc NCM and Screenvision are the countryrsquos predominant preshow cinema advertising networks covering over 80 percent of movie theatre screens in the United States The complaint alleged that the proposed acquisition would have provided AMC with direct control of one of its most significant movie theatre competitors and in some cases its only competitor in 15 local markets in nine states As a result moviegoers likely would have experienced higher ticket and concession prices and lower quality services in these local markets The complaint further alleged that the acquisition would have allowed AMC to hold sizable interests in both NCM and Screenvision post-transaction resulting in increased prices and reduced services for advertisers and theatre exhibitors seeking preshow services On December 20 2016 a proposed final judgment was filed simultaneously with the complaint settling the lawsuit Under the terms of the decree AMC agreed to (1) divest theatres in the 15 local markets (2) reduce its equity stake in NCM to 499 percent (3) relinquish its seats on NCMrsquos Board of Directors and all of its other governance rights in NCM (4) transfer 24 theatres with a total of 384 screens to the Screenvision cinema advertising network and (5) implement and maintain ldquofirewallsrdquo to inhibit the flow of competitively sensitive information between NCM and Screenvision The court entered the final judgment on March 7 2017
In United States v Clear Channel Outdoor Holdings Inc and Fairway Media Group LLC26 the Division challenged a proposed asset exchange between Clear Channel Outdoor Holdings Inc and Fairway Media Group LLC Clear Channel sought to acquire certain Fairway billboards located in Atlanta Georgia and Fairway sought to acquire certain Clear Channel billboards located in Indianapolis Indiana along with billboards in other metropolitan areas The complaint alleged that as initially structured the transaction would have eliminated the substantial head-to-head competition between Clear Channel and Fairway in Atlanta and Indianapolis resulting in higher prices and lower quality services for advertisers who purchased outdoor advertising in those markets A proposed final judgment filed simultaneously with the complaint on December 22 2016 required the parties to divest 13 billboard structures in Indianapolis to Circle City Outdoor LLC and 44 billboard structures in Atlanta to Link Media Georgia LLC The divestitures were completed and on March 7 2017 the court entered the final judgment
In United States v Smiths Group PLC Safran SA Morpho Detection LLC and Morpho Detection International LLC27 the Division challenged Smiths Group plcrsquos proposed acquisition of the global explosive detection business of Morpho Detection LLC and Morpho Detection International (collectively Morpho) from Safran SA Smiths and Morpho were two of the three leading providers of desktop explosive trace detection (ETD) devices and related services in the United States ETD devices are used to detect trace amounts of explosives or narcotics on persons or objects in airports and other high-risk critical infrastructure sites The complaint filed
26 United States v Clear Channel Outdoor Holdings Inc and Fairway Media Group LLC No 116-cv-02497 (DDC filed Dec 22 2016)27 United States v Smiths Group PLC Safran SA Morpho Detection LLC and Morpho Detection International LLC No 117-cv-00580 (DDC filed Mar 30 2017)
12
on March 30 2017 alleged that the transaction as initially structured would have eliminated competition between Smiths and Morpho for desktop ETD devices sold for passenger air travel or air cargo transport applications in the United States This loss in competition likely would have given Smiths the ability and incentive to raise prices decrease the quality of service and lessen innovation for customers including the Department of Homeland Security in the United States Under the terms of a proposed final judgment filed simultaneously with the complaint Smiths agreed to divest Morphorsquos global ETD business which included desktop handheld and portal ETD devices On June 23 2017 the final judgment was entered by the court The Division cooperated closely with the European Commission throughout the course of its investigation
In United States v Danone SA and The WhiteWave Foods Company28 the Division challenged Danone SArsquos proposed acquisition of The WhiteWave Foods Company Inc Danone a leading US manufacturer of organic yogurt had participated in the raw organic milk and fluid organic milk markets for the past two decades through a strategic partnership and supply and licensing agreements with WhiteWaversquos closest competitor CROPP Cooperative As a result Danonersquos acquisition of WhiteWave would have effectively combined WhiteWave and CROPP the top purchasers of raw organic milk in the Northeast and the producers of the three leading brands of fluid organic milk in the United States The complaint alleged that the transaction as originally structured likely would have resulted in less favorable contract terms for Northeast farmers for the purchase of their raw organic milk and would have aligned the interests of the producers of the only three national fluid organic milk brandsmdashStonyfield Horizon and Organic Valleymdashrisking higher prices and fewer choices for US customers A proposed final judgment filed simultaneously with the complaint on April 3 2017 required Danone to divest Stonyfield Farm Inc including the supply and licensing agreements with CROPP On July 13 2017 the court entered the final judgment
In United States v General Electric Co and Baker Hughes Incorporated29 the Division challenged the proposed acquisition of Baker Hughes Incorporated (ldquoBaker Hughesrdquo) by General Electric Co Baker Hughes and GE were two of the leading providers of refinery process chemicals in the United States covering over 50 percent of the market Refineries process crude oil and natural gas extracted from wells into finished products like gasoline GE and Baker Hughes were two of a few firms with the technical capabilities and expertise to provide refinery process chemicals and services in the United States and competed vigorously in price service quality and product development On June 12 2017 the Division filed a proposed final judgment simultaneously with the complaint Under the terms of the decree GE agreed to divest its Water amp Process Technologies business unit which included its refinery process chemicals and services unit to SUEZ SA by approximately the end of September 2017 or if the United States exercised its discretion to grant an extension by approximately the end of 2017 After consummating the GEBaker Hughes merger GE informed the United States that it would be unable to complete the divestiture by the agreed-upon deadline GE explained that in 19 foreign jurisdictions there were legal and other barriers to SUEZ operating the assets and that GE would not be able to complete the divestiture until 2018 On October 16 2017 the court entered
28 United States v Danone SA and The WhiteWave Foods Co No 117-cv-00592 (DDC filed Apr 3 2017) 29 United States v General Electric Co and Baker Hughes Inc No 117-cv-1146 (DDC filed June 12 2017)
13
a modified final judgment that added two provisions to the final judgment designed to encourage GE to complete the divestiture promptly The modified final judgment required GE to begin making daily incentive payments as of January 1 2018 until the divestiture is completed and also included GErsquos agreement to reimburse the United States for attorneyrsquos fees and costs incurred in addressing the delay The Division cooperated closely with its counterparts in several jurisdictions including the European Commission Canada and Australia throughout the course of its investigation
In United States et al v The Dow Chemical Company and EI Du Pont De Nemours and Company30 the Division along with the attorney generals of Iowa Mississippi and Montana challenged the proposed merger of The Dow Chemical Company and EI DuPont de Nemours and Company Dow and DuPont were two of the leading companies in both crop-protection chemicals and traited seeds in the United States Each company also manufactured a number of petrochemicals including high-pressure ethylene derivatives that are crucial inputs to a number of important products and industries The complaint alleged that the proposed merger would likely reduce or eliminate competition in the markets for broadleaf herbicides for winter wheat and chewing pest insecticides and tend to create a monopoly in the markets for acid copolymers and ionomers in the United States resulting in higher prices and reduced services and innovation in these markets On June 15 2017 a proposed final judgment was filed simultaneously with the complaint The final judgment requires DuPont to divest its Finesse-formulated herbicide products and its Rynaxypyr-formulated insecticide products along with the assets used to develop manufacture and sell those products Dow Chemical also was required to divest its Freeport Texas acid copolymers and ionomers manufacturing unit and associated assets The court entered the final judgment on October 19 2017 The Division cooperated closely with the European Commission throughout the course of its investigation
In United States v Parker-Hannifin Corporation and CLARCOR Inc31 the Division sued to unwind Parker-Hannifin Corporationrsquos acquisition of its only US competitor in aviation fuel filtration systems and filter elements CLARCOR Inc Aviation fuel must be filtered properly to remove particulate contaminants and water droplets before such fuel is delivered into commercial or military aircraft US airlines mandate the use of aviation filtration products that meet Energy Institute (EI) specifications32 Prior to the acquisition Parker-Hannifin and CLARCOR were the only suppliers of EI-qualified aviation fuel filtration systems and filter elements to US customers The Divisionrsquos complaint filed on September 26 2017 alleged that Parkerrsquos acquisition eliminated all head-to-head competition between the only two domestic manufacturers of these products effectively creating a monopoly in the United States On December 18 2017 the Division filed a proposed final judgment requiring Parker-Hannifin to divest its Facet filtration business including the aviation fuel filtration assets that it acquired from CLARCOR The Division will move to enter the final judgment upon completion of the Tunney Act period
30 United States et al v The Dow Chemical Co and EI Du Pont De Nemours and Co No 1-17-cv-01176 (DDC filed June 15 2017) 31 United States v Parker-Hannifin Corp and CLARCOR Inc No 117-cv-01354-UNA (D Del Sept 26 2017) 32 EI is an independent international professional organization for the energy sector that publishes performance and testing standards for aviation fuel filtration products
14
In United States v Showa Denko KK SGL Carbon SE and SGL GE Carbon Holding LLC (USA)33 the Division challenged Showa Denko KKrsquos (SDK) proposed acquisition of SGL Carbon SErsquos global graphite electrodes business SDK and SGL Carbon were two of the three leading suppliers of large ultra-high power (UHP) graphite electrodes used in electric arc furnaces (EAFs) at steel mills in the United States The complaint alleged that the acquisition would eliminate head-to-head competition between SDK and SGL Carbon to supply large UHP graphite electrodes to US EAF steel mills resulting in higher prices and decreased quality of delivery and service A proposed final judgment filed simultaneously with the complaint on September 27 2017 required the parties to divest SGL Carbonrsquos graphite electrode business to Tokai Carbon Co Ltd SDK completed the divestiture on November 7 2017 and the court entered the final judgment on January 9 2018
2 The Federal Trade Commission
In DraftKingsFanDuel34 the Commission filed an administrative complaint challenging the merger of DraftKings and FanDuel two providers of paid daily fantasy sports contests The Commissions complaint alleged that the transaction would be anticompetitive because the merger would have combined the two largest daily fantasy sports websites which controlled more than 90 percent of the US market for paid daily fantasy sports contests The Commission alleged that consumers of paid daily fantasy sports were unlikely to view season-long fantasy sports contests as a meaningful substitute for paid daily fantasy sports due to the length of season-long contests the limitations on number of entrants and several other issues Shortly after the Commission filed its complaint the parties abandoned the merger on July 13 2017 and the Commission dismissed its administrative complaint
The Commission also accepted for public comment and finalized consent orders in the following 14 merger matters
In Abbott LaboratoriesSt Jude Medical 35 the Commission challenged Abbott Laboratories proposed $25 billion acquisition of St Jude Medical Inc The Commissions complaint alleged that the proposed merger would have harmed competition in the US markets for vascular closure devices which are used to close holes in arteries from the insertion of catheters and for ldquosteerablerdquo sheaths which are used to guide catheters for treating heart arrhythmias To remedy these concerns and maintain competition the Commission issued a consent order requiring the parties to divest all rights and assets related to St Judersquos vascular closure device business and Abbottrsquos steerable sheath business to Terumo Corporation and to help Terumo establish manufacturing capabilities for these products The consent order also required Abbott to notify the Commission if it intended to acquire lesion-assessing ablation catheter assets from Advanced Cardiac Therapeutics (ACT) Abbott and ACT formed a partnership to develop these types of catheters Currently only St Jude and one other company
33 United States v Showa Denko KK SGL Carbon SE and SGL GE Carbon Holding LLC (USA) No 117-cv-01992 (DDC filed Sept 27 2017) 34 In the Matter of DraftKings Inc and FanDuel Ltd FTC Dkt C-9375 (complaint filed on June 19 2017) available at httpswwwftcgovenforcementcases-proceedings161-0174draft-kings-inc-fanduel-limited 35 In the Matter of Abbott Laboratories and St Jude Medical Inc FTC Dkt C-4600 (final order issued on Feb 23 2017) available at httpswwwftcgovenforcementcases-proceedings161-0126abbott-laboratories-st-jude-medical-matter
15
provide lesion-assessing ablation catheters in the United States After the acquisition of St Jude if Abbott acquired lesion-assessing ablation catheter assets from ACT it could eliminate additional competition Following a public comment period the Commission approved the final order on February 23 2017
In CentraCare HealthSCMG36 the Commission challenged CentraCare Healths proposed acquisition of St Cloud Medical Group PA (SCMG) The Commissions complaint alleged that the proposed merger would have combined the two largest providers of adult primary care pediatric and OBGYN services in the St Cloud Minnesota area By eliminating SCMG as a potential alternative in the St Cloud area the acquisition would have increased CentraCare Healthrsquos bargaining power vis-agrave-vis commercial health plans allowing it to raise reimbursement rates and secure more favorable payment terms Prior to the proposed acquisition however SCMG was failing financially had lost a number of physicians from its practice and was likely to lose more physicians if the merger did not close Over the course of a multi-year search SCMG was unable to identify an alternative purchaser to CentraCare Health However at least one local provider had expressed interest in expanding its practice by hiring some of SCMGrsquos physicians To remedy these concerns regarding the proposed merger and maintain competition the Commission issued a consent order requiring CentraCare Health to lift non-compete provisions and permit some adult primary care pediatric and OBGYN physicians to leave the health system and work for other local providers or establish a new practice in the area Following a public comment period the Commission approved the final order on January 9 2017
In CH Boehringer SohnSanofi37 the Commission challenged CH Boehringer Sohnrsquos proposed $135 billion animal health products asset swap with Sanofi The Commissions complaint alleged that the proposed asset swap would likely have harmed competition in US markets for various vaccines for companion animals and certain parasite control products for cattle and sheep Specifically the merger as proposed would likely substantially reduce competition in five markets (1) canine vaccines (2) feline vaccines (3) rabies vaccines (4) products to prevent and control outbreaks of parasites in cattle and (5) products to prevent and control outbreaks of parasites in sheep To remedy these concerns and maintain competition the Commission issued a consent order requiring Boehringer to divest its companion animal vaccines to Eli Lilly and Co and divest its Elanco Animal Health division and the parasite control products to Bayer AG Following a public comment period the Commission approved the final order on February 24 2017
In EnbridgeSpectra Energy38 the Commission challenged Enbridge Incs proposed $28 billion acquisition of Spectra Energy Corporation The Commissions complaint alleged that Enbridges the proposed merger would have harmed competition in the market for the pipeline transportation of natural gas in three production areas off the coast of Louisiana According to
36 In the Matter of CentraCare Health System FTC Dkt C-4594 (final order issued on Jan 9 2017) available at httpswwwftcgovenforcementcases-proceedings161-0096centracare-health-system 37 In the Matter of CH Boehringer Sohn AG amp Co KG FTC Dkt 4601 (final order issued on Feb 24 2017) available at httpswwwftcgovenforcementcases-proceedings161-0077ch-boehringer-sohn-matter 38 In the Matter of Enbridge Inc a corporation and Spectra Energy Corp FTC Dkt C-4604 (final order issued on Mar 24 2017) available at httpswwwftcgovenforcementcases-proceedings161-0215enbridge-spectra-energy
16
the Commissionrsquos complaint the merger likely would have reduced natural gas pipeline competition in three offshore natural gas producing areas in the Gulf of MexicomdashGreen Canyon Walker Ridge and Keathley Canyonmdashleading to higher prices for natural gas pipeline transportation from those areas In portions of the affected areas the merging partiesrsquo pipelines (Enbridges Walker Ridge Pipeline and Spectras 40 percent interest in the Discovery Pipeline) were the two pipelines located closest to certain wells and as a result were likely the lowest cost pipeline transportation options for these wells Furthermore the merger would have given Enbridge an ownership interest in both pipelines which would have given it access to competitively sensitive information of the Discovery Pipeline as well as significant voting rights over it providing Enbridge with the incentive and opportunity to unilaterally increase pipeline transportation costs for natural gas producers located in the affected areas The acquisition would have also increased the likelihood of tacit or explicit anticompetitive coordination between the Walker Ridge Pipeline and the Discovery Pipeline To remedy these concerns the Commission issued a consent order requiring Enbridge to establish firewalls to limit its access to non-public information about the Discovery Pipeline Board members of the Spectra-affiliated companies holding a 40 percent share in the Discovery Pipeline had to recuse themselves from any vote involving the pipeline with two limited exceptions Enbridge was also required to notify the Commission before acquiring an ownership interest in any natural gas pipeline operating in the Green Canyon Walker Ridge and Keathley Canyon areas or increasing its 40 percent ownership interest of Spectra affiliate DCP Midstream Partners LP in the Discovery Pipeline The consent order which is to remain in effect for 20 years allowed the Commission to appoint a monitor to ensure Enbridges compliance Following a public comment period the Commission approved the final order on March 24 2017
In China National Chemical CorpSyngenta AG39 the Commission challenged China National Chemical Corporations (ChemChina) proposed $43 billion acquisition of Syngenta The Commissions complaint alleged that the proposed merger would have reduced competition for three pesticides (1) the herbicide paraquat which is used to clear fields prior to the growing season (2) the insecticide abamectin which protects primarily citrus and tree nut crops by killing mites psyllid and leafminers and (3) the fungicide chlorothalonil which is used mainly to protect peanuts and potatoes According to the complaint Syngenta owned the branded version of these three pesticides giving it significant market shares in the United States ChemChinas subsidiary ADAMA was either the first- or second-largest generic supplier in the United States for these three pesticides To remedy these concerns the Commission issued a consent order requiring ChemChina to sell all rights and assets of ADAMArsquos USrsquos paraquat abamectin and chlorothalonil crop protection businesses to AMVAC an agrochemical company Following a public comment period the Commission approved the final order on June 16 2017
In DaVita IncRV ManagementRenal Ventures40 the Commission challenged DaVita Incs proposed $358 million acquisition of Renal Ventures Management LLC The
39 In the Matter of China National Chemical Corporation ADAMA Agricultural Solutions Ltd and Makhteshim Agan of North America Inc FTC Dkt C-4610 (final order issued on June 16 2017) available at httpswwwftcgovenforcementcases-proceedings1610093china-national-chemical-corporation-et-al 40 In the Matter of DaVita Inc RV Management Corp Renal Ventures Partners LLC Renal Ventures Limited LLC and Renal Ventures Management LLC FTC Dkt C-4616 (final order issued on June 14 2017) available at httpswwwftcgovenforcementcases-proceedings151-0204davita-rv-management-renal-ventures
17
Commissions complaint alleged that the proposed merger would have reduced competition for outpatient dialysis services At the time of the merger DaVita was the second-largest provider of outpatient dialysis services in the United States and Renal Ventures was the seventh largest According to the complaint competition between dialysis clinics happened at the local level and the acquisition would have led to significant anticompetitive effects in the New Jersey markets of Brick Clifton Somerville Succasunna and Trenton and in the Dallas-area markets of Denton and Frisco To remedy these concerns and maintain competition the Commission issued a consent order requiring DaVita to divest its ownership interest in seven clinics five in New Jersey and two in Texas to a Commission-approved buyer Following a public comment period the Commission approved the final order on June 14 2017
In Emerson ElectricPentair41 the Commission challenged Emerson Electric Cos proposed $315 billion acquisition of Pentair plc The Commissions complaint alleged that the proposed merger would have harmed competition for switchboxes the devices used to monitor and control valves that regulate the flow of liquids and gases in industrial facilities According to the complaint the acquisition would have combined the two leading manufacturers of switchboxes in the United States ndash which together controlled about 60 percent of the US market Emersonrsquos TopWorx and Pentairrsquos Westlock switchboxes were the most widely-used brands nationwide and for many customers the only acceptable brands of switchboxes To remedy these concerns the Commission issued a consent order requiring Emerson to divest Westlock Controls Corporation the Pentair subsidiary to Crane Co within 10 days after Emerson acquired Pentair Following a public comment period the Commission approved the final order on June 30 2017
In Sherwin-WilliamsValspar42 the Commission challenged Sherwin-Williams Cos proposed $113 billion acquisition of Valspar Corporation The Commissions complaint alleged that the proposed acquisition would have reduced competition in the North American market for industrial wood coatings used to make furniture kitchen cabinets and building products where Sherwin-Williams and Valspar were two of the top three industrial wood coatings manufacturers Industrial wood coatings which include stains topcoats and sealants provide better resistance to abrasion and water than consumer wood coatings To remedy these concerns the Commission issued a consent order requiring Sherwin-Williams to divest two Valspar industrial wood coatings plants one in High Point North Carolina and the other in Cornwall Ontario to Axalta Coating Systems Ltd a leading supplier of coatings to large automotive and industrial original equipment manufacturers Following a public comment period the Commission approved the final order on July 28 2017
In Alimentation Couche-TardCST Brands43 the Commission challenged Alimentation Couche-Tard Incs proposed $44 billion acquisition of CST Brands Inc The Commissions
41 In the Matter of Emerson Electric Company and Pentair plc FTC Dkt C-4615 (final order issued on June 30 2017) available at httpswwwftcgovenforcementcases-proceedings161-0221emerson-electric-pentair 42 In the Matter of The Sherwin-Williams Company and The Valspar Corporation FTC Dkt C-4621 (final order issued on July 28 2017) available at httpswwwftcgovenforcementcases-proceedings161-0116sherwin-williamsvalspar-matter 43 In the Matter of Alimentation Couch-Tard Inc and CST Brands Inc FTC Dkt C-4618 (final order issued on August 14 2017) available at httpswwwftcgovenforcementcases-proceedingsfile-no-161-0207-docket-no-c-4618alimentation-couche-tard-cst-brands
18
complaint alleged that the proposed merger would have reduced competition for the retail sales of gasoline and diesel in 71 local markets At the time of the merger Alimentation Couche-Tard operated convenience stores and retail fuel stations worldwide including nearly 4700 in United States Its convenience stores primarily operate under the Circle K and Kangaroo Express banners and the retail fuel sells under numerous brands CST operated 1146 convenience stores and retail fuel stations in the United States Its convenience stores primarily operated under the Corner Store banner while its fuel stations generally use the Valero brand According to the complaint the geographic markets for the retail sale of gasoline and diesel were local and generally ranged from a few blocks to a few miles The complaint alleged that without a remedy the merger would have increased market concentration for the retail sales of gasoline or diesel in each of the 71 local markets resulting in a monopoly in ten markets and reduced the number of competitors in the rest from three to two competitors To remedy these concerns the Commission issued a consent order requiring Alimentation Couche-Tard to divest 70 CST fuel stations to Empire Petroleum Partners The divested fuel stations were located in Arizona Colorado Florida Georgia Louisiana New Mexico Ohio and Texas Following a public comment period the Commission approved the final order on August 14 2017
In BroadcomBrocade Communications Systems44 the Commission challenged Broadcom Limiteds proposed $59 billion acquisition of Brocade Communications Systems Inc The Commissions complaint alleged that the proposed merger would have been anticompetitive because of Broadcoms access to the confidential business information of Brocades major competitor Cisco Systems Such information could be used to restrain competition or slow innovation in the worldwide market for fibre channel switches According to the complaint Brocade and Cisco were the only two competitors in the worldwide market for fibre channel switches and Broadcom supplied both companies with application-specific integrated circuits to make fibre channel switches The complaint further alleged that as the new owner of Brocade Broadcom could have used Ciscos confidential business information to unilaterally exercise market power or to coordinate action among Brocade and Cisco increasing the likelihood that customers would pay higher prices for fibre channel switches To remedy these concerns the Commission issued a consent order preventing Broadcom from using Ciscos competitively sensitive confidential information for any purpose other than designing manufacturing and selling fibre channel application-specific integrated circuits for Cisco To assure compliance the Commission appointed a monitor for five years The Commission cooperated with its counterparts in a number of jurisdictions that also reviewed the transaction including the European Commission China and Japan Following a public comment period the Commission approved the final order on August 17 2017
In Abbott LaboratoriesAlere 45 the Commission challenged Abbott Laboratoriesrsquo proposed $83 billion acquisition of Alere Inc over concerns that the proposed merger would have harmed competition in the United States for the sale of two types of medical devices point-of-care blood gas testing systems and point-of-care cardiac marker testing systems Point-of-
44 In the Matter of Broadcom Ltd and Brocade Communications Systems Inc FTC Dkt C-4622 (final order issued on August 17 2017) available at httpswwwftcgovenforcementcases-proceedings171-0027broadcom-limitedbrocade-communications-systems 45 In the Matter of Abbott Laboratories and Alere Inc FTC Dkt C-4625 (final order issued on Nov 14 2017) available at httpswwwftcgovenforcementcases-proceedings161-0084abbott-laboratories-alere-inc
19
care blood gas testing systems measure blood pH oxygen carbon dioxide and electrolyte levels in the blood Point-of-care cardiac marker testing systems measure specific proteins in the blood to access whether a patient is having a heart attack To remedy these concerns the Commission issued a consent order requiring Alere to divest its blood gas testing systems to Siemens Aktiengelsellschaft and its cardiac marker testing systems to Quidel Corporation Following a public comment period the Commission approved the final order on November 14 2017
In Integra LifesciencesJohnson amp Johnson 46 the Commission challenged Integrarsquos proposed $1 billion acquisition of Johnson amp Johnsonrsquos Codman Neuro division The Commissionrsquos complaint alleged that the proposed merger would have harmed competition in five medical device product market lines used in operative neurosurgery hydrocephalus management and neuro-critical care To remedy these concerns the Commission issued a consent order requiring Integra to sell these medical device product lines to Natus Medical Inc In addition the consent order required Integra to divest its manufacturing facility in San Diego and supply Natus with cranial access kits until Natus secured its own supply Following a public comment period the Commission approved the final order on December 22 2017
In Baxter InternationalClaris Lifesciences and Arjun Handa 47 the Commission challenged Baxterrsquos proposed $625 million acquisition of Clarisrsquo injectable drugs business The Commissionrsquos complaint alleged that the proposed merger would have reduced competition in the market for the antifungal agent fluconazole in saline intravenous bags as well as future competition in the market for milrinone in dextrose intravenous bags which dilates blood vessels lowers blood pressure and allows blood to flow more easily through the cardiovascular system To remedy these concerns the Commission issued a consent order requiring the parties to divest all of Clarisrsquos rights to these injectable drugs to Renaissance Lakewood Pharmaceuticals Following a public comment period the Commission approved the final order on August 30 2017
In Mars IncVCA48 the Commission challenged Marsrsquo proposed $91 billion acquisition of pet care company VCA alleging that the proposed merger would have harmed competition for certain specialty and emergency veterinary services in ten localities in the United States by eliminating head-to-head competition between Mars and VCA specialists The Commission issued a consent order requiring the parties to divest clinics in Kansas City New York Phoenix Chicago Corpus Christi San Antonio and two clinics in Seattle Under the terms of the consent order Mars was required for ten years to notify the Commission if it planned to acquire any additional specialty or emergency veterinary clinics in certain geographic areas The consent order also required both Mars and VCA to secure all third-party consents assignments and releases permitting the buyers to conduct business at the divested clinics Following a public comment period the Commission approved the final order on December 19 2017
46 In the Matter of Integra Lifesciences Corp and Johnson amp Johnson FTC Dkt C-4624 (final order issued on Dec 22 2017) available at httpswwwftcgovenforcementcases-proceedings171-0084integra-lifesciences-johnson-johnson 47 In the Matter of Baxter International Inc Claris Lifesciences Limited and Arjun Handa FTC Dkt C-4620 (final order issued on August 30 2017) available at httpswwwftcgovenforcementcases-proceedings171-0052baxter-international-inc-claris-lifesciences-limited-arjun 48 In the Matter of Mars Inc and VCA Inc FTC Dkt C-4633 (final order issued on December 19 2017) available at httpswwwftcgovenforcementcases-proceedings171-0057mars-incorporated-vca-inc
20
ONGOING REASSESSMENT OF THE EFFECTS OF THE PREMERGER NOTIFICATION PROGRAM
The Commission and the Antitrust Division continually review the impact of the premerger notification program on the business community and antitrust enforcement The premerger notification program ensures that the antitrust agencies review virtually every relatively large merger and acquisition that affects US consumers before consummation Prior to the HSR Act businesses could and often did consummate transactions that raised significant antitrust concerns before the agencies had an opportunity to consider adequately their competitive effects This practice forced the agencies to engage in lengthy post-acquisition litigation during the course of which the transactionrsquos anticompetitive effects continued to harm consumers and if effective post-acquisition relief was not practicable the harm continued Because the premerger notification program requires reporting before consummation the agenciesrsquo ability to obtain timely effective relief to prevent anticompetitive effects has vastly improved Thus the HSR Act is doing what Congress intendedmdashgiving the government the opportunity to investigate and challenge those relatively large mergers that are likely to harm consumers before injury can arise
The Commission and the Antitrust Division also regularly examine the premerger notification programrsquos effectiveness and continually seek ways to increase accessibility promote transparency and improve the review process to reduce the burden on the filing parties without compromising the agenciesrsquo ability to investigate and challenge proposed transactions that may substantially lessen competition
21
LIST OF APPENDICES
Appendix A Summary of Transactions Fiscal Years 2008 - 2017
Appendix B Number of Transactions Reported and Filings Received by Month for Fiscal Years 2008 - 2017
LIST OF EXHIBITS
Exhibit A Statistical Tables for Fiscal Year 2017 ndash Data ProfilingHart-Scott-Rodino Notification Filings and Enforcement Interests
Adjusted Transactions In Which A Second Request Could Have Been 1656 684 1128 1414 1400 1286 Issued2
Investigations in Which Second Requests 41 31 42 55 49 47Were Issued FTC3 21 15 20 24 20 25
Percent4 13 22 18 17 14 19
DOJ3 20 16 22 31 29 22
Percent4 12 23 20 22 21 17
Transactions Involving a Request For 1385 575 953 1157 1094 990Early Termination5
Granted5 1021 396 704 888 902 797
Not Granted5 364 179 249 269 192 193
2014
1663
3307
1618
51
30
19
21
13
1274
1020
254
2015
1801
3585
1754
47
20
11
27
15
1366
1086
280
2016
1832
3674
1772
54
25
14
29
16
1374
1102
272
2017
2052
4083
1992
51
33
17
18
09
1552
1220
332 Note The data for FY 2010 and FY 2011 reflect corrections to some prior annual reports and the DOJ number of investigations in which second requests were issued and the percentage of transactions in which second requests were issued by DOJ
1 Usually two filings are received one from the acquiring person and one from the acquired person when a transaction is reported Only one application is received when an acquiring party files for an exemption under Section 7A (c )(6) or (c )(8) of the Clayton Act
2 These figures omit from the total number of transactions reported all transactions for which the agencies were not authorized to request additional information These include (1) incomplete transactions (only one party filed a complete notification) (2) transactions reported pursuant to the exemption provisions of Sections 7A (c)(6) and 7A(c)(8) of the Act (3) transactions which were found to be non-reportable and (4) transactions withdrawn before the waiting period began In addition where a party filed more than one notification in the same year to acquire voting securities of the same corporation eg filing one threshold and later filing for a higher threshold only a single consolidated transaction has been counted because as a practical matter the agencies do not issue more than one Second Request in such a case These statistics also omit from the total number the transactions reported secondary acquisitions filed pursuant to sect8014 of the Premerger Notification rules Secondary acquisitions have been deducted in order to be consistent with the statistics presented in most of the prior annual reports
3 These statistics are based on the date the Second Request was issued and not the date the investigation was opened 4 Second Request investigations are a percentage of the total number of adjusted transactions The total percentage reflected in Figure 2 may not equal the sum of reported component values due to rounding
5 These statistics are based on the date of the HSR filing and not the date action was taken on the request
APPENDIX B
NUMBER OF TRANSACTIONS REPORTED
AND
FILINGS RECEIVED BY MONTH
FOR
FISCAL YEARS 2008 - 2017
APPENDIX B TABLE 1 NUMBER OF TRANSACTIONS REPORTED BY MONTH FOR FISCAL YEARS
October
November
December
January
February
March
April
May
June
July
August
September
TOTAL
2008 2009 2010 2011 2012 2013 2014 2015 2016
158 91 66 128 122 127 124 144 168
191 85 135 217 169 260 159 157 243
172 37 84 91 95 92 108 122 157
158 42 62 97 104 78 125 118 117
119 32 61 81 90 82 114 140 127
131 42 116 97 111 87 100 128 125
128 60 92 96 96 77 140 131 129
150 58 108 142 117 117 157 152 168
146 51 108 117 142 90 150 155 150
128 62 94 120 130 91 162 170 140
126 77 120 164 133 122 151 216 166
119 79 120 100 120 103 173 168 142
1726 716 1166 1450 1429 1326 1663 1801 1832
2017
163
215
148
153
153
146
150
209
191
146
219
159
2052
APPENDIX B TABLE 2 NUMBER OF FILINGS RECEIVED1 BY MONTH FOR FISCAL YEARS
October
November
December
January
February
March
April
May
June
July
August
September
TOTAL
2008 2009 2010 2011 2012 2013 2014 2015
319 185 146 252 242 255 247 289
380 165 242 422 332 511 325 322
343 79 177 193 188 180 211 239
316 77 126 188 203 151 244 244
246 63 116 157 185 169 236 257
242 81 232 195 215 172 195 252
272 119 182 190 193 151 271 265
294 114 216 284 231 228 315 305
293 99 213 231 275 181 304 322
259 121 187 240 269 186 323 327
251 149 238 329 259 240 292 425
240 159 243 201 237 204 344 338
3455 1411 2318 2882 2829 2628 3307 3585
2016
345
483
314
236
249
265
249
331
304
284
339
275
3674
2017
329
416
297
307
298
302
290
402
388
291
446
317
4083
1 Usually two filings are received one from the acquiring person and one from the acquired person when the transaction is reported Only one filing is received when an acquiring person files for a transaction that is exempt under Sections 7A(c)(6) and (c)(8) of the Clayton Act
EXHIBIT A
STATISTICAL TABLES
FOR
FISCAL YEAR 2017
DATA PROFILING HART-SCOTT-RODINO PREMERGER NOTIFICATION FILINGS AND ENFORCEMENT INTERESTS
5
5
5
5
5
5
5
TABLE I 1FISCAL YEAR 2017
2ACQUISITIONS BY SIZE OF TRANSACTION (BY SIZE RANGE)
TRANSACTION RANGE ($MILLIONS)
HSR TRANSACTIONS CLEARANCE GRANTED TO FTC OR DOJ 3SECOND REQUEST INVESTIGATIONS
812 Personal and Laundry Services 5 03 -01 0 0 0 0 0 0 0
TABLE XI 1FISCAL YEAR 2017
INDUSTRY GROUP OF ACQUIRED ENTITIES
3 DIGIT NAICS
11CODE INDUSTRY DESCRIPTION
4NUMBER
PERCENT OF TOTAL
POINTS CHANGE FROM FY
2016 12
CLEARANCE GRANTED TO FTC
OR DOJ
SECOND REQUEST 3INVESTIGATIONS
NUMBER OF 3 DIGIT INTRA-
INDUSTRY TRANSAC-
TIONS 14FTC DOJ TOTAL FTC DOJ TOTAL
1992 1000 205 72 277 33 18 51 508
1 Fiscal year 2017 figures include transactions reported between October 1 2016 and September 30 2017
2 The size of transaction is based on the aggregate total amount of voting securities non-corporate interests andor assets held by the acquiring person as a result of the transaction and are taken from the response to Item 2(d)(iii) 2(d)(vii) and 2(d)(ix) of the Notification and Report Form
3 These statistics are based on the date the Second Request was issued
4 During fiscal year 2017 2052 transactions were reported under the HSR Premerger Notification program The smaller number 1992 reflects the adjustments to eliminate the following types of transactions (1) transactions reported under Section 7A(c)(6) and (c)(8) (transactions involving certain regulated industries and financial businesses) (2) transactions deemed non-reportable (3) incomplete transactions (only one party in each transaction filed a compliant notification) and (4) transactions withdrawn before the waiting period began The table does not however exclude competing offers or multiple HSR transactions resulting from a single business transaction (where there are multiple acquiring persons or acquired persons)
5 The total number of filings under $50M submitted in Fiscal Year 2017 reflects corrective filings
6 In February 2001 legislation raised the size of transaction from $15 million to $50 million with annual adjustments beginning in February 2005 As of FY 2017 the threshold categories include non-corporate interests (NCI) encompassing transactions in which the acquiring entity acquires 50 of more of the non-corporate interests of the acquired entity
7 The category labeled ldquoSales Not Availablerdquo includes newly-formed acquiring persons foreign acquiring person with no United States revenues and acquiring persons who had not derived any revenues from their investments at the time of filing
8 Assets of an acquired entity are not available when the acquired entityrsquos financial data is consolidated within its ultimate parent
9 Sales of an acquired entity are taken from responses to Item 4(a) and (b) (SEC documents and annual reports) or item 5 (dollar revenues) of the Premerger Notification and Report Form
10 This category includes acquisition of newly-formed entities from which no sales were generated and acquisitions of assets which produced no sales revenues during the prior year to filing the Notification and Report Form
11 The 3-digit codes are part of the North American Industrial Classification System (NAICS) established by the United States Government North American Industrial Classification System 1997 Executive Office of the President Office of Management and Budget The NAICS groups used in this table were determined from responses submitted by the parties to Item 5 of the Premerger Notification and Report Form
12 This represents the deviation from the fiscal year 2016 percentage
13 This category includes transactions by newly-formed entities
14 The intra-industry transactions column identifies the number of acquisitions in which both the acquiring and acquired person derived revenues from the same 3-digit NAICS code
INTRODUCTION
A STATISTICAL PROFILE OF THE PREMERGER NOTIFICATION PROGRAM
A STATISTICAL PROFILE OF THE PREMERGER NOTIFICATION PROGRAM
DEVELOPMENTS WITHIN THE PREMERGER PROGRAM
INTRODUCTION
The Hart-Scott-Rodino Antitrust Improvements Act of 1976 Pub L No 94-435 (ldquoHSR Actrdquo or ldquothe Actrdquo) together with Section 13(b) of the Federal Trade Commission Act and Section 15 of the Clayton Act enables the Federal Trade Commission (ldquoFTCrdquo or ldquoCommissionrdquo) and the Antitrust Division of the Department of Justice (ldquoAntitrust Divisionrdquo or ldquoDivisionrdquo) to obtain effective preliminary relief against anticompetitive mergers and to prevent interim harm to competition and consumers The premerger notification program was instrumental in alerting the Commission and the Division to transactions that became the subjects of the numerous enforcement actions brought in fiscal year 20171 to protect consumersmdashindividual business and governmentmdashagainst anticompetitive mergers
The Commission and the Antitrust Division continue their efforts to protect competition by identifying and investigating those mergers and acquisitions that raise potentially significant competitive concerns In fiscal year 2017 2052 transactions were reported under the HSR Act representing about a 120 percent increase from the 1832 transactions reported in fiscal year 2016 (See Figure 1 below) Over the past five years the number of HSR reportable transactions has increased significantly ndash in FY2013 1326 HSR transactions were reported and in FY2017 2052 HSR transactions were reported an increase of over 50 This is in the face of flat or effectively decreasing budgets and restrictions on hiring
Num
ber of Transactions
HSR Merger Transactions Reported Fiscal Years 2008-2017
1 Fiscal year 2017 covered the period of October 1 2016 through September 30 2017
During fiscal year 2017 the Commission brought 21 merger enforcement challenges2 including 14 in which it accepted consent orders for public comment all of which resulted in final orders six in which the transaction was abandoned or restructured as a result of antitrust concerns raised during the investigation and one in which the Commission initiated administrative or federal court litigation These enforcement actions preserved competition in numerous sectors of the economy including consumer goods and services pharmaceuticals healthcare high tech and industrial goods and energy
Of note the Commission successfully concluded its merger challenge of DraftKings and FanDuel the two largest daily fantasy sports sites The Commission initiated an administrative action and together with attorney generals from six states sought a temporary restraining order and a preliminary injunction in federal court alleging that the combined firm would control more than 90 percent of the US market for paid daily fantasy sports contests Shortly after the Commission filed its complaint the parties abandoned the merger
Again this year most of the Commissionrsquos merger enforcement actions were resolved by a negotiated settlement For instance the Commission required divestitures to resolve competitive concerns arising from Sherwin-Williams Cos proposed $113 billion acquisition of Valspar Corporation The Commissions complaint alleged that the proposed acquisition would have reduced competition in the North American market for industrial wood coatings used to make furniture kitchen cabinets and building products where Sherwin-Williams and Valspar were two of the top three industrial wood coatings manufacturers The Commission also moved to preserve competition in local gasoline and diesel markets challenging Alimentation Couche-Tard Incrsquos proposed $44 billion acquisition of CST Brands Inc Alimentation Couche-Tard operates convenience stores and retail fuel stations worldwide including nearly 4700 in United States primarily under the Circle K and Kangaroo Express banners CST operates 1146 convenience stores and retail fuel stations in the United States under the Corner Store banner The Commissionrsquos order required divestitures in 71 local markets located in Arizona Colorado Florida Georgia Louisiana New Mexico Ohio and Texas
The Commission also took action to preserve competition in the worldwide market for fibre channel switches which are part of storage area networks that transfer data between servers and storage arrays in data centers To resolve concerns that semiconductor manufacturer Broadcom Limitedrsquos vertical acquisition of Brocade Communications Systems Inc would reduce competition or slow innovation for fibre channel switches the Commissionrsquos order prevents Broadcomrsquos business unit from sharing the confidential information of its customer Cisco Systems Inc with Brocade Ciscorsquos rival
During fiscal year 2017 the Antitrust Division challenged 18 merger transactions including 11 with filed complaints in US district court In nine of these 11 the Division simultaneously filed a proposed settlement In the remaining two the complaint was initiated as litigation In six of the remaining challenges the parties abandoned the proposed transaction and in the last the parties restructured the transaction to resolve the Divisionrsquos concerns
2 To avoid double-counting this Report includes only those merger enforcement actions in which the Commission or the Antitrust Division took its first public action during fiscal year 2017
2
In one of the two filed litigation complaints the Division sued to block EnergySolutions Incrsquos (ES) proposed acquisition of Waste Control Specialists LLC from Andrews County Holdings Inc The US District Court for the District of Delaware found in favor of the Division and blocked ESrsquos proposed acquisition because the proposed merger would have substantially lessened competition in the markets for disposal of higher-activity low-level radioactive waste (LLRW) and lower-activity LLRW in violation of Section 7 of the Clayton Act The parties abandoned the transaction and agreed to reimburse the Division for more than $165000 in litigation costs
In two significant matters the Division challenged transactions where contractual relationships with a third-party not the partiesrsquo overlapping assets increased the likelihood that the proposed acquisitions would substantially lessen competition In the first the Division challenged Alaska Air Group Incrsquos proposed acquisition of Virgin America Inc because Alaskarsquos extensive codeshare relationship with American Airlines would have decreased Alaskarsquos incentive to compete against American post-merger on the routes on which Virgin and American competed Under the terms of the final judgment filed simultaneously with the complaint Alaska agreed to significantly reduce the scope of its codeshare agreement with American In the second matter the Division challenged Danone SArsquos acquisition of The WhiteWave Foods Company Inc Post-merger Danonersquos long-term strategic partnership and supply and licensing agreements with WhiteWaversquos primary competitor CROPP Cooperative would have provided incentives and opportunities for cooperative behavior between the two leading purchasers of raw organic milk in the northeastern United States and the producers of the only three national fluid organic milk brands Under the terms of the final judgment filed simultaneously with the complaint Danone agreed to divest its Stonyfield Farms business which included all its contracts with CROPP
The Divisionrsquos investigation also led to a competition-protecting outcome when Lam Research Corporation and KLA-Tencor Corporation abandoned their plans to merge In that matter the Division informed the parties that it had serious concerns about the impact the transaction would have on competition KLA-Tencorrsquos leading position in several semiconductor metrology and inspection markets could have allowed Lam Research to foreclose its competitors by reducing their timely access to key KLA-Tencor equipment and related services
Finally the Division reinforced the importance of partiesrsquo compliance with the terms of a proposed final judgment in its challenge to General Electric Corsquos (GE) proposed acquisition of Baker Hughes Inc Under the terms of a proposed final judgment filed simultaneously with the complaint GE agreed to divest its refinery process chemicals and services unit by the end of September 2017 or if it was granted an extension the end of 2017 However after it consummated its merger with Baker Hughes GE informed the United States that it would be unable to complete the divestiture by the agreed-upon deadline due to complications with international aspects of divestitures On October 16 2017 the court entered a modified final judgment that added two provisions imposing financial obligations upon GE including incentive payments to encourage quick divestiture and attorneysrsquo fees to the Division to cover the costs associated with modifying and enforcing the decree until the divestiture is completed
3
In fiscal year 2017 the Commissionrsquos Premerger Notification Office (PNO) continued to respond to thousands of questions seeking information about the reportability of transactions under the HSR Act and the details involved in completing and filing the Notification and Report Form (the filing form) The PNO continued to provide information necessary for the notification process on its PNO website3 which serves as a HSR practitionersrsquo primary source of information on the HSR form and instructions for completing the form rules current filing thresholds notices of grants of early termination filing fee instructions and procedures for submitting post-consummation filings The website also provides training materials for new practitioners information on scheduled HSR events frequently asked questions regarding HSR filing requirements and contact information for PNO staff In addition the website also includes a catalog of informal interpretation letters giving the public ready access to PNO staff interpretations of the HSR Act and rules Finally PNO staff continued to provide tips for HSR practitioners in blog posts on the Commissionrsquos Competition Matters blog4 As always PNO staff is available to help HSR practitioners comply with HSR notification requirements
BACKGROUND OF THE HSR ACT
Section 201 of the HSR Act amended the Clayton Act by adding a new Section 7A 15 USC sect 18a In general the HSR Act requires that certain proposed acquisitions of voting securities non-corporate interests or assets be reported to the Commission and the Antitrust Division prior to consummation The parties must then wait a specified period usually 30 days (or 15 days in the case of a cash tender offer or bankruptcy sale) before they may complete the transaction Whether a particular acquisition is subject to these requirements depends on the value of the acquisition and in certain acquisitions the size of the parties as measured by their sales and assets Acquisitions valued below a certain threshold acquisitions involving parties with assets and sales below a certain threshold and certain classes of acquisitions that are less likely to raise antitrust concerns are excluded from the Actrsquos coverage
The Commission with the concurrence of the Assistant Attorney General for the Antitrust Division promulgated final rules implementing the premerger notification program on July 31 1978 At that time a comprehensive Statement of Basis and Purpose also was published containing a section-by-section analysis of the rules and an item-by-item analysis of the filing form5 The program became effective on September 5 1978 The Commission with the concurrence of the Assistant Attorney General has amended the rules and the filing form on many occasions over the years to improve the programrsquos effectiveness and to lessen the burden of complying with the rules6
The primary purpose of the statutory scheme as the legislative history makes clear is to provide the antitrust enforcement agencies with the opportunity to review mergers and
3 See httpswwwftcgovenforcementpremerger-notification-program 4 See httpswwwftcgovnews-eventsblogsterms368 5 43 Fed Reg 33450 (July 31 1978) 6 See httpswwwftcgovenforcementpremerger-notification-programstatute-rules-and-formal-interpretationsstatements-basis-purpose
4
acquisitions before they occur The premerger notification program with its filing and waiting period requirements provides the agencies with both the time and the information necessary to conduct this antitrust review Much of the information for a preliminary antitrust evaluation is included in the notification filed with the agencies by the parties to the proposed transactions
If either reviewing agency determines during the waiting period that further inquiry is necessary the agency is authorized by Section 7A(e) of the Clayton Act to issue a request for additional information and documentary material (Second Request)7 The Second Request extends the waiting period for a specified period of time (usually 30 days but 10 days in the case of a cash tender offer or bankruptcy sale) after all parties have complied with the Second Request (or in the case of a tender offer or bankruptcy sale after the acquiring person complies) This additional time provides the reviewing agency with the opportunity to analyze the information and to take appropriate action before the transaction is consummated If the reviewing agency believes that a proposed transaction may substantially lessen competition it may seek an injunction in federal district court to prohibit consummation of the transaction The Commission also may challenge the transaction in administrative litigation
A STATISTICAL PROFILE OF THE PREMERGER NOTIFICATION PROGRAM
The appendices to this Report provide a statistical summary of the operation of the premerger notification program Appendix A shows for the ten-year period covering fiscal years 2008-2017 the number of transactions reported the number of filings received the number of merger investigations in which Second Requests were issued and the number of transactions in which requests for early termination of the waiting period were received granted and not granted8 Appendix A also shows the number of transactions in which Second Requests could have been issued as well as the percentage of transactions in which Second Requests were issued Appendix B provides a month-by-month comparison of the number of transactions reported and the number of filings received for fiscal years 2008 through 2017
The statistics set out in these appendices show that the number of transactions reported in fiscal year 2017 increased 120 percent from the number of transactions reported in fiscal year 2016 In fiscal year 2017 2052 transactions were reported while 1832 were reported in fiscal year 20169 The statistics in Appendix A also show that the number of merger investigations in which Second Requests were issued in fiscal year 2017 decreased from the previous year Second Requests were issued in 51 merger investigations in fiscal year 2017 (33 issued by the
7 15 USC sect18a(e)(1)(a) (ldquoThe Federal Trade Commission or the Assistant Attorney General may prior to the expiration of the 30-day waiting period (or in the case of a cash tender offer the 15-day waiting period)helliprequire the submission of additional information or documentary material relevant to the proposed acquisitionrdquo) 8 The term ldquotransactionrdquo as used in Appendices A and B and Exhibit A to this Report does not refer only to individual mergers or acquisitions A particular merger joint venture or acquisition may be structured such that it involves more than one filing that must be made under the HSR Act 9 This Report like previous Reports also includes annual data on ldquoadjusted transactions in which a Second Request could have been issuedrdquo (ldquoadjusted transactionsrdquo) See Appendix A amp Appendix A n2 (explaining calculation of that data) There were 1992 adjusted transactions in fiscal year 2017 and the data presented in the Tables and the percentages discussed in the text of this Report (eg percentage of transactions resulting in Second Requests) are based on this figure
5
~
~ ~ ~
-
LZ7 ~
~
~ - ~
~
-
-
-
-
-_I__ _I_ _ I _I_ ~7 -
FTC and 18 issued by the Antitrust Division) while Second Requests were issued in 54 merger investigations in fiscal year 2016 (25 issued by the FTC and 29 issued by the Antitrust Division) The percentage of transactions in which a Second Request was issued decreased from 30 percent in fiscal year 2016 to 26 percent in fiscal year 2017 See Figure 2 below
Percentage of Transactions Resulting in Second Request Fiscal Years 2008-2017
50
45
40
35
30
25
20
15
10
05
00
The statistics in Appendix A also show that early termination of the waiting period is requested in the majority of transactions In fiscal year 2017 early termination was requested in 779 percent (1552) of the adjusted transactions reported In fiscal year 2016 early termination was requested in 775 percent (1374) of the transactions reported The percentage of requests granted out of the total requested decreased from 802 percent in fiscal year 2016 to 786 percent in fiscal year 2017
The tables (Tables I through XI) in Exhibit A contain information regarding the agenciesrsquo enforcement activities for transactions reported in fiscal year 2017 The tables provide for example various characteristics of transactions the number and percentage of transactions in which one antitrust agency granted the other clearance to commence an investigation and the number of merger investigations in which either agency issued Second Requests Table III of Exhibit A shows that in fiscal year 2017 the agencies received clearance to conduct an initial investigation in 139 percent of the total number of transactions reported The tables also provide the number of transactions based on the dollar value of transactions reported and the
reporting threshold indicated in the notification report In fiscal year 2017 the aggregate dollar value of reported transactions was $18 trillion10
Tables X and XI provide the number of transactions by industry group in which the acquiring person or the acquired entity derived the most revenue Figure 3 illustrates the percentage of reportable transactions within industry groups for fiscal year 2017 based on the acquired entityrsquos operations11
Percentage of Transactions By Industry Group of Acquired EntityFiscal Year 2017
Chemicals amp Health Services Pharmaceuticals Transportation
Energy amp Natural Consumer Goods amp Resources 73 Services 259
(Figure 3)
Other 194
Banking amp Insurance 78
Information Technology 107
48 59 39
Manufacturing 144
10 The information on the value of reported adjusted transactions for fiscal year 2017 is drawn from a database maintained by the Premerger Notification Office 11 The category designated as ldquoOtherrdquo consists of industry segments that include construction educational services performing arts recreation and other non-classifiable businesses
7
DEVELOPMENTS WITHIN THE PREMERGER PROGRAM
1 Threshold Adjustments
The 2000 amendments to the HSR Act require the Commission to publish adjustments to the Actrsquos jurisdictional and filing fee thresholds in the Federal Register annually for each fiscal year beginning on September 30 2004 based on the change in the gross national product in accordance with Section 8(a)(5) of the Clayton Act The Commission amended the rules in 2005 to provide a method for future adjustments as required by the 2000 amendments and to reflect the revised thresholds contained in the rules The Commission publishes the revised thresholds annually in January and they become effective 30 days after publication
On January 26 2017 the Commission published a notice12 to reflect adjustment of the reporting thresholds as required by the 2000 amendments13 to Section 7A of the Clayton Act 15 USC sect 18a The revised thresholds including an increase in the size of transaction threshold from $782 million to $808 million became effective February 27 2017
2 Compliance
The Commission and the Antitrust Division continued to monitor compliance with the premerger notification programrsquos filing and waiting period requirements and initiated a number of compliance investigations in fiscal year 2017 The agencies use several methods to oversee compliance including monitoring news outlets and industry publications for transactions that may not have been reported in accordance with the HSR Actrsquos requirements Industry sources such as competitors customers and suppliers interested members of the public and in certain cases the parties themselves also provide the agencies with information about transactions and possible violations of the Actrsquos requirements
Under Section 7A(g)(1) of the Act any person that fails to comply with the Actrsquos notification and waiting period requirements is liable for a civil penalty of up to $40654 for each day the violation continues14 The antitrust agencies examine the circumstances of each violation to determine whether to seek penalties15 During fiscal year 2017 50 post-consummation ldquocorrectiverdquo filings were received and the agencies brought four enforcement actions resulting in $22 million in civil penalties
12 82 Fed Reg 8524 (Jan 26 2017) 13 15 USC sect18a(a) See Pub L No 106-553 114 Stat 2762 14 Dollar amounts specified in civil monetary penalty provisions within the Commissionrsquos jurisdiction are adjusted for inflation in accordance with the Federal Civil Penalties Inflation Adjustment Act Improvements Act of 2015 Pub L No 114-7 (Nov 2 2015) The adjustments have included an increase in the maximum civil penalty from $10000 to $11000 for each day during which a person is in violation of Section 7A(g)(1) (61 Fed Reg 54548 (Oct 21 1996) corrected at 61 Fed Reg 55840 (Oct 29 1996)) to $16000 effective February 10 2009 (74 Fed Reg 857 (Jan 9 2009)) to $40000 effective August 1 2016 (81 Fed Reg 42476 (June 30 2016)) and to $40654 effective January 24 2017 (81 Fed Reg 8135 (Jan 24 2017)) 15 If parties inadvertently fail to file the agencies generally will not seek penalties so long as the parties promptly submit corrective filings after discovering the failure to file submit an acceptable explanation of their failure to file and have not previously violated the Act
8
In United States v Duke Energy Corp16 the complaint alleged that Duke Energy Corporation violated the HSR Act when after agreeing to purchase the Osprey Energy Center from Calpine Corporation Duke took control of Ospreyrsquos business before filing required HSR Act notifications and waiting for the expiration of the mandatory waiting period At the same time that Duke had agreed to purchase Osprey Duke entered into a so-called ldquotolling agreementrdquo that immediately gave Duke control over Ospreyrsquos output and gave Duke the right to receive the day-to-day profits and losses from Ospreyrsquos business As a result from the moment the tolling agreement went into effect Osprey ceased to be an independent competitor Under the terms of a proposed final judgment filed January 18 2017 Duke Energy agreed to pay a $600000 civil penalty to resolve the lawsuit On April 7 2017 the court entered the final judgment
In United States v Mitchell P Rales17 the complaint alleged that investor Mitchell P Rales violated the HSR Act in October 2011 by failing to report voting shares valued in excess of $1319 million that his wife acquired in Colfax The complaint also alleged that Mr Rales violated the HSR Act in January 2008 by failing to report voting shares valued in excess of $5979 million that he acquired in Danaher Although Mr Rales contended that the violations were inadvertent the Commission determined to seek penalties because as noted in the complaint Mr Rales had paid civil penalties to settle an earlier HSR enforcement action brought by the Department of Justice in 1991 Under the terms of a proposed final judgment filed at the same time as the complaint Mr Rales agreed to pay a $720000 civil penalty to resolve the lawsuit On April 12 2017 the court entered the final judgment
In United States v Ahmet H Okumus18 the complaint alleged that hedge fund founder Ahmet H Okumus violated the HSR Act in June 2016 by failing to report voting shares valued in excess of $1563 million that his hedge fund Okumus Opportunistic Value Fund Ltd acquired in Webcom Although the Commission found Mr Okumusrsquos HSR violation to be inadvertent it sought penalties because as noted in the complaint this was Mr Okumusrsquos second HSR violation in two years regarding Webcom Under the terms of a proposed final judgment filed at the same time as the complaint Mr Okumus agreed to pay a $180000 civil penalty to resolve the lawsuit On April 21 2017 the court entered the final judgment
In United States v Fayez Sarofim19 the complaint alleged that Fayez Sarofim violated the HSR Act in 2001 2006 and 2012 by failing to report voting shares of Kinder Morgan valued in excess of $15 million in 2001 $1134 million in 2006 and $6821 million in 2012 The complaint also alleged that Mr Sarofim violated the HSR Act in May 2007 by failing to report voting shares valued in excess of $598 million that he acquired in Unitrin which later changed its name to Kemper The Commission found that Mr Sarofim was not entitled to rely upon the ldquoinvestment-onlyrdquo exemption which exempts acquisitions of up to ten percent of voting
16 United States v Duke Energy Corporation No 117-cv-00116 (DDC filed Jan 18 2017) available at httpswwwjusticegovatrcaseus-v-duke-energy-corporation 17 United States v Mitchell P Rales No 117-cv-00103 (DDC filed Jan 17 2017) available at httpswwwftcgovenforcementcases-proceedings161-0135mitchell-p-rales 18 United States v Ahmet H Okumus No 117-cv-00104 (DDC filed Jan 17 2017) available at httpswwwftcgovenforcementcases-proceedings161-0189ahmet-h-okumus 19 United States v Fayez Sarofim No 116-cv-02156 (DDC filed Oct 28 2016) available at httpswwwftcgovenforcementcases-proceedings151-0064united-states-federal-trade-commission-v-fayez-sarofim
9
securities if they are made solely for investment purposes This exemption however is not available to individuals who serve on the board of directors of the issuer at the time the shares are acquired and Mr Sarofim served on Kinder Morgans and Unitrins board before he made the securities purchases at issue Under the terms of a proposed final judgment filed at the same time as the complaint Mr Sarofim agreed to pay a $720000 civil penalty to resolve the lawsuit On January 26 2017 the court entered the final judgment
MERGER ENFORCEMENT ACTIVITY20
1 The Department of Justice
During fiscal year 2017 the Antitrust Division challenged 18 merger transactions that it concluded would have substantially lessened competition if allowed to proceed as proposed In 11 of these challenges the Antitrust Division filed a complaint in US district court In nine of these court challenges the Division filed settlement papers simultaneously with the complaint The remaining two court challenges were initiated as litigation In one after a trial on its merits the court found in favor of the Division and blocked the merger In the other the parties reached a settlement with the Division before the trial commenced Of the seven fiscal 2017 challenges where the Division did not file suit the parties abandoned the proposed transaction in six instances and in the remaining instance the parties restructured the transaction resolving the Divisionrsquos concerns21
In United States v Westinghouse Air Brake Technologies Corp and Faiveley Transport SA and Faiveley Transport North America22 the Division challenged the proposed acquisition of Faiveley Transport SA including its wholly-owned subsidiary Faiveley Transport North America (collectively Faiveley) by Westinghouse Air Brake Technologies Corporation (Wabtec) The complaint alleged that the transaction as originally structured would have substantially lessened competition for the development manufacture and sale of various freight railcar brake components by eliminating Faiveley as one of only three major companies supplying freight car brake components in the US The transaction would have also eliminated future competition for control valves by preventing Faiveleyrsquos entry into this market and would have thus maintained a century-old duopoly between Wabtec and its only other control valve rival A proposed final judgment filed simultaneously with the complaint on October 26 2016 required Wabtec to divest Faiveleyrsquos entire US freight car brakes business including all assets relating to Faiveleyrsquos freight car control valve development project (known as the FTEN) to
20 The cases listed in this section were not necessarily reportable under the premerger notification program Given the confidentiality of information obtained pursuant to the Act it would be inappropriate to identify the cases initiated under the program except in those instances in which that information has already been disclosed 21 (1) Lam Research Corporationrsquos proposed acquisition of KLA-Tencor Corporation (semiconductor fabrication tools) (2) Proposed slots exchange between American Airlines and United Airlines (3) Republic Airways Holding Inc proposed restructuring from bankruptcy by granting equity shares to American Airlines Group Inc Delta Air Lines Inc and United Continental Holdings Inc (4) Qatar Airways proposed acquisition of a stake in American Airlines (5) Proposed joint venture between First Data Corporation and FleetCor Technologies Inc(prepaid card processing) (6) tronc Incrsquos (owner of the Chicago Tribune) proposed acquisition of the Chicago Sun-Times from Wrapports Inc and (7) Raycom Media Incrsquos proposed acquisition of certain broadcast television stations from Calkins Media Inc 22 United States v Westinghouse Air Brake Technologies Corp Faiveley Transport SA and Faiveley Transport North America No 116-cv-02147 (DDC filed Oct 26 2016)
10
Amsted Rail Company Inc The divestiture was completed on November 30 2016 and the Court entered the final judgment on April 10 2017
In United States v Energy Solutions Inc Rockwell Holdco Inc Andrews County Holdings Inc and Waste Control Specialists LLC23 the Division filed suit to enjoin Energy Solutions Inc (ES) a wholly-owned subsidiary of Rockwell Holdco Inc from acquiring Waste Control Specialists LLC (WCS) a wholly-owned subsidiary of Andrews County Holdings Inc The complaint alleged that the transaction would have combined the only two licensed commercial low-level radioactive waste (LLRW) disposal facilities for 36 states Puerto Rico and the District of Columbia There are only four licensed LLRW disposal facilities in the United States Two of these facilities however did not accept LLRW from the relevant states The complaint alleged that ESrsquos Clive facility in Utah and WCSrsquos Andrews facility in Texas were the only two significant disposal alternatives available in the relevant states for the commercial disposal of higher-activity and lower-activity LLRW At trial one of the defenses asserted by the defendants was that that WCS was a failing firm and absent the transaction its assets would imminently exit the market The Division argued that the defendants did not show that WCSrsquos assets would in fact imminently exit the market given its failure to make good-faith efforts to elicit reasonable alternative offers that might be less anticompetitive than its transaction with ES On June 21 2017 after a 10-day trial the US District Court for the District of Delaware ruled in favor of the Division
In United States v Alaska Air Group Inc and Virgin America Inc24 the Division challenged Alaska Air Group Incrsquos proposed acquisition of Virgin America Inc While the combined company would have become only the fifth-largest domestic airline Alaskarsquos codeshare agreement with American Airlines Group Inc threatened to curb important competition supplied by Virgin on routes where it competed with American once these routes became part of Alaskarsquos network A codeshare agreement allows each airline to market tickets for certain flights operated by the other airline The complaint alleged that the codeshare agreement with American would have incentivized Alaska to cooperate rather than compete with American on each of the twenty nonstop routes on which Virgin and American competed resulting in a reduction of service decreased service quality increased prices andor ceased operations on the Virgin-American overlap routes Under the terms of a proposed final judgment filed simultaneously with the complaint on December 6 2016 Alaska agreed to significantly reduce the scope of its codeshare agreement with American The proposed final judgment prohibited Alaska and American from codesharing on routes where Alaska offered competing nonstop service with American on routes where Virgin and American competed pre-merger and on routes where Alaska would otherwise be likely to launch new service in competition with American following the merger On June 23 2017 the court entered the final judgment
In United States v AMC Entertainment Holdings Inc and Carmike Cinemas Inc25 the Division challenged AMC Entertainment Holdings Incrsquos proposed acquisition of Carmike
23 United States v Energy Solutions Inc Rockwell Holdco Inc Andrews County Holdings Inc and Waste Control Specialists LLC No 116-cv-01056 (D Del filed Nov 16 2016) 24 United States v Alaska Air Group Inc and Virgin America Inc No 116-cv-02377 (DDC filed Dec 6 2016) 25 US v AMC Entertainment Holdings Inc and Carmike Cinemas Inc No 1-16-cv-02475 (DDC filed Dec 20 2016)
11
Cinemas Inc AMC and Carmike were the second-largest and fourth-largest movie theatre chains respectively in the United States Additionally AMC owned significant equity in National CineMedia LLC (NCM) and Carmike owned significant equity in SV Holdco LLC a holding company that owns and operates Screenvision Exhibition Inc NCM and Screenvision are the countryrsquos predominant preshow cinema advertising networks covering over 80 percent of movie theatre screens in the United States The complaint alleged that the proposed acquisition would have provided AMC with direct control of one of its most significant movie theatre competitors and in some cases its only competitor in 15 local markets in nine states As a result moviegoers likely would have experienced higher ticket and concession prices and lower quality services in these local markets The complaint further alleged that the acquisition would have allowed AMC to hold sizable interests in both NCM and Screenvision post-transaction resulting in increased prices and reduced services for advertisers and theatre exhibitors seeking preshow services On December 20 2016 a proposed final judgment was filed simultaneously with the complaint settling the lawsuit Under the terms of the decree AMC agreed to (1) divest theatres in the 15 local markets (2) reduce its equity stake in NCM to 499 percent (3) relinquish its seats on NCMrsquos Board of Directors and all of its other governance rights in NCM (4) transfer 24 theatres with a total of 384 screens to the Screenvision cinema advertising network and (5) implement and maintain ldquofirewallsrdquo to inhibit the flow of competitively sensitive information between NCM and Screenvision The court entered the final judgment on March 7 2017
In United States v Clear Channel Outdoor Holdings Inc and Fairway Media Group LLC26 the Division challenged a proposed asset exchange between Clear Channel Outdoor Holdings Inc and Fairway Media Group LLC Clear Channel sought to acquire certain Fairway billboards located in Atlanta Georgia and Fairway sought to acquire certain Clear Channel billboards located in Indianapolis Indiana along with billboards in other metropolitan areas The complaint alleged that as initially structured the transaction would have eliminated the substantial head-to-head competition between Clear Channel and Fairway in Atlanta and Indianapolis resulting in higher prices and lower quality services for advertisers who purchased outdoor advertising in those markets A proposed final judgment filed simultaneously with the complaint on December 22 2016 required the parties to divest 13 billboard structures in Indianapolis to Circle City Outdoor LLC and 44 billboard structures in Atlanta to Link Media Georgia LLC The divestitures were completed and on March 7 2017 the court entered the final judgment
In United States v Smiths Group PLC Safran SA Morpho Detection LLC and Morpho Detection International LLC27 the Division challenged Smiths Group plcrsquos proposed acquisition of the global explosive detection business of Morpho Detection LLC and Morpho Detection International (collectively Morpho) from Safran SA Smiths and Morpho were two of the three leading providers of desktop explosive trace detection (ETD) devices and related services in the United States ETD devices are used to detect trace amounts of explosives or narcotics on persons or objects in airports and other high-risk critical infrastructure sites The complaint filed
26 United States v Clear Channel Outdoor Holdings Inc and Fairway Media Group LLC No 116-cv-02497 (DDC filed Dec 22 2016)27 United States v Smiths Group PLC Safran SA Morpho Detection LLC and Morpho Detection International LLC No 117-cv-00580 (DDC filed Mar 30 2017)
12
on March 30 2017 alleged that the transaction as initially structured would have eliminated competition between Smiths and Morpho for desktop ETD devices sold for passenger air travel or air cargo transport applications in the United States This loss in competition likely would have given Smiths the ability and incentive to raise prices decrease the quality of service and lessen innovation for customers including the Department of Homeland Security in the United States Under the terms of a proposed final judgment filed simultaneously with the complaint Smiths agreed to divest Morphorsquos global ETD business which included desktop handheld and portal ETD devices On June 23 2017 the final judgment was entered by the court The Division cooperated closely with the European Commission throughout the course of its investigation
In United States v Danone SA and The WhiteWave Foods Company28 the Division challenged Danone SArsquos proposed acquisition of The WhiteWave Foods Company Inc Danone a leading US manufacturer of organic yogurt had participated in the raw organic milk and fluid organic milk markets for the past two decades through a strategic partnership and supply and licensing agreements with WhiteWaversquos closest competitor CROPP Cooperative As a result Danonersquos acquisition of WhiteWave would have effectively combined WhiteWave and CROPP the top purchasers of raw organic milk in the Northeast and the producers of the three leading brands of fluid organic milk in the United States The complaint alleged that the transaction as originally structured likely would have resulted in less favorable contract terms for Northeast farmers for the purchase of their raw organic milk and would have aligned the interests of the producers of the only three national fluid organic milk brandsmdashStonyfield Horizon and Organic Valleymdashrisking higher prices and fewer choices for US customers A proposed final judgment filed simultaneously with the complaint on April 3 2017 required Danone to divest Stonyfield Farm Inc including the supply and licensing agreements with CROPP On July 13 2017 the court entered the final judgment
In United States v General Electric Co and Baker Hughes Incorporated29 the Division challenged the proposed acquisition of Baker Hughes Incorporated (ldquoBaker Hughesrdquo) by General Electric Co Baker Hughes and GE were two of the leading providers of refinery process chemicals in the United States covering over 50 percent of the market Refineries process crude oil and natural gas extracted from wells into finished products like gasoline GE and Baker Hughes were two of a few firms with the technical capabilities and expertise to provide refinery process chemicals and services in the United States and competed vigorously in price service quality and product development On June 12 2017 the Division filed a proposed final judgment simultaneously with the complaint Under the terms of the decree GE agreed to divest its Water amp Process Technologies business unit which included its refinery process chemicals and services unit to SUEZ SA by approximately the end of September 2017 or if the United States exercised its discretion to grant an extension by approximately the end of 2017 After consummating the GEBaker Hughes merger GE informed the United States that it would be unable to complete the divestiture by the agreed-upon deadline GE explained that in 19 foreign jurisdictions there were legal and other barriers to SUEZ operating the assets and that GE would not be able to complete the divestiture until 2018 On October 16 2017 the court entered
28 United States v Danone SA and The WhiteWave Foods Co No 117-cv-00592 (DDC filed Apr 3 2017) 29 United States v General Electric Co and Baker Hughes Inc No 117-cv-1146 (DDC filed June 12 2017)
13
a modified final judgment that added two provisions to the final judgment designed to encourage GE to complete the divestiture promptly The modified final judgment required GE to begin making daily incentive payments as of January 1 2018 until the divestiture is completed and also included GErsquos agreement to reimburse the United States for attorneyrsquos fees and costs incurred in addressing the delay The Division cooperated closely with its counterparts in several jurisdictions including the European Commission Canada and Australia throughout the course of its investigation
In United States et al v The Dow Chemical Company and EI Du Pont De Nemours and Company30 the Division along with the attorney generals of Iowa Mississippi and Montana challenged the proposed merger of The Dow Chemical Company and EI DuPont de Nemours and Company Dow and DuPont were two of the leading companies in both crop-protection chemicals and traited seeds in the United States Each company also manufactured a number of petrochemicals including high-pressure ethylene derivatives that are crucial inputs to a number of important products and industries The complaint alleged that the proposed merger would likely reduce or eliminate competition in the markets for broadleaf herbicides for winter wheat and chewing pest insecticides and tend to create a monopoly in the markets for acid copolymers and ionomers in the United States resulting in higher prices and reduced services and innovation in these markets On June 15 2017 a proposed final judgment was filed simultaneously with the complaint The final judgment requires DuPont to divest its Finesse-formulated herbicide products and its Rynaxypyr-formulated insecticide products along with the assets used to develop manufacture and sell those products Dow Chemical also was required to divest its Freeport Texas acid copolymers and ionomers manufacturing unit and associated assets The court entered the final judgment on October 19 2017 The Division cooperated closely with the European Commission throughout the course of its investigation
In United States v Parker-Hannifin Corporation and CLARCOR Inc31 the Division sued to unwind Parker-Hannifin Corporationrsquos acquisition of its only US competitor in aviation fuel filtration systems and filter elements CLARCOR Inc Aviation fuel must be filtered properly to remove particulate contaminants and water droplets before such fuel is delivered into commercial or military aircraft US airlines mandate the use of aviation filtration products that meet Energy Institute (EI) specifications32 Prior to the acquisition Parker-Hannifin and CLARCOR were the only suppliers of EI-qualified aviation fuel filtration systems and filter elements to US customers The Divisionrsquos complaint filed on September 26 2017 alleged that Parkerrsquos acquisition eliminated all head-to-head competition between the only two domestic manufacturers of these products effectively creating a monopoly in the United States On December 18 2017 the Division filed a proposed final judgment requiring Parker-Hannifin to divest its Facet filtration business including the aviation fuel filtration assets that it acquired from CLARCOR The Division will move to enter the final judgment upon completion of the Tunney Act period
30 United States et al v The Dow Chemical Co and EI Du Pont De Nemours and Co No 1-17-cv-01176 (DDC filed June 15 2017) 31 United States v Parker-Hannifin Corp and CLARCOR Inc No 117-cv-01354-UNA (D Del Sept 26 2017) 32 EI is an independent international professional organization for the energy sector that publishes performance and testing standards for aviation fuel filtration products
14
In United States v Showa Denko KK SGL Carbon SE and SGL GE Carbon Holding LLC (USA)33 the Division challenged Showa Denko KKrsquos (SDK) proposed acquisition of SGL Carbon SErsquos global graphite electrodes business SDK and SGL Carbon were two of the three leading suppliers of large ultra-high power (UHP) graphite electrodes used in electric arc furnaces (EAFs) at steel mills in the United States The complaint alleged that the acquisition would eliminate head-to-head competition between SDK and SGL Carbon to supply large UHP graphite electrodes to US EAF steel mills resulting in higher prices and decreased quality of delivery and service A proposed final judgment filed simultaneously with the complaint on September 27 2017 required the parties to divest SGL Carbonrsquos graphite electrode business to Tokai Carbon Co Ltd SDK completed the divestiture on November 7 2017 and the court entered the final judgment on January 9 2018
2 The Federal Trade Commission
In DraftKingsFanDuel34 the Commission filed an administrative complaint challenging the merger of DraftKings and FanDuel two providers of paid daily fantasy sports contests The Commissions complaint alleged that the transaction would be anticompetitive because the merger would have combined the two largest daily fantasy sports websites which controlled more than 90 percent of the US market for paid daily fantasy sports contests The Commission alleged that consumers of paid daily fantasy sports were unlikely to view season-long fantasy sports contests as a meaningful substitute for paid daily fantasy sports due to the length of season-long contests the limitations on number of entrants and several other issues Shortly after the Commission filed its complaint the parties abandoned the merger on July 13 2017 and the Commission dismissed its administrative complaint
The Commission also accepted for public comment and finalized consent orders in the following 14 merger matters
In Abbott LaboratoriesSt Jude Medical 35 the Commission challenged Abbott Laboratories proposed $25 billion acquisition of St Jude Medical Inc The Commissions complaint alleged that the proposed merger would have harmed competition in the US markets for vascular closure devices which are used to close holes in arteries from the insertion of catheters and for ldquosteerablerdquo sheaths which are used to guide catheters for treating heart arrhythmias To remedy these concerns and maintain competition the Commission issued a consent order requiring the parties to divest all rights and assets related to St Judersquos vascular closure device business and Abbottrsquos steerable sheath business to Terumo Corporation and to help Terumo establish manufacturing capabilities for these products The consent order also required Abbott to notify the Commission if it intended to acquire lesion-assessing ablation catheter assets from Advanced Cardiac Therapeutics (ACT) Abbott and ACT formed a partnership to develop these types of catheters Currently only St Jude and one other company
33 United States v Showa Denko KK SGL Carbon SE and SGL GE Carbon Holding LLC (USA) No 117-cv-01992 (DDC filed Sept 27 2017) 34 In the Matter of DraftKings Inc and FanDuel Ltd FTC Dkt C-9375 (complaint filed on June 19 2017) available at httpswwwftcgovenforcementcases-proceedings161-0174draft-kings-inc-fanduel-limited 35 In the Matter of Abbott Laboratories and St Jude Medical Inc FTC Dkt C-4600 (final order issued on Feb 23 2017) available at httpswwwftcgovenforcementcases-proceedings161-0126abbott-laboratories-st-jude-medical-matter
15
provide lesion-assessing ablation catheters in the United States After the acquisition of St Jude if Abbott acquired lesion-assessing ablation catheter assets from ACT it could eliminate additional competition Following a public comment period the Commission approved the final order on February 23 2017
In CentraCare HealthSCMG36 the Commission challenged CentraCare Healths proposed acquisition of St Cloud Medical Group PA (SCMG) The Commissions complaint alleged that the proposed merger would have combined the two largest providers of adult primary care pediatric and OBGYN services in the St Cloud Minnesota area By eliminating SCMG as a potential alternative in the St Cloud area the acquisition would have increased CentraCare Healthrsquos bargaining power vis-agrave-vis commercial health plans allowing it to raise reimbursement rates and secure more favorable payment terms Prior to the proposed acquisition however SCMG was failing financially had lost a number of physicians from its practice and was likely to lose more physicians if the merger did not close Over the course of a multi-year search SCMG was unable to identify an alternative purchaser to CentraCare Health However at least one local provider had expressed interest in expanding its practice by hiring some of SCMGrsquos physicians To remedy these concerns regarding the proposed merger and maintain competition the Commission issued a consent order requiring CentraCare Health to lift non-compete provisions and permit some adult primary care pediatric and OBGYN physicians to leave the health system and work for other local providers or establish a new practice in the area Following a public comment period the Commission approved the final order on January 9 2017
In CH Boehringer SohnSanofi37 the Commission challenged CH Boehringer Sohnrsquos proposed $135 billion animal health products asset swap with Sanofi The Commissions complaint alleged that the proposed asset swap would likely have harmed competition in US markets for various vaccines for companion animals and certain parasite control products for cattle and sheep Specifically the merger as proposed would likely substantially reduce competition in five markets (1) canine vaccines (2) feline vaccines (3) rabies vaccines (4) products to prevent and control outbreaks of parasites in cattle and (5) products to prevent and control outbreaks of parasites in sheep To remedy these concerns and maintain competition the Commission issued a consent order requiring Boehringer to divest its companion animal vaccines to Eli Lilly and Co and divest its Elanco Animal Health division and the parasite control products to Bayer AG Following a public comment period the Commission approved the final order on February 24 2017
In EnbridgeSpectra Energy38 the Commission challenged Enbridge Incs proposed $28 billion acquisition of Spectra Energy Corporation The Commissions complaint alleged that Enbridges the proposed merger would have harmed competition in the market for the pipeline transportation of natural gas in three production areas off the coast of Louisiana According to
36 In the Matter of CentraCare Health System FTC Dkt C-4594 (final order issued on Jan 9 2017) available at httpswwwftcgovenforcementcases-proceedings161-0096centracare-health-system 37 In the Matter of CH Boehringer Sohn AG amp Co KG FTC Dkt 4601 (final order issued on Feb 24 2017) available at httpswwwftcgovenforcementcases-proceedings161-0077ch-boehringer-sohn-matter 38 In the Matter of Enbridge Inc a corporation and Spectra Energy Corp FTC Dkt C-4604 (final order issued on Mar 24 2017) available at httpswwwftcgovenforcementcases-proceedings161-0215enbridge-spectra-energy
16
the Commissionrsquos complaint the merger likely would have reduced natural gas pipeline competition in three offshore natural gas producing areas in the Gulf of MexicomdashGreen Canyon Walker Ridge and Keathley Canyonmdashleading to higher prices for natural gas pipeline transportation from those areas In portions of the affected areas the merging partiesrsquo pipelines (Enbridges Walker Ridge Pipeline and Spectras 40 percent interest in the Discovery Pipeline) were the two pipelines located closest to certain wells and as a result were likely the lowest cost pipeline transportation options for these wells Furthermore the merger would have given Enbridge an ownership interest in both pipelines which would have given it access to competitively sensitive information of the Discovery Pipeline as well as significant voting rights over it providing Enbridge with the incentive and opportunity to unilaterally increase pipeline transportation costs for natural gas producers located in the affected areas The acquisition would have also increased the likelihood of tacit or explicit anticompetitive coordination between the Walker Ridge Pipeline and the Discovery Pipeline To remedy these concerns the Commission issued a consent order requiring Enbridge to establish firewalls to limit its access to non-public information about the Discovery Pipeline Board members of the Spectra-affiliated companies holding a 40 percent share in the Discovery Pipeline had to recuse themselves from any vote involving the pipeline with two limited exceptions Enbridge was also required to notify the Commission before acquiring an ownership interest in any natural gas pipeline operating in the Green Canyon Walker Ridge and Keathley Canyon areas or increasing its 40 percent ownership interest of Spectra affiliate DCP Midstream Partners LP in the Discovery Pipeline The consent order which is to remain in effect for 20 years allowed the Commission to appoint a monitor to ensure Enbridges compliance Following a public comment period the Commission approved the final order on March 24 2017
In China National Chemical CorpSyngenta AG39 the Commission challenged China National Chemical Corporations (ChemChina) proposed $43 billion acquisition of Syngenta The Commissions complaint alleged that the proposed merger would have reduced competition for three pesticides (1) the herbicide paraquat which is used to clear fields prior to the growing season (2) the insecticide abamectin which protects primarily citrus and tree nut crops by killing mites psyllid and leafminers and (3) the fungicide chlorothalonil which is used mainly to protect peanuts and potatoes According to the complaint Syngenta owned the branded version of these three pesticides giving it significant market shares in the United States ChemChinas subsidiary ADAMA was either the first- or second-largest generic supplier in the United States for these three pesticides To remedy these concerns the Commission issued a consent order requiring ChemChina to sell all rights and assets of ADAMArsquos USrsquos paraquat abamectin and chlorothalonil crop protection businesses to AMVAC an agrochemical company Following a public comment period the Commission approved the final order on June 16 2017
In DaVita IncRV ManagementRenal Ventures40 the Commission challenged DaVita Incs proposed $358 million acquisition of Renal Ventures Management LLC The
39 In the Matter of China National Chemical Corporation ADAMA Agricultural Solutions Ltd and Makhteshim Agan of North America Inc FTC Dkt C-4610 (final order issued on June 16 2017) available at httpswwwftcgovenforcementcases-proceedings1610093china-national-chemical-corporation-et-al 40 In the Matter of DaVita Inc RV Management Corp Renal Ventures Partners LLC Renal Ventures Limited LLC and Renal Ventures Management LLC FTC Dkt C-4616 (final order issued on June 14 2017) available at httpswwwftcgovenforcementcases-proceedings151-0204davita-rv-management-renal-ventures
17
Commissions complaint alleged that the proposed merger would have reduced competition for outpatient dialysis services At the time of the merger DaVita was the second-largest provider of outpatient dialysis services in the United States and Renal Ventures was the seventh largest According to the complaint competition between dialysis clinics happened at the local level and the acquisition would have led to significant anticompetitive effects in the New Jersey markets of Brick Clifton Somerville Succasunna and Trenton and in the Dallas-area markets of Denton and Frisco To remedy these concerns and maintain competition the Commission issued a consent order requiring DaVita to divest its ownership interest in seven clinics five in New Jersey and two in Texas to a Commission-approved buyer Following a public comment period the Commission approved the final order on June 14 2017
In Emerson ElectricPentair41 the Commission challenged Emerson Electric Cos proposed $315 billion acquisition of Pentair plc The Commissions complaint alleged that the proposed merger would have harmed competition for switchboxes the devices used to monitor and control valves that regulate the flow of liquids and gases in industrial facilities According to the complaint the acquisition would have combined the two leading manufacturers of switchboxes in the United States ndash which together controlled about 60 percent of the US market Emersonrsquos TopWorx and Pentairrsquos Westlock switchboxes were the most widely-used brands nationwide and for many customers the only acceptable brands of switchboxes To remedy these concerns the Commission issued a consent order requiring Emerson to divest Westlock Controls Corporation the Pentair subsidiary to Crane Co within 10 days after Emerson acquired Pentair Following a public comment period the Commission approved the final order on June 30 2017
In Sherwin-WilliamsValspar42 the Commission challenged Sherwin-Williams Cos proposed $113 billion acquisition of Valspar Corporation The Commissions complaint alleged that the proposed acquisition would have reduced competition in the North American market for industrial wood coatings used to make furniture kitchen cabinets and building products where Sherwin-Williams and Valspar were two of the top three industrial wood coatings manufacturers Industrial wood coatings which include stains topcoats and sealants provide better resistance to abrasion and water than consumer wood coatings To remedy these concerns the Commission issued a consent order requiring Sherwin-Williams to divest two Valspar industrial wood coatings plants one in High Point North Carolina and the other in Cornwall Ontario to Axalta Coating Systems Ltd a leading supplier of coatings to large automotive and industrial original equipment manufacturers Following a public comment period the Commission approved the final order on July 28 2017
In Alimentation Couche-TardCST Brands43 the Commission challenged Alimentation Couche-Tard Incs proposed $44 billion acquisition of CST Brands Inc The Commissions
41 In the Matter of Emerson Electric Company and Pentair plc FTC Dkt C-4615 (final order issued on June 30 2017) available at httpswwwftcgovenforcementcases-proceedings161-0221emerson-electric-pentair 42 In the Matter of The Sherwin-Williams Company and The Valspar Corporation FTC Dkt C-4621 (final order issued on July 28 2017) available at httpswwwftcgovenforcementcases-proceedings161-0116sherwin-williamsvalspar-matter 43 In the Matter of Alimentation Couch-Tard Inc and CST Brands Inc FTC Dkt C-4618 (final order issued on August 14 2017) available at httpswwwftcgovenforcementcases-proceedingsfile-no-161-0207-docket-no-c-4618alimentation-couche-tard-cst-brands
18
complaint alleged that the proposed merger would have reduced competition for the retail sales of gasoline and diesel in 71 local markets At the time of the merger Alimentation Couche-Tard operated convenience stores and retail fuel stations worldwide including nearly 4700 in United States Its convenience stores primarily operate under the Circle K and Kangaroo Express banners and the retail fuel sells under numerous brands CST operated 1146 convenience stores and retail fuel stations in the United States Its convenience stores primarily operated under the Corner Store banner while its fuel stations generally use the Valero brand According to the complaint the geographic markets for the retail sale of gasoline and diesel were local and generally ranged from a few blocks to a few miles The complaint alleged that without a remedy the merger would have increased market concentration for the retail sales of gasoline or diesel in each of the 71 local markets resulting in a monopoly in ten markets and reduced the number of competitors in the rest from three to two competitors To remedy these concerns the Commission issued a consent order requiring Alimentation Couche-Tard to divest 70 CST fuel stations to Empire Petroleum Partners The divested fuel stations were located in Arizona Colorado Florida Georgia Louisiana New Mexico Ohio and Texas Following a public comment period the Commission approved the final order on August 14 2017
In BroadcomBrocade Communications Systems44 the Commission challenged Broadcom Limiteds proposed $59 billion acquisition of Brocade Communications Systems Inc The Commissions complaint alleged that the proposed merger would have been anticompetitive because of Broadcoms access to the confidential business information of Brocades major competitor Cisco Systems Such information could be used to restrain competition or slow innovation in the worldwide market for fibre channel switches According to the complaint Brocade and Cisco were the only two competitors in the worldwide market for fibre channel switches and Broadcom supplied both companies with application-specific integrated circuits to make fibre channel switches The complaint further alleged that as the new owner of Brocade Broadcom could have used Ciscos confidential business information to unilaterally exercise market power or to coordinate action among Brocade and Cisco increasing the likelihood that customers would pay higher prices for fibre channel switches To remedy these concerns the Commission issued a consent order preventing Broadcom from using Ciscos competitively sensitive confidential information for any purpose other than designing manufacturing and selling fibre channel application-specific integrated circuits for Cisco To assure compliance the Commission appointed a monitor for five years The Commission cooperated with its counterparts in a number of jurisdictions that also reviewed the transaction including the European Commission China and Japan Following a public comment period the Commission approved the final order on August 17 2017
In Abbott LaboratoriesAlere 45 the Commission challenged Abbott Laboratoriesrsquo proposed $83 billion acquisition of Alere Inc over concerns that the proposed merger would have harmed competition in the United States for the sale of two types of medical devices point-of-care blood gas testing systems and point-of-care cardiac marker testing systems Point-of-
44 In the Matter of Broadcom Ltd and Brocade Communications Systems Inc FTC Dkt C-4622 (final order issued on August 17 2017) available at httpswwwftcgovenforcementcases-proceedings171-0027broadcom-limitedbrocade-communications-systems 45 In the Matter of Abbott Laboratories and Alere Inc FTC Dkt C-4625 (final order issued on Nov 14 2017) available at httpswwwftcgovenforcementcases-proceedings161-0084abbott-laboratories-alere-inc
19
care blood gas testing systems measure blood pH oxygen carbon dioxide and electrolyte levels in the blood Point-of-care cardiac marker testing systems measure specific proteins in the blood to access whether a patient is having a heart attack To remedy these concerns the Commission issued a consent order requiring Alere to divest its blood gas testing systems to Siemens Aktiengelsellschaft and its cardiac marker testing systems to Quidel Corporation Following a public comment period the Commission approved the final order on November 14 2017
In Integra LifesciencesJohnson amp Johnson 46 the Commission challenged Integrarsquos proposed $1 billion acquisition of Johnson amp Johnsonrsquos Codman Neuro division The Commissionrsquos complaint alleged that the proposed merger would have harmed competition in five medical device product market lines used in operative neurosurgery hydrocephalus management and neuro-critical care To remedy these concerns the Commission issued a consent order requiring Integra to sell these medical device product lines to Natus Medical Inc In addition the consent order required Integra to divest its manufacturing facility in San Diego and supply Natus with cranial access kits until Natus secured its own supply Following a public comment period the Commission approved the final order on December 22 2017
In Baxter InternationalClaris Lifesciences and Arjun Handa 47 the Commission challenged Baxterrsquos proposed $625 million acquisition of Clarisrsquo injectable drugs business The Commissionrsquos complaint alleged that the proposed merger would have reduced competition in the market for the antifungal agent fluconazole in saline intravenous bags as well as future competition in the market for milrinone in dextrose intravenous bags which dilates blood vessels lowers blood pressure and allows blood to flow more easily through the cardiovascular system To remedy these concerns the Commission issued a consent order requiring the parties to divest all of Clarisrsquos rights to these injectable drugs to Renaissance Lakewood Pharmaceuticals Following a public comment period the Commission approved the final order on August 30 2017
In Mars IncVCA48 the Commission challenged Marsrsquo proposed $91 billion acquisition of pet care company VCA alleging that the proposed merger would have harmed competition for certain specialty and emergency veterinary services in ten localities in the United States by eliminating head-to-head competition between Mars and VCA specialists The Commission issued a consent order requiring the parties to divest clinics in Kansas City New York Phoenix Chicago Corpus Christi San Antonio and two clinics in Seattle Under the terms of the consent order Mars was required for ten years to notify the Commission if it planned to acquire any additional specialty or emergency veterinary clinics in certain geographic areas The consent order also required both Mars and VCA to secure all third-party consents assignments and releases permitting the buyers to conduct business at the divested clinics Following a public comment period the Commission approved the final order on December 19 2017
46 In the Matter of Integra Lifesciences Corp and Johnson amp Johnson FTC Dkt C-4624 (final order issued on Dec 22 2017) available at httpswwwftcgovenforcementcases-proceedings171-0084integra-lifesciences-johnson-johnson 47 In the Matter of Baxter International Inc Claris Lifesciences Limited and Arjun Handa FTC Dkt C-4620 (final order issued on August 30 2017) available at httpswwwftcgovenforcementcases-proceedings171-0052baxter-international-inc-claris-lifesciences-limited-arjun 48 In the Matter of Mars Inc and VCA Inc FTC Dkt C-4633 (final order issued on December 19 2017) available at httpswwwftcgovenforcementcases-proceedings171-0057mars-incorporated-vca-inc
20
ONGOING REASSESSMENT OF THE EFFECTS OF THE PREMERGER NOTIFICATION PROGRAM
The Commission and the Antitrust Division continually review the impact of the premerger notification program on the business community and antitrust enforcement The premerger notification program ensures that the antitrust agencies review virtually every relatively large merger and acquisition that affects US consumers before consummation Prior to the HSR Act businesses could and often did consummate transactions that raised significant antitrust concerns before the agencies had an opportunity to consider adequately their competitive effects This practice forced the agencies to engage in lengthy post-acquisition litigation during the course of which the transactionrsquos anticompetitive effects continued to harm consumers and if effective post-acquisition relief was not practicable the harm continued Because the premerger notification program requires reporting before consummation the agenciesrsquo ability to obtain timely effective relief to prevent anticompetitive effects has vastly improved Thus the HSR Act is doing what Congress intendedmdashgiving the government the opportunity to investigate and challenge those relatively large mergers that are likely to harm consumers before injury can arise
The Commission and the Antitrust Division also regularly examine the premerger notification programrsquos effectiveness and continually seek ways to increase accessibility promote transparency and improve the review process to reduce the burden on the filing parties without compromising the agenciesrsquo ability to investigate and challenge proposed transactions that may substantially lessen competition
21
LIST OF APPENDICES
Appendix A Summary of Transactions Fiscal Years 2008 - 2017
Appendix B Number of Transactions Reported and Filings Received by Month for Fiscal Years 2008 - 2017
LIST OF EXHIBITS
Exhibit A Statistical Tables for Fiscal Year 2017 ndash Data ProfilingHart-Scott-Rodino Notification Filings and Enforcement Interests
Adjusted Transactions In Which A Second Request Could Have Been 1656 684 1128 1414 1400 1286 Issued2
Investigations in Which Second Requests 41 31 42 55 49 47Were Issued FTC3 21 15 20 24 20 25
Percent4 13 22 18 17 14 19
DOJ3 20 16 22 31 29 22
Percent4 12 23 20 22 21 17
Transactions Involving a Request For 1385 575 953 1157 1094 990Early Termination5
Granted5 1021 396 704 888 902 797
Not Granted5 364 179 249 269 192 193
2014
1663
3307
1618
51
30
19
21
13
1274
1020
254
2015
1801
3585
1754
47
20
11
27
15
1366
1086
280
2016
1832
3674
1772
54
25
14
29
16
1374
1102
272
2017
2052
4083
1992
51
33
17
18
09
1552
1220
332 Note The data for FY 2010 and FY 2011 reflect corrections to some prior annual reports and the DOJ number of investigations in which second requests were issued and the percentage of transactions in which second requests were issued by DOJ
1 Usually two filings are received one from the acquiring person and one from the acquired person when a transaction is reported Only one application is received when an acquiring party files for an exemption under Section 7A (c )(6) or (c )(8) of the Clayton Act
2 These figures omit from the total number of transactions reported all transactions for which the agencies were not authorized to request additional information These include (1) incomplete transactions (only one party filed a complete notification) (2) transactions reported pursuant to the exemption provisions of Sections 7A (c)(6) and 7A(c)(8) of the Act (3) transactions which were found to be non-reportable and (4) transactions withdrawn before the waiting period began In addition where a party filed more than one notification in the same year to acquire voting securities of the same corporation eg filing one threshold and later filing for a higher threshold only a single consolidated transaction has been counted because as a practical matter the agencies do not issue more than one Second Request in such a case These statistics also omit from the total number the transactions reported secondary acquisitions filed pursuant to sect8014 of the Premerger Notification rules Secondary acquisitions have been deducted in order to be consistent with the statistics presented in most of the prior annual reports
3 These statistics are based on the date the Second Request was issued and not the date the investigation was opened 4 Second Request investigations are a percentage of the total number of adjusted transactions The total percentage reflected in Figure 2 may not equal the sum of reported component values due to rounding
5 These statistics are based on the date of the HSR filing and not the date action was taken on the request
APPENDIX B
NUMBER OF TRANSACTIONS REPORTED
AND
FILINGS RECEIVED BY MONTH
FOR
FISCAL YEARS 2008 - 2017
APPENDIX B TABLE 1 NUMBER OF TRANSACTIONS REPORTED BY MONTH FOR FISCAL YEARS
October
November
December
January
February
March
April
May
June
July
August
September
TOTAL
2008 2009 2010 2011 2012 2013 2014 2015 2016
158 91 66 128 122 127 124 144 168
191 85 135 217 169 260 159 157 243
172 37 84 91 95 92 108 122 157
158 42 62 97 104 78 125 118 117
119 32 61 81 90 82 114 140 127
131 42 116 97 111 87 100 128 125
128 60 92 96 96 77 140 131 129
150 58 108 142 117 117 157 152 168
146 51 108 117 142 90 150 155 150
128 62 94 120 130 91 162 170 140
126 77 120 164 133 122 151 216 166
119 79 120 100 120 103 173 168 142
1726 716 1166 1450 1429 1326 1663 1801 1832
2017
163
215
148
153
153
146
150
209
191
146
219
159
2052
APPENDIX B TABLE 2 NUMBER OF FILINGS RECEIVED1 BY MONTH FOR FISCAL YEARS
October
November
December
January
February
March
April
May
June
July
August
September
TOTAL
2008 2009 2010 2011 2012 2013 2014 2015
319 185 146 252 242 255 247 289
380 165 242 422 332 511 325 322
343 79 177 193 188 180 211 239
316 77 126 188 203 151 244 244
246 63 116 157 185 169 236 257
242 81 232 195 215 172 195 252
272 119 182 190 193 151 271 265
294 114 216 284 231 228 315 305
293 99 213 231 275 181 304 322
259 121 187 240 269 186 323 327
251 149 238 329 259 240 292 425
240 159 243 201 237 204 344 338
3455 1411 2318 2882 2829 2628 3307 3585
2016
345
483
314
236
249
265
249
331
304
284
339
275
3674
2017
329
416
297
307
298
302
290
402
388
291
446
317
4083
1 Usually two filings are received one from the acquiring person and one from the acquired person when the transaction is reported Only one filing is received when an acquiring person files for a transaction that is exempt under Sections 7A(c)(6) and (c)(8) of the Clayton Act
EXHIBIT A
STATISTICAL TABLES
FOR
FISCAL YEAR 2017
DATA PROFILING HART-SCOTT-RODINO PREMERGER NOTIFICATION FILINGS AND ENFORCEMENT INTERESTS
5
5
5
5
5
5
5
TABLE I 1FISCAL YEAR 2017
2ACQUISITIONS BY SIZE OF TRANSACTION (BY SIZE RANGE)
TRANSACTION RANGE ($MILLIONS)
HSR TRANSACTIONS CLEARANCE GRANTED TO FTC OR DOJ 3SECOND REQUEST INVESTIGATIONS
812 Personal and Laundry Services 5 03 -01 0 0 0 0 0 0 0
TABLE XI 1FISCAL YEAR 2017
INDUSTRY GROUP OF ACQUIRED ENTITIES
3 DIGIT NAICS
11CODE INDUSTRY DESCRIPTION
4NUMBER
PERCENT OF TOTAL
POINTS CHANGE FROM FY
2016 12
CLEARANCE GRANTED TO FTC
OR DOJ
SECOND REQUEST 3INVESTIGATIONS
NUMBER OF 3 DIGIT INTRA-
INDUSTRY TRANSAC-
TIONS 14FTC DOJ TOTAL FTC DOJ TOTAL
1992 1000 205 72 277 33 18 51 508
1 Fiscal year 2017 figures include transactions reported between October 1 2016 and September 30 2017
2 The size of transaction is based on the aggregate total amount of voting securities non-corporate interests andor assets held by the acquiring person as a result of the transaction and are taken from the response to Item 2(d)(iii) 2(d)(vii) and 2(d)(ix) of the Notification and Report Form
3 These statistics are based on the date the Second Request was issued
4 During fiscal year 2017 2052 transactions were reported under the HSR Premerger Notification program The smaller number 1992 reflects the adjustments to eliminate the following types of transactions (1) transactions reported under Section 7A(c)(6) and (c)(8) (transactions involving certain regulated industries and financial businesses) (2) transactions deemed non-reportable (3) incomplete transactions (only one party in each transaction filed a compliant notification) and (4) transactions withdrawn before the waiting period began The table does not however exclude competing offers or multiple HSR transactions resulting from a single business transaction (where there are multiple acquiring persons or acquired persons)
5 The total number of filings under $50M submitted in Fiscal Year 2017 reflects corrective filings
6 In February 2001 legislation raised the size of transaction from $15 million to $50 million with annual adjustments beginning in February 2005 As of FY 2017 the threshold categories include non-corporate interests (NCI) encompassing transactions in which the acquiring entity acquires 50 of more of the non-corporate interests of the acquired entity
7 The category labeled ldquoSales Not Availablerdquo includes newly-formed acquiring persons foreign acquiring person with no United States revenues and acquiring persons who had not derived any revenues from their investments at the time of filing
8 Assets of an acquired entity are not available when the acquired entityrsquos financial data is consolidated within its ultimate parent
9 Sales of an acquired entity are taken from responses to Item 4(a) and (b) (SEC documents and annual reports) or item 5 (dollar revenues) of the Premerger Notification and Report Form
10 This category includes acquisition of newly-formed entities from which no sales were generated and acquisitions of assets which produced no sales revenues during the prior year to filing the Notification and Report Form
11 The 3-digit codes are part of the North American Industrial Classification System (NAICS) established by the United States Government North American Industrial Classification System 1997 Executive Office of the President Office of Management and Budget The NAICS groups used in this table were determined from responses submitted by the parties to Item 5 of the Premerger Notification and Report Form
12 This represents the deviation from the fiscal year 2016 percentage
13 This category includes transactions by newly-formed entities
14 The intra-industry transactions column identifies the number of acquisitions in which both the acquiring and acquired person derived revenues from the same 3-digit NAICS code
INTRODUCTION
A STATISTICAL PROFILE OF THE PREMERGER NOTIFICATION PROGRAM
A STATISTICAL PROFILE OF THE PREMERGER NOTIFICATION PROGRAM
DEVELOPMENTS WITHIN THE PREMERGER PROGRAM
~
~ ~ ~
-
LZ7 ~
~
~ - ~
~
-
-
-
-
-_I__ _I_ _ I _I_ ~7 -
FTC and 18 issued by the Antitrust Division) while Second Requests were issued in 54 merger investigations in fiscal year 2016 (25 issued by the FTC and 29 issued by the Antitrust Division) The percentage of transactions in which a Second Request was issued decreased from 30 percent in fiscal year 2016 to 26 percent in fiscal year 2017 See Figure 2 below
Percentage of Transactions Resulting in Second Request Fiscal Years 2008-2017
50
45
40
35
30
25
20
15
10
05
00
The statistics in Appendix A also show that early termination of the waiting period is requested in the majority of transactions In fiscal year 2017 early termination was requested in 779 percent (1552) of the adjusted transactions reported In fiscal year 2016 early termination was requested in 775 percent (1374) of the transactions reported The percentage of requests granted out of the total requested decreased from 802 percent in fiscal year 2016 to 786 percent in fiscal year 2017
The tables (Tables I through XI) in Exhibit A contain information regarding the agenciesrsquo enforcement activities for transactions reported in fiscal year 2017 The tables provide for example various characteristics of transactions the number and percentage of transactions in which one antitrust agency granted the other clearance to commence an investigation and the number of merger investigations in which either agency issued Second Requests Table III of Exhibit A shows that in fiscal year 2017 the agencies received clearance to conduct an initial investigation in 139 percent of the total number of transactions reported The tables also provide the number of transactions based on the dollar value of transactions reported and the
reporting threshold indicated in the notification report In fiscal year 2017 the aggregate dollar value of reported transactions was $18 trillion10
Tables X and XI provide the number of transactions by industry group in which the acquiring person or the acquired entity derived the most revenue Figure 3 illustrates the percentage of reportable transactions within industry groups for fiscal year 2017 based on the acquired entityrsquos operations11
Percentage of Transactions By Industry Group of Acquired EntityFiscal Year 2017
Chemicals amp Health Services Pharmaceuticals Transportation
Energy amp Natural Consumer Goods amp Resources 73 Services 259
(Figure 3)
Other 194
Banking amp Insurance 78
Information Technology 107
48 59 39
Manufacturing 144
10 The information on the value of reported adjusted transactions for fiscal year 2017 is drawn from a database maintained by the Premerger Notification Office 11 The category designated as ldquoOtherrdquo consists of industry segments that include construction educational services performing arts recreation and other non-classifiable businesses
7
DEVELOPMENTS WITHIN THE PREMERGER PROGRAM
1 Threshold Adjustments
The 2000 amendments to the HSR Act require the Commission to publish adjustments to the Actrsquos jurisdictional and filing fee thresholds in the Federal Register annually for each fiscal year beginning on September 30 2004 based on the change in the gross national product in accordance with Section 8(a)(5) of the Clayton Act The Commission amended the rules in 2005 to provide a method for future adjustments as required by the 2000 amendments and to reflect the revised thresholds contained in the rules The Commission publishes the revised thresholds annually in January and they become effective 30 days after publication
On January 26 2017 the Commission published a notice12 to reflect adjustment of the reporting thresholds as required by the 2000 amendments13 to Section 7A of the Clayton Act 15 USC sect 18a The revised thresholds including an increase in the size of transaction threshold from $782 million to $808 million became effective February 27 2017
2 Compliance
The Commission and the Antitrust Division continued to monitor compliance with the premerger notification programrsquos filing and waiting period requirements and initiated a number of compliance investigations in fiscal year 2017 The agencies use several methods to oversee compliance including monitoring news outlets and industry publications for transactions that may not have been reported in accordance with the HSR Actrsquos requirements Industry sources such as competitors customers and suppliers interested members of the public and in certain cases the parties themselves also provide the agencies with information about transactions and possible violations of the Actrsquos requirements
Under Section 7A(g)(1) of the Act any person that fails to comply with the Actrsquos notification and waiting period requirements is liable for a civil penalty of up to $40654 for each day the violation continues14 The antitrust agencies examine the circumstances of each violation to determine whether to seek penalties15 During fiscal year 2017 50 post-consummation ldquocorrectiverdquo filings were received and the agencies brought four enforcement actions resulting in $22 million in civil penalties
12 82 Fed Reg 8524 (Jan 26 2017) 13 15 USC sect18a(a) See Pub L No 106-553 114 Stat 2762 14 Dollar amounts specified in civil monetary penalty provisions within the Commissionrsquos jurisdiction are adjusted for inflation in accordance with the Federal Civil Penalties Inflation Adjustment Act Improvements Act of 2015 Pub L No 114-7 (Nov 2 2015) The adjustments have included an increase in the maximum civil penalty from $10000 to $11000 for each day during which a person is in violation of Section 7A(g)(1) (61 Fed Reg 54548 (Oct 21 1996) corrected at 61 Fed Reg 55840 (Oct 29 1996)) to $16000 effective February 10 2009 (74 Fed Reg 857 (Jan 9 2009)) to $40000 effective August 1 2016 (81 Fed Reg 42476 (June 30 2016)) and to $40654 effective January 24 2017 (81 Fed Reg 8135 (Jan 24 2017)) 15 If parties inadvertently fail to file the agencies generally will not seek penalties so long as the parties promptly submit corrective filings after discovering the failure to file submit an acceptable explanation of their failure to file and have not previously violated the Act
8
In United States v Duke Energy Corp16 the complaint alleged that Duke Energy Corporation violated the HSR Act when after agreeing to purchase the Osprey Energy Center from Calpine Corporation Duke took control of Ospreyrsquos business before filing required HSR Act notifications and waiting for the expiration of the mandatory waiting period At the same time that Duke had agreed to purchase Osprey Duke entered into a so-called ldquotolling agreementrdquo that immediately gave Duke control over Ospreyrsquos output and gave Duke the right to receive the day-to-day profits and losses from Ospreyrsquos business As a result from the moment the tolling agreement went into effect Osprey ceased to be an independent competitor Under the terms of a proposed final judgment filed January 18 2017 Duke Energy agreed to pay a $600000 civil penalty to resolve the lawsuit On April 7 2017 the court entered the final judgment
In United States v Mitchell P Rales17 the complaint alleged that investor Mitchell P Rales violated the HSR Act in October 2011 by failing to report voting shares valued in excess of $1319 million that his wife acquired in Colfax The complaint also alleged that Mr Rales violated the HSR Act in January 2008 by failing to report voting shares valued in excess of $5979 million that he acquired in Danaher Although Mr Rales contended that the violations were inadvertent the Commission determined to seek penalties because as noted in the complaint Mr Rales had paid civil penalties to settle an earlier HSR enforcement action brought by the Department of Justice in 1991 Under the terms of a proposed final judgment filed at the same time as the complaint Mr Rales agreed to pay a $720000 civil penalty to resolve the lawsuit On April 12 2017 the court entered the final judgment
In United States v Ahmet H Okumus18 the complaint alleged that hedge fund founder Ahmet H Okumus violated the HSR Act in June 2016 by failing to report voting shares valued in excess of $1563 million that his hedge fund Okumus Opportunistic Value Fund Ltd acquired in Webcom Although the Commission found Mr Okumusrsquos HSR violation to be inadvertent it sought penalties because as noted in the complaint this was Mr Okumusrsquos second HSR violation in two years regarding Webcom Under the terms of a proposed final judgment filed at the same time as the complaint Mr Okumus agreed to pay a $180000 civil penalty to resolve the lawsuit On April 21 2017 the court entered the final judgment
In United States v Fayez Sarofim19 the complaint alleged that Fayez Sarofim violated the HSR Act in 2001 2006 and 2012 by failing to report voting shares of Kinder Morgan valued in excess of $15 million in 2001 $1134 million in 2006 and $6821 million in 2012 The complaint also alleged that Mr Sarofim violated the HSR Act in May 2007 by failing to report voting shares valued in excess of $598 million that he acquired in Unitrin which later changed its name to Kemper The Commission found that Mr Sarofim was not entitled to rely upon the ldquoinvestment-onlyrdquo exemption which exempts acquisitions of up to ten percent of voting
16 United States v Duke Energy Corporation No 117-cv-00116 (DDC filed Jan 18 2017) available at httpswwwjusticegovatrcaseus-v-duke-energy-corporation 17 United States v Mitchell P Rales No 117-cv-00103 (DDC filed Jan 17 2017) available at httpswwwftcgovenforcementcases-proceedings161-0135mitchell-p-rales 18 United States v Ahmet H Okumus No 117-cv-00104 (DDC filed Jan 17 2017) available at httpswwwftcgovenforcementcases-proceedings161-0189ahmet-h-okumus 19 United States v Fayez Sarofim No 116-cv-02156 (DDC filed Oct 28 2016) available at httpswwwftcgovenforcementcases-proceedings151-0064united-states-federal-trade-commission-v-fayez-sarofim
9
securities if they are made solely for investment purposes This exemption however is not available to individuals who serve on the board of directors of the issuer at the time the shares are acquired and Mr Sarofim served on Kinder Morgans and Unitrins board before he made the securities purchases at issue Under the terms of a proposed final judgment filed at the same time as the complaint Mr Sarofim agreed to pay a $720000 civil penalty to resolve the lawsuit On January 26 2017 the court entered the final judgment
MERGER ENFORCEMENT ACTIVITY20
1 The Department of Justice
During fiscal year 2017 the Antitrust Division challenged 18 merger transactions that it concluded would have substantially lessened competition if allowed to proceed as proposed In 11 of these challenges the Antitrust Division filed a complaint in US district court In nine of these court challenges the Division filed settlement papers simultaneously with the complaint The remaining two court challenges were initiated as litigation In one after a trial on its merits the court found in favor of the Division and blocked the merger In the other the parties reached a settlement with the Division before the trial commenced Of the seven fiscal 2017 challenges where the Division did not file suit the parties abandoned the proposed transaction in six instances and in the remaining instance the parties restructured the transaction resolving the Divisionrsquos concerns21
In United States v Westinghouse Air Brake Technologies Corp and Faiveley Transport SA and Faiveley Transport North America22 the Division challenged the proposed acquisition of Faiveley Transport SA including its wholly-owned subsidiary Faiveley Transport North America (collectively Faiveley) by Westinghouse Air Brake Technologies Corporation (Wabtec) The complaint alleged that the transaction as originally structured would have substantially lessened competition for the development manufacture and sale of various freight railcar brake components by eliminating Faiveley as one of only three major companies supplying freight car brake components in the US The transaction would have also eliminated future competition for control valves by preventing Faiveleyrsquos entry into this market and would have thus maintained a century-old duopoly between Wabtec and its only other control valve rival A proposed final judgment filed simultaneously with the complaint on October 26 2016 required Wabtec to divest Faiveleyrsquos entire US freight car brakes business including all assets relating to Faiveleyrsquos freight car control valve development project (known as the FTEN) to
20 The cases listed in this section were not necessarily reportable under the premerger notification program Given the confidentiality of information obtained pursuant to the Act it would be inappropriate to identify the cases initiated under the program except in those instances in which that information has already been disclosed 21 (1) Lam Research Corporationrsquos proposed acquisition of KLA-Tencor Corporation (semiconductor fabrication tools) (2) Proposed slots exchange between American Airlines and United Airlines (3) Republic Airways Holding Inc proposed restructuring from bankruptcy by granting equity shares to American Airlines Group Inc Delta Air Lines Inc and United Continental Holdings Inc (4) Qatar Airways proposed acquisition of a stake in American Airlines (5) Proposed joint venture between First Data Corporation and FleetCor Technologies Inc(prepaid card processing) (6) tronc Incrsquos (owner of the Chicago Tribune) proposed acquisition of the Chicago Sun-Times from Wrapports Inc and (7) Raycom Media Incrsquos proposed acquisition of certain broadcast television stations from Calkins Media Inc 22 United States v Westinghouse Air Brake Technologies Corp Faiveley Transport SA and Faiveley Transport North America No 116-cv-02147 (DDC filed Oct 26 2016)
10
Amsted Rail Company Inc The divestiture was completed on November 30 2016 and the Court entered the final judgment on April 10 2017
In United States v Energy Solutions Inc Rockwell Holdco Inc Andrews County Holdings Inc and Waste Control Specialists LLC23 the Division filed suit to enjoin Energy Solutions Inc (ES) a wholly-owned subsidiary of Rockwell Holdco Inc from acquiring Waste Control Specialists LLC (WCS) a wholly-owned subsidiary of Andrews County Holdings Inc The complaint alleged that the transaction would have combined the only two licensed commercial low-level radioactive waste (LLRW) disposal facilities for 36 states Puerto Rico and the District of Columbia There are only four licensed LLRW disposal facilities in the United States Two of these facilities however did not accept LLRW from the relevant states The complaint alleged that ESrsquos Clive facility in Utah and WCSrsquos Andrews facility in Texas were the only two significant disposal alternatives available in the relevant states for the commercial disposal of higher-activity and lower-activity LLRW At trial one of the defenses asserted by the defendants was that that WCS was a failing firm and absent the transaction its assets would imminently exit the market The Division argued that the defendants did not show that WCSrsquos assets would in fact imminently exit the market given its failure to make good-faith efforts to elicit reasonable alternative offers that might be less anticompetitive than its transaction with ES On June 21 2017 after a 10-day trial the US District Court for the District of Delaware ruled in favor of the Division
In United States v Alaska Air Group Inc and Virgin America Inc24 the Division challenged Alaska Air Group Incrsquos proposed acquisition of Virgin America Inc While the combined company would have become only the fifth-largest domestic airline Alaskarsquos codeshare agreement with American Airlines Group Inc threatened to curb important competition supplied by Virgin on routes where it competed with American once these routes became part of Alaskarsquos network A codeshare agreement allows each airline to market tickets for certain flights operated by the other airline The complaint alleged that the codeshare agreement with American would have incentivized Alaska to cooperate rather than compete with American on each of the twenty nonstop routes on which Virgin and American competed resulting in a reduction of service decreased service quality increased prices andor ceased operations on the Virgin-American overlap routes Under the terms of a proposed final judgment filed simultaneously with the complaint on December 6 2016 Alaska agreed to significantly reduce the scope of its codeshare agreement with American The proposed final judgment prohibited Alaska and American from codesharing on routes where Alaska offered competing nonstop service with American on routes where Virgin and American competed pre-merger and on routes where Alaska would otherwise be likely to launch new service in competition with American following the merger On June 23 2017 the court entered the final judgment
In United States v AMC Entertainment Holdings Inc and Carmike Cinemas Inc25 the Division challenged AMC Entertainment Holdings Incrsquos proposed acquisition of Carmike
23 United States v Energy Solutions Inc Rockwell Holdco Inc Andrews County Holdings Inc and Waste Control Specialists LLC No 116-cv-01056 (D Del filed Nov 16 2016) 24 United States v Alaska Air Group Inc and Virgin America Inc No 116-cv-02377 (DDC filed Dec 6 2016) 25 US v AMC Entertainment Holdings Inc and Carmike Cinemas Inc No 1-16-cv-02475 (DDC filed Dec 20 2016)
11
Cinemas Inc AMC and Carmike were the second-largest and fourth-largest movie theatre chains respectively in the United States Additionally AMC owned significant equity in National CineMedia LLC (NCM) and Carmike owned significant equity in SV Holdco LLC a holding company that owns and operates Screenvision Exhibition Inc NCM and Screenvision are the countryrsquos predominant preshow cinema advertising networks covering over 80 percent of movie theatre screens in the United States The complaint alleged that the proposed acquisition would have provided AMC with direct control of one of its most significant movie theatre competitors and in some cases its only competitor in 15 local markets in nine states As a result moviegoers likely would have experienced higher ticket and concession prices and lower quality services in these local markets The complaint further alleged that the acquisition would have allowed AMC to hold sizable interests in both NCM and Screenvision post-transaction resulting in increased prices and reduced services for advertisers and theatre exhibitors seeking preshow services On December 20 2016 a proposed final judgment was filed simultaneously with the complaint settling the lawsuit Under the terms of the decree AMC agreed to (1) divest theatres in the 15 local markets (2) reduce its equity stake in NCM to 499 percent (3) relinquish its seats on NCMrsquos Board of Directors and all of its other governance rights in NCM (4) transfer 24 theatres with a total of 384 screens to the Screenvision cinema advertising network and (5) implement and maintain ldquofirewallsrdquo to inhibit the flow of competitively sensitive information between NCM and Screenvision The court entered the final judgment on March 7 2017
In United States v Clear Channel Outdoor Holdings Inc and Fairway Media Group LLC26 the Division challenged a proposed asset exchange between Clear Channel Outdoor Holdings Inc and Fairway Media Group LLC Clear Channel sought to acquire certain Fairway billboards located in Atlanta Georgia and Fairway sought to acquire certain Clear Channel billboards located in Indianapolis Indiana along with billboards in other metropolitan areas The complaint alleged that as initially structured the transaction would have eliminated the substantial head-to-head competition between Clear Channel and Fairway in Atlanta and Indianapolis resulting in higher prices and lower quality services for advertisers who purchased outdoor advertising in those markets A proposed final judgment filed simultaneously with the complaint on December 22 2016 required the parties to divest 13 billboard structures in Indianapolis to Circle City Outdoor LLC and 44 billboard structures in Atlanta to Link Media Georgia LLC The divestitures were completed and on March 7 2017 the court entered the final judgment
In United States v Smiths Group PLC Safran SA Morpho Detection LLC and Morpho Detection International LLC27 the Division challenged Smiths Group plcrsquos proposed acquisition of the global explosive detection business of Morpho Detection LLC and Morpho Detection International (collectively Morpho) from Safran SA Smiths and Morpho were two of the three leading providers of desktop explosive trace detection (ETD) devices and related services in the United States ETD devices are used to detect trace amounts of explosives or narcotics on persons or objects in airports and other high-risk critical infrastructure sites The complaint filed
26 United States v Clear Channel Outdoor Holdings Inc and Fairway Media Group LLC No 116-cv-02497 (DDC filed Dec 22 2016)27 United States v Smiths Group PLC Safran SA Morpho Detection LLC and Morpho Detection International LLC No 117-cv-00580 (DDC filed Mar 30 2017)
12
on March 30 2017 alleged that the transaction as initially structured would have eliminated competition between Smiths and Morpho for desktop ETD devices sold for passenger air travel or air cargo transport applications in the United States This loss in competition likely would have given Smiths the ability and incentive to raise prices decrease the quality of service and lessen innovation for customers including the Department of Homeland Security in the United States Under the terms of a proposed final judgment filed simultaneously with the complaint Smiths agreed to divest Morphorsquos global ETD business which included desktop handheld and portal ETD devices On June 23 2017 the final judgment was entered by the court The Division cooperated closely with the European Commission throughout the course of its investigation
In United States v Danone SA and The WhiteWave Foods Company28 the Division challenged Danone SArsquos proposed acquisition of The WhiteWave Foods Company Inc Danone a leading US manufacturer of organic yogurt had participated in the raw organic milk and fluid organic milk markets for the past two decades through a strategic partnership and supply and licensing agreements with WhiteWaversquos closest competitor CROPP Cooperative As a result Danonersquos acquisition of WhiteWave would have effectively combined WhiteWave and CROPP the top purchasers of raw organic milk in the Northeast and the producers of the three leading brands of fluid organic milk in the United States The complaint alleged that the transaction as originally structured likely would have resulted in less favorable contract terms for Northeast farmers for the purchase of their raw organic milk and would have aligned the interests of the producers of the only three national fluid organic milk brandsmdashStonyfield Horizon and Organic Valleymdashrisking higher prices and fewer choices for US customers A proposed final judgment filed simultaneously with the complaint on April 3 2017 required Danone to divest Stonyfield Farm Inc including the supply and licensing agreements with CROPP On July 13 2017 the court entered the final judgment
In United States v General Electric Co and Baker Hughes Incorporated29 the Division challenged the proposed acquisition of Baker Hughes Incorporated (ldquoBaker Hughesrdquo) by General Electric Co Baker Hughes and GE were two of the leading providers of refinery process chemicals in the United States covering over 50 percent of the market Refineries process crude oil and natural gas extracted from wells into finished products like gasoline GE and Baker Hughes were two of a few firms with the technical capabilities and expertise to provide refinery process chemicals and services in the United States and competed vigorously in price service quality and product development On June 12 2017 the Division filed a proposed final judgment simultaneously with the complaint Under the terms of the decree GE agreed to divest its Water amp Process Technologies business unit which included its refinery process chemicals and services unit to SUEZ SA by approximately the end of September 2017 or if the United States exercised its discretion to grant an extension by approximately the end of 2017 After consummating the GEBaker Hughes merger GE informed the United States that it would be unable to complete the divestiture by the agreed-upon deadline GE explained that in 19 foreign jurisdictions there were legal and other barriers to SUEZ operating the assets and that GE would not be able to complete the divestiture until 2018 On October 16 2017 the court entered
28 United States v Danone SA and The WhiteWave Foods Co No 117-cv-00592 (DDC filed Apr 3 2017) 29 United States v General Electric Co and Baker Hughes Inc No 117-cv-1146 (DDC filed June 12 2017)
13
a modified final judgment that added two provisions to the final judgment designed to encourage GE to complete the divestiture promptly The modified final judgment required GE to begin making daily incentive payments as of January 1 2018 until the divestiture is completed and also included GErsquos agreement to reimburse the United States for attorneyrsquos fees and costs incurred in addressing the delay The Division cooperated closely with its counterparts in several jurisdictions including the European Commission Canada and Australia throughout the course of its investigation
In United States et al v The Dow Chemical Company and EI Du Pont De Nemours and Company30 the Division along with the attorney generals of Iowa Mississippi and Montana challenged the proposed merger of The Dow Chemical Company and EI DuPont de Nemours and Company Dow and DuPont were two of the leading companies in both crop-protection chemicals and traited seeds in the United States Each company also manufactured a number of petrochemicals including high-pressure ethylene derivatives that are crucial inputs to a number of important products and industries The complaint alleged that the proposed merger would likely reduce or eliminate competition in the markets for broadleaf herbicides for winter wheat and chewing pest insecticides and tend to create a monopoly in the markets for acid copolymers and ionomers in the United States resulting in higher prices and reduced services and innovation in these markets On June 15 2017 a proposed final judgment was filed simultaneously with the complaint The final judgment requires DuPont to divest its Finesse-formulated herbicide products and its Rynaxypyr-formulated insecticide products along with the assets used to develop manufacture and sell those products Dow Chemical also was required to divest its Freeport Texas acid copolymers and ionomers manufacturing unit and associated assets The court entered the final judgment on October 19 2017 The Division cooperated closely with the European Commission throughout the course of its investigation
In United States v Parker-Hannifin Corporation and CLARCOR Inc31 the Division sued to unwind Parker-Hannifin Corporationrsquos acquisition of its only US competitor in aviation fuel filtration systems and filter elements CLARCOR Inc Aviation fuel must be filtered properly to remove particulate contaminants and water droplets before such fuel is delivered into commercial or military aircraft US airlines mandate the use of aviation filtration products that meet Energy Institute (EI) specifications32 Prior to the acquisition Parker-Hannifin and CLARCOR were the only suppliers of EI-qualified aviation fuel filtration systems and filter elements to US customers The Divisionrsquos complaint filed on September 26 2017 alleged that Parkerrsquos acquisition eliminated all head-to-head competition between the only two domestic manufacturers of these products effectively creating a monopoly in the United States On December 18 2017 the Division filed a proposed final judgment requiring Parker-Hannifin to divest its Facet filtration business including the aviation fuel filtration assets that it acquired from CLARCOR The Division will move to enter the final judgment upon completion of the Tunney Act period
30 United States et al v The Dow Chemical Co and EI Du Pont De Nemours and Co No 1-17-cv-01176 (DDC filed June 15 2017) 31 United States v Parker-Hannifin Corp and CLARCOR Inc No 117-cv-01354-UNA (D Del Sept 26 2017) 32 EI is an independent international professional organization for the energy sector that publishes performance and testing standards for aviation fuel filtration products
14
In United States v Showa Denko KK SGL Carbon SE and SGL GE Carbon Holding LLC (USA)33 the Division challenged Showa Denko KKrsquos (SDK) proposed acquisition of SGL Carbon SErsquos global graphite electrodes business SDK and SGL Carbon were two of the three leading suppliers of large ultra-high power (UHP) graphite electrodes used in electric arc furnaces (EAFs) at steel mills in the United States The complaint alleged that the acquisition would eliminate head-to-head competition between SDK and SGL Carbon to supply large UHP graphite electrodes to US EAF steel mills resulting in higher prices and decreased quality of delivery and service A proposed final judgment filed simultaneously with the complaint on September 27 2017 required the parties to divest SGL Carbonrsquos graphite electrode business to Tokai Carbon Co Ltd SDK completed the divestiture on November 7 2017 and the court entered the final judgment on January 9 2018
2 The Federal Trade Commission
In DraftKingsFanDuel34 the Commission filed an administrative complaint challenging the merger of DraftKings and FanDuel two providers of paid daily fantasy sports contests The Commissions complaint alleged that the transaction would be anticompetitive because the merger would have combined the two largest daily fantasy sports websites which controlled more than 90 percent of the US market for paid daily fantasy sports contests The Commission alleged that consumers of paid daily fantasy sports were unlikely to view season-long fantasy sports contests as a meaningful substitute for paid daily fantasy sports due to the length of season-long contests the limitations on number of entrants and several other issues Shortly after the Commission filed its complaint the parties abandoned the merger on July 13 2017 and the Commission dismissed its administrative complaint
The Commission also accepted for public comment and finalized consent orders in the following 14 merger matters
In Abbott LaboratoriesSt Jude Medical 35 the Commission challenged Abbott Laboratories proposed $25 billion acquisition of St Jude Medical Inc The Commissions complaint alleged that the proposed merger would have harmed competition in the US markets for vascular closure devices which are used to close holes in arteries from the insertion of catheters and for ldquosteerablerdquo sheaths which are used to guide catheters for treating heart arrhythmias To remedy these concerns and maintain competition the Commission issued a consent order requiring the parties to divest all rights and assets related to St Judersquos vascular closure device business and Abbottrsquos steerable sheath business to Terumo Corporation and to help Terumo establish manufacturing capabilities for these products The consent order also required Abbott to notify the Commission if it intended to acquire lesion-assessing ablation catheter assets from Advanced Cardiac Therapeutics (ACT) Abbott and ACT formed a partnership to develop these types of catheters Currently only St Jude and one other company
33 United States v Showa Denko KK SGL Carbon SE and SGL GE Carbon Holding LLC (USA) No 117-cv-01992 (DDC filed Sept 27 2017) 34 In the Matter of DraftKings Inc and FanDuel Ltd FTC Dkt C-9375 (complaint filed on June 19 2017) available at httpswwwftcgovenforcementcases-proceedings161-0174draft-kings-inc-fanduel-limited 35 In the Matter of Abbott Laboratories and St Jude Medical Inc FTC Dkt C-4600 (final order issued on Feb 23 2017) available at httpswwwftcgovenforcementcases-proceedings161-0126abbott-laboratories-st-jude-medical-matter
15
provide lesion-assessing ablation catheters in the United States After the acquisition of St Jude if Abbott acquired lesion-assessing ablation catheter assets from ACT it could eliminate additional competition Following a public comment period the Commission approved the final order on February 23 2017
In CentraCare HealthSCMG36 the Commission challenged CentraCare Healths proposed acquisition of St Cloud Medical Group PA (SCMG) The Commissions complaint alleged that the proposed merger would have combined the two largest providers of adult primary care pediatric and OBGYN services in the St Cloud Minnesota area By eliminating SCMG as a potential alternative in the St Cloud area the acquisition would have increased CentraCare Healthrsquos bargaining power vis-agrave-vis commercial health plans allowing it to raise reimbursement rates and secure more favorable payment terms Prior to the proposed acquisition however SCMG was failing financially had lost a number of physicians from its practice and was likely to lose more physicians if the merger did not close Over the course of a multi-year search SCMG was unable to identify an alternative purchaser to CentraCare Health However at least one local provider had expressed interest in expanding its practice by hiring some of SCMGrsquos physicians To remedy these concerns regarding the proposed merger and maintain competition the Commission issued a consent order requiring CentraCare Health to lift non-compete provisions and permit some adult primary care pediatric and OBGYN physicians to leave the health system and work for other local providers or establish a new practice in the area Following a public comment period the Commission approved the final order on January 9 2017
In CH Boehringer SohnSanofi37 the Commission challenged CH Boehringer Sohnrsquos proposed $135 billion animal health products asset swap with Sanofi The Commissions complaint alleged that the proposed asset swap would likely have harmed competition in US markets for various vaccines for companion animals and certain parasite control products for cattle and sheep Specifically the merger as proposed would likely substantially reduce competition in five markets (1) canine vaccines (2) feline vaccines (3) rabies vaccines (4) products to prevent and control outbreaks of parasites in cattle and (5) products to prevent and control outbreaks of parasites in sheep To remedy these concerns and maintain competition the Commission issued a consent order requiring Boehringer to divest its companion animal vaccines to Eli Lilly and Co and divest its Elanco Animal Health division and the parasite control products to Bayer AG Following a public comment period the Commission approved the final order on February 24 2017
In EnbridgeSpectra Energy38 the Commission challenged Enbridge Incs proposed $28 billion acquisition of Spectra Energy Corporation The Commissions complaint alleged that Enbridges the proposed merger would have harmed competition in the market for the pipeline transportation of natural gas in three production areas off the coast of Louisiana According to
36 In the Matter of CentraCare Health System FTC Dkt C-4594 (final order issued on Jan 9 2017) available at httpswwwftcgovenforcementcases-proceedings161-0096centracare-health-system 37 In the Matter of CH Boehringer Sohn AG amp Co KG FTC Dkt 4601 (final order issued on Feb 24 2017) available at httpswwwftcgovenforcementcases-proceedings161-0077ch-boehringer-sohn-matter 38 In the Matter of Enbridge Inc a corporation and Spectra Energy Corp FTC Dkt C-4604 (final order issued on Mar 24 2017) available at httpswwwftcgovenforcementcases-proceedings161-0215enbridge-spectra-energy
16
the Commissionrsquos complaint the merger likely would have reduced natural gas pipeline competition in three offshore natural gas producing areas in the Gulf of MexicomdashGreen Canyon Walker Ridge and Keathley Canyonmdashleading to higher prices for natural gas pipeline transportation from those areas In portions of the affected areas the merging partiesrsquo pipelines (Enbridges Walker Ridge Pipeline and Spectras 40 percent interest in the Discovery Pipeline) were the two pipelines located closest to certain wells and as a result were likely the lowest cost pipeline transportation options for these wells Furthermore the merger would have given Enbridge an ownership interest in both pipelines which would have given it access to competitively sensitive information of the Discovery Pipeline as well as significant voting rights over it providing Enbridge with the incentive and opportunity to unilaterally increase pipeline transportation costs for natural gas producers located in the affected areas The acquisition would have also increased the likelihood of tacit or explicit anticompetitive coordination between the Walker Ridge Pipeline and the Discovery Pipeline To remedy these concerns the Commission issued a consent order requiring Enbridge to establish firewalls to limit its access to non-public information about the Discovery Pipeline Board members of the Spectra-affiliated companies holding a 40 percent share in the Discovery Pipeline had to recuse themselves from any vote involving the pipeline with two limited exceptions Enbridge was also required to notify the Commission before acquiring an ownership interest in any natural gas pipeline operating in the Green Canyon Walker Ridge and Keathley Canyon areas or increasing its 40 percent ownership interest of Spectra affiliate DCP Midstream Partners LP in the Discovery Pipeline The consent order which is to remain in effect for 20 years allowed the Commission to appoint a monitor to ensure Enbridges compliance Following a public comment period the Commission approved the final order on March 24 2017
In China National Chemical CorpSyngenta AG39 the Commission challenged China National Chemical Corporations (ChemChina) proposed $43 billion acquisition of Syngenta The Commissions complaint alleged that the proposed merger would have reduced competition for three pesticides (1) the herbicide paraquat which is used to clear fields prior to the growing season (2) the insecticide abamectin which protects primarily citrus and tree nut crops by killing mites psyllid and leafminers and (3) the fungicide chlorothalonil which is used mainly to protect peanuts and potatoes According to the complaint Syngenta owned the branded version of these three pesticides giving it significant market shares in the United States ChemChinas subsidiary ADAMA was either the first- or second-largest generic supplier in the United States for these three pesticides To remedy these concerns the Commission issued a consent order requiring ChemChina to sell all rights and assets of ADAMArsquos USrsquos paraquat abamectin and chlorothalonil crop protection businesses to AMVAC an agrochemical company Following a public comment period the Commission approved the final order on June 16 2017
In DaVita IncRV ManagementRenal Ventures40 the Commission challenged DaVita Incs proposed $358 million acquisition of Renal Ventures Management LLC The
39 In the Matter of China National Chemical Corporation ADAMA Agricultural Solutions Ltd and Makhteshim Agan of North America Inc FTC Dkt C-4610 (final order issued on June 16 2017) available at httpswwwftcgovenforcementcases-proceedings1610093china-national-chemical-corporation-et-al 40 In the Matter of DaVita Inc RV Management Corp Renal Ventures Partners LLC Renal Ventures Limited LLC and Renal Ventures Management LLC FTC Dkt C-4616 (final order issued on June 14 2017) available at httpswwwftcgovenforcementcases-proceedings151-0204davita-rv-management-renal-ventures
17
Commissions complaint alleged that the proposed merger would have reduced competition for outpatient dialysis services At the time of the merger DaVita was the second-largest provider of outpatient dialysis services in the United States and Renal Ventures was the seventh largest According to the complaint competition between dialysis clinics happened at the local level and the acquisition would have led to significant anticompetitive effects in the New Jersey markets of Brick Clifton Somerville Succasunna and Trenton and in the Dallas-area markets of Denton and Frisco To remedy these concerns and maintain competition the Commission issued a consent order requiring DaVita to divest its ownership interest in seven clinics five in New Jersey and two in Texas to a Commission-approved buyer Following a public comment period the Commission approved the final order on June 14 2017
In Emerson ElectricPentair41 the Commission challenged Emerson Electric Cos proposed $315 billion acquisition of Pentair plc The Commissions complaint alleged that the proposed merger would have harmed competition for switchboxes the devices used to monitor and control valves that regulate the flow of liquids and gases in industrial facilities According to the complaint the acquisition would have combined the two leading manufacturers of switchboxes in the United States ndash which together controlled about 60 percent of the US market Emersonrsquos TopWorx and Pentairrsquos Westlock switchboxes were the most widely-used brands nationwide and for many customers the only acceptable brands of switchboxes To remedy these concerns the Commission issued a consent order requiring Emerson to divest Westlock Controls Corporation the Pentair subsidiary to Crane Co within 10 days after Emerson acquired Pentair Following a public comment period the Commission approved the final order on June 30 2017
In Sherwin-WilliamsValspar42 the Commission challenged Sherwin-Williams Cos proposed $113 billion acquisition of Valspar Corporation The Commissions complaint alleged that the proposed acquisition would have reduced competition in the North American market for industrial wood coatings used to make furniture kitchen cabinets and building products where Sherwin-Williams and Valspar were two of the top three industrial wood coatings manufacturers Industrial wood coatings which include stains topcoats and sealants provide better resistance to abrasion and water than consumer wood coatings To remedy these concerns the Commission issued a consent order requiring Sherwin-Williams to divest two Valspar industrial wood coatings plants one in High Point North Carolina and the other in Cornwall Ontario to Axalta Coating Systems Ltd a leading supplier of coatings to large automotive and industrial original equipment manufacturers Following a public comment period the Commission approved the final order on July 28 2017
In Alimentation Couche-TardCST Brands43 the Commission challenged Alimentation Couche-Tard Incs proposed $44 billion acquisition of CST Brands Inc The Commissions
41 In the Matter of Emerson Electric Company and Pentair plc FTC Dkt C-4615 (final order issued on June 30 2017) available at httpswwwftcgovenforcementcases-proceedings161-0221emerson-electric-pentair 42 In the Matter of The Sherwin-Williams Company and The Valspar Corporation FTC Dkt C-4621 (final order issued on July 28 2017) available at httpswwwftcgovenforcementcases-proceedings161-0116sherwin-williamsvalspar-matter 43 In the Matter of Alimentation Couch-Tard Inc and CST Brands Inc FTC Dkt C-4618 (final order issued on August 14 2017) available at httpswwwftcgovenforcementcases-proceedingsfile-no-161-0207-docket-no-c-4618alimentation-couche-tard-cst-brands
18
complaint alleged that the proposed merger would have reduced competition for the retail sales of gasoline and diesel in 71 local markets At the time of the merger Alimentation Couche-Tard operated convenience stores and retail fuel stations worldwide including nearly 4700 in United States Its convenience stores primarily operate under the Circle K and Kangaroo Express banners and the retail fuel sells under numerous brands CST operated 1146 convenience stores and retail fuel stations in the United States Its convenience stores primarily operated under the Corner Store banner while its fuel stations generally use the Valero brand According to the complaint the geographic markets for the retail sale of gasoline and diesel were local and generally ranged from a few blocks to a few miles The complaint alleged that without a remedy the merger would have increased market concentration for the retail sales of gasoline or diesel in each of the 71 local markets resulting in a monopoly in ten markets and reduced the number of competitors in the rest from three to two competitors To remedy these concerns the Commission issued a consent order requiring Alimentation Couche-Tard to divest 70 CST fuel stations to Empire Petroleum Partners The divested fuel stations were located in Arizona Colorado Florida Georgia Louisiana New Mexico Ohio and Texas Following a public comment period the Commission approved the final order on August 14 2017
In BroadcomBrocade Communications Systems44 the Commission challenged Broadcom Limiteds proposed $59 billion acquisition of Brocade Communications Systems Inc The Commissions complaint alleged that the proposed merger would have been anticompetitive because of Broadcoms access to the confidential business information of Brocades major competitor Cisco Systems Such information could be used to restrain competition or slow innovation in the worldwide market for fibre channel switches According to the complaint Brocade and Cisco were the only two competitors in the worldwide market for fibre channel switches and Broadcom supplied both companies with application-specific integrated circuits to make fibre channel switches The complaint further alleged that as the new owner of Brocade Broadcom could have used Ciscos confidential business information to unilaterally exercise market power or to coordinate action among Brocade and Cisco increasing the likelihood that customers would pay higher prices for fibre channel switches To remedy these concerns the Commission issued a consent order preventing Broadcom from using Ciscos competitively sensitive confidential information for any purpose other than designing manufacturing and selling fibre channel application-specific integrated circuits for Cisco To assure compliance the Commission appointed a monitor for five years The Commission cooperated with its counterparts in a number of jurisdictions that also reviewed the transaction including the European Commission China and Japan Following a public comment period the Commission approved the final order on August 17 2017
In Abbott LaboratoriesAlere 45 the Commission challenged Abbott Laboratoriesrsquo proposed $83 billion acquisition of Alere Inc over concerns that the proposed merger would have harmed competition in the United States for the sale of two types of medical devices point-of-care blood gas testing systems and point-of-care cardiac marker testing systems Point-of-
44 In the Matter of Broadcom Ltd and Brocade Communications Systems Inc FTC Dkt C-4622 (final order issued on August 17 2017) available at httpswwwftcgovenforcementcases-proceedings171-0027broadcom-limitedbrocade-communications-systems 45 In the Matter of Abbott Laboratories and Alere Inc FTC Dkt C-4625 (final order issued on Nov 14 2017) available at httpswwwftcgovenforcementcases-proceedings161-0084abbott-laboratories-alere-inc
19
care blood gas testing systems measure blood pH oxygen carbon dioxide and electrolyte levels in the blood Point-of-care cardiac marker testing systems measure specific proteins in the blood to access whether a patient is having a heart attack To remedy these concerns the Commission issued a consent order requiring Alere to divest its blood gas testing systems to Siemens Aktiengelsellschaft and its cardiac marker testing systems to Quidel Corporation Following a public comment period the Commission approved the final order on November 14 2017
In Integra LifesciencesJohnson amp Johnson 46 the Commission challenged Integrarsquos proposed $1 billion acquisition of Johnson amp Johnsonrsquos Codman Neuro division The Commissionrsquos complaint alleged that the proposed merger would have harmed competition in five medical device product market lines used in operative neurosurgery hydrocephalus management and neuro-critical care To remedy these concerns the Commission issued a consent order requiring Integra to sell these medical device product lines to Natus Medical Inc In addition the consent order required Integra to divest its manufacturing facility in San Diego and supply Natus with cranial access kits until Natus secured its own supply Following a public comment period the Commission approved the final order on December 22 2017
In Baxter InternationalClaris Lifesciences and Arjun Handa 47 the Commission challenged Baxterrsquos proposed $625 million acquisition of Clarisrsquo injectable drugs business The Commissionrsquos complaint alleged that the proposed merger would have reduced competition in the market for the antifungal agent fluconazole in saline intravenous bags as well as future competition in the market for milrinone in dextrose intravenous bags which dilates blood vessels lowers blood pressure and allows blood to flow more easily through the cardiovascular system To remedy these concerns the Commission issued a consent order requiring the parties to divest all of Clarisrsquos rights to these injectable drugs to Renaissance Lakewood Pharmaceuticals Following a public comment period the Commission approved the final order on August 30 2017
In Mars IncVCA48 the Commission challenged Marsrsquo proposed $91 billion acquisition of pet care company VCA alleging that the proposed merger would have harmed competition for certain specialty and emergency veterinary services in ten localities in the United States by eliminating head-to-head competition between Mars and VCA specialists The Commission issued a consent order requiring the parties to divest clinics in Kansas City New York Phoenix Chicago Corpus Christi San Antonio and two clinics in Seattle Under the terms of the consent order Mars was required for ten years to notify the Commission if it planned to acquire any additional specialty or emergency veterinary clinics in certain geographic areas The consent order also required both Mars and VCA to secure all third-party consents assignments and releases permitting the buyers to conduct business at the divested clinics Following a public comment period the Commission approved the final order on December 19 2017
46 In the Matter of Integra Lifesciences Corp and Johnson amp Johnson FTC Dkt C-4624 (final order issued on Dec 22 2017) available at httpswwwftcgovenforcementcases-proceedings171-0084integra-lifesciences-johnson-johnson 47 In the Matter of Baxter International Inc Claris Lifesciences Limited and Arjun Handa FTC Dkt C-4620 (final order issued on August 30 2017) available at httpswwwftcgovenforcementcases-proceedings171-0052baxter-international-inc-claris-lifesciences-limited-arjun 48 In the Matter of Mars Inc and VCA Inc FTC Dkt C-4633 (final order issued on December 19 2017) available at httpswwwftcgovenforcementcases-proceedings171-0057mars-incorporated-vca-inc
20
ONGOING REASSESSMENT OF THE EFFECTS OF THE PREMERGER NOTIFICATION PROGRAM
The Commission and the Antitrust Division continually review the impact of the premerger notification program on the business community and antitrust enforcement The premerger notification program ensures that the antitrust agencies review virtually every relatively large merger and acquisition that affects US consumers before consummation Prior to the HSR Act businesses could and often did consummate transactions that raised significant antitrust concerns before the agencies had an opportunity to consider adequately their competitive effects This practice forced the agencies to engage in lengthy post-acquisition litigation during the course of which the transactionrsquos anticompetitive effects continued to harm consumers and if effective post-acquisition relief was not practicable the harm continued Because the premerger notification program requires reporting before consummation the agenciesrsquo ability to obtain timely effective relief to prevent anticompetitive effects has vastly improved Thus the HSR Act is doing what Congress intendedmdashgiving the government the opportunity to investigate and challenge those relatively large mergers that are likely to harm consumers before injury can arise
The Commission and the Antitrust Division also regularly examine the premerger notification programrsquos effectiveness and continually seek ways to increase accessibility promote transparency and improve the review process to reduce the burden on the filing parties without compromising the agenciesrsquo ability to investigate and challenge proposed transactions that may substantially lessen competition
21
LIST OF APPENDICES
Appendix A Summary of Transactions Fiscal Years 2008 - 2017
Appendix B Number of Transactions Reported and Filings Received by Month for Fiscal Years 2008 - 2017
LIST OF EXHIBITS
Exhibit A Statistical Tables for Fiscal Year 2017 ndash Data ProfilingHart-Scott-Rodino Notification Filings and Enforcement Interests
Adjusted Transactions In Which A Second Request Could Have Been 1656 684 1128 1414 1400 1286 Issued2
Investigations in Which Second Requests 41 31 42 55 49 47Were Issued FTC3 21 15 20 24 20 25
Percent4 13 22 18 17 14 19
DOJ3 20 16 22 31 29 22
Percent4 12 23 20 22 21 17
Transactions Involving a Request For 1385 575 953 1157 1094 990Early Termination5
Granted5 1021 396 704 888 902 797
Not Granted5 364 179 249 269 192 193
2014
1663
3307
1618
51
30
19
21
13
1274
1020
254
2015
1801
3585
1754
47
20
11
27
15
1366
1086
280
2016
1832
3674
1772
54
25
14
29
16
1374
1102
272
2017
2052
4083
1992
51
33
17
18
09
1552
1220
332 Note The data for FY 2010 and FY 2011 reflect corrections to some prior annual reports and the DOJ number of investigations in which second requests were issued and the percentage of transactions in which second requests were issued by DOJ
1 Usually two filings are received one from the acquiring person and one from the acquired person when a transaction is reported Only one application is received when an acquiring party files for an exemption under Section 7A (c )(6) or (c )(8) of the Clayton Act
2 These figures omit from the total number of transactions reported all transactions for which the agencies were not authorized to request additional information These include (1) incomplete transactions (only one party filed a complete notification) (2) transactions reported pursuant to the exemption provisions of Sections 7A (c)(6) and 7A(c)(8) of the Act (3) transactions which were found to be non-reportable and (4) transactions withdrawn before the waiting period began In addition where a party filed more than one notification in the same year to acquire voting securities of the same corporation eg filing one threshold and later filing for a higher threshold only a single consolidated transaction has been counted because as a practical matter the agencies do not issue more than one Second Request in such a case These statistics also omit from the total number the transactions reported secondary acquisitions filed pursuant to sect8014 of the Premerger Notification rules Secondary acquisitions have been deducted in order to be consistent with the statistics presented in most of the prior annual reports
3 These statistics are based on the date the Second Request was issued and not the date the investigation was opened 4 Second Request investigations are a percentage of the total number of adjusted transactions The total percentage reflected in Figure 2 may not equal the sum of reported component values due to rounding
5 These statistics are based on the date of the HSR filing and not the date action was taken on the request
APPENDIX B
NUMBER OF TRANSACTIONS REPORTED
AND
FILINGS RECEIVED BY MONTH
FOR
FISCAL YEARS 2008 - 2017
APPENDIX B TABLE 1 NUMBER OF TRANSACTIONS REPORTED BY MONTH FOR FISCAL YEARS
October
November
December
January
February
March
April
May
June
July
August
September
TOTAL
2008 2009 2010 2011 2012 2013 2014 2015 2016
158 91 66 128 122 127 124 144 168
191 85 135 217 169 260 159 157 243
172 37 84 91 95 92 108 122 157
158 42 62 97 104 78 125 118 117
119 32 61 81 90 82 114 140 127
131 42 116 97 111 87 100 128 125
128 60 92 96 96 77 140 131 129
150 58 108 142 117 117 157 152 168
146 51 108 117 142 90 150 155 150
128 62 94 120 130 91 162 170 140
126 77 120 164 133 122 151 216 166
119 79 120 100 120 103 173 168 142
1726 716 1166 1450 1429 1326 1663 1801 1832
2017
163
215
148
153
153
146
150
209
191
146
219
159
2052
APPENDIX B TABLE 2 NUMBER OF FILINGS RECEIVED1 BY MONTH FOR FISCAL YEARS
October
November
December
January
February
March
April
May
June
July
August
September
TOTAL
2008 2009 2010 2011 2012 2013 2014 2015
319 185 146 252 242 255 247 289
380 165 242 422 332 511 325 322
343 79 177 193 188 180 211 239
316 77 126 188 203 151 244 244
246 63 116 157 185 169 236 257
242 81 232 195 215 172 195 252
272 119 182 190 193 151 271 265
294 114 216 284 231 228 315 305
293 99 213 231 275 181 304 322
259 121 187 240 269 186 323 327
251 149 238 329 259 240 292 425
240 159 243 201 237 204 344 338
3455 1411 2318 2882 2829 2628 3307 3585
2016
345
483
314
236
249
265
249
331
304
284
339
275
3674
2017
329
416
297
307
298
302
290
402
388
291
446
317
4083
1 Usually two filings are received one from the acquiring person and one from the acquired person when the transaction is reported Only one filing is received when an acquiring person files for a transaction that is exempt under Sections 7A(c)(6) and (c)(8) of the Clayton Act
EXHIBIT A
STATISTICAL TABLES
FOR
FISCAL YEAR 2017
DATA PROFILING HART-SCOTT-RODINO PREMERGER NOTIFICATION FILINGS AND ENFORCEMENT INTERESTS
5
5
5
5
5
5
5
TABLE I 1FISCAL YEAR 2017
2ACQUISITIONS BY SIZE OF TRANSACTION (BY SIZE RANGE)
TRANSACTION RANGE ($MILLIONS)
HSR TRANSACTIONS CLEARANCE GRANTED TO FTC OR DOJ 3SECOND REQUEST INVESTIGATIONS
812 Personal and Laundry Services 5 03 -01 0 0 0 0 0 0 0
TABLE XI 1FISCAL YEAR 2017
INDUSTRY GROUP OF ACQUIRED ENTITIES
3 DIGIT NAICS
11CODE INDUSTRY DESCRIPTION
4NUMBER
PERCENT OF TOTAL
POINTS CHANGE FROM FY
2016 12
CLEARANCE GRANTED TO FTC
OR DOJ
SECOND REQUEST 3INVESTIGATIONS
NUMBER OF 3 DIGIT INTRA-
INDUSTRY TRANSAC-
TIONS 14FTC DOJ TOTAL FTC DOJ TOTAL
1992 1000 205 72 277 33 18 51 508
1 Fiscal year 2017 figures include transactions reported between October 1 2016 and September 30 2017
2 The size of transaction is based on the aggregate total amount of voting securities non-corporate interests andor assets held by the acquiring person as a result of the transaction and are taken from the response to Item 2(d)(iii) 2(d)(vii) and 2(d)(ix) of the Notification and Report Form
3 These statistics are based on the date the Second Request was issued
4 During fiscal year 2017 2052 transactions were reported under the HSR Premerger Notification program The smaller number 1992 reflects the adjustments to eliminate the following types of transactions (1) transactions reported under Section 7A(c)(6) and (c)(8) (transactions involving certain regulated industries and financial businesses) (2) transactions deemed non-reportable (3) incomplete transactions (only one party in each transaction filed a compliant notification) and (4) transactions withdrawn before the waiting period began The table does not however exclude competing offers or multiple HSR transactions resulting from a single business transaction (where there are multiple acquiring persons or acquired persons)
5 The total number of filings under $50M submitted in Fiscal Year 2017 reflects corrective filings
6 In February 2001 legislation raised the size of transaction from $15 million to $50 million with annual adjustments beginning in February 2005 As of FY 2017 the threshold categories include non-corporate interests (NCI) encompassing transactions in which the acquiring entity acquires 50 of more of the non-corporate interests of the acquired entity
7 The category labeled ldquoSales Not Availablerdquo includes newly-formed acquiring persons foreign acquiring person with no United States revenues and acquiring persons who had not derived any revenues from their investments at the time of filing
8 Assets of an acquired entity are not available when the acquired entityrsquos financial data is consolidated within its ultimate parent
9 Sales of an acquired entity are taken from responses to Item 4(a) and (b) (SEC documents and annual reports) or item 5 (dollar revenues) of the Premerger Notification and Report Form
10 This category includes acquisition of newly-formed entities from which no sales were generated and acquisitions of assets which produced no sales revenues during the prior year to filing the Notification and Report Form
11 The 3-digit codes are part of the North American Industrial Classification System (NAICS) established by the United States Government North American Industrial Classification System 1997 Executive Office of the President Office of Management and Budget The NAICS groups used in this table were determined from responses submitted by the parties to Item 5 of the Premerger Notification and Report Form
12 This represents the deviation from the fiscal year 2016 percentage
13 This category includes transactions by newly-formed entities
14 The intra-industry transactions column identifies the number of acquisitions in which both the acquiring and acquired person derived revenues from the same 3-digit NAICS code
INTRODUCTION
A STATISTICAL PROFILE OF THE PREMERGER NOTIFICATION PROGRAM
A STATISTICAL PROFILE OF THE PREMERGER NOTIFICATION PROGRAM
DEVELOPMENTS WITHIN THE PREMERGER PROGRAM
DEVELOPMENTS WITHIN THE PREMERGER PROGRAM
1 Threshold Adjustments
The 2000 amendments to the HSR Act require the Commission to publish adjustments to the Actrsquos jurisdictional and filing fee thresholds in the Federal Register annually for each fiscal year beginning on September 30 2004 based on the change in the gross national product in accordance with Section 8(a)(5) of the Clayton Act The Commission amended the rules in 2005 to provide a method for future adjustments as required by the 2000 amendments and to reflect the revised thresholds contained in the rules The Commission publishes the revised thresholds annually in January and they become effective 30 days after publication
On January 26 2017 the Commission published a notice12 to reflect adjustment of the reporting thresholds as required by the 2000 amendments13 to Section 7A of the Clayton Act 15 USC sect 18a The revised thresholds including an increase in the size of transaction threshold from $782 million to $808 million became effective February 27 2017
2 Compliance
The Commission and the Antitrust Division continued to monitor compliance with the premerger notification programrsquos filing and waiting period requirements and initiated a number of compliance investigations in fiscal year 2017 The agencies use several methods to oversee compliance including monitoring news outlets and industry publications for transactions that may not have been reported in accordance with the HSR Actrsquos requirements Industry sources such as competitors customers and suppliers interested members of the public and in certain cases the parties themselves also provide the agencies with information about transactions and possible violations of the Actrsquos requirements
Under Section 7A(g)(1) of the Act any person that fails to comply with the Actrsquos notification and waiting period requirements is liable for a civil penalty of up to $40654 for each day the violation continues14 The antitrust agencies examine the circumstances of each violation to determine whether to seek penalties15 During fiscal year 2017 50 post-consummation ldquocorrectiverdquo filings were received and the agencies brought four enforcement actions resulting in $22 million in civil penalties
12 82 Fed Reg 8524 (Jan 26 2017) 13 15 USC sect18a(a) See Pub L No 106-553 114 Stat 2762 14 Dollar amounts specified in civil monetary penalty provisions within the Commissionrsquos jurisdiction are adjusted for inflation in accordance with the Federal Civil Penalties Inflation Adjustment Act Improvements Act of 2015 Pub L No 114-7 (Nov 2 2015) The adjustments have included an increase in the maximum civil penalty from $10000 to $11000 for each day during which a person is in violation of Section 7A(g)(1) (61 Fed Reg 54548 (Oct 21 1996) corrected at 61 Fed Reg 55840 (Oct 29 1996)) to $16000 effective February 10 2009 (74 Fed Reg 857 (Jan 9 2009)) to $40000 effective August 1 2016 (81 Fed Reg 42476 (June 30 2016)) and to $40654 effective January 24 2017 (81 Fed Reg 8135 (Jan 24 2017)) 15 If parties inadvertently fail to file the agencies generally will not seek penalties so long as the parties promptly submit corrective filings after discovering the failure to file submit an acceptable explanation of their failure to file and have not previously violated the Act
8
In United States v Duke Energy Corp16 the complaint alleged that Duke Energy Corporation violated the HSR Act when after agreeing to purchase the Osprey Energy Center from Calpine Corporation Duke took control of Ospreyrsquos business before filing required HSR Act notifications and waiting for the expiration of the mandatory waiting period At the same time that Duke had agreed to purchase Osprey Duke entered into a so-called ldquotolling agreementrdquo that immediately gave Duke control over Ospreyrsquos output and gave Duke the right to receive the day-to-day profits and losses from Ospreyrsquos business As a result from the moment the tolling agreement went into effect Osprey ceased to be an independent competitor Under the terms of a proposed final judgment filed January 18 2017 Duke Energy agreed to pay a $600000 civil penalty to resolve the lawsuit On April 7 2017 the court entered the final judgment
In United States v Mitchell P Rales17 the complaint alleged that investor Mitchell P Rales violated the HSR Act in October 2011 by failing to report voting shares valued in excess of $1319 million that his wife acquired in Colfax The complaint also alleged that Mr Rales violated the HSR Act in January 2008 by failing to report voting shares valued in excess of $5979 million that he acquired in Danaher Although Mr Rales contended that the violations were inadvertent the Commission determined to seek penalties because as noted in the complaint Mr Rales had paid civil penalties to settle an earlier HSR enforcement action brought by the Department of Justice in 1991 Under the terms of a proposed final judgment filed at the same time as the complaint Mr Rales agreed to pay a $720000 civil penalty to resolve the lawsuit On April 12 2017 the court entered the final judgment
In United States v Ahmet H Okumus18 the complaint alleged that hedge fund founder Ahmet H Okumus violated the HSR Act in June 2016 by failing to report voting shares valued in excess of $1563 million that his hedge fund Okumus Opportunistic Value Fund Ltd acquired in Webcom Although the Commission found Mr Okumusrsquos HSR violation to be inadvertent it sought penalties because as noted in the complaint this was Mr Okumusrsquos second HSR violation in two years regarding Webcom Under the terms of a proposed final judgment filed at the same time as the complaint Mr Okumus agreed to pay a $180000 civil penalty to resolve the lawsuit On April 21 2017 the court entered the final judgment
In United States v Fayez Sarofim19 the complaint alleged that Fayez Sarofim violated the HSR Act in 2001 2006 and 2012 by failing to report voting shares of Kinder Morgan valued in excess of $15 million in 2001 $1134 million in 2006 and $6821 million in 2012 The complaint also alleged that Mr Sarofim violated the HSR Act in May 2007 by failing to report voting shares valued in excess of $598 million that he acquired in Unitrin which later changed its name to Kemper The Commission found that Mr Sarofim was not entitled to rely upon the ldquoinvestment-onlyrdquo exemption which exempts acquisitions of up to ten percent of voting
16 United States v Duke Energy Corporation No 117-cv-00116 (DDC filed Jan 18 2017) available at httpswwwjusticegovatrcaseus-v-duke-energy-corporation 17 United States v Mitchell P Rales No 117-cv-00103 (DDC filed Jan 17 2017) available at httpswwwftcgovenforcementcases-proceedings161-0135mitchell-p-rales 18 United States v Ahmet H Okumus No 117-cv-00104 (DDC filed Jan 17 2017) available at httpswwwftcgovenforcementcases-proceedings161-0189ahmet-h-okumus 19 United States v Fayez Sarofim No 116-cv-02156 (DDC filed Oct 28 2016) available at httpswwwftcgovenforcementcases-proceedings151-0064united-states-federal-trade-commission-v-fayez-sarofim
9
securities if they are made solely for investment purposes This exemption however is not available to individuals who serve on the board of directors of the issuer at the time the shares are acquired and Mr Sarofim served on Kinder Morgans and Unitrins board before he made the securities purchases at issue Under the terms of a proposed final judgment filed at the same time as the complaint Mr Sarofim agreed to pay a $720000 civil penalty to resolve the lawsuit On January 26 2017 the court entered the final judgment
MERGER ENFORCEMENT ACTIVITY20
1 The Department of Justice
During fiscal year 2017 the Antitrust Division challenged 18 merger transactions that it concluded would have substantially lessened competition if allowed to proceed as proposed In 11 of these challenges the Antitrust Division filed a complaint in US district court In nine of these court challenges the Division filed settlement papers simultaneously with the complaint The remaining two court challenges were initiated as litigation In one after a trial on its merits the court found in favor of the Division and blocked the merger In the other the parties reached a settlement with the Division before the trial commenced Of the seven fiscal 2017 challenges where the Division did not file suit the parties abandoned the proposed transaction in six instances and in the remaining instance the parties restructured the transaction resolving the Divisionrsquos concerns21
In United States v Westinghouse Air Brake Technologies Corp and Faiveley Transport SA and Faiveley Transport North America22 the Division challenged the proposed acquisition of Faiveley Transport SA including its wholly-owned subsidiary Faiveley Transport North America (collectively Faiveley) by Westinghouse Air Brake Technologies Corporation (Wabtec) The complaint alleged that the transaction as originally structured would have substantially lessened competition for the development manufacture and sale of various freight railcar brake components by eliminating Faiveley as one of only three major companies supplying freight car brake components in the US The transaction would have also eliminated future competition for control valves by preventing Faiveleyrsquos entry into this market and would have thus maintained a century-old duopoly between Wabtec and its only other control valve rival A proposed final judgment filed simultaneously with the complaint on October 26 2016 required Wabtec to divest Faiveleyrsquos entire US freight car brakes business including all assets relating to Faiveleyrsquos freight car control valve development project (known as the FTEN) to
20 The cases listed in this section were not necessarily reportable under the premerger notification program Given the confidentiality of information obtained pursuant to the Act it would be inappropriate to identify the cases initiated under the program except in those instances in which that information has already been disclosed 21 (1) Lam Research Corporationrsquos proposed acquisition of KLA-Tencor Corporation (semiconductor fabrication tools) (2) Proposed slots exchange between American Airlines and United Airlines (3) Republic Airways Holding Inc proposed restructuring from bankruptcy by granting equity shares to American Airlines Group Inc Delta Air Lines Inc and United Continental Holdings Inc (4) Qatar Airways proposed acquisition of a stake in American Airlines (5) Proposed joint venture between First Data Corporation and FleetCor Technologies Inc(prepaid card processing) (6) tronc Incrsquos (owner of the Chicago Tribune) proposed acquisition of the Chicago Sun-Times from Wrapports Inc and (7) Raycom Media Incrsquos proposed acquisition of certain broadcast television stations from Calkins Media Inc 22 United States v Westinghouse Air Brake Technologies Corp Faiveley Transport SA and Faiveley Transport North America No 116-cv-02147 (DDC filed Oct 26 2016)
10
Amsted Rail Company Inc The divestiture was completed on November 30 2016 and the Court entered the final judgment on April 10 2017
In United States v Energy Solutions Inc Rockwell Holdco Inc Andrews County Holdings Inc and Waste Control Specialists LLC23 the Division filed suit to enjoin Energy Solutions Inc (ES) a wholly-owned subsidiary of Rockwell Holdco Inc from acquiring Waste Control Specialists LLC (WCS) a wholly-owned subsidiary of Andrews County Holdings Inc The complaint alleged that the transaction would have combined the only two licensed commercial low-level radioactive waste (LLRW) disposal facilities for 36 states Puerto Rico and the District of Columbia There are only four licensed LLRW disposal facilities in the United States Two of these facilities however did not accept LLRW from the relevant states The complaint alleged that ESrsquos Clive facility in Utah and WCSrsquos Andrews facility in Texas were the only two significant disposal alternatives available in the relevant states for the commercial disposal of higher-activity and lower-activity LLRW At trial one of the defenses asserted by the defendants was that that WCS was a failing firm and absent the transaction its assets would imminently exit the market The Division argued that the defendants did not show that WCSrsquos assets would in fact imminently exit the market given its failure to make good-faith efforts to elicit reasonable alternative offers that might be less anticompetitive than its transaction with ES On June 21 2017 after a 10-day trial the US District Court for the District of Delaware ruled in favor of the Division
In United States v Alaska Air Group Inc and Virgin America Inc24 the Division challenged Alaska Air Group Incrsquos proposed acquisition of Virgin America Inc While the combined company would have become only the fifth-largest domestic airline Alaskarsquos codeshare agreement with American Airlines Group Inc threatened to curb important competition supplied by Virgin on routes where it competed with American once these routes became part of Alaskarsquos network A codeshare agreement allows each airline to market tickets for certain flights operated by the other airline The complaint alleged that the codeshare agreement with American would have incentivized Alaska to cooperate rather than compete with American on each of the twenty nonstop routes on which Virgin and American competed resulting in a reduction of service decreased service quality increased prices andor ceased operations on the Virgin-American overlap routes Under the terms of a proposed final judgment filed simultaneously with the complaint on December 6 2016 Alaska agreed to significantly reduce the scope of its codeshare agreement with American The proposed final judgment prohibited Alaska and American from codesharing on routes where Alaska offered competing nonstop service with American on routes where Virgin and American competed pre-merger and on routes where Alaska would otherwise be likely to launch new service in competition with American following the merger On June 23 2017 the court entered the final judgment
In United States v AMC Entertainment Holdings Inc and Carmike Cinemas Inc25 the Division challenged AMC Entertainment Holdings Incrsquos proposed acquisition of Carmike
23 United States v Energy Solutions Inc Rockwell Holdco Inc Andrews County Holdings Inc and Waste Control Specialists LLC No 116-cv-01056 (D Del filed Nov 16 2016) 24 United States v Alaska Air Group Inc and Virgin America Inc No 116-cv-02377 (DDC filed Dec 6 2016) 25 US v AMC Entertainment Holdings Inc and Carmike Cinemas Inc No 1-16-cv-02475 (DDC filed Dec 20 2016)
11
Cinemas Inc AMC and Carmike were the second-largest and fourth-largest movie theatre chains respectively in the United States Additionally AMC owned significant equity in National CineMedia LLC (NCM) and Carmike owned significant equity in SV Holdco LLC a holding company that owns and operates Screenvision Exhibition Inc NCM and Screenvision are the countryrsquos predominant preshow cinema advertising networks covering over 80 percent of movie theatre screens in the United States The complaint alleged that the proposed acquisition would have provided AMC with direct control of one of its most significant movie theatre competitors and in some cases its only competitor in 15 local markets in nine states As a result moviegoers likely would have experienced higher ticket and concession prices and lower quality services in these local markets The complaint further alleged that the acquisition would have allowed AMC to hold sizable interests in both NCM and Screenvision post-transaction resulting in increased prices and reduced services for advertisers and theatre exhibitors seeking preshow services On December 20 2016 a proposed final judgment was filed simultaneously with the complaint settling the lawsuit Under the terms of the decree AMC agreed to (1) divest theatres in the 15 local markets (2) reduce its equity stake in NCM to 499 percent (3) relinquish its seats on NCMrsquos Board of Directors and all of its other governance rights in NCM (4) transfer 24 theatres with a total of 384 screens to the Screenvision cinema advertising network and (5) implement and maintain ldquofirewallsrdquo to inhibit the flow of competitively sensitive information between NCM and Screenvision The court entered the final judgment on March 7 2017
In United States v Clear Channel Outdoor Holdings Inc and Fairway Media Group LLC26 the Division challenged a proposed asset exchange between Clear Channel Outdoor Holdings Inc and Fairway Media Group LLC Clear Channel sought to acquire certain Fairway billboards located in Atlanta Georgia and Fairway sought to acquire certain Clear Channel billboards located in Indianapolis Indiana along with billboards in other metropolitan areas The complaint alleged that as initially structured the transaction would have eliminated the substantial head-to-head competition between Clear Channel and Fairway in Atlanta and Indianapolis resulting in higher prices and lower quality services for advertisers who purchased outdoor advertising in those markets A proposed final judgment filed simultaneously with the complaint on December 22 2016 required the parties to divest 13 billboard structures in Indianapolis to Circle City Outdoor LLC and 44 billboard structures in Atlanta to Link Media Georgia LLC The divestitures were completed and on March 7 2017 the court entered the final judgment
In United States v Smiths Group PLC Safran SA Morpho Detection LLC and Morpho Detection International LLC27 the Division challenged Smiths Group plcrsquos proposed acquisition of the global explosive detection business of Morpho Detection LLC and Morpho Detection International (collectively Morpho) from Safran SA Smiths and Morpho were two of the three leading providers of desktop explosive trace detection (ETD) devices and related services in the United States ETD devices are used to detect trace amounts of explosives or narcotics on persons or objects in airports and other high-risk critical infrastructure sites The complaint filed
26 United States v Clear Channel Outdoor Holdings Inc and Fairway Media Group LLC No 116-cv-02497 (DDC filed Dec 22 2016)27 United States v Smiths Group PLC Safran SA Morpho Detection LLC and Morpho Detection International LLC No 117-cv-00580 (DDC filed Mar 30 2017)
12
on March 30 2017 alleged that the transaction as initially structured would have eliminated competition between Smiths and Morpho for desktop ETD devices sold for passenger air travel or air cargo transport applications in the United States This loss in competition likely would have given Smiths the ability and incentive to raise prices decrease the quality of service and lessen innovation for customers including the Department of Homeland Security in the United States Under the terms of a proposed final judgment filed simultaneously with the complaint Smiths agreed to divest Morphorsquos global ETD business which included desktop handheld and portal ETD devices On June 23 2017 the final judgment was entered by the court The Division cooperated closely with the European Commission throughout the course of its investigation
In United States v Danone SA and The WhiteWave Foods Company28 the Division challenged Danone SArsquos proposed acquisition of The WhiteWave Foods Company Inc Danone a leading US manufacturer of organic yogurt had participated in the raw organic milk and fluid organic milk markets for the past two decades through a strategic partnership and supply and licensing agreements with WhiteWaversquos closest competitor CROPP Cooperative As a result Danonersquos acquisition of WhiteWave would have effectively combined WhiteWave and CROPP the top purchasers of raw organic milk in the Northeast and the producers of the three leading brands of fluid organic milk in the United States The complaint alleged that the transaction as originally structured likely would have resulted in less favorable contract terms for Northeast farmers for the purchase of their raw organic milk and would have aligned the interests of the producers of the only three national fluid organic milk brandsmdashStonyfield Horizon and Organic Valleymdashrisking higher prices and fewer choices for US customers A proposed final judgment filed simultaneously with the complaint on April 3 2017 required Danone to divest Stonyfield Farm Inc including the supply and licensing agreements with CROPP On July 13 2017 the court entered the final judgment
In United States v General Electric Co and Baker Hughes Incorporated29 the Division challenged the proposed acquisition of Baker Hughes Incorporated (ldquoBaker Hughesrdquo) by General Electric Co Baker Hughes and GE were two of the leading providers of refinery process chemicals in the United States covering over 50 percent of the market Refineries process crude oil and natural gas extracted from wells into finished products like gasoline GE and Baker Hughes were two of a few firms with the technical capabilities and expertise to provide refinery process chemicals and services in the United States and competed vigorously in price service quality and product development On June 12 2017 the Division filed a proposed final judgment simultaneously with the complaint Under the terms of the decree GE agreed to divest its Water amp Process Technologies business unit which included its refinery process chemicals and services unit to SUEZ SA by approximately the end of September 2017 or if the United States exercised its discretion to grant an extension by approximately the end of 2017 After consummating the GEBaker Hughes merger GE informed the United States that it would be unable to complete the divestiture by the agreed-upon deadline GE explained that in 19 foreign jurisdictions there were legal and other barriers to SUEZ operating the assets and that GE would not be able to complete the divestiture until 2018 On October 16 2017 the court entered
28 United States v Danone SA and The WhiteWave Foods Co No 117-cv-00592 (DDC filed Apr 3 2017) 29 United States v General Electric Co and Baker Hughes Inc No 117-cv-1146 (DDC filed June 12 2017)
13
a modified final judgment that added two provisions to the final judgment designed to encourage GE to complete the divestiture promptly The modified final judgment required GE to begin making daily incentive payments as of January 1 2018 until the divestiture is completed and also included GErsquos agreement to reimburse the United States for attorneyrsquos fees and costs incurred in addressing the delay The Division cooperated closely with its counterparts in several jurisdictions including the European Commission Canada and Australia throughout the course of its investigation
In United States et al v The Dow Chemical Company and EI Du Pont De Nemours and Company30 the Division along with the attorney generals of Iowa Mississippi and Montana challenged the proposed merger of The Dow Chemical Company and EI DuPont de Nemours and Company Dow and DuPont were two of the leading companies in both crop-protection chemicals and traited seeds in the United States Each company also manufactured a number of petrochemicals including high-pressure ethylene derivatives that are crucial inputs to a number of important products and industries The complaint alleged that the proposed merger would likely reduce or eliminate competition in the markets for broadleaf herbicides for winter wheat and chewing pest insecticides and tend to create a monopoly in the markets for acid copolymers and ionomers in the United States resulting in higher prices and reduced services and innovation in these markets On June 15 2017 a proposed final judgment was filed simultaneously with the complaint The final judgment requires DuPont to divest its Finesse-formulated herbicide products and its Rynaxypyr-formulated insecticide products along with the assets used to develop manufacture and sell those products Dow Chemical also was required to divest its Freeport Texas acid copolymers and ionomers manufacturing unit and associated assets The court entered the final judgment on October 19 2017 The Division cooperated closely with the European Commission throughout the course of its investigation
In United States v Parker-Hannifin Corporation and CLARCOR Inc31 the Division sued to unwind Parker-Hannifin Corporationrsquos acquisition of its only US competitor in aviation fuel filtration systems and filter elements CLARCOR Inc Aviation fuel must be filtered properly to remove particulate contaminants and water droplets before such fuel is delivered into commercial or military aircraft US airlines mandate the use of aviation filtration products that meet Energy Institute (EI) specifications32 Prior to the acquisition Parker-Hannifin and CLARCOR were the only suppliers of EI-qualified aviation fuel filtration systems and filter elements to US customers The Divisionrsquos complaint filed on September 26 2017 alleged that Parkerrsquos acquisition eliminated all head-to-head competition between the only two domestic manufacturers of these products effectively creating a monopoly in the United States On December 18 2017 the Division filed a proposed final judgment requiring Parker-Hannifin to divest its Facet filtration business including the aviation fuel filtration assets that it acquired from CLARCOR The Division will move to enter the final judgment upon completion of the Tunney Act period
30 United States et al v The Dow Chemical Co and EI Du Pont De Nemours and Co No 1-17-cv-01176 (DDC filed June 15 2017) 31 United States v Parker-Hannifin Corp and CLARCOR Inc No 117-cv-01354-UNA (D Del Sept 26 2017) 32 EI is an independent international professional organization for the energy sector that publishes performance and testing standards for aviation fuel filtration products
14
In United States v Showa Denko KK SGL Carbon SE and SGL GE Carbon Holding LLC (USA)33 the Division challenged Showa Denko KKrsquos (SDK) proposed acquisition of SGL Carbon SErsquos global graphite electrodes business SDK and SGL Carbon were two of the three leading suppliers of large ultra-high power (UHP) graphite electrodes used in electric arc furnaces (EAFs) at steel mills in the United States The complaint alleged that the acquisition would eliminate head-to-head competition between SDK and SGL Carbon to supply large UHP graphite electrodes to US EAF steel mills resulting in higher prices and decreased quality of delivery and service A proposed final judgment filed simultaneously with the complaint on September 27 2017 required the parties to divest SGL Carbonrsquos graphite electrode business to Tokai Carbon Co Ltd SDK completed the divestiture on November 7 2017 and the court entered the final judgment on January 9 2018
2 The Federal Trade Commission
In DraftKingsFanDuel34 the Commission filed an administrative complaint challenging the merger of DraftKings and FanDuel two providers of paid daily fantasy sports contests The Commissions complaint alleged that the transaction would be anticompetitive because the merger would have combined the two largest daily fantasy sports websites which controlled more than 90 percent of the US market for paid daily fantasy sports contests The Commission alleged that consumers of paid daily fantasy sports were unlikely to view season-long fantasy sports contests as a meaningful substitute for paid daily fantasy sports due to the length of season-long contests the limitations on number of entrants and several other issues Shortly after the Commission filed its complaint the parties abandoned the merger on July 13 2017 and the Commission dismissed its administrative complaint
The Commission also accepted for public comment and finalized consent orders in the following 14 merger matters
In Abbott LaboratoriesSt Jude Medical 35 the Commission challenged Abbott Laboratories proposed $25 billion acquisition of St Jude Medical Inc The Commissions complaint alleged that the proposed merger would have harmed competition in the US markets for vascular closure devices which are used to close holes in arteries from the insertion of catheters and for ldquosteerablerdquo sheaths which are used to guide catheters for treating heart arrhythmias To remedy these concerns and maintain competition the Commission issued a consent order requiring the parties to divest all rights and assets related to St Judersquos vascular closure device business and Abbottrsquos steerable sheath business to Terumo Corporation and to help Terumo establish manufacturing capabilities for these products The consent order also required Abbott to notify the Commission if it intended to acquire lesion-assessing ablation catheter assets from Advanced Cardiac Therapeutics (ACT) Abbott and ACT formed a partnership to develop these types of catheters Currently only St Jude and one other company
33 United States v Showa Denko KK SGL Carbon SE and SGL GE Carbon Holding LLC (USA) No 117-cv-01992 (DDC filed Sept 27 2017) 34 In the Matter of DraftKings Inc and FanDuel Ltd FTC Dkt C-9375 (complaint filed on June 19 2017) available at httpswwwftcgovenforcementcases-proceedings161-0174draft-kings-inc-fanduel-limited 35 In the Matter of Abbott Laboratories and St Jude Medical Inc FTC Dkt C-4600 (final order issued on Feb 23 2017) available at httpswwwftcgovenforcementcases-proceedings161-0126abbott-laboratories-st-jude-medical-matter
15
provide lesion-assessing ablation catheters in the United States After the acquisition of St Jude if Abbott acquired lesion-assessing ablation catheter assets from ACT it could eliminate additional competition Following a public comment period the Commission approved the final order on February 23 2017
In CentraCare HealthSCMG36 the Commission challenged CentraCare Healths proposed acquisition of St Cloud Medical Group PA (SCMG) The Commissions complaint alleged that the proposed merger would have combined the two largest providers of adult primary care pediatric and OBGYN services in the St Cloud Minnesota area By eliminating SCMG as a potential alternative in the St Cloud area the acquisition would have increased CentraCare Healthrsquos bargaining power vis-agrave-vis commercial health plans allowing it to raise reimbursement rates and secure more favorable payment terms Prior to the proposed acquisition however SCMG was failing financially had lost a number of physicians from its practice and was likely to lose more physicians if the merger did not close Over the course of a multi-year search SCMG was unable to identify an alternative purchaser to CentraCare Health However at least one local provider had expressed interest in expanding its practice by hiring some of SCMGrsquos physicians To remedy these concerns regarding the proposed merger and maintain competition the Commission issued a consent order requiring CentraCare Health to lift non-compete provisions and permit some adult primary care pediatric and OBGYN physicians to leave the health system and work for other local providers or establish a new practice in the area Following a public comment period the Commission approved the final order on January 9 2017
In CH Boehringer SohnSanofi37 the Commission challenged CH Boehringer Sohnrsquos proposed $135 billion animal health products asset swap with Sanofi The Commissions complaint alleged that the proposed asset swap would likely have harmed competition in US markets for various vaccines for companion animals and certain parasite control products for cattle and sheep Specifically the merger as proposed would likely substantially reduce competition in five markets (1) canine vaccines (2) feline vaccines (3) rabies vaccines (4) products to prevent and control outbreaks of parasites in cattle and (5) products to prevent and control outbreaks of parasites in sheep To remedy these concerns and maintain competition the Commission issued a consent order requiring Boehringer to divest its companion animal vaccines to Eli Lilly and Co and divest its Elanco Animal Health division and the parasite control products to Bayer AG Following a public comment period the Commission approved the final order on February 24 2017
In EnbridgeSpectra Energy38 the Commission challenged Enbridge Incs proposed $28 billion acquisition of Spectra Energy Corporation The Commissions complaint alleged that Enbridges the proposed merger would have harmed competition in the market for the pipeline transportation of natural gas in three production areas off the coast of Louisiana According to
36 In the Matter of CentraCare Health System FTC Dkt C-4594 (final order issued on Jan 9 2017) available at httpswwwftcgovenforcementcases-proceedings161-0096centracare-health-system 37 In the Matter of CH Boehringer Sohn AG amp Co KG FTC Dkt 4601 (final order issued on Feb 24 2017) available at httpswwwftcgovenforcementcases-proceedings161-0077ch-boehringer-sohn-matter 38 In the Matter of Enbridge Inc a corporation and Spectra Energy Corp FTC Dkt C-4604 (final order issued on Mar 24 2017) available at httpswwwftcgovenforcementcases-proceedings161-0215enbridge-spectra-energy
16
the Commissionrsquos complaint the merger likely would have reduced natural gas pipeline competition in three offshore natural gas producing areas in the Gulf of MexicomdashGreen Canyon Walker Ridge and Keathley Canyonmdashleading to higher prices for natural gas pipeline transportation from those areas In portions of the affected areas the merging partiesrsquo pipelines (Enbridges Walker Ridge Pipeline and Spectras 40 percent interest in the Discovery Pipeline) were the two pipelines located closest to certain wells and as a result were likely the lowest cost pipeline transportation options for these wells Furthermore the merger would have given Enbridge an ownership interest in both pipelines which would have given it access to competitively sensitive information of the Discovery Pipeline as well as significant voting rights over it providing Enbridge with the incentive and opportunity to unilaterally increase pipeline transportation costs for natural gas producers located in the affected areas The acquisition would have also increased the likelihood of tacit or explicit anticompetitive coordination between the Walker Ridge Pipeline and the Discovery Pipeline To remedy these concerns the Commission issued a consent order requiring Enbridge to establish firewalls to limit its access to non-public information about the Discovery Pipeline Board members of the Spectra-affiliated companies holding a 40 percent share in the Discovery Pipeline had to recuse themselves from any vote involving the pipeline with two limited exceptions Enbridge was also required to notify the Commission before acquiring an ownership interest in any natural gas pipeline operating in the Green Canyon Walker Ridge and Keathley Canyon areas or increasing its 40 percent ownership interest of Spectra affiliate DCP Midstream Partners LP in the Discovery Pipeline The consent order which is to remain in effect for 20 years allowed the Commission to appoint a monitor to ensure Enbridges compliance Following a public comment period the Commission approved the final order on March 24 2017
In China National Chemical CorpSyngenta AG39 the Commission challenged China National Chemical Corporations (ChemChina) proposed $43 billion acquisition of Syngenta The Commissions complaint alleged that the proposed merger would have reduced competition for three pesticides (1) the herbicide paraquat which is used to clear fields prior to the growing season (2) the insecticide abamectin which protects primarily citrus and tree nut crops by killing mites psyllid and leafminers and (3) the fungicide chlorothalonil which is used mainly to protect peanuts and potatoes According to the complaint Syngenta owned the branded version of these three pesticides giving it significant market shares in the United States ChemChinas subsidiary ADAMA was either the first- or second-largest generic supplier in the United States for these three pesticides To remedy these concerns the Commission issued a consent order requiring ChemChina to sell all rights and assets of ADAMArsquos USrsquos paraquat abamectin and chlorothalonil crop protection businesses to AMVAC an agrochemical company Following a public comment period the Commission approved the final order on June 16 2017
In DaVita IncRV ManagementRenal Ventures40 the Commission challenged DaVita Incs proposed $358 million acquisition of Renal Ventures Management LLC The
39 In the Matter of China National Chemical Corporation ADAMA Agricultural Solutions Ltd and Makhteshim Agan of North America Inc FTC Dkt C-4610 (final order issued on June 16 2017) available at httpswwwftcgovenforcementcases-proceedings1610093china-national-chemical-corporation-et-al 40 In the Matter of DaVita Inc RV Management Corp Renal Ventures Partners LLC Renal Ventures Limited LLC and Renal Ventures Management LLC FTC Dkt C-4616 (final order issued on June 14 2017) available at httpswwwftcgovenforcementcases-proceedings151-0204davita-rv-management-renal-ventures
17
Commissions complaint alleged that the proposed merger would have reduced competition for outpatient dialysis services At the time of the merger DaVita was the second-largest provider of outpatient dialysis services in the United States and Renal Ventures was the seventh largest According to the complaint competition between dialysis clinics happened at the local level and the acquisition would have led to significant anticompetitive effects in the New Jersey markets of Brick Clifton Somerville Succasunna and Trenton and in the Dallas-area markets of Denton and Frisco To remedy these concerns and maintain competition the Commission issued a consent order requiring DaVita to divest its ownership interest in seven clinics five in New Jersey and two in Texas to a Commission-approved buyer Following a public comment period the Commission approved the final order on June 14 2017
In Emerson ElectricPentair41 the Commission challenged Emerson Electric Cos proposed $315 billion acquisition of Pentair plc The Commissions complaint alleged that the proposed merger would have harmed competition for switchboxes the devices used to monitor and control valves that regulate the flow of liquids and gases in industrial facilities According to the complaint the acquisition would have combined the two leading manufacturers of switchboxes in the United States ndash which together controlled about 60 percent of the US market Emersonrsquos TopWorx and Pentairrsquos Westlock switchboxes were the most widely-used brands nationwide and for many customers the only acceptable brands of switchboxes To remedy these concerns the Commission issued a consent order requiring Emerson to divest Westlock Controls Corporation the Pentair subsidiary to Crane Co within 10 days after Emerson acquired Pentair Following a public comment period the Commission approved the final order on June 30 2017
In Sherwin-WilliamsValspar42 the Commission challenged Sherwin-Williams Cos proposed $113 billion acquisition of Valspar Corporation The Commissions complaint alleged that the proposed acquisition would have reduced competition in the North American market for industrial wood coatings used to make furniture kitchen cabinets and building products where Sherwin-Williams and Valspar were two of the top three industrial wood coatings manufacturers Industrial wood coatings which include stains topcoats and sealants provide better resistance to abrasion and water than consumer wood coatings To remedy these concerns the Commission issued a consent order requiring Sherwin-Williams to divest two Valspar industrial wood coatings plants one in High Point North Carolina and the other in Cornwall Ontario to Axalta Coating Systems Ltd a leading supplier of coatings to large automotive and industrial original equipment manufacturers Following a public comment period the Commission approved the final order on July 28 2017
In Alimentation Couche-TardCST Brands43 the Commission challenged Alimentation Couche-Tard Incs proposed $44 billion acquisition of CST Brands Inc The Commissions
41 In the Matter of Emerson Electric Company and Pentair plc FTC Dkt C-4615 (final order issued on June 30 2017) available at httpswwwftcgovenforcementcases-proceedings161-0221emerson-electric-pentair 42 In the Matter of The Sherwin-Williams Company and The Valspar Corporation FTC Dkt C-4621 (final order issued on July 28 2017) available at httpswwwftcgovenforcementcases-proceedings161-0116sherwin-williamsvalspar-matter 43 In the Matter of Alimentation Couch-Tard Inc and CST Brands Inc FTC Dkt C-4618 (final order issued on August 14 2017) available at httpswwwftcgovenforcementcases-proceedingsfile-no-161-0207-docket-no-c-4618alimentation-couche-tard-cst-brands
18
complaint alleged that the proposed merger would have reduced competition for the retail sales of gasoline and diesel in 71 local markets At the time of the merger Alimentation Couche-Tard operated convenience stores and retail fuel stations worldwide including nearly 4700 in United States Its convenience stores primarily operate under the Circle K and Kangaroo Express banners and the retail fuel sells under numerous brands CST operated 1146 convenience stores and retail fuel stations in the United States Its convenience stores primarily operated under the Corner Store banner while its fuel stations generally use the Valero brand According to the complaint the geographic markets for the retail sale of gasoline and diesel were local and generally ranged from a few blocks to a few miles The complaint alleged that without a remedy the merger would have increased market concentration for the retail sales of gasoline or diesel in each of the 71 local markets resulting in a monopoly in ten markets and reduced the number of competitors in the rest from three to two competitors To remedy these concerns the Commission issued a consent order requiring Alimentation Couche-Tard to divest 70 CST fuel stations to Empire Petroleum Partners The divested fuel stations were located in Arizona Colorado Florida Georgia Louisiana New Mexico Ohio and Texas Following a public comment period the Commission approved the final order on August 14 2017
In BroadcomBrocade Communications Systems44 the Commission challenged Broadcom Limiteds proposed $59 billion acquisition of Brocade Communications Systems Inc The Commissions complaint alleged that the proposed merger would have been anticompetitive because of Broadcoms access to the confidential business information of Brocades major competitor Cisco Systems Such information could be used to restrain competition or slow innovation in the worldwide market for fibre channel switches According to the complaint Brocade and Cisco were the only two competitors in the worldwide market for fibre channel switches and Broadcom supplied both companies with application-specific integrated circuits to make fibre channel switches The complaint further alleged that as the new owner of Brocade Broadcom could have used Ciscos confidential business information to unilaterally exercise market power or to coordinate action among Brocade and Cisco increasing the likelihood that customers would pay higher prices for fibre channel switches To remedy these concerns the Commission issued a consent order preventing Broadcom from using Ciscos competitively sensitive confidential information for any purpose other than designing manufacturing and selling fibre channel application-specific integrated circuits for Cisco To assure compliance the Commission appointed a monitor for five years The Commission cooperated with its counterparts in a number of jurisdictions that also reviewed the transaction including the European Commission China and Japan Following a public comment period the Commission approved the final order on August 17 2017
In Abbott LaboratoriesAlere 45 the Commission challenged Abbott Laboratoriesrsquo proposed $83 billion acquisition of Alere Inc over concerns that the proposed merger would have harmed competition in the United States for the sale of two types of medical devices point-of-care blood gas testing systems and point-of-care cardiac marker testing systems Point-of-
44 In the Matter of Broadcom Ltd and Brocade Communications Systems Inc FTC Dkt C-4622 (final order issued on August 17 2017) available at httpswwwftcgovenforcementcases-proceedings171-0027broadcom-limitedbrocade-communications-systems 45 In the Matter of Abbott Laboratories and Alere Inc FTC Dkt C-4625 (final order issued on Nov 14 2017) available at httpswwwftcgovenforcementcases-proceedings161-0084abbott-laboratories-alere-inc
19
care blood gas testing systems measure blood pH oxygen carbon dioxide and electrolyte levels in the blood Point-of-care cardiac marker testing systems measure specific proteins in the blood to access whether a patient is having a heart attack To remedy these concerns the Commission issued a consent order requiring Alere to divest its blood gas testing systems to Siemens Aktiengelsellschaft and its cardiac marker testing systems to Quidel Corporation Following a public comment period the Commission approved the final order on November 14 2017
In Integra LifesciencesJohnson amp Johnson 46 the Commission challenged Integrarsquos proposed $1 billion acquisition of Johnson amp Johnsonrsquos Codman Neuro division The Commissionrsquos complaint alleged that the proposed merger would have harmed competition in five medical device product market lines used in operative neurosurgery hydrocephalus management and neuro-critical care To remedy these concerns the Commission issued a consent order requiring Integra to sell these medical device product lines to Natus Medical Inc In addition the consent order required Integra to divest its manufacturing facility in San Diego and supply Natus with cranial access kits until Natus secured its own supply Following a public comment period the Commission approved the final order on December 22 2017
In Baxter InternationalClaris Lifesciences and Arjun Handa 47 the Commission challenged Baxterrsquos proposed $625 million acquisition of Clarisrsquo injectable drugs business The Commissionrsquos complaint alleged that the proposed merger would have reduced competition in the market for the antifungal agent fluconazole in saline intravenous bags as well as future competition in the market for milrinone in dextrose intravenous bags which dilates blood vessels lowers blood pressure and allows blood to flow more easily through the cardiovascular system To remedy these concerns the Commission issued a consent order requiring the parties to divest all of Clarisrsquos rights to these injectable drugs to Renaissance Lakewood Pharmaceuticals Following a public comment period the Commission approved the final order on August 30 2017
In Mars IncVCA48 the Commission challenged Marsrsquo proposed $91 billion acquisition of pet care company VCA alleging that the proposed merger would have harmed competition for certain specialty and emergency veterinary services in ten localities in the United States by eliminating head-to-head competition between Mars and VCA specialists The Commission issued a consent order requiring the parties to divest clinics in Kansas City New York Phoenix Chicago Corpus Christi San Antonio and two clinics in Seattle Under the terms of the consent order Mars was required for ten years to notify the Commission if it planned to acquire any additional specialty or emergency veterinary clinics in certain geographic areas The consent order also required both Mars and VCA to secure all third-party consents assignments and releases permitting the buyers to conduct business at the divested clinics Following a public comment period the Commission approved the final order on December 19 2017
46 In the Matter of Integra Lifesciences Corp and Johnson amp Johnson FTC Dkt C-4624 (final order issued on Dec 22 2017) available at httpswwwftcgovenforcementcases-proceedings171-0084integra-lifesciences-johnson-johnson 47 In the Matter of Baxter International Inc Claris Lifesciences Limited and Arjun Handa FTC Dkt C-4620 (final order issued on August 30 2017) available at httpswwwftcgovenforcementcases-proceedings171-0052baxter-international-inc-claris-lifesciences-limited-arjun 48 In the Matter of Mars Inc and VCA Inc FTC Dkt C-4633 (final order issued on December 19 2017) available at httpswwwftcgovenforcementcases-proceedings171-0057mars-incorporated-vca-inc
20
ONGOING REASSESSMENT OF THE EFFECTS OF THE PREMERGER NOTIFICATION PROGRAM
The Commission and the Antitrust Division continually review the impact of the premerger notification program on the business community and antitrust enforcement The premerger notification program ensures that the antitrust agencies review virtually every relatively large merger and acquisition that affects US consumers before consummation Prior to the HSR Act businesses could and often did consummate transactions that raised significant antitrust concerns before the agencies had an opportunity to consider adequately their competitive effects This practice forced the agencies to engage in lengthy post-acquisition litigation during the course of which the transactionrsquos anticompetitive effects continued to harm consumers and if effective post-acquisition relief was not practicable the harm continued Because the premerger notification program requires reporting before consummation the agenciesrsquo ability to obtain timely effective relief to prevent anticompetitive effects has vastly improved Thus the HSR Act is doing what Congress intendedmdashgiving the government the opportunity to investigate and challenge those relatively large mergers that are likely to harm consumers before injury can arise
The Commission and the Antitrust Division also regularly examine the premerger notification programrsquos effectiveness and continually seek ways to increase accessibility promote transparency and improve the review process to reduce the burden on the filing parties without compromising the agenciesrsquo ability to investigate and challenge proposed transactions that may substantially lessen competition
21
LIST OF APPENDICES
Appendix A Summary of Transactions Fiscal Years 2008 - 2017
Appendix B Number of Transactions Reported and Filings Received by Month for Fiscal Years 2008 - 2017
LIST OF EXHIBITS
Exhibit A Statistical Tables for Fiscal Year 2017 ndash Data ProfilingHart-Scott-Rodino Notification Filings and Enforcement Interests
Adjusted Transactions In Which A Second Request Could Have Been 1656 684 1128 1414 1400 1286 Issued2
Investigations in Which Second Requests 41 31 42 55 49 47Were Issued FTC3 21 15 20 24 20 25
Percent4 13 22 18 17 14 19
DOJ3 20 16 22 31 29 22
Percent4 12 23 20 22 21 17
Transactions Involving a Request For 1385 575 953 1157 1094 990Early Termination5
Granted5 1021 396 704 888 902 797
Not Granted5 364 179 249 269 192 193
2014
1663
3307
1618
51
30
19
21
13
1274
1020
254
2015
1801
3585
1754
47
20
11
27
15
1366
1086
280
2016
1832
3674
1772
54
25
14
29
16
1374
1102
272
2017
2052
4083
1992
51
33
17
18
09
1552
1220
332 Note The data for FY 2010 and FY 2011 reflect corrections to some prior annual reports and the DOJ number of investigations in which second requests were issued and the percentage of transactions in which second requests were issued by DOJ
1 Usually two filings are received one from the acquiring person and one from the acquired person when a transaction is reported Only one application is received when an acquiring party files for an exemption under Section 7A (c )(6) or (c )(8) of the Clayton Act
2 These figures omit from the total number of transactions reported all transactions for which the agencies were not authorized to request additional information These include (1) incomplete transactions (only one party filed a complete notification) (2) transactions reported pursuant to the exemption provisions of Sections 7A (c)(6) and 7A(c)(8) of the Act (3) transactions which were found to be non-reportable and (4) transactions withdrawn before the waiting period began In addition where a party filed more than one notification in the same year to acquire voting securities of the same corporation eg filing one threshold and later filing for a higher threshold only a single consolidated transaction has been counted because as a practical matter the agencies do not issue more than one Second Request in such a case These statistics also omit from the total number the transactions reported secondary acquisitions filed pursuant to sect8014 of the Premerger Notification rules Secondary acquisitions have been deducted in order to be consistent with the statistics presented in most of the prior annual reports
3 These statistics are based on the date the Second Request was issued and not the date the investigation was opened 4 Second Request investigations are a percentage of the total number of adjusted transactions The total percentage reflected in Figure 2 may not equal the sum of reported component values due to rounding
5 These statistics are based on the date of the HSR filing and not the date action was taken on the request
APPENDIX B
NUMBER OF TRANSACTIONS REPORTED
AND
FILINGS RECEIVED BY MONTH
FOR
FISCAL YEARS 2008 - 2017
APPENDIX B TABLE 1 NUMBER OF TRANSACTIONS REPORTED BY MONTH FOR FISCAL YEARS
October
November
December
January
February
March
April
May
June
July
August
September
TOTAL
2008 2009 2010 2011 2012 2013 2014 2015 2016
158 91 66 128 122 127 124 144 168
191 85 135 217 169 260 159 157 243
172 37 84 91 95 92 108 122 157
158 42 62 97 104 78 125 118 117
119 32 61 81 90 82 114 140 127
131 42 116 97 111 87 100 128 125
128 60 92 96 96 77 140 131 129
150 58 108 142 117 117 157 152 168
146 51 108 117 142 90 150 155 150
128 62 94 120 130 91 162 170 140
126 77 120 164 133 122 151 216 166
119 79 120 100 120 103 173 168 142
1726 716 1166 1450 1429 1326 1663 1801 1832
2017
163
215
148
153
153
146
150
209
191
146
219
159
2052
APPENDIX B TABLE 2 NUMBER OF FILINGS RECEIVED1 BY MONTH FOR FISCAL YEARS
October
November
December
January
February
March
April
May
June
July
August
September
TOTAL
2008 2009 2010 2011 2012 2013 2014 2015
319 185 146 252 242 255 247 289
380 165 242 422 332 511 325 322
343 79 177 193 188 180 211 239
316 77 126 188 203 151 244 244
246 63 116 157 185 169 236 257
242 81 232 195 215 172 195 252
272 119 182 190 193 151 271 265
294 114 216 284 231 228 315 305
293 99 213 231 275 181 304 322
259 121 187 240 269 186 323 327
251 149 238 329 259 240 292 425
240 159 243 201 237 204 344 338
3455 1411 2318 2882 2829 2628 3307 3585
2016
345
483
314
236
249
265
249
331
304
284
339
275
3674
2017
329
416
297
307
298
302
290
402
388
291
446
317
4083
1 Usually two filings are received one from the acquiring person and one from the acquired person when the transaction is reported Only one filing is received when an acquiring person files for a transaction that is exempt under Sections 7A(c)(6) and (c)(8) of the Clayton Act
EXHIBIT A
STATISTICAL TABLES
FOR
FISCAL YEAR 2017
DATA PROFILING HART-SCOTT-RODINO PREMERGER NOTIFICATION FILINGS AND ENFORCEMENT INTERESTS
5
5
5
5
5
5
5
TABLE I 1FISCAL YEAR 2017
2ACQUISITIONS BY SIZE OF TRANSACTION (BY SIZE RANGE)
TRANSACTION RANGE ($MILLIONS)
HSR TRANSACTIONS CLEARANCE GRANTED TO FTC OR DOJ 3SECOND REQUEST INVESTIGATIONS
812 Personal and Laundry Services 5 03 -01 0 0 0 0 0 0 0
TABLE XI 1FISCAL YEAR 2017
INDUSTRY GROUP OF ACQUIRED ENTITIES
3 DIGIT NAICS
11CODE INDUSTRY DESCRIPTION
4NUMBER
PERCENT OF TOTAL
POINTS CHANGE FROM FY
2016 12
CLEARANCE GRANTED TO FTC
OR DOJ
SECOND REQUEST 3INVESTIGATIONS
NUMBER OF 3 DIGIT INTRA-
INDUSTRY TRANSAC-
TIONS 14FTC DOJ TOTAL FTC DOJ TOTAL
1992 1000 205 72 277 33 18 51 508
1 Fiscal year 2017 figures include transactions reported between October 1 2016 and September 30 2017
2 The size of transaction is based on the aggregate total amount of voting securities non-corporate interests andor assets held by the acquiring person as a result of the transaction and are taken from the response to Item 2(d)(iii) 2(d)(vii) and 2(d)(ix) of the Notification and Report Form
3 These statistics are based on the date the Second Request was issued
4 During fiscal year 2017 2052 transactions were reported under the HSR Premerger Notification program The smaller number 1992 reflects the adjustments to eliminate the following types of transactions (1) transactions reported under Section 7A(c)(6) and (c)(8) (transactions involving certain regulated industries and financial businesses) (2) transactions deemed non-reportable (3) incomplete transactions (only one party in each transaction filed a compliant notification) and (4) transactions withdrawn before the waiting period began The table does not however exclude competing offers or multiple HSR transactions resulting from a single business transaction (where there are multiple acquiring persons or acquired persons)
5 The total number of filings under $50M submitted in Fiscal Year 2017 reflects corrective filings
6 In February 2001 legislation raised the size of transaction from $15 million to $50 million with annual adjustments beginning in February 2005 As of FY 2017 the threshold categories include non-corporate interests (NCI) encompassing transactions in which the acquiring entity acquires 50 of more of the non-corporate interests of the acquired entity
7 The category labeled ldquoSales Not Availablerdquo includes newly-formed acquiring persons foreign acquiring person with no United States revenues and acquiring persons who had not derived any revenues from their investments at the time of filing
8 Assets of an acquired entity are not available when the acquired entityrsquos financial data is consolidated within its ultimate parent
9 Sales of an acquired entity are taken from responses to Item 4(a) and (b) (SEC documents and annual reports) or item 5 (dollar revenues) of the Premerger Notification and Report Form
10 This category includes acquisition of newly-formed entities from which no sales were generated and acquisitions of assets which produced no sales revenues during the prior year to filing the Notification and Report Form
11 The 3-digit codes are part of the North American Industrial Classification System (NAICS) established by the United States Government North American Industrial Classification System 1997 Executive Office of the President Office of Management and Budget The NAICS groups used in this table were determined from responses submitted by the parties to Item 5 of the Premerger Notification and Report Form
12 This represents the deviation from the fiscal year 2016 percentage
13 This category includes transactions by newly-formed entities
14 The intra-industry transactions column identifies the number of acquisitions in which both the acquiring and acquired person derived revenues from the same 3-digit NAICS code
INTRODUCTION
A STATISTICAL PROFILE OF THE PREMERGER NOTIFICATION PROGRAM
A STATISTICAL PROFILE OF THE PREMERGER NOTIFICATION PROGRAM
DEVELOPMENTS WITHIN THE PREMERGER PROGRAM
ONGOING REASSESSMENT OF THE EFFECTS OF THE PREMERGER NOTIFICATION PROGRAM
The Commission and the Antitrust Division continually review the impact of the premerger notification program on the business community and antitrust enforcement The premerger notification program ensures that the antitrust agencies review virtually every relatively large merger and acquisition that affects US consumers before consummation Prior to the HSR Act businesses could and often did consummate transactions that raised significant antitrust concerns before the agencies had an opportunity to consider adequately their competitive effects This practice forced the agencies to engage in lengthy post-acquisition litigation during the course of which the transactionrsquos anticompetitive effects continued to harm consumers and if effective post-acquisition relief was not practicable the harm continued Because the premerger notification program requires reporting before consummation the agenciesrsquo ability to obtain timely effective relief to prevent anticompetitive effects has vastly improved Thus the HSR Act is doing what Congress intendedmdashgiving the government the opportunity to investigate and challenge those relatively large mergers that are likely to harm consumers before injury can arise
The Commission and the Antitrust Division also regularly examine the premerger notification programrsquos effectiveness and continually seek ways to increase accessibility promote transparency and improve the review process to reduce the burden on the filing parties without compromising the agenciesrsquo ability to investigate and challenge proposed transactions that may substantially lessen competition
21
LIST OF APPENDICES
Appendix A Summary of Transactions Fiscal Years 2008 - 2017
Appendix B Number of Transactions Reported and Filings Received by Month for Fiscal Years 2008 - 2017
LIST OF EXHIBITS
Exhibit A Statistical Tables for Fiscal Year 2017 ndash Data ProfilingHart-Scott-Rodino Notification Filings and Enforcement Interests
Adjusted Transactions In Which A Second Request Could Have Been 1656 684 1128 1414 1400 1286 Issued2
Investigations in Which Second Requests 41 31 42 55 49 47Were Issued FTC3 21 15 20 24 20 25
Percent4 13 22 18 17 14 19
DOJ3 20 16 22 31 29 22
Percent4 12 23 20 22 21 17
Transactions Involving a Request For 1385 575 953 1157 1094 990Early Termination5
Granted5 1021 396 704 888 902 797
Not Granted5 364 179 249 269 192 193
2014
1663
3307
1618
51
30
19
21
13
1274
1020
254
2015
1801
3585
1754
47
20
11
27
15
1366
1086
280
2016
1832
3674
1772
54
25
14
29
16
1374
1102
272
2017
2052
4083
1992
51
33
17
18
09
1552
1220
332 Note The data for FY 2010 and FY 2011 reflect corrections to some prior annual reports and the DOJ number of investigations in which second requests were issued and the percentage of transactions in which second requests were issued by DOJ
1 Usually two filings are received one from the acquiring person and one from the acquired person when a transaction is reported Only one application is received when an acquiring party files for an exemption under Section 7A (c )(6) or (c )(8) of the Clayton Act
2 These figures omit from the total number of transactions reported all transactions for which the agencies were not authorized to request additional information These include (1) incomplete transactions (only one party filed a complete notification) (2) transactions reported pursuant to the exemption provisions of Sections 7A (c)(6) and 7A(c)(8) of the Act (3) transactions which were found to be non-reportable and (4) transactions withdrawn before the waiting period began In addition where a party filed more than one notification in the same year to acquire voting securities of the same corporation eg filing one threshold and later filing for a higher threshold only a single consolidated transaction has been counted because as a practical matter the agencies do not issue more than one Second Request in such a case These statistics also omit from the total number the transactions reported secondary acquisitions filed pursuant to sect8014 of the Premerger Notification rules Secondary acquisitions have been deducted in order to be consistent with the statistics presented in most of the prior annual reports
3 These statistics are based on the date the Second Request was issued and not the date the investigation was opened 4 Second Request investigations are a percentage of the total number of adjusted transactions The total percentage reflected in Figure 2 may not equal the sum of reported component values due to rounding
5 These statistics are based on the date of the HSR filing and not the date action was taken on the request
APPENDIX B
NUMBER OF TRANSACTIONS REPORTED
AND
FILINGS RECEIVED BY MONTH
FOR
FISCAL YEARS 2008 - 2017
APPENDIX B TABLE 1 NUMBER OF TRANSACTIONS REPORTED BY MONTH FOR FISCAL YEARS
October
November
December
January
February
March
April
May
June
July
August
September
TOTAL
2008 2009 2010 2011 2012 2013 2014 2015 2016
158 91 66 128 122 127 124 144 168
191 85 135 217 169 260 159 157 243
172 37 84 91 95 92 108 122 157
158 42 62 97 104 78 125 118 117
119 32 61 81 90 82 114 140 127
131 42 116 97 111 87 100 128 125
128 60 92 96 96 77 140 131 129
150 58 108 142 117 117 157 152 168
146 51 108 117 142 90 150 155 150
128 62 94 120 130 91 162 170 140
126 77 120 164 133 122 151 216 166
119 79 120 100 120 103 173 168 142
1726 716 1166 1450 1429 1326 1663 1801 1832
2017
163
215
148
153
153
146
150
209
191
146
219
159
2052
APPENDIX B TABLE 2 NUMBER OF FILINGS RECEIVED1 BY MONTH FOR FISCAL YEARS
October
November
December
January
February
March
April
May
June
July
August
September
TOTAL
2008 2009 2010 2011 2012 2013 2014 2015
319 185 146 252 242 255 247 289
380 165 242 422 332 511 325 322
343 79 177 193 188 180 211 239
316 77 126 188 203 151 244 244
246 63 116 157 185 169 236 257
242 81 232 195 215 172 195 252
272 119 182 190 193 151 271 265
294 114 216 284 231 228 315 305
293 99 213 231 275 181 304 322
259 121 187 240 269 186 323 327
251 149 238 329 259 240 292 425
240 159 243 201 237 204 344 338
3455 1411 2318 2882 2829 2628 3307 3585
2016
345
483
314
236
249
265
249
331
304
284
339
275
3674
2017
329
416
297
307
298
302
290
402
388
291
446
317
4083
1 Usually two filings are received one from the acquiring person and one from the acquired person when the transaction is reported Only one filing is received when an acquiring person files for a transaction that is exempt under Sections 7A(c)(6) and (c)(8) of the Clayton Act
EXHIBIT A
STATISTICAL TABLES
FOR
FISCAL YEAR 2017
DATA PROFILING HART-SCOTT-RODINO PREMERGER NOTIFICATION FILINGS AND ENFORCEMENT INTERESTS
5
5
5
5
5
5
5
TABLE I 1FISCAL YEAR 2017
2ACQUISITIONS BY SIZE OF TRANSACTION (BY SIZE RANGE)
TRANSACTION RANGE ($MILLIONS)
HSR TRANSACTIONS CLEARANCE GRANTED TO FTC OR DOJ 3SECOND REQUEST INVESTIGATIONS
812 Personal and Laundry Services 5 03 -01 0 0 0 0 0 0 0
TABLE XI 1FISCAL YEAR 2017
INDUSTRY GROUP OF ACQUIRED ENTITIES
3 DIGIT NAICS
11CODE INDUSTRY DESCRIPTION
4NUMBER
PERCENT OF TOTAL
POINTS CHANGE FROM FY
2016 12
CLEARANCE GRANTED TO FTC
OR DOJ
SECOND REQUEST 3INVESTIGATIONS
NUMBER OF 3 DIGIT INTRA-
INDUSTRY TRANSAC-
TIONS 14FTC DOJ TOTAL FTC DOJ TOTAL
1992 1000 205 72 277 33 18 51 508
1 Fiscal year 2017 figures include transactions reported between October 1 2016 and September 30 2017
2 The size of transaction is based on the aggregate total amount of voting securities non-corporate interests andor assets held by the acquiring person as a result of the transaction and are taken from the response to Item 2(d)(iii) 2(d)(vii) and 2(d)(ix) of the Notification and Report Form
3 These statistics are based on the date the Second Request was issued
4 During fiscal year 2017 2052 transactions were reported under the HSR Premerger Notification program The smaller number 1992 reflects the adjustments to eliminate the following types of transactions (1) transactions reported under Section 7A(c)(6) and (c)(8) (transactions involving certain regulated industries and financial businesses) (2) transactions deemed non-reportable (3) incomplete transactions (only one party in each transaction filed a compliant notification) and (4) transactions withdrawn before the waiting period began The table does not however exclude competing offers or multiple HSR transactions resulting from a single business transaction (where there are multiple acquiring persons or acquired persons)
5 The total number of filings under $50M submitted in Fiscal Year 2017 reflects corrective filings
6 In February 2001 legislation raised the size of transaction from $15 million to $50 million with annual adjustments beginning in February 2005 As of FY 2017 the threshold categories include non-corporate interests (NCI) encompassing transactions in which the acquiring entity acquires 50 of more of the non-corporate interests of the acquired entity
7 The category labeled ldquoSales Not Availablerdquo includes newly-formed acquiring persons foreign acquiring person with no United States revenues and acquiring persons who had not derived any revenues from their investments at the time of filing
8 Assets of an acquired entity are not available when the acquired entityrsquos financial data is consolidated within its ultimate parent
9 Sales of an acquired entity are taken from responses to Item 4(a) and (b) (SEC documents and annual reports) or item 5 (dollar revenues) of the Premerger Notification and Report Form
10 This category includes acquisition of newly-formed entities from which no sales were generated and acquisitions of assets which produced no sales revenues during the prior year to filing the Notification and Report Form
11 The 3-digit codes are part of the North American Industrial Classification System (NAICS) established by the United States Government North American Industrial Classification System 1997 Executive Office of the President Office of Management and Budget The NAICS groups used in this table were determined from responses submitted by the parties to Item 5 of the Premerger Notification and Report Form
12 This represents the deviation from the fiscal year 2016 percentage
13 This category includes transactions by newly-formed entities
14 The intra-industry transactions column identifies the number of acquisitions in which both the acquiring and acquired person derived revenues from the same 3-digit NAICS code
INTRODUCTION
A STATISTICAL PROFILE OF THE PREMERGER NOTIFICATION PROGRAM
A STATISTICAL PROFILE OF THE PREMERGER NOTIFICATION PROGRAM
DEVELOPMENTS WITHIN THE PREMERGER PROGRAM
APPENDIX B TABLE 2 NUMBER OF FILINGS RECEIVED1 BY MONTH FOR FISCAL YEARS
October
November
December
January
February
March
April
May
June
July
August
September
TOTAL
2008 2009 2010 2011 2012 2013 2014 2015
319 185 146 252 242 255 247 289
380 165 242 422 332 511 325 322
343 79 177 193 188 180 211 239
316 77 126 188 203 151 244 244
246 63 116 157 185 169 236 257
242 81 232 195 215 172 195 252
272 119 182 190 193 151 271 265
294 114 216 284 231 228 315 305
293 99 213 231 275 181 304 322
259 121 187 240 269 186 323 327
251 149 238 329 259 240 292 425
240 159 243 201 237 204 344 338
3455 1411 2318 2882 2829 2628 3307 3585
2016
345
483
314
236
249
265
249
331
304
284
339
275
3674
2017
329
416
297
307
298
302
290
402
388
291
446
317
4083
1 Usually two filings are received one from the acquiring person and one from the acquired person when the transaction is reported Only one filing is received when an acquiring person files for a transaction that is exempt under Sections 7A(c)(6) and (c)(8) of the Clayton Act
EXHIBIT A
STATISTICAL TABLES
FOR
FISCAL YEAR 2017
DATA PROFILING HART-SCOTT-RODINO PREMERGER NOTIFICATION FILINGS AND ENFORCEMENT INTERESTS
5
5
5
5
5
5
5
TABLE I 1FISCAL YEAR 2017
2ACQUISITIONS BY SIZE OF TRANSACTION (BY SIZE RANGE)
TRANSACTION RANGE ($MILLIONS)
HSR TRANSACTIONS CLEARANCE GRANTED TO FTC OR DOJ 3SECOND REQUEST INVESTIGATIONS
812 Personal and Laundry Services 5 03 -01 0 0 0 0 0 0 0
TABLE XI 1FISCAL YEAR 2017
INDUSTRY GROUP OF ACQUIRED ENTITIES
3 DIGIT NAICS
11CODE INDUSTRY DESCRIPTION
4NUMBER
PERCENT OF TOTAL
POINTS CHANGE FROM FY
2016 12
CLEARANCE GRANTED TO FTC
OR DOJ
SECOND REQUEST 3INVESTIGATIONS
NUMBER OF 3 DIGIT INTRA-
INDUSTRY TRANSAC-
TIONS 14FTC DOJ TOTAL FTC DOJ TOTAL
1992 1000 205 72 277 33 18 51 508
1 Fiscal year 2017 figures include transactions reported between October 1 2016 and September 30 2017
2 The size of transaction is based on the aggregate total amount of voting securities non-corporate interests andor assets held by the acquiring person as a result of the transaction and are taken from the response to Item 2(d)(iii) 2(d)(vii) and 2(d)(ix) of the Notification and Report Form
3 These statistics are based on the date the Second Request was issued
4 During fiscal year 2017 2052 transactions were reported under the HSR Premerger Notification program The smaller number 1992 reflects the adjustments to eliminate the following types of transactions (1) transactions reported under Section 7A(c)(6) and (c)(8) (transactions involving certain regulated industries and financial businesses) (2) transactions deemed non-reportable (3) incomplete transactions (only one party in each transaction filed a compliant notification) and (4) transactions withdrawn before the waiting period began The table does not however exclude competing offers or multiple HSR transactions resulting from a single business transaction (where there are multiple acquiring persons or acquired persons)
5 The total number of filings under $50M submitted in Fiscal Year 2017 reflects corrective filings
6 In February 2001 legislation raised the size of transaction from $15 million to $50 million with annual adjustments beginning in February 2005 As of FY 2017 the threshold categories include non-corporate interests (NCI) encompassing transactions in which the acquiring entity acquires 50 of more of the non-corporate interests of the acquired entity
7 The category labeled ldquoSales Not Availablerdquo includes newly-formed acquiring persons foreign acquiring person with no United States revenues and acquiring persons who had not derived any revenues from their investments at the time of filing
8 Assets of an acquired entity are not available when the acquired entityrsquos financial data is consolidated within its ultimate parent
9 Sales of an acquired entity are taken from responses to Item 4(a) and (b) (SEC documents and annual reports) or item 5 (dollar revenues) of the Premerger Notification and Report Form
10 This category includes acquisition of newly-formed entities from which no sales were generated and acquisitions of assets which produced no sales revenues during the prior year to filing the Notification and Report Form
11 The 3-digit codes are part of the North American Industrial Classification System (NAICS) established by the United States Government North American Industrial Classification System 1997 Executive Office of the President Office of Management and Budget The NAICS groups used in this table were determined from responses submitted by the parties to Item 5 of the Premerger Notification and Report Form
12 This represents the deviation from the fiscal year 2016 percentage
13 This category includes transactions by newly-formed entities
14 The intra-industry transactions column identifies the number of acquisitions in which both the acquiring and acquired person derived revenues from the same 3-digit NAICS code
INTRODUCTION
A STATISTICAL PROFILE OF THE PREMERGER NOTIFICATION PROGRAM
A STATISTICAL PROFILE OF THE PREMERGER NOTIFICATION PROGRAM
DEVELOPMENTS WITHIN THE PREMERGER PROGRAM
1 Fiscal year 2017 figures include transactions reported between October 1 2016 and September 30 2017
2 The size of transaction is based on the aggregate total amount of voting securities non-corporate interests andor assets held by the acquiring person as a result of the transaction and are taken from the response to Item 2(d)(iii) 2(d)(vii) and 2(d)(ix) of the Notification and Report Form
3 These statistics are based on the date the Second Request was issued
4 During fiscal year 2017 2052 transactions were reported under the HSR Premerger Notification program The smaller number 1992 reflects the adjustments to eliminate the following types of transactions (1) transactions reported under Section 7A(c)(6) and (c)(8) (transactions involving certain regulated industries and financial businesses) (2) transactions deemed non-reportable (3) incomplete transactions (only one party in each transaction filed a compliant notification) and (4) transactions withdrawn before the waiting period began The table does not however exclude competing offers or multiple HSR transactions resulting from a single business transaction (where there are multiple acquiring persons or acquired persons)
5 The total number of filings under $50M submitted in Fiscal Year 2017 reflects corrective filings
6 In February 2001 legislation raised the size of transaction from $15 million to $50 million with annual adjustments beginning in February 2005 As of FY 2017 the threshold categories include non-corporate interests (NCI) encompassing transactions in which the acquiring entity acquires 50 of more of the non-corporate interests of the acquired entity
7 The category labeled ldquoSales Not Availablerdquo includes newly-formed acquiring persons foreign acquiring person with no United States revenues and acquiring persons who had not derived any revenues from their investments at the time of filing
8 Assets of an acquired entity are not available when the acquired entityrsquos financial data is consolidated within its ultimate parent
9 Sales of an acquired entity are taken from responses to Item 4(a) and (b) (SEC documents and annual reports) or item 5 (dollar revenues) of the Premerger Notification and Report Form
10 This category includes acquisition of newly-formed entities from which no sales were generated and acquisitions of assets which produced no sales revenues during the prior year to filing the Notification and Report Form
11 The 3-digit codes are part of the North American Industrial Classification System (NAICS) established by the United States Government North American Industrial Classification System 1997 Executive Office of the President Office of Management and Budget The NAICS groups used in this table were determined from responses submitted by the parties to Item 5 of the Premerger Notification and Report Form
12 This represents the deviation from the fiscal year 2016 percentage
13 This category includes transactions by newly-formed entities
14 The intra-industry transactions column identifies the number of acquisitions in which both the acquiring and acquired person derived revenues from the same 3-digit NAICS code
INTRODUCTION
A STATISTICAL PROFILE OF THE PREMERGER NOTIFICATION PROGRAM