HART/McINTURFF Study #10316--page 1 10316 May 2010 NBC News/Wall Street Journal Survey Interviews: 1000 adults, including 100 reached by cell phone Date: May 6-10, 2010 Oversample of 90 Hispanic adults Total of 200 Hispanic adults NBC News/Wall Street Journal Survey Please note: all results are shown as percentages unless otherwise stated. The margin of error for 1000 interviews is ±3.10% Unless otherwise noted by a “+”, all previous data shown reflects responses among all adults. (ASK ONLY OF SAMPLE TYPE 2--CELL PHONE ONLY RESPONDENTS.) Q1a. Do you have a landline in addition to your cell phone, or is your cell phone the only telephone you have? Have a landline ................................. - TERMINATE Cell phone is only telephone ............. 100 CONTINUE Not sure .......................................... - TERMINATE Q2a For statistical purposes only, would you please tell me how old you are? (IF “REFUSED,” ASK:) Well, would you tell me which age group you belong to? (READ LIST.) 18-24 ................................................ 10 25-29 ................................................ 8 30-34 ................................................ 8 35-39 ................................................ 10 40-44 ................................................ 9 45-49 ................................................ 8 50-54 ................................................ 9 55-59 ................................................ 10 60-64 ................................................ 10 65-69 ................................................ 6 70-74 ................................................ 3 75 and over ....................................... 6 Not sure/refused ............................. 3 Q2b To ensure that we have a representative sample, would you please tell me whether you are from a Hispanic or Spanish-speaking background? Yes, Hispanic .................................... 11 No, not Hispanic ............................... 89 Not sure/refused ............................. - Q2c And again, for statistical purposes only, what is your race--white, black, Asian, or something else? White ................................................. 76 Black ................................................. 11 Asian ................................................. 2 Other ................................................. 4 Hispanic (VOL) ................................ 6 Not sure/refused.............................. 1 48 Male 52 Female
Transcript
HART/McINTURFF Study #10316--page 1 10316 May 2010 NBC News/Wall Street Journal Survey
Interviews: 1000 adults, including 100 reached by cell phone Date: May 6-10, 2010 Oversample of 90 Hispanic adults
Total of 200 Hispanic adults NBC News/Wall Street Journal Survey Please note: all results are shown as percentages unless otherwise stated.
The margin of error for 1000 interviews is ±3.10%
Unless otherwise noted by a “+”, all previous data shown reflects responses among all adults.
(ASK ONLY OF SAMPLE TYPE 2--CELL PHONE ONLY RESPONDENTS.) Q1a. Do you have a landline in addition to your cell phone, or is your cell phone the only telephone you have?
Have a landline ................................. - TERMINATE Cell phone is only telephone ............. 100 CONTINUE Not sure .......................................... - TERMINATE
Q2a For statistical purposes only, would you please tell me how old you are? (IF “REFUSED,” ASK:) Well,
would you tell me which age group you belong to? (READ LIST.)
+ Results shown reflect responses among registered voters.
HART/McINTURFF Study #10316--page 5 10316 May 2010 NBC News/Wall Street Journal Survey
Q6 Now I'm going to read you the names of several public figures and groups, and I'd like you to rate your
feelings toward each one as very positive, somewhat positive, neutral, somewhat negative, or very negative. If you don't know the name, please just say so. (RANDOMIZE EXCEPT BARACK OBAMA)
Very Positive
Somewhat
Positive
Neutral
Somewhat Negative
Very
Negative
Don't Know Name/
Not Sure
Barack Obama May 2010 .................................. 29 20 12 14 24 1 March 2010 ............................... 31 19 11 14 24 1 January 23-25, 2010 ................. 29 23 14 14 20 - January 10-14, 2010 ................. 29 23 12 16 19 1 December 2009 ........................ 29 21 13 15 22 - October 2009 ............................ 36 20 11 12 21 - September 2009 ....................... 38 18 11 14 19 - July 2009 .................................. 37 18 10 14 20 1 June 2009 ................................. 41 19 11 12 17 - April 2009 ................................. 45 19 12 10 13 1 February 2009 .......................... 47 21 12 9 10 1 January 2009 ............................ 43 23 17 8 6 3 December 2008 ........................ 45 22 15 8 8 2 October 17-20, 2008+ ............... 37 19 10 10 23 1 October 4-5, 2008+ ................... 30 22 12 12 23 1 September 19-22, 2008+ .......... 29 19 15 14 22 1 September 6-8, 2008+ .............. 33 20 13 12 20 2 August 2008+ ........................... 28 22 13 17 19 1 July 2008+ ................................ 27 21 16 11 23 2 June 2008+ ............................... 25 23 17 11 22 2 April 2008+ ............................... 23 23 16 17 20 1 March 2008+ ............................. 24 25 18 16 16 1 January 2008 ............................ 19 30 22 11 14 4 December 2007 ........................ 17 29 22 14 12 6 November 2007 ........................ 15 28 24 12 12 9 September 2007 ....................... 15 27 23 13 12 10 July 2007 .................................. 16 26 24 12 10 12 April 2007 ................................. 19 26 25 8 6 16 March 2007 ............................... 18 19 26 11 6 20 High February 2009 .......................... 47 21 12 9 10 1 Low Oct. 28-30, 2006+ ..................... 14 17 18 5 6 40
+ Results shown reflect responses among registered voters.
HART/McINTURFF Study #10316--page 6 10316 May 2010 NBC News/Wall Street Journal Survey
Q.6 (cont'd)
Very Positive
Somewhat
Positive
Neutral
Somewhat Negative
Very
Negative
Don't Know Name/
Not Sure
The Democratic Party May 2010 ................................... 11 26 19 18 24 2 March 2010 ................................ 9 28 19 19 24 1 January 23-25, 2010 ................... 14 25 22 17 21 1 January 10-14, 2010 ................... 11 27 20 18 23 1 December 2009 ........................... 10 25 19 19 26 1 October 2009 ............................. 14 28 20 14 22 2 September 2009 ......................... 14 27 18 17 22 2 July 2009 .................................... 13 29 19 17 20 2 June 2009 .................................. 19 26 16 16 21 2 April 2009 ................................... 17 28 19 15 19 2 February 2009 ............................ 20 29 18 14 17 2 December 2008 .......................... 17 32 22 15 13 1 October 17-20, 2008+ ................ 16 23 22 17 21 1 October 4-5, 2008+ .................... 15 26 20 18 19 2 September 19-22, 2008+ ........... 19 23 20 16 20 2 September 6-8, 2008+ ............... 24 25 17 19 14 1 August 2008+ ............................. 17 26 21 16 19 1 July 2008+ .................................. 15 28 18 18 19 2 June 2008+ ................................ 16 27 24 13 19 1 April 2008+ ................................. 17 27 22 15 17 2 March 7-10, 2008+ ..................... 20 25 18 16 19 2 January 2008 ............................. 22 25 19 18 15 1 November 2007 .......................... 12 27 24 18 17 2 September 2007 ......................... 8 26 27 22 16 1 July 2007 .................................... 15 27 21 20 15 2 January 2007 ............................. 13 29 26 16 14 2 October 28-30, 2006+ ................ 14 25 25 18 17 1 July 2006 .................................... 7 25 27 22 17 2 January 2006 ............................. 11 25 28 20 15 1 May 2005 ................................... 12 26 26 20 14 2 February 2005 ............................ 14 28 28 16 13 1 October 2004+ ........................... 17 25 22 16 19 1 January 2002 ............................. 16 33 23 15 11 2 January 1998 ............................. 13 30 30 16 9 2 January 1994 ............................. 11 29 29 17 11 3 High January 2000 ............................. 20 30 23 15 10 2 Low July 2006 .................................... 7 25 27 22 17 2
+ Results shown reflect responses among registered voters.
HART/McINTURFF Study #10316--page 7 10316 May 2010 NBC News/Wall Street Journal Survey
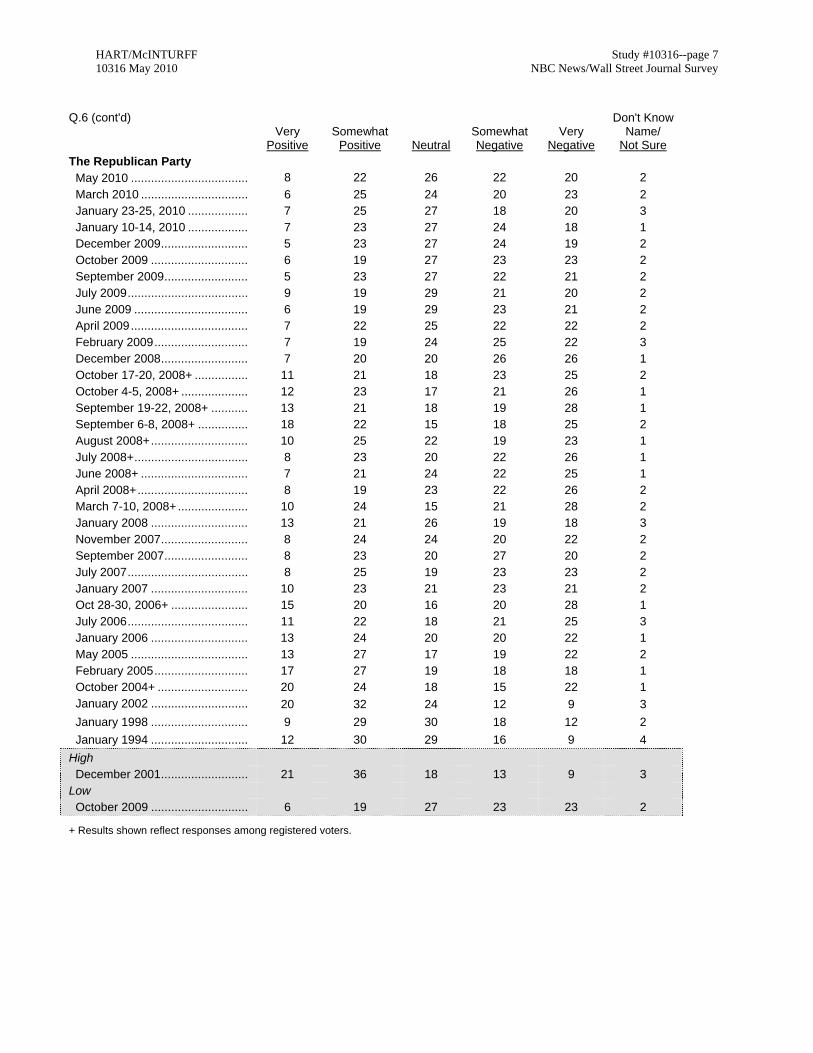
Q.6 (cont'd)
Very Positive
Somewhat
Positive
Neutral
Somewhat Negative
Very
Negative
Don't Know Name/
Not Sure
The Republican Party May 2010 ................................... 8 22 26 22 20 2 March 2010 ................................ 6 25 24 20 23 2 January 23-25, 2010 .................. 7 25 27 18 20 3 January 10-14, 2010 .................. 7 23 27 24 18 1 December 2009 .......................... 5 23 27 24 19 2 October 2009 ............................. 6 19 27 23 23 2 September 2009 ......................... 5 23 27 22 21 2 July 2009 .................................... 9 19 29 21 20 2 June 2009 .................................. 6 19 29 23 21 2 April 2009 ................................... 7 22 25 22 22 2 February 2009 ............................ 7 19 24 25 22 3 December 2008 .......................... 7 20 20 26 26 1 October 17-20, 2008+ ................ 11 21 18 23 25 2 October 4-5, 2008+ .................... 12 23 17 21 26 1 September 19-22, 2008+ ........... 13 21 18 19 28 1 September 6-8, 2008+ ............... 18 22 15 18 25 2 August 2008+ ............................. 10 25 22 19 23 1 July 2008+ .................................. 8 23 20 22 26 1 June 2008+ ................................ 7 21 24 22 25 1 April 2008+ ................................. 8 19 23 22 26 2 March 7-10, 2008+ ..................... 10 24 15 21 28 2 January 2008 ............................. 13 21 26 19 18 3 November 2007 .......................... 8 24 24 20 22 2 September 2007 ......................... 8 23 20 27 20 2 July 2007 .................................... 8 25 19 23 23 2 January 2007 ............................. 10 23 21 23 21 2 Oct 28-30, 2006+ ....................... 15 20 16 20 28 1 July 2006 .................................... 11 22 18 21 25 3 January 2006 ............................. 13 24 20 20 22 1 May 2005 ................................... 13 27 17 19 22 2 February 2005 ............................ 17 27 19 18 18 1 October 2004+ ........................... 20 24 18 15 22 1 January 2002 ............................. 20 32 24 12 9 3 January 1998 ............................. 9 29 30 18 12 2 January 1994 ............................. 12 30 29 16 9 4 High December 2001 .......................... 21 36 18 13 9 3 Low October 2009 ............................. 6 19 27 23 23 2
+ Results shown reflect responses among registered voters.
HART/McINTURFF Study #10316--page 8 10316 May 2010 NBC News/Wall Street Journal Survey
Q.6 (cont'd)
Very Positive
Somewhat
Positive
Neutral
Somewhat Negative
Very
Negative
Don't Know Name/
Not Sure
The Tea Party Movement May 2010 .................................... 16 15 21 10 20 18
March 2010 ................................. 13 16 22 10 18 21
January 23-25, 2010 ................... 14 14 20 6 15 31 BP, or British Petroleum May 2010 .................................... 2 9 29 22 23 15 Charlie Crist May 2010 .................................... 2 6 19 10 6 58
Goldman Sachs
May 2010* .................................. 1 3 21 19 31 25
General Motors, or GM
May 2010* .................................. 11 26 31 17 10 5
June 2009 ................................. 6 12 30 24 23 5
December 2008 .......................... 6 19 23 26 23 3
Citibank
May 2010** ................................. 3 7 35 20 23 12
December 2008 .......................... 3 13 28 27 21 8
Toyota
May 2010** ................................. 9 22 30 20 14 5
* Asked of one-half the respondents (FORM A). ** Asked of one-half the respondents (FORM B). + Results shown reflect responses among registered voters.
THIS TABLE IS RANKED BY D/S (TOTAL POSITIVE – TOTAL NEGATIVE)
Summary Table of Images Total Positive
Total Negative
D/S
Barack Obama 49 38 11 General Motors, or GM 37 27 10 The Tea Party Movement 31 30 1 Toyota 31 34 -3 The Democratic Party 37 42 -5 Charlie Crist 8 16 -8 The Republican Party 30 42 -12 BP, or British Petroleum 11 45 -34 Citibank 10 43 -33 Goldman Sachs 4 50 -46
Q7 I'm going to read you two statements about America and I'd like to know which one comes closer to your
point of view. (ROTATE STATEMENTS.)
Statement A: America needs more sense of community and people helping one another Statement B: America needs more self-reliance and personal responsibility.
5/10 A/America needs more community ..................................... 47 B/America needs more personal responsibility .................. 47 Some of both (VOL) ........................................................ 6 Not sure ............................................................................ -
HART/McINTURFF Study #10316--page 9 10316 May 2010 NBC News/Wall Street Journal Survey
Q8a/b How much of the time do you trust the government in Washington to do what is right--just about always,
most of the time, or only some of the time? (IF “ONLY SOME OF THE TIME,” ASK:) More specifically, would you say you trust the government in Washington to do what is right only some of the time or almost never?
5/10* 12/09** 10/09 9/05 6/051 7/042 7/032 Just about always .............................. 4 3 4 4 4 4 4 Most of the time ................................. 21 18 19 27 26 36 32 Only some of the time ....................... 44 46 65 62 65 56 60 Almost never7 ................................... 31 32 11 7 5 3 3 Not sure ........................................... - 1 1 - - 1 1 7/022 9/27/013 8/004 8/995 8/973 5 13 2 7 2 33 51 28 21 20 57 35 62 67 76 4 1 7 5 - 1 - 1 1 1 11/953 9/906 6/856 19826 19706 19586 3 7 6 2 6 16 22 35 32 23 47 57 67 55 58 69 44 23 6 2 3 4 - 0 1 1 1 2 2 4
* Asked of one-half the respondents (FORM A). ** Asked of one-half the respondents (FORM B). 1 Survey conducted by Gallup Organization. 2 Survey conducted by CBS News/New York Times. 3 Survey conducted by ABC News/Washington Post. 4 Survey conducted by Hart/Teeter for the Council for Excellence in Government. 5 Survey conducted by Henry J. Kaiser Family Foundation/Harvard University. 6 Survey data from The National Election Studies/Center for Political Studies at University of Michigan. 7 Prior to December 2009, the options read to the respondents were “Just about all the time,” “Most of the time,” and “Only some of the time,” with “Never” as a volunteered response.
Q9 Do you agree or disagree with the following statement: "The economic and political systems in the country
HART/McINTURFF Study #10316--page 10 10316 May 2010 NBC News/Wall Street Journal Survey
Q10a Let me list some issues that have been proposed for the federal government to address. Please tell me
which one of these items you think should be the top priority for the federal government. (READ LIST. RANDOMIZE. ACCEPT ONLY ONE RESPONSE. IF MORE THAN ONE, ASK:) Well, if you had to choose just one, which do you think should be the top priority?
(ASK ONLY OF RESPONDENTS WHO CHOOSE A PRIORITY IN Q10a.) Q10b And which of these issues do you think should be the next highest priority for the federal government to
address? (READ LIST AGAIN IF NECESSARY. RANDOMIZE. ACCEPT ONLY ONE RESPONSE.)
THIS TABLE HAS BEEN RANKED BY THE HIGHEST PERCENTAGE (Q.10a)
Q.10a.
Top Priority
Q.10a/b COMBINED
Top/Second Priorities 5/10 1/10 9/09 7/09 6/09 5/10 1/10 9/09 7/09 6/09 Job creation and economic growth ......... 35 38 30 38 31 55 61 55 62 54 The deficit and government spending .... 20 13 18 17 19 36 29 34 32 34 National security and terrorism ............... 12 17 11 11 14 27 36 23 23 27 Health care ............................................. 10 12 21 14 16 CONTINUE 25 31 40 32 34 The wars in Iraq and Afghanistan ........... 7 10 11 10 9 18 25 27 25 26 Immigration ............................................. 7 n/a n/a n/a n/a 17 n/a n/a n/a n/a Energy and the cost of gas ..................... 4 4 4 5 5 13 10 12 16 16 Other (VOL) .......................................... 1 - - 1 - 1 1 - 1 - All equally (VOL) .................................. 3 3 2 2 3 Skip to 3 - - 1 - None of these (VOL)............................. 1 - - - - Q.11a 1 - - - - Not sure ................................................ - - - - 1 1 - 1 - -
Q11 And, which one of the following stories that have been covered by news organizations in the last few weeks
is of most concern to you personally? (READ & RANDOMIZE.)
5/10 The Gulf Coast oil spill ........................................................... 38 The attempted terrorist attack in Times Square, New York ... 31 New immigration legislation passed in Arizona ..................... 19 The criminal investigation into Goldman Sachs ...................... 8 Florida Governor Charlie Crist changing parties to run for the U.S. Senate as an independent ........................................ 1 None of these (VOL) ....................................................... 2 Not sure ............................................................................ 1
Q11a Recently, there have been a number of cases of controversial corporate behavior--which one of these most
bothers you? (READ & RANDOMIZE.)
5/10** The oil spill by BP in the Gulf of Mexico ................................. 31 The Countrywide subprime mortgage case ............................ 26 The Goldman Sachs selling investment products .................. 22 The Bernard Madoff investment fraud .................................... 13 The issue with Toyota’s acceleration problems ...................... 5 All of them (VOL) .............................................................. 1 None of them (VOL) ....................................................... 1 Not sure ............................................................................ 1 ** Asked of one-half the respondents (FORM B).
HART/McINTURFF Study #10316--page 11 10316 May 2010 NBC News/Wall Street Journal Survey
Now, thinking ahead… Q12 Please tell me how interested you are in November's elections, using a scale from one to ten, on which a
"ten" means that you are very interested in November's elections and a "one" means that you are not at all interested. You may choose any number from one to ten. (IF "NOT SURE," RECORD AS "DK.")
HART/McINTURFF Study #10316--page 13 10316 May 2010 NBC News/Wall Street Journal Survey
ASKED ONLY OF RESPONDENTS WHO PREFERED A DEMOCRATIC-CONTROLLED CONGRESS (Q13:2) Q14a. Is your preference for a Democratic-controlled Congress more because you support the policies of Barack
Obama and the Democratic candidates, or more because you oppose the policies of the Republican Party and its candidates?*
5/10+ 10/94+ Support Barack Obama and Democratic candidates .. 49 43 Oppose Republican Party and candidates .................. 48 39 Neither (VOL) ......................................................... 1 n/a Do not plan to vote (VOL) ....................................... - n/a Both (VOL) ................................................................. n/a 6 Local candidate/issues (VOL) .................................... n/a 4 Not sure ........................... .......................................... 2 8 + Results shown reflect responses among registered voters. * In October 1994, the question read, “Are you planning to vote for the Democrat
more because you support the policies of Bill Clinton and the Democratic candidates, or more because you oppose the policies of the Republican Party and its candidates?”
ASKED ONLY OF RESPONDENTS WHO PREFERED A REPUBLICAN-CONTROLLED CONGRESS (Q13:1) Q14b. Is your preference for a Republican-controlled Congress more because you support the policies of the
Republican Party and its candidates, or more because you oppose the policies of Barack Obama and Democratic candidates?*
5/10+ 10/94+ Support Republican Party and candidates .................. 31 48 Oppose Barack Obama and Democratic candidates .. 64 34 Neither (VOL) .......................................................... 3 n/a Do not plan to vote (VOL) ........................................ - n/a Both (VOL) ................................................................. n/a 11 Local candidate/issues (VOL) .................................... n/a 3 Not sure ...................................................................... 2 4 + Results shown reflect responses among registered voters. * In October 1994, the question read “Are you planning to vote for the Republican more because you support the policies of the Republican Party and its candidates, or more because you oppose the policies of Bill Clinton and Democratic candidates?”
(ASK IF HEARD OF THE TEA PARTY MOVEMENT, Q6:1-5) Q15 From what you know about the so-called Tea Party Movement, would it be a third party that you would be
interested in voting for this year for Congress?
5/10+ 3/10+ Aware of the Tea Party and yes, interested in voting for it ...................... 21 20 Aware of the Tea Party and no, not interested in voting for it .................. 54 50 Aware of the Tea Party and Depends (VOL) ........................................ 4 5 Aware of the Tea Party and Not sure .................................................... 5 7 Unaware of Tea Party (Q6:6) ................................................................. 16 18 + Results shown reflect responses among registered voters.
HART/McINTURFF Study #10316--page 14 10316 May 2010 NBC News/Wall Street Journal Survey
Q16 In general, do you think that it is better for the same political party to control both the Congress and the
presidency, so they can work together more closely, or do you think that it is better to have different political parties controlling the Congress and the presidency to prevent either one from going too far?
5/10
3/10 10/4- 5/08+
12/13/03
12/02
10/00+
All Adults
Reg Voters+
All Adults
Reg Voters+
Better if same party controls Congress and the presidency 31 31 30 31 41 32 29 41 Better if different parties control Congress and the presidency 62 62 61 60 48 57 62 47 Not sure 7 7 9 9 11 11 9 12 9/00+ 12/99 9/98 9/97 6/96+ 12/95 41 33 34 25 43 42 47 60 55 67 44 48 12 7 11 8 13 10 1/95 10/94 6/94 1/94 10/93 12/92 33 36 30 33 30 37 55 55 59 56 58 51 12 9 11 11 12 12 10/92+ 9/92+ 8/92+ 7/92+ 4/92+ 39 40 43 40 32 47 46 44 47 61 14 14 13 13 7 10/91+ 1/92+ 10/90+ 1/90+ 9/86+ 24 28 23 24 28 67 62 67 63 64 9 10 10 13 8 + Results shown reflect responses among registered voters.
Q17 Which of the following statements is closest to your own view of the two-party system today, in terms of how
well it defines issues and provides choices for voters?
5/10 12/07 12/97 9/95 The two-party system works fairly well ................. 15 20 15 15 The two-party system has real problems, but with some improvements it can still work well .............. 52
47
55
54
The two-party system is seriously broken, and the country needs a third party ............................. 31
29
27
28
Not sure .............................................................. 2 4 3 3
HART/McINTURFF Study #10316--page 15 10316 May 2010 NBC News/Wall Street Journal Survey
Now, switching topics… Q18 Which ONE of the following statements best describes your feelings toward Barack Obama? (READ LIST.
ACCEPT ONLY ONE RESPONSE. IF MORE THAN ONE, SAY:) Well, if you had to choose just one statement, which would you choose?
5/10 1/10 10/09 9/09 6/09 4/09 1/09 Like personally and approve most policies .................. 43 42 44 46 48 51 55 Like personally but disapprove of many policies ......... 26 33 30 31 27 30 22 Don’t like personally, approve most of policies ............ 3 2 3 2 3 3 5 Don’t like personally, disapprove many policies .......... 25 19 19 18 16 12 10 None of these (VOL) ................................................. 3 3 2 2 3 2 3 Not sure ..................................................................... - 1 2 1 3 2 5 Q19 How much confidence do you have that President Obama will select the right kind of person to sit on the
Supreme Court--a great deal, quite a bit, some, very little, or none at all?
5/10 A great deal of confidence .............. 27Quite a bit of confidence ................ 17Some confidence ........................... 18Very little confidence ...................... 14No confidence at all ........................ 23 Not sure 1
GEORGE W. BUSH 7/05**
A great deal of confidence ............................ 21 Quite a bit of confidence .............................. 20 Some confidence ......................................... 21 Very little confidence .................................... 23 No confidence at all ...................................... 14 Not sure ...................................................... 1 ** Asked of one-half the respondents (FORM B).
(ASKED OF HISPANIC/LATINOS ONLY) L1 When it comes to (READ ITEM), which party do you think would do a better job--the Democratic Party, the
Republican Party, both about the same, or neither? (RANDOMIZE)
Party Advantage
DemocraticParty
RepublicanParty
Both About The Same
Neither
Not Sure
Protecting the interests of minorities D-37 49 12 25 12 2 Representing the opportunity to move up the economic ladder D-11 34 23 28 13 2 Working for the equality of and protecting against discrimination of immigrants D-42 49 7 20 22 2 Dealing with immigration D-28 39 11 23 25 2 Promoting strong moral values D-7 30 23 25 20 2
HART/McINTURFF Study #10316--page 16 10316 May 2010 NBC News/Wall Street Journal Survey
Now turning to the economy... Q20 How satisfied are you with the state of the U.S. economy today--are you very satisfied, somewhat satisfied,
somewhat dissatisfied, or very dissatisfied with the state of the economy?
HART/McINTURFF Study #10316--page 18 10316 May 2010 NBC News/Wall Street Journal Survey
Q22 Do you think last year's economic stimulus legislation is already helping improve the economy, will help
improve the economy in the future, or will it not help improve the economy? If you do not have an opinion either way, please just say so.^
5/10 9/09 7/09 Already helping improve the economy ................. 18 20 16 Will help improve the economy in the future ........ 20 27 32 Will not help improve the economy ...................... 42 38 38 Do not have an opinion either way ....................... 18 12 13 Not sure ............................................................. 2 3 1 ^ Prior to May 2010, the question read “Do you think that the economic stimulus legislation is beginning to help improve the economy, will help improve the economy in the future, or will it not help improve the economy? If you do not have an opinion either way, please just say so.”
Q23/24 Right now, do you think the United States is in an economic recession, or not? (IF YES, THEN ASK) Which
one of the following do you think best applies to the economic recession the country is in? It is almost over, it will be over within the next six months, it will be over between six months and one year, it will be over between one to two years, it will be over between two to three years, it will go on for more than three years. (ACCEPT ONLY ONE RESPONSE. IF MORE THAN ONE, SAY:) Well, if you had to choose just one, which would you choose?
CBS/NYT Surveys
5/10* 9/19-
22/08+
4/08+
3/081
1/08
8/02
1/02 9/20-23/01
Yes, in a recession 76 77 81 66 53 56 70 63 It is almost over ................................................. - It will be over within the next six months ............. 2 It will be over between six months and one year 9 It will be over between one to two years ........... 26 It will be over between two to three years ......... 16 It will go on for more than three years ............... 20 Not sure ............................................................ 3 No, not in a recession 22 19 15 27 41 39 25 32 Not sure .............................................................. 2 4 4 7 6 5 5 6
9/12/01
8/01 4/23- 25/01
4/4- 5/01
2/01
48 44 42 42 35 42 50 52 51 57 10 6 6 7 7 1Comparative data prior to April 2008 comes from surveys conducted for CBS/New York Times. * Asked of one-half the respondents (FORM A). + Results shown reflect responses among registered voters
HART/McINTURFF Study #10316--page 19 10316 May 2010 NBC News/Wall Street Journal Survey
Thinking about something a little different… Q25 When it comes to the problems in the financial markets, do you think that (INSERT PERSON/GROUP) is more
concerned about the interests of average Americans or more concerned about the interests of large corporations? (RANDOMIZE)
Interests of
Average Americans
Interests of Large
corporations
Both
Equally
Not
Sure President Obama May 2010 ...................................... 51 36 2 11 July 2002 (President Bush) ......... 36 49 10 5 Republicans in Congress May 2010 ...................................... 20 71 2 7 July 2002 ....................................... 28 55 8 9 Democrats in Congress May 2010 ...................................... 35 53 2 10 July 2002 ....................................... 47 29 10 4
Q26 Which of these statements comes closer to your point of view – (ROTATE STATEMENTS)
Statement A: The stock market is a fair and open way to invest one's money, and there are rules that make it fair and equal for all. Statement B: Because of corporate corruption and broker practices, the stock market is no longer a fair and open way to invest one's money.
5/10 10/02+ 7/02 Statement A: Stock market is fair and open ..................... 35 37 40 Statement B: Stock market is no longer fair and open ..... 58 55 49 Not sure ......................................................................... 7 8 11 + Results shown reflect responses among registered voters.
Q27 Thinking about efforts in Congress to regulate financial markets and institutions, which would concern you
more? (ROTATE STATEMENTS)
Statement A: Not doing enough to protect consumers and rein in the excesses of Wall Street and their risky investment activities. Statement B: Going too far and limiting investment opportunities for investors and curbing the country’s ability to compete in financial markets.
5/10 Statement A: Not doing enough to protect consumers ........................... 55 Statement B: Going too far and limiting investment opportunities ............ 38 Neither (VOL) ........................................................................................ 1 A little of both (VOL) ............................................................................. 1 Not sure ................................................................................................. 5
HART/McINTURFF Study #10316--page 20 10316 May 2010 NBC News/Wall Street Journal Survey
Turning to the issue of health care... Q28 From what you have heard about Barack Obama's health care plan that was recently passed by Congress
and signed into law by the President, do you think his plan is a good idea or a bad idea? If you do not have an opinion either way, please just say so. (IF GOOD IDEA/BAD IDEA, THEN ASK) And, do you feel that way strongly, or not so strongly?
5/10^ 3/10 1/23-25/10
1/10-14/10 12/09 10/09
9/09
8/09
7/09
6/09
4/09 Total Good idea 38 36 31 33 32 38 39 36 36 33 33Strongly ........................... 28 Not so strongly ................ 10 Total Bad idea 44 48 46 46 47 42 41 42 42 32 26Strongly ........................... 38 Not so strongly ................ 6 Do not have an opinion ... 17 15 22 18 17 16 17 17 17 30 34 Not sure ........................ 1 1 1 3 4 4 3 5 5 5 7 ^Prior to May 2010, the question did not ask “And, do you feel that way strongly, or not so strongly?”
Q29 And from what you have heard about Barack Obama's health care plan, do you believe it will result in the
quality of your health care getting better, worse, or staying about the same as now? If you do not have an opinion, please just say so.
5/10 10/09 9/09 8/09 7/09 4/09 Quality will get better ........................ 17 21 19 24 21 22 Quality will get worse ........................ 36 40 36 40 39 24 Quality will stay the same ................. 37 27 34 27 29 29 Do not have an opinion ..................... 9 10 8 7 9 20 Not sure .......................................... 1 2 3 2 2 5
Q30 And, would you be more likely to vote for (ROTATE) -- a candidate for Congress who says we should give
the new health care law a chance to work and then make changes to it as needed, or a candidate for Congress who says we should repeal the new health care law entirely and then start over?
5/10 Candidate who says give it a chance/make changes ................................. 55 Candidate who says repeal entirely/start over ............................................ 42 Depends (VOL) ........................................................................................ - Neither (VOL) ........................................................................................... 1 Not sure .................................................................................................... 2
Q31 And, if a candidate for Congress from your district has a position on the new health care law that differs from
your own, how likely is it that this particular difference ALONE would determine your vote on election day this November? (READ CHOICES)
5/10 Extremely likely .............................................................................. 21 Very likely ....................................................................................... 19 Somewhat likely ............................................................................. 36 Not very likely ................................................................................ 21 Not sure ...................................................................................... 3
HART/McINTURFF Study #10316--page 21 10316 May 2010 NBC News/Wall Street Journal Survey
Now, thinking about immigration… Q32 Would you say that immigration helps the United States more than it hurts it, OR immigration hurts the
United States more than it helps it?
5/10 12/07 6/07 7/06 6/06 4/06 12/05 All
Adults Hispanic /
Latino All
Adults Hispanic /
Latino All
Adults Hispanic /
Latino
Helps more than it hurts .... 37 58 39 46 69 45 44 45 62 37 Hurts more than it helps .... 53 32 52 44 21 42 45 45 28 53 Not sure ........................... 10 10 9 10 10 13 11 10 10 10
Q33 How much of an impact has illegal immigration made on your own community where you live--a great deal of
impact, quite a bit of impact, just a little impact, or no impact at all?
5/10 6/07 All
Adults Hispanic /
Latino All
Adults Hispanic /
Latino Great deal of impact ....................... 23 32 25 38 Quite a bit of impact ........................ 21 18 22 23 Just a little impact ........................... 34 24 31 20 No impact at all ............................... 19 22 20 18 Not sure ........................................ 3 4 2 1
Now, as you may know, Arizona recently passed some legislation regarding immigration… Q34 The Arizona law makes it a state crime to be in the U.S. illegally. It requires local and state law enforcement
officers to question people about their immigration status if they have reason to suspect a person is in the country illegally, making it a crime for them to lack registration documents. Do you support or oppose this law? (IF SUPPORT/OPPOSE, THEN ASK) And, do you strongly (support/oppose) or just somewhat (support/oppose) this law?
5/10 All
Adults Hispanic /
Latino Strongly support ................................................................. 46 15 Somewhat support ............................................................... 18 12 Somewhat oppose ............................................................... 10 12 Strongly oppose ................................................................... 24 58 Not sure ............................................................................ 2 3
Q35 How likely do you think it is that the decision in Arizona to promote strong enforcement of immigrants who
are NOT in the U.S. legally will lead to discrimination of Hispanic or Latino immigrants who ARE in the U.S. legally? (READ CHOICES)
5/10 All
Adults Hispanic /
Latino Very likely ............................................................................ 34 61 Somewhat likely ................................................................... 32 21 Not too likely ........................................................................ 17 8 Not at all likely ...................................................................... 14 8 Not sure ............................................................................ 3 2
HART/McINTURFF Study #10316--page 22 10316 May 2010 NBC News/Wall Street Journal Survey
Thinking about something else… Q36 Do you support or oppose a proposal to allow more drilling for oil off the coast of the United States? (IF
SUPPORT/OPPOSE, THEN ASK) And, do you strongly (support/oppose) or just somewhat (support/oppose) this?
5/10 Strongly support ............................................................................ 34 Somewhat support ......................................................................... 26 Somewhat oppose ......................................................................... 12 Strongly oppose ............................................................................. 22 Not sure ...................................................................................... 6
Q37 When it comes to oil drilling off U.S. coasts, which of the following statements comes closer to your point of
view? (ROTATE STATEMENTS)
Statement A: The potential harm to the environment outweighs the potential benefits to the economy. Statement B: The potential benefits to the economy outweigh the potential harm to the environment.
5/10 A/ Harm to environment outweighs economy ......................................... 41 B/ Benefits to the economy outweighs environment ............................... 53 A little of both (VOL) ............................................................................ 1
Not sure ................................................................................................ 5 Q38a Do you think that the federal government is doing enough or is not doing enough to deal with the
environmental problems caused by the recent Gulf Coast oil spill?
5/10* Doing enough ................................. 43 Not doing enough ........................... 45 Not sure ....................................... 12 * Asked of one-half the respondents (FORM A).
HURRICANE KATRINA 9/05 Doing enough ................................. 32 Not doing enough ........................... 47 Not sure ....................................... 21
Q38b Do you think that BP, or British Petroleum is doing enough or is not doing enough to deal with the
environmental problems caused by the recent Gulf Coast oil spill?
5/10** Doing enough ................................................................................ 37 Not doing enough ........................................................................... 50 Not sure ...................................................................................... 13 ** Asked of one-half the respondents (FORM B).
HART/McINTURFF Study #10316--page 23 10316 May 2010 NBC News/Wall Street Journal Survey
Q39 How much do you think the Gulf Coast oil spill will affect the nation's economy--a great deal, quite a bit,
some, very little, or not at all?
5/10* Affect the nation's economy a great deal ...... 28Affect the nation's economy quite a bit ......... 25Affect the nation's economy some ................ 34Affect the nation's economy very little ........... 10Will not affect the nation's economy at all ..... 2 Not sure ...................................................... 1* Asked of one-half the respondents (FORM A).
HURRICANE KATRINA 9/05 Affect the nation's economy a great deal ...... 36 Affect the nation's economy quite a bit ......... 30 Affect the nation's economy some ................ 28 Affect the nation's economy very little ........... 4 Will not affect the nation's economy at all ..... 1 Not sure ...................................................... 2
And, on a different topic… Q40 How worried are you that the United States will experience another major terrorist attack--very worried, fairly
worried, only slightly worried, or not really worried at all?
5/10
1/10
10/17- 20/08+
9/07
7/07
1/06
7/05
1/02
Very worried .................................. 31 33 17 27 30 25 31 30 Fairly worried ................................. 27 23 25 25 22 23 27 29 Only slightly worried ....................... 28 28 41 34 32 35 29 26 Not really worried at all .................. 14 15 16 13 16 17 12 14 Not sure ....................................... - 1 1 1 - - 1 1
+ Results shown reflect responses among registered voters. Q41a How willing are you to give up personal freedoms and civil liberties to prevent another terrorist attack--very
willing, somewhat willing, somewhat unwilling, or very unwilling?
5/10* 9/01 Very willing .................................... 18 38 Somewhat willing ........................... 34 37 Somewhat unwilling ....................... 21 9 Very unwilling ................................ 23 11 Not sure ....................................... 4 5 * Asked of one-half the respondents (FORM A).
Q41b In general, do you approve or disapprove of using racial or ethnic profiling in combating terrorism?
5/10** Approve ............................................................................................ 51 Disapprove ....................................................................................... 43 Not sure ......................................................................................... 6 ** Asked of one-half the respondents (FORM B).
HART/McINTURFF Study #10316--page 24 10316 May 2010 NBC News/Wall Street Journal Survey
FACTUALS: Now I am going to ask you a few questions for statistical purposes only. Q42/43 Do you have a health plan, that is, are you covered by a private health insurance plan or by a government
program such as Medicare, Medicaid, or Tricare? (IF YES, THEN ASK:) What kind of health plan do you have? (DO NOT READ LIST. ACCEPT ONLY ONE RESPONSE. IF MORE THAN ONE, ASK:) Well, what kind of plan would you say your primary plan is? (IF RESPONDENT SAYS SOMETHING NOT ON LIST, RECORD UNDER 6--OTHER.)
Yes, Have A Health Plan 86 Private health insurance ......................... 59 MediCARE .............................................. 15 MediCAID ................................................ 3 Tricare ..................................................... 3 VA, military .............................................. - Other (specify) ...................................... 3 Don't know what kind of plan ................ 3NO, Do Not Have A Health Plan 13 Don't know/refused ................................. 1
QF1a Are you currently registered to vote at this address?
Registered ....................................... 85Not registered .................................. 14 Not sure ......................................... 1
F1b/c. A lot of people are unable to get out and vote for many reasons. Did you happen to vote in last November's
election for president? (IF “YES,” ASK:) For whom did you vote––Barack Obama, John McCain, or someone else?
Yes, Voted 83 Voted for Barack Obama ................ 40 Voted for John McCain ................... 33 Voted for someone else ................. 5 Not sure ........................................ 5No, Did Not Vote 17 Not sure ........................................ -
QF1d And did you happen to vote in the 2006 election for U.S. Congress?
Yes, voted ....................................... 61No, did not vote ............................... 34 Not sure ......................................... 5
QF2 Are you currently employed? (IF "CURRENTLY EMPLOYED," ASK:) What type of work do you do?
(RECORD UNDER "6--OTHER.") (IF "NOT CURRENTLY EMPLOYED," ASK:) Are you a student, a homemaker, retired, or unemployed and looking for work?
Currently Employed Professional, manager ............................. 29 White-collar worker .................................. 15 Blue-collar worker .................................... 16 Farmer, rancher ....................................... -Not Currently Employed Student .................................................... 4 Homemaker ............................................. 6 Retired ..................................................... 21 Unemployed, looking for work ................. 7 Other ....................................................... 2 Not sure ................................................. -
HART/McINTURFF Study #10316--page 25 10316 May 2010 NBC News/Wall Street Journal Survey
QF3 What is the last grade that you completed in school? (DO NOT READ CHOICES.)
Grade school ............................................................ 1Some high school..................................................... 4High school graduate ............................................... 27Some college, no degree ......................................... 19Vocational training/2-year college ............................ 94-year college/bachelor's degree ............................. 23Some postgraduate work, no degree ....................... 32-3 years postgraduate work/master's degree ......... 11Doctoral/law degree ................................................. 4 Not sure/refused..................................................... 1
QF4 Generally speaking, do you think of yourself as (ROTATE:) a Democrat, a Republican, an independent, or
something else? (IF "DEMOCRAT" OR "REPUBLICAN," ASK:) Would you call yourself a strong (Democrat/Republican) or not a very strong (Democrat/Republican)? (IF "NOT SURE," CODE AS "NOT VERY STRONG DEMOCRAT/REPUBLICAN.") (IF "INDEPENDENT," ASK:) Do you think of yourself as closer to the Republican Party, closer to the Democratic Party, or do you think of yourself as strictly independent? (IF "NOT SURE," CODE AS "STRICTLY INDEPENDENT.")
QF5 Thinking about your general approach to issues, do you consider yourself to be liberal, moderate, or conservative? (IF "LIBERAL" OR "CONSERVATIVE," ASK:) Do you consider yourself to be very (liberal/conservative) or somewhat (liberal/conservative)?
Very liberal ...................................... 8Somewhat liberal ............................. 14Moderate ......................................... 37Somewhat conservative .................. 22Very conservative ............................ 18 Not sure ......................................... 1
QF6 How often do you attend services at a church, synagogue, mosque, or other place of worship? (READ
LIST.)
Never ................................................ 20Once a year ...................................... 7A few times a year ............................ 19Once a month ................................... 7About twice a month ......................... 9Once a week or more often .............. 36 Not sure .......................................... 2
HART/McINTURFF Study #10316--page 26 10316 May 2010 NBC News/Wall Street Journal Survey
QF7 If you added together the yearly income of all the members of your family who were living at home last year,
would the total be less than ten thousand dollars, between ten thousand dollars and twenty thousand dollars, between twenty thousand dollars and thirty thousand dollars, between thirty thousand dollars and forty thousand dollars, between forty thousand dollars and fifty thousand dollars, between fifty thousand dollars and seventy-five thousand dollars, between seventy-five thousand dollars and one hundred thousand dollars, or would the total be more than that?
Less than $10,000 ............................... 5Between $10,000 and $20,000 ............ 8Between $20,000 and $30,000 ............ 10Between $30,000 and $40,000 ............ 10Between $40,000 and $50,000 ............ 7Between $50,000 and $75,000 ............ 16Between $75,000 and $100,000 .......... 16More than $100,000 ............................. 18 Not sure/refused ................................ 10
QF8a/b Do you have money invested in the stock market and mutual funds, including IRAs and 401Ks? (ASK ONLY
OF RESPONDENTS WHO SAY "YES") Which of the following would you say is the value of these investments? Please just stop me when I get to the correct category. (READ LIST. IF "NOT SURE," ASK:) Well, please just give me your best guess.
Yes, Have investments 58 Less than $10,000 ....................................... 7 At least $10,000 but less than $50,000 ....... 14 At least $50,000 but less than $100,000 ..... 8 At least $100,000 but less than $200,000 ... 7 At least $200,000 but less than $300,000 ... 4 At least $300,000 but less than $500,000 ... 3 At least $500,000 but less than $1,000,000 2 $1,000,000 or more ..................................... 2 Not sure/refused ........................................ 11No, Do not have investments 40 Not sure ........................................................ 2