Haïti: Economic recovery strategy Ambassade d’Haïti à Londres/ 3 rd Haitian European Diaspora Dinner Business Conference Fritz Duroseau Member of the Board Banque de la République d’Haïti December 2, 2017 London
Transcript
Haïti: Economic recovery strategyAmbassade d’Haïti à Londres/ 3rd Haitian European Diaspora Dinner
Business Conference
Fritz Duroseau
Member of the Board
Banque de la République d’Haïti
December 2, 2017
London
Outline
• Factors leading to economic growth;
• Haitian economic context;
• BRH Financial incentives to investment;
• Proposal of a diaspora investment strategy;
• Conclusion.
2
Factors leading to growth
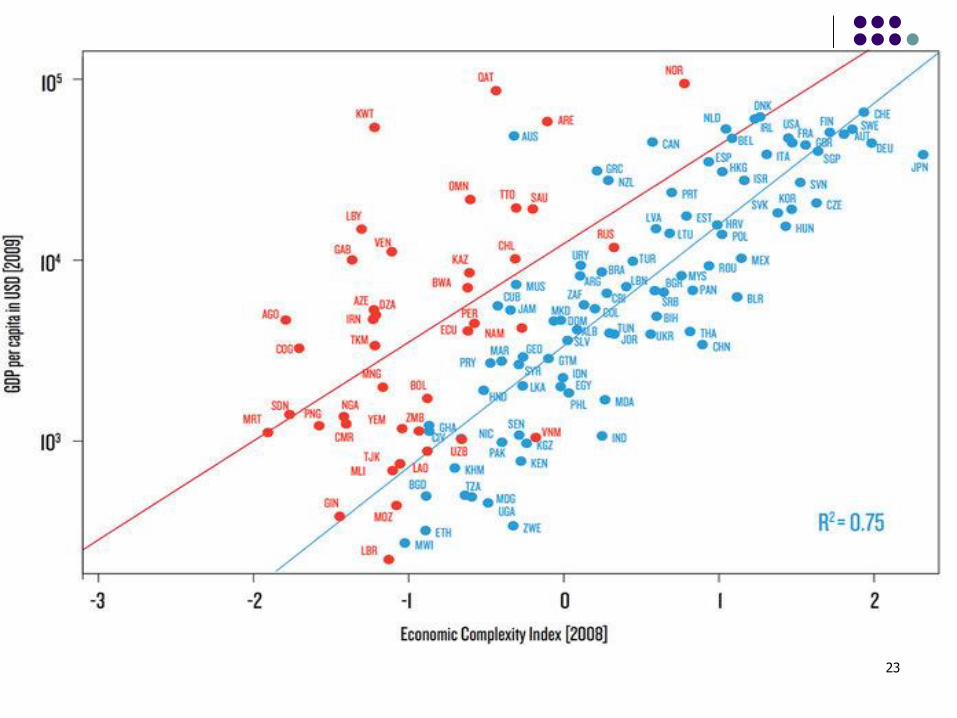
• The growth process targets an improved welfare: rise in GDP per capita;
• Production factors: Physical, Human, Intangible (Knowhow, cumulated expertises, branding);
• Productivity of human and physical capital positivelycorrelated to technological progress;
• Growth can be led by consumption (public & private), exports, investment (public & private);
• Investment depends on domestic and international savings;
3
Factors leading to growth
• A growth strategy is not a quick-fix/ miracle-cure :• Identification and minimization of constraints,
identification and maximization of opportunities;
• Iterative public policies adapted to the local context provide better results than “copy and paste” policies. However common denominators are found for countries with similar characteristics and similar problems;
• South-Korea, exporter for 600 million USD of primary goods in 1963,
4
Factors leading to growth: example
• Today, after implementing key outward-orientedpolicies and reforms, exports more than 600 Billion USD of goods ;
• Its per capita GDP, 146,00$ in 1963 to 27,538.00$ in 2016;
5
Factors leading to growth: example
• FDIs are more stable/ long term risk taking
decision : Digicel 1st taxpayer ;
• FDIs come with capital, new knowhow including
new technologies, new demand, connections to
international networks (hotels to tourism
networks, airlines, car rentals, etc) ;
• FDI may contribute to some public infrastructure
projects;
6
7
GDP Per capita Macroecomic
framework
Data from BOP
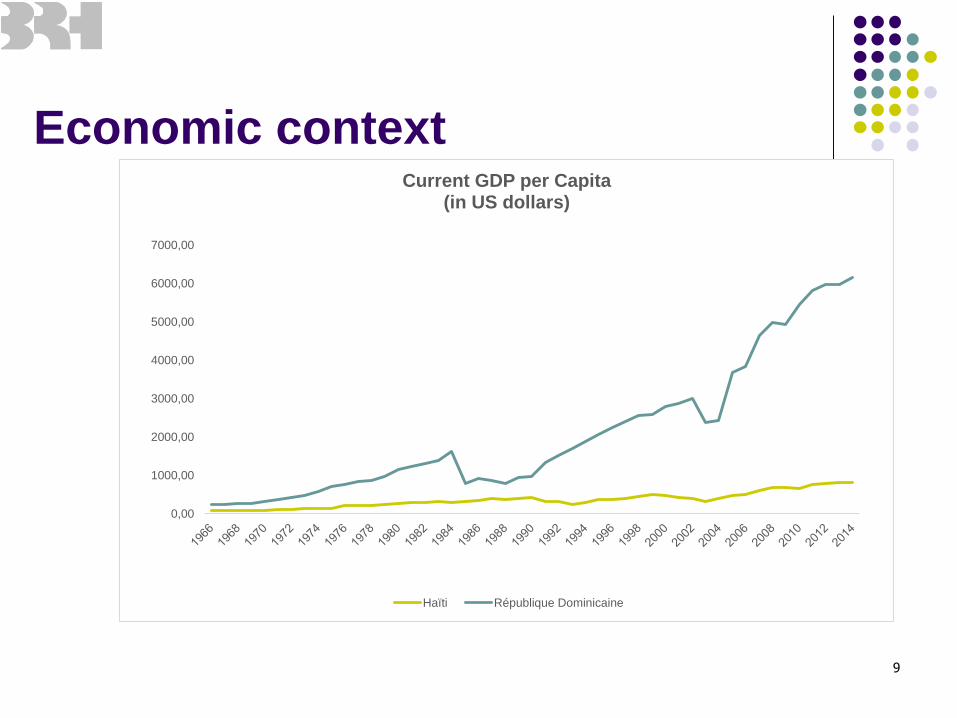
• Haïti’s annual
per capita
GDP inferior to
800 dollars;
• Average GDP
growth of
1,4% for the
past 5
decades while
average
demographic
growth of
1,8%;
• Relatively stable
macroeconomic
framework since
2004;
• Sound financial
sector:
profitable, liquid,
well capitalized;
• Improvements in
the socio-
political climate
since 2004;
•Net importer of goods and services: vulnerable to externalshocks (natural, prices);•Diaspora contributes to growthvia the sending of remittances(2,4 billion USD, 25% of GDP, superior to international aid). New contributions from Chile;•Remittances finance mostlyconsumption goods, educationservices and imports
Economic context
Competitive/ high potential sectors already identified by studies
some agricultural value-chains, tourism, textile, construction,
infrastructure, renewable energies, BPOs: Collier, DSNCRP, National
Commission on competitiveness;
8
What should be done
The quality and the volume of public investment should be improved in
order to maximize its catalyst effect on private investment: advocacy
toward multilateral and bilateral donors and better cost-benefit analysis
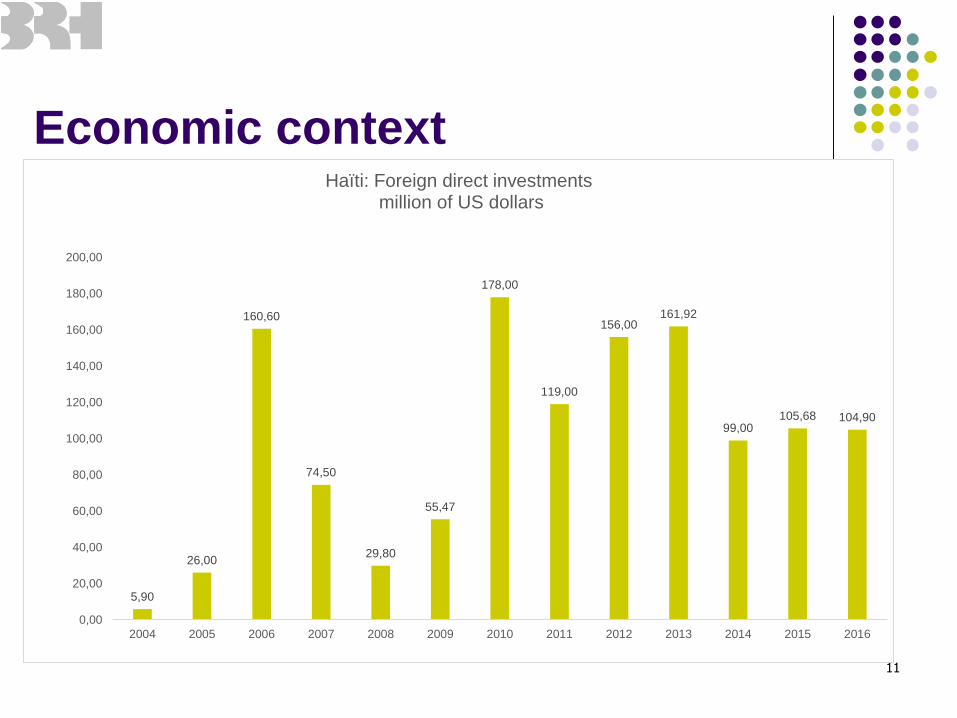
Haïti: Foreign direct investments million of US dollars
Foreign direct Investments net (million
of USD: Worldbank)
12
0
2000
4000
6000
8000
10000
12000
Dominican Republic Haïti Jamaica South Korea Honduras
1960
2016
GDP per capita (current USD: Worldbank)
130
5000
10000
15000
20000
25000
30000
Dominican Republic Haïti Jamaica South Korea Honduras
1960
2016
Economic context
14
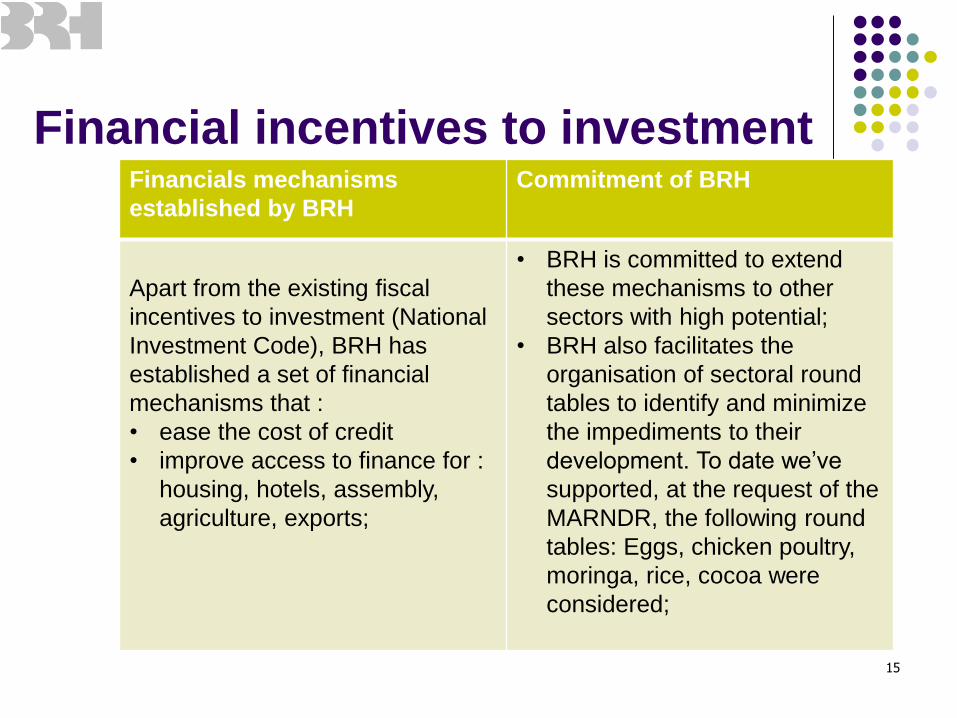
Financial incentives to investmentFinancials mechanisms
established by BRH
Commitment of BRH
Apart from the existing fiscal
incentives to investment (National
Investment Code), BRH has
established a set of financial
mechanisms that :
• ease the cost of credit
• improve access to finance for :
housing, hotels, assembly,
agriculture, exports;
• BRH is committed to extend
these mechanisms to other
sectors with high potential;
• BRH also facilitates the
organisation of sectoral round
tables to identify and minimize
the impediments to their
development. To date we’ve
supported, at the request of the
MARNDR, the following round
tables: Eggs, chicken poultry,
moringa, rice, cocoa were
considered;
15
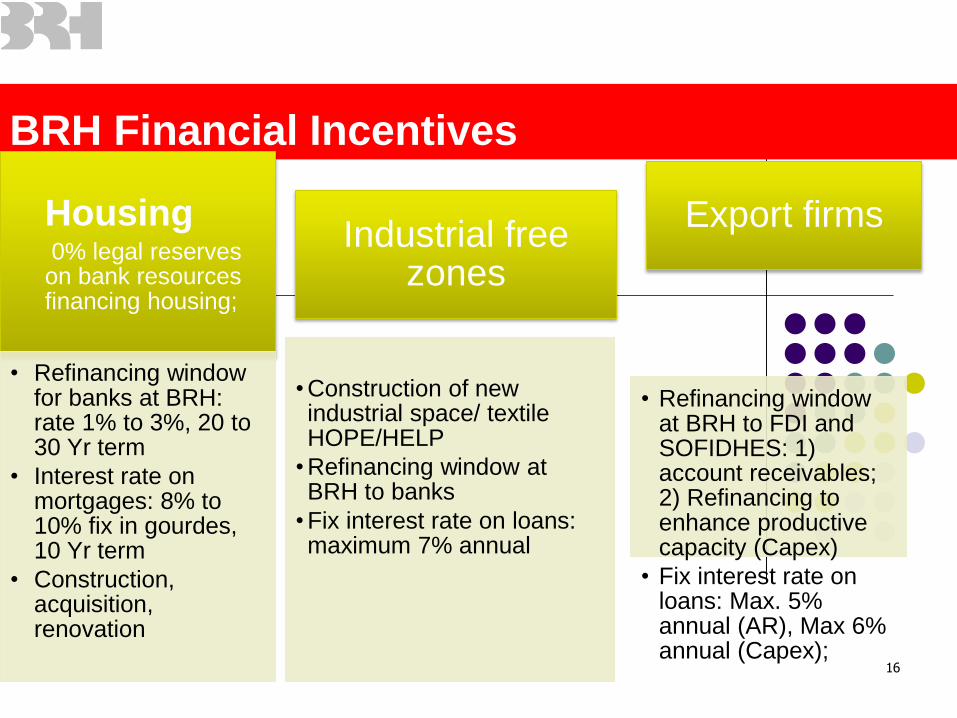
BRH Financial Incentives
16
Housing0% legal reserves
on bank resources financing housing;
• Refinancing window for banks at BRH: rate 1% to 3%, 20 to 30 Yr term
• Interest rate on mortgages: 8% to 10% fix in gourdes, 10 Yr term
• Construction, acquisition, renovation
Industrial free zones
• Construction of new industrial space/ textile HOPE/HELP
• Refinancing window at BRH to banks
• Fix interest rate on loans: maximum 7% annual
Export firms
• Refinancing windowat BRH to FDI and SOFIDHES: 1) account receivables; 2) Refinancing to enhance productive capacity (Capex)
• Fix interest rate on loans: Max. 5% annual (AR), Max 6% annual (Capex);
BRH Financial Incentives
17
Tourism and Hospitality services
(hotels)
• 0% legal reserves on bankresources financing tourism and hospitality projects
• Facility to restructure existing loans and provisioning rate of 5% compared to 50% for other restructured loans;
• Construction and renovation
Agriculture and Agro-industry
• 0% legal reserves on bank resources financing agriculture production and transformation
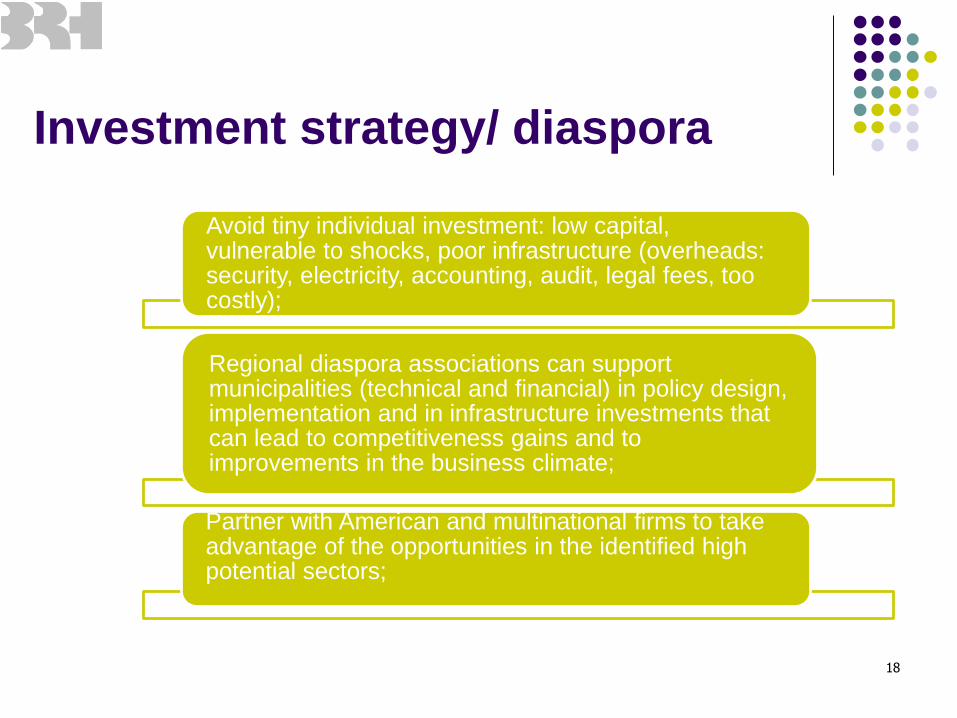
Investment strategy/ diaspora
Avoid tiny individual investment: low capital, vulnerable to shocks, poor infrastructure (overheads: security, electricity, accounting, audit, legal fees, too costly);
Regional diaspora associations can support municipalities (technical and financial) in policy design, implementation and in infrastructure investments that can lead to competitiveness gains and to improvements in the business climate;
Partner with American and multinational firms to take advantage of the opportunities in the identified high potential sectors;
18
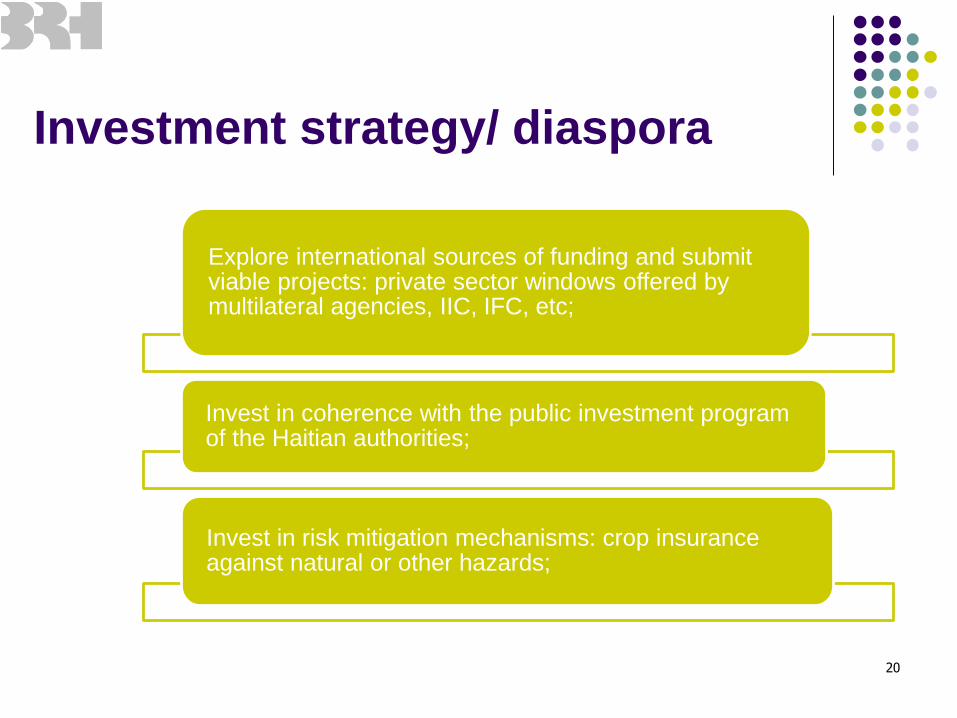
Investment strategy/ diaspora
Implement projects that meet a certain demand from the diaspora: gated communities, retirement communities, cultural services, transportation, etc;
Private equity investment via long term capital injections or acquisition of shares and participation to the governance of:
-Start-ups;
-Existing projects in need of capital in order to expand;
-Firms experiencing financial and governance problems;
-Firms that are in the process of being sold or transferred;
-Venture capital investments;
19
Investment strategy/ diaspora
Explore international sources of funding and submit viable projects: private sector windows offered by multilateral agencies, IIC, IFC, etc;
Invest in coherence with the public investment program of the Haitian authorities;
Invest in risk mitigation mechanisms: crop insurance against natural or other hazards;
20
Conclusion• BRH committed to extend the incentive mechanisms to real
estate developers and agriculture clusters;
• The quest for FDI flows is an absolute must for any country
experiencing negative national savings;
• Investments in capital and knowhow from the diaspora can
enhance the competitiveness of local firms and play a key
role in economic diversification and resilience to shocks;
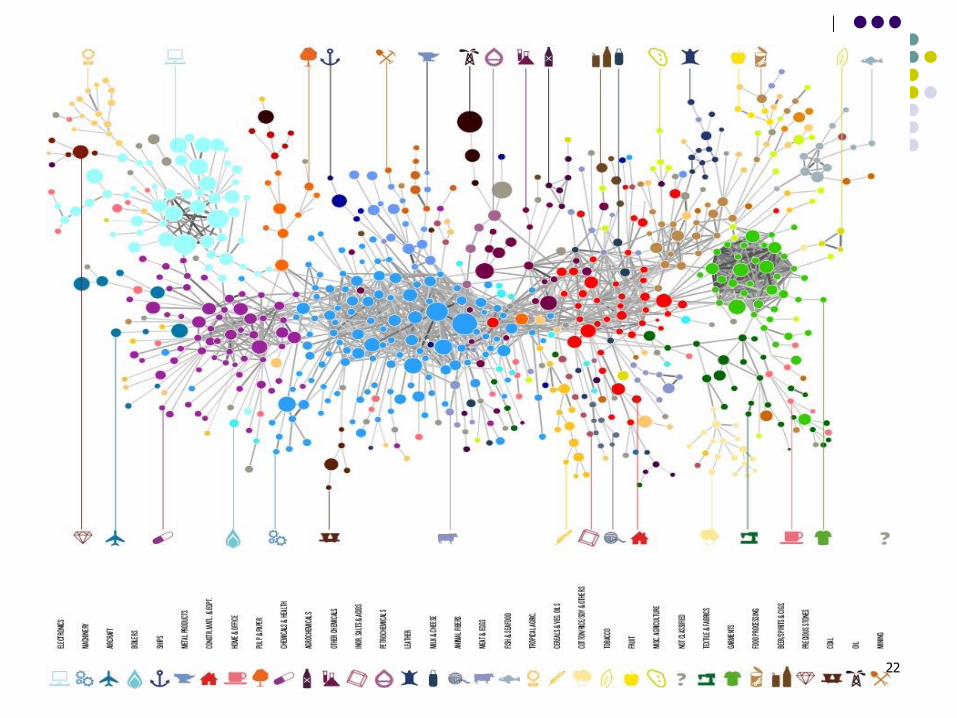
• The diaspora strategy should put the emphasis on complex
economic sectors (case of Sweden wood) less vulnerable
to competition and with high value-added;
• Opportunities in the aforementioned sectors and in import