22
LEAN IN ITSM A FUNNY THING HAPPENED ON MY JOURNEY
| Date post: | 15-Jan-2017 |
| Category: |
Technology |
| Upload: | institut-lean-france |
| View: | 808 times |
| Download: | 1 times |
LEAN IN ITSM
A FUNNY THING HAPPENED ON
MY JOURNEY

FRAME THE SESSION
• What normally happens Is we build a process from left to right
• Why?
• What if we built the process starting with the customer?
• Define customer as user, external customer, next in line, I don’t give a toss.
• Vision, SIPOC, VSM with post-it notes, all players in one room for a day
• Take no prisioners, assign RACI afterwards
• KPIs: if they don’t enable a decision they are a metric

SET THE FOCUS
S I P O C
Supplier Input Process Output Customer
Who provides
information?
How is this
turned into
requirements
or wishes?
What are the
steps?
What is the
outcome?
Who receives
the outcome?
SIPOC: a simple way to scope a process
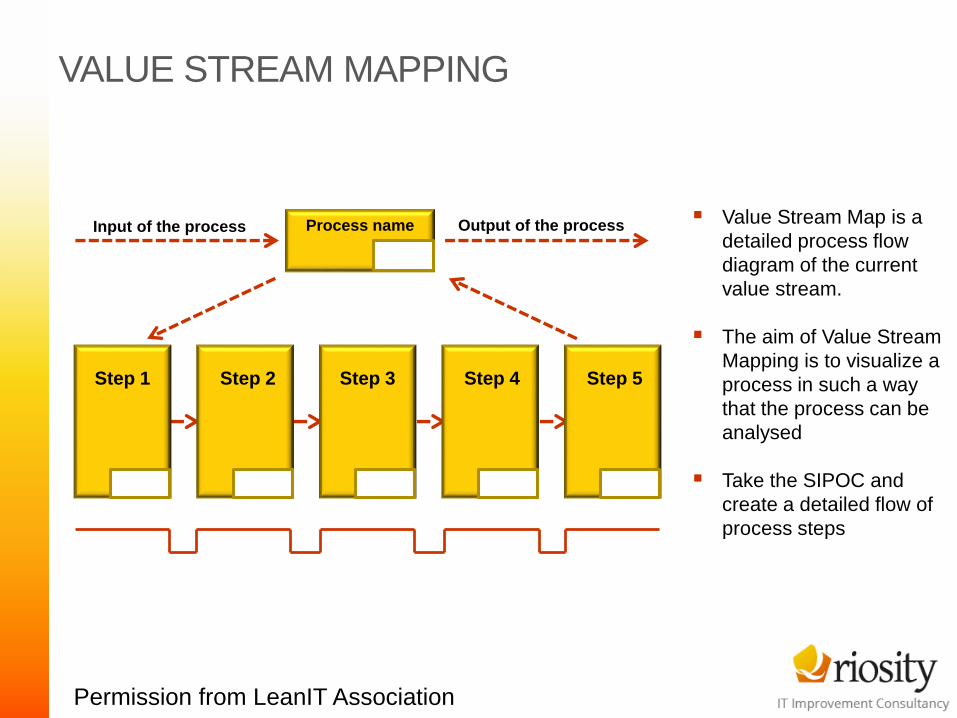
VALUE STREAM MAPPING
Value Stream Map is a
detailed process flow
diagram of the current
value stream.
The aim of Value Stream
Mapping is to visualize a
process in such a way
that the process can be
analysed
Take the SIPOC and
create a detailed flow of
process steps
Process nameInput of the process Output of the process
Step 1 Step 2 Step 3 Step 4 Step 5
Permission from LeanIT Association

VALUE STREAM MAPPING: TAKT TIME
Takt time determines the
correct pace of the
process to ensure that it
delivers products to match
customer demand
Takt time is calculated by
dividing the net working
time available by the
number of customer
requests
If the output of the process
is lower than the Takt time
then the customers will
have to wait
Unit of work: Change
Takt time: 6 hours
CUSTOMERS:
80% from Service Delivery Manager
20% from Problem Management
Release processChange ready for release Deployed change
1) Receive
change
request
and
distribute
2) Intake
change
complete
ready for
delivery
3) Plan the
change
4) Deliver
change
Design
Build
Test
5) Handover
to
Operations
Takt
time
Net time available to work
Demand of the customer=
Permission from LeanIT Association

VALUE STREAM MAPPING: BASIC INFORMATION
Add basic information
such as the input and
output.
Subdivide the process
into steps that can be
measured
Describe the steps
Release ProcessINPUT:
Change ready for release
OUTPUT:
Deployed change
1) Receive
change
request
and
distribute
2) Intake
change
complete
ready for
delivery
3) Plan the
change
4) Deliver
change
Design
Build
Test
5) Handover
to
Operations
Permission from LeanIT Association
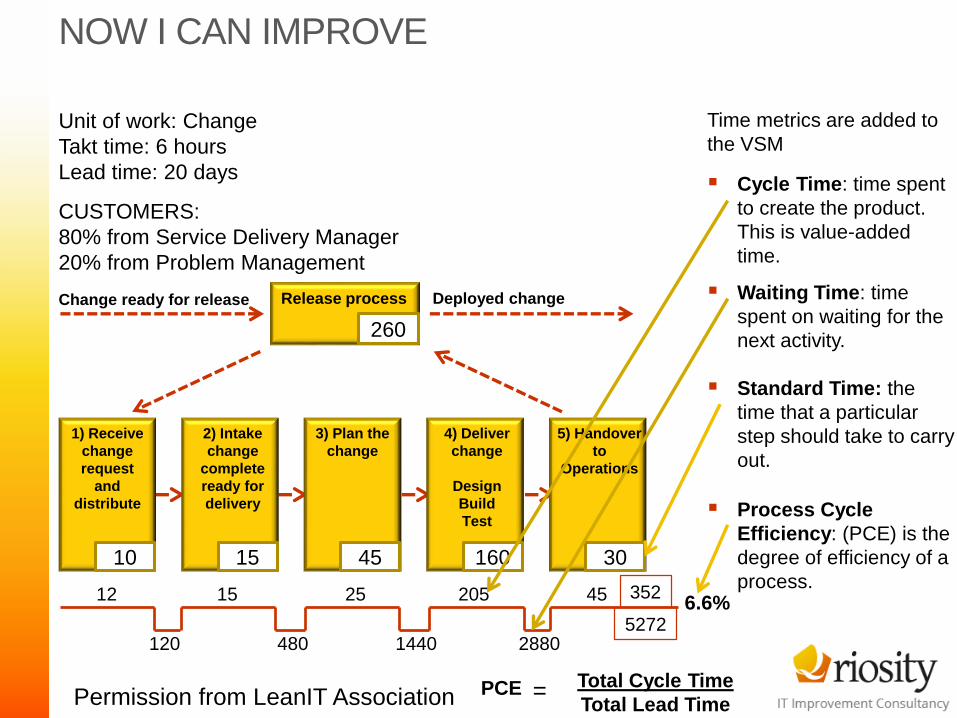
NOW I CAN IMPROVE
Time metrics are added to
the VSM
Cycle Time: time spent
to create the product.
This is value-added
time.
Waiting Time: time
spent on waiting for the
next activity.
Standard Time: the
time that a particular
step should take to carry
out.
Process Cycle
Efficiency: (PCE) is the
degree of efficiency of a
process.
Unit of work: Change
Takt time: 6 hours
Lead time: 20 days
CUSTOMERS:
80% from Service Delivery Manager
20% from Problem Management
260
Release processChange ready for release Deployed change
10 15 45 160 30
1) Receive
change
request
and
distribute
2) Intake
change
complete
ready for
delivery
3) Plan the
change
4) Deliver
change
Design
Build
Test
5) Handover
to
Operations
PCE Total Cycle Time
Total Lead Time=
12 15 25 205 45
120 480 1440 2880
352
52726.6%
Permission from LeanIT Association
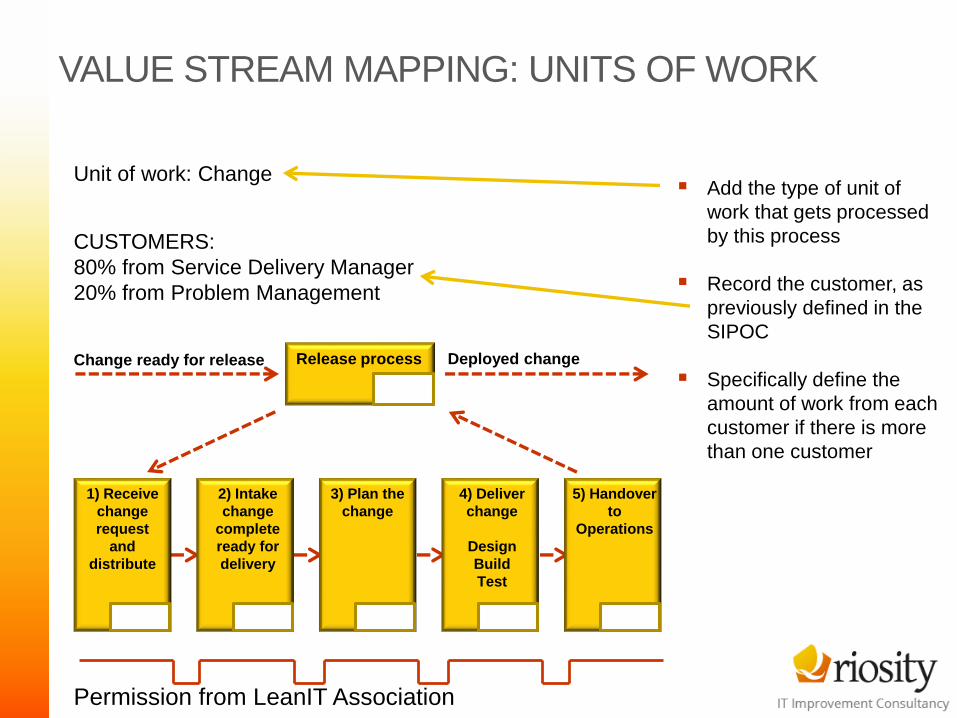
VALUE STREAM MAPPING: UNITS OF WORK
Add the type of unit of
work that gets processed
by this process
Record the customer, as
previously defined in the
SIPOC
Specifically define the
amount of work from each
customer if there is more
than one customer
Unit of work: Change
CUSTOMERS:
80% from Service Delivery Manager
20% from Problem Management
Release processChange ready for release Deployed change
1) Receive
change
request
and
distribute
2) Intake
change
complete
ready for
delivery
3) Plan the
change
4) Deliver
change
Design
Build
Test
5) Handover
to
Operations
Permission from LeanIT Association
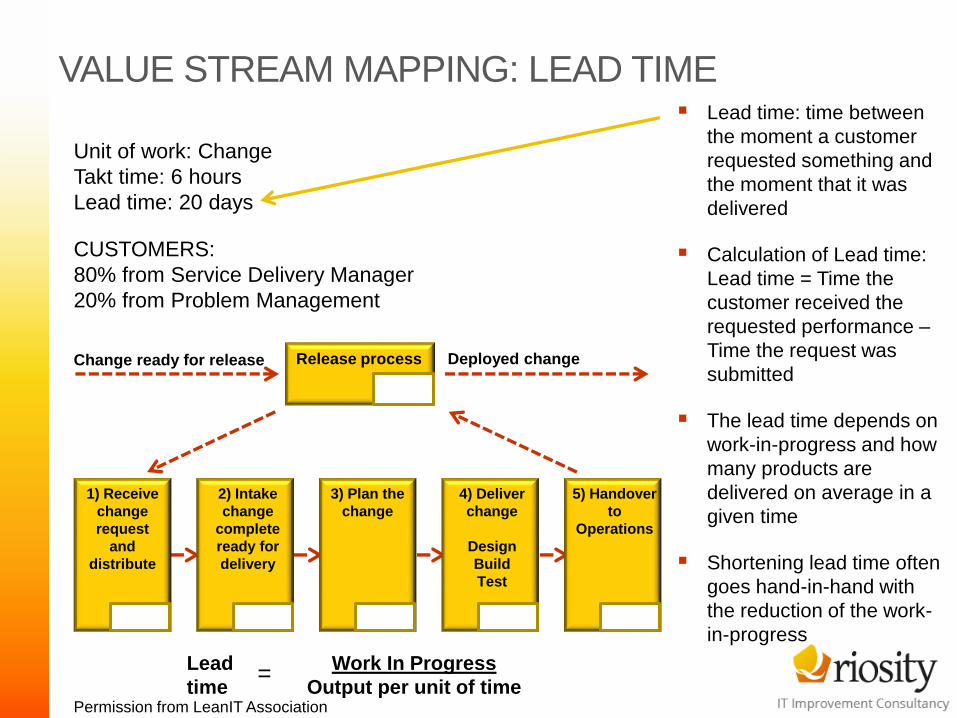
VALUE STREAM MAPPING: LEAD TIME Lead time: time between
the moment a customer
requested something and
the moment that it was
delivered
Calculation of Lead time:
Lead time = Time the
customer received the
requested performance –
Time the request was
submitted
The lead time depends on
work-in-progress and how
many products are
delivered on average in a
given time
Shortening lead time often
goes hand-in-hand with
the reduction of the work-
in-progress
Unit of work: Change
Takt time: 6 hours
Lead time: 20 days
CUSTOMERS:
80% from Service Delivery Manager
20% from Problem Management
Release processChange ready for release Deployed change
1) Receive
change
request
and
distribute
2) Intake
change
complete
ready for
delivery
3) Plan the
change
4) Deliver
change
Design
Build
Test
5) Handover
to
Operations
Lead
time
Work In Progress
Output per unit of time=
Permission from LeanIT Association
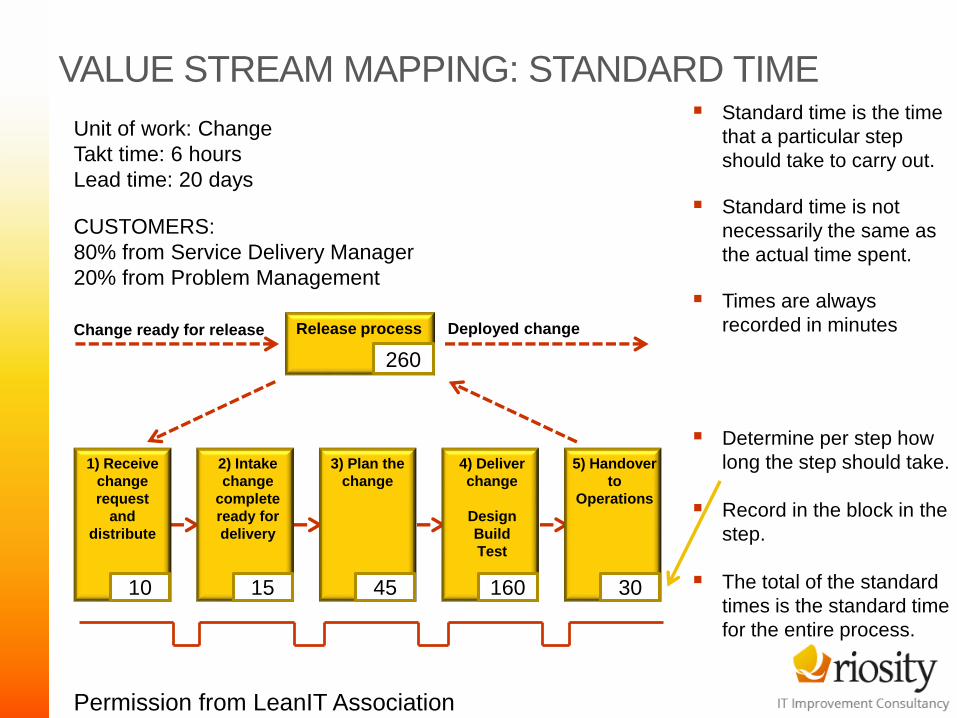
VALUE STREAM MAPPING: STANDARD TIME Standard time is the time
that a particular step
should take to carry out.
Standard time is not
necessarily the same as
the actual time spent.
Times are always
recorded in minutes
Determine per step how
long the step should take.
Record in the block in the
step.
The total of the standard
times is the standard time
for the entire process.
Unit of work: Change
Takt time: 6 hours
Lead time: 20 days
CUSTOMERS:
80% from Service Delivery Manager
20% from Problem Management
260
Release processChange ready for release Deployed change
10 15 45 160 30
1) Receive
change
request
and
distribute
2) Intake
change
complete
ready for
delivery
3) Plan the
change
4) Deliver
change
Design
Build
Test
5) Handover
to
Operations
Permission from LeanIT Association
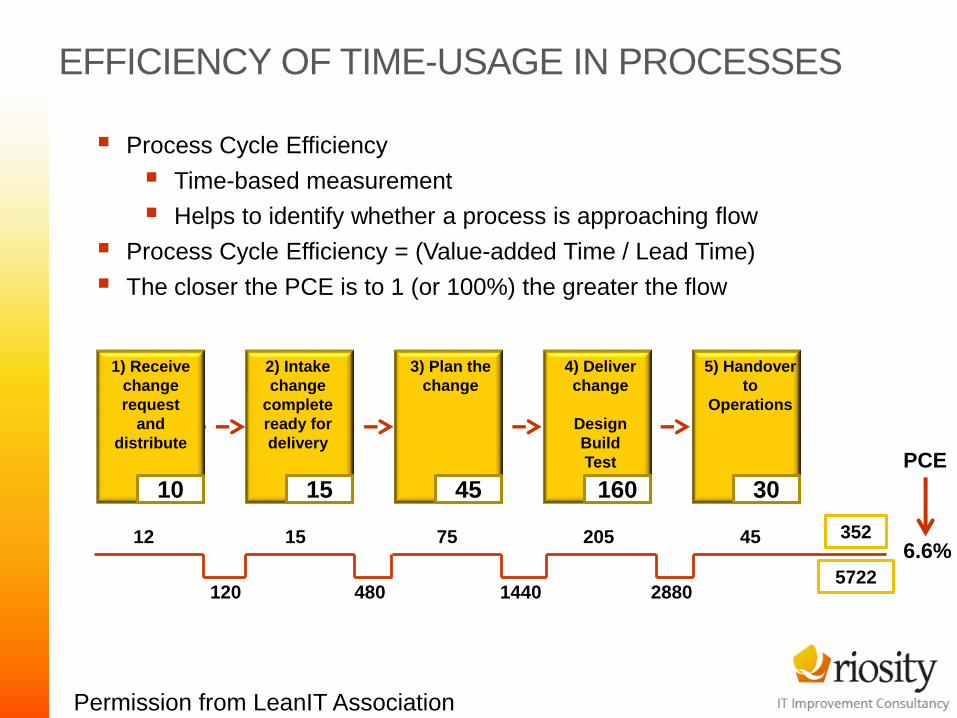
EFFICIENCY OF TIME-USAGE IN PROCESSES
Process Cycle Efficiency
Time-based measurement
Helps to identify whether a process is approaching flow
Process Cycle Efficiency = (Value-added Time / Lead Time)
The closer the PCE is to 1 (or 100%) the greater the flow
10 15 45 160 30
1) Receive
change
request
and
distribute
2) Intake
change
complete
ready for
delivery
3) Plan the
change
4) Deliver
change
Design
Build
Test
5) Handover
to
Operations
12 15 75 205 45
120 480 1440 2880
352
5722
6.6%
PCE
Permission from LeanIT Association
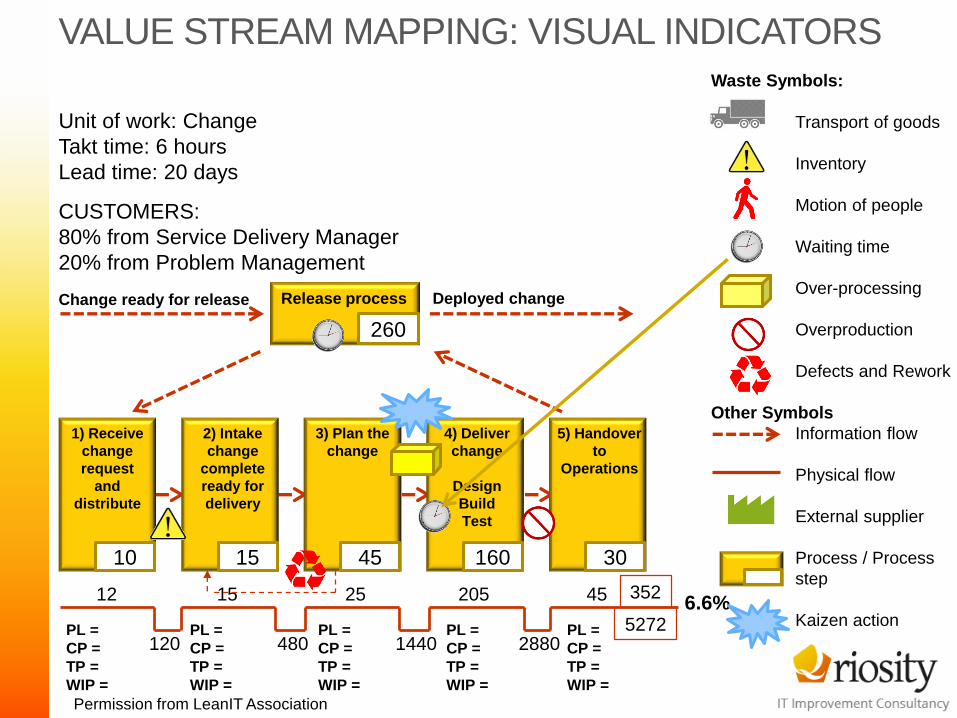
VALUE STREAM MAPPING: VISUAL INDICATORSWaste Symbols:
Transport of goods
Inventory
Motion of people
Waiting time
Over-processing
Overproduction
Defects and Rework
Other Symbols
Information flow
Physical flow
External supplier
Process / Process
step
Kaizen action
Unit of work: Change
Takt time: 6 hours
Lead time: 20 days
CUSTOMERS:
80% from Service Delivery Manager
20% from Problem Management
260
Release processChange ready for release Deployed change
10 15 45 160 30
1) Receive
change
request
and
distribute
2) Intake
change
complete
ready for
delivery
3) Plan the
change
4) Deliver
change
Design
Build
Test
5) Handover
to
Operations
12 15 25 205 45
120 480 1440 2880
352
52726.6%
PL =
CP =
TP =
WIP =
PL =
CP =
TP =
WIP =
PL =
CP =
TP =
WIP =
PL =
CP =
TP =
WIP =
PL =
CP =
TP =
WIP =
Permission from LeanIT Association

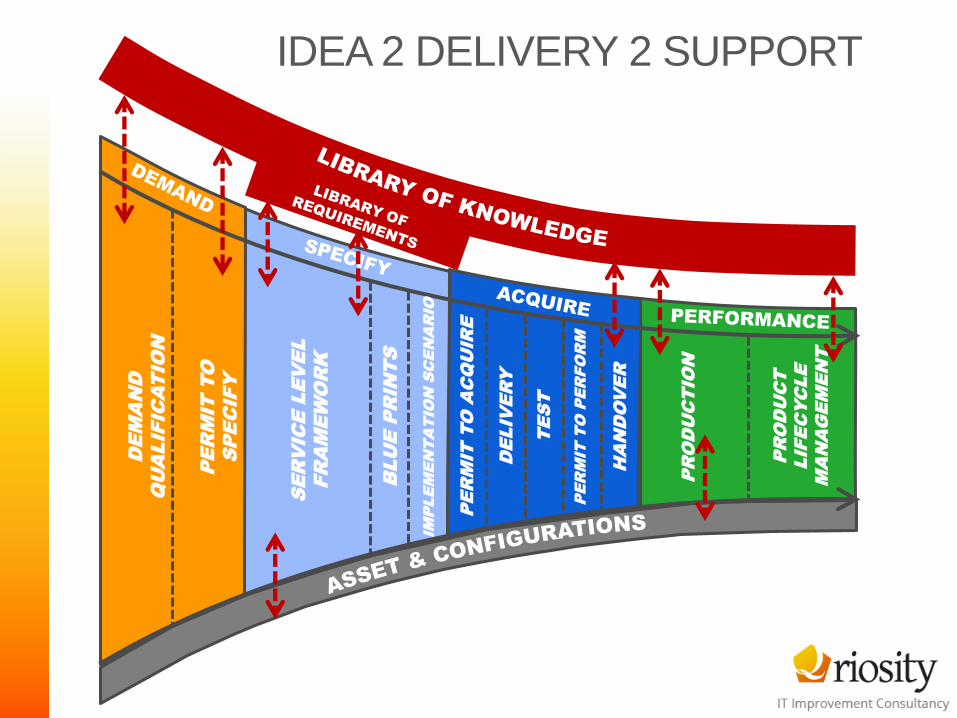
SO WE CHEATED!

OUR NOT SO FANCY VSM
DE
MA
ND
QU
AL
IF
IC
AT
IO
N
PE
RM
IT
T
O
SP
EC
IF
Y
BLU
E P
RIN
TS
IM
PLE
ME
NT
AT
IO
N S
CE
NA
RIO
PE
RM
IT
T
O A
CQ
UIR
E
DE
LIV
ER
Y
TE
ST
PE
RM
IT
T
O P
ER
FO
RM
HA
ND
OV
ER
PR
OD
UC
TIO
N
PR
OD
UC
T
LIF
EC
YC
LE
MA
NA
GE
ME
NT
SE
RV
IC
E L
EV
EL
FR
AM
EW
OR
K
IDEA 2 DELIVERY 2 SUPPORT
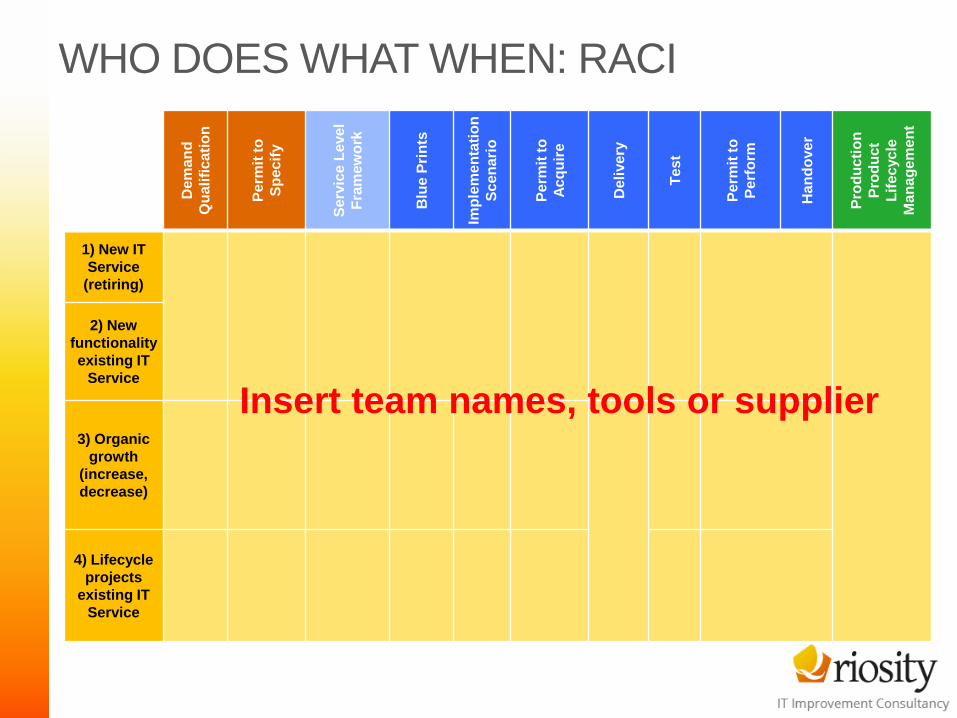
WHO DOES WHAT WHEN: RACI
De
ma
nd
Qu
ali
fic
ati
on
Pe
rmit
to
Sp
ec
ify
Se
rvic
eL
eve
l
Fra
me
wo
rk
Blu
e P
rin
ts
Imp
lem
en
tati
on
Sc
en
ari
o
Pe
rmit
to
Ac
qu
ire
De
live
ry
Te
st
Pe
rmit
to
Pe
rfo
rm
Ha
nd
ove
r
Pro
du
cti
on
Pro
du
ct
Lif
ecyc
le
Ma
na
ge
me
nt
1) New IT
Service
(retiring)
2) New
functionality
existing IT
Service
3) Organic
growth
(increase,
decrease)
4) Lifecycle
projects
existing IT
Service
Insert team names, tools or supplier
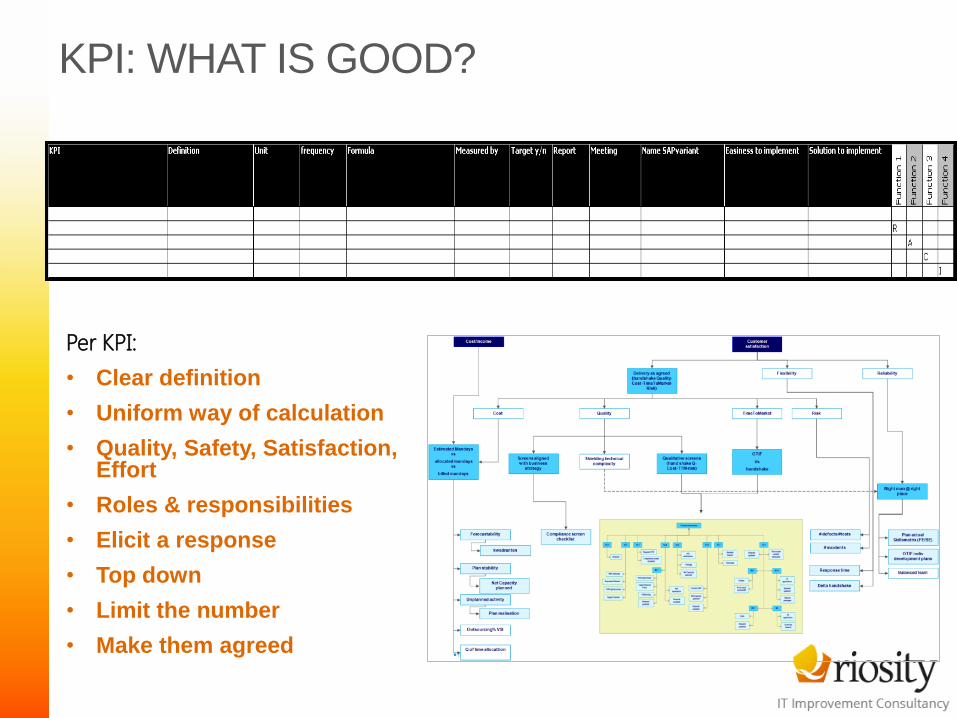
KPI: WHAT IS GOOD?
Per KPI:
• Clear definition
• Uniform way of calculation
• Quality, Safety, Satisfaction, Effort
• Roles & responsibilities
• Elicit a response
• Top down
• Limit the number
• Make them agreed

METRICS: CREATE AS A TEAM
Percentage of Releases not built to standard in the library
Percentage of tests performed along the path
Number of unauthorised deployments (above zero is bad)
Deployments accepted percentage
Number of service-affecting outages caused by deployments (approved and unauthorised)
Percentage of assets/configurations updated along the the path
Number of “special” change requests (those Management decrees)
% of effort across the lifecycle
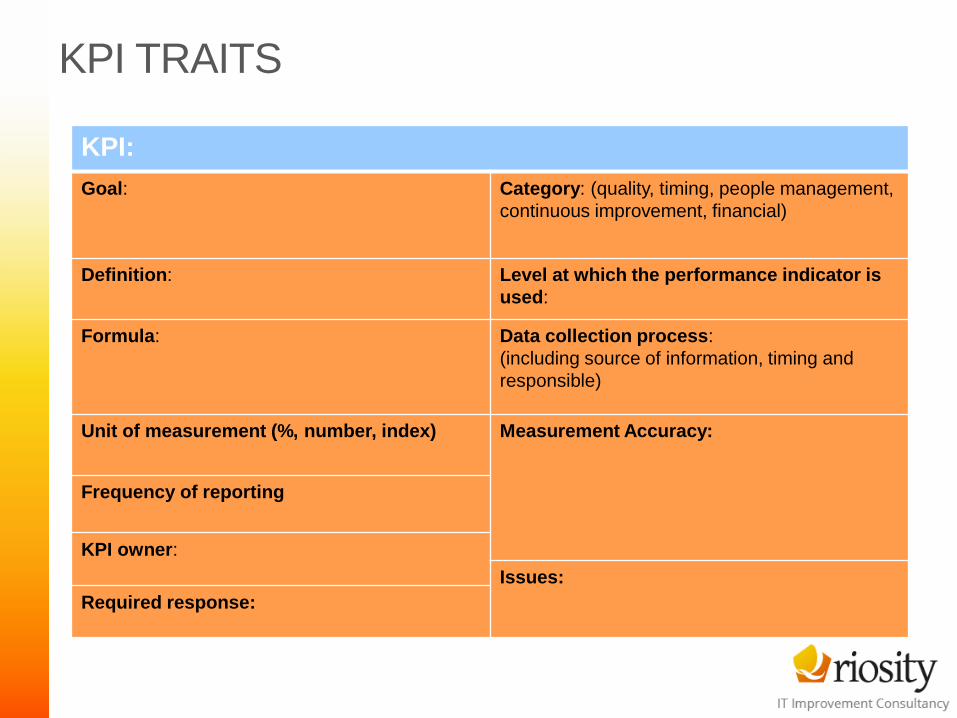
KPI TRAITS
KPI:
Goal: Category: (quality, timing, people management,
continuous improvement, financial)
Definition: Level at which the performance indicator is
used:
Formula: Data collection process:
(including source of information, timing and
responsible)
Unit of measurement (%, number, index) Measurement Accuracy:
Frequency of reporting
KPI owner:
Issues:
Required response:

20
WILL FORM BASIS FOR SLA, OLA, SUPPLIER CONTRACTS AND INPUT INTO SERVICE CATALOG
Service Management Charter: NAME OF SERIVCE OR APPLICATION
Event Scope Leadership / Coordination (Normal) Schedule
Product or Service Compute, Storage, Service Desk, etc. Executive Sponsor VP or C-levelDays of
Product/ServiceWhen is it required?
Specific ConditionsWhat circumstances you're including and excluding? (type of customer, time of year, etc.)
XXX Manager Tactical role until GFB live Start/End Times Times of use
Customer DemandHow many times is this done per wk, qtr, mo, or yr.? (if helpful to know)
IT Service Leader Service or Application IT ownerLocation(s) of
serviceCorporate or specific locations
used Location of documentation SharePoint location
First Step Task on first process block Business Service owner
Not always needed but usefulProduct - Service Date exceptions
Linked to Change calendar or other requirementsLast Step Task on last process block
Boundaries & Limitations What is the team NOT authorized to change, do, etc.? Supplier/VendorIf external, then name of company and
contact
Interim Briefing(s) If scrum, when or CAB
Reporting cycleDaily, weekly, quarterly (add in roles if helpful)
Event Drivers Significant Contacts1 What dependencies in services Providers Name Contact Name Contact Information
2 What dependencies on other partners (significant 1
3 Assumptions 2
4 3
5 4
Goals & Measureable Objectives 5
1 Aim for objectives w/ measurable targets (from X to X). 6
2 7
3 8
4 9
5 10
Planned Deliverables by Output-based Partners On-Call Support1 Application mgt Function Name Contact Information
2 Compute storage 1SMEs that may not be needed full time
3 Service Desk 2
4 3
5 4
Planned Deliverables by Operating Partners On-Call Support1 Application mgt Function Name Contact Information
2 compute storage 1SMEs that may not be needed full time
3 Service Desk 2
4 3
5 4
Potential Obstacles Approvals
1 Application mgt Executive Sponsor XXX Manager Business Owner
2 Compute storage
3 Service Desk
4 Signature: Signature: Signature:
5 Date: Date: Date:
Version Control1 Version no. Reason for change
2 Creation Date
3 Revised Date
4 Author
OLA

Managed Infrastructure:Example between COMPANY teamsScenario Comments
Accountable Responsible Consulted Informed
Service DescriptionWho defines the service being provided?
The service is a product, defined and provided by the . Service Options will be selected by YYY
Service HoursWho defines the hours of provision
The service is a product, defined and provided by the XXX. Service Options will be selected by YYY
Service TargetsWho sets the targets of provision
The service is a product, defined and provided by the XXX. Service Options will be selected by YYY
Service AvailabilityWho ensures the availability of that service
MI can be configured to provide different availability tagets. The APPS will configure the MI in accordance with guidelines set by product management
Service CapacityWho ensures that capacity is deployed as required
XXX is exclusively responsible for providing required capacity. YYY has visibility of overall consumption.
Service Monitoring and Events
Who monitors and reacts to events
APPS will configure the infrastructure to raise events to the event monitoring system in accordance with guidelines established by YYY
Incident and Problem Management
Who manages the incident or problem
COMPANY visible incidents will be managed by the APPS in the COMPANY incident management system in accordance with guidelines established by YYY
Change ManagementWho approves the change request (Yes/No)
Change requests for infrastructure configuration, OS and application software will be managed by the APPS in accordance with guidelines established by YYY
Release ManagementWho does the approved change
Releases of infrastructure configuration, OS and application software will be managed by the APPS in accordance with guidelines established by YYY
Configuration Management
Who manages SACM Infrastructure Cis will be maintained by the APPS in the COMPANY CMDB in accordance with guidelines defined by YYY
Security Management
Who ensures Security on infrastructure
The infrastructure security configuration and security management tooling will be managed by the APPS in accordance with guidelines determined by YYY
GovernanceWho performs governance of service
The service will be governed by YYY in a consultative structure that gives voice to APPS and XXX
Service ContinuityWho ensures service is always there
MI can be configured to provide different continuity scenarios. The APPS will configure the MI in accordance with guidelines set by product management
Service Level Management
Who reviews service and contract
Service levels will be reviewed by the APPS in consultation with the XXX
Service Reporting and Metrics
Who provides data on service
Service level reports will be delivered by the XXX as part of the defined service
Continual Service Improvement
Who ensures service is being improved
MI service level improvement is the responsibility of the XXX
EscalationWho notifies and manages communication
Escalation/Communication of COMPANY visible incidents will be managed by the APPS in accordance with guidelines established by YYY
You need to add in a name, not a team.
RACI


