STATE OF HAWAI‘I OFFICE OF THE AUDITOR 465 S. King Street, Room 500 Honolulu, Hawai‘i 96813-2917 LESLIE H. KONDO State Auditor (808) 587-0800 [email protected]Hawai‘i 2050 Sustainability Plan - Ten Year Measurement Update March 7, 2018 Act 8 of the 2005 Special Session of the Hawai‘i State Legislature (Act 8) established the Hawai‘i 2050 Task Force (Task Force) to review the Hawai‘i State Plan and the State’s comprehensive planning system, to develop a statewide sustainability plan for the 21st century. Act 8 required the Office of the Auditor, after receipt of the Task Force’s report, to prepare the Hawai‘i 2050 Sustainability Plan to define and implement state goals, objectives, policies, and priority deadlines by incorporating the Tasks Force’s recommendations. In January 2008, the Office of the Auditor submitted the Hawai‘i 2050 Sustainability Plan to the Hawai‘i State Legislature. While Act 8 called for “[t]he auditor, with the assistance of the office of planning [to] update the [sustainability] plan every ten years and report to the legislature,” no funding beyond Fiscal Year 2007 was appropriated for the purposes of this Act. Furthermore, Act 8 called for the Hawai‘i 2050 Task Force to sunset on June 30, 2008. Therefore, the Task Force recommended the Legislature pass a law establishing an implementing agency, the Sustainability Council, to be a continuing, governmental organization with budgetary and staffing resources essential to carry forward the Hawai‘i 2050 Sustainability Plan. However, a Sustainability Council was never established. Given that a Sustainability Council was never established, and that our office lacks the requisite expertise and financial resources to facilitate a full, formal update, this report represents an informal update of the Hawai‘i 2050 Sustainability plan prepared by the Office of Planning. This informal update includes a compilation, review and analysis of available metrics originally established by the 2008 version of the Hawai‘i 2050 Sustainability Plan, along with additional recommendations developed by the Office of Planning. This report is also accessible through the Office of the Auditor’s website at http://files.hawaii.gov/auditor/Reports/2018/2018H2050.pdf. We express our appreciation for the assistance extended by the State Sustainability Coordinator Danielle M. M. Bass in preparing this report.
Transcript
STATE OF HAWAI‘I OFFICE OF THE AUDITOR 465 S. King Street, Room 500Honolulu, Hawai‘i 96813-2917
Hawai‘i 2050 Sustainability Plan - Ten Year Measurement Update
March 7, 2018
Act 8 of the 2005 Special Session of the Hawai‘i State Legislature (Act 8) established the Hawai‘i 2050 Task Force (Task Force) to review the Hawai‘i State Plan and the State’s comprehensive planning system, to develop a statewide sustainability plan for the 21st century. Act 8 required the Office of the Auditor, after receipt of the Task Force’s report, to prepare the Hawai‘i 2050 Sustainability Plan to define and implement state goals, objectives, policies, and priority deadlines by incorporating the Tasks Force’s recommendations.
In January 2008, the Office of the Auditor submitted the Hawai‘i 2050 Sustainability Plan to the Hawai‘i State Legislature.
While Act 8 called for “[t]he auditor, with the assistance of the office of planning [to] update the [sustainability] plan every ten years and report to the legislature,” no funding beyond Fiscal Year 2007 was appropriated for the purposes of this Act. Furthermore, Act 8 called for the Hawai‘i 2050 Task Force to sunset on June 30, 2008. Therefore, the Task Force recommended the Legislature pass a law establishing an implementing agency, the Sustainability Council, to be a continuing, governmental organization with budgetary and staffing resources essential to carry forward the Hawai‘i 2050 Sustainability Plan. However, a Sustainability Council was never established.
Given that a Sustainability Council was never established, and that our office lacks the requisite expertise and financial resources to facilitate a full, formal update, this report represents an informal update of the Hawai‘i 2050 Sustainability plan prepared by the Office of Planning. This informal update includes a compilation, review and analysis of available metrics originally established by the 2008 version of the Hawai‘i 2050 Sustainability Plan, along with additional recommendations developed by the Office of Planning. This report is also accessible through the Office of the Auditor’s website at http://files.hawaii.gov/auditor/Reports/2018/2018H2050.pdf.
We express our appreciation for the assistance extended by the State Sustainability Coordinator Danielle M. M. Bass in preparing this report.
Hawaii 2050 Sustainability Plan Ten Year Measurement Update (2008-2017)
Overview of the Hawaii 2050 Sustainability Plan ................................................................... 6
Assessment of 2008 Recommendations for Action ............................................................... 8
Recommendation 1: Focus on Priority Actions, “2020 Benchmarks” .................................... 8
1. Increase Affordable Housing Opportunities for Households up to 140% of the Medium Income .................................................................................................... 8
2. Strengthen Public Education ........................................................................................ 11
3. Reduce Reliance on Fossil Fuels ................................................................................. 15
4. Increase Recycling, Reuse, and Waste Reduction Strategies ...................................... 23
5. Develop a More Diverse and Resilient Economy .......................................................... 31
6. Create a Sustainability Ethic ......................................................................................... 37
7. Increase Production and Consumption of Local Foods and Products, Particularly Agricultural Products .................................................................................. 39
8. Provide Access to Long-Term Care and Elderly Housing ............................................. 44
9. Preserve and Perpetuate our Kanaka Maoli and Island Cultural Values ....................... 48
Recommendation 2: Establish a Sustainability Council ...................................................... 52
Figure 1. Total Households in Hawaii by Year (2006 – 2016) ............................................................................................................ 9
Figure 2. Hawaii Shelter-to-Income Ratios by Year (2006 – 2014) .................................................................................................... 9
Figure 13. Hawaii Island Traded Clusters (1998 – 2014) ................................................................................................................. 34
Figure 14. Hawaii Local Agricultural Production (2007 – 2016) ...................................................................................................... 42
Figure 15. Future Predictions of Long-Term Care in Hawaii (2013 – 2030) ..................................................................................... 47
Figure 16. Fresh Water Use for the State of Hawaii (1985 – 2010) ................................................................................................. 64
Figure 17. Public Water Supply Use Increased as Population Increased (Statewide) (1985 – 2010) .............................................. 64
Figure 18. Statewide Energy Consumption Per Capita (2007 – 2015) ............................................................................................. 65
Figure 19. Statewide Residential Average Monthly Energy Use (2011 – 2016) .............................................................................. 65
Figure 20. Hawaii Renewable Portfolio Standard Progress (2007 – 2016) ...................................................................................... 66
Figure 21. Statewide Renewable Energy Generation (2016) ........................................................................................................... 66
Figure 23. Hawaii Statewide Employment: Professional Science and Technological Services (2007 – 2016). ................................ 72
Figure 24. Hawaii’s Agricultural Land Utilization in 1980 ............................................................................................................... 79
Figure 25. Hawaii’s Agricultural Land Utilization in 2015 ............................................................................................................... 79
Figure 26. Hawaii Renewable Portfolio Standard Progress (2007 – 2016) ...................................................................................... 82
Figure 27. Statewide Renewable Energy Generation (2016) ........................................................................................................... 82
Figure 34. Marine Managed Acres in Hawaii State Waters out to 3 NM (2016) ............................................................................ 88
Figure 39. Kauai Draft General Plan Policies to Guide Growth (2017) ............................................................................................ 93
PAGE 2
Figure 40. Mean Sea Level Trends of Nawiliwili, Kauai; Honolulu, Oahu; Kahului, Maui; Hilo, Hawaii (1900 – 2017) .................. 98
Figure 41. Runoff Pollution Infographic for Hawaii’s Ahupuaa’s .................................................................................................. 100
Figure 42. Water Quality Assessments for All of Hawaii’s Rivers and Streams (2014) .................................................................. 101
Figure 43. Water Quality Impairment of Hawaii’s Assessed Rivers and Streams (2014) .............................................................. 101
Figure 44. Hawaii’s Rivers and Streams Causes of Impairment (2014) ......................................................................................... 101
Figure 45.Water Quality Assessments for All of Hawaii’s Bays and Estuaries (2014) ................................................................... 102
Figure 46. Water Quality Impairment of Hawaii’s Assessed Rivers and Streams (2014) .............................................................. 102
Figure 47. Hawaii’s Bays and Estuaries Causes of Impairment (2014) .......................................................................................... 102
Figure 48. Water Quality Assessment for All of Hawaii’s Coastal Shorelines (2014)..................................................................... 103
Figure 49. Water Quality Impairment of Hawaii’s Assessed Coastal Shorelines (2014) ................................................................ 103
Figure 50. Hawaii’s Bays and Estuaries Causes of Impairment (2014) .......................................................................................... 103
Figure 51. Statewide Values of Annual Index Median Flows Statewide (1913 – 2008) ................................................................. 106
Figure 52. Trends in Base Flow in Hawaii (1913 – 2008) ............................................................................................................... 107
Figure 53. Trends in Streamflow in Hawaii (1913 – 2008) ............................................................................................................ 107
Figure 54. Hawaii’s Civilian Population with Health Insurance (2015) .......................................................................................... 112
Figure 55. Statewide Percentage of Population using Public Transportation and Ridesharing (2010 – 2015).. ........................... 113
Figure 56. Statewide Commuting Patterns in Hawaii (1980 – 2013) ............................................................................................ 113
Figure 57. Honolulu Annual Hours of Delay and Excess Fuel Consumed by Commuter (2007 – 2014). ........................................ 114
Figure 58. Statewide Annual Motor Vehicle Miles per Year (2007 – 2016) ................................................................................... 115
Figure 59. Commuting Patterns in Hawaii (1980 – 2013) ............................................................................................................. 116
Figure 61. Hawaii Households with Internet Access at Home (2013 – 2016) ................................................................................ 122
Figure 62. Hawaii High School Student Out-Migration Rates (2008 – 2014). ............................................................................... 122
Figure 63. University of Hawaii Kawaihuelani Center for Hawaiian Language Total Student Enrollment (2014 – 2017) ............. 132
Figure 64. University of Hawaii Student Enrollment in HAW-101: Elementary Hawaiian (2014 – 2017) ...................................... 132
Figure 65. Hawaii Tourism Authority Kukulu Ola Living Hawaiian Culture Program Funding (2010 – 2016) ................................ 135
Figure 66. OHA Programmatic Grants Awarded to Sustain Subsistence-Based Businesses and Economies (2012 – 2016) .......... 137
Figure 67. Hawaii Tourism Authority Aloha Aina Program Awards (2010 – 2016) ....................................................................... 137
PAGE 3
List of Tables
Table 1: DOE Statewide College and Career Readiness Indicators (2006 – 2016) ........................................................................... 13
Table 2: Percentage of Students Proficient and Advanced on the National Assessment of Educational Progress (NAEP).............. 14
Table 4: LED Lighting Projects in DOE Schools Statewide (2017) .................................................................................................... 20
Table 5: Description of Net-Energy Metered PV Systems and KWh Production (2017) ................................................................... 20
Table 6. Overall Performance of Hawaii’s Targeted Industry Portfolio (2006 – 2016) .................................................................... 36
Table 7: Compilation of Hawaii Local Agricultural Production (2007 – 2016) ................................................................................. 43
Table 8: Elderly Population in Hawaii, 2007 and 2030 .................................................................................................................... 44
Table 9: Population Distribution Projections for the United States and Hawaii by Age Groups, 2015 and 2020 ............................ 44
Table 10. Hawaii County Water Consumption Rates (Fiscal Years 2008 – 2017) ............................................................................ 61
Table 11. Kauai County Water Consumption Rates (2008 – 2017) ................................................................................................. 61
Table 12. Maui County Water Consumption Rates Per Capita per Day (Fiscal Years 2007 – 2016) ................................................ 62
Table 13. City and County of Honolulu Board of Water Supply Water Consumption Rates per Capita per Day (2000 – 2020) ...... 62
Table 15. Historical Table of STEM Degrees and Certificates, Earned by College, Statewide (2007 – 2017) .................................. 75
Table 16. Hawaii Self-Sufficiency Income Standards (2007 – 2016) ................................................................................................ 76
Table 17. Massachusetts Institute of Technology’s Living Wage Calculation for Hawaii (2016) .................................................... 77
Table 18. Hawaii’s Total Import and Export Values (2013 – 2016) ................................................................................................. 78
Table 19. Hawaii State Household Income in Quintiles (2016) ....................................................................................................... 78
Table 20. Statewide Households at HUD Income Guidelines (2006 – 2014) ................................................................................. 111
Table 21. HUD 2017 Income Limits for the State of Hawaii .......................................................................................................... 111
Table 22. Population of Owner Occupied Units (2006 – 2014) ..................................................................................................... 112
Table 23. Statewide Mean Commute Time, By County (2011 – 2015) .......................................................................................... 114
Table 24. DOE Statewide College and Career Readiness Indicators (2009-2016) ......................................................................... 118
Table 25. Hawaii High School Completers College Enrollment (2009 – 2016) ............................................................................... 119
Table 26. Hawaii Substance Abuse Rates Comparison between 2008 – 2009 and 2014 – 2015................................................... 119
Table 27. Percentage of Annual Household Expenditures by County in 2014 ............................................................................... 120
Table 28. Hawaii Executive Office on Early Learning Public Pre-Kindergarten Program (2014 – 2017) ........................................ 123
Table 29. Children Attending Pre-Kindergarten Programs on DOE Campuses (2013 – 2017) ....................................................... 123
Table 30. Number and Percentage of 3- and 4-year olds Not Enrolled in Pre-K (2009 – 2015) ..................................................... 123
PAGE 4
Executive Summary
The Hawaii 2050 Sustainability Plan was published in 2008 in accordance with Act 8, Special Session
Laws of 2005. Act 8, Special Session Laws of 2005 requires the State Auditor, with the assistance of the
Office of Planning, to update this plan every ten years; due to a lack of funding for the update of this
plan, the Office of Planning, through the State’s Sustainability Coordinator, conducted an evaluation of
the metrics and indicators established by the 2008 Hawaii 2050 Sustainability Plan. This evaluation and
measurement was the first of its kind over the past decade. This report reviews the data collected over
the course of this ten year measurement of Hawaii’s progress toward sustainability according to the
Hawaii 2050 Sustainability Plan’s 5 goals, 9 “2020 benchmarks”, 22 strategic actions, and 55 indicators.
This report found that through the course of the past ten years, the Hawaii 2050 Sustainability Plan was
disregarded. The Hawaii 2050 Sustainability Plan set nine benchmarks to achieve by 2020. This report
found that as of 2017, Hawaii continues to struggle with these same issues. The Hawaii 2050
Sustainability Plan also provided recommendations and next steps to assist with implementing
sustainability statewide. This report found that these recommendations were either only partially
implemented or not implemented at all.
Although Hawaii’s sustainability ethic has strengthened over the past ten years, this ethic is primarily
externally driven through climate change mitigation and adaptation reports and data, and recent
international, national, and local sustainability efforts. This report found that many sustainability efforts
and indicators were not implemented by government in a coordinated manner.
Hawaii lacked a permanent governmental sustainability coordinating entity over the past ten years to
assist with the implementation of the Hawaii 2050 Sustainability Plan and its sustainability goals.
A stronger legislative framework focusing on sustainability, the permanent establishment of a
governmental sustainability coordinating entity with recognized responsibilities and authorities, and
budgetary funding are necessary to develop, coordinate, and implement Hawaii’s sustainability goals,
priorities, and planning throughout government.
The Hawaii 2050 Sustainability Plan is outdated with some unmeasurable indicators. Funding will be
necessary to perform a formal ten year update of this large plan pursuant to Act 8, Special Session Laws
of 2005, with current scientific data, best practices, and indicators measuring the sustainability of
Hawaii, its economy, society, and natural resources. Future sustainability coordination should include
but are not limited to: assessments of Hawaii’s infrastructure, water security planning and strategies,
sustainable land use recommendations, and local food security planning and strategies.
These areas must be examined to prepare for a sustainable Hawaii by 2050.
PAGE 5
Legal Mandate
Act 8, Special Session Laws of 2005
On July 12, 2005, the State Legislature overrode the veto of S.B. 1592, thus enacting Act 8 Special Session Laws of
Hawaii (SSLH) 2005 (S.B. 1592, SD 1, HD2, CD1) Relating to State Planning (Act 8) to create a task force to review
the Hawaii State Plan and other fundamental concepts of community planning and make recommendations for
the Hawaii 2050 Sustainability Plan. The law required the State Auditor to prepare the Hawaii 2050 Sustainability
Plan, which would define and implement state goals, objectives, policies, and priority guidelines by incorporating
some or all of the recommendations of the Hawaii 2050 Task Force. The Legislature found that “planning the
overall theme and goals of the State was important to our future success, and that there were many real, serious,
and immediate problems that our state faces on an annual basis” (Act 8, SSLH 2005). While the Legislature found
that “it [was] the government’s responsibility to resolve those issues, it [was] also the government’s responsibility
to keep a watchful eye on the future and guide the State in the right direction for succeeding generations” (Act 8,
SSLH 2005). Thus, the Legislature believed in 2005 “that the time had come to review the precepts of the Hawaii
State Plan and other fundamental components of community planning. Specifically, many quality-of-life issues,
including water quality, air quality, land use, energy, and ocean resources, are important to the people of Hawaii
and should focus on the planning of Hawaii’s future” (Act 8, SSLH 2005).
Act 8, Special Session Laws of 2005 required the Hawaii 2050 Task Force to provide criteria or benchmarks as
recommendations to either be enacted into law, adopted as policies for governmental agencies, or through
guiding budgetary priorities. A report from the Hawaii 2050 Task Force was also required to provide the
Legislature recommendations, including any implementing legislation prior to the 2006 legislative session.
The Act also required the State Auditor to prepare the Hawaii 2050 Sustainability Plan to define and implement
state goals, objectives, and priority guidelines using the Hawaii State Planning Act’s §226-3 to §226-27 of the
Hawaii Revised Statutes as guiding principles. The State Auditor was required to solicit input from the public and
all state departments to prepare the plan and incorporate all or some of the Hawaii 2050 Task Force
recommendations in the Hawaii 2050 Sustainability Plan.
The Hawaii 2050 Sustainability Plan was directed through Act 8 to serve as a guideline for funding and
implementation by state and county agencies. The State Auditor submitted the Hawaii 2050 Sustainability Plan:
Charting a Course for Hawaii’s Sustainable Future to the Legislature in January 2008.1 Finally, Act 8 further
required the State Auditor, with the assistance of the Office of Planning, to update the plan every ten years and
report to the Legislature.
This report seeks to evaluate the Hawaii 2050 Sustainability Plan to determine what goals, 2020 benchmarks, and
strategic actions were implemented over the past ten years. Funding will be necessary to perform a formal
update to the Hawaii 2050 Sustainability Plan.
1 Hawaii 2050 Sustainability Task Force. (2008). Hawaii 2050 Sustainability Plan. Retrieved from: http://www.oahumpo.org/wp-content/uploads/2013/02/Hawaii2050_Plan_FINAL.pdf.
PAGE 6
Overview of the Hawaii 2050 Sustainability Plan
The Hawaii 2050 Sustainability Plan: Charting a Course for Hawaii’s Sustainable Future reviewed the Hawaii State
Planning Act in Chapter 226 of the Hawaii Revised Statutes (enacted in 1978) and considered the plan to be a
visionary effort of Governor George Ariyoshi that provided balanced guidance to government and the private
sector in the use of our state’s precious natural and cultural resources. The Hawaii 2050 Sustainability Plan,
however, noted that since 1986, the Hawaii State Plan “fell into disuse. Overtime it has become outdated, and
awareness of the State Plan and its goals has dwindled” (p. 7).
The Hawaii 2050 Sustainability Plan, published in 2008, noted that the last comprehensive review of the Hawaii
State Plan occurred in the mid-1980s, and the functional plans were last updated in 1991.
The Hawaii 2050 Sustainability Plan created the State’s first definition of sustainability, which was:
A Hawaii that achieves the following:
1) Respects the culture, character, beauty, and
history of our state’s island communities;
2) Strikes balance among economic, social and
community, and environmental priorities; and
3) Meets the needs of the present without
compromising the ability of future generations to
meet their own needs. (p.1)
This definition was meant to serve as the foundation of
Hawaii’s sustainability toward 2050 and the beginning of a
shared vocabulary about sustainability and the future of
Hawaii.
5 Goals
The Hawaii 2050 Sustainability Plan identified five goals as integrated philosophies that express the sustainable
future of Hawaii to reflect a sense of where Hawaii should be headed.
Sustainability as a Way of Life: Living sustainably is part of our daily practice in Hawaii.
Sustainable Economy: Our diversified and globally competitive economy enables us to live, work, and
play in Hawaii.
Sustainable Environment and Natural Resources: Our natural resources are responsibly and
respectfully used, replenished, and preserved for future generations.
Sustainable Community and Social Well Being: Our community is strong, healthy, vibrant and
nurturing, providing safety nets for those in need.
Sustaining Kanaka Maoli Culture and Island Values: Our Kanaka Maoli and island cultures and values
are thriving and perpetuated.
To measure success or failure of the implementation of these five goals, the Hawaii 2050 Sustainability Plan
identified 22 strategic actions and 55 indicators. This report attempts to measure these five goals based off of the
Hawaii 2050 Sustainability Plan’s 22 strategic actions and 55 indicators.
Social/Cultural Equity
Economic Growth
Environmental Protection
SUSTAINABILITY
PAGE 7
2020 Benchmarks
The Hawaii 2050 Sustainability Plan also identified nine priority actions to serve as intermediate steps as tangible
targets or benchmarks to be achieved immediately by the year 2020. This report attempts to measure these nine
“2020 benchmarks”:
1. Increase Affordable Housing Opportunities for Households up to 140% of Median Income
2. Strengthen Public Education
3. Reduce Reliance on Fossil (carbon-based) Fuels
4. Increase Recycling, Reuse, and Waste Reduction Strategies
5. Develop a More Diverse and Resilient Economy
6. Create a Sustainability Ethic
7. Increase Production and Consumption of Local Foods and Products, Particularly Agriculture
8. Provide Access to Long-Term and Elderly Housing
9. Preserve and Perpetuate our Kanaka Maoli and Island Cultural Values
Next Steps: Recommendations for Action
Finally, the Hawaii 2050 Sustainability Plan provided four recommendations for action to implement the plan’s
intentions. This report attempts to evaluate the progress toward the previously established 2008
recommendations.
1. Take Action on the Nine “2020 Benchmarks:” to kick-start Hawaii’s sustainability process.
2. Establish a State Sustainability Council: This non-regulatory government body would be in charge
of coordinating, marketing, and implementing Hawaii 2050 initiatives and recommendations.
Similar to the State’s Council on Revenues, this council would help to promote sustainability,
determine intermediate and long-term benchmarks, measure success, coordinate cross-sector
efforts and dialogue, and report to government and private sector leaders on progress.
3. Develop Sustainability Indicators: The 55 Hawaii 2050 indicators would be an annual aggregation of
the data as the primary measure of the overall progress of our society. These 55 indicators will
measure Hawaii’s overall economic, environmental, community, and cultural characteristics.
4. Report on Progress: To be held accountable to these goals and objectives, an annual report should
be produced by the Sustainability Council and presented to government and other leaders.
PAGE 8
Assessment of the 2008 Recommendations for Action
Recommendation 1: Focus on Priority Actions, Take Action on the Nine “2020 Benchmarks”
1. Increase Affordable Housing Opportunities for Households up to 140% of theMedium Income
In 2006, the Hawaii Housing Policy Study found that almost half of the
state’s rental units were not affordable for its residents.2 In 2008, the
Hawaii 2050 Sustainability Plan identified affordable housing as the most
critical issue facing the state.3 The National Low Income Housing
Coalition’s (NLIHC) annual report, Out of Reach 2017, documents the gap
between wages and the price of housing across the United States.4 The
report’s housing wage is an estimate of the hourly wage that a full-time
worker must earn to afford a modest and safe rental home without
spending more than 30% of income on rent and utility costs. Hawaii’s
housing wage is presently the highest in the nation at $35.20 for a two-
bedroom rental unit at the Fair Market Rent (FMR) of $1,830 established
by the U.S. Department of Housing and Urban Development (HUD).
In order to afford this level of rent and utilities — without paying more
than 30% of income on housing — a household must earn $6,102
monthly or $73,217 annually. A worker earning the state minimum
wage of $9.25 per hour would need to work 3.8 full-time jobs, or
approximately 152 hours per week for all 52 weeks of the year, in order
to afford a two-bedroom apartment at HUD’s FMR. As a point of
contrast, the national housing wage is $21.21 for a two-bedroom
apartment with a FMR of $1,103.5 As the most expensive state in the
nation to rent a home, the NLIHC estimates that Hawaii has a deficiency
of 27,889 units for families earning 80% or less of HUD’s Area Median Income (AMI). 6
HUD defines households earning up to:
30% AMI as extremely low income
50% AMI as very low income
80% AMI as low income
Up to 120% AMI as moderate income, and up to 140% AMI as above-moderate income.
2 State of Hawaii, Hawaii Housing Finance and Development Corporation. (2006). Hawaii Housing Planning Study. Retrieved from: http://www.hawaiihousingalliance.org/docs/pubs/State,%20County,%20Legislative%20Housing%20Reports/Hawaii%20State%20Housing%20Policy%20Studies/SMS%20Hawaii%20Housing%20Policy%202006%20Technical%20Data.pdf. 3 Hawaii 2050 Sustainability Task Force. (2008). Hawaii 2050 Sustainability Plan: Charting a Course for Hawai’i’s Sustainable Future. Retrieved from: http://www.oahumpo.org/wp-content/uploads/2013/02/Hawaii2050_Plan_FINAL.pdf. 4 National Low Income Housing Coalition. (2017). 2017 Annual Report: Out of Reach 2017: The High Cost of Living. Retrieved from: http://nlihc.org/sites/default/files/oor/OOR_2017.pdf. 5Ibid. 6Ibid.
140% AMI IN
2017 DOLLARS
STATEWIDE AVERAGE:$113,942
HAWAII COUNTY:$88,620
MAUI COUNTY:$103,740
KAUAI COUNTY:$110,800
HONOLULU COUNTY:$121,240
Special Action Team on Affordable Rental Housing
PAGE 9
The Hawaii 2050 Sustainability Plan published that the Hawaii Housing Policy Study (2006) measured 435,818
housing units in Hawaii with 54.2% [sic] (correction: 54.3%7) of households in 2006 paid less than 30% of income
for housing, referencing that paying less than 30% of income is considered affordable. The plan also identified that
34% are cost burdened, with 11.3% of households paying 30-40% of their incomes for housing, and 22.6% paid
housing payments exceeding 40% of their income. This report will use the same measurement references which
includes two updates to the Hawaii Housing Policy Studies in 2006, 2011, and 2016 as reflected in Figures 1 and 2.
7 State of Hawaii, Hawaii Housing Finance and Development Corporation. (2006). Hawaii Housing Planning Study. Retrieved from: http://www.hawaiihousingalliance.org/docs/pubs/State,%20County,%20Legislative%20Housing%20Reports/Hawaii%20State%20Housing%20Policy%20Studies/SMS%20Hawaii%20Housing%20Policy%202006%20Technical%20Data.pdf.
501,956
516,394
532,413
500,000
505,000
510,000
515,000
520,000
525,000
530,000
535,000
2 0 0 6 2 0 1 1 2 0 1 5
Total Housing Units Statewide(2006-2015)
Figure 1. Total Households in Hawaii by Year 2006-2016. Data from the Hawaii Housing Planning Study, 2016 prepared for the Hawaii Housing finance and Development Corporation, 2016.
54.3%
11.3%
22.7%
34.0%
51.1%
10.7%
29.6%
40.3%
58.2%
11.3%
24.6%
35.9%
0.0%
10.0%
20.0%
30.0%
40.0%
50.0%
60.0%
30% of Income orBelow
30 to 40% of Income 40% of Income orAbove
Combined rate of 30-40% Income or Above
Hawaii Shelter-to-Income Ratios (2006-2014)
2006 2011 2014
Figure 2. Hawaii Shelter-to-Income Ratios by Year 2006-2014. Data from the Hawaii Housing Planning Study, 2016 prepared for the Hawaii Housing Finance and Development Corporation, 2016.
PAGE 10
The State of Hawaii recently enacted Act 127 in 2016 which
established a Special Action Team on Affordable Rental
Housing to recommend actions to increase the supply of
rental housing, particularly rental housing affordable to low-
and moderate-income families. This Special Action Team was
also required to develop a ten year plan that identifies state,
county, and private parcels of land that are suitable for
housing units. Act 127 further required the update to the
Hawaii State Planning Act’s Housing Functional Plan, which
was recently updated in February 2017. This State Housing
Functional Plan (2017) based the definitions of “affordable
housing” on HUD Area Median Incomes. For example, the
State Housing Functional Plan makes a distinction between
affordable rental housing, capped at 80% of AMI, and
affordable for-sale housing, targeted to families earning
between 80% and 140% of AMI.8
As noted in §2 of Act 127 (2016), the state will require 64,700
housing units to meet the projected housing demand
between 2015 and 2025. Of these, a projected 22,247 units
will be needed for rental units for households earning 80% or
less of AMI.9 These projected numbers stem from the April
2015 State Department of Economic Development and
Tourism (DBEDT), Measuring Housing Demand in Hawaii,
2015-2025 (DBEDT Housing Demand Study), which projects a
statewide demand for 64,693 housing units over the ten year
period of 2015-2025. Further and in-depth information on
Hawaii’s affordable rental housing may be found in the State’s
Special Action Team on Affordable Rental Housing Ten Year Plan, which will be released in 2018.
8 State of Hawaii, Hawaii Housing Finance and Development Corporation. (2017). State Housing Functional Plan. Retrieved from: https://dbedt.hawaii.gov/hhfdc/files/2017/03/Housing_2017.pdf. 9 State of Hawaii, Special Action Team on Affordable Housing. (2018). Ten Year Plan and Report to the 2018 State Legislature.
WHO NEEDS AFFORDABLE
RENTAL HOUSING?
68% of households earning less than $65,470 need affordable
rental housing
21% of households earning between $65,470 and $98,204
need housing, and they are targeted as for-sale “workforce”
housing
Only 22% of households earning more than $98,204 need
housing, and they are targeted as for-sale “workforce” or market
rate housing.
Special Action Team on Affordable Rental Housing
PAGE 11
2. Strengthen Public Education
In 2016, the State Department of Education (DOE) began a year-long effort to review and extend their 2012-2018
Strategic Plan. Following an extensive community outreach program, and based on feedback from thousands of
participants, the 2017-2020 DOE-BOE Joint Strategic Plan (Strategic Plan) was approved by the Board of Education
on December 6, 2016.10 The Strategic Plan delineates detailed goals, objectives, and strategies aimed at
improving our public education system. Centered on the Strategic Plan’s first goal – student success, the
Strategic Plan outlines four objectives with related strategies to ensure that all students demonstrate that they
are on a path toward success in college, career, and citizenship. These objectives and strategies include:
Objective One
EMPOWERED. All students are empowered in their learning to set and achieve their aspirations for the future
1a. Increase student engagement and empowerment through relevant, rigorous learning opportunities that incorporate students’ voices. Students are encouraged to apply their learning through life experiences, questions, and challenges. Students practice creative problem solving and can see themselves as part of a community effort to address complex questions and challenges that impact our islands and the world.
1b. Ensure that high school graduates demonstrate the General Learner Outcomes (GLOs) and have the abilities, habits, and knowledge to set and achieve their short-term and long-term career, community, and postsecondary education goals. Students can identify the training, certificate, apprenticeship, and/or college degree requirements for their career and community passions, and are equipped with the knowledge and skills to set and achieve their goals.
1c. Throughout their K-12 education experience, students have diverse opportunities to explore, plan, and prepare so that they graduate from high school ready to succeed. Students have access to high-quality career and college counseling, mentorship opportunities, internships and advanced courses (e.g., Early College) to support their long-term success.
Objective Two WHOLE CHILD.
All students are safe, healthy, and supported in school, so that they can engage fully in high-quality educational opportunities.
2a. Provide students with learning environments that are caring, safe, and supportive of high-quality learning.
2b. Address students’ physical, mental, and behavioral health through school programs and partnerships with families, community organizations, and government agencies that support students’ well-being.
2c. Cultivate a community and school culture where attendance is valued, encouraged, and supported. Extend this culture of attendance to the home; encourage families to plan for family vacations, travel, and other events during school breaks, holidays and other non-student days.
10 State of Hawaii, Department of Education and Board of Education. (2016). Strategic Plan 2017-2020. Retrieved from: http://www.hawaiipublicschools.org/DOE%20Forms/Advancing%20Education/SP2017-20.pdf.
PAGE 12
Objective Three WELL-ROUNDED.
All students are offered and engage in a rigorous, well-rounded education so that students are prepared to be successful in their post-high school goals.
3a. Provide students of all backgrounds, ages, and needs with a challenging and quality standards-based education in all subject areas.
3b. Ensure that each student’s learning is personalized, informed by high-quality data, and advances them toward readiness for success in career, college, and community.
Objective Four PREPARED AND RESILIENT.
All students transition successfully throughout their educational experiences. 4a.
Identify and address student strengths and challenges early, so students may transition into early elementary grades ready to learn and with a cognitive foundation for reading that prepares them for the future.
4b. Support students’ transition in adolescence (grades 5-10) through school practices, counseling, and research-based experiences that advance total well-being.
4c. Creative innovative learning options to earn a high school diploma.
4d. Support students who are transitioning between grade levels or transferring to a new school.
4e. Ensure that every high school graduate or completer has an identified next step after high school aligned with their future aspirations.
As the DOE begins to focus on implementation of their new Strategic Plan with an eye toward sustainable
improvement in the public education system, focus has sharpened around three important areas: school design,
student voice, and teacher collaboration.
In addition to the Strategic Plan, the DOE partnered over the past several years with Hawaii P-20 Partnerships for
Education to track college and career readiness indicators.11 An annual report has been produced every year since
2009. The report presents information on how well Hawaii’s graduates are prepared to meet the DOE’s vision of
what a high school graduate should be. Indicators are based on recommendations from Measures that Matter:
Making College and Career Readiness the Mission of High Schools, published by Achieve, a non-profit education
organization created in 1996 by a bipartisan group of governors and business leaders to help states with their
college and career readiness goals.12
Data presented in Table 1 is aggregate for the state; however, reports for individual high schools are available
online.
11 Hawaii P-20 Partnerships for Education. (2017). College and Career Readiness Indicators Reports. Retrieved from: http://www.p20hawaii.org/resources/college-and-career-readiness-indicators-reports/. 12 Achieve and the Education Trust. (2008). Making college and Career Readiness the Mission for High Schools: A Guide for State Policymakers. Retrieved from: https://www.achieve.org/files/MakingCollegeandCareerReadinesstheMissionforHighSchool.pdf.
PAGE 13
Table 1: DOE Statewide College and Career Readiness Indicators (2006 – 2016)
CLASS OF: 2009 2010 2011 2012 2013 2014 2015 2016 High School Completers1 11,451 10,787 10,805 11,596 11,275 11,216 10,927 11,003 On-time Graduation Rate2 80% 80% 81% 81% 82% 82% 82% 82% Hawaii State Assessments (% Proficient)3,4
1 For these reports, high school completers include those who have earned diplomas or certificates of completion. 2 On-time graduation rate is based on the first-time ninth grade cohort adjusted for students who transferred in or out. 3 Hawaii State Assessment (HSA) proficiencies are based on each graduating class’s 10th grade scores. 4 2016 percentages reflect performance on the Smarter Balanced Assessment, which replaced the HSA. 5Advanced Placement results are reported for high school completers who took at least one Advanced Placement exam during high school. 6 For 2009, number and percentage of students taking AP exams. 7 For 2009, number of exams scored 3 of 5 or better. 8 Dual Credit participants are high school completers who took at least one credit course from the University of Hawaii while they were still enrolled in high school. Numbers reported for 2009 and 2010 reflect only participants in the Running Start program. These participants are high school completers who took at least one Running Start course during high school. 9 These data represent high school completers’ confirmed college enrollment following high school graduation and are based on reports provided by the National Student Clearinghouse. 10 These figures represent enrollment in any course that is below college-level. 11 “Other” courses satisfy UH general education mathematics or English requirements and/or may be used to fulfill a “terminal” mathematics or English requirement for a degree or certificate.
Source: Hawaii Department of Education, data compiled from Hawaii P-20 Partnerships for Education Reports.
PAGE 14
The Hawaii 2050 Sustainability Plan specifically identified scores on the National Assessment of Educational
Progress (NAEP) as a metric to measure progress toward the strengthening of public education. This metric alone,
however, does not provide a complete picture of the actions that have been taken over the past ten years to
strengthen public education in the state. NAEP was originally designed to provide a common national measure of
student performance during a time in which there was no consistency in state academic standards. Results are
based on samples of fourth- and eighth-graders, meaning that not all students across the state are tested.
Table 2 provides the original 2007 benchmark and the identified 2019 goal for percentage proficiency in grade 4
and grade 8 reading and mathematics from the Hawaii 2050 Sustainability Plan. There appears to be no indication
as to how the 2019 goals were set in the 2008 Hawaii 2050 Sustainability Plan. Since NAEP also assesses science in
grades 4 and 8, such data were included where available. Accordingly, in addition to NAEP scores, the DOE offers
the following data in Table 3 to demonstrate progress made toward strengthening public education.
Table 2: Percentage of Students Proficient and Advanced on the National Assessment of Educational Progress (NAEP)
2007 Benchmark Sustainability Plan
2019 Goal 2011 2013 2015
Reading
Grade 4 26% 35% 27% 30% 29%
Grade 8 20% 22% 26% 28% 26%
Mathematics
Grade 4 33% 61% 40% 46% 38%
Grade 8 21% 31% 30% 32% 30%
Science
Grade 4 -- -- 30%
Grade 8 -- -- 22% 23% Source: Hawaii State Department of Education (Accountability Section, Assessment and Accountability Branch – Office of Strategy, Innovation and Performance)
Science** 40% 42% 43% Notes: Achievement rates are based on all students enrolled on the Participation Rate Count date. *Hawaii State Reading and Mathematics Bridge Assessments were administered students in grades 3-8 and 10. These Bridge Assessments were meant to bridge between the Hawaii State Assessment and the Smarter Balanced Assessment, which is based on Common Core State Standards. The Smarter Balanced Assessment have been administered for English Language Arts/Literacy and Mathematics to students in grades 3-8 and 11 beginning with SY2014-2015. **Science proficiency has been measured by the HAS Science for grades 4 and 8 and the Biology I End-of-Course Exam and the Hawaii State Alternate Assessment for high school. Source: Hawaii State Department of Education (Accountability Section, Assessment and Accountability Branch – Office of Strategy, Innovation and Performance)
Hawaii’s Blueprint for Public Education
The Federal Government reauthorized the Every Student Succeeds Act (ESSA) in 2015, a new federal education law
replacing the No Child Behind Act, which must be implemented by the 2017-2018 school year. Using the
Department of Education’s six year Strategic Plan, the State developed a new Hawaii Blueprint for Public Education
to guide preparation of the State of Hawaii’s ESSA plan. This Hawaii Blueprint for Public Education is organized
around three focus areas—student success, educator success, and system success. Each focus area provides
design principles to be student centered and based on a theory of action that inspires engagement rather than
compliance.13
13 State of Hawaii, Department of Education. (2017). Every Student Succeeds Act. Retrieved from: http://www.hawaiipublicschools.org/VisionForSuccess/AdvancingEducation/StriveHIPerformanceSystem/Pages/ESSA.aspx.
PAGE 15
3. Reduce Reliance on Fossil Fuels
State Greenhouse Gas Emission Reduction Goals
The State of Hawaii enacted Act 234, codified as Chapter 342B-Part VI of the Hawaii Revised Statutes, in 2007 to
establish the State’s policy framework and requirements to address greenhouse gas (GHG) emissions.14 Act 234
(2007) likewise established the Greenhouse Gas Emissions Reduction Task Force within the State’s Department of
Business Economic Development and Tourism (DBEDT) to submit a work plan and proposed regulatory scheme to
the Legislature prior to the 2010 Legislative Session.15 Hawaii’s Greenhouse Gas Emissions law aims to achieve
cost-effective GHG emission reductions to achieve emission levels at or below Hawaii’s 1990 GHG emissions by
January 1, 2020 (which would be 13.66 million metric tons per year of CO2e, excluding aviation and international
bunker fuel emissions and includes carbon sinks).16 In 2008, the State of Hawaii developed statewide GHG
emission inventories for 1990 and 2007.17 This law was the product of many reports from the previous decade
warning of the risks of climate change, the need to reduce GHG emissions and the need for Hawaii’s energy
independence, including the Inventory of Hawaii Greenhouse Gas Emissions Estimates for 1990,18 and the Hawaii
Energy Strategy 2000.19 The task force was dissolved following its legislative report in 2010.20 The report
highlighted that the task force unanimously recommended strong support and implementation of the Hawaii
Clean Energy Initiative (HCEI) with the support of additional policies and funding as a means to achieve energy
security and reducing GHG emissions.
Act 234 (2007) tasks the State’s Department of Health’s Clean Air Branch with establishing GHG emission limits to
be achieved by January 1, 2020, establishing emission reduction; and report and verify statewide GHG emissions
and to monitor and enforce compliance. By June 2014 the Department of Health’s Clean Air Branch updated the
Hawaii Administrative Rules and initiated GHG emission rules and emissions caps to implement the goals set forth
in Act 234 (2007) through HAR Chapter 11-60.1.21 These Hawaii Administrative Rules (HAR Chapter 11-60.1-204k)
further requires that the DOH must conduct annual evaluations to determine progress in achieving the statewide
GHG emissions limit.22
The Department of Health’s Clean Air Branch is in the process of updating prior statewide GHG inventories
through an annual report expected to be released in 2018, which will include a new 2015 statewide GHG emission
inventory, updated 1990, 2007, and 2010 GHG inventories, as well as statewide GHG projections for 2020 and
2025. At the 9th Annual Hawaii Clean Energy Day in August 2017, the Clean Air Branch shared the following
updated data from previous GHG inventories from their updated report depicted in Figure 3.23
14 Hawaii Revised Statutes Chapter 342B-Part VI. 15 State of Hawaii, Department of Business Economic Development and Tourism, Greenhouse Gas Emissions Reduction Task Force. (2009). Report to the 2010 Legislature: Work Plan for Greenhouse Gas Emissions Reductions. Retrieved from: http://files.hawaii.gov/dbedt/annuals/2015/2015-greenhouse-gas-program.pdf. 16 State of Hawaii, Department of Health, Clean Air Branch. (2013). Highlights for State Greenhouse Gas (GHG) Rules. Retrieved from: http://health.hawaii.gov/cab/files/2013/10/Highlights__post-comment-period.pdf. 17State of Hawaii, Department of Business Economic Development and Tourism; Energy, Resources, and Technology Division, and Department of Health, Clean Air Branch. (1997). Inventory of Hawaii Greenhouse Gas Emissions Estimates for 1990. 18 Ibid. 19 State of Hawaii, Department of Business Economic Development and Tourism, Energy Resources and Technology Division. (2000). Hawaii Energy Strategy 2000. Retrieved from: http://www.hawaiicleanenergyinitiative.org/storage/hes2000.pdf. 20 State of Hawaii, Hawaii Department of Business Economic Development and Tourism, Greenhouse Gas Emissions Reduction Task Force. (2009). Report to the 2010 Legislature: Work Plan for Greenhouse Gas Emissions Reductions. Retrieved from: http://files.hawaii.gov/dbedt/annuals/2015/2015-greenhouse-gas-program.pdf. 21 State of Hawaii Administrative Rules. (2014). Hawaii Administrative Rules Chapter 11-60.1. Retrieved from: http://health.hawaii.gov/cab/files/2014/07/Highlights-GHG-RulesFinal.pdf. 22 Ibid. 23 State of Hawaii, Department of Health, Clean Air Branch. (2017). 9th Annual Hawaii Clean Energy Day, GHG Rules & Statewide GHG Emission Inventories Presentation. Retrieved from: https://health.hawaii.gov/epo/files/2017/10/HawaiiCleanEnergyDay2017final.pptx.
PAGE 16
Further information about the Department of Health’s updated GHG emissions annual report is available at the
Clean Air Branch’s website: http://health.hawaii.gov/epo/strategic/greenhouse/.
Hawaii’s Commitment to the UN Paris Agreement
The State enacted Act 32 (SB 559) in 2017, codified as Chapter 225P of the Hawaii Revised Statutes, which
documented the State of Hawaii’s commitment to combat climate change by systematically reducing GHG
emissions and improving Hawaii’s resiliency to climate change; the State’s commitment aligned with the principles
and contributed to the goals set by the Paris Agreement.24 The Paris Agreement was the 21st Conference of the
parties of the United Nations Framework Convention on Climate Change which adopted an agreement in 2016 to
address worldwide GHG emissions mitigation, adaptation, and finance starting in the year 2020. Under the Paris
Agreement adopted in 2016, 195 countries signed as parties to set GHG reduction goals, record and communicate
information through a transparency mechanism, and provide support to undeveloped countries through a finance
mechanism.
The recent passage of this law made the State of Hawaii the first state in the United States to align with the Paris
Agreement. Act 32 further requires that the:
State shall expand strategies and mechanisms to reduce the GHG emissions statewide through the
reduction of energy use, adoption of renewable energy, and control of air pollution among all agencies,
departments, industries, and sectors, including transportation. These strategies and mechanisms shall
utilize the best available science, technologies, and policies to reduce GHG emissions and shall be closely
aligned with the climate change principles and goals adopted in the Paris Agreement and Hawaii's share
of obligations within the expectations apportioned to the United States in the Paris Agreement, regardless
of federal action. The State is also required to strive to formulate and communicate long-term low GHG
emission development strategies and shall take actions to conserve and enhance long-term sinks and
reservoirs of GHGs, by prioritizing the development of parks, greenways, and restoration of native upland
and coastal forests and wetlands. (Act 32, Session Laws of Hawaii 2017)
24 Hawaii Revised Statutes §225P-3. (L 2014, c 83, pt of §2; am L 2017, c 32, §5).
13.6616.70
14.11
17.30
0.00
2.00
4.00
6.00
8.00
10.00
12.00
14.00
16.00
18.00
20.00
CO
2e
(MM
T)
Emissions Year
Prior and Updated Statewide GHG Inventories (1990 & 2007)(Excluding Aviation and International Bunker Fuel Emissions
Figure 3. Prior and Updated Statewide GHG Inventories (1990 & 2007) (Excluding Aviation and International Bunker Fuel Emissions and Including Carbon Sinks). Source: Hawaii State Department of Health, Clean Air Branch.
Updated
Updated
PAGE 17
Hawaii’s Carbon Farming Task Force
To assist with the enhancement of long-term sinks and reservoirs of GHGs, Act 33 was also enacted in 2017
creating a Carbon Farming Task Force within the Office of Planning to identify practices in agriculture, aquaculture,
and agroforestry to improve soil health, and promote carbon sequestration – the capture and long-term storage
of atmospheric carbon dioxide to mitigate climate change. The Carbon Farming Task Force is required to provide
a final report of its findings and recommendations by 2025.25
Hawaii Clean Energy Initiative
The State of Hawaii launched the Hawaii Clean Energy Initiative (HCEI) partnership in 2008 through a
memorandum of understanding with the U.S. Department of Energy to collaborate on the reduction of Hawaii’s
heavy dependence on imported fossil fuels and established a goal of achieving 70% clean energy by 2030 through
renewable energy and energy efficiency.26 Since its establishment, over the past ten years, the HCEI is now a
framework of statutes and regulations supported by a diverse group of stakeholders including business leaders,
policy makers, and concerned citizens committed to Hawaii’s clean energy future. In support of this 70% clean
energy goal, the State established a renewable portfolio standard (RPS) of 40% by 2030, and an energy efficiency
portfolio standard (EEPS) of 30% by 2030.27
The HCEI grew stronger since its creation, most notably it reaffirmed its commitment by renewing its
Memorandum of Understanding with the U.S. Department of Energy in 2014 to set bold new clean energy goals,
including28:
Achieving a statewide 100% renewable portfolio standards (RPS) by the year 2045.
Reducing electricity consumption by 4,300 gigawatt-hours by the year 2030, which would continue to
be enough electricity to power every home in Oahu, Molokai, Lanai, Maui, and Hawaii Island for more
than two years.
Reducing petroleum use in Hawaii’s transportation sector which includes two-thirds of the State’s
overall energy use.
The Hawaii Clean Energy Initiative (HCEI) credits a total of 82 laws enacted between 2008 and 2017 as key policy
milestones and a framework of policies guiding Hawaii’s energy transformation.29 These policies range from
renewable energy portfolio and energy efficiency targets, which are codified into law, as well as regulatory reform
policies, tax policies, and clean energy financing policies. The HCEI program was likewise established by law in
2010 through Act 73, Hawaii’s Environmental Response, Energy, and Food Security Tax (“the Barrel Tax”), which
temporarily created three special funds—the Energy Security Special Fund, the Energy Systems Special Fund, and
the Agricultural Development and Food Security Fund.30 Act 73 also was partially codified as §196-10.5 of the
Hawaii Revised Statutes to provide support for the Hawaii Clean Energy Initiative, the Greenhouse Gas Emissions
Reduction Task Force, and the Hawaii Natural Energy Institute to advance the State’s energy goals.31
25 State of Hawaii Office of Planning. (2017). Carbon Farming Task Force. Retrieved from: http://planning.hawaii.gov/carbon-farming-task-force/. 26 State of Hawaii. (2017). Hawaii Clean Energy Initiative. Retrieved from: http://www.hawaiicleanenergyinitiative.org/about-the-hawaii-clean-energy-initiative/. 27 U.S. Department of Energy, Office of Energy Efficiency & Renewable Energy. (2017). Achieving 70% Clean Energy by 2030 in Hawaii. Retrieved from: https://energy.gov/eere/technology-to-market/achieving-70-clean-energy-2030-hawaii. 28 State of Hawaii. (2017 Feb). Transforming Power in Paradise: The Hawaii Clean Energy Initiative. Retrieved from: http://www.hawaiicleanenergyinitiative.org/wp-content/uploads/2015/02/HCEI_FactSheet_Feb2017.pdf. 29 U.S. Department of Energy, Office of Energy Efficiency & Renewable Energy. (2017). Achieving 70% Clean Energy by 2030 in Hawaii. Retrieved from: https://energy.gov/eere/technology-to-market/achieving-70-clean-energy-2030-hawaii. 30 Hawaii Clean Energy Initiative Program Act. (2010). Hawaii Revised Statutes §196-10.5. 31 University of Hawaii Economic Research Organization. (2014). Hawaii’s Environmental Response, Energy, and Food Security Tax Credit (aka Barrel Tax). Retrieved from: http://www.uhero.hawaii.edu/news/view/269.
PAGE 18
State Renewable Portfolio Standard Goals
The Hawaii State Energy Office provides an overview of Hawaii’s progress toward its renewable energy goals.
In 2001, the State enacted Act 272 codified as §269-92 of the Hawaii Revised Statutes establishing the State’s
renewable portfolio standard (RPS). Since the law’s enactment, Hawaii’s RPS requirements grew along with the
innovation of renewable energy technologies; the law requires each electric utility in the State of Hawaii to
establish a renewable portfolio standard of 32:
10% RPS by 2010
15% RPS by 2015
30% RPS by 2020
40% RPS by 2030
70% RPS by 2040
100% RPS by 2045
Hawaii’s RPS grew significantly over the past decade as depicted in Figure 4. Hawaii’s most recent RPS milestone
was to achieve a 15% RPS by 2015, that year Hawaii’s renewable portfolio measured at 23.4%, 8% above the 2015
goal and on track toward the goal to have a 30% renewable portfolio standard by the year 2020.
State Energy-Efficiency Portfolio Standard Goals
Hawaii’s energy-efficiency portfolio standard (EEPS) was enacted in 2009 by Act 155, codified as §269-96 of the
Hawaii Revised Statutes. Similar to the renewable portfolio standard, the energy-efficiency portfolio standard
mandated a goal to reduce the statewide consumption of electricity by 4,300 giga-watt hours of electrical use by
the year 2030. This energy-efficiency portfolio standard law designates the State’s Public Utilities Commission to
be responsible for establishing standards that will maximize cost-effective energy-efficiency programs and
technologies as well as establish interim goals for electricity use reduction to be achieved by 2015, 2020, and
2025.33 According to a recent State of Hawaii Energy Efficiency Potential Study, published in 2014, the Hawaii
Public Utilities Commission set forth the following goals to achieve34:
1,375 giga-watts of energy efficiency savings by 2015
2,350 giga-watts of energy efficiency savings by 2020
3,325 giga-watts of energy efficiency savings by 2025
4,300 giga-watts of energy efficiency savings by 2030 (as required by HRS §269-96)
32 Hawaii Renewable Portfolio Standards Act. (2001). Hawaii Revised Statutes §269-92 (L 2001, c 272, §3; am L 2004, c 95, §5; am L 2006, c 162, §5; am L 2009, c 155, §3; am L 2015, c 97, §2). 33 Energy-Efficiency Portfolio Standards Act. (2009). HRS §269-96. 34 State of Hawaii, Public Utilities Commission. (2014). State of Hawaii Energy Efficiency Potential Study. Retrieved from: http://puc.hawaii.gov/wp-content/uploads/2013/04/State_of_HI_Potential_Study_Final.pdf.
8.6% 9.4% 9.5%
9.5%
11.9%13.7%
18.0%
21.1%
23.4%
26.6%
10% Goal 15% Goal0.0%
5.0%
10.0%
15.0%
20.0%
25.0%
30.0%
2007 2008 2009 2010 2011 2012 2013 2014 2015 2016
Hawaii Renewable Portfolio Standard Progress (2007-2016)
Renewable Portfolio Standard Mandated goal
Figure 4. Hawaii Renewable Portfolio Standard Progress (2007-2016). Sources: Hawaii Renewable Portfolio Standards Act, Hawaii State Energy Office
PAGE 19
Clean Energy within the Department of Education
The State Department of Education (DOE) launched a five year sustainability initiative in 2014, known as Ka Hei,
to integrate innovative energy technology with meaningful learning experiences, all while reducing energy costs.35
As a comprehensive energy and sustainability program, Ka Hei is at the core of DOE’s sustainability efforts.
Key objectives of the Ka Hei program include:
1. Reduce the cost and consumption of energy at all DOE public schools. 2. Build a diverse portfolio of new, clean, on-site energy generation. 3. Aggressively implement energy efficiency and conservation measures, including demand response. 4. Support the goals of the Hawaii Clean Energy Initiative and the DOE’s goal of 90 percent clean energy
by 2040.36 5. Leveraging these activities to create educational opportunities and stimulate the economy through
local construction labor. The Ka Hei Program supports the DOE’s sustainability goals, which are outlined in Board of Education (BOE) Policy 301-9, Sustainability 37:
The Department of Education (“Department”) has a fundamental responsibility to educate students about sustainability and to model sustainability. The Department shall establish regulations or guidelines to implement this policy. The regulations or guidelines shall include, but shall not be limited to: (1) establishing standards for facilities that ensure schools and Department facilities are
designed and operated in a manner that maximizes Hawaii’s natural environment and ensures the lowest environmental impact possible;
(2) incorporating energy efficiency and conservation measures whenever possible;
(3) reducing water consumption across facilities and utilizing grey water/storm water when possible;
(4) utilizing on-site renewable energy and adopting a series of clean energy goals that guides DOE to 90% Clean Energy by 2040:
25% clean energy by 2015 40% clean energy by 2020 80% clean energy by 2030 90% clean energy by 2040
(5) promoting the longevity and responsible procurement of facilities, equipment and vehicles;
(6) promoting material conservation and recycling across facilities;
(7) incorporating the importance of sustainability and environmental stewardship at the classroom level;
(8) conveying the mission of sustainability and environmental stewardship at the faculty and staff level;
(9) working with local partners to collaborate on projects, as well as informing the public on the efforts being made by the Department; and
(10) developing and implementing a plan for measuring implementation of the sustainability policy.
35 State of Hawaii, Board of Education. (2015). Board of Education Policy 301-9. Retrieved from: http://boe.hawaii.gov/policies/Board%20Policies/Sustainability.pdf . 36 Ibid. 37 State of Hawaii, Board of Education. (2017). Sustainability Policy. Retrieved from:http://boe.hawaii.gov/policies/6000series/Pages/6710.aspx.
PAGE 20
In addition to the goals set forth in the BOE policy on sustainability, the Hawaii State Legislature passed the
Sustainable Schools Initiative as Act 176 in 2016, codified as §302A-1510 of the Hawaii Revised Statutes, which
requires the DOE to establish a goal of becoming net-zero with respect to energy use by January 1, 2035.38
The Sustainable Schools Initiative sets the amount and value of energy consumed by the DOE across all public
school facilities during the 2015-2016 fiscal year as the benchmark for measuring progress toward this goal and
requires annual progress reporting to the Legislature.
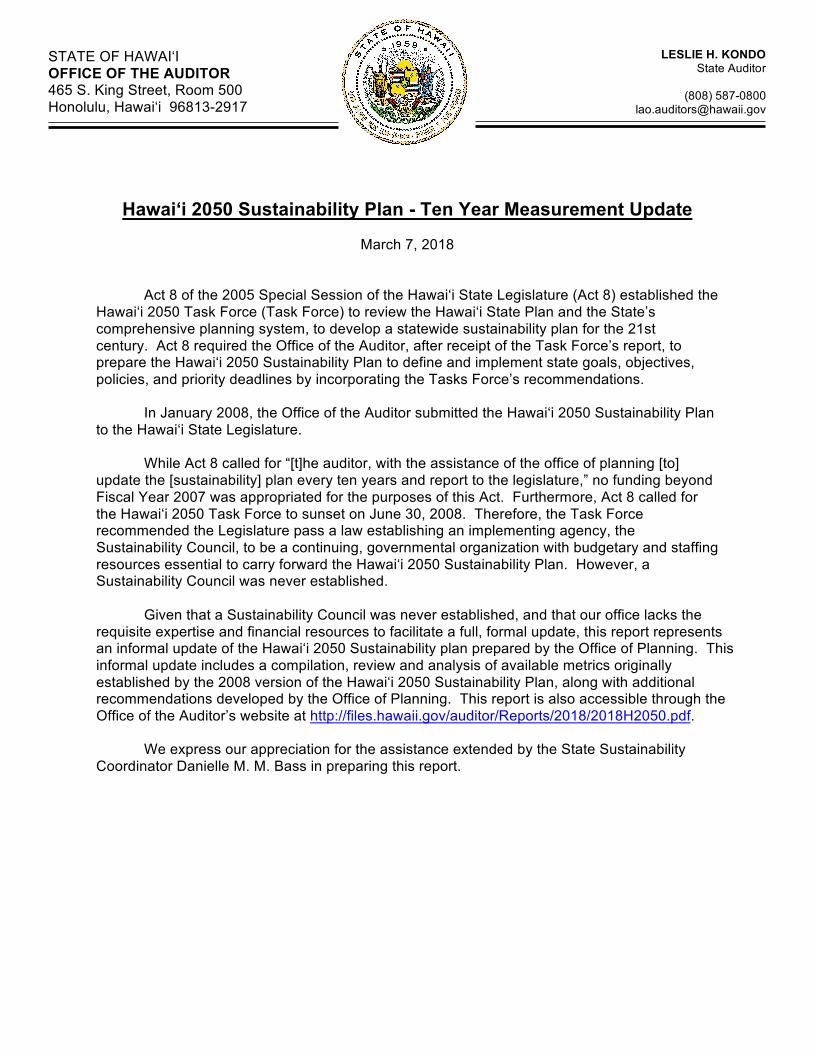
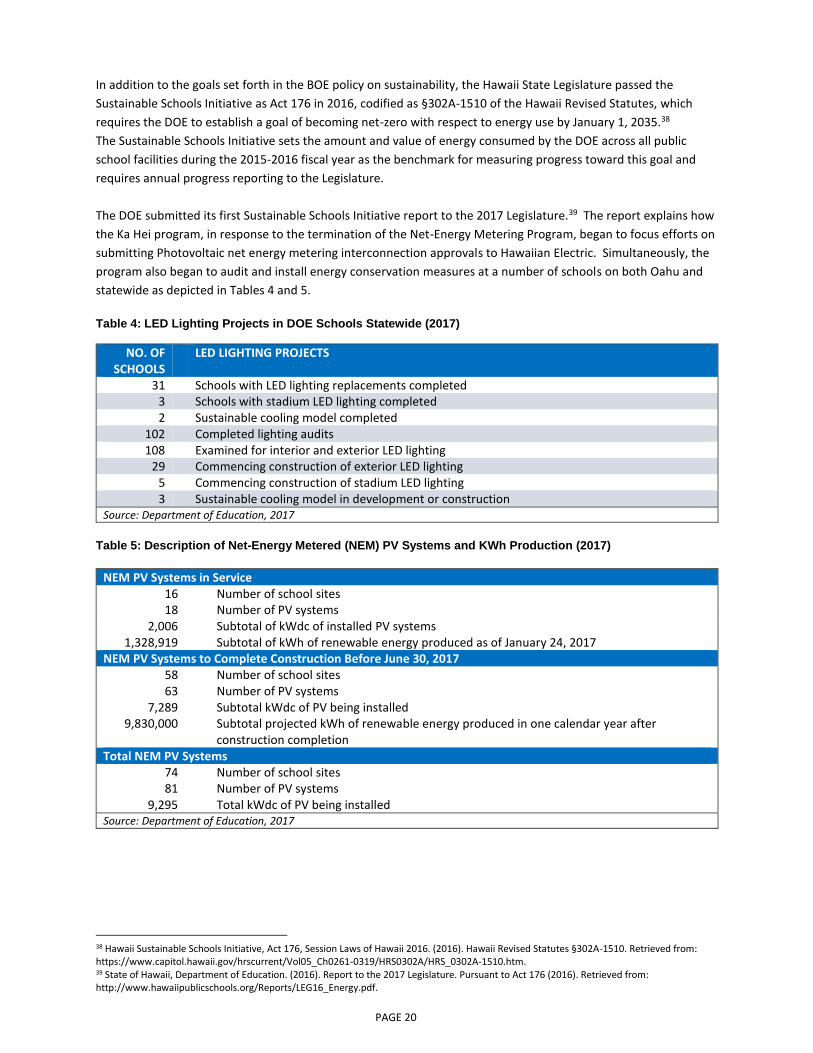
The DOE submitted its first Sustainable Schools Initiative report to the 2017 Legislature.39 The report explains how
the Ka Hei program, in response to the termination of the Net-Energy Metering Program, began to focus efforts on
submitting Photovoltaic net energy metering interconnection approvals to Hawaiian Electric. Simultaneously, the
program also began to audit and install energy conservation measures at a number of schools on both Oahu and
statewide as depicted in Tables 4 and 5.
Table 4: LED Lighting Projects in DOE Schools Statewide (2017)
NO. OF SCHOOLS
LED LIGHTING PROJECTS
31 Schools with LED lighting replacements completed 3 Schools with stadium LED lighting completed 2 Sustainable cooling model completed
102 Completed lighting audits 108 Examined for interior and exterior LED lighting
29 Commencing construction of exterior LED lighting 5 Commencing construction of stadium LED lighting 3 Sustainable cooling model in development or construction
Source: Department of Education, 2017
Table 5: Description of Net-Energy Metered (NEM) PV Systems and KWh Production (2017)
NEM PV Systems in Service 16 Number of school sites 18 Number of PV systems
2,006 Subtotal of kWdc of installed PV systems 1,328,919 Subtotal of kWh of renewable energy produced as of January 24, 2017
NEM PV Systems to Complete Construction Before June 30, 2017 58 Number of school sites 63 Number of PV systems
7,289 Subtotal kWdc of PV being installed 9,830,000 Subtotal projected kWh of renewable energy produced in one calendar year after
construction completion Total NEM PV Systems
74 Number of school sites 81 Number of PV systems
9,295 Total kWdc of PV being installed Source: Department of Education, 2017
38 Hawaii Sustainable Schools Initiative, Act 176, Session Laws of Hawaii 2016. (2016). Hawaii Revised Statutes §302A-1510. Retrieved from: https://www.capitol.hawaii.gov/hrscurrent/Vol05_Ch0261-0319/HRS0302A/HRS_0302A-1510.htm. 39 State of Hawaii, Department of Education. (2016). Report to the 2017 Legislature. Pursuant to Act 176 (2016). Retrieved from: http://www.hawaiipublicschools.org/Reports/LEG16_Energy.pdf.
PAGE 21
Heat Abatement within the Department of Education
In 2016, Act 47, Session Laws of Hawaii 2016, was enacted and appropriated $100 million to fund capital
improvement program equipment and installation costs for air conditioning, other heat abatement measures,
energy efficient lighting, and other energy efficiency measures at public school campuses.40
The DOE opted to use several different approaches to cool schools through both mechanical and passive means.41
These methods include:
(1) Solar-powered ventilators.
These are vents, installed either on roofs or high up on walls or windows that enable hot air to be vented out of classrooms allowing cooler air to come in. These solar-powered ventilators have been installed at the following schools:
Hokulani Elementary
Jarrett Middle
Kailua Intermediate (kitchen)
Kaiulani Elementary
Kamiloiki Elementary (solar wall vents)
Lunalilo Elementary (solar wall vents)
Molokai High
Noelani Elementary
Niu Valley Elementary (shop building)
Washington Middle
(2) Photovoltaic air conditioning. The DOE piloted an air conditioning project to cool a portable at Waianae High School. The unit is powered by photovoltaics. This allows the unit to generate its own electricity. Two more photovoltaic air conditioning systems funded through a crowd-funding program led by high school students, was installed on portables at Campbell High School.
(3) Solar light.
High efficiency skylights allow light into the classroom without the heat generated by electric lights. These eliminate, in some cases, the need for turning on classroom lights throughout the entire day. Solar lights were installed at Kaimuki High (including the portables), Ewa Makai Middle, and Hookele Elementary.
(4) Increased insulation.
Since 2005, the DOE facilities team has increased insulation in roofs and walls to reduce the amount of heat gain in DOE buildings. These improvements are done in conjunction with needed repairs.
(5) Roof coating system.
By painting roofs with a heat reflective roof coating system, it is possible to reduce interior temperatures by as much as 5 degrees. This system includes solar reflective properties. Sometimes, additional layers of insulation material reduce heat transferring into the classroom and minimize the impact of direct sunlight.
40 Act 47, Session Laws of Hawaii. (2016). Retrieved from: http://www.capitol.hawaii.gov/session2016/bills/SB3126_CD1_.pdf. 41 State of Hawaii, Department of Education. (2017). Heat Abatement Program at Public Schools. Retrieved from: http://www.hawaiipublicschools.org/ConnectWithUs/Organization/SchoolFacilities/Pages/Heat-Abatement.aspx.
PAGE 22
(6) Ceiling fan installation. As part of a Race to the Top-funded facilities effort in the “Zones of School Innovation,” ceiling fan installation targeted classrooms that were not already air conditioned, did not already have ceiling fans, and were used for student instruction. These classrooms are located at the following schools:
Leeward Oahu District:
Nanakuli Elementary (8 classrooms)
Nanakuli High & Intermediate (41 classrooms)
Waianae Elementary (2 classrooms)
Waianae Intermediate (42 classrooms)
Waianae High (57 classrooms)
Makaha Elementary (43 classrooms)
Leihoku Elementary (5 classrooms)
Kamaile Charter School (29 classrooms) Hawaii Island:
Kaʻu High & Elementary (7 classrooms)
Keonepoko Elementary (20 classrooms)
Pahoa Elementary (37 classrooms)
Keaau Middle (16 classrooms)
Pahoa High & Intermediate (59 classrooms)
Mountain View Elementary (14 classrooms)
Naalehu Elementary (21 classrooms)
Clean Biofuel Energy Powering State’s Daniel K. Inouye International Airport
Finally, the State Department of Transportation Airports Division and the Hawaiian Electric Company partnered to
launch their dual-operating emergency power facility at the Daniel K. Inouye International Airport in 2017.42 The
facility, which uses four generators running on biofuels to provide up to ten-megawatts of power, was built by and
is owned by the State of Hawaii. During non-emergencies, the facility is operated by Hawaiian Electric Company to
provide electricity to Honolulu’s grid. The power plant was designed to withstand a Category 5 hurricane and a
2,500-year recurrence earthquake.
42 State of Hawaii, Department of Transportation. (2017). Daniel K. Inouye International Airport Emergency Power Facility in Full Operation. [Blog post]. http://hidot.hawaii.gov/blog/2017/06/29/daniel-k-inouye-international-airport-emergency-power-facility-in-full-operation/.
PAGE 23
4. Increase Recycling, Reuse, and Waste Reduction Strategies
The State of Hawaii has a made many commitments to improve recycling for Hawaii’s sustainable future.
Since the early 1990’s, the State passed many recycling laws and goals, including:
Requires the State’s Department of Health’s Office of Solid Waste Management and the counties to
consider solid waste management practices and processing methods in the following order of priority 43:
1. Source Reduction
2. Recycling and bioconversion, including composting
3. Landfilling and incineration
The State Department of Health’s Office of Solid Waste Management notes that the first two practices
(source reduction and recycling, bioconversion, and composting, respectively) reduce the amount of
waste to be either landfilled or incinerated.44
HRS §103D-1005: Encouraging the use of Recycled Products through the Hawaii Public Procurement
Code: Requires that contracts shall be awarded to the lowest responsible and responsive bidder with
preference being given to the products containing recycled material.45
HRS §342G-41: Goals for Recycled Product Procurement:
Establishes the policy for all state and county public agencies to give preference to the purchase of
products made from recycled materials, that are themselves recyclable, and that are designed for
durability.46
HRS §342G-43: Reporting:
Each state agency that conducts its own procurement activities shall annually submit information and
data to the DOH-Office of Solid Waste Management regarding 47:
The agency’s progress in developing procurement programs;
The total amount of paper purchased during the year;
The amount of recycled goods purchased during the year compared to non-recycled
counterparts.
If an agency is unable to supply this information, the agency shall describe what steps it is taking to
obtain this information in the future.
(b) At the request of the DOH-Office of Solid Waste Management, each county shall provide a
similar report.
43 Hawaii Revised Statutes §342G-2. (1991). Solid Waste Management Priorities. Retrieved from: https://www.capitol.hawaii.gov/hrscurrent/Vol06_Ch0321-0344/HRS0342G/HRS_0342G-0002.htm. 44 State of Hawaii, Department of Health, Office of Solid Waste Management. (2015). 2016 Annual Report to the Legislature. Retrieved from: https://health.hawaii.gov/shwb/files/2013/06/2016_OSWM_Annual_Report.pdf. 45 Hawaii Revised Statutes §103D-1005. (1994). Recycled Products. (L 1994, c 186, pt of §1; am L 1997, c 352, §23). Retrieved from: https://www.capitol.hawaii.gov/hrscurrent/Vol02_Ch0046-0115/HRS0103D/HRS_0103D-1005.htm. 46 Hawaii Revised Statutes §342G-41. (1991).Goals for Recycled Product Procurement. Retrieved from: https://www.capitol.hawaii.gov/hrscurrent/Vol06_Ch0321-0344/HRS0342G/HRS_0342G-0041.htm. 47 Hawaii Revised Statutes §342G-43. (1991). Reporting. Retrieved from: https://www.capitol.hawaii.gov/hrscurrent/Vol06_Ch0321-0344/HRS0342G/HRS_0342G-0043.htm.
PAGE 24
HRS §342G-45: Establishment of an Office Paper and Other Materials Recovery Program:
By June 30, 1993, all state and county agencies shall establish an office paper and other materials
recovery program.48
HRS §342G-3: Recycling Goals:
Establishes a statewide goal to reduce the solid waste stream prior to disposal by 49:
25% by January 1, 1995,
50% by January 1, 2000 through source reduction, recycling, and bioconversion,
25% of the amount of office paper generated by all state and county agencies will be reduced by
January 1, 1995 through source reduction. The base year for calculating progress toward this
goal shall be total office paper consumption by state and county agencies in 1990.
The State Department of Health’s Office of Solid Waste Management provides annual reports to the Legislature
measuring the State’s progress toward achieving the recycling and waste reduction goal. In their annual reports,
the Office of Solid Waste Management calculates the amount of waste diversion performed by the counties.
For their measurement, “diversion” refers to the combination of reuse and recycling activities; it does not include
landfilling, incineration, or waste to energy processes. This diversion rate comprises recycling activity and a small
amount of reuse activity of each county’s tonnage of waste diverted.
According to these annual reports of Hawaii’s diversion rate. Hawaii has not yet met its goal to reduce the solid
waste stream by 50% by January 1, 2000. The most recent annual report from the State Department of Health’s
Office of Solid Waste Management indicates that the state achieved its highest diversion rate of 43% in 2015 over
the previous decade. These diversion percentages were compiled from the State Department of Health’s Office of
Solid Waste Management annual reports spanning from 2005 to 2016 and are depicted through Figure 5.
48 Hawaii Revised Statutes §342G-45. (1991). Establishment of an Office Paper and Other Materials Recycling Program. Retrieved from: https://www.capitol.hawaii.gov/hrscurrent/Vol06_Ch0321-0344/HRS0342G/HRS_0342G-0043.htm. 49 Hawaii Revised Statutes §342G-3. (1991). Goals. Retrieved from: https://www.capitol.hawaii.gov/hrscurrent/Vol06_Ch0321-0344/HRS0342G/HRS_0342G-0003.htm.
Figure 5. Statewide Diversion Rate (FY 2005-2015). Compiled from Hawaii State Department of Health Office of Solid Waste Management Annual Reports between 2005 and 2016.
The State Department of Health’s Office of Solid Waste Management explains that source reduction is also called
“waste prevention” or “waste reduction” and means creating less waste. Although not included in the list of
priorities directed in §342G-2 of the Hawaii Revised Statutes, “reuse” is also often popularly used to mean using a
product over without first having to reprocess it. The product may be used for its original or intended use, or may
be used in a different capacity.50 “Recycling” is the process by which materials are collected and used as "raw"
materials to create new products. All of these methods are sometimes referred to collectively as “waste
diversion.”51 Because waste reduction avoids creation of waste, it is inherently difficult to quantify. In some
cases, comparisons can be made to waste levels before a waste reduction practice was employed to waste levels
afterward. In most cases, an estimate of the amount of waste reduced is all that is possible.
Reuse of products or materials is marginally easier to measure than waste reduction because it involves actual
material. It can be measured counting the units of a particular product being reused or measuring its tonnage.
However, effectively measuring reuse is difficult because it takes place at so many levels and on an unregulated
and widespread scale. Take for example the reuse of plastic and glass containers for food storage at home or in
the workplace. While this particular activity contributes to overall waste reduction, it is impossible to accurately
measure.
Bioconversion/Composting
Bioconversion programs and laws have also been in existence since 1991 through §342G-45 and §342G-46 of the
Hawaii Revised Statutes. Figure 6 depicts the amount of organic matter (green waste, food waste, fats, oils and
grease used for biofuels) that was either bioconverted or composted by the counties of Hawaii, Honolulu, and
Kauai between 2009 and 2016. Bioconversion can direct organic materials, including plant and animal waste,
from landfills and wastewater systems and convert these materials into usable products.
50 State of Hawaii Department of Health, Office of Solid Waste Management. (2015). 2016 Annual Report to the Legislature. Retrieved from: https://health.hawaii.gov/shwb/files/2013/06/2016_OSWM_Annual_Report.pdf. 51 Ibid.
0
20,000
40,000
60,000
80,000
100,000
120,000
140,000
160,000
180,000
2010 2011 2012 2013 2014 2015 2016
Ton
s
Bioconversion/Composting (2010-2016)
County of Hawaii City and County of Honolulu County of Kauai
Figure 6. Bioconversion/Composting Amounts (2010-2016). Compiled from data provided by the City and County of Honolulu, the County of Hawaii, and the County of Kauai.
PAGE 26
Recycling
Figure 7 illustrates the compiled information provided by each county’s recycling efforts for the past seven years to
provide a statewide prospective of Hawaii’s recycling efforts by product.
A long standing recycling law is the State’s Glass Container Recovery Law, enacted in 1994 created the glass
advance disposal fee (ADF).52 The purpose of this fee was to encourage glass recycling, and for glass container
importers to pay an advance disposal fee to fund county recovery glass programs.
A recent State Auditor’s Report (17-04) reported that after glass importers pay their quarterly or annual advance
deposit fees to the State Department of Health, the fees are deposited into the ADF account within the
Environmental Management Special Fund.53 Those who import or manufacture fewer than 5,000 non-deposit
beverage glass containers per year, however, are exempt from the advance disposal fee. Around the beginning of
each fiscal year, the Department of Health’s Office of Solid Waste Management will estimate the revenue it
expects to collect for the remaining fiscal year based on revenues to date. The Department of Health’s Office of
Solid Waste Management then executes a contract with each of the counties based off this projection for the
implementation of the glass recycling program. Counties then pay the recycler to collect and transport non-
deposit beverage glass either to the U.S. mainland for recycling or reuse. The State distributes 90% of the ADF
revenues to counties based on each county’s population to fund their glass recovery programs. Each county is
required to run a glass recovery program, according to §342G-86 of the Hawaii Revised Statutes, which must
include some form of a glass incentive or “buyback” program to encourage participation.
52 Glass Container Recovery Act. (1994). Hawaii Revised Statutes §342G-Part VII. Retrieved from: https://www.capitol.hawaii.gov/hrscurrent/Vol06_Ch0321-0344/HRS0342G/HRS_0342G-0081.htm. 53 State of Hawaii, Office of the Auditor. (2017). Follow-Up on Recommendations from Report No. 14-16, Audit of the Department of Health’s Glass Advance Disposal Fee Program. Retrieved from: http://files.hawaii.gov/auditor/Reports/2017/17-04.pdf.
0
100,000
200,000
300,000
400,000
500,000
600,000
700,000
800,000
900,000
2009 2010 2011 2012 2013 2014 2015 2016
Ton
s
Statewide Recycling (by Product) (2009-2016)
Paper Organics Glass
Metals Plastics Tires
Electronic Waste Vehicle Batteries Construction & Demolition
Figure 7. Statewide Recycling (by Product) (2009-2016). Compiled from data provided by the City and County of Honolulu, the County of Hawaii, the County of Maui, and the County of Kauai.
PAGE 27
A 2014 State Audit of the State’s ADF Program provides nine recommendations for the Department of Health 54:
1. Work with the Legislature to update the State’s waste disposal goals to ensure the goals are
measurable and revised when necessary.
2. Work with the Legislature to clarify whether the purpose of the glass ADF is to fully or partially
fund county glass collection programs.
3. Adopt administrative rules that include, but are not limited to, recycling goals for non-deposit
glass, performance measures for the glass ADF, a schedule when counties are notified of ADF
allocations and formalizing contracts, reporting requirements and supporting documents, and a
process for returning unspent ADF funds at the end of the annual contract periods.
4. Adopt written procedures for the glass ADF program that include but are not limited to, contract
administration, accounting, enforcement and compliance, and the collection and compilation of
glass ADF data presented in annual reports to the Legislature.
5. Revise the scope of services in contracts with counties to include requiring supporting
documents for costs such as administrative costs and incentive rates.
6. It the DOH elects to retain reimbursement as a preferred method of payment, then it should
coordinate with counties to establish a new method for calculating ADF allocations that is timely
and accurate.
7. Require the City & County of Honolulu to return unspent ADF funds that were allocated in
previous years, taking into account that reserve ADF funds the county used in FY 2012 at the
department’s request.
8. Suspend allocation of glass ADF funding to the County of Kauai until the Department reaffirms
whether the buyback program required for counties to receive glass ADF funds is satisfied by
participation in the deposit beverage container 5₡ redemption system.
9. Continue to request from the Legislature funds to update the State’s integrated waste
management plan and additional staff to adequately administer the glass ADF.
The State Auditor’s 2017 Follow-up Report found that five of nine recommendations provided in 2014 were not
implemented.55 It is important to note that the State’s glass ADF program was significantly affected by the
implementation of the Deposit Beverage Container (HI-5 “Bottle Bill”) program. The Office of Solid Waste
Management’s 2016 Annual Report explains that on October 1, 2004, the glass deposit beverage containers were
transferred from the ADF program to the Deposit Beverage Container program; this transfer reduced the number
of containers covered by the ADF program by 80% and decreased the ADF’s revenue.56
54 State of Hawaii, Office of the Auditor. (2017). Follow-Up on Recommendations from Report No. 14-16, Audit of the Department of Health’s Glass Advance Disposal Fee Program. Retrieved from: http://files.hawaii.gov/auditor/Reports/2017/17-04.pdf. 55 Ibid. 56 State of Hawaii, Department of Health, Office of Solid Waste Management. (2015). 2016 Annual Report to the Legislature. Retrieved from: https://health.hawaii.gov/shwb/files/2013/06/2016_OSWM_Annual_Report.pdf.
PAGE 28
Deposit Beverage Container Program, “HI-5” Law
Contrary to the State’s ADF program is the well-known Deposit
Beverage Container “HI-5” 5₡ Law, was enacted in 2002 as Act
176 (“Bottle Bill”), codified as Chapter 342G, Part VIII of the
Hawaii Revised Statutes. The purpose of this law was to increase
participation in deposit programs, increase recycling rates for
specified deposit beverage containers, provide a connection
between manufacturing decisions and recycling program
management, and reduce litter. This law requires that
manufacturers and distributors of beverage containers be
responsible for paying deposits and fees into the Deposit
Beverage Container fund when they sell, donate, or otherwise
distribute beverages in applicable containers in Hawaii.
These manufacturers and distributors may pass on the deposits
and container fees they pay to their customers (retailers), who, in
turn, may pass on the costs to consumers. The deposit is 5₡ per
container and the fee is 1₡ per container on each eligible beverage
container manufactured in or imported into Hawaii.
The original container fee was 1.5₡ in September 2012, but was lowered effective September 2015 to 1₡ due to the
statewide redemption rates falling below 70%. In accordance to the Deposit Beverage Container Law, the State
Auditor produced six biennial financial and program audits of the State’s Deposit Beverage Container Program
since 2005.
The State Office of the Auditor’s 2017 Report No. 17-02 provides the following “HI-5” Deposit Container
Redemption Rates as depicted through Figure 8 57:
57 State of Hawaii, Office of the Auditor. (2017). Financial and Program Audit of the Deposit Beverage Container Program, June 30, 2016. Retrieved from: http://files.hawaii.gov/auditor/Reports/2017/17-02.pdf.
Figure 8. State Deposit Container Redemption Rates (2006-2016). Source: Hawaii State Auditor.
The State Auditor’s 2017 Report warns that the Deposit Beverage Container Program relies on self-reported data
from distributors and certified redemption centers and lacks adequate controls to monitor accuracy and
completeness of the information submitted by distributors and certified redemption centers. This lack of
adequate control exposes the program to risks of underpayments by distributors and overpayments to certified
redemption centers, either of which the State Auditor notes, exposes the program to fraud, results in higher costs,
and generates unreliable redemption rate reports, all of which result in financial harm to the State.58
Incineration
Hawaii’s many sustainability-related goals and laws call for both clean energy conversion while also pursuing
waste reduction goals. The Hawaii Clean Energy Initiative and the Hawaii 2050 Sustainability Plan both seek to
reduce fossil fuel use. While the Hawaii Integrated Solid Waste Management Act and the Hawaii 2050
Sustainability Plan seek to increase recycling, reuse, and waste reduction strategies, a recent debate revealed
some contention and conflict between the State’s clean energy goals and recycling goals.
A 2017 City and County of Honolulu Audit of the City’s Recycling Program (17-06) found that Honolulu’s market of
selling and buying recycled waste declined, and, as a result, the revenues from the sale of solid waste were
insufficient to offset the costs of processing the collected recycled waste.59 The City’s audit found that the City
was effective in its efforts to divert municipal solid waste and recycling. The audit also revealed that these efforts
have contributed significantly to landfill diversion. The audit suggested that solid waste disposal costs could be
reduced by diverting recycled waste to the H-POWER waste to energy facility.60
The Hawaii Integrated Solid Waste Management Act, however, defines “incineration” as a method of waste
disposal not recycling. Therefore, as stated in their 2016 Annual Report, the Department of Health’s Office of
Solid Waste Management cannot concur with the position that incineration is a form of recycling.61 Furthermore,
the Department of Health’s Office of Solid Waste Management explains that the hierarchy of solid waste
management practices defined in §342G-2 of the Hawaii Revised Statutes that incineration (or waste to energy)
should be considered after (1) source reduction and (2) recycling and bioconversion, including composting.62
The Department of Health’s Office of Solid Waste Management explains that if incineration is considered
recycling, there will be less of an incentive to retrieve recyclable materials for the creation of new products.63
Instead, these materials will be utilized solely for their energy value. The Department of Health’s Office of Solid
Waste Management recommends that such evaluations should be conducted in the next state Integrated Solid
Waste Management Plan, pending available funding.64
58 State of Hawaii, Office of the Auditor. (2017). Financial and Program Audit of the Deposit Beverage Container Program, June 30, 2016. Retrieved from: http://files.hawaii.gov/auditor/Reports/2017/17-02.pdf. 59 City and County of Honolulu, Office of the City Auditor. (2017). Audit of the City’s Recycling Program. https://www.honolulu.gov/rep/site/oca/oca_docs/City_Recycling_Program_Final_Report_rev._102717.pdf. 60 Ibid. 61 State of Hawaii, Department of Health, Office of Solid Waste Management. (2015). 2016 Annual Report to the Legislature. Retrieved from: https://health.hawaii.gov/shwb/files/2013/06/2016_OSWM_Annual_Report.pdf. 62 Ibid. 63 Ibid. 64 Ibid.
PAGE 30
Recycling Market
Worldwide waste generation rates are rising. According to the World Bank, the world’s cities generated 1.3 billion
tons of solid waste per year, which amount to a footprint of 2.6 lbs per person per day.65 A 2012 World Bank study
estimates that with rapid population growth and urbanization, municipal waste generation is expected to grow by
70% to 2.2 billion tons by 2025.66 A 2017 World Bank brief warns that poorly managed waste serves as a breeding
ground for disease vectors, contributes to global climate change through methane generation, and promotes
urban violence.67
Recycling in Hawaii has its limitations. Unless the materials can be economically recycled within Hawaii, they are
either shipped to the U.S. mainland, South Asia, or China. Scrap and waste are the sixth largest U.S. export to
China.68 China has long-served as the world’s recycling center. The Bureau of International Recycling China
estimated that in 2016, China imported 7.3 million tons of plastics and 27 million tons of waste paper from Europe,
the U.S., and Japan.69 However, in July 2017, China announced to the World Trade Organization that severe
restrictions prohibiting the import of recyclable materials including many variations of waste paper and plastics
would be effective by the end of 2017.70 By October 2017, the prohibition of importing the world’s paper and
plastic recyclables into China began and created a blockage of the global waste disposal system.71 As Hawaii
reflects upon its local recycling laws, goals, data, as well as the recent effects of the global recycling market, Hawaii
must also consider that Hawaii’s local recycling industry and market may need additional investment for local
reuse and recycling opportunities for a stronger sustainable future.
65 The World Bank. (April 2017). Brief: Solid Waste Management. Retrieved from: http://www.worldbank.org/en/topic/urbandevelopment/brief/solid-waste-management. 66 Hoornweg, Daniel; Bhada-Tata, Perinaz. 2012. What a Waste: A Global Review of Solid Waste Management. Urban Development Series; Knowledge Papers no. 15. World Bank, Washington, DC. Retrieved from: https://openknowledge.worldbank.org/handle/10986/17388. 67 The World Bank. (April 2017). Brief: Solid Waste Management. Retrieved from: http://www.worldbank.org/en/topic/urbandevelopment/brief/solid-waste-management. 68 CNN Money. (Sept 2017). China to US: Please Stop Sending Us Your Junk. Retrieved from: http://money.cnn.com/2017/09/11/news/china-scrap-ban-us-recycling/index.html. 69 BBC News. (October 2017). The Chinese Blockage in the Global Waste Disposal System. Retrieved from: http://www.bbc.com/news/business-41582924. 70 World Trade Organization. (July 2017). Catologue of Solid Wastes Forbidden to Import into China by the End of 2017. Retrieved from: https://resource-recycling.com/resourcerecycling/wp-content/uploads/2017/07/CHN1211.pdf. 71 BBC News. (October 2017). The Chinese Blockage in the Global Waste Disposal System. Retrieved from: http://www.bbc.com/news/business-41582924.
PAGE 31
5. Develop a More Diverse and Resilient Economy
The Hawaii 2050 Sustainability Plan emphasized that a sustainable Hawaii cannot occur without a sustainable
economy. The 2008 plan stressed the need to diversify Hawaii’s economy and to make the economy more
resilient in the face of an unpredictable future. The Hawaii 2050 Sustainability Plan suggested opportunities
including diversified agriculture, fisheries, and knowledge-and innovation-based industries like high tech,
healthcare, biotechnology, film and digital media as important factors in building a sustainable economy.
Hawaii’s Economic Diversification
A recent 2017 report published by the Economic Research Organization at the University of Hawaii (UHERO)
highlights the role of clusters in Hawaii’s economy through A New Perspective on Hawaii’s Economy:
Understanding the Role of Clusters.72 According to UHERO, a “cluster” is a regional concentration of related
industries that are connected by workforce, skillsets, technologies, and other industry connections. A cluster
analysis can help diagnose a region’s economic strength and challenges and can determine realistic ways to shape
the region’s economic future. Understanding clusters as important features of economies can make regions
uniquely competitive for jobs and private investment. Clusters consist of companies, suppliers, and service
providers, as well as government agencies and other institutions that provide specialized training and education,
information, research, and technical support.
Regional economies consist of two types of clusters: traded clusters and local clusters. Traded clusters are the
groups of similar industries that serve markets beyond the region where they are located. Traded clusters
compete in cross-regional markets and experience competition from other regions; they serve as the engines of
regional economies. Local clusters consist of industries which serve the local market. Both types of clusters work
together to support a healthy and prosperous regional economy.
Statewide Economic Clusters
UHERO’s A New Perspective on Hawaii’s Economy found that in 2014, 37% of Hawaii’s traded employment was a
part of strong traded clusters; this ranked Hawaii as 25th among all 50 states.73 Although typical states throughout
the U.S. have economies based on ten strong traded clusters, Hawaii only had three. As shown in Figure 9,
Hawaii’s three strongly traded clusters in 2014 were the hospitality and tourism cluster, the water transportation
cluster, and the jewelry and precious metals cluster. UHERO found that Hawaii’s hospitality and tourism cluster
was the largest and strongest of traded
clusters across the state, consisting of more
than 55,000 jobs in 2014. The other two
strongly traded clusters in Hawaii employed
less than 4,000 personnel.
72 The Economic Research Organization at the University of Hawaii. (2017). UHERO Report: A New Perspective on Hawaii’s Economy: Understanding the Role of Clusters. Retrieved from: http://www.uhero.hawaii.edu/assets/New_Perspective_Hawaii.pdf. 73 Ibid.
Figure 9. Statewide Traded Clusters (1998-2014). Courtesy: UHERO, data from US Cluster Mapping Project.
PAGE 32
Honolulu Economic Clusters
The City and County of Honolulu was found to have stronger traded clusters than the statewide clusters with a
count of nine strong traded clusters, employing 57% of total traded employment. As shown in Figure 10, the City
and County of Honolulu’s mix of industry is due to its role Hawaii’s most populated county while serving as the
central point of the State’s transportation networks, State Government, and federal defense interests; the report
found that Hawaii’s three other counties were more reliant upon the hospitality and tourism cluster. Honolulu’s
nine strong traded clusters were: hospitality and tourism, transportation and logistics, water transportation,
jewelry and precious metals, apparel, performing arts, footwear, insurance services, and education and knowledge
creation.74 According to the UHERO Report, only three of the nine strong traded clusters grew in Honolulu during
the 1998-2014 period; the education and knowledge creation cluster created the most jobs in the county, adding
3,550 jobs with an annual growth rate of 3%. The water transportation cluster added 542 jobs and experienced an
annual growth rate of 1%.
UHERO’s A New Perspective on Hawaii’s Economy explains Honolulu County differs from Hawaii’s three other
counties and most other U.S. regions because of the dominant role in federal defense spending in Honolulu’s
economy. Recently in Fiscal Year 2014, Honolulu County was populated with 67,354 military personnel while the
counties of Maui and Hawaii had 600 personnel, and Kauai County had 250 military personnel. Fiscal Year 2014
produced $6.7 billion in U.S. defense spending into the State of Hawaii, representing 9.9% of the state’s gross
domestic product (GDP), and 14% of the county’s GDP.
74 The Economic Research Organization at the University of Hawaii. (2017). UHERO Report: A New Perspective on Hawaii’s Economy: Understanding the Role of Clusters. Retrieved from: http://www.uhero.hawaii.edu/assets/New_Perspective_Hawaii.pdf.
Figure 10. Honolulu’s Traded Clusters (1998-2014). Courtesy: UHERO, data from the US Cluster Mapping Project.
PAGE 33
Maui County Economic Clusters
Contrary to Honolulu County, which enjoys the most diversified economy, Maui’s economic cluster reflected a
strong reliance on hospitality and tourism cluster, as shown in Figure 11. While Maui was found to be heavily
reliant on the hospitality and tourism cluster, three other strong clusters were identified by UHERO; however,
they only have a combined employment of 1,000 workers. These three other strong clusters between 1998 and
2014 were: the performing arts cluster which added around 700 jobs and enjoyed an annual growth rate of 13%,
the water transportation cluster, which grew at an annual growth rate of less than 2%, and music sound recording
cluster, which did not grow over the past 16 years yet remained a strong traded cluster for Maui. UHERO found
that since 71.8% of Maui’s total traded employment was in these four strong clusters.75
Kauai County Economic Clusters
Similar to Maui, Kauai County’s economic clustering heavily relies on the hospitality and tourism cluster, which
employs more than 6,000 workers. UHERO found that Kauai County had five strong traded clusters, including the
hospitality and tourism cluster, performing arts, fishing and fishing products, jewelry and precious metals, and
music and sound recording.76 Besides the hospitality and tourism cluster, the remaining four strong traded
clusters employ a total of 215 people. UHERO found that 62.9% of Kauai’s total traded workforce was in the
strong traded clusters. Of all of Kauai’s economic clusters, the education and knowledge creation cluster was
Kauai’s fastest growing cluster between 1998 and 2014 with an annual growth rate of 18%. Though the education
and knowledge cluster added 245 jobs, it was not one of the strong traded clusters. Kauai’s fastest strong traded
cluster was its performing arts cluster which added 135 jobs at an annual growth rate of 9%.
75 The Economic Research Organization at the University of Hawaii. (2017). UHERO Report: A New Perspective on Hawaii’s Economy: Understanding the Role of Clusters. Retrieved from: http://www.uhero.hawaii.edu/assets/New_Perspective_Hawaii.pdf. 76 Ibid.
Figure 11. Maui’s Traded Clusters (1998-2014). Courtesy: UHERO, data from the US Cluster Mapping Project.
Figure 12. Kauai’s Traded Clusters (1998-2014). Courtesy: UHERO, data from the US Cluster Mapping Project.
PAGE 34
Hawaii County Economic Clusters
Figure 13 shows Hawaii County’s hospitality and tourism cluster was also found to be one of four strong traded
clusters employing around 8,000 people on the island with the remaining three strong traded clusters: fishing and
fishing products, music and sound recording, and water transportation, employing under 250 people. UHERO
found that similar to Kauai and Maui, Hawaii County’s large hospitality and tourism cluster enables 54.2% of total
traded employment in the county’s strong traded clusters. Hawaii County’s fastest growing traded cluster was the
business services cluster with an annual growth rate of 9% adding 481 jobs to the economy.77
Emerging Economic Clusters
1) Education and Knowledge Creation Cluster
UHERO’s A New Perspective on Hawaii’s Economy: Understanding the Role of Clusters identified Hawaii’s education
and knowledge creation cluster as one of Hawaii’s fastest growing clusters between 1998 and 2014.78 Although
the education and knowledge creation cluster is not categorized as a strong traded cluster statewide, it was in the
top tier of job creating clusters for Honolulu’s, Kauai’s and Hawaii County’s economies. This cluster was the fastest
growing cluster for Kauai and Honolulu and was the second fastest growing in Hawaii County; it especially paid the
highest wage among all economic clusters in Hawaii County.
2) Energy Innovation Cluster
UHERO’s analysis considered the emergence of a Hawaii energy innovation cluster, primarily generated from
recent growth in the alternative electric power subcluster, comprised of businesses generating electricity through
geothermal, biomass, solar, wind, hydroelectricity, and other non-fossil fuels. The period of the study between
1998 and 2014 showed that 80 jobs in alternative electric power were added statewide, with the majority of these
jobs found in Hawaii County, providing Hawaii County with a high concentration in renewable energy employment
opportunities.79 UHERO noted that the electric power generation and transmission cluster remains a local cluster
throughout the state, and is not a traded or a strong traded cluster.
77 The Economic Research Organization at the University of Hawaii. (2017). UHERO Report: A New Perspective on Hawaii’s Economy: Understanding the Role of Clusters. Retrieved from: http://www.uhero.hawaii.edu/assets/New_Perspective_Hawaii.pdf. 78 Ibid. 79 Ibid.
Figure 13. Hawaii Island Traded Clusters (1998-2014). Courtesy: UHERO, data from the US Cluster Mapping Project.
PAGE 35
UHERO expects that Hawaii’s economy will significantly benefit if a transition of energy technologies lead to lower
electricity costs. Such a transition will allow Hawaii’s electric power generation and transmission cluster to grow
at the rate of Hawaii’s overall economy as a local cluster. To shift Hawaii’s electric power generation and
transmission from a local cluster to a traded cluster, UHERO suggested using Hawaii’s renewable energy goals to
stimulate research and development and innovation opportunities, which are traded clusters, to evolve into a
“Hawaii energy innovation cluster.”
UHERO identified that research and development and innovation opportunities within renewable energy in
Hawaii are emerging through the education and knowledge creation and the business services clusters. Industries
within research and development and innovation sectors, including Hawaii’s physical engineering and life sciences
industry, grew 39% in between 2001 to 2014; this was 14% greater than the industry’s national growth rate.
UHERO explained that state policies and the market drive for renewable energies pushed this economic
diversification. Hawaii’s counties are the most isolated markets compared to other U.S. counties, and Hawaii’s
renewable resources (wind, sun, and ocean) and high electrical costs have led to substantial investments to drive
Hawaii to become a leader in innovation in renewable energy generation and transmission.
Hawaii’s Targeted and Emerging Industries
The State’s Innovation Initiative through Act 148 in 2007, codified as §201-19 of the Hawaii Revised Statutes,
mandated DBEDT to create and update a database on defining and measuring Hawaii’s emerging industries and
develop appropriate outcome measures to assess the effectiveness of the State’s Innovation Initiative in
promoting economic diversification, growth, and stability in Hawaii.80 DBEDT published two reports in 2008 and
2011 to measure the economic diversification in Hawaii, these reports measured the earlier decades spanning
from 1990 - 2000, and 2000 - 2009.81,82 Since 2009, DBEDT suggested a range of economic activities as candidates
for diversifying the State’s economy through a “Targeted Industry Portfolio.” The portfolio industries were also
grouped into major areas of interest such as technology, creative, and agribusiness.83
Hawaii’s Targeted & Emerging Industries: 2016 Update illustrates how targeted industries have performed after
the recovery period of the recession. This update summarized the best performing targeted industry groups for
the 2006 - 2016 period in terms of their average growth and national competitiveness.
The Hawaii’s Targeted & Emerging Industries: 2016 Update found the following industries to be Hawaii’s best
performing targeted industry groups between 2006 and 2016 as depicted through Table 684:
1. Alternative Power Generation
2. Hospitals and Nursing Facilities
3. Film, TV, Video Production Distribution
4. Agricultural Inputs
5. Business Consulting
6. Technical Consulting Services
80 Hawaii Revised Statutes §201-19. Research and Statistics for Growth Industries. Retrieved from: https://www.capitol.hawaii.gov/hrscurrent/Vol04_Ch0201-0257/HRS0201/HRS_0201-0019.htm. 81 State of Hawaii, Department of Business Economic Development and Tourism, Research and Economic Analysis Division. (2008). Measuring Economic Diversification in Hawaii. Retrieved from: http://files.hawaii.gov/dbedt/economic/data_reports/EconDiversification/Economic_Diversification_Report_Final%203-7-08.pdf. 82 State of Hawaii, Department of Business Economic Development and Tourism, Research and Economic Analysis Division. (2011). Measuring Economic Diversification in Hawaii. Retrieved from: http://files.hawaii.gov/dbedt/economic/data_reports/reports-studies/2011-12-diversification.pdf. 83 State of Hawaii, Department of Business Economic Development and Tourism. (2009). Report to the 2009 Legislature: Efforts to Support Emerging Growth Industries. Retrieved from: http://files.hawaii.gov/dbedt/annuals/2009/PerformReport09Final.pdf. 84 State of Hawaii, Department of Business Economic Development and Tourism. (2016). Hawaii’s Targeted and Emerging Industries: 2016 Update Report. http://files.hawaii.gov/dbedt/annuals/2016/2016-targeted-industries.pdf.
PAGE 36
Table 6. Overall Performance of Hawaii’s Targeted Industry Portfolio (2006 – 2016)
HI Growth Initiative
The Department of Business Economic Development and Tourism’s (DBEDT) Hawaii Strategic Development
Corporation (HSDC) began the HI Growth Initiative in 2011 to develop a vibrant entrepreneurial ecosystem for
private sector investors. Between 2012 and 2016 the HI Growth Initiative established Hawaii as a viable place to
build competitive startups.85 Another UHERO Report, The Evolution of the HI Growth Initiative, published in 2016,
found 65 companies were funded as a result of the HI Growth Initiative. The average capital investment from the
State’s HI Growth Initiative was $160,000 per company, representing the cumulative investment of $10.8 million,
generating over $60 million in funding with over 150 Hawaii-based jobs.86,87
UHERO’s A New Perspective on Hawaii’s Economy reaffirmed that energy innovation industries grew rapidly over
the previous decade due to several factor conditions like the HI Growth Initiative and accelerator programs, home
demand conditions, a strong policy framework, and market competition, which support the growth of Hawaii’s
energy innovation cluster.88 UHERO recommended that government continue to serve as a convener of cluster
participants. Partnerships between the Hawaii Venture Capital Association, the Hawaii Strategic Development
Corporation, and the Hawaii Technology Development Corporation proved to be successful for emerging markets
and a diversified economy. Identifying common needs between Hawaii’s clusters like shared infrastructure and
services can strengthen Hawaii’s economy. UHERO concluded by recommending the development of a policy to
upgrade all of Hawaii’s clusters within the region will align with the government’s role in providing high quality
public goods and services.
85 State of Hawaii, Department of Business Economic Development and Tourism, Hawaii Strategic Development Corporation. (2017). HI Growth Initiative. Retrieved from: http://hsdc.hawaii.gov/hi-growth-initiative/. 86 The Economic Research Organization of the University of Hawaii. (2016). The Evolution of the Hawaii Growth Initiative. Retrieved from: https://hsdc.hawaii.gov/wp-content/uploads/2017/10/Evolution_HIGrowth_Initiative1.pdf. 87 The Economic Research Organization at the University of Hawaii. (2017). UHERO Report: A New Perspective on Hawaii’s Economy: Understanding the Role of Clusters. Retrieved from: http://www.uhero.hawaii.edu/assets/New_Perspective_Hawaii.pdf. 88 Ibid.
Source: Department of Business Economic Development and Tourism, “Hawaii’s Targeted & Emerging Industries: 2016 Update Report”.
PAGE 37
6. Create a Sustainability Ethic
The people of Hawaii have long embraced the practice of sustainability. In 1973, State Senator Kenneth (“Kenny”)
Brown spoke of the need for the “Mālama Ethic” (to take care of, to care for) in the planning of Hawaii’s future.
Through his practice of “Mālama Hawaii,” Sen. Kenny Brown envisioned a five-part model: a code of conduct for
communities that integrated social justice, environmental protection, health and wellness, business, and
education. This Mālama Ethic was the foundation of Hawaii’s historical sustainability ethic. The 1978
Constitutional Convention amended the Hawaii State Constitution to focus on Hawaii’s self-sufficiency:
For the benefit of present and future generations, the State and its political subdivisions shall
conserve and protect Hawaii's natural beauty and all natural resources, including land, water,
air, minerals and energy sources, and shall promote the development and utilization of these
resources in a manner consistent with their conservation and in furtherance of the self-
sufficiency of the State. All public natural resources are held in trust by the State for the benefit
of the people. (Hawaii State Constitution, Article XI, Section 1)
Similarly, during 1978, the Hawaii State Planning Act was signed into law with its State goals being aligned
with sustainable practices of balancing Hawaii’s economy, environment, and social and cultural well -being:
1. A strong, viable economy, characterized by stability, diversity, and growth that enables the
fulfilment of the needs and expectations of Hawaii’s present and future generations.
2. A desired physical environment, characterized by beauty, cleanliness, quiet, stable natural
systems, and uniqueness that enhances the mental and physical well-being of the people.
3. Physical, social, and economic well-being, for individuals and families in Hawaii that nourishes
a sense of community responsibility, or caring, and of participation in community life.
(Hawaii Revised Statutes §226-5)
Thirty years later, in 2008, the Hawaii 2050 Sustainability Plan was written and identified that 85% of Hawaii’s
residents considered sustainability to be a “critically important” issue to the state (p.66). The plan called for the
creation of a Sustainability Council to assist the coordination, marketing, and implementation of the Hawaii
2050 Sustainability initiatives and recommendations throughout Hawaii’s state and county governments, the
private sector, and cross-sector.89 Yet, over the past decade, the Sustainability Council was never established.
In 2011, the Hawaii State Planning Act was amended to direct priority guidelines and principles for the Hawaii
State Plan to promote sustainability. The Hawaii State Planning Act’s priority guidelines and principles of
sustainability are found in §226-108 of the Hawaii Revised Statutes, and are consistent with the Hawaii 2050
Sustainability Plan’s “Guiding Principles of Sustainability” (p.14).
89 Hawaii 2050 Sustainability Task Force. (2008). Hawaii 2050 Sustainability Plan. Retrieved from: http://www.oahumpo.org/wp-content/uploads/2013/02/Hawaii2050_Plan_FINAL.pdf.
PAGE 38
Hawaii’s sustainability priority guidelines and principles for the Hawaii State Planning Act are found in §226-108 of
the Hawaii Revised Statutes, as follows 90:
HRS §226-108 Sustainability. Priority guidelines and principles to promote sustainability shall include:
(1) Encouraging balanced economic, social, community, and environmental priorities;
(2) Encouraging planning that respects and promotes living within the natural resources and limits of
the State;
(3) Promoting a diversified and dynamic economy;
(4) Encouraging respect for the host culture;
(5) Promoting decisions based on meeting the needs of the present without compromising the
needs of future generations;
(6) Considering the principles of the ahupua‘a system; and
(7) Emphasizing that everyone, including individuals, families, communities, businesses, and
government, has the responsibility for achieving a sustainable Hawaii.
Later in 2014, the State’s support for sustainability was reaffirmed through the passage of Senate Concurrent
Resolution 69, endorsing and supporting the Aloha+ Challenge, which was an integrated approach focusing on six
ambitious targets related to clean energy, local food, natural resource management, waste reduction, smart
sustainable communities, and green workforce development.91 The same legislative resolution tasked the Hawaii
State Sustainability Coordinator to submit a report to the Legislature on the launch of the Aloha+ Challenge, which
included recommendations for promoting action and tracking progress on the statewide sustainability targets.92
The temporary State Sustainability Coordinator position was vacated in April 2015 and was not re-established until
June 2017. Through these many governmental transitions over the past six years, a myriad of local community
groups, businesses, and non-profits continued this effort for governmental, economic, and community-led
sustainable practices in Hawaii.
During this time period, in May 2014, the Polynesian Voyaging Society embarked their Polynesian double-hulled
voyaging canoes, Hōkūle‘a and Hikianalia, for their “Mālama Honua” voyage, a three year circumnavigation of the
Earth to bring global attention to the need to take care of our Island Earth.93 The Polynesian Voyaging Society’s
mission through Mālama Honua sought to engage communities worldwide on practicing to live sustainability while
sharing the Polynesian culture, learning from the past and from each other, creating global relationships, and
inspiring action to care for our Island Earth. After successfully visiting more than 150 ports, 23 countries and
territories, and travelling a combined 60,000 nautical miles in three years, Hōkūle‘a and Hikianalia returned to
their home in Hawaii in June 2017, to teach the people of Hawaii, Mālama Honua: to take care of our Island Earth
sustainably, and Mālama Hawaii: to take care of Hawaii sustainably. 94
Thanks to the leadership of Polynesian Voyaging Society and Hawaii’s many sustainability-advocacy groups,
Hawaii’s sustainability ethic remains strong. The government, however, needs to create a stronger legislative
framework establishing a permanent government sustainability entity and direct responsibilities, authorities, and
provide programmatic funding to this government sustainability coordinating entity. This can ensure consistency
in the coordination and implementation of the many sustainability initiatives and recommendations established
through the Hawaii State Planning Act’s sustainability priority guidelines and principals, the Hawaii 2050
Sustainability Plan’s goals and indicators, and the State’s Aloha+ Challenge targets to ensure consistency of all
these statewide sustainability goals throughout Hawaii’s state and county governments.
7. Increase Production and Consumption of Local Foods and Products, Particularly Agricultural Products
The Hawaii 2050 Sustainability Plan found that food self-sufficiency is one of the foundations of a sustainable
economy.95 The 2008 Hawaii 2050 Sustainability Plan measured that about 15% of the food consumed in Hawaii
was grown locally, and 35% of the fruits and vegetables consumed were locally grown. The plan further
suggested that a benchmark of 30% of food consumed could be grown locally and 85% of fruits and vegetables
consumed could be locally grown by 2020, according to the UH College of Tropical Agriculture and Human
Resources
(CTAHR). 96
The State of Hawaii’s Office of Planning published in 2012 the Increased Food Security and Food Self-Sufficiency
Strategy as a recommendation to increase Hawaii’s food self-sufficiency by increasing the amount of locally
grown food consumed by Hawaii residents, which are components to Hawaii’s food security. The publication
warned that Hawaii became less food self-sufficient over the past thirty years. The strategy document
recounted the food conditions in 201297:
Vegetables: watercress, Chinese cabbage, mustard cabbage, green onions, choi sum, shanghai pak-choi, shijuku, malunggay leaves, and yard-long beans were close to self-sufficiency. Tomatoes, sweet potato, cucumber, and sweet corn were supplied 75% by local farmers; while lettuce and other vegetables were imported.
Fruit: Watermelon, papaya, pineapple, and banana meet much of resident demand in Hawaii. Local residents’ backyards provided a healthy supply of mango, and tropical-exotic fruit such as lychee, rambutan, and jack fruit. Other types of fruits were mostly imported, and there was a market potential for blueberries, dragon fruit, and pomegranate.
Livestock: Cattle numbers decreased steadily between 1970 and 2001, stabilized in 2002, and gradually increased between 2002 and 2006. A compilation of the USDA’s National Agricultural Statistics Services data reflects, however, a gradual decline of raw meat produced by Hawaii cattle over the past decade from 5,000 lbs in 2007 to 4,200 lbs in 2016.
Dairy: In 1970, there were 120 local milk operations, and Hawaii was self-sufficient in milk; however, in 2009, 15 dairies remained. By 2012, there were only two dairies in operation.
Hogs and Pigs: the 2012 self-sufficiency strategy notes that there was a steady decline of hogs and pigs between 1970 and 2009; however, there was no information available on the amount of local demand met by local supply.
Egg Farms: In 1970, there were 240 egg farms, and Hawaii was self-sufficient in egg production. By 2009, there were only 100 egg farms still in operation. Presently, the USDA National Agricultural Statistics Service is unable to disclose egg production data to avoid disclosure of individual operations.
95 Hawaii 2050 Sustainability Task Force. (2008). Hawaii 2050 Sustainability Plan. Retrieved from: http://www.oahumpo.org/wp-content/uploads/2013/02/Hawaii2050_Plan_FINAL.pdf. 96 Ibid. 97 State of Hawaii, Office of Planning. (2012). Increased Food Security and Food Self-Sufficiency Strategy. Retrieved from: http://files.hawaii.gov/dbedt/op/spb/INCREASED_FOOD_SECURITY_AND_FOOD_SELF_SUFFICIENCY_STRATEGY.pdf.
PAGE 40
The Office of Planning’s 2012 Food Security and Food Self-Sufficiency Strategy recommended the following actions to improve Hawaii’s food self-sufficiency:
Demand
1. Expand the “Buy Local/It Matters” marketing campaign as to promote the benefits of buying local foods.
2. Expand and improve branding and 40 labelling programs and provide consumer education.
3. Encourage public institutions to purchase locally grown foods. Establish a pilot program in the charter schools.
4. To address food safety issues, increase the farm food safety coaching program and farm food safety certifiers.
Production
1. To increase production of locally grown foods, improve agricultural infrastructure including agricultural parks, irrigation systems and distribution systems/facilities.
2. Support the Agricultural Park Program, which provides public lands at reasonable cost and long-term tenure to farmers, and complete the transfer of agricultural lands from the Department of Land and Natural Resources (DLNR) to the Department of Agriculture (DOA).
3. Support Capital Improvement Project (CIP) funding to repair and maintain State irrigation systems since these systems provide water at low cost to farmers.
4. Encourage a variety of distribution systems to move goods to the market place. Nationally, direct consumer sales, farmers’ markets, community-supported agriculture organizations and farm-to-school programs have all increased.
5. Support multi-functional food hub facilities or food incubator facilities to handle aggregation, processing, treatment, and distribution.
6. To build the agricultural workforce, continue the “Green Jobs Initiative” which provides workforce development services for the agricultural, energy, natural resources, and related industries.
Policy and Organization
1. Restore the Market Analysis and News Branch of DOA to track progress toward food self-sufficiency.
2. Adopt legislation to establish an Agricultural Development and Food Security Program.
3. The Strategy also contains recommendations to provide for pest prevention and control, research and extension services, and policy and organizational support. The proposed Agricultural Development and Food Security Program will help to coordinate and direct efforts to address food self-sufficiency
4. A critical factor toward successful implementation will be building partnerships with the increasing number of organizations involved in food self-sufficiency/food security.
PAGE 41
A majority of these 2012 recommendations were not funded or implemented over the past five years. Although
a recent 2015 Statewide Agricultural Land Use Baseline was published by the University of Hilo and prepared for
the State Department of Agriculture, this baseline reflects Hawaii’s agricultural footprint through land use,
compilation, and the study of agricultural acreage.98 This baseline does not measure the amount of local food
production or local food consumption.
The Hawaii 2050 Issue Book, published in support of the Hawaii 2050 Sustainability Plan, explained that neither
the State’s Department of Agriculture nor the Department of Business Economic Development and Tourism have
an index or measure the amount of Hawaii’s imported food consumption.99 The Hawaii 2050 Issue Book
explained that in 2008, Hawaii’s limited land supply would stress Hawaii’s ability to produce enough local food to
be near self-sufficiency and recommended the need to use our agricultural lands more prudently, as competing
uses for good farmland will affect Hawaii’s local food sustainability and self-sufficiency.100
The Increased Food Security and Food Self-Sufficiency Strategy 2012 report, estimated that 80-90% of Hawaii’s
food was imported and made Hawaii particularly vulnerable to natural disasters and global events that could
disrupt shipping and our local food supply.101 The strategy emphasized that the economic impact of food import
replacement is significant. For instance, if Hawaii was able to replace 10% of the food imported, this would
amount to approximately $313 million, assuming a 30% farm share, $94 million would be realized at the
farm-gate, which would generate an economy-wide impact of an additional $188 million in sales, $47 million in
earnings, $6 million in state tax revenues, and more than 2,300 jobs (in 2012 dollars).102
The following chart attempts to measure Hawaii’s local agricultural production over the past ten years. It is
important to note that due to budgetary cuts and the reduction-in-force of the State Department of Agriculture in
2009, State agricultural statistical positions were cut and Federal U.S. Department of Agriculture (USDA)
reorganizations in 2012 regionalized USDA statistical measuring. Since 2012, Hawaii has relied on two USDA
employees to perform surveying and statistical analysis of our statewide local food production. Over the last ten
years, there was a drop of annual surveys of Hawaii’s local food production. Increased funding for State
agricultural statisticians would likely increase the availability of local agricultural annual production surveys.
98 State of Hawaii, Department of Agriculture, produced by the University of Hilo, Spatial Data Analysis & Visualization Research Lab. (2015). Statewide Agricultural Land Use Baseline, 2015. Retrieved from: http://hdoa.hawaii.gov/salub/. 99 Hawaii 2050 Sustainability Task Force. (2007). Hawaii 2050 Issue Book: Building A Shared Future. Retrieved from: http://hipaonline.com/images/uploads/HI2050_Issue_Book.pdf. 100 Ibid. 101 State of Hawaii, Office of Planning. (2012). Increased Food Security and Food Self-Sufficiency Strategy. Retrieved from: http://files.hawaii.gov/dbedt/op/spb/INCREASED_FOOD_SECURITY_AND_FOOD_SELF_SUFFICIENCY_STRATEGY.pdf. 102 Ibid.
PAGE 42
The following local agricultural food production s were compiled through many U.S. Department of Agriculture
annual reports, annual summaries, and Statistics of Hawaii Agriculture books:
-
20,000,000
40,000,000
60,000,000
80,000,000
100,000,000
120,000,000
140,000,000
160,000,000
180,000,000
200,000,000
2007 2008 2009 2010 2011 2012 2013 2014 2015 2016
Pro
du
ctio
n in
Po
un
ds
Production by Year
Hawaii Local Agricultural Production (2007-2016)
Hawaii Tropical Fruits & Specialties Hawaii Vegetable and Melon Crops Aquaculture
Coffee Macademia Nuts Cattle (raw meat)
Milk Hogs & Pigs Taro
Avocados Bananas Papayas
Figure 14. Hawaii Local Agricultural Production (2007-2016). Sources: The USDA National Agricultural Statistics Service Hawaii Field Office; USDA 2016 State Agricultural Overview; 2012 USDA Census of Agriculture for Hawaii; the 2008, 2009, 2010, 2011 USDA Statistics of Hawaii Agriculture Books; 2017 USDA Hawaii Tropical Fruit and Crops Report; 2013 USDA Hawaii Vegetable and Herb Report; the 2015, 2016, 2017 USDA Hawaii Vegetable and Melon Crops Reports; the 2008, 2009, 2010, 2011, and 2016-2017 USDA Coffee Marketing Estimate Reports; and the 2011-2012, 2016-2017 USDA Hawaii Macadamia Nuts Final Season Estimates Reports.
PAGE 43
Table 7: Compilation of Hawaii Local Agricultural Production (2007 – 2016)
It is important to note that the agricultural production data do not include all production quantities due to: the
reduction of agricultural statistical surveyors, a potential cash economy, non-recurring annual statistical surveying
data, and private residential agricultural growth. The data do not measure the amount of locally produced food,
which is either consumed locally or exported. Furthermore, this measurement of local agricultural production
does not necessarily represent “food” (for example: whether macadamia nuts and coffee yields provide a
sustainable food source for the people of Hawaii). By including Figure 14 and Table 7, this report attempts to
provide a basic compilation of local agricultural production levels to encourage further discussion of
strengthening future policies, planning, and funding to establish an official statewide agricultural baseline of local
food production and local food consumption, compared to our agricultural exports.
NOTES: (1) 2007-2010 Hawaii Vegetable and Melon Crops are not comparable to 2011-2016, therefore were not included in this report. (2) 2007-2011 expressed in parchment equivalent pounds. Coffee marketed in cherry form was converted to an equivalent parchment
weight and added to parchment marketings. (3) 2014-2016 measured on cherry-basis. (4) USDA-NASS measures in tons, to be consistent with other data in this measurement, the tonnage was converted into pounds for this
report. ** Does not include unreported production data. Some production may be unmeasured due to the reduction of agricultural surveyors, a
potential cash economy, non-recurring annual statistical surveying data collection, and private residential agricultural production.
*** Does not include production data of certain commodities to be shown separately to avoid disclosure of individual operations. **** Does not include historic sugar production between 2007 and 2016. Local sugar production from Hawaii’s sugar industry ended with its last harvest on Dec. 12, 2016.
Sources: The USDA National Agricultural Statistics Service Hawaii Field Office; USDA 2016 State Agricultural Overview; 2012 USDA Census of Agriculture for Hawaii; 2011 USDA Statistics of Hawaii Agriculture Book; 2017 USDA Hawaii Tropical Fruit and Crops Report; 2013 USDA Hawaii Vegetable and Herb Report; the 2015, 2016, 2017 USDA Hawaii Vegetable and Melon Crops Reports; the 2008, 2009, 2010, 2011, and 2016-2017 USDA Coffee Marketing Estimate Reports; and the 2011-2012, 2016-2017 USDA Hawaii Macadamia Nuts Final Season Estimates Reports.
PAGE 44
8. Provide Access to Long-Term Care and Elderly Housing
Considering the increasing pressure on State budgets of institutional long-term care and the increasing inability of
most families to plan for paying institutional care costs, the Legislature passed Act 224 in 2008. Act 224
established the Hawaii Long-Term Care Commission which reviewed the breadth of measures possible for funding
long-term care in Hawaii.103 In 2011, the Commission released its final report in response to the legislative
directive.
The 2011 report to the Hawaii Long Term Care Commission provides An Overview of Long-Term Care in Hawaii.104
The report found that Hawaii’s elderly population is projected to increase significantly over the next two decades.
The Hawaii Long Term Care Commission projected an increase in the population aged 65 and older—and
particularly people aged 85 and older—will lead to an increase in the number of people needing long-term care.
Table 8: Elderly Population in Hawaii, 2007 and 2030
Population 2007 2030
Total Population 65+ 185,622 326,957
Percent of Overall Population 14% 22.3%
Total Population 85+ 26,294 48,254
Percent of Overall Population 2% 3.3%
Source: Hawaii Long Term Care Commission Final Report 2011, and American Health Care Association’s “The state long-term health care sector, characteristics, utilization, and government funding: 2010 update.”
According to the Executive Office on Aging’s 2017-2019 Hawaii State Plan on Aging, Hawaii’s older adult population
(of ages 60 years old and over) continues to increase. The Hawaii State Plan on Aging predicts that by 2020, 1-in-4
residents of Hawaii will be 60 years or older depicted in Table 9.105
Table 9: Population Distribution Projections for the United States and Hawaii by Age Groups, 2015 and 2020
Age Group 2015 2020
United States 1
Hawaii 2 United States 1
Hawaii 2
60 years and older 20.8% 23.5% 23.2% 25.8%
60 – 64 years old 5.9% 6.5% 6.3% 6.5%
65 – 74 years old 8.6% 9.6% 9.9% 11%
75 – 84 years old 4.3% 4.8% 5% 5.6%
85 years and older 2% 2.6% 2% 2.7%
Source: 2017-2019 Hawaii State Plan on Aging: (1) U.S. Census Bureau, (2) Department of Business Economic Development and Tourism
103 Act 224. Session Laws of Hawaii 2008. (2008). Establishing the Hawaii Long Term Care Commission. Retrieved from: https://www.capitol.hawaii.gov/session2008/bills/SB3255_CD1_.htm. 104 Hawaii Long Term Care Commission. (2011). An Overview of Long-Term Care in Hawaii, Final Report for the Hawaii Long Term Care Commission. Retrieved from: http://www.publicpolicycenter.hawaii.edu/projects-programs/_long-term-care/RTI_Overview_of_LTC_System-FINAL.pdf. 105 State of Hawaii, Department of Health, Executive Office on Aging. (2016). 2017-2019 Hawaii State Plan on Aging. Retrieved from: https://www.mediafire.com/file/y6cj61v3276tcbe/ExtensionPlan.pdf.
PAGE 45
Although these projections do not necessarily project that the population increase will require long term care
and elderly housing, these projections do reveal the increase in Hawaii’s aging population, which will increase
the demand for home and community-based services. The 2017-2019 State Plan on Aging notes that the growing
number of older adults is likely to put a severe strain on the State’s resources for and system of long-term
supports and services.106
One of the goals in the Executive Office on Aging’s 2017-2019 State Plan on Aging describes the need to develop
“a statewide Aging and Disability Resource Center (ADRC) system for older adults and their families to access and
receive long-term services and supports within their counties” (Goal 3, p. 24). To fulfill this goal, the Executive
Office on Aging plans to have a statewide fully functioning ADRC. This ADRC is a system that provides older
adults and their caregivers and persons with disabilities with a single access point to information on the full
range of long-term support and benefits.107 The ADRC began in 2006 through various grant funding awarded to
the Executive Office on Aging and was adopted by the State Legislature in 2013 by codifying the ADRC into
§349-31 of the Hawaii Revised Statutes.108
Long-term care comprises a range of services from licensed skilled nursing services to homemaker and chore
services. The major service types discussed below are used primarily by older people and younger persons with
physical disabilities.
The Hawaii Long Term Care Commission’s 2011 report noted that in 2010, Hawaii had 48 nursing homes with
4,191 beds certified to participate in Medicare or Medicaid.109 A total of 3,889 individuals resided in these
nursing facilities in 2010.110
Nursing Home Facilities
Hawaii has a much lower supply of nursing home beds relative to its elderly population than other states.
In 2009, Hawaii had 43.4 nursing home beds per 1,000 persons aged 75 and older, compared to the national
average of 88.9 nursing home beds per 1,000 persons aged 75 and older.111 Between 1997 and 2009, the
nursing bed/population ratio declined, both nationally and in Hawaii.112
The Hawaii Long Term Care Commission’s 2011 report provided possible explanations of this decline between
the nursing bed and population ratio is the high amount of three-generation households in the state combined
with a strong tradition of informal caregiving has resulted in low demand for nursing home care. Another
explanation is that the high cost of real estate and construction needed to expand existing facilities or build
new ones constrains the number of nursing home beds.113
106 State of Hawaii, Department of Health, Executive Office on Aging. (2016). 2017-2019 Hawaii State Plan on Aging. Retrieved from: https://www.mediafire.com/file/y6cj61v3276tcbe/ExtensionPlan.pdf. 107 State of Hawaii, Department of Health, Executive Office on Aging. (2016). Report to the 2017 State Legislature. Retrieved from: http://health.hawaii.gov/opppd/files/2016/10/Act-138-EOA-Annual-Report-111416.pdf. 108 Hawaii Revised Statutes §349-31. (2012). Aging and Disability Resource Centers Program. Retrieved from: https://www.capitol.hawaii.gov/hrscurrent/Vol07_Ch0346-0398/HRS0349/HRS_0349-0031.htm. 109 American Healthcare Association. (2010). LTC stats: Nursing facility operational characteristics report: September 2010 Update. Washington, DC: American Health Care Association. Retrieved from: http://www.ahcancal.org/research_data/oscar_data/Nursing%20Facility%20Operational%20Characteris tics/OperationalCharacteristicsReport_Sep2010.pdf. 110 Hawaii Long Term Care Commission. (2011). An Overview of Long-Term Care in Hawaii, Final Report for the Hawaii Long Term Care Commission. Retrieved from: http://www.publicpolicycenter.hawaii.edu/projects-programs/_long-term-care/RTI_Overview_of_LTC_System-FINAL.pdf. 111 Ibid. 112 Ibid. 113 Ibid.
PAGE 46
Reflecting upon the high cost of nursing homes in Hawaii, in 2010, 70% of Hawaii’s nursing home residents were
eligible for Medicaid compared to the national average of 63.6%.114 Moreover, the Hawaii Long Term Care
Commission’s 2011 report explained that fewer Hawaii nursing home residents have their care covered by
Medicare: 9.2% of residents in Hawaii compared to 14.2% for the nation as a whole.115 A total of 20.9% of
residents in Hawaii paid out of pocket or through another payer compared to 22.2% of residents for the country as
a whole.116
Hawaii has a very complex system of community-based residential care settings. These include Adult Residential
Care Homes (ARCHs), Expanded ARCHs, Community Care Foster Family Homes (CCFFHs), and assisted living
facilities. Unless specifically licensed or certified to provide a higher level of care, these homes provide room and
board, supervision, and limited assistance with personal care and health-related needs.117
Adult Residential Care Homes
ARCHs are licensed by the Hawaii Department of Health. In addition to room and board, ARCHs provide limited
assistance with ADLs, custodial care, and supervisory oversight. Type I ARCHs care for up to 5 residents in a private
home; Type II ARCHs care for 6 or more residents in larger, more institutional settings that may care for as many as
50 to 60 residents.118 An expanded ARCH is an adult residential facility licensed to admit individuals who require a
nursing home level of care. As of November 2017, Hawaii had 207 Type I ARCHs with 931 beds, 36 Type II ARCHs
with 493 beds, and 229 expanded ARCHs with 1,132 beds.119
Adult Foster Care Homes/ Community Care Foster Family Homes
Adult Foster Care Homes, also known as Community Care Foster Family Homes (CCFFHs) are certified by the
Department of Health to serve both private pay residents and Medicaid-eligible residents who meet nursing home
level-of-care criteria as certified by a physician. As of November 2017, there were 1,166 facilities with a capacity of
2,874 beds.120
Assisted Living Facilities
Assisted living facilities are licensed and regulated by the Department of Health. Assisted living facilities differ
from other types of residential care facilities in that they are required to provide apartment units. These facilities
provide room and board, health care services, and personalized supportive services to meet individual residents’
needs. As of November 2017, Hawaii had 17 assisted living facilities with 2,683 units.121
114 Hawaii Long Term Care Commission. (2011). An Overview of Long-Term Care in Hawaii, Final Report for the Hawaii Long Term Care Commission. Retrieved from: http://www.publicpolicycenter.hawaii.edu/projects-programs/_long-term-care/RTI_Overview_of_LTC_System-FINAL.pdf. 115 Ibid. 116 Ibid. 117 Hawaii Long-Term Care Association. (undated). An Overview. Honolulu: Hawaii Long-Term Care Association. 118 Ibid. 119 State of Hawaii, Department of Health, Office of Health Care Assurance. (2017). Combined ARCH expanded ARCH Vacancy Report- by Area. Retrieved from: https://health.hawaii.gov/ohca/files/2013/06/Combined-ARCH-Expanded-ARCH-Vacancy-Report-By-Area-11-2017.pdf. 120 State of Hawaii, Department of Health, Office of Health Care Assurance. (2017). Community Care Foster Homes. Retrieved from: https://health.hawaii.gov/ohca/files/2013/06/Community-Care-Foster-Family-Homes-11-2017.pdf. 121 State of Hawaii, Department of Health, Office of Health Care Assurance. (2017). Assisted Living Facilities. Retrieved from: https://health.hawaii.gov/ohca/files/2013/06/Assisted-Living-Facilities-11-2017.pdf.
PAGE 47
Aging in Place
By focusing on preventive services rather than treating only advanced health needs, aging-in-place service
providers can also help seniors maintain independence at home, avoid nursing home admission, reduce
hospitalization, and minimize social isolation. Studies show that those who choose to age at home have better
health outcomes while incurring significantly lower health costs than those who age in nursing homes.122, 123
In addition to saving financial resources, aging in place is popular among seniors: a full 90% of American seniors
share the desire to remain in their homes as they age.124
The relatively low supply of nursing home beds in Hawaii has several consequences. In the last 2010 U.S. Census,
Hawaii had about 204,700 people over the age of 65. The American Health Association estimated in 2013 that
about 12% of Hawaii’s senior population, or 23,750 will need long-term care.125 A 2013 Caring for Our Kupuna
study produced by the Hawaii Community Foundation warned that with only 4,000 spaces available in nursing
homes and 7,000 in residential care homes, approximately 12,750 kupuna who needed long-term care in 2013
were unable to age in a residential facility.126 The Caring for our Kupuna study, estimated that nearly 40,000
kupuna will need long-term care in 2030, shown in Figure 15. The study concluded that Hawaii’s facilities
would be able to serve only 30% of the 38,000 older adults projected to need long-term care in 2035.127
The State Executive Office on Aging’s 2017-2019 State Plan on Aging identifies strategies and target dates to
coordinate services for older adults to receive care in the comfort of their homes instead of an institution. The
Executive Office on Aging stresses the importance that older adults need to be provided with access to
high-quality long-term services and supports, such as adult day care, assisted transportation, attendant care,
case management, home-delivered meals, and personal care. Finally, this State Plan on Aging identifies
improvements for the quality of care for Hawaii’s older adults from potential abusive or neglectful in-home
support through the Hawaii’s Long-Term Care Ombudsman Program.
122 Marek, K. D., Popejoy, L., Petroski, G., Mehr, D., Rantz, M., & Lin, W.-C. "Clinical Outcomes of Aging in Place." Nursing Research 54.3 (2005): 202-11. 123 Marek, K D., F Stetzer, S J. Adams, L L. Popejoy, and M Rantz. "Aging in place versus nursing home care: comparison of costs to Medicare and Medicaid." Research in Gerontological Nursing 5.2 (2012): 123-29. 124 AARP Policy Institute. (2011). Aging in Place: A State Survey of Liveability Policies and Practices. Retrieved from: https://assets.aarp.org/rgcenter/ppi/liv-com/aging-in-place-2011-full.pdf. 125 American Healthcare Association. (2013). Trends and Statistics. Retrieved from: http://www. ahcancal.org/research_data/trends_statistics/Pages/default.aspx. 126 Hawaii Community Foundation. (2013). Caring for Our Kupuna Study. Retrieved from: https://www.hawaiicommunityfoundation.org/file/pdfs/Caring-for-Our-Kupuna-Study.pdf. 127 American Healthcare Association. Nov 2010. The State Long-Term Healthcare Sector: Characteristics, Utilization, and Government Funding: 2010 Update.
Figure 15. Future Predictions of Long-Term Care in Hawaii. Courtesy: Hawaii Community Foundation, Caring for Our Kupuna Study.
PAGE 48
9. Preserve and Perpetuate our Kanaka Maoli and Island Cultural Values
The 2008 Hawaii 2050 Sustainability Plan explained that Hawaii’s ethnic diversity and multi-culturalism have
contributed significantly toward making our state unique. The Hawaii 2050 Sustainability Plan’s “where are we
now” measurement explained that no data of this information was compiled and suggested that an annual
population survey could be conducted to measure this activity. The Hawaii 2050 Sustainability Plan’s “2020
Suggested Benchmark” was that Hawaii residents should attend a cultural event at least once a quarter by 2020.
Unfortunately, due to the lack of a permanent government sustainability coordinating entity over the previous
decade, it is difficult to measure whether there has been an increase of Hawaii residents’ attendance at cultural
events on a quarterly basis over the past ten years. The Hawaii Tourism Authority does commission a resident
study, most recently completed in 2015. It would have been most effective for this resident study to include a
question on resident attendance at cultural events, as there are other questions pertaining to sustainability in the
2015 study.128
Additionally, the Hawaii Tourism Authority (HTA) funds the County Product Enrichment Program (CPEP) in
partnership with each of the four counties of Hawaii. These are programs that are initiated by the community and
supported by HTA which showcase the unique and diverse experiences available for resident and visitor
attendance across the Hawaiian Islands. In 2018 HTA funded 124 programs statewide through their community
enrichment program, aloha ʻāina program, and kukulu ola program.129
Thanks to many initiatives over this past decade, efforts to preserve and protect the Kanaka Maoli and Hawaii’s
cultural values has progressed. The Hawaii 2050 Sustainability Plan also called for the establishment of intellectual
property right laws and created an indictor under Goal 5, Indicator 5.6 to measure the number of intellectual
property laws passed over the last decade.
Although no intellectual property laws protecting and preserving the Native Hawaiian culture were enacted during
the study period of this report (2008-2017), this report found other noteworthy laws were passed as significant
cultural laws strengthening the importance of including Hawaii’s Lāhui Kānaka and advancing the preservation of
Hawaii’s cultural values in government.
128 State of Hawaii, Hawaii Tourism Authority. (2016). 2015 HTA Resident Sentiment Study. Prepared by: QMark Research. Retrieved from: http://www.hawaiitourismauthority.org/default/assets/File/reports/2015%20Resident%20Sentiment.pdf. 129 State of Hawaii, Hawaii Tourism Authority. (2017). 2018 Community Enrichment Program. Retrieved from: http://www.hawaiitourismauthority.org/default/assets/File/Community%20Programs%202018.pdf.
PAGE 49
Noteworthy Hawaiian Cultural Laws Enacted (2008-2017):
Act 210 (2010)130: Prevents the loss of Hawaiian fishponds, a valuable cultural resource and
encourages their restoration and preservation by prohibiting the sale of public lands on which
government-owned Hawaiian fishponds are located.
Act 107 (2011)131: Required the Department of Health to adopt rules in order to recognize the
preparation of poi and pa‘i ‘ai using traditional Hawaiian cultural food preparation practices.
Act 195 (2011)132: Recognized the Native Hawaiian people as the only indigenous, aboriginal,
Maoli people of Hawaii as well as established a Native Hawaiian roll to build Hawaiian identity
and representation within government.
Act 210 (2011)133: Protected the He‘eia community development district to develop culturally
appropriate agriculture, education, and natural-resource restoration and management of the
He‘eia wetlands.
Act 4 (2013)134: Added a member possessing a background in Native Hawaiian traditional and
customary practices on the DLNR-Natural Area Reserves System Commission.
Act 104 (2014)135: Required that at least one member of the board of land and natural resources,
other than the member appointed for having a background in conservation and natural resources,
have demonstrated expertise in Native Hawaiian traditional and customary practices.
Act 169 (2015)136: Required Office of Hawaiian Affairs to administer a training course on Native
Hawaiian and Hawaiian rights. Required members of certain State councils, boards, and
commissions to attend the training course.
Act 171 (2015)137: Decriminalized traditional Hawaiian burial practices.
Act 31 (2015)138: Updated the State’s agricultural objectives to include the perpetuation,
promotion, and growth of traditional Hawaiian farming methods and crops, as well as the
growth and development of small scale farms.
Act 230 (2015)139: Waived the DOH water quality certification requirement for restoration, repair,
and operation of Hawaiian loko i‘a (fishponds).
Act 72 (2016)140: Appropriated funds to the Kaho‘olawe Island Reserve Commission for restoration
and preservation projects. Required submission of a financial self-sufficiency and sustainability
plan to the Legislature.
130 Act 210, Session Laws of Hawaii. (2010). Hawaii Revised Statutes §171-28. Government-owned Hawaiian fishponds; sale prohibition. Retrieved from: https://www.capitol.hawaii.gov/hrscurrent/Vol03_Ch0121-0200D/HRS0171/HRS_0171-0028.htm. 131 Act 107, Session Laws of Hawaii. (2011). Hawaii Revised Statutes §321-4.7. Producers of hand-pounded poi; exemption. Retrieved from: https://www.capitol.hawaii.gov/hrscurrent/Vol06_Ch0321-0344/HRS0321/HRS_0321-0004_0007.htm. 132 Act 195, Session Laws of Hawaii. (2011). Hawaii Revised Statutes §10H. Native Hawaiian Recognition. Retrieved from: https://www.capitol.hawaii.gov/hrscurrent/Vol01_Ch0001-0042F/HRS0010H/HRS_0010H-.htm. 133 Act 210, Session Laws of Hawaii. (2011). Hawaii Revised Statutes §206E, Part VIII. Heeia Community Development District. Retrieved from: https://www.capitol.hawaii.gov/hrscurrent/Vol04_Ch0201-0257/HRS0206E/HRS_0206E-0201.htm. 134 Act 4, Session Laws of Hawaii. (2013). Hawaii Revised Statutes §195-6. Retrieved from: https://www.capitol.hawaii.gov/session2013/bills/HB941_.pdf. 135 Act 104, Session Laws of Hawaii (2014). Hawaii Revised Statutes §26-15. Retrieved from: https://www.capitol.hawaii.gov/session2014/bills/HB1618_CD1_.pdf. 136 Act 169, Session Laws of Hawaii. (2015). Hawaii Revised Statutes §10, Part III. Retrieved from: https://www.capitol.hawaii.gov/hrscurrent/Vol01_Ch0001-0042F/HRS0010/HRS_0010-0041.htm. 137 Act 31, Session Laws of Hawaii. (2015). Hawaii Revised Statutes §711-1108. Retrieved from: https://www.capitol.hawaii.gov/session2015/bills/SB434_HD1_.pdf. 138 Act 31, Session Laws of Hawaii. (2015). Hawaii Revised Statutes §226-7. Retrieved from: https://www.capitol.hawaii.gov/session2015/bills/SB434_HD1_.pdf. 139 Act 230, Session Laws of Hawaii. (2015). Hawaii Revised Statutes §342D-6.5. Hawaiian Loko iʻa. Retrieved from: https://www.capitol.hawaii.gov/session2015/bills/HB393_SD2_.pdf. 140 Act 72, Session Laws of Hawaii. (2016). Appropriating the Kahoolawe Island Reserve. Retrieved from: https://www.capitol.hawaii.gov/session2016/bills/HB2034_CD1_.pdf.
PAGE 50
Polynesian Voyaging Society and Mālama Honua
The Polynesian Voyaging Society led Hawaii and the World in the recognition of Native Hawaiian and Polynesian
historical cultural practices. Polynesian voyaging was near extinction when, in the 1970s, a group of traditional
navigators, scientists, and explorers founded the Polynesian Voyaging Society to revive traditional wayfinding and
exploration. After decades of voyaging, the Polynesian Voyaging Society embarked on their Polynesian double-
hulled voyaging canoes, Hōkūle‘a and Hikianalia, from Oahu for their “Mālama Honua” voyage in 2014 for a three
year circumnavigation of the Earth to bring global attention to the need to take care of our Island Earth. Mālama
Honua has allowed the Polynesian Voyaging Society to collect stories of hope from around the world, including
how indigenous communities in Hawaii and elsewhere are turning to traditional practices to reverse the
environmental damage caused by human activity. The Polynesian Voyaging Society’s mission through Mālama
Honua sought to engage communities worldwide in practicing how to live sustainability while sharing the
Polynesian culture, learning from the past and from each other, creating global relationships, and inspiring action
to care for our Island Earth. After Hōkūle‘a and Hikianalia returned to Hawaii, they launched their “Mahalo, Hawaii
Sail” in August 2017 to mahalo and mālama the people of Hawaii.
2018 as the Year of the Hawaiian
Most recently the 2017 State Senate passed Senate Resolution 74, requesting the Governor to proclaim and
designate June 1, 2018 - June 1, 2019 as the “Year of the Hawaiian” and requesting the Office of Hawaiian Affairs
to study and recommend to the Legislature a plan to celebrate the 2018 and 2019 as the “Year of the Hawaiian.”141
The senate resolution highlighted that 2010 U.S. Census data indicated that there were a total of 527,077 Native
Hawaiians living in the United States, with 289,970, or 55%, living in Hawaii, which comprises 21.3% of Hawaii’s
total population.142 The resolution further highlighted that 2013 U.S. Census data indicated that the Native
Hawaiian population is expected to double before 2050.143
Growth in Native Hawaiian Community
There has been a substantial growth in Native Hawaiian charter schools so that 15 of the existing 31, or 48%, of the
State charter schools are now Native Hawaiian focused, which participate as part of the Native Hawaiian Charter
School Alliance known as Nā Lei Na‘auao, and are learning communities that are pedagogically aligned in unique
and various ways with Native Hawaiian culture, language, traditions, and values.144
The Hawaiian Benevolent Royal Societies origins are rooted in the legacies of Hawaiian Ali‘i such as the Royal Order
of Kamehameha originating in 1865,145 the Ka‘ahumanu Society founded in 1905,146 the Mamakakaua Daughters
and Sons of Hawaiian Warriors (originally formed as Daughters of the Warriors in 1911),147 and Hale O Nā Ali‘i O
Hawaii formed in 1918.148 Finally, in 2003, a hui called the ‘Aha Hipu‘u formed, comprised of these four royal
societies, to continue to ensure that Native Hawaiians maintain a connection to their unique Native Hawaiian
heritage, history, and tradition.149
141 Hawaii State Senate. (2017). Senate Resolution 74. Retrieved from:http://www.capitol.hawaii.gov/session2017/bills/SR74_SD1_.pdf. 142 Ibid. 143 Ibid. 144 Na Lei Naauao, Native Hawaiian Charter School Alliance. (2017). Retrieved from:http://www.kalo.org/apps/pages/index.jsp?uREC_ID=209524&type=d&pREC_ID=465138. 145 Royal Order of Kamehameha. (2017). Retrieved from: http://www.mamalahoa.org/kamehameha/royal-order-of-kamehameha-i/. 146 Ahahui Kaahumanu. (2017). Retrieved from: http://www.kaahumanu.org/. 147 Aha Hipuu. (2017). Background of the Aha Hipuu. Retrieved from: http://www.ahahipuu.org/about/. 148 Ibid. 149 Ibid.
PAGE 51
Hawaiian homestead community organizations were formed by various homestead community members to
advance the economic and social improvement of the residents living within these Hawaiian homestead
communities and, of the 30 then- existing homestead associations, 19 joined together in 1987 to form the
Sovereign Council of the Hawaiian Homestead Assembly (formerly the State Council of the Hawaiian Homelands
Assembly). This Council continues today representing 35 of the 48 existing homestead communities. The
Association of Hawaiian Civic Clubs, established in 1918, grew over the years to 58 chapters located on the four
islands of Oahu, Hawaii, Maui, and Kauai, as well as on the mainland, and continues to maintain an active and
growing presence to address the needs of Native Hawaiians.150
Major events including the Aloha Lili‘u Ceremony, provided the opportunity for a centennial observance honoring
Hawaii’s last reigning monarch, Queen Lili‘uokalani’s life and legacy. This noteworthy ceremony honored the Queen
on the centennial anniversary of her death on November 11, 2017, showing that one hundred years later, the people
of Hawaii continue to feel the loss of a leader and one of the most influential women in Hawaii history.151
Native Hawaiians have raised the consciousness throughout Hawaii of the importance of Aloha ‘Āina - loving,
caring, respecting, and honoring the precious and fragile lands, seas, and stewardship to Pae‘aina o Hawaii, which
led to significant policies and programs to protect the sustainability of Hawaii's natural resources. Despite these
strides made to preserve and protect the Kanaka Maoli and Hawaii’s cultural values, Hawaii continues to struggle
with the Native Hawaiian principles and practices of aloha ‘āina and cultural literacy of mo‘olelo, recognizing the
sacred and cultural significance of Hawaii’s land.
As Sen. Kenny Brown explained in his landmark speech on the “Mālama Ethic” during a July 25, 1973 seminar titled
The Spectrum of Influences Affecting Quality Growth.152 His advice in the planning for Hawaii’s future included:
First, carry on all the transactions you want with the outside world, but protect the land, the beasts, the
plants, the insects and the rest, for only by exporting their produce can you pay for the purchases you
make. Second, multiply, if you will, within the limits of productivity, but have infinite care where you put
your houses, harbors, and hotels, because you must protect your land’s natural beauty and spirit of place
if you are to retain and sustain your own spirit. (Brown, 1973, para. 16)
Heeding such advice is more important today than when it was first offered in 1973; however, most important of
his Mālama Ethic, Sen. Kenny Brown reminds us that the transactions we face must meet the test of mālama, at all
times, without exception, as he describes:
All of man’s acts in Hawaii must be dominated by the spirit of “Malama.” Because he knows so many ways
to destroy his natural environment, man must now become its custodian and caretaker for his own sake.
He must exercise malama, because if he starts selling parts of his natural environment abroad for creature
comforts, he will lose it all, and be unable to survive here. If he uses up his landscapes, mountains, valley
and vistas, or if he degrades his air and waters, he will destroy the beauty and hence the spirit of Hawaii,
and in so doing, his own spirit. Malama, is thus an imperative. It is applicable to our entire lives in Hawaii.
It is applicable to all our transactions with each other, to all of our transactions with the overseas world,
and to all of the transactions between society and nature. Each of these transactions must meet the test
of malama, at all times, without exception. [Emphasis added] (Brown, 1973, para. 17)
As an island-community, Hawaii, grew to recognize the significance of its indigenous culture. Hawaii’s ancestors
relied on sustainable practices to mālama Hawaii, and we can continue to strive to achieve this balance of
sustainability protecting our economic interests, environmental resources, and social and cultural values.
150 The Association of Hawaiian Civic Clubs. (2017). Retrieved from: http://www.aohcc.org/index.php/en/. 151 The Queen Liliuokalani Trust. (2017). Aloha Lili‘u: Honoring the Queen’s Life and Legacy. Retrieved from: http://onipaa.org/pages/aloha-lili-u-honoring-the-queen-s-life-legacy. 152 Brown, K. 1973. “Malama” before the seminar titled “The Spectrum of Influences Affecting Quality Growth”. Retrieved from: http://archive.hokulea.com/index/founder_and_teachers/kenny_brown.html.
PAGE 52
Recommendation 2: Establish a Sustainability Council
The 2008 Hawaii 2050 Sustainability Plan recommended that an implementing entity (i.e.: the Sustainability
Council) be established to implement Hawaii’s sustainability goals. The intent was that this Sustainability Council
would be a non-regulatory government body to be in charge of coordinating, marketing, and implementing the
Hawaii 2050 initiatives and recommendations. The plan explained that similar in concept to the State’s Council on
Revenues, this Sustainability Council would help promote sustainability, determine intermediate and long-term
benchmarks, measure success, coordinate cross-sector efforts and dialogue, and report to government and private
sector leaders on progress.
Over the past ten years, however, the Sustainability Council was never established. Instead, a temporary State
Sustainability Coordinator position was created in 2013, as a cabinet-level position in the Governor’s office with
the purpose to work across departments, with local governments, federal agencies, communities, the private
sector, and with non-governmental organizations to advance integrated policies, programs, and projects for urban
and rural sustainable development and resilience. This position worked with the State Legislature to develop the
legislative resolution endorsing and supporting the Aloha+ Challenge: a Culture of Sustainability, which established
six targets focusing on clean energy, local food, natural resource management, waste reduction, smart sustainable
communities, and green workforce.153 This legislative resolution required the State’s Sustainability Coordinator to
submit a report to the 2015 Legislature on the launch of the Aloha+ Challenge, including recommendations for
promoting action and tracking progress on statewide sustainability targets.154
The temporary State Sustainability Coordinator position in the Governor’s office diminished in 2015. Later in 2016,
another State Sustainability Coordinator position was established within the Office of Planning and was filled in
2017 to implement the sustainability priority guidelines within the Hawaii State Planning Act (HRS § 226-108).155
The position was tasked to serve as a sustainability liaison among state and other governmental agencies, as well
as private or non-profit organizations, on various sustainability initiatives being performed statewide.
In order to support the vision of the Hawaii Sustainability 2050 Plan, policies must be enacted to:
Codify a sustainability framework within the Hawaii Revised Statutes.
Create a permanent sustainability program or office within the State of Hawaii.
Define the sustainability program with staff and definitions of the program’s responsibilities and
authorities.
Fund the sustainability program to ensure statewide implementation.
Fund the update of the ten year update of the 2008 Hawaii 2050 Sustainability Plan.
153 S.C.R. 69, S.D.1, 27th Leg., Reg. Sess. (Haw. 2014). 154 State of Hawaii, “Report to the 28th Legislature, 2015 Regular Session, Aloha+ Challenge: Recommendations for Taking Action and Tracking Progress,” December 2014. 155 Sustainability Priority Guidelines, Hawaii State Planning Act, Hawaii Revised Statutes §226-108 (2011). Retrieved from: https://www.capitol.hawaii.gov/hrscurrent/Vol04_Ch0201-0257/HRS0226/HRS_0226-0108.htm.
The State of Hawaii has many recycling laws and goals within the Hawaii Revised Statutes, yet decades after
these laws’ enactment, Hawaii continues to struggle with its recycling efforts, laws like Hawaii’s ADF glass law
and Hawaii’s HI-5 law, compete against each other. Incinerating waste to create clean energy can also
contradict Hawaii’s recycling goals, and could lead to the justification of potentially incinerating recyclables.
Stronger direction and delineation between these goals is needed.
156 American Planning Association. (2017). PAS Report: Planners and Water. Retrieved from: https://www.planning.org/publications/report/9131532/. 157 Hawaii Community Foundation, Hawaii Freshwater Initiative. (2016). A Blueprint for Action: Water Security for an Uncertain Future (2016-2018). Retrieved from: https://www.hawaiicommunityfoundation.org/strengthening/fresh-water.
PAGE 56
Measurements of Indicators:
1.1 Percentage of All Schools That Have Adopted Sustainability Modules:
Unfortunately, due to the lack of a permanent government sustainability coordinating entity, the percentage of
schools throughout Hawaii adopting sustainability modules was not monitored over the past decade. This report,
however, will highlight the amount of several sustainability initiatives at the individual school-level.
Since the Hawaii 2050 Sustainability Plan was published, the Department of Education (DOE) made several
concerted efforts not only to improve public education in the state, which is the department’s primary jurisdiction,
but has, through several parallel efforts, attempted to incorporate sustainable practices into the way it does
business. These efforts range from pilot projects and focused data gathering in the Office of School Facilities and
Support Services to the development of curriculum on different areas of conservation and sustainability and an
emphasis on Nā Hopena A‘o, which is a DOE-wide framework to develop the skills, behaviors, and dispositions that
are reminiscent of Hawaii’s unique context, and to honor the qualities and values of the indigenous language and
culture of Hawaii.
The DOE’s energy sustainability project, Ka Hei, includes a curriculum program that, since Ka Hei’s launch in 2014,
has grown to include 184 participating schools.158 The Ka Hei curriculum program is aligned with Hawaii Common
Core and Next Generation Science Standards and builds upon STEM (science, technology, engineering, and math)
opportunities in classroom.159 To date, 1,153 educators have been involved with Ka Hei-related professional
development sessions or activities and 47 professional development sessions have been completed statewide.
The Ka Hei curriculum program is organized around themes to prepare students to be community stewards and
activities are designed to nurture the ongoing development of interpersonal skills to support students’ future
success. The curriculum program began with solar and energy efficiency kits and living laboratories for grades 5-9
and has expanded to include additional grades.
In addition to Ka Hei, several DOE schools have partnered with community stakeholders to engage in projects that
promote sustainability and sustainable practices. These include:
Keoneula Elementary Garden
Keoneula’s Outdoor Learning Center includes a native Hawaiian garden, including taro, sweet potato, and
native flora (including medicinal plants); a worm bin for green composting; and an aquaponics system.
The school has been working with community partners, including Prudential Locations Foundation, HECO,
and families and neighbors to expand this project and more easily integrate it into the school’s
curriculum.160
158 State of Hawaii, Department of Education. (2017). Ka Hei Program. Retrieved from: http://www.hawaiipublicschools.org/ConnectWithUs/Organization/SchoolFacilities/Pages/Ka-Hei.aspx. 159State of Hawaii, Department of Education. (2017). Ka Hei Program Curriculum. Retrieved from: http://www.hawaiipublicschools.org/VisionForSuccess/SuccessStories/Partners/Pages/KaHeiCurriculum.aspx. 160State of Hawaii, Department of Education. (2013). Community Kokua Makes Keoneula Elementary Garden, Learning Center, a Reality. [blog post]. Retrieved from: http://www.hawaiipublicschools.org/VisionForSuccess/SuccessStories/Volunteers/Pages/Keoneula-Elementary-Outdoor-Learning-Center.aspx.
PAGE 57
Mākaha Elementary School
Mākaha Elementary School is located right next to Hoa ‘Āina O Mākaha, a 501(c) (3) non-profit
educational program. In 1987, the then Principal of Mākaha approached former Catholic priest Luigi
(Gigi) Cocquio, the owner of the farm, to see if he would be willing to collaborate on a program for
the elementary school students. The result was the Na Keiki O Ka ‘Āina (The Children of the Land)
Program.161
Under Makaha Elementary School’s program, one grade a day from the school follows a curriculum planned with
the grade-level teachers and aligned to DOE standards. Examples of work that is done include planting various
food crops (each grade level has its own plot), exploring science concepts through the care and keeping of the
crops, and learning about traditional Hawaiian uses of different flora for specific purposes. In addition, students
learn about Polynesian migration, the formation of the islands, and traditional Hawaiian land divisions.
In addition, the students are able to harvest what they’ve grown and use it at home, completing the farm to
table cycle.
Farm to School
Hawaii has an amazing legacy of land cultivation spanning two millennia. Providing meals for Hawaii’s next
generation grown from the lands on which they live is an approach that at one point in Hawaii’s history was the
only way to provide meals. Connecting Hawaii’s keiki to the “that which feeds” (a literal term for the Hawaiian
word ‘āina – land) will grow an understanding and respect for the land with a generation growing farther
removed from its utility and capacity.
In 2015, Lt. Governor Shan Tsutsui convened the Hawaii Farm to School Advisory Group to develop a pathway
toward bringing fresh, local food to schools statewide to reinforce the vision that Hawaii exists as a perpetual
reminder of finite resources, fertile lands and communities who are committed to the wellbeing of their keiki.
The Lieutenant Governor’s Advisory Group developed the ‘Āina Pono: Hawaii’s Farm to Cafeteria Initiative, a
private-public partnership “expressing the pride we have in food grown in these islands, the ingenuity of the
people we trust to feed our keiki and the collective strength to return our communities to a legacy of cultivating
fresh, locally grown sustenance to build the minds of tomorrow.”162
‘Āina Pono is the Hawaii State Department of Education’s (HIDOE) pioneering farm to school pilot initiative that
aims to bring more healthy, nutritious, fresh, and local food to school cafeterias throughout Hawaii.
Farm to school encompasses a variety of efforts to connect communities and students to fresh, nutritious food.
Farm to school generally includes three core elements:
1. School gardens;
2. Nutrition, agriculture, health, and food education; and
3. The procurement of local foods for school meals.
161 Hoa ʻĀina O Mākaha. (2017). Na Keiki O Ka ʻĀina Program. Retrieved from:http://www.hoaainaomakaha.org/programs-3/na-keiki-o-ka-aina-children-of-the-land/. 162 State of Hawaii, Office of the Lieutenant Governor. (2017). Farm to School Initiative. Retrieved from: http://ltgov.hawaii.gov/farm-to-school-initiative/.
PAGE 58
The first and second elements aim to help students become “citizen eaters” who understand the connections
between food, health, and agriculture. ‘Āina Pono focuses on the third element, which aims to create pathways
to include local food in school meals. From improving academic performance, to encouraging healthy food
choices, to supporting farmers and the local economy, the benefits of farm to school programs are truly
abundant.
‘Āina Pono has four main goals:
1. Purchase Local Food: Systematically increase HIDOE’s purchasing of local food for school
breakfast, lunch, and snack programs. Target: 40% local food (i.e., grown and/or raised within the
increase the number of students that eat school meals. Target: participation increases by 5%.
3. Healthy Foods: Increase student consumption of healthy foods in school meals. Targets: Processed
food shall not exceed 40%; food waste declines by 10%.
4. Cost-Neutral: The Initiative will be cost-neutral over time, i.e., implementation costs will be covered by
cost- savings generated by decreased waste and increased efficiencies. Target: Overproduction shall not
exceed 5%.
The Initiative includes the following components:
Menu Development: Working with cafeteria staff to develop new student-approved recipes that use
fresh, locally sourced ingredients and meet USDA guidelines. Cooking with fresh food is integral to
sourcing local food in Hawaii due to the unprocessed nature of most local food products.
Training: Training cafeteria staff on production planning, just-in-time production, teamwork,
leadership, time management, production records, portion control, local procurement, cooking
skills, knife skills, offer vs. serve, waste systems, profit and loss analysis, purchasing/inventory/cost
controls, customer service, taste testing, and recordkeeping.
Data Tracking: Developing data tracking systems to track profit and loss, waste, and local
procurement.
Waste Management: Developing waste management systems to measure and reduce
overproduction (i.e., food that is prepared but not sold) and plate waste (i.e., food that is sold but not
eaten).
Supply Chain Development: Meeting with farmers and food distributors to increase the pipeline of
local food available to HIDOE.
Procurement Innovation: Working with HIDOE’s School Food Services Branch supervisors and
procurement contracts branch, Hawaii Child Nutrition Programs, the State Procurement Office, and
the USDA to develop innovative procurement approaches that support buying local while complying
with state and federal laws.
Community Outreach: Engaging community members throughout the state in the Initiative in
order to share information, receive feedback, and encourage students to try new menu items.
Nutrition Education: Providing schoolchildren with nutrition education in school gardens and
classroom settings to connect them to the source of their food and expose them to a wide variety of
fresh, local foods, including fresh fruits and vegetables.
PAGE 59
Additionally, the Hawaii Department of Agriculture’s Farm to School Program was established in 2015 through
Act 218, codified as §141-11 of the Hawaii Revised Statutes. The Department of Agriculture’s Farm to School
Program is a participant in the Kohala Center’s Hawaii Farm to School and School Garden Hui, which led the
Hawaii Farm to School and School Garden Hui Survey in 2012. The School Garden Hui’s 2012 Farm to School
survey reported there were 168 school learning gardens in Hawaii, reaching 21,557 students with 830
participating teachers and 30 acres of land dedicated to school learning gardens in the 2012 school year.163
The Kōkua Hawaii Foundation also works directly with 46 individual public, charter, and private schools
throughout Hawaii to promote sustainability-related education focusing on plastic free, recycling, and ʻāina
program in Hawaii’s schools.164 Since 2006, Kōkua Hawaii Foundation has provided participating schools with
their “‘Āina in Schools” farm to school initiative teaching children healthy eating habits, nutrition education,
garden-based learning, promoting environmental stewardship by connecting children to the land and water that
sustains them, waste reduction, and agricultural literacy.165
The Kōkua Hawaii Foundation expanded their curriculum resources to schools by providing a “3R’s in Schools”
school recycling program, where the school makes commitments to reduce, reuse, and recycle on their school
campuses.166 “Plastic Free Hawaii” is another program offered by the Kōkua Hawaii Foundation which provides
resources, tools, and trainings to educate schools, business partners, and community members about the
environmental and health benefits of going plastic free to minimize single-use plastics in our islands. The
program supports communities and schools in coordinating beach clean-ups, film screenings, and trainings to
deliver Plastic Free Hawaii educational presentations.167
Finally, the Kōkua Hawaii Foundation offers field trip grants and mini-grants for schools to experience hands-on
learning about Hawaii’s environment, as well as fund projects and teachers from Hawaii schools to assist in
advancing their environmental goals in the classroom and pursue stewardship endeavors. During the most
recent 2016-2017 school year, Kōkua Hawaii Foundation awarded a total of 164 of Hawaii’s schools with mini-
grants or field trip grants which supported over 26,000 students.168 Several DOE schools have partnered with
the Kōkua Hawaii Foundation to engage in projects that promote sustainability and sustainable practices in their
communities, including:
Mililani Uka Elementary School
Mililani Uka started the ‘Āina In Schools program and the Plastic Free Hawaii program in 2012, with an
enthusiastic group of school staff and parents taking the lead to implement a strong program. The
school has also hosted recycling drives and created environmental education programming with the
support of Kōkua Hawaii Foundation Mini-Grants.
163 The Kohala Center. (2012). Growing School Learning Gardens: A Summary of the 2012 Statewide School Garden Survey. Retrieved from: http://kohalacenter.org/schoolgardenhui/pdf/HFSSGH_Final_Summary_Report_2012.pdf. 164 Data provided by the Kokua Hawaii Foundation. 165 Kokua Hawaii Foundation. (2017). Aina in Schools. Retrieved from: https://www.kokuahawaiifoundation.org/aina. 166 Kokua Hawaii Foundation. (2017). 3R’s School Recycling Program. Retrieved from: https://www.kokuahawaiifoundation.org/3rs. 167 Kokua Hawaii Foundation. (2017). Plastic Free Hawaii. Retrieved from: https://www.kokuahawaiifoundation.org/pfh. 168 Kokua Hawaii Foundation. (2017). 2016-2017 Year End Report. Retrieved from: https://kokuahawaiifoundation.org.
PAGE 60
Public Charter Schools
Many of Hawaii’s Public Charter Schools have also promoted sustainability and sustainable practices either
through the Nā Lei Na‘auao, the Native Hawaiian Charter School Alliance, or as a part of their own entire
curriculum. These include:
The School for Examining Essential Questions of Sustainability
The entire curriculum for the School for Examining Essential Questions of Sustainability (SEEQS) is
modelled after sustainability through interdisciplinary investigation of questions essential to Hawaii’s
future. This newly authorized public charter school, established in 2013, is presently serving 6th- 8th grade
students.169
Waimea Middle School
Hosts a one-acre Mala‘ai culinary garden. According to the Mala‘ai Garden Classroom 2015-2016 School
Year Annual Report, 297 classes participated in the garden, 855 lbs of produce was harvested, weighed,
and recorded, 1,452 volunteer hours were dedicated to the culinary school garden, and all 266 students
of Waimea Middle School were provided with garden experiences.170
Ka`ohao School
Became the first school in Hawaii to achieve a Zero-Based Waste program schoolwide in 2016 and won a
national award from the EPA’s 2016 Food Recovery Challenge for the 2014-2015 school year.171 Ka‘ohao
School, formerly Lanikai Elementary, established a “zero waste revolution,” which leads the state and the
nation in organics waste reduction with a philosophy and practice of “Zero Waste.” Teaching that all
discarded materials are regarded not as trash but as valuable resources consistent with a near-perfect
record of waste collection and on-site processing of food waste, paper, cardboard, and green waste.
As of December 2016, 100% of all the school’s food waste was recovered and composted on site to total
1,673 pounds. Total food waste recovered and composted by 2017 was 9,308 pounds, or 4.65 tons.
100% of all HI-5 cans and bottles were collected, sorted, and redeemed. The campus processed 99% of all
green waste, and 98% of paper and cardboard waste.172
Kona Pacific Public Charter School
Hosts multiple farm to school programs, which include a school garden, FoodCorps, FarmCorps Hawaii,
WHOLE Community Foodservice, West Hawaii Summer Lunch, USDA Farm to School, West Hawaii
Community Kitchen, NRCS “Food Forest Park”, and the Hawaii Island Charter School Foodservice Hui.
In 2015, Kona Pacific Public Charter School received a $1.2 million grant-in-aid from the Hawaii State
Legislature for a new kitchen facility, which will house two complete kitchens: one for the community’s
foodservice, and another to serve as a value-added processing facility for local farmers to assist west
Hawaii’s regional agricultural economy.173
169 The School for Examining Essential Questions of Sustainability. (2017). Retrieved from: http://www.seeqs.org/. 170 Malaai. (2016). Malaai Annual Report. Retrieved from:http://malaai.org/wp-content/uploads/Malaai-Annual-Report-2015-2016.pdf. 171 U.S. Environmental Protection Agency. (2016). Sustainable Management of Food: About the 2016 Food Recovery Challenge Award Winners. Retrieved from: https://www.epa.gov/sustainable-management-food/about-2016-food-recovery-challenge-award-winners. 172 Kaohao School. (2017). Zero Waste Revolution Website. Retrieved from: http://kaohaoschool.org/zero-waste-revolution/. 173 Legislature grants $1.2M for school kitchen facility. (2015, May 8), West Hawaii Today. Retrieved from: http://westhawaiitoday.com/news/local-news/legislature-grants-12m-school-kitchen-facility.
PAGE 61
1.2 Percentage of Residents Understanding and Supporting Sustainability Practices:
Due to the lack of a permanent government sustainability coordinating entity, the percentage of residents
understanding and supporting sustainability practices were unmeasured over the past decade.
1.3 Per Capita Water Consumption
This report found that per capita water consumption rates are not consistent statewide. County water utilities
are the best source of information of fresh water consumption; however, county water utilities do not monitor
private municipal water systems or domestic private individually owned wells.
For the purpose of measuring fresh water consumption, the county water utilities have provided the following
information as reflected in Tables 10, 11, 12, and 13.
County Fresh Water Consumption Metrics
The County of Hawaii’s Department of Water Supply provided the following consumption rates (Table 10)
measuring their total accounts island-wide, including all residential, commercial, industrial accounts connected
to the utility. The annual consumption rates are measured in 1,000 of gallons at the end of each fiscal year.
For example, Fiscal Year 2017 (July 1, 2016 - June 30, 2017) measured 9,700,618,000 total gallons of water
consumed island-wide for all 43,352 accounts connected to the utility.
Table 10. Hawaii County Water Consumption Rates (Fiscal Years 2008 – 2017)
The County of Kauai’s Department of Water provided the following consumption rates reflected in Table 11
measuring their total accounts island-wide, including all residential, commercial, industrial accounts connected to
the utility. Per Capita Consumption data was not available due to the lack of population data.
Table 11. County of Kauai Water Consumption Rates (2008 – 2017)
Source: City and County Board of Water Supply, 2016 Water Master Plan.
PAGE 63
Water Auditing
The State Department of Health describes that there are over 50 county-run public water systems statewide
as well as an additional 50 large capacity public water systems and public water systems operating in
designated ground water management areas.174 It is believed that many of these water distribution systems
may be operating with inefficiencies, resulting in a loss of water, increasing energy costs, and potential loss of
revenue. To improve the efficiency of water delivery and identify losses in the system, Act 169 was enacted in
2016 requiring the State’s Commission on Water Resource Management to assist each county utility to
develop a statewide standardized water audit of their county’s public water systems.
This statewide water auditing system will be managed by the State’s Commission on Water Resources
Management; the Commission will provide the counties with technical assistance until July 1, 2021. Beginning
on July 1, 2018, each county public water system will submit a completed and validated water loss audit
report over the previous year to the Commission on Water Resources Management. By July 1, 2020, all other
remaining large capacity public water systems and public water systems in water management will begin to
submit a completed and validated water loss audit report over the previous year to the Commission on Water
Resources Management.175
Water Smart Software
Two county public water systems recently piloted a program with the WaterSmart Program. WaterSmart
targets improved water-use efficiency and greater financial control. Households participating in the pilot
program can now see their accounts digitally, receive leak alerts, learn how their water use compares to
similar households via their WaterScore, and gain actionable information about how and when to reduce their
use in order to lower their water bills.176 The City and County of Honolulu’s Board of Water Supply established
a one year pilot program with WaterSmart in March 2017 for 38,000 participating households on Oahu.177
Hawaii County also established a pilot-program with the WaterSmart Program in September 2016 with 10,000
accounts participating. Due to water restrictions and well problems in the Kona area, Hawaii County’s pilot
program was paused in April 2017.
Hawaii Fresh Water Initiative
The Hawaii Fresh Water Initiative was launched in 2013 to bring multiple, diverse parties together to develop
a forward-thinking and consensus-based strategy to increase water security for the Hawaiian Islands. This
Hawaii Fresh Water Initiative was organized by the Hawaii Community Foundation. The Initiative relied on the
“Hawaii Fresh Water Council,” a panel of individuals with deep knowledge of water and a vision for a more
secure and sustainable water future for Hawaii. Their Blueprint for Action: Water Security for an Uncertain
Future (2016-2018) provides Hawaii policy and decision-makers with a set of solutions that should be adopted
between 2016 and 2018 to put Hawaii on a path toward water security.178
174 Act 169, Session Laws of Hawaii. (2016). Water Audit. Retrieved from: https://www.capitol.hawaii.gov/session2016/bills/SB2645_CD1_.pdf. 175 State of Hawaii, Commission on Water Resources Management. (2017). Hawaii Water Audit Validation Effort (WAVE). Retrieved from: http://www.hawaiiwaterloss.org/. 176 WaterSmart Software. (2017). About Us. Retrieved from: https://www.watersmart.com/. 177 City and County of Honolulu, Board of Water Supply. (Feb 2017). Board of Water Supply to Test Online WaterSmart Program. Retrieved from: http://www.boardofwatersupply.com/news-events/news-releases/2017/news-release-bws-to-test-online-watersmart-program. 178 Hawaii Community Foundation, Hawaii Freshwater Initiative. (2016). A Blueprint for Action: Water Security for an Uncertain Future (2016-2018). Retrieved from: https://www.hawaiicommunityfoundation.org/strengthening/fresh-water.
PAGE 64
One of the strategy areas of the Blueprint’s statewide goal of 100 MGD in additional fresh water capacity pertains
to this Hawaii 2050 Sustainability “Per Capita Water Consumption” indicator and emphasizes that the public and
private sectors must work together to achieve by 2030 179:
Conservation: Improve the efficiency in how water is transported and used so that each Hawaii
resident requires 15% less water per capita to meet our needs.
Statewide Fresh Water Use (2013)
Finally, the U.S. Geological Survey (USGS) provided the following data in a presentation to the Hawaii Water Works
Association in 2013, which reflects the use of freshwater throughout the State of Hawaii between 1985 and 2010.
The data are limited due to incomplete reporting of pumpage and surface water diversions, unknown water usage,
and changes in methods used to estimate missing data.
At the time of this presentation, the incomplete groundwater pumpage reporting consisted of data reported for
30% of registered wells, and data not reported for 70% of registered wells throughout the state. The USGS data
reflected in Figure 16 show that the primary uses of Hawaii’s fresh water are for public supply and irrigation. The
USGS found that between 1985 and 2010, Hawaii’s public water supply use increased as the population increased,
as depicted in Figure 17.180
179 Hawaii Community Foundation, Hawaii Freshwater Initiative. (2016). A Blueprint for Action: Water Security for an Uncertain Future (2016-2018). Retrieved from: https://www.hawaiicommunityfoundation.org/strengthening/fresh-water. 180 Miller, L., U.S. Geological Survey. (2013). Presentation to the Hawaii Water Works Association Conference. “Water Use in Hawaii”. Retrieved from: https://hi.water.usgs.gov/presentations/HWWA_20131023_WaterUse.pdf.
Figure 16. Fresh Water Use for the State of Hawaii. Presentation to the Hawaii Water Works Association (2013). Source: U.S. Geological Survey
Figure 17. Statewide Public Water Supply Use Increased as Population Increased. Presentation to the Hawaii Water Works Association (2013). Source: U.S. Geological Survey
PAGE 65
1.4 Per Capita Energy Consumption:
The State of Hawaii’s 2016 Data Book provides the primary energy consumption (in BTU: British Thermal
Units) per capita statewide data from 1994-2015, Figure 18 reflects the statewide primary energy
consumption between 2007 and 2015. Over the past eight years Hawaii’s statewide per capita energy
consumption reduced by 57.4 British Thermal Units (BTUs).
The Hawaii State Energy Office provides a more in depth analysis of each island’s residential average
monthly energy use between 2011 and 2016 in the Hawaii Energy Facts & Figures Report (May 2017)
Statewide Per Capita Energy Consumption (2007-2015)
Figure 18. Statewide Energy Consumption Per Capita (2007-2015). Source: Data compiled from the 2016 State of Hawaii Data Book.
Statewide Monthly584 KwH
543 KwH 514 KwH 496 KwH 497 KwH 484 KwH
0
100
200
300
400
500
600
700
2011 2012 2013 2014 2015 2016
Ave
rage
Mo
nth
ly U
se (
Kw
H)
Statewide Residential Average Monthly Energy Use(2011-2016)
Statewide Oahu Hawaii Kauai Lanai Maui Molokai
Figure 19. Statewide Residential Average Monthly Energy Use (2011-2016). Source: Data compiled from the Hawaii Energy Facts & Figures Report (May 2017).
PAGE 66
1.5 Percentage of Renewable and Alternative Energy:
Since its establishment in 2008, the Hawaii Clean Energy Initiative (HCEI) helped direct Hawaii toward a clean
energy future. Over the past decade, Hawaii’s renewable portfolio standard experienced a growth rate of 18% and
surpassed its recent mandated RPS goal of 15% RPS by 2015 as depicted in Figure 20.
According to the Hawaii State Energy Office’s Facts and Figures May 2017 Report, renewable energies generated
statewide in 2016 were diversified as depicted in Figure 21.
8.6% 9.4% 9.5%
9.5%
11.9%13.7%
18.0%
21.1%
23.4%
26.6%
10% Goal 15% Goal0.0%
5.0%
10.0%
15.0%
20.0%
25.0%
30.0%
2007 2008 2009 2010 2011 2012 2013 2014 2015 2016
Hawaii Renewable Portfolio Standard Progress (2007-2016)
Renewable Portfolio Standard Mandated goal
Figure 20. Hawaii Renewable Portfolio Standard Progress (2007-2016). Sources: Data compiled from the Hawaii Renewable Portfolio Standards Act, and Hawaii State Energy Office.
Distributed PV
33%
Utility Scale PV5%
Wind27%
Hydro4%
Geothermal10%
Biofuels2%
Biomass19%
2016 Statewide Renewable Energy Generation (GWHS)
Figure 21. 2016 Statewide Renewable Energy Generation. Source: Hawaii State Energy Office
PAGE 67
1.6 Percentage use of Solar or Other Alternative Water Heating Sources:
After much study, this report found there are no reporting requirements for the use of solar water heating
sources. Two rebates (federal and state) are offered for the installation of a solar water heater in residential
and commercial areas. The State’s rebate for the installation of solar water heaters is pursuant to §235-12.5
(b) (1) of the Hawaii Revised Statutes. Effective January 1, 2010, §196-6.5 of the Hawaii Revised Statutes also
required that new single-family dwellings built on or after January 1, 2010 shall include the use of solar water
heaters. Therefore, this solar water heater requirement for new single-family dwellings does not allow for the
claim to the rebate program under §235-12.5 (b) (1) of the Hawaii Revised Statutes. It is important to note
that there is an exemption to this requirement by allowing the use of a variance from installing a solar water
heater for new single-family dwellings built on or after January 1, 2010, provided that the new single-family
dwelling attests that installation is impractical due to poor solar resources, is cost-prohibitive, an alternative
renewable energy technology system is substituted as the primary energy source for heating water, or a gas-
tankless instantaneous water heater device is used.
Due to the gap of reporting requirements between the use of the rebates claimed by commercial buildings or
homes built before January 1, 2010 and use of variances from solar water heating requirements on new single-
family dwellings built on or after January 1, 2010, this indicator is now difficult to measure.
1.7 Number of Government, Business, Labor and Community Organizations that Adopt
Sustainability Practices and Policies:
Due to the lack of a permanent government sustainability coordinating entity, the number of government,
business, labor, and community organizations that adopt sustainability practices and policies was not measured
over the past decade.
PAGE 68
1.8 Percentage of New Cars Purchased That Use Renewable Fuel Technology:
The Department of Business and Economic Development and Tourism (DBEDT) reports monthly and historical data
on type of vehicle registration and fuel consumption as a part of its monthly reporting of energy trends. New car
purchases are not separated from the total of taxable vehicle registrations measured by this data.
Figure 22 provides a visualization of the recent growth of vehicles using renewable fuel technologies over the last
ten years, based on the information of the registered electric and hybrid vehicles in the State of Hawaii.
As of December 2017, DBEDT reported the following data of total registered electric and hybrid vehicles using
renewable fuel technologies used statewide, compiled in Table 14.
Table 14. Statewide Percentage of Registered Vehicle Populations (2017)
Registered
Electric Vehicles
Registered Vehicles Using Hybrid Fuel
Technologies Registered Vehicles Using Fossil Fuel
Type of Vehicle
Registered Passenger
Electric Vehicles
Registered Electric Freight
Vehicles
Registered Passenger
Hybrid Vehicles
Registered Hybrid Freight
Vehicles
Registered Gasoline
Passenger Vehicles
Registered Gasoline Freight
Vehicles
Registered Diesel
Passenger Vehicles
Registered Diesel Freight
Vehicles
December 2017 6,687 10 24,918 92 1,019,106 47,071 8,809 24,152
Combined Total 6,697 25,010 1,066,177 32,961
Percentage of Registered
Vehicle Population
0.6% 2.2% 94.3% 2.9%
NOTE: Data does not include “Miscellaneous Fuel” measurements (Misc. Fuel for Passenger: 1,289, Misc. Fuel for Freight: 100) **Data does not measure “percentage of new car purchased”, data measures total taxable registered vehicles within the State of Hawaii. Source: Compiled from data provided by DBEDT “Monthly Energy Data: Historical Data.”
Figure 22. Statewide Registered Vehicles Using Renewable Fuel Technologies (2007-2017). Source: Department of Business Economic Development and Tourism
Statewide Registered Vehicles Using Renewable Fuel Technologies (2007-2016)
Hybrid (Passenger Vehicle) Electric (Passenger Vehicle) Hybrid Freight Electric Freight
PAGE 69
1.9 Percentage of Households Participating in Recycling:
This report found that this indicator was unmeasurable due to the varied recycling programs offered by the
four counties. It is important to note that China’s 2017 prohibition of importing certain paper and plastic
recyclables may adversely affect Hawaii’s county recycling programs. The City & County of Honolulu
completed its island-wide implementation of a residential curbside recycling program in May 2010, which
includes 160,000 homes yielding approximately 23,000 tons of mixed recyclables collected each year. The City
& County of Honolulu also accepts other recyclable material at its six Refuse and Recycling Centers and three
Transfer Stations throughout Oahu.181 Similarly, Maui County reinstated its curbside recycling pilot project in
2015 for the South Maui residential area.182
Kauai County does not offer a curbside recycling program due to the lack of processing capacity. Kauai County
is underway in developing a clean Materials Recovery Facility that will enable sorting and processing of
recyclables as well as a proposed future residential curbside collection program of green waste and recyclables
in FY 2019 to increase the island’s recycling rate.183 Finally the County of Hawaii similarly does not offer a
municipal curbside recycling program; instead, residents self-haul their rubbish and recyclables to any of the
county’s 22 recycling and transfer stations.184
All counties have enacted forms of ordinances to reduce the use of single-use non-compostable plastic bags,
requiring households to adapt to reusable grocery bags.
Maui County adopted Plastic Bag Reduction Ordinance 2587 in 2008, it became effective in 2011.
The law prohibited businesses from providing plastic bags to their customers at the point of sale.185
Kauai County adopted Plastic Bag Reduction Ordinance 885 in 2009, it became effective in 2011.
The law required retail establishments to provide only recyclable paper bags, biodegradable bags
and/or reusable bags.186
Hawaii County adopted Plastic Bag Reduction 12-1 in 2012, which became effective in 2013.
The law banned businesses from providing individual, single-use plastic bags to customers for free
or for purchase at the point of sale.187
Honolulu County adopted its Plastic Bag Ban Ordinance 17-37 in 2017, it will be effective in 2020.
The law requires retailers providing reusable bags, compostable plastic bags, or recyclable paper
bags to charge customers a minimum of 15 cents per bag. The fee becomes effective in July 2018.
Compostable bags and thicker plastic bags will be banned in 2020.188
181 City and County of Honolulu, Department of Environmental Services. (2017) 3-Cart Refuse/ Recycling Collection. Retrieved from: http://www.opala.org/solid_waste/curbside.htm. 182 County of Maui, Environmental Management. (2017). Curbside Collection - The 3 Can Plan. Retrieved from: https://www.mauicounty.gov/1869/Curbside-Collection---The-3-Can-Plan. 183 County of Kauai-Department of Public Works. (May 2016). FEA-FONSI for the Environmental Assessment of Materials Recycling Facility for County of Kauai to the State Office of Environmental Quality and Control. Retrieved from: http://oeqc.doh.hawaii.gov/Shared%20Documents/EA_and_EIS_Online_Library/Kauai/2010s/2016-06-08-KA-5B-FEA-Materials-Recycling-Facility.pdf. 184 County of Hawaii, Department of Environmental Management. (2017). Solid Waste and Recycling Division. Retrieved from: http://www.hawaiizerowaste.org/. 185 County of Maui, Environmental Management, Environmental Protection & Sustainability Services. (2010). Plastic Bag Reduction – B.Y.O. Bag. Retrieved from: https://www.mauicounty.gov/1688/Plastic-Bag-Reduction---BYOBag. 186 County of Kauai, Public Works, Solid Water Recycling Program. (2015). Plastic Bag Reduction Ordinance. Retrieved from: http://www.kauai.gov/BagOrdinance. 187 County of Hawaii, Department of Environmental Management, Solid Waste Division- Recycling Section. (2014). Plastic Bag Reduction Ordinance Frequently Asked Questions (FAQ). Retrieved from: http://www.hawaiizerowaste.org/site-content/uploads/Plastic_Bag_Reduction_Ordinance_-_Frequently_Asked-Questions_2014-02-06.pdf. 188 City and County of Honolulu, City Council. (2017). Bill 59 (2016), FD1, CD3. Retrieved from: http://www4.honolulu.gov/docushare/dsweb/Get/Document-195377/BILL059(16)%2c%20FD1%2c%20CD3.pdf.
PAGE 70
Goal 2: Sustainable Economy
The Hawaii 2050 Sustainability Plan emphasized that “a sustainable Hawaii cannot occur without a sustainable
economy” and that “diversification makes our economy more resilient in the face of an unpredictable future.”
(Hawaii 2050 Sustainability Plan, p.25) The Hawaii 2050 Sustainability Plan recommended the investment in
diversified agriculture, fisheries and aquaculture, and knowledge- and innovation-based industries such as high
tech, healthcare, biotechnology, film, and digital media as important components to building a sustainable
economy. The Hawaii 2050 Sustainability Plan likewise emphasized the need for a strong workforce to develop a
strong economy. This recommendation included strengthening public education, increasing the availability and
quality of jobs, as well as strengthening the training of Hawaii’s skilled workforce. Finally the Hawaii 2050
Sustainability Plan focused on the importance of financing, repairing, and maintaining Hawaii’s critical
infrastructure to prepare for future population growth and demand.
To measure this goal of establishing a sustainable economy, the Hawaii 2050 Sustainability Plan provided four
strategic actions based off of the following 11 indicators:
STRATEGIC ACTIONS:
1. Develop a more diverse and resilient economy.
2. Support the building blocks for economic stability and sustainability.
3. Increase the competitiveness of Hawaii’s workforce.
4. Identify, prioritize, and fund infrastructure “crisis points” that need fixing.
11 INDICATORS:
1. Percentage of local economy by industries and sectors.
2. Percentage of science-and technology-based workers.
3. Number of post-secondary science and engineering students.
4. Gross licensing revenue from commercialized university research.
5. The level of university, government, and private sector research and development.
6. The number of living wage jobs as a percentage of total jobs in Hawaii, compared to
the national average.
7. Dollars spent in locally owned businesses.
8. Value of goods and services imported and exported.
9. Income of top quintile relative to the bottom quintile.
10. Proportion of food produced and consumed locally.
11. Dollar value and number of acres in agricultural production.
PAGE 71
Summary of Progress toward the “Sustainable Economy”
Strategic Actions and Indicators:
The Hawaii 2050 Sustainability Plan’s second goal to integrate sustainability throughout our economy, has
generally progressed over the past decade. Although still heavily reliant upon Hawaii’s hospitality and tourism
economic cluster, economic clustering data show the progression and development of a diverse economy.
The Hawaii Clean Energy Initiative again led Hawaii’s progress toward a more diverse and resilient economy
over the past decade by developing more clean energy projects and initiatives. Additional government
support through similar progressive, sustainable, and highly coordinated initiative policies could help Hawaii
diversify its economy while investing in more sustainable projects.
Outdated Indicators
Data associated with some of this goal’s indicators were not tracked or were outdated. Should the State fund
a formal update to the Hawaii 2050 Sustainability Plan, this report recommends the update of economic
indicators to measure a more diverse and resilient economy. A future Hawaii 2050 Sustainability Plan should
also study economic shocks and stresses and provide indicators to improve Hawaii’s economic resilience.
Affordability Problem
Data based off this goal’s indicators show that affording to live in Hawaii has grown to be more challenging
over the past ten years.
Agricultural Land Use Decreased
A 2015 agricultural land use baseline assessed the agricultural land use changes over various periods of time
the most recent comparison was between 1980 and 2015 agricultural land use statewide. The report found
that there was a significant decrease in Hawaii’s agricultural land use between 1980 and 2015. Over the past
35 years, Hawaii’s experienced a 56% reduction of active crop use on agricultural lands and a 30% decrease of
pasture lands statewide. Improved policy coordination is needed to understand how much agricultural
acreage and water is necessary to produce a sustainable yield a local food for the state’s population.
Agricultural Production and Consumption is Not Measured
Local agricultural consumption data is not monitored or available. Policies must be established to improve
coordination and thorough measurement of local agricultural production and local agricultural consumption.
“Food” must be delineated from agricultural production since local farmers produce agricultural goods
including coffee and macadamia nuts, but these commodities may not necessarily imply “local food” for
Hawaii’s goals for sustainable food sources.
PAGE 72
Measurement of Indicators:
2.1 Percentage of Local Economy by Industries And Sectors:
According to Department of Business Economic Development and Tourism (DBEDT), Hawaii’s economy is not easily
summarized into conventional industry sectors common to economic analysis, (i.e. those categories that comprise
the Gross State Product). The primary source of income for Hawaii is the visitor sector, which spreads itself over
several industries, such as service, transportation and retail trade.189
2.2 Percentage of Science and Technology-Based Workers:
The State’s Department of Labor and Industrial Relations (DLIR) compiles information on Hawaii’s labor force and
employment through their research and statistics division. The data in Figure 23 reflects the statewide annual job
count within the “science and technological services” industry.
189 State of Hawaii, Department of Business Economic Development and Tourism, Information Services. (2008). Frequently Asked Questions Webpage. Retrieved from: http://dbedt.hawaii.gov/economic/library/faq/faq08/.
Figure 23. Hawaii Statewide Employment: Professional Science and Technological Services (2007-2016). NOTE: Not seasonally adjusted data. Source: DLIR Research and Statistics, Job Count by Industry 2007-2016 reports.
24,600
25,100
24,55024,100
24,300 24,30024,400 24,400
24,50024,400
24,000
24,200
24,400
24,600
24,800
25,000
25,200
2007 2008 2009 2010 2011 2012 2013 2014 2015 2016
Hawaii Statewide Employment: Professional Science and Technological Services (2007-2016)
PAGE 73
The State’s Department of Education (DOE) has also engaged in several strategies to strengthen career pathways
for public school students:
Career and Technical Education Pathways
As of the 2017-2018 school year, 75% of high schools (43 of a total of 57) have career and technical education
(CTE) pathways. The DOE’s CTE vision is to “make sure that all CTE students fully develop their career and
academic potential.” This vision includes four core principles190:
Alignment. Effective alignment between CTE and labor market needs to equip students with 21st-
century skills and prepare them for in-demand occupations in high-growth industry sectors.
Collaboration. Strong collaboration among secondary and post-secondary institutions, employers,
and industry partners to improve the quality of CTE programs.
Accountability. Meaningful accountability for improving academic outcomes and building technical
and employability skills in CTE programs, based upon common definitions and clear metrics for
performance.
Innovation. Increased emphasis on innovation supported by systemic reform of state policies and
practices to support CTE implementation of effective practices at the local level.
The CTE curricular and assessments program is structured around programs of study, core standards, and
performance-based assessments. It also includes the Hawaii Career Pathway System Handbook, which details
the six career pathways and the occupations that are in each.191 The career pathways and the organization of
occupations within those pathways were determined through a collaboration between educators and business
and industry representatives. The six career pathways are:
Arts and Communication
Business
Health Services
Industrial and Engineering Technology
Natural Resources
Public and Human Services
In addition, the program is assisted by the Pathway Advisory Council, whose members provide pathway and
industry-specific expertise in the review and approval of standards and assessments.
To provide additional curricular materials and strong connections to industry, DOE high schools also have two
national industry curriculum available for their use: the National Restaurant Association ProStart Culinary
curriculum and the United Brotherhood of Carpenters Career Connections curriculum.192, 193
190 State of Hawaii, Department of Education. (2017). Career and Technical Education webpage. Retrieved from: http://www.hawaiipublicschools.org/TeachingAndLearning/StudentLearning/C2C/Pages/CTE.aspx. 191 State of Hawaii, Department of Education, Career and Technical Education. (undated). Hawaii Career Pathway System Handbook. Retrieved from: http://www.hawaiipublicschools.org/DOE%20Forms/CTE/CTEhandbook.pdf. 192 National Restaurant Association. (2017). ProStart Culinary Curriculum. Retrieved from: http://www.goprostart.com/. 193 United Brotherhood of Carpenters and Joiners of America. (2017). Career Connections Curriculum. Retrieved from:https://www.carpenters.org/citf-training/citf-training-programs/career-connections/.
PAGE 74
Connect to Careers (C2C)
C2C, is an industry-led coalition designed to benefit Hawaii’s economic future by collaboratively preparing students
for success in high-skill, in-demand careers at both state and regional levels. The DOE’s Community Engagement
Office provides support and assistance to the C2C Program. The C2C effort rests on three pillars194:
Business Led. Industry identifies entry level skill sets and employability qualities and collaborates on
degrees and certifications that will prepare students for these opportunities;
Aligned Curriculum and Opportunities. There is coordination between the K-12 and post-secondary
educational systems for relevant and rigorous learning pathways; and
Tracking Effectiveness. Data and industry feedback are used to determine which pathways are leading to
successful careers and incomes that build and sustain thriving communities in Hawaii;
and four core principles195:
Alignment. Effective alignment between CTE and labor market needs to equip students with 21st century
skills and prepare them for in-demand occupations in high-growth industry sectors;
Collaboration. Strong collaboration among secondary and post-secondary institutions, employers, and
industry partners to improve the quality of CTE programs;
Accountability. Meaningful accountability for improving academic outcomes and building technical and
employability skills in CTE programs, based upon common definitions and clear metrics for performance;
and
Innovation. Increased emphasis on innovation supported by systemic reform of state policies and
practices to support CTE implementation of effective practices at the local level.
The C2C coalition includes employers, state educational systems, funders, and workforce and economic
development agencies. The DOE’s partners have made education a policy priority and have taken a leading role in
implementation. Primary examples include the Hawaii Business Roundtable, which cites working with K-12 and
higher education to strengthen career readiness as a top priority in its policy action agenda for 2017 and the
Chamber of Commerce of Hawaii, which is hosting quarterly industry sector summits by island to gather
information about industry needs that reflect regional realities. Sector foci include finance and banking,
cybersecurity, carpentry, food manufacturing, health occupations, computer science, and construction and
engineering.
194 State of Hawaii, Department of Education. (2017). Connect to Careers – C2C. Retrieved from: http://www.hawaiipublicschools.org/TeachingAndLearning/StudentLearning/C2C/Pages/home.aspx. 195 Ibid.
PAGE 75
2.3 Number of Post-Secondary Science and Engineering Students:
The University of Hawaii’s Institutional Research and Analysis Office maintains the data of students studying
post-secondary science and engineering within the University of Hawaii system. To assess the growth of
education pursuing science and engineering, this report will provide the University of Hawaii’s Institutional
Research and Analysis Office compilation of science, technology, engineering, and mathematics (STEM) degrees
and certificates awarded system-wide between 2007 and 2017 as reflected in Table 15.
Table 15. Historical Table of STEM Degrees and Certificates, Earned by College, Statewide (2007 – 2017)
2.4 Gross Licensing Revenue from Commercialized University Research:
This information was not available.
2.5 The Level of University, Government, and Private Sector Research and Development:
This information was not available.
2008-2009
2009-2010
2010-2011
2011-2012
2012-2013
2013-2014
2014-2015
2015-2016
2016-2017
University of Hawaii at Manoa
734 735 720 761 867 873 1,016 1,062 976
University of Hawaii at Hilo
133 107 143 134 153 122 153 158 183
Hawaii Community College
22 21 18 14 23 19 15 36 40
Honolulu Community College
41 50 40 52 72 60 63 162 132
Kapiolani Community College
28 28 34 57 89 77 110 127 155
Kauai Community College
5 4 8 5 4 7 5 9 22
Leeward Community College
6 4 5 10 18 29 66 133 128
University of Hawaii Maui
College
3 8 21 18 29 23 15 33 35
Windward Community College
N/A N/A N/A N/A 9 11 39 23 29
TOTAL 972 957 989 1,051 1,264 1,221 1,482 1,743 1,700
NOTE: Effective Fall 2014, STEM counts were revised due to the addition of selected codes from the 04, 09, 10, 13, 28, and 29 CIP categories. These codes are found on the Department of Homeland Security's list of STEM programs and have been added to UH's STEM list. STEM counts from terms prior to Fall 2014 also reflect this updated definition. In Fall 2013, the CIP code for Honolulu Community College's APTR (Applied Trades) major was changed from 15.0699 (STEM) to 46.0000 (non-STEM). In order to be consistent with the current coding for this major, this code will need to be excluded when obtaining Honolulu CC STEM counts for terms prior to Fall 2013. **In Spring 2015, UH’s STEM definition was revised to align solely with the DHS STEM definition. ***No University of Hawaii-West Oahu data was provided in this dataset. Source: University of Hawaii System, Institutional Research and Analysis Office, Degrees Table 7. Historical Table of STEM Degrees and Certificates, Earned by College Fiscal Years (July 1 to June 30) 2008-09 to 2016-17.
PAGE 76
2.6 The Number of Living Wage Jobs as a Percentage of Total Jobs In Hawaii, Compared to the
National Average:
Unfortunately this report found that there is no data available on the number of living wage jobs as a percentage
of total jobs in Hawaii, compared to the national average. Act 12 (Special Session Laws of 2008), codified as §201-
3(5) of the Hawaii Revised Statutes was enacted to require the Department of Business Economic Development
and Tourism (DBEDT), beginning in 2008, to establish and update biennially a self-sufficiency standard
incorporating existing methods of calculation, and reflecting costs relating to housing, food, child care,
transportation, health care, clothing and household expenses, taxes, children’s ages, geography, and the number
of household wage earners.196 Table 16 summarizes DBEDT’s six biennial self-sufficiency reports which describe
Hawaii’s self-sufficiency income standards.
Table 16. Hawaii Self-Sufficiency Income Standards (2007 – 2016)
One Adult Two Adult
Family One Adult + One
Pre-Schooler
One Adult + One Pre-Schooler +
One School-Age Child
Two Adults + One Pre-Schooler +
One School Age Child
2007 $26,151 $35,092 $41,761 $49,852 $55,581
2009 $28,257 $36,936 $45,373 $55,135 $61,394
2011 $33,009 $41,528 $51,106 $61,893 $68,466
2013 $31,901 $41,183 $55,031 $67,006 $73,799
2014 $31,409 $40,756 $53,766 $65,748 $72,737
2016 $32,957 $42,371 $56,157 $69,318 $75,947
Source: DBEDT Self-Sufficiency Income Standard Estimates Reports 2009, 2011, 2012, 2014, 2015, 2017.
Economic self-sufficiency is defined as the amount of money that a household requires to meet its basic needs
without public assistance. Statewide, the percentages of families below the self-sufficiency standard in 2016
were197:
44.1% of single-adult families with no children
21.5% of two-adult families with no children
50.8% of single-adult families with one pre-school child
31.7% of two-adult with two children
According to Hawaii Appleseed’s 2016 publication, The State of Poverty in Hawaii: How Hawaii’s Low Income
Residents are Faring Post-Recovery, these metrics lead to the same conclusion, that “far too many working families
cannot afford to get by in Hawaii” (p.6).198
196 Hawaii Revised Statutes §201-3 (5). Retrieved from: https://www.capitol.hawaii.gov/hrscurrent/Vol04_Ch0201-0257/HRS0201/HRS_0201-0003.htm. 197 State of Hawaii, Department of Business Economic Development and Tourism. (2017). Self-Sufficiency Income Standard Estimates for Hawaii 2016. Retrieved from: http://files.hawaii.gov/dbedt/economic/reports/self-sufficiency/self-sufficiency_2016.pdf. 198 Hawaii Appleseed Center for Law and Economic Justice. (2016). The State of Poverty in Hawaii. Retrieved from: http://hiappleseed.org/sites/default/files/State%20of%20Poverty%20%5BFINAL%5D.pdf.
PAGE 77
A new tool called “The Living Wage Calculator” was developed in 2015 by Massachusetts Institute of Technology
(MIT) professors and researchers to present a realistic estimate, tailored by region, and the cost of living across
the nation.
According to MIT’s “Living Wage Calculator” the living wage calculation for Hawaii shown is the hourly rate that
an individual must earn to support their family, if they are the sole provider and are working full-time (2,080
hours per year). All values in Table 17 are per adult in a family unless otherwise noted. The state minimum
wage is the same for all individuals, regardless of how many dependents they may have. The poverty rate is
typically quoted as the gross annual income. MIT converted it to an hourly wage for the sake of comparison.
Table 17. Massachusetts Institute of Technology’s Living Wage Calculation for Hawaii (2016)
MIT compares state living wages to national living wages based on a family of four (two working adults, two
children) before taxes.199 According to MIT’s most recent 2016 data update, the results found that state
minimum wages provide for only a portion of the living wage. The results found that for two adult, two
children families, and the minimum wage covers 41.5% of the living wage in Hawaii, which found Hawaii as the
worst in the nation.200 “This means that families earning between the poverty threshold ($24,491 for two
working adults, two children on average in 2016) and the living wage ($65,860 on average for two working
adults, two children per year before taxes), may fall short of the income and assistance they require to meet
their basic needs.”(Living Wage Calculator, 2016 Data Update, para 5.)
199 Glasmier, Amy, PhD and the Massachusetts Institute of Technology. (2016). Living wage Calculator: New Data: Calculating the Living Wage for US States, Counties and Metro Areas. Retrieved from: http://livingwage.mit.edu/articles/19-new-data-calculating-the-living-wage-for-u-s-states-counties-and-metro-areas. 200 Glasmier, Amy, PhD, and Carey Anne Nadeau, Opendata.com and the Massachusetts Institute of Technology. (13 April 2017). Results from the 2016 Data Update. Retrieved from: http://livingwage.mit.edu/articles/23-results-from-the-2016-data-update.
Source: Massachusetts Institute of Technology, Living Wage Calculator. June 2016.
PAGE 78
2.7 Dollars Spent in Locally Owned Businesses:
This report found that there was no data measuring this indicator of the Hawaii 2050 Sustainability Plan.
2.8 Value of Goods and Services Imported and Exported:
The US Census provides the value of total Hawaii imports (by state of final destination) and exports (by origin of
movement series) in the value of millions of dollars, this information is reflected in Table 18.201, 202
Table 18. Hawaii’s Total Import and Export Values (2013 – 2016)
2013 2014 2015 2016
Import
(value in millions of dollars) 6,097 5,329 3,756 2,931
Export
(value in millions of dollars) 599 1,447 1,896 795
Source: U.S. Census State Imports for Hawaii, State Exports from Hawaii.
2.9 Income of Top Quintile Relative to the Bottom Quintile:
The Department of Business Economic Development and Tourism (DBEDT) arranged Hawaii’s 2016 income quintile
information reflected in Table 19 for the purposes of this report.
A quintile is a statistical value of a data set that represents 20% of a given population, so the first quintile
represents the lowest fifth of the data (1 - 20%); the second quintile represents the second fifth (21% - 40%); the
third quintile represents the third fifth (41% - 60%); the fourth quintile represents the fourth fifth (61% - 80%); and
the fifth quintile represents the highest fifth (81% - 100%).
Table 19. Hawaii State Household Income in Quintiles (2016)
Quintile of Household Income
20% $31,000
40% $59,140
60% $91,000
80% $141,000
100% Highest value in sample ($985,200)
NOTE: The value of $985,200 is the highest value in the sample dataset, therefore, at the 100% level. Source: U.S. Census Bureau American Community Survey 1-Year PUMS 2016, compiled by DBEDT.
The data in Table 19 show the random sample of the household population in the state, rather than the decennial
census that includes all households in the population. The bottom 20% of households have a household income of
$31,000 or less. The top 20% of households have a household income of $141,000 or more.
201 U.S. Census. (2016). State Imports for Hawaii (2013-2016). Retrieved from: https://www.census.gov/foreign-trade/statistics/state/data/imports/hi.html. 202 U.S. Census. (2016). State Exports from Hawaii. (2013-2016). Retrieved from: https://www.census.gov/foreign-trade/statistics/state/data/hi.html.
PAGE 79
2.10 Proportion of Food Produced And Consumed Locally:
Presently, there is no data measuring local food production compared to local food consumption.
2.11 Dollar Value and Number of Acres in Agricultural Production:
The Statewide Agricultural Land Use Baseline, 2015 provided the most recent analysis of local acreage of
agricultural production throughout the State of Hawaii. The report noted that between 1980 and 2015,
agricultural lands with active crop use declined from 350,830 acres to 151,830 acres in 2015. Similarly
agricultural lands in pasture use declined from 1.1 million acres to 761,430 acres in 2015.203 Figures 24 and 25
compare the severe decline of agricultural lands between 1980 and 2015. As of 2015, the combined acreage
in agricultural production was 913,260 acres; this was a reduction of 56% of agricultural lands with crop use
and a 30% decrease of Hawaii’s pasture lands over the past 35 years.204
The 2016 Hawaii State Data Book identified the growth of cost between 2007 and 2012 on the average
valuation of land and buildings per farm from $1,146,213 in 2007 to $1,461,342 in 2012, a growth rate of 27%
or $315,129 in five years.205 Average valuation of land and buildings per acre between 2007 and 2012 also
increased from $7,688/acre to $9,058/acre in 2012, increasing by $1,370.00 or 17% in five years.206
203 State of Hawaii, Department of Agriculture. (2015). Statewide Agricultural Land Use Baseline, 2015. Prepared by: The University of Hilo, Spatial Data Analysis & Visualization Research Lab. Retrieved from: Retrieved from: http://hdoa.hawaii.gov/wp-content/uploads/2016/02/StateAgLandUseBaseline2015.pdf. 204 Ibid. 205 State of Hawaii Data Book. (2016). Section 19- Agriculture. Retrieved from: http://dbedt.hawaii.gov/economic/databook/2016-individual/_19/ 206 Ibid.
Figure 24. Hawaii’s Agricultural Land Utilization in 1980. Source: Statewide Agricultural Land Use Baseline, 2015.
Hawaii Agricultural Land Use in 1980
Figure 25. Hawaii’s Agricultural Land Utilization in 2015. Source: Statewide Agricultural Land Use Baseline, 2015.
Hawaii Agricultural Land Use in 2015
PAGE 80
Goal 3: Sustainable Environment and Natural Resources
The Hawaii 2050 Sustainability Plan highlighted the importance to preserve Hawaii’s environment and natural
resources, noting that in 2008 the U.S. Environmental Protection Agency found that 64% of Hawaii’s streams were
considered “impaired” by pollutants and the ratio of renewable energy (5%) vs. fossil fuel use (95%) ranked Hawaii
as among the worst in the nation. The plan warned that “as we look toward a sustainable future, we must also
prepare for the realities of rising fuel costs and climate change” (p. 35).
The U.S. Global Change Research Program published the Fourth National Climate Assessment in 2017 through the
Climate Science Special Report. The report provided the scientific evidence that the Earth has experienced the
warmest period in the history of modern civilization over the past 115 years, while global annual average surface
air temperatures have increased by 1.8° Fahrenheit between 1901 and 2016.207 To measure this goal of
establishing a sustainable environment and natural resources, the Hawaii 2050 Sustainability Plan provided seven
strategic actions and the following ten indicators.
207 Wuebbles, D.J., D.W. Fahey, K.A. Hibbard, B. DeAngelo, S. Doherty, K. Hayhoe, R. Horton, J.P. Kossin, P.C. Taylor, A.M. Waple, and C.P. Weaver, 2017: Executive summary. In: Climate Science Special Report: Fourth National Climate Assessment, Volume I [Wuebbles, D.J., D.W. Fahey, K.A. Hibbard, D.J. Dokken, B.C. Stewart, and T.K. Maycock (eds.)]. U.S. Global Change Research Program, Washington, DC, USA, pp. 12-34, doi: 10.7930/J0DJ5CTG.
STRATEGIC ACTIONS:
1. Reduce reliance on fossil (carbon-based) fuels.
2. Conserve water and ensure adequate water supply.
3. Increase recycling, reuse, and waste reduction strategies.
4. Provide greater protection for air, and land-, fresh water-, and ocean-based
habitats.
5. Conserve agricultural, open space, and conservation lands and resources.
6. Research and strengthen management initiatives to respond to rising sea levels,
coastal hazards, erosion, and other natural hazards.
7. Develop a comprehensive environmental mapping and measurement system to
evaluate the overall health and status of Hawaii’s natural ecosystems.
10 INDICATORS:
1. Percentage of renewable and alternative energy produced locally.
2. Percentage of solid waste recycled and diverted from landfills.
3. Percentage of treated wastewater reused.
4. Percentage of lands and water protected for native plants and animals.
5. Percentage of leadership in energy and environmental design (LEED)-type building
permits issued.
6. Percentage of new urban developments consistent with “smart growth” principles.
7. Percentage of shorelines threatened or retreating, and rate of loss.
8. Pollution level in streams, aquifers and coastal waters.
9. Number and types of invasive species introduced to Hawaii annually, including
intra-island migration.
10. Water level in streams and aquifers.
PAGE 81
Summary of Progress toward the “Sustainable Environment and Natural Resources”
Strategic Actions and Indicators:
The Hawaii 2050 Sustainability Plan’s third goal; to manage Hawaii’s natural resources so that they are able to
replenish themselves, has slowly progressed over the past decade.
Hawaii’s Fresh Water Security Needs Strengthening
As mentioned in Goal One’s summary, data measuring Hawaii’s water reuse: pollution levels in Hawaii’s streams,
aquifers, and coastal waters; and decreasing streamflows and base flow show that Hawaii’s fresh water is not
secured for the future. The indicators show that statewide wastewater reuse is low, pollution levels are high,
and streamflows are decreasing. The Blueprint for Action can serve as a reference to establish a statewide
framework to coordinate future water security policies, projects, funding, and initiatives throughout Hawaii.
Sustainable Land Use Needs to be Implemented
No data was collected measuring smart growth development statewide. Ten years later, best practices offer
other solutions to improve sustainability through land use including increasing green infrastructure
development, increasing water recharge opportunities and catchment, increasing open space, improving
agricultural land uses, increasing the pedestrian and bike access throughout communities, increasing multi-
modal systems, reducing urban sprawl, and reducing urban heat-island effects.
Updated comprehensive planning through the counties’ general and community plans and the State’s functional
plans to integrate sustainability plans, resiliency plans, and climate adaptation plans can serve as a foundation
for a Hawaii’s future in sustainable land use. Important agricultural lands (IAL) need to be identified and
designated to plan for Hawaii’s future in local food and agricultural production. Statewide boundary reviews will
also assist land use coordination to determine which areas should be protected to replenish Hawaii’s natural
resources while supporting Hawaii’s growing population and economic demands.
Not Many LEED-Certified Facilities
Only 179 facilities were certified as sustainable LEED facilities statewide; of those, only 41 are owned by the
State of Hawaii. Additional LEED-certified facilities will improve the statewide practice of sustainability, as well
as reduce energy, water, waste consumption, and costs overtime.
Recycling is Low
A law calling for the State of Hawaii to recycle 50% of its material by January 2000 has not yet been achieved.
Fifteen years later, Hawaii hit its highest recycling measurement of 43% in 2015.
Hawaii’s Climate is Changing
Many policies and data identify the many indicators of a changing climate. 70% of Hawaii’s coastline is eroding;
Hawaii’s streams are drying; the amount of rainfall is decreasing; and Hawaii’s corals are bleaching.
Sustainability policies and comprehensive planning can assisting Hawaii to adapt to its changing climate.
PAGE 82
Measurement of Indicators:
3.1 Percentage of Renewable and Alternative Energy Produced Locally:
As previously indicated, since its establishment in 2008,
the Hawaii Clean Energy Initiative (HCEI) was the main
policy which led Hawaii toward a clean energy future
based on locally produced renewable energies. Over
the past decade, Hawaii’s renewable portfolio standard
(RPS) experienced a growth rate of 18%, and surpassed
its recent mandated RPS goal of 15% RPS by 2015 as
depicted in the Figure 26.
According to the Hawaii State Energy Office’s Facts and Figures May 2017 Report, renewable energies generated
statewide in 2016 were diversified as depicted in Figure 27.
8.6% 9.4% 9.5%
9.5%
11.9%13.7%
18.0%
21.1%
23.4%
26.6%
10% Goal 15% Goal0.0%
5.0%
10.0%
15.0%
20.0%
25.0%
30.0%
2007 2008 2009 2010 2011 2012 2013 2014 2015 2016
Hawaii Renewable Portfolio Standard Progress (2007-2016)
Renewable Portfolio Standard Mandated goal
Figure 26. Hawaii Renewable Portfolio Standard Progress (2007-2016). Sources: Hawaii Renewable Portfolio Standards Act and Hawaii State Energy Office
Distributed PV
33%
Utility Scale PV5%Wind
27%
Hydro4%
Geothermal10%
Biofuels2%
Biomass19%
2016 Statewide Renewable Energy Generation (GWHS)
Figure 27. 2016 Statewide Renewable Energy Generation. Source: Hawaii State Energy Office
26.6% OF HAWAII’S ENERGY IS
RENEWABLE
Hawaii State Energy Office
PAGE 83
3.2 Percentage of Solid Waste Recycled and Diverted from Landfills:
The State’s Department of Health’s Office of Solid
Waste Management provides annual reports to the
Legislature measuring the State’s progress toward
achieving the State’s 50% recycling goal by 2000
(pursuant to §342G-3 of the Hawaii Revised
Statutes).
Presently, as shown through Figure 28, Hawaii’s most recently measured recycling rate was 43% in 2015, and
the State has not yet fulfilled its 50% recycling goal by the year 2000. The Office of Solid Waste Management
annually calculates the amount of waste diversion performed by the counties and combines these
measurements to determine Hawaii’s diversion rate. According to Office of Solid Waste Management Annual
Reports, “diversion” refers to the combination of reuse and recycling activities; it does not include landfilling,
incineration, or waste to energy processes.208 This “diversion rate” is composed primarily of recycling activity
and a small amount of reuse activity of each county’s tonnage of waste diverted.
208 State of Hawaii Department of Health, Office of Solid Waste Management. (2015). 2016 Annual Report to the Legislature. Retrieved from: https://health.hawaii.gov/shwb/files/2013/06/2016_OSWM_Annual_Report.pdf.
Figure 28. Statewide Diversion Rate (FY 2005 - 2015) Compiled from data provided by Hawaii State Department of Health Office of Solid Waste Management Annual Reports between 2005 and 2016.
43% OF HAWAII’S SOLID WASTE
IS RECYCLED Department of Health,
Office of Solid Waste Management
PAGE 84
3.3 Percentage of Treated Wastewater Reused:
Wastewater is increasingly being viewed as a
commodity with potential for resource recovery and
reuse.209 The State Department of Health’s Wastewater
Branch monitors the reuse of wastewater throughout
the state. Figure 29 shows that as of 2016, 12.84% of
Hawaii’s wastewater is reused statewide, this is a
decrease from Hawaii’s highest wastewater reuse
percentage of 16.4% in 2014.
Hawaii Fresh Water Initiative
The Hawaii Fresh Water Council Blueprint for Action: Water Security for an Uncertain Future, 2016-2018 recognized
the need for a more integrated “One Water” approach to sustainable water management for Hawaii’s future.210
One of the Blueprint for Action’s three goals focuses on water reuse, thus replacing the demand for potable water
to be used for irrigation and other purposes. If fulfilled, this goal would yield 30 MGD in increased water
availability by 2030.
Reuse: More than double the amount of wastewater currently being reused in the islands to 50 MGD
while reducing by nearly half the amount of wastewater currently being discharged directly into the
ocean around the Hawaiian Islands. By 2030, this goal will yield a target 30 MGD in increased water
availability.
209 American Planning Association. (2017). PAS Report: Planners and Water. https://www.planning.org/publications/report/9131532/. 210 Hawaii Community Foundation, Hawaii Fresh Water Initiative. (2015). A Blueprint for Action: Water Security for an Uncertain Future, 2016-2018. Retrieved from: https://www.hawaiicommunityfoundation.org/learning/a-blueprint-for-action-water-security-for-an-uncertain-future-2016-2018.
Figure 29. Statewide Wastewater Reuse (2007- 2016). Compiled from data provided by Hawaii State Department of Health’s Wastewater Branch.
16.27% 15.94% 15.94%15.85%
13.93%14.99% 15.88%
16.42%
12.16%
12.84%
0.00%
2.00%
4.00%
6.00%
8.00%
10.00%
12.00%
14.00%
16.00%
18.00%
0
20
40
60
80
100
120
140
160
2007 2008 2009 2010 2011 2012 2013 2014 2015 2016
PER
CEN
TAG
E R
EUSE
DW
AST
EWA
TER
REU
SED
/TO
TAL
WA
STEW
ATE
R
TREA
TED
(MG
DS)
MIL
LIO
N G
ALL
ON
S P
ER D
AY
(MG
D)
Statewide Treated Wastewater Reuse (2007-2016)
Total Wastewater Treated (MGD) Wastewater Reused (MGD) Percentage Reused
12.84% OF HAWAII’S TREATED
WASTEWATER IS REUSED Department of Health,
Wastewater Branch
PAGE 85
The Blueprint for Action recommended the following implementation policies by the end of 2018 211:
Revise the Hawaii Department of Health’s Water Reuse Guidelines:
o According to the State Department of Health, Hawaii’s Water Reuse Guidelines were
revised on January 2016.212
Revise Greywater Guidelines (by promoting the expanded use of greywater for landscape irrigation
and groundwater recharge via updated state and county rules for new construction, while also
allowing facilities and homeowners to retrofit current plumbing systems, and prioritizing the
adoption of the 2012 Uniform Plumbing Code):
o Act 141 (HB 637), 2017: Required the State Building Code Council to adopt codes or
standards within two years of official publication; otherwise, the codes will be automatically
adopted into the Hawaii State Building Code until such adoption is effectuated.213
Increase Water Reuse for Large Landscaped Areas
Water reclamation laws were also recently enacted, including:
Act 229 (HB 1394), 2015: Established a water scalping pilot project water scalping feasibility study
at DOT Airports.214
Act 170 (HB 1749), 2016: Amended the goals of the Hawaii water plan to include the utilization of
reclaimed water for uses other than drinking and for potable water needs in all state and county
facilities by 2045.215
Water Reclamation in the Department of Transportation
The State Department of Transportation recently completed its Feasibility Study on the Use of Water Scalping
Technology at Honolulu International Airport, Kahului Airport, Kona International Airport at Keahole, and Hilo
International Airport. The feasibility study described water scalping as a process that can be used to convert the
liquid portion of wastewater into reusable water for irrigation, non-potable uses, and even human
consumption. The feasibility study offers thorough recommendations of water scalping options to assist in
addressing the limited water resources available in the state without compromising.
Water Reclamation in the Department of Education
DOE schools on Oahu also began to participate in the Small Municipal Separate Storm Sewer System (MS-4)
Program, the Environmental Protection Agency’s effort to preserve, protect, and improve water resources from
polluted storm water runoff. Information on how families can participate is available on several Oahu schools’
websites. In addition, many schools have developed storm water management plans and provided curriculum
resources to educators, including:
Niu Valley Middle School216
Pearl Ridge Elementary School217
Kaneohe Elementary School,218 and
Hokulani Elementary School219
211 Hawaii Community Foundation, Hawaii Fresh Water Initiative. 2015. A Blueprint for Action: Water Security for an Uncertain Future, 2016-2018. https://www.hawaiicommunityfoundation.org/learning/a-blueprint-for-action-water-security-for-an-uncertain-future-2016-2018. 212 State of Hawaii, Department of Health, Wastewater Branch, Recycled Water Program. (2016). Retrieved from: http://health.hawaii.gov/wastewater/home/reuse/. 213 Hawaii Revised Statutes §107-24. Retrieved from: http://capitol.hawaii.gov/measure_indiv.aspx?billtype=HB&billnumber=637&year=2017. 214 Act 229, Session Laws of Hawaii. (2015). Water Reclamation. Retrieved from: https://www.capitol.hawaii.gov/Archives/measure_indiv_Archives.aspx?billtype=HB&billnumber=1394&year=2015. 215 Hawaii Revised Statutes §174C-31. Hawaii Water Plan. Retrieved from: https://www.capitol.hawaii.gov/session2016/bills/HB1749_CD1_.pdf. 216 Niu Valley Middle School. (2017). Sustainability. Retrieved from: http://www.niuvalleymiddle.org/sustainability/. 217 Pearl Ridge Elementary School. (2017). MS4 Water Pollution Prevention Program. Retrieved from: http://pearlrid.k12.hi.us/. 218 Kaneohe Elementary School. (2017). MS4 Water Pollution Prevention Program. Retrieved from: https://sites.google.com/a/kaneohe.k12.hi.us/internet/. 219 Hokulani Elementary School. (2017). MS4 Water Pollution Prevention Program. Retrieved from: https://sites.google.com/a/kaneohe.k12.hi.us/internet/.
PAGE 86
3.4 Percentage of Lands and Water Protected for Native Plants and Animals:
Percentage of Watershed Forests Protected:
Protecting native forests is a critical tool for adapting
to climate change’s drying effects, and will make
Hawaii more resilient in extreme weather events by
reducing landslides, flooding, and runoff. Because of
this, the Department of Land and Natural Resources (DLNR) elevated watershed protection as its top priority.
Hawaii’s Watershed Partnership Program provides technical and financial support for the implementation of the
DLNR Management Plans. Watershed partnerships are voluntary alliances of both public and private landowners
committed to the common value of protecting forested watersheds for water recharge, conservation, and other
Since 2008, two new watershed partnerships were established, totalling to ten watershed partnerships statewide.
Presently these ten statewide partnerships are active on five islands—one partnership in Kauai, two partnerships
in Oahu, one partnership in Molokai, three partnerships in Maui, and three partnerships in Hawaii
Island. Together, these partnerships involve over 74 private landowners and public agencies that encompass 2.2
million acres of land in the state.220
In 2011, the DLNR launched a Watershed Protection Plan entitled, The Rain Follows the Forest: A Plan to Replenish
Hawaii’s Source of Water. This plan identified priority watersheds statewide and consisted of 20% of land area
(843,000 acres) of the state; these priority watersheds were determined to play a key role in generating the state’s
water supply.221 The 2011 Watershed Protection Plan identified the watershed priority areas that are depicted in
Figure 31.222
220 Hawaii Association on Watershed Partnerships. (2017). Watershed Partnerships. Retrieved from: http://hawp.org/partnerships/. 221 State of Hawaii, Department of Land and Natural Resources. (2014). DLNR Accelerating Forest Protection to Secure Hawaii’s Water Supply. Retrieved from: http://dlnr.hawaii.gov/blog/2014/02/14/nr14-025/. 222 State of Hawaii, Department of Land and Natural Resources. (2011). Hawaii’s Watershed Priority Areas. Retrieved from: http://dlnr.hawaii.gov/rain/.
Figure 31. Hawaii’s Watershed Priority Areas. (2011) Source: Department of Land and Natural Resources
Figure 30. Hawaii Watershed Partnerships. (2015) Source: Department of Land and Natural Resources, Division of Forestry and Wildlife
16% OF HAWAII’S PRIORITY
WATERSHEDS ARE PROTECTED Department of Land and Natural Resources,
Division Forestry and Wildlife
PAGE 87
The DLNR estimated that 50% of Hawaii’s native forests declined over the past two hundred years, resulting in
only 90,000 acres (10% of the priority watersheds) of Hawaii’s watersheds being protected in 2011.223 This 2011
plan called to double the protection of the 90,000 acres of priority watershed over the next ten years (protecting
180,000 acres by 2021).224 Since 2011, the DLNR was able to protect a total of 132,000 priority acres, or 16% of
DLNR’s priority watershed forests, which increased from the 90,000 acres baseline in 2011. Figure 32 reflects
the growth of 42,000 acres of priority watersheds protected within the past six years:
In 2016, the DLNR committed to conserve and protect 30% of Hawaii’s priority watershed forests (253,000 acres)
by the target date of 2030 as depicted in Figure 33. DLNR’s Forest Action Plan, published in 2016, elaborates
that this target includes the fencing and removal of non-native hooved animals from targeted core areas,
control of invasive plants in priority native forests, prevention and control of wildfires, combating forest
diseases and pests, and planting native trees in order to protect watershed forests.225 To fulfill this 30% target,
the DLNR will need to protect the remaining 121,000 acres within the next 12 years.
223 State of Hawaii, Department of Land and Natural Resources. (2014). The Rain Follows the Forest Public Service Announcement. Retrieved from: https://www.youtube.com/watch?v=FiYcvntog74. 224 University of Hawaii Economic Research Organization. (2012). Financing Watershed Conservation. Retrieved from: http://www.uhero.hawaii.edu/news/view/185. 225State of Hawaii, Department of Land and Natural Resources, Division of Forestry and Wildlife. (2016). Hawaii Forest Action Plan. Retrieved from: https://dlnr.hawaii.gov/forestry/files/2013/09/Hawaii-Forest-Action-Plan-2016.pdf.
Figure 32. Total Priority Watershed Acreage Protected Statewide (2011-2017). Compiled from data provided by Hawaii State Department of Land and Natural Resources, Division of Forestry and Wildlife.
90,000
105,000113,000
120,500127,000 132,000
10%
12%13%
14%15%
16%
0%
2%
4%
6%
8%
10%
12%
14%
16%
18%
0
20,000
40,000
60,000
80,000
100,000
120,000
140,000
Nov 3 2011 Dec 312013
Oct 232014
July 6 2015 Dec 102015
July 192017
Per
cen
tage
of
Tota
l Wat
ersh
ed A
cres
P
rote
cted
Tota
l Acr
es P
rote
cted
Total Priority Watershed Acreage Protected Statewide (2011-2017)
Watershed Acreage Fenced Percentage Protected
Figure 33. Hawaii’s Priority Watersheds Acres Protected (2016). Source: Department of Land and Natural Resources, Forest Action Plan, 2016.
PAGE 88
Percentage of Marine Waters Protected:
As an island archipelago, Hawaii is particularly
dependent on a healthy marine ecosystem. Marine
Protected Areas (MPAs) are often described by broad
characteristics and classifications, however a U.S.
Executive Order defines MPAs as “any area of the
marine environment that has been reserved
by Federal, State, territorial, tribal, or local
laws or regulations to provide lasting
protection for part or all of the natural and
cultural resources therein.”226 The intention
for this marine protection is to “enhance the
conservation of our natural and cultural
marine heritage and the ecologically and
economically sustainable use of the marine
environment for future generations.”227
According to the United Nations,
approximately 5% of oceans are protected
globally.228 The DLNR-Division of Aquatic
Resources (DAR) measured as of June 2016;
13.1% of Hawaii’s marine waters were under
active management.229
Figure 34 maps the Federal and State marine
managed areas throughout Hawaii.
The Office of Planning is also in the process of updating Hawaii’s Ocean Resources Management Plan (ORMP); this
statewide plan sets forth the State’s ocean and coastal resource management priorities. The ORMP supports the
effective management, beneficial use, protection, and development of the State’s coastal zone, which includes all
lands of the State and area extending seaward from the shoreline to the limit of the State’s police power and
management authority, including U.S. territorial sea. The ORMP identifies 11 management priorities for the next
five years by identifying responsible agencies and resources and by providing a method for performance measures
and reporting. The most recent ORMP was published in 2013, and will be updated as a part of its five year update
by 2018.230
226 Executive Order No. 13158, 3 C.F.R. p. 273, (2000). 227 Ibid. 228 United Nations, Sustainable Development Goals. (2016). More than 5 per cent of world’s oceans now protected with more commitments underway (blog post). Retrieved from: http://www.un.org/sustainabledevelopment/blog/2016/12/more-than-5-per-cent-of-worlds-oceans-now-protected-with-more-commitments-underway-un-environment-wing/. 229 State of Hawaii, Aloha+ Challenge Dashboard. (2017). Active Marine Management. Retrieved from: https://dashboard.hawaii.gov/en/stat/goals/5xhf-begg/4s33-f5iv/ydtj-mhwg. 230 State of Hawaii, Office of Planning. (2013). Hawaii Ocean Resources Management Plan. Retrieved from: http://files.hawaii.gov/dbedt/op/czm/ormp/ormp_update_reports/final_ormp_2013.pdf.
Figure 34. Marine Managed Acres in Hawaii State Waters out to 3 NM. Source: NOAA MPA Center, 2014. Hawaii State GIS Program, 2015. Map by: Pacific Cartography for the Hawaii Conservation Alliance, 2016.
13.1% OF HAWAII’S MARINE
WATERS ARE UNDER
ACTIVE MANAGEMENT Department of Land and Natural Resources,
Division of Aquatic Resources
PAGE 89
Coral Bleaching
Hawaii’s coral reefs are a local and national treasure, providing cultural, economic, and recreational
opportunities for residents and visitors. A 2004 study found that the average annual value of coral reef
ecosystems in Hawaii generates $364 million each year.231 Hawaii experienced its first statewide
mass-bleaching event in 2015 as depicted in Figure 35.
Since 1998 the Earth has experienced three global coral bleaching events. The first in 1998, second in 2010,
and 2015 revealed a third global coral bleaching event.232 Coral Bleaching, as depicted in Figure 36, is a stress
response, generally induced by high temperature and light levels, where the coral animal expels zooxanthellae,
or photosynthetic dinoflagellates that provide coral polyps with energy. Bleached corals are in a weakened
state and will eventually die if temperature and light levels remain high.233
In August 2014, thermal stress began to cause bleaching throughout the Hawaiian Archipelago. Of the main
Hawaiian Islands, Kauai, Oahu, and Maui observed the majority of coral bleaching in 2014.234 Coral bleaching
was more severe in 2015, with the most extreme bleaching occurring in west Hawaii and Maui, which resulted
in extensive coral mortality in west Hawaii and Maui. Although mortality varied among sites, overall average
coral cover loss at surveyed sites in west Hawaii was 49.7% as a result of the 2015 bleaching event.235 Bleaching
mortality rates were especially catastrophic for important reef-building species.236 The coral mortality rate of
Maui’s corals was estimated at 20 - 40% following the 2015 bleaching event.237
231 Cesar, H and van Beukering, P. (2004). Economic Valuation of the Coral Reefs of Hawaii. Retrieved from: https://scholarspace.manoa.hawaii.edu/bitstream/10125/2723/1/vol58n2-231-242.pdf. 232 The Ocean Agency. (2015). The Third Global Coral Bleaching Event 2014/2017. Retrieved from: http://www.globalcoralbleaching.org/. 233 State of Hawaii, Department of Land and Natural Resources, Division of Aquatic Resources. (2017). Coral Bleaching Recovery Plan: Identifying Management Responses to Promote Coral Recovery in Hawaii. Retrieved from: https://dlnr.hawaii.gov/dar/files/2017/04/Coral_Bleaching_Recovery_Plan_final.pdf. 234 State of Hawaii, Department of Land and Natural Resources, Division of Aquatic Resources. (2014). Coral Bleaching 2014: Important Findings. Retrieved from:http://dlnr.hawaii.gov/reefresponse/current-rapid-responses/coral-bleaching-2014/. 235 National Oceanic and Atmospheric Association. (2015). Coral Reef Watch. NOAA Declares Third Ever Global Coral Bleaching Event. Retrieved from: http://www.noaanews.noaa.gov/stories2015/100815-noaa-declares-third-ever-global-coral-bleaching-event.html. 236 Ibid. 237 State of Hawaii, Department of Land and Natural Resources, Division of Aquatic Resources. (2017). Coral Bleaching Recovery Plan: Identifying Management Responses to Promote Coral Recovery in Hawaii. Retrieved from: https://dlnr.hawaii.gov/dar/files/2017/04/Coral_Bleaching_Recovery_Plan_final.pdf.
Figure 36. Understanding Coral Bleaching Events. Source: The Ocean Agency/ XL Catlin Seaview Survey, March 2015.
Figure 35. Hawaii’s Coral Bleaching Timeline (2014-2016). Source: Department of Land and Natural Resources, Division of Aquatic Resources, Coral Bleaching Recovery Plan, 2017.
PAGE 90
In response to this global coral bleaching event and its adverse effects on the corals throughout the Hawaiian
Islands, the DLNR-DAR in partnership with NOAA, the University of Hawaii, and the Nature Conservancy,
established and published the Coral Bleaching Recovery Plan: Identifying Management Responses to Promote Coral
Recovery in Hawaii (“Coral Bleaching Recovery Plan”) in March 2017.238 The plan selected priority areas that
identified the highest level of exposure to high ocean temperatures and/or experienced the highest levels of coral
mortality following the 2014-2015 global coral bleaching event. These four priority areas are 239:
1. West Hawaii,
2. Leeward Maui,
3. Kaneohe Bay of Oahu, and
4. North Kauai.
According to the Coral Bleaching Recovery Plan, these priority areas will serve as templates for management
intervention, where Hawaii’s coral reef scientists and managers have identified potential management
implementation obstacles and opportunities, as well as research needs for each of the areas in the plan.
Conservation Education
Corresponding to this indicator and the strategic actions under Goal 3, the 2008 Hawaii 2050 Sustainability Plan
urged the strengthening of funding public and private conservation education. Unfortunately, due to the lack of a
permanent government sustainability coordinating entity over the previous decade, there was no active
coordination measuring the funding of public and private conservation education for the past ten years.
This report will measure the strength of the Hawaii Youth Conservation Corps, which is a dedicated program
through Chapter 193, Part IV of the Hawaii Revised Statutes, that authorizes the State of Hawaii through the
Department of Land and Natural Resources, and other state agencies to design programs to provide healthful
outdoor training and employment for young persons and to advance the conservation, development, and
management of natural resources and recreational areas.240
Figure 37 reflects the development and impact of State funding invested in and the corresponding total volunteer
hours invested in the Hawaii Youth Conservation Corps program managed between DLNR-Division of Forestry and
Wildlife (DOFAW) and KUPU since 2008.
238 State of Hawaii, Department of Land and Natural Resources, Division of Aquatic Resources. (2017). Coral Bleaching Recovery Plan: Identifying Management Responses to Promote Coral Recovery in Hawaii. Retrieved from: https://dlnr.hawaii.gov/dar/files/2017/04/Coral_Bleaching_Recovery_Plan_final.pdf. 239 Ibid. 240 Hawaii Revised Statutes Chapter 193, Part IV. Hawaii Youth Conservation Corps. Retrieved from: https://www.capitol.hawaii.gov/hrscurrent/Vol03_Ch0121-0200D/HRS0193/HRS_0193-0031.htm.
$0
$200,000
$400,000
$600,000
$800,000
$1,000,000
$1,200,000
$1,400,000
0
20,000
40,000
60,000
80,000
100,000
120,000
140,000
160,000
2008 2009 2010 2011 2012 2013 2014 2015 2016 2017
Tota
l Sta
te F
un
din
g
Tota
l Ho
urs
of
Serv
ice
Hawaii Youth Conservation Corps Funding and Volunteer Hours (2008-2017)
State Funding to Hawaii Youth Conservation Corps Total Hours of ServiceFigure 37. Hawaii Youth Conservation Corps Funding and Volunteer Hours (2008-2017). Compiled from data provided by the Department of Land and Natural Resources, Division of Forestry and Wildlife and KUPU.
PAGE 91
3.5 Percentage of Leadership in Energy and Environmental Design (LEED)-Type Building Permits
Issued:
Due to the lack of a permanent
government sustainability coordinating
entity, there was no active coordination
measuring the percentage of LEED-type
building permits issued statewide over the
past ten years.
In 2006, the State enacted Act 96 codified as §196-9 of the Hawaii Revised Statutes, to direct state agencies
to implement, to the extent possible, the following goals 241:
1. Design and construct buildings meeting the LEED silver or two green globes rating system, or
another comparable state-approved, nationally recognized, and consensus-based guideline,
standard, or system (except if these guidelines interferes with an emergency shelter).
2. Incorporate energy-efficiency measures to prevent heat gain in residential facilities up to three-
stories in height. Where possible, buildings shall be oriented to maximize natural ventilation and
day-lighting without heat gain and to optimize solar for water heating. This provision shall apply
to new residential facilities built using any portion of state funds or is located on state lands.
3. Install solar water heating systems where it is cost-effective.
4. Implement water and energy efficiency practices in operations to reduce waste and increase
conservation.
5. Incorporate principals of waste minimization and pollution prevention, such as reducing, revising,
and recycling as a standard operating practice in programs, include programs for waste management
in construction and demolition projects and office paper and packaging recycling programs.
6. Use life cycle cost-benefit analysis to purchase energy efficient equipment such as Energy Star
products and use utility rebates, where available, to reduce purchase and installation costs.
7. Procure environmentally preferable products, including recycled and recycled-content, bio-based,
and other resource-efficient products and materials.
The US Green Building Council (USGBC) provides LEED certification and is the most widely used green building
system in the world. LEED provides a framework for the design, construction, operation, and maintenance of
green buildings, homes, and neighborhoods
that aim to help building owners and
operators to be environmentally responsible
and use resources efficiently and sustainably.
USGBC’s 2017 State Market Brief identified
only 179 LEED certified buildings statewide.
Of these 179 certified buildings, 41 are
owned by the State of Hawaii, 18 are owned
by local counties, and 116 are owned by the
Federal Government.242 Figure 38 depicts the
growth rate of LEED certified buildings
statewide from 2008 to 2017.
241 Hawaii Revised Statutes §196-9. Energy Efficiencies and Environmental Standards for State Facilities, Motor Vehicles, and Transportation Fuel. Retrieved from: http://www.capitol.hawaii.gov/hrscurrent/Vol03_Ch0121-0200D/HRS0196/HRS_0196-0009.htm. 242 U.S. Green Building Council. (2017). State Market Brief: Hawaii. Retrieved from: https://www.usgbc.org/advocacy/state-market-brief.
11 2031
5778
95
125149
166179
0
50
100
150
200
2008 2009 2010 2011 2012 2013 2014 2015 2016 2017
Tota
l LEE
D B
uild
ings
LEED Certified Buildings Statewide (2008 - 2017)
Figure 38. LEED Certified Buildings Statewide (2008-2017). Source: USGBC State Market Brief: Hawaii
41 OF THE 179 LEED-CERTIFIED
BUILDINGS THROUGHOUT HAWAII ARE
OWNED BY THE STATE GOVERNMENT U.S. Green Building Council
PAGE 92
3.6 Percentage of New Urban Developments Consistent with “Smart Growth” Principles:
Unfortunately, due to the lack of a permanent government sustainability coordinating entity over the previous
decade, no measurements of the percentage of new urban developments consistent with “smart growth”
principals were conducted over the past ten years; however, this report will summarize the recent land use
planning updates through county general plans and community plans, as well as provide recommendations to
improve sustainable land use planning.
Planning for sustainability is the defining challenge of the twenty-first century.243 The American Planning
Association explained in a recent Planning Advisory Service (PAS) 578, Sustaining Places: Best Practices for
Comprehensive Plans that as the leading policy document guiding the long-range development of local jurisdictions
across the country; the comprehensive plan has a critical role to play in meeting challenges such as resource
depletion, climate instability, and economic and social disparities. Into the twentieth century, the typical
comprehensive plan was a general policy document focused on land use and physical development. This model
began to change toward the close of the century in response to societal changes and trends in planning practice.
The American Planning Association identified key trends that likely will significantly affect comprehensive planning
practice in the twenty-first century 244:
Resilience: The increasing frequency and impacts of natural disasters, as well as severe economic
downturns, have highlighted the need for communities to become more resilient— in other words,
they need the ability to recover from disturbance and change.
Systems thinking: The traditional model of separate topical elements is being replaced by an
approach that views these topics as complex systems whose interactions determine the form and
function of an even more complex system—the community as a whole.
Community engagement: Rapid advances in digital technology are transforming the ways citizens
can be involved in the comprehensive planning process. At the same time, a critical need exists to
reach groups that are traditionally underrepresented in the process.
Equity: Increasing inequality—not just in economic status but also in basic quality-of-life issues
such as health outcomes and vulnerability to disasters—is a major national and global concern.
Implementation: In a time of fiscal constraints and questioning of the role of government,
successful implementation is vital to establish the value of planning. For the comprehensive plan,
this means establishing priorities, responsibilities, and timeframes; effectively allocating resources;
developing new implementation models; using targets and metrics to monitor progress; and
communicating stories of success.
Adaptation: Conditions that used to be considered stable, such as the climate, resource availability
and costs, and the local employment base, are increasingly subject to forces beyond the control
of local governments. Such uncertainties call for an adaptive approach that uses monitoring and
feedback mechanisms (a form of systems thinking) to adjust implementation programs on an
ongoing basis.
243 Godschalk, David and William Anderson. (2012). Sustaining Places: The Role of the Comprehensive Plan (PAS Report 567). Chicago: American Planning Association. Retrieved from: https://www.planning.org/publications/report/9026891/. 244 Godschalk, David and David Rouse. (2015). Sustaining Places: Best Practices for Comprehensive Plans (PAS Report 578). Chicago: American Planning Association. Retrieved from: https://www.planning.org/publications/report/9026901/.
PAGE 93
Some communities and regions in Hawaii have adopted certain sustainability land use practices through either
their own best practices research or through integrating smart growth, green infrastructure, open space, storm
water management, water recharge opportunities, and urban growth boundaries into their comprehensive
plans. These long-range plans are aimed at guiding the community by balancing social equity, environmental,
and economic conditions while tying together the community's goals, strategies, and implementation actions.
Adopting a separate sustainability plan, however, may integrate more resource and use planning, including:
energy-efficiency, land use, transportation, water efficiency, water reuse, green infrastructure with water
recharge opportunities, public health, recycling, renewable energy, economic development, and more.245 When
integrated, these planning principals help to improve the community's quality of life for generations to come.
Over the past decade, Hawaii’s counties have updated their respective general and community land use plans.
Many of these counties’ general plans have reiterated the need for protecting the islands’ agricultural lands for
productive and sustainable agricultural use while balancing the need for affordable housing to accommodate
forecasted population growth.
The following summary will identify whether sustainable land use best practices (for example, integrating smart
growth, the use of green infrastructure in built environments to reduce impermeable surfaces and generate
water recharge opportunities, or planning for climate change) were included in Hawaii’s comprehensive plans
and community plans.
Kauai County General Plan246: Draft
submitted June 2017. The plan
establishes core visions and goals of a
sustainable island, a healthy and
resilient people, a unique and beautiful
place, and an equitable place with
opportunity for all. The draft General
Plan highlights the importance of
sustainable development for Kauai
since “many feel the island is near or at
carrying capacity…There is also
concern that Kauai’s natural resources
and ecosystems are being irreversibly
stressed or depleted. Addressing these
issues sustainably means frankly
assessing the existing conditions and
identifying the tools and resources
available to provide for their
sustainable use and protection into the
future.” (p.33)
The draft Kauai County General Plan
establishes 19 policies to guide growth,
which center around sustainability planning principles as shown in Figure 39.
245Godschalk, David and David Rouse. (2015). Sustaining Places: Best Practices for Comprehensive Plans (PAS Report 578). Chicago: American Planning Association. Retrieved from: https://www.planning.org/publications/report/9026901/. 246 County of Kauai, Planning Department. (2017). Kauai County Draft General Plan. Retrieved from: http://plankauai.com/.
Figure 39. Kauai Draft General Plan Policies to Guide Growth Source: Kauai County Planning Department
PAGE 94
o South Kauai Community Plan247: Adopted in 2015, the plan discussed sustainability principles
including walkable mixed use communities, support for a comprehensive water strategy,
runoff and erosion prevention, renewable energy generation, climate change mitigation
strategies, eco-friendly tourism, local food and sustainable farming practices, and important
agricultural land designations, among others.
o East Kauai Development Plan248: Update is underway.
o Lihue Community Plan249: Adopted in 2015, the plan incorporated seven recommendations
for policies within the plan to be: sustainable, compact, connected, place-based, mixed use,
multi-modal, and vital and attractive. The plan focused on smart growth and sustainability
principles and recommends a Lihue urban edge boundary, increasing the availability of
LEED-certified buildings, adding a materials recycling facility, restoring storm irrigation to
reduce runoff, enhancing area walkability and bikeability, identifying important agricultural
land designations, and recommending mitigation and adaptation strategies for future
climate change.
City and County of Honolulu, Oahu 2035: The General Plan Focused Update is currently underway.
It will review the critical issues of growth, development, and quality of life that island residents are
most concerned about, including regional population, economic health, affordable housing, and
sustainability. The City and County’s Department of Planning and Permitting (DPP) and its
consultant released the Second Public Review Draft of the General Plan in February 2017. There
was a public comment period until May 7, 2017. The DPP anticipates submitting a final plan in
March 2018 to the Planning Commission, which will hold a public hearing before making a
recommendation to the City Council for review and adoption.250
o Honolulu General Plan Update: Sustainability Trend Report, 2011251: Was published to
present information about the concept of sustainability as it relates to the City & County of
Honolulu’s General Plan. The report recommended the City and County of Honolulu’s
General Plan should include goals and objectives related to sustainability as a broad position
on sustainability, and not be limited to climate change initiatives.
o Central Oahu Sustainable Communities Plan252: Submitted to City Council for Adoption in
October 2016, the plan sought to protect agricultural lands, open space, and natural, historic,
and cultural resources; build master planned residential communities that support walking,
biking, and transit use, and design communities to reduce automobile usage, provide
adequate infrastructure to meet the needs of new and existing development.
o East Honolulu Sustainable Communities Plan253: Update is underway. This plan’s update
includes several climate adaptation workshops focusing on climate change and sea level rise
planning, and green infrastructure planning.
247 County of Kauai, Planning Department. (2015). South Kauai Community Plan. Retrieved from: http://www.kauai.gov/Government/Departments-Agencies/Planning-Department/Long-Range-Division/South-Kauai-Community-Plan. 248 County of Kauai, Planning Department. East Kauai Development Plan. Retrieved from: http://www.kauai.gov/Government/Departments-Agencies/Planning-Department/Long-Range-Division/East-Kauai-Development-Plan. 249 County of Kauai, Planning Department. (2015). Lihue Community Plan. Retrieved from: http://www.kauai.gov/Government/Departments-Agencies/Planning-Department/Long-Range-Division/Lihue-Community-Plan-LCP. 250 City and County of Honolulu. (2017). Oahu General Plan Update Process Timeline. Retrieved from: http://honoluludpp.org/Portals/0/pdfs/planning/generalplan/Schedule%2012-28-17.pdf. 251 City and County of Honolulu. (2011). Honolulu General Plan Update. Sustainability Trend Report. Prepared by Herbert Hastart & Fee. Retrieved from: http://www.honoluludpp.org/Portals/0/pdfs/planning/generalplan/GPUpdate/TrendReports/Sustainability.pdf. 252 City and County of Honolulu, Department of Planning and Permitting. (2016). Central Oahu Communities Plan. Retrieved from: http://www.honoluludpp.org/Portals/0/pdfs/planning/CentralOahu/2016%20COSCP%20Proposed%20Clean.pdf. 253 City and County of Honolulu, Department of Planning and Permitting. (2017). East Honolulu Sustainable Communities Plan. Retrieved from: http://www.honoluludpp.org/Planning/DevelopmentSustainableCommunitiesPlans/EastHonoluluPlan.aspx.
PAGE 95
o Ewa Development Plan254: Adopted July 2013, the plan sought to integrate principles of
sustainability into decision-making processes.
o Koolau Loa Sustainable Communities Plan255: Pre-final revised plan submitted to the City
Council in 2012. The plan sought to integrate principles of sustainability into decision-making
processes.
o Koolau Poko Sustainable Communities Plan256: Adopted August 2017, the plan called for
protection of the communities’ natural, scenic, cultural, historic and agricultural resources,
while addressing the need to improve and replace, as necessary, the region’s aging
infrastructure systems.
o North Shore Sustainable Communities Plan257: Adopted May 2011, the plan sought to
integrate principles of sustainability into decision-making processes.
o Waianae Sustainable Communities Plan258: Adopted March 2012, the plan sought to integrate
principles of sustainability into decision-making processes.
o Primary Urban Center Development Plan259: Last adopted 2004, the update is underway.
Hawaii County General Plan Comprehensive Review: Started in February 2015, the plan will take
an estimated time frame of three-years to complete. The Comprehensive Review noted that in
Hawaii County, everything that has transpired; including population growth, natural disasters,
technological advancements, and sustainability efforts, is being considered in the General Plan.
The County Planning Department has also updated the following community development plans to
consider growth management and sustainable land uses, including preserving agricultural lands:
o Envision Downtown Hilo 2025260: Five Year Action Plan Update was submitted November 2010.
o Hamakua Community Development Plan261: Draft undergoing final recommendations for
revision and future adoption.
o Kau Community Development Plan262: Adopted by Hawaii County Council in October 2017.
o Kona Community Development Plan263: The update is underway, the Kona CDP Action
Committee was created.
o North Kohala Community Development Plan264: The update is underway, the North Kohala
CDP Action Committee was created.
o South Kohala Community Development Plan265: The update is underway, the South Kohala
CDP Action Committee was created.
o Puna Community Development Plan266: Adopted by Hawaii County Council in 2008, the plan
was last amended December 2011.
254 City and County of Honolulu, Department of Planning and Permitting. (2013). Ewa Development Plan. Retrieved from: http://www.honoluludpp.org/Portals/0/pdfs/planning/ewa/ewa5yr/Ewa_DP_2013_securedcopy.pdf. 255 City and County of Honolulu, Department of Planning and Permitting. (2012). Koolau Loa Sustainable Communities Plan. Retrieved from: http://www.honoluludpp.org/Portals/0/pdfs/planning/Koolauloa/Kloa5Yr/Final/Final_KLSCP(Dec2012).pdf. 256 City and County of Honolulu, Department of Planning and Permitting. (2017). Koolau Poko Sustainable Communities Plan. Retrieved from: http://www.honoluludpp.org/Portals/0/pdfs/planning/Koolaupoko/2017-08.KPSCP.pdf. 257 City and County of Honolulu, Department of Planning and Permitting. (2011). North Shore Sustainable Communities Plan. Retrieved from: http://www.honoluludpp.org/Portals/0/pdfs/planning/NorthShore/NSSCP_May_2011.pdf. 258 City and County of Honolulu, Department of Planning and Permitting. (2012). Waianae Sustainable Communities Plan. Retrieved from: http://www.honoluludpp.org/Portals/0/pdfs/planning/Waianae/2012WaianaeSCPReduced.pdf. 259 City and County of Honolulu, Department of Planning and Permitting. (2004). Primary Urban Center Development Plan. Retrieved from: http://www.honoluludpp.org/Portals/0/pdfs/planning/PUC/PrimaryUrbanCenterDP.pdf. 260 County of Hawaii, Planning Department. (2010). Envision Downtown Hilo 2025. Retrieved from: http://www.hawaiicounty.gov/pl-edh2025. 261 County of Hawaii, Planning Department. Hamakua Community Development Plan. Retrieved from: http://www.hawaiicountycdp.info/hamakua-cdp. 262 County of Hawaii, Planning Department. (2017). Kau Community Development Plan. Retrieved from: http://www.hawaiicountycdp.info/kau-cdp. 263 County of Hawaii, Planning Department. (2017). Kona Community Development Plan. Retrieved from: http://www.hawaiicountycdp.info/north-and-south-kona-cdp. 264 County of Hawaii, Planning Department. (2017). North Kohala Community Development Plan. Retrieved from: http://www.hawaiicountycdp.info/north-kohala-cdp. 265 County of Hawaii, Planning Department. South Kohala Community Development Plan. Retrieved from: http://www.hawaiicountycdp.info/south-kohala-cdp. 266 County of Hawaii, Planning Department. (2011). Puna Community Development Plan. Retrieved from: http://www.hawaiicountycdp.info/puna-cdp/draft-plan-recommendations.
PAGE 96
Maui Countywide Policy Plan267: Adopted in 2010, the plan acts as an overarching values
statement and provides a policy framework for the Maui Island Plan.
Maui Island Plan268: Adopted in 2012, the plan acknowledged the need to preserve island
agriculture lands while balancing directed growth for new development.
o Lanai Community Plan269: Adopted in 2016, the plan seeks to “establish Lanai as a model
sustainable island to be known for its bold integration of innovative green policies into a
traditional rural island community” (p.2-3). The plan identified the need for a sustainable
population for the island, and the need to increase the island’s food security. Increasing
renewable energy sources, the goal to recycle 100% of wastewater for irrigation while
exploring options for reuse of household greywater for lawn and garden irrigation were also
highlighted.
o Molokai Community Plan270: Draft submitted to the Maui County Council, 2016, the plan
acknowledges the need for sustainability and climate change planning and identifies that the
current and future water demand exceeds the sustainable water supply as of 2016. The plan
recommends the use of green infrastructure and technology and sustainable building
practices as solutions which need to be implemented to restore natural systems to improve
the island’s resiliency to climate change. The plan recognizes and supports sustainable
agricultural, forestry, and game best management practices, and sustainable subsistence
fishery management.
o Kihei-Makena Community Plan271: Last adopted in 1998.
o Paia-Haiku Community Plan272: Last adopted in 1995.
o Wailuku-Kahului Community Plan273: Last adopted in 2002.
o Makawao-Pukalani-Kula Community Plan274: Last adopted in 1996.
o Hana Community Plan275: Last adopted in 1994.
o West Maui Community Plan276: Last adopted in 1996.
267 County of Maui, Planning Department. (2010). Countywide Policy Plan. Retrieved from: https://www.mauicounty.gov/420/Countywide-Policy-Plan. 268 County of Maui, Planning Department. (2012). Maui Island Plan. Retrieved from: https://www.mauicounty.gov/1503/Maui-Island-Plan. 269 County of Maui, Planning Department. (2016). Lanai Community Plan. Retrieved from: https://hi-mauicounty2.civicplus.com/DocumentCenter/View/105983. 270 County of Maui, Planning Department. (2016). Molokai Community Plan. Retrieved from: https://www.mauicounty.gov/DocumentCenter/View/103666. 271 County of Maui, Planning Department. (1998). Kihei-Makena Community Plan. Retrieved from: https://www.mauicounty.gov/DocumentCenter/Home/View/1712. 272 County of Maui, Planning Department. (1995). Paia-Haiku Community Plan. Retrieved from: https://www.mauicounty.gov/DocumentCenter/Home/View/1717. 273 County of Maui, Planning Department. (2002). Wailuku-Kahului Community Plan. Retrieved from: https://www.mauicounty.gov/DocumentCenter/Home/View/1717. 274 County of Maui, Planning Department. (1996). Makawao-Pukalani-Kula Community Plan. Retrieved from: https://www.mauicounty.gov/DocumentCenter/Home/View/1714. 275 County of Maui, Planning Department. (1994). Hana Community Plan. Retrieved from: https://www.mauicounty.gov/DocumentCenter/Home/View/1710. 276 County of Maui, Planning Department. (1996). West Maui Community Plan. Retrieved from: https://www.mauicounty.gov/DocumentCenter/Home/View/1720.
PAGE 97
Upon review, this report finds that sustainable land use coordination could be improved through stronger and
clearer statewide land use policies as they relate to Hawaii’s sustainability. The following laws and land use
plans could be integrated to improve sustainability land use planning through the comprehensive plans:
Hawaii’s Important Agricultural Land (IAL) Law (Hawaii Revised Statutes Chapter 205, Part III)277:
Requires the counties to designate important agricultural lands; however as of 2017, only the County
of Kauai completed its Important Agricultural Lands Study.278 The City and County of Honolulu’s
mapping of Oahu’s Important Agricultural Lands is currently underway, with the most recent
community meeting held on November 2017.279
Future sustainability policies and plans focusing on Hawaii land use could inventory the progress and
total acreage of Hawaii’s statewide Important Agricultural Lands. Future County General Plans and
Community Plans could document the intended and future use of Important Agricultural Lands.
Periodic Review of Land Use Districts: Five year updates could be performed by the Office of
Planning pursuant to §205-18 of the Hawaii Revised Statutes to undertake a review of the
classification and districting of all lands in the State. In this five year boundary review, the Office of
Planning could focus on efforts in reviewing the Hawaii State Plan, county general plans, and county
development and community plans. Upon completion of the five year boundary review, the Office of
Planning is required to submit a report of the findings to the Land Use Commission.280 This will
ensure thorough land use coordination toward Hawaii’s sustainable future and assist Hawaii’s Land
Use Commission to determine and coordinate future urban, agricultural, conservation, and rural land
use designations.
Transit-Oriented Development Plans281: Can identify the improvement and addition of green
infrastructure, stormwater runoff and groundwater recharge, the use of permeable surfaces, mixed-
use, pedestrian and bike friendly access, as well as complete street opportunities.
Complete Street Plans282, 283: Can identify opportunities to improve pedestrian and bike access, green
infrastructure, and the use of permeable surfaces within the urban environment.
277 Hawaii Revised Statutes Chapter 205, Part III. Important Agricultural Lands Law. 278 County of Kauai, Planning Department. (2015). Important Agricultural Lands Study. Retrieved from: https://sites.google.com/site/kauaiial/. 279 City and County of Honolulu, Department of Planning and Permitting. (2017). Oahu Important Agricultural Lands. Retrieved from: http://mapoahuagland.com/meetings-announcements/presentations/. 280 Hawaii Revised Statutes §205-18. Periodic Review of Land Use Districts. Retrieved from: https://www.capitol.hawaii.gov/hrscurrent/Vol04_Ch0201-0257/HRS0205/HRS_0205-0018.htm. 281 City and County of Honolulu, Department of Planning and Permitting, TOD Honolulu. Retrieved from: https://www.honolulu.gov/tod. 282 City and County of Honolulu, Department of Transportation Services, Honolulu Complete Streets. (2017). What are Complete Streets? Retrieved from: http://www.honolulu.gov/completestreets. 283 State of Hawaii, Department of Health, Healthy Hawaii Initiative. (2017). Community Design and Active Living. Retrieved from: http://health.hawaii.gov/physical-activity-nutrition/home/community-design-active-living/.
PAGE 98
3.7 Percentage of Shorelines Threatened or Retreating; and Rate of Loss:
The U.S. Global Change Research Program’s Fourth
National Climate Assessment - Climate Science Special
Report was recently published in 2017 warning about
the sea level rise effects of Global climate change for
Hawaii and other Pacific Islands which are at risk for
amplified rising sea levels due to their distance from
the melting land ice of glaciers and ice sheets through
static-equilibrium effects.284
The National Oceanic and Atmospheric Administration has actively collected data
and monitored mean sea level trends, interannual variations, and annual seasonal cycles throughout Hawaii.
Climate Change Adaptation Priority Guidelines for the Hawaii State Plan
Recognizing the potentially serious effects of climate change for Hawaii, the State enacted Act 286 in 2012,
codified as §226-109 of the Hawaii Revised Statutes, as a set of climate change adaptation priority guidelines
within the Hawaii State Planning Act to prepare the State to address the impacts of climate change, including the
areas of agriculture, conservation lands, coastal and nearshore marine areas, natural and cultural resources,
education, energy, higher education, health, historic preservation, water resources, and the built environment
such as housing, recreation, and transportation.285 Figure 40 provides a compilation of the National Oceanic and
Atmospheric Association’s (NOAA’s) analysis of rising mean sea level trends for Kauai, Oahu, Maui, and Hawaii
Islands.
284 Sweet, W.V., R. Horton, R.E. Kopp, A.N. LeGrande, and A. Romanou, 2017: Sea level rise. In: Climate Science Special Report: Fourth National Climate Assessment, Volume I [Wuebbles, D.J., D.W. Fahey, K.A. Hibbard, D.J. Dokken, B.C. Stewart, and T.K. Maycock (eds.)]. U.S. Global Change Research Program, Washington, DC, USA, pp. 333-363, doi: 10.7930/J0VM49F2. 285 Hawaii Revised Statutes §226-109. (2012). Climate Change Adaptation Priority Guidelines. Retrieved from: http://www.capitol.hawaii.gov/hrscurrent/Vol04_Ch0201-0257/HRS0226/HRS_0226-0109.htm.
Figure 40. Mean Sea Level Trends of Nawiliwili, Kauai (top left); Honolulu, Oahu (top right); Kahului, Maui (bottom left); Hilo, Hawaii (bottom right) (1900-2017). Source: National Oceanic and Atmospheric Association
70% OF HAWAII’S BEACHES ARE
UNDERGOING CHRONIC EROSION
Department of Land and Natural Resources, Impacts of Sea Level Rise
PAGE 99
Interagency Climate Adaptation Committee
Act 83 was enacted in 2014 to implement the climate change policy guidelines directed in §226-109 of the
Hawaii Revised Statutes by directing the Office of Planning and the Department of Land and Natural Resources
(DLNR) to form an Interagency Climate Adaptation Committee (ICAC). This committee was tasked to identify
major areas of sea level rise impacts, which will affect Hawaii through 2050, including any economic
ramifications of sea level rise, and recommend the planning, management, and adaptation for hazards
associated with increasing sea level rise. The ICAC was required by law to publish the analysis of their
research by December 2017.286
Through the ICAC’s research, the State found that coastal erosion will exacerbate flooding and inundation
resulting in the permanent loss of beaches and dry land, which will become submerged at increasing rates due
to sea level rise. The ICAC explains, beaches, dunes and other coastal environments, in their natural state, can
provide effective protection from impacts of high waves and storms.287 Statewide, the ICAC found that 70% of
Hawaii’s beaches are undergoing chronic erosion, meaning the shoreline is quickly retreating.288
Hawaii Climate Change Mitigation and Adaptation Commission
Recently the ICAC evolved into the Hawaii Climate Change Mitigation and Adaptation Commission (“Climate
Commission”) in 2017 through the update of Chapter 225P of the Hawaii Revised Statutes via Act 32.
This Commission broadened the ICAC to include multiple agencies, counties, and legislators to serve to
provide policy direction, facilitation, coordination, and planning statewide. This Climate Commission is tasked
to establish climate change mitigation and adaptation strategies and goals to help guide the planning and
implementation statewide to monitor and forecast climate change related impacts by 2023.289 Further and in-
depth information on Hawaii’s threatened and retreating shoreline may be found in the Hawaii Climate
Commission’s (formerly ICAC) Hawaii Sea Level Rise Vulnerability and Adaptation Report.290
Managed Retreat
In March 2017, the Office of Planning’s Coastal Zone Management program initiated an exploratory study to
generate discussion around the feasibility of managed retreat as a potential strategy for climate change
adaptation for Hawaii. Managed retreat is a coastal management strategy that, through the relocation of
structures and infrastructure near the shoreline, allows the shoreline to move inland, unimpeded. This
approach may allow some erosion control measures using soft-stabilization techniques to prolong the life of
shorefront buildings and other infrastructure for the short term.291 This exploratory study will generate a
background report, case studies covering different development types, discussions at a symposium, and
provide analysis through a final report in 2018 on the feasibility of implementing managed retreat in Hawaii.
286 Act 83, Session Laws of Hawaii. (2014). Climate Adaptation. Retrieved from: http://www.capitol.hawaii.gov/Archives/measure_indiv_Archives.aspx?billtype=HB&billnumber=1714&year=2014. 287 State of Hawaii, Hawaii Climate Change Mitigation and Adaptation Commission. (2017). Hawaii Climate Adaptation Portal, Impacts of Sea Level Rise. Retrieved from: http://climateadaptation.hawaii.gov/impacts-of-sea-level-rise/. 288 National Oceanic and Atmospheric Administration. (2015). Sea Level Rise Trends. Retrieved from: https://tidesandcurrents.noaa.gov/sltrends/sltrends.html. 289 Act 32, Session Laws of Hawaii. (2017). Hawaii Revised Statutes §225P, Hawaii Climate Change Mitigation and Adaptation Initiative. http://www.capitol.hawaii.gov/Archives/measure_indiv_Archives.aspx?billtype=SB&billnumber=559&year=2017. 290 Hawaii Climate Change Mitigation and Adaptation Commission. 2017. Hawaii Sea Level Rise Vulnerability and Adaptation Report. Prepared by Tetra Tech, Inc. and the State of Hawaii Department of Land and Natural Resources, Office of Conservation and Coastal Lands, under the State of Hawaii Department of Land and Natural Resources Contract No: 64064. Retrieved from: https://climateadaptation.hawaii.gov/wp-content/uploads/2017/12/SLR-Report_Dec2017.pdf. 291 National Oceanic and Atmospheric Association. (2007). Ocean and Coastal Resource Management, Managed Retreat Strategies. Retrieved from: https://web.archive.org/web/20150905055350/http://coastalmanagement.noaa.gov/initiatives/shoreline_ppr_retreat.html, or http://www.adaptationclearinghouse.org/resources/managed-retreat-strategies.html.
PAGE 100
3.8 Pollution Level in Streams, Aquifers and Coastal Waters:
Polluted runoff is the greatest threat to Hawaii’s surface and ground waters, making them unsafe for drinking,
swimming, fishing, and other recreational uses. Some polluted runoff is from natural sources; however, most
polluted runoff results from human activities on the land and in the water.
The State’s Department of Health’s Clean Water Branch manages Hawaii’s Polluted Runoff Control Program,
administers the State’s Non-Point Source (NPS) pollution management program, and develops the State’s NPS
Management Plan to implement watershed-specific strategies to control NPS pollution, also known as runoff
pollution.
Hawaii’s NPS Management Plan guides the State’s NPS management efforts by establishing goals, objectives,
strategies, and milestones directed at preventing and reducing NPS pollution and improving water quality.292
The NPS Management Plan also advances the State’s efforts to obtain full approval of Hawai‘i’s Coastal Nonpoint
Pollution Control Program (CNPCP), which was established under Section 6217 of the Coastal Zone Act
Reauthorization Amendments (CZARA) of 1990. The CNPCP is administered jointly by the DOH and by the Office
of Planning’s Coastal Zone Management (CZM) program.293 Both the Polluted Runoff Control program and the
CNPCP seek to prevent and reduce polluted runoff to protect and improve Hawaii’s water quality.
The most recent NPS Management Plan was updated in 2015 to provide a more coordinated approach among
federal, state, and local water quality agencies to implement NPS projects and target pollutants and their
sources more effectively between 2015 and 2020.294
292 State of Hawaii Department of Health, Clean Water Branch, Polluted Runoff Control Program. (2015). Hawaii’s Nonpoint Source Management Plan (2015-2020). Retrieved from: http://health.hawaii.gov/cwb/files/2013/05/2015-Hawaii-NPS-Management-Plan.pdf. 293 State of Hawaii, Office of Planning. (1996). Hawaii’s Coastal Nonpoint Pollutant Control Program. Retrieved from: http://files.hawaii.gov/dbedt/op/czm/initiative/nonpoint/cnpcp_mgmt_plan.pdf. 294 State of Hawaii Department of Health, Clean Water Branch, Polluted Runoff Control Program. (2015). Hawaii’s Nonpoint Source Management Plan (2015-2020). Retrieved from: http://health.hawaii.gov/cwb/files/2013/05/2015-Hawaii-NPS-Management-Plan.pdf.
Figure 41. Pollution Infographic about Hawaii’s Ahupuaa’s. Source: Hawaii Department of Health, Clean Water Branch, Polluted Runoff Control Program.
PAGE 101
Impairment of Hawaii’s Rivers and Streams in 2014
The U.S. Environmental Protection Agency (EPA) summarizes water quality data in helpful graphics. The EPA
provides a summary of the Hawaii Water Quality Monitoring and Assessment Report in 2014.295
Figures 42 and 43 show the amount of pollution in Hawaii’s rivers in streams in 2014. Figure 42 reveals that
of Hawaii’s total 3,905 miles of all rivers and streams, the Department of Health assessed 2,567 miles, or
66% of the total rivers and streams in Hawaii. Figure 43 shows that of the 66% of the rivers and streams
assessed by the Department of Health, 90% of the rivers and streams were determined to be impaired by
pollutants. Figure 44 describes the causes and amount of impairment of the rivers and streams that were
assessed.
295 United States Environmental Protection Agency. (2014). Hawaii Water Quality Assessment Report. Retrieved from: https://iaspub.epa.gov/waters10/attains_index.control?p_area=HI#STREAM/CREEK/RIVER.
Assessed, 2,567Miles, 66%
Unassessed,1,338 Miles,
34%
All Hawaii Rivers and Streams (2014)
Figure 42. Water Quality Assessments for all of Hawaii’s Rivers and Streams (2014). Source: Environmental Protection Agency
Good, 244.4 Miles, 10%
Impaired, 2322.6 Miles,
90%
Impairment of Assessed Hawaii River and Streams
(2014)
Figure 43. Water Quality Impairment of Hawaii’s Assessed Rivers and Streams (2014). Source: Environmental Protection Agency
1,983.31,285.0
1,051.91,034.2
213.5196.3183.2
28.124.311.31.1
0 500 1,000 1,500 2,000 2,500
Turbidity
Total Nitrogen
Total Suspended Solids
Trash
Chlordane
Phosphate
Miles
Hawaii's Rivers and Streams Causes of Impairment (2014)
Figure 44. Hawaii’s Rivers and Streams Causes of Impairment (2014). Source: Environmental Protection Agency
PAGE 102
Impairment of Hawaii’s Aquifers
There is no public data available measuring the water quality of Hawaii’s aquifers. The EPA also notes that the
total size of Hawaii’s lakes, reservoirs, and ponds are unavailable. According to the Hawaii Water Quality
Monitoring and Assessment Report in 2014, 4.9 acres of a lake, reservoir or pond was assessed and found impaired
by turbidity, nitrogen, phosphorus, nitrate/nitrite, and trash.296
Impairment of Hawaii’s Coastal Waters (Bays and Estuaries)
The U.S. Environmental Protection Agency (EPA) summarizes water quality data in graphics to understand the
data. The EPA provides a summary of the Hawaii Water Quality Monitoring and Assessment Report in 2014.297
Figures 45 and 46 show the amount of pollution in Hawaii’s bays and estuaries in 2014. Figure 45 reveals that of
Hawaii’s total 94.1 square miles of all bays and estuaries, the Department of Health assessed 88 square miles, or
94% of the total bays and estuaries in Hawaii. Figure 46 shows that of the 94% of the bays and estuaries assessed
by the Department of Health, 98% of the bays and estuaries were determined to be impaired by pollutants.
Figure 47 describes the causes and amount of impairment of the bays and estuaries assessed.
296 United States Environmental Protection Agency. (2014). Hawaii Water Quality Assessment Report. Retrieved from: https://iaspub.epa.gov/waters10/attains_index.control?p_area=HI#STREAM/CREEK/RIVER. 297 Ibid.
Assessed, 88Square Miles,
94%
Unassessed, 6.1 Sq. Miles, 6%
All Hawaii Bays and Estuaries (2014)
Figure 45.Water Quality Assessments for all of Hawaii’s Bays and Estuaries (2014). Source: Environmental Protection Agency
Impaired, 88 Square Miles, 98%
Good, 2.2 Sq. Miles, 2%
Impairment of Assessed Hawaii Bays and Estuaries
(2014)
Figure 46. Water Quality Impairment of Hawaii’s Assessed Rivers and Streams (2014). Source: Environmental Protection Agency
81.3
23.5
21.9
20.5
10.6
10.2
8.1
0 10 20 30 40 50 60 70 80 90
Turbidity
Total Nitrogen
Total Ammonia
Nitrate/ Nitrite
Chlorophyll-A
Enterococcus Bacteria
Total Phospohorus
Square Miles
Hawaii's Bays and Estuaries Causes of Impairment (2014)
Figure 47 Hawaii’s Bays and Estuaries Causes of Impairment (2014). Source: Environmental Protection Agency
PAGE 103
Impairment of Hawaii’s Coastal Waters (Coastal Shorelines)
The U.S. Environmental Protection Agency (EPA) summarizes water quality data in graphics to understand the
data. The EPA provides a summary of the Hawaii Water Quality Monitoring and Assessment Report in 2014.298
Figures 48 and 49 show the amount of pollution in Hawaii’s coastal shorelines in 2014. Figure 48 reveals that of
Hawaii’s total 1,052 miles of all coastal shorelines, the Department of Health assessed 170.3 miles, or 16% of the
total coastal shorelines in Hawaii. Figure 49 shows that of the 16% of the coastal shorelines assessed by the
Department of Health, 67% of Hawaii’s coastal shorelines were determined to be impaired by pollutants.
Figure 50 describes the causes and amount of impairment of the coastal shorelines assessed.
298 United States Environmental Protection Agency. (2014). Hawaii Water Quality Assessment Report. Retrieved from: https://iaspub.epa.gov/waters10/attains_index.control?p_area=HI#STREAM/CREEK/RIVER.
Figure 49. Water Quality Impairment of Hawaii’s Assessed Coastal Shorelines (2014). Source: Environmental Protection Agency
Impaired, 114.1 Miles,
67%
Good, 56.2 Miles, 33%
Impairment of Assessed Hawaii Coastal Shorelines
(2014)
Assessed, 170.3 Miles, 16%
Unassessed, 881.7 Miles, 84%
All Hawaii's Coastal Shoreline (2014)
Figure 48. Water Quality Assessment for all of Hawaii’s Coastal Shorelines (2014). Source: Environmental Protection Agency
97.7
40.8
33.5
23.3
22.9
22.2
10.2
10
0 10 20 30 40 50 60 70 80 90 100
Turbidity
Chlorophyll-A
Total Nitrogen
Total Phosphorus
Nitrate/Nitrite
Total Ammonia
Enterococcus Bacteria
Phosphate
Miles
Hawaii's Coastal Shoreline Causes of Impairment (2014)
Figure 50. Hawaii’s Bays and Estuaries Causes of Impairment (2014). Source: Environmental Protection Agency
PAGE 104
In November 2017, the Department of Health’s Clean Water Branch revamped its website providing up-to-date
information on bacteria levels and brown water advisories along with aerial photos to provide the public with a
more user-friendly alert notification system for Hawaii’s beaches. The website will provide a quick overview of all
active advisories, search functions by island and type of advisory, mapping to identify the areas of the advisories,
polluted runoff control watershed based plans, and notifications for online subscribers.299
Water pollution laws were also recently enacted, including:
Act 42, (HB 1325), 2015: Authorizes counties to establish and charge user fees for stormwater
management. Similar stormwater utilities on the mainland serve an important tool for local
governments to reduce runoff pollution, recharge local aquifers, and mitigate flood damage.300
According to the Blueprint for Action, this policy will yield approximately 10 MGD by 2030.
Act 5 (HB 1509), 2017: Requires the State and counties to consider storm water management in the
development of the Hawaii Water Resource Protection Plan.301
Act 248 (HB 2030), 2016: Prohibits the discharge of treated or raw sewage into state waters after
12/31/2026 except when used to create clean energy.302
The American Planning Association (APA) recently recognized that water resource issues should be accepted as
highly interrelated with land development. Population and employment growth has increased demands on scarce
water supplies. Pollution and water disposal practices have also diminished the quality and availability of water.
Due to these challenges, the APA has recommended the concept of “One Water” management as a foundational
paradigm for water sustainability planning.303
Water system problems can be characterized in one of three ways: not enough water, too much water, the quality
of water is compromised. These three issues translate into challenges of scarcity of water supplies, flooding, and
water pollution and contamination.304 Aging and deteriorated infrastructure compounds these problems, which
impact the environment, the economy, and society. Two factors—climate change and population change—are
exacerbating existing water management challenges and creating new ones.305 While measuring pollution through
streams, it is important to highlight the need to address stormwater management. Stormwater is precipitation,
such as rain, that is not absorbed into the ground but flows overland as runoff. In urbanized areas, where
impermeable surfaces such as streets, sidewalks, parking lots, and buildings predominate, flooding can occur when
large volumes of runoff flow into streams and rivers.306
299 Hawaii Department of Health, Clean Water Branch System. (2017). Retrieved from: https://eha-cloud.doh.hawaii.gov/cwb/#!/home. 300 Hawaii Community Foundation, Hawaii Freshwater Initiative. (2016). A Blueprint for Action: Water Security for an Uncertain Future (2016-2018). Retrieved from: https://www.hawaiicommunityfoundation.org/strengthening/fresh-water. 301 Act 5, Session Laws of Hawaii (2017). Hawaii Revised Statutes §174C-31. Retrieved from: http://www.capitol.hawaii.gov/Archives/measure_indiv_Archives.aspx?billtype=HB&billnumber=1509&year=2017. 302 Act 248, Session Laws of Hawaii. (2016). Hawaii Revised Statutes §342D-50.5. Retrieved from: http://www.capitol.hawaii.gov/Archives/measure_indiv_Archives.aspx?billtype=HB&billnumber=2030&year=2016. 303 American Planning Association. (2017). PAS Report: Planners and Water. Retrieved from: https://www.planning.org/publications/report/9131532/. 304 Sullivan, Katherine, Administrator, National Oceanic and Atmospheric Agency. (2016). Remarks, American Planning Association National Planning Conference, Phoenix. 305 American Planning Association. (2017). PAS Report: Planners and Water. Retrieved from: https://www.planning.org/publications/report/9131532/. 306 Konrad, C.P. 2003. “Effects of Urban Development on Floods.” USGS Fact Sheet 076-03. Retrieved from: https://pubs.usgs.gov/fs/fs07603.
PAGE 105
3.9 Number and Types of Invasive Species Introduced to Hawaii Annually,
Including Intra-Island Migration:
In 2016, the Hawaii Interagency Biosecurity Plan (HIBP) was proposed
as a coordinated effort between the Hawaii Department of
Agriculture, the Department of Land and Natural Resources, the
Department of Health, the University of Hawaii as well as other
federal, state, county, and private agencies to increase biosecurity
efforts across the state. The HIBP is designed to be implemented
through 147 action items over a ten year period. The plan proposes
new legislation, systems, and procedures to protect Hawaii’s complex
ecosystem.307
A recent audit, BioInsecurity: Audit of the Hawaii Department of
Agriculture’s Plant Quarantine Branch (Report 17-05) was published
by the State Auditor in July 2017 and found that the Plant Quarantine
Branch (PQB) lacked the data gathering and data analysis functions
necessary to actively and continuously assess risks from invasive
species. The audit further found that the branch’s central database
does not perform its core functions and was considered by HDOA-
PQB staff to be unreliable and cumbersome to use. Finally, the audit
found that the PQB lacked the organizational framework necessary to
manage and communicate risks from invasive species.308
In today’s globally interconnected world, the State of Hawaii must be
vigilant, responsive, and flexible in guarding against the threat of invasive species.
Given the tremendous volume of cargo arriving through Hawaii’s ports,
PQB inspectors cannot examine every box of produce, every plant, or even every
shipping container. Instead, the branch must develop processes and incorporate
technology to deploy its inspectors and direct its biosecurity efforts efficiently and effectively.
To assist the Department of Agriculture in this effort, a recent biosecurity law was enacted as Act 163 (HB 1325;
2017), cited as “The Clift Tsuji Act” in honor of the late-State Representative Clift Tsuji, who was deeply devoted to
fighting against invasive species through biosecurity statewide. Act 163 requires the Department of Agriculture to
establish and report to the Legislature on parameters and construction requirements for biosecurity facilities that
provide for and ensure the safety of agricultural and food commodities. This recent biosecurity law appropriated
$3.6 million for several biosecurity initiatives within the Department of Agriculture.309 The Clift Tsuji Biosecurity
Act was signed into law in July 2017 and is awaiting implementation.
307 State of Hawaii, Hawaii Interagency Biosecurity Plan: 2017-2027. (2017). Retrieved from:https://dlnr.hawaii.gov/hisc/files/2017/02/Hawaii-Interagency-Biosecurity-Plan.pdf. 308 State of Hawaii, Office of the Auditor. (2017). Audit of Hawaii Department of Agriculture’s Plant Quarantine Branch (Report 17-05). Retrieved from: http://files.hawaii.gov/auditor/Reports/2017/17-05.pdf. 309 The Clift Tsuji Act, Act 163. (2017). Hawaii Revised Statutes §150A-53. Retrieved from: http://www.capitol.hawaii.gov/session2017/bills/HB1325_CD1_.pdf.
32,176,000 TONS OF DOMESTIC CARGO WAS IMPORTED
INTO HAWAII IN 2015
2.5% OF CARGO WAS INSPECTED BY DEPARTMENT OF
AGRICULTURE PLANT QUARANTINE BRANCH INSPECTORS Hawaii Department of Agriculture, Hawaii State Auditor
HAWAII’S TOP 10
INVASIVE SPECIES IN
2016
1. LITTLE FIRE ANT
2. COCONUT RHINOCEROS
BEETLE
3. COQUI FROG
4. RAT
5. MONGOOSE
6. STRAWBERRY GUAVA
7. MICONIA
8. FIREWEED
9. INVASIVE ALGAE
10.ALBIZIA TREE
Department of Land and Natural Resources
PAGE 106
3.10 Water Level in Streams and Aquifers:
Water use comes from two main sources—surface water and ground water. Understanding water use will help
evaluate the effects of future development plans and trends, which in turn helps create more sustainable water
use practices that can help meet future demand.310
In Hawaii, surface-water resources are especially vital for agricultural purposes, cultural practices, and Hawaii’s
native fauna. Measuring surface-water resources can serve as a useful indicator of the availability of Hawaii’s
groundwater as well. Streamflow is predominantly controlled by periods of heavy rainfall that cause direct runoff,
while base flow is more of an indicator of groundwater recharge and storage. Streamflow during Hawaii’s wet
months (January – March) were low following El Niño periods and were high following La Niña periods during the
20th century.311
A 2013 study of Trends and Shifts in Streamflow in Hawaii researched the streamflow, base flow, peak flow, and
rainfall records and compiled this data to reflect and document the overall hydrological changes in Hawaii over
the previous century between 1913 and 2008.312 The study found that over the last century, trend tests of
Hawaii’s streamflow and base flow reflected significant downward trends. There were no significant upward
trends detected in any of Hawaii’s streamflow or base flow records between 1913 and 2008 as depicted in Figure
51. Figures 52 and 53 reveal the general decline of Hawaii’s base flow and streamflow, respectively, statewide
since 1913.
310 American Planning Association. (2017). PAS Report: Planners and Water. Retrieved from: https://www.planning.org/publications/report/9131532/. 311 Oki DS. (2004). Trends in streamflow characteristics at long-term gaging stations, Hawaii. Scientific Investigations Report 2004-5080, US Geological Survey. 312 Bassionuini, M. and Oki DS. (2013). Trends and shifts in streamflow in Hawaii, 1913-2008. Hydrological Processes, 27, 1484-1500.
Figure 51. Values of annual, January-March (wet months), and July-September (dry months) index median flows during 1913-2008, Hawaii. (A) Streamflow and (B) Base flow. Courtesy: US Geological Survey
PAGE 107
The study explained that the reduction of stream base flows reveal a reduction in groundwater recharge and
storage, which is problematic for Hawaii since more than 90% of the drinking water used is derived from
groundwater sources.313 The reduction in groundwater recharge will have significant implications for future
water planning and sustainability. Withdrawals from some of Hawaii’s most productive aquifers were nearing
their sustainable yields in 2013.314 Scientists and researchers warn that as Hawaii’s population increases, the
demand for groundwater will also increase.315 Trends and Shifts in Streamflow in Hawaii identified that as of
2013 “conflicts between those diverting water for irrigation purposes and those desiring greater instream
flows have become common in recent years” (p.1498). The study also warned that it “may be necessary to
identify other sources of water to meet future demands and develop strategies that help mitigate decreasing
groundwater recharge, such as improved watershed forest management” (p.1498).
The long-term downward trends of Hawaii’s streams identified between 1913 and 2008 were a result of long-
term decrease in the water availability. The trends of Hawaii’s streamflow and base flow were consistent with
other climate change-associated trends, which indicate a drying climate for Hawaii as well as emphasize the
vulnerability of Hawaii’s streamflow to climate change.
Finally, the 2013 study explained that these descending trends in groundwater discharge into Hawaii’s streams
could play a significant role in Hawaii’s future sustainability and have economic, social, and ecological
implications for Hawaii’s future groundwater and surface-water availability and management. The study’s
most imperative warning was that should these downward water availability trends continue, the future
management of Hawaii’s water resources will require adaptation to these climate change conditions.
Trends and Shifts in Streamflow in Hawaii, published in 2013, was the most recent study and assessment of
Hawaii’s streamflow trends. Although the USGS continues to collect streamflow data through web
applications such as StreamStats, which define basin characteristics and estimate peak-streamflow statistics of
Hawaii’s streams, the USGS lacks the sufficient funds to update their streamflow trends assessment.316 To
successfully manage and develop strategies to improve Hawaii’s water resources, additional studies on
present and future changes in streamflow and base flow will be extremely relevant to understand Hawaii’s
future water sustainability.
313 Bassionuini, M. and Oki DS. (2013). Trends and Shifts in Streamflow in Hawaii, 1913-2008. Hydrological Processes, 27, 1484-1500. 314 Ibid. 315 Ibid. 316 Oki, D.S., Rosa, S.N., and Yeung C.W., (2010). Flood-frequency Estimates for Streams on Kauai, Oahu, Molokai, Maui, and Hawaii, State of Hawaii: U.S. Geological Survey Scientific Investigations Report 2010-5035. Retrieved from: http://pubs.usgs.gov/sir/2010/5035.
Figure 52. Trends in Base Flow in Hawaii, 1913-2008. Courtesy: U.S. Geological Survey
Figure 53. Trends in Streamflow in Hawaii, 1913-2008. Courtesy: U.S. Geological Survey
PAGE 108
Hawaii Fresh Water Initiative
Hawaii’s streamflow and base flow trends reveal a significant decrease in water levels. The Hawaii Fresh Water
Council’s Blueprint for Action recommends three goals to achieve by 2018 to ensure sustainable water
management for Hawaii’s future.317
One of the Blueprint for Action’s three goals focuses on water recharge is to increase the amount of rainfall and
surface stormwater. If fulfilled, this goal would yield 30 MGD in increased water availability by 2030.
Recharge: Hawaii’s underground freshwater supply can be restored with:
1. Reduced pumping from aquifers,
2. Increased rainfall, and/or
3. Increased effective recharge
The Blueprint for Action explains that by increasing effective recharge rates is a critical factor in protecting
Hawaii’s aquifers. The Hawaii Fresh Water Council suggests initiative priorities to improve recharge
capabilities, including improved funding for updated streamflow and base flow monitoring and reporting will
increase the understanding of current and changing trends in Hawaii’s water availability. Green infrasturcture
recharge development projects could be implemented to capture and provide effective water recharge
opportunities.
317 Hawaii Community Foundation, Hawaii Fresh Water Initiative. (2015). A Blueprint for Action: Water Security for an Uncertain Future, 2016-2018. Retrieved from: https://www.hawaiicommunityfoundation.org/learning/a-blueprint-for-action-water-security-for-an-uncertain-future-2016-2018.
PAGE 109
Goal 4: Sustainable Community and Social Well-Being
The Hawaii 2050 Sustainability Plan explained that quality of life depends on safe, caring, and engaged
communities; healthy, sustainable surroundings; quality job opportunities for present and future generations;
access to quality education, housing, and health care; adequate, well-maintained infrastructure and
governmental services; access to recreational facilities and leisure activities; and positive interaction and
respect among the citizenry.
The Hawaii 2050 Sustainability Plan highlighted that “the choices we make today are essential for tomorrow.”
(Hawaii 2050 Sustainability Plan, p.47) The quality of our lives in 2050 will depend on the choices we make
today for a more prosperous future, including where jobs, productivity, wages, and education, achievements
grow and economic disparities are reduced.
To measure this goal of establishing a sustainable community and social well-being, the Hawaii 2050
Sustainability Plan provided four strategic actions and the following seventeen indicators:
STRATEGIC ACTIONS:
1. Strengthen social safety nets.
2. Improve public transportation infrastructure and alternatives.
3. Strengthen public education.
4. Provide access to diverse recreational facilities and opportunities.
17 INDICATORS:
1. Percentage of rental and for purchase housing stock that is affordable for persons
earning up to 140% of median income.
2. Percentage of population owning residential dwelling units as their principal place
of residence.
3. Percentage of population covered by health insurance.
4. Percentage of population using public transportation.
5. Percentage of population ridesharing.
6. Commute time for residents.
7. Percent change in annual vehicle miles travelled.
8. Percentage of total non-motorized trips.
9. High school graduation rates.
10. Proportion of high school students going on to post-secondary education.
11. Substance abuse rates.
12. Proportion of family income spent on housing.
13. Percentage of population engaged in volunteer work.
14. Percentage of population with internet access at their residence.
15. Out migration rates of high school graduates.
16. Percentage of children enrolled in pre-school.
17. Number and diversity of recreational facilities and activities per capita.
PAGE 110
Summary of Progress toward the “Sustainable Community and Social Well-Being”
Strategic Actions and Indicators:
The Hawaii 2050 Sustainability Plan’s fourth goal is to ensure that our community is strong, healthy, vibrant, and
nurturing, providing safety nets for those in need, and has progressed over the past decade.
Affordability Problem
Data based off this goal’s indicators show that affording to live in Hawaii has grown to be more challenging over
the past ten years. Data from indicators reveal that owner-occupancy in housing units have decreased over the
past ten years. Most shocking is 2014 data reflecting that 71.8% of consumer spending in Honolulu revolve around
housing, transportation, and food.
Pedestrian Walkability and Bicycle Access is Low
Outdated data from four indicators reveal that pedestrian walkability and bicycle access throughout the State is
low. Commuting continues to be heavily reliant on personal vehicles, public transportation, and ridesharing, and
walking usage was low when last measured. There have been recent bike sharing and ride sharing initiatives that
were not measured in recent statewide commuting studies. An updated commuting study should be performed to
improve data collection measuring new sustainable transportation methods.
Outdated Indicators
Data associated with some of this goal’s indicators were not tracked or were outdated. Should the State fund an
update to the Hawaii 2050 Sustainability Plan, this report recommends the update of social indicators to measure
a sustainable society.
PAGE 111
Measurement of Indicators:
4.1 Percentage of Rental and For Purchase Housing Stock that is Affordable for Persons
Earning up to 140% of Median Income:
The Hawaii Housing Policy Studies of 2016 provide data of the occupied housing units which are occupied by
resident households. Unfortunately, the data are not separated by percentage of rental housing and for-
purchase housing reflected in Table 20.
Table 20. Statewide Households at HUD Income Guidelines (2006 – 2014)
Total
Households
30% AMI
or less
Over 30% to
50% AMI
Over 50% to
80% AMI
Over 80% to
120% AMI
Over 120% and
140% AMI
Over 140%
AMI
2006 435,818 14% 11% 20% 22% 8% 26%
2011 455,311 20% 17% 24% 12% 7% 22%
2014 462,876 16% 12% 21% 14% 13% 23%
Source: Hawaii Housing Planning Study, 2016 “Table A-3. Households at HUD Income Guidelines by County.”
For the purposes of understanding this data, Table 21 is a compilation of the 2017 US Department of Housing
and Urban Development’s (HUD’s) income limits, which provide income guidelines for the State of Hawaii’s
Hawaii Housing Financial Development Corporation (HHFDC) for a four-person household in each county in
2017 dollars.318 For example, to better understand the data in Table 20, 21% of households statewide in 2014
yielded incomes over 50% to 80% of HUD’s Area Median Income (AMI). Using the data in Table 21,
a four-person household in Honolulu yielding between 50% and 80% AMI had incomes over $52,300
and under $83,680 (in 2017 dollars).
Table 21. HUD 2017 Income Limits for the State of Hawaii
30% AMI 50% AMI 80% AMI 100% AMI 120% AMI 140% AMI
Honolulu
County $31,380 $52,300 $83,680 $104, 600 $125,520 $146,440
Maui
County $25,830 $43,050 $68,880 $86,100 $103,320 $120,540
Kauai
County $25,590 $42,650 $68,240 $85,300 $102,360 $119,420
Hawaii
County $22,230 $37,050 $59,280 $74,100 $88,920 $103,740
Source: Hawaii Housing Finance Development Corporation
318 State of Hawaii, Hawaii Housing Finance and Development Corporation. (2017). 2017 Income, Sales, and Rent Guidelines. Retrieved from: http://dbedt.hawaii.gov/hhfdc/developers/copy2_of_copy_of_copy2_of_copy_of_income-sales-rent-guidelines/.
PAGE 112
4.2 Percentage of Population Owning Residential Dwelling Units as their Principal Place of
Residences:
The Hawaii Housing Planning Studies of 2006, 2011,
and 2016 provide data of the owner-occupied housing
units statewide, as reflected in Table 22.319 Hawaii
owner-occupancy declined 4.4% between 2006 and
2014.
Table 22. Population of Owner Occupied Units (2006 – 2014)
4.3 Percentage of Population Covered by Health Insurance:
According to the Department of Business Economic
Development and Tourism (DBEDT), the percentage of
civilian population with health insurance in Hawaii was
96% in 2015, 5.4% points higher than the U.S. average.
Figure 54 ranked Hawaii 4th among the 50 states and the
District of Columbia.320
319 State of Hawaii, Hawaii Housing Finance and Development Corporation, produced (2016). Hawaii Housing Planning Study, 2016. Prepared by SMS Research. Retrieved from: https://luc.hawaii.gov/wp-content/uploads/2017/05/Ex.-14_Hawaii-Housing-Planning-Study-2016.pdf. 320 State of Hawaii, Department of Business and Economic Development. (2016). Hawaii Rankings and Comparisons. http://dbedt.hawaii.gov/economic/ranks/.
Total Housing Units
Total Owner-
Occupied
Percent of Housing Units
Occupied by Households
2006 501,956 267,923 53.3%
2011 516,394 261,516 50.6%
2014 524,852 257,121 48.9%
Source: Hawaii Housing Planning Study, 2011, 2016.
48.9% OF HAWAII’S HOUSING
UNITS WERE OWNER-OCCUPIED
IN 2014 Hawaii Housing Planning Study
96% OF HAWAII’S POPULATION
WERE COVERED WITH HEALTH
INSURANCE IN 2015 Department of Business Economic Development
and Tourism
Figure 54. Hawaii’s Civilian Population with Health Insurance in 2015. Source: Department of Business Economic Development and Tourism
PAGE 113
4.4 Percentage of Population Using Public Transportation:
4.5 Percentage of Population Ridesharing:
The U.S. Census Bureau provides commuting
patterns analyzing how much of the State of Hawaii’s
population uses public transportation and/or
carpools in its American Community Survey, 5-year
estimate as reflect in Figure 55.
The State of Hawaii’s Department of Business and Economic Development (DBEDT) published its analysis of
Commuting Patterns in Hawaii in 2015, which reflects the rate of change in public transportation use and
carpooling between 1980 and 2013 as shown in Figure 56.
6.5% OF HAWAII’S POPULATION
USED PUBLIC TRANSPORTATION
14.1% OF CARPOOLED IN 2015 U.S. Census Bureau
6.00% 6.10% 6.30% 6.40% 6.50% 6.50%
15.40% 15.00% 15% 14.40% 14.20% 14.10%
0.00%
5.00%
10.00%
15.00%
20.00%
2010 2011 2012 2013 2014 2015
Statewide Percentage of Population Using Public Transportation and Ridesharing (2010-2015)
Using Public Transportation Carpooling
Figure 55. Statewide Percentage of Population using Public Transportation and Ridesharing (2010-2015). Source: U.S. Census Bureau, American Community Survey 2010-2015 5-year Estimate.
Figure 56. Statewide Commuting Patterns in Hawaii (1980-2013). Source: Department of Business Economic Development and Tourism, “Commuting Patterns in Hawaii”.
PAGE 114
4.6 Commute Time for Residents:
The US Census provides the mean travel time to work between 2011 and 2015 as reflected in Table 23.
Table 23. Statewide Mean Commute Time, By County (2011 – 2015)
2011-2015 Honolulu County Hawaii County Kauai County Maui County
Mean Commute
Time (Minutes) 28.2 Minutes 25.1 Minutes 22.4 Minutes 21.3 minutes
Source: U.S. Census Bureau, American Community Survey 5-Year Estimate.
To study congestion levels and excess fuel consumed due to congestion delay, the Texas A&M Transportation
Institute provides national Urban Mobility Information, which summarizes and determines nationwide congestion
levels and trends in Figure 57.
21
22
23
24
25
26
27
49
49.5
50
50.5
51
51.5
52
52.5
2007 2008 2009 2010 2011 2012 2013 2014
An
nu
al E
xces
s Fu
el C
on
sum
ed (
Gal
lon
s)
An
nu
al H
ou
rs o
f D
elay
Honolulu Annual Hours of Delay and Excess Fuel Consumed Per Commuter (2007-2014)
Annual Hours of Delay (Per Commuter)
Annual Excess Fuel Consumed (Gallons Per Commuter)
Figure 57. Honolulu Annual Hours of Delay and Excess Fuel Consumed by Commuter (2007-2014). Source: Texas A&M Transportation Institute, Urban Mobility Information.
PAGE 115
4.7 Percent Change in Annual Vehicle Miles Travelled:
The State of Hawaii’s 2016 Data Book provides the
statistical information of the annual vehicle miles
travelled as depicted in Figure 58.
Figure 58. Statewide Annual Motor Vehicle Miles per Year (2007-2016). NOTE: Data based on motor vehicle total by county inspection; includes both taxable and non-taxable vehicles, and all military non-resident exempt vehicles. Data include passenger cars, buses, trucks, and motorcycles but exclude trailers and semi-trailers. Source: Hawaii State Data Book, 2016.
Statewide Annual Motor Vehicle Miles Per Year (2007-2016)
Miles Per Vehicle
4.3% INCREASE IN ANNUAL
VEHICLE MILES DRIVEN
BETWEEN 2007 AND 2016 Hawaii State Data Book
PAGE 116
4.8 Percentage of Total Non-Motorized Trips:
Unfortunately, there is no combined recent data measuring the total of non-motorized trips. The State of
Hawaii’s Department of Business and Economic Development and Tourism (DBEDT) published its analysis of
Commuting Patterns in Hawaii in 2015, which references an earlier American Community Survey, 5-year
estimates conducted by the US Census Bureau as depicted in Figure 59.
According to Commuting Patterns in Hawaii, non-motorized trends commuting to work by bicycle rose 32.6%
from 5,300 bicycling commuters in 1980 to 7,026 bicycling commuters between 2009 and 2013. The same
report revealed a decline of 16% in walking to work from 36,840 pedestrian commuters in 1980 to 31,081
pedestrian commuters between 2009 and 2013.321
Walk Score, a private company which provides walkability services and ratings through a website and mobile
applications provides annual walkability indices that assigns a numerical walkability score between 0 and 100
that measures the walkability of any address in the United States. Walk Score rated urban Honolulu with a walk
score of 64, transit score of 56, and bike score of 45 in 2016. These scores show that urban Honolulu is
measured as only “somewhat walkable,” offered “many nearby public transportation options,” and has “minimal
bike infrastructure.” The majority of other towns and neighborhoods across the state were rated by Walk Score
as “car-dependent cit[ies]”.322
As of June 2017, Biki, Honolulu’s new bikeshare program launched to make bicycles a more convenient and
popular option for commuting within urban Honolulu. Since its launch in June 2017, Bikeshare Hawaii reported
that Biki logged more than 360,729 total rides, with nearly two-thirds of its users (231,414) taken by Oahu
residents in 2017.323
321 State of Hawaii, Department of Business Economic Development and Tourism. (2015). Commuting Patterns in Hawaii. Retrieved from: http://files.hawaii.gov/dbedt/economic/data_reports/briefs/Commuting_Patterns_Apr2015.pdf. 322 Walk Score. (2017). Retrieved from: https://www.walkscore.com/. 323 Honolulu Star-Advertiser. (Nov 1 2017). Bikeshare Hawaii CEO Pleased by Growth, Says Biki Evolving. Retrieved from: http://www.staradvertiser.com/2017/11/01/hawaii-news/bikeshare-hawaii-ceo-pleased-by-growth-says-biki-is-evolving/.
Figure 59. Commuting Patterns in Hawaii (1980-2013). Source: Department of Business Economic Development and Tourism, “Commuting Patterns in Hawaii.”
PAGE 117
4.9 High School Graduation Rates:
As the State’s Department of Education (DOE) begins
to focus on implementation of the Strategic Plan with
an eye toward sustainable improvement in the public
education system, focus has sharpened around three
important areas: school design, student voice, and
teacher collaboration. Work on these critical areas of
strategic focus will continue in the coming years.
In addition to the Strategic Plan, the DOE has partnered over the past several years with Hawaii P-20 Partnerships
for Education to track college and career readiness indicators.324 An annual report has been produced every year
since 2009. The report presents information on how well Hawaii’s graduates are prepared to meet the DOE’s
vision of what a high school graduate should be. Indicators are based on recommendations from Measures that
Matter: Making College and Career Readiness the Mission of High Schools, published by Achieve, a nonprofit
education organization created in 1996 by a bipartisan group of governors and business leaders to help states with
their college and career readiness goals.
Data presented in Table 24 is aggregate for the state; however, reports for individual high schools are available
online.
324 Hawaii P-20 Partnerships for Education. (2017). College and Career Readiness Indicators Reports. Retrieved from: http://www.p20hawaii.org/resources/college-and-career-readiness-indicators-reports/.
82% OF HAWAII’S HIGH
SCHOOL STUDENTS
GRADUATED ON-TIME IN 2016 Hawaii State Department of Education
PAGE 118
Table 24. DOE Statewide College and Career Readiness Indicators (2009-2016)
CLASS OF: 2009 2010 2011 2012 2013 2014 2015 2016 High School Completers1 11,451 10,787 10,805 11,596 11,275 11,216 10,927 11,003
On-time Graduation Rate2
80% 80% 81% 81% 82% 82% 82% 82%
Hawaii State Assessments (% Proficient)3,4 Reading 60% 62% 65% 67% 67% 72% 72% 54%
1 For these reports, high school completers include those who have earned diplomas or certificates of completion. 2 On-time graduation rate is based on the first-time ninth grade cohort adjusted for students who transferred in or out. 3 Hawaii State Assessment (HSA) proficiencies are based on each graduating class’s 10th grade scores. 4 2016 percentages reflect performance on the Smarter Balanced Assessment, which replaced the HSA. 5Advanced Placement results are reported for high school completers who took at least one Advanced Placement exam during high school. 6 For 2009, number and percentage of students taking AP exams. 7 For 2009, number of exams scored 3 of 5 or better. 8 Dual Credit participants are high school completers who took at least one credit course from the University of Hawaii while they were still enrolled in high school. Numbers reported for 2009 and 2010 reflect only participants in the Running Start program. These participants are high school completers who took at least one Running Start course during high school. 9 These data represent high school completers’ confirmed college enrollment following high school graduation and are based on reports provided by the National Student Clearinghouse. 10 These figures represent enrollment in any course that is below college-level. 11 “Other” courses satisfy UH general education mathematics or English requirements and/or may be used to fulfill a “terminal” mathematics or English requirement for a degree or certificate
Source: Hawaii Department of Education, data compiled from Hawaii P-20 Partnerships for Education Reports
PAGE 119
4.10 Proportion of High School Students Going on to Post-Secondary Education:
The data reflected in Table 25 represent high
school completers’ confirmed college enrollment
following high school graduation and are based on
reports provided by the National Student
Clearinghouse.
Table 25. Hawaii High School Completers College Enrollment (2009 – 2016)
4.11 Substance Abuse Rates:
The data reflecting the amount of substance abuse rates for Hawaii is provided by the Substance Abuse and
Mental Health Services Administration (SAMHSA), an agency of the U.S. Department of Health and Human Services
(DHHS). SAMHSA provides the percentages of selected drug use within Hawaii by age group through the National
Survey on Drug Use and Health: Comparison of 2008-2009 and 2014-2015 Population Percentages, compiled in
Table 26.325
Table 26. Hawaii Substance Abuse Rates Comparison between 2008 – 2009 and 2014 – 2015
Source: Data compiled from the National Survey on Drug Use and Health: Comparison of 2008-2009 and 2014-2015 Population Percentages.
325 U.S. Department of Health and Human Services, Substance Abuse and Mental Health Services Administration. (2016). National Survey on Drug Use and Health: Comparison of 2008-2009 and 2014-2015 Population Percentages. Retrieved from: https://www.samhsa.gov/data/sites/default/files/NSDUHsaeLongTermCHG2015/NSDUHsaeLongTermCHG2015.htm.
CLASS OF: 2009 2010 2011 2012 2013 2014 2015 2016 College Enrollment Nationwide, Fall
College Enrollment, UH only, Fall # (%) of completers
4,590 (40%)
4,232 (39%)
4,384 (41%)
4,409 (38%)
4,258 (38%)
4,136 (37%)
3,956 (36%)
3,888 (35%)
Source: Data compiled from reports provided by the National Student Clearinghouse.
55% OF HAWAII’S HIGH SCHOOL
CONTINUED ON TO POST-
SECONDARY EDUCATION IN 2016 National Student Clearinghouse
PAGE 120
4.12 Proportion of Family Income Spent on Housing:
Hawaii’s Department of Business and Economic
Development and Tourism (DBEDT) published many
consumer spending reports studying each county’s
consumer spending habits. The Summary of
Consumer Spending by County: 2014 report was a
statewide compilation of consumer spending habits
throughout the State was released in February
2017. The results of DBEDT’s study, depicted in
Table 27, show that Hawaii households spent an
average of 42.1% of their expenditures on housing.
It should be noted that each county’s respective report included expenditures by demographic categories including
age, income, and household size that are not included in the analysis below.326
326 State of Hawaii, Department of Business Economic Development and Tourism. (2017). Summary of Consumer Spending by County: 2014. Retrieved from: http://files.hawaii.gov/dbedt/economic/reports/CE_Comparison_Final.pdf.
HAWAII HOUSEHOLDS SPENT
42.1% OF THEIR EXPENDITURES ON
HOUSING IN 2014
Department of Business Economic Development
and Tourism
Table 27. Percentage of Annual Household Expenditures by County in 2014
Source: Department of Business Economic Development and Tourism, Summary of Consumer Spending by County: 2014.
PAGE 121
4.13 Percentage of Population Engaged In Volunteer Work:
This report found that there was no state agency
collecting or maintaining any data on the
percentage of Hawaii’s population engaged in
volunteer work.
The Corporation for National and Community
Service (CNCS) is a federal agency that engages
Americans across the country through its core
programs: Senior Corps, AmeriCorps, the Social
Innovation Fund, and Serve.gov. As the nation’s
largest grant maker for service and volunteering,
CNCS plays a critical role in strengthening America’s
nonprofit sector and addressing our nation’s challenges through service. Each year the CNCS ranks each state
across the nation based on the percent of residents who volunteer, of the national rankings, Hawaii was among
the ten lowest ranking states with the worst volunteer ranking.
According to the Corporation for National and Community Service, Hawaii has a total of 489 service sites, and
2,376 Senior Corps and AmeriCorps members. Hawaii has also collected a total of $18.4 million in CNCS and local
funding, and received $16.6 million in AmeriCorps scholarships earned since 1994.327 The following data in Figure
60 are a compilation of Hawaii’s population percentage engaged in volunteer work according to the CNCS.328
Over the past decade, Hawaii has consistently ranked among the bottom ten states in volunteerism nationwide
and volunteerism among Hawaii’s population declined 2.74% between 2005 and 2015.
327 U. S. Corporation for National and Community Service. (2017). National Service in Hawaii. Retrieved from: https://www.nationalservice.gov/sites/default/files/upload/states/HI-StateGraphic.png. 328 U. S. Corporation for National and Community Service. (2015). State Rankings by Volunteer Rate. Retrieved from: https://www.nationalservice.gov/vcla/state-rankings-volunteer-rate.
Figure 60. Hawaii Statewide Volunteer Rate (2005-2015). Source: Corporation for National Community Service
4.14 Percentage of Population With Internet Access At Their Residence:
The US Census American Community Survey began
collecting and reporting the internet accessibility
available in residential homes in 2013. Since 2013,
Hawaii households consistently had a higher
percentage of some form of internet access
available in their homes compared to the US
average. Figure 61 shows that in 2016, 84% of
Hawaii’s households had internet access at home.
4.15 Out Migration Rates of High School Graduates:
The US Department of Education’s National Center
for Education Statistics offers an annual Digest of
Education Statistics, which provides biennial
migration data of students leaving their home
states.329
The data show in Figure 62 that Hawaii’s high school
out-migration rates (Hawaii high school students who
left Hawaii after graduation), increased 13% between
2008 and 2014.
329 U.S. Department of Education, National Center for Education Statistics. (2016). 2008-2016 Digest of Education Statistics. Retrieved from: https://nces.ed.gov/programs/digest/index.asp.
79.60%
80.60%
82.20%
84%
79%
80%
81%
82%
83%
84%
85%
2 0 1 3 2 0 1 4 2 0 1 5 2 0 1 6
Internet Access At Home (2013 - 2016)
Figure 61. Hawaii Households with Internet Access at Home (2013-2016). Source: U.S. Census Bureau, data compiled from American Community Surveys.
84% OF HAWAII’S HOUSEHOLDS
HAD INTERNET ACCESS IN 2016
US Census Bureau
2,8732,589
2,769
3,251
2,000
2,500
3,000
3,500
Fall 2008 Fall 2010 Fall 2012 Fall 2014
Hawaii High School Graduate Out-Migration Rates (2008 - 2014)
Figure 62. Hawaii High School Student Out-Migration Rates (2008-2014). Source: U.S. Department of Education National Center for Education Statistics, Digest of Education Statistics.
3,251 OF HAWAII’S HIGH SCHOOL
GRADUATES LEFT HAWAII
IN 2014
US Department of Education
PAGE 123
4.16 Percentage of Children Enrolled in Pre-School:
Early learning opportunities in the state are varied and involve both public and private providers. The vast majority
of children attending early education programs do so through private providers, though public offerings funded by
both the state and federal levels, have been slowly growing.
In 2012, the Hawaii State Legislature passed Act 178, Session Laws of Hawaii 2012, which established the Executive
Office on Early Learning (EOEL). EOEL has been tasked with developing a statewide early learning system to
coordinate resources and increase the number of young children enrolled in early education programs.
In recent years, EOEL has focused on developing a public pre-kindergarten program and coordinating with other
early learning service providers to increase access to early learning opportunities. Note that the numbers Tables
28 and 29 represent enrollment in public pre-K options, whereas the majority of children attending pre-K in the
state do so through private pre-K providers.
Table 28. Hawaii Executive Office on Early Learning Public Pre-Kindergarten Program (2014 – 2017)
YEAR 2014-2015 2015-2016 2016-2017 Total 4-yr. Old Population 17,451 18,461 Not available
Number of Classrooms 20 21 21 Available Seats 400 420 420
Total Enrollment 365 375 370 Teachers 20 21 21
Educational Assistants 20 21 21 NOTE: Upon initial establishment in 2012, EOEL was temporarily placed within the Governor’s Office. However, since permanent agencies are not allowed to be attached to the Governor’s Office, EOEL was administratively attached to the DOE beginning in 2015. Source: Executive Office on Early Learning
Table 29. Children Attending Pre-Kindergarten Programs on DOE Campuses (2013 – 2017)
YEAR 2013-2014 2014-2015 2015-2016 2016-2017 SPED Pre-K (3 and 4 years) 1,527 1,462 1,537 1,532 KALO Pre-K (3 and 4 years) 113 101 88 90
EOEL Pre-K (4 years only) N/A 365 375 370 Charter Pre-K (4 years only) N/A N/A 72 Not available
Source: Hawaii Executive Office on Early Learning.
There appears to be no single indicator tracking the percentage of children enrolled in pre-school, particularly
when the data is viewed longitudinally. The KIDS COUNT Data Book and Data Center does provide simple,
descriptive longitudinal data for the “share of children ages 3 to 4 not enrolled in school, including nursery school,
preschool school or kindergarten, during the previous three-months.”330 Due to small sample size, these data are
based on a pooled three-year average of 1-year American Community Survey responses to increase the accuracy of
the estimates.331
Table 30. Number and Percentage of 3- and 4-year olds Not Enrolled in Pre-K (2009 – 2015)
YEAR SPAN: 2009-2011 2010-2012 2011-2013 2012-2014 2013-2015
Number 16,000 17,000 18,000 18,000 19,000
Percentage 44% 46% 49% 49% 52% NOTE: data reflected in Table 30 indicate that as a percentage of the total, over time, fewer 3- and 4-year olds are enrolled in some type of early learning program. These numbers should not be taken at face value. Additional targeted research needs to be done to contextualize the data and determine the actual impact and its cause. Source: Population Reference Bureau, analysis of data from the U.S. Census Bureau, pooled 2007-2009 to 2013-2015 one-year American Community Survey.
330 The Annie C. Casey Foundation. Kids Count Data Center. (2017). Young Children Not in School. Retrieved from: http://datacenter.kidscount.org/data/tables/9010-young-children-not-in-school?loc=13&loct=2#detailed/2/13/false/1491,1443,1218,1049,995/any/17975,17976. 331 Ibid.
PAGE 124
4.17 Number and Diversity of Recreational Facilities and Activities Per Capita:
Due to the lack of a permanent government sustainability coordinating entity, the number and diversity of
recreational facilities and activities per capita was not measured over the past ten years.
The Department of Land and Natural Resources, Division of Forestry and Wildlife (DLNR-DOFAW) provided
information on the recreational facilities they provide, which include 900,000 acres of public hunting lands and 855
miles of trails and access roads. DLNR continues to improve and expand access and hunting opportunities.
PAGE 125
Financial Literacy:
The Hawaii 2050 Sustainability Plan also discussed the importance of increasing awareness and competency in
financial literacy and asset building to strengthen Hawaii’s social safety net. There was no indicator provided to
measure financial literacy implementation; therefore, this summary will be added to show recent developments to
increase awareness and competency in financial literacy.
The Department of Education (DOE) explained their involvement in improving the financial literacy competencies
through Hawaii’s public schools. Senate Concurrent Resolution 97, Senate Draft 1 (SCR 97) was adopted by the
Hawaii State Legislature in 2015.332 SCR 97 requested the DOE establish a Hawaii Public Schools Financial Literacy
Task Force (Task Force). In its final report to the Legislature, the task force provided the following findings333:
“There is general consensus among all sectors of the community about the importance and need for
financial literacy education for all students. Research conducted by the Financial Literacy Task Force and
the results of a separate stakeholder Financial Capability Survey conducted in 2015 by the Hawaii Alliance
for Community-Based Economic Development provided the basis for the following findings.
Financial Literacy Models and Pathways. There are financial literacy education models currently in
place in Hawaii’s public schools. Hawaii’s core standards provide rigorous foundational knowledge
and skills, and the Career and Technical Education (CTE) and Personal Transition Plan (PTP) courses
are existing pathways that can be leveraged directly to engage Hawaii students in learning about
financial literacy.
Community Resources. There is a plethora of community resources available to schools; however,
there is a need for system-wide coordination of access to and use of such resources and programs.
Some of the resources are unique to a community or island, others are available statewide. A
coordinated effort will allow schools to match community resources to their student data, thereby
ensuring relevant and culturally sensitive programs.
Learning Opportunities, Transition Points. The transition from middle school to high school and the
transition out of high school are ideal avenues to reach all students in providing financial literacy
education. Currently, all public school students entering high school must create Personal Transition
Plans [sic] that identifies [sic] benchmarks at each grade level to prepare them for college or future
careers.
332 S.C.R. 97, S.D.1, 28th Leg., Reg. Sess. (Haw. 2015). Retrieved from: https://www.capitol.hawaii.gov/session2015/bills/SCR97_SD1_.pdf. 333 State of Hawaii, Department of Education. (2015). Financial Literacy Task Force Final Report. Retrieved from: https://www.hawaiipublicschools.org/Reports/leg15_finlit.pdf.
PAGE 126
Financial Literacy Learning Standards. It is critical that the DOE, in partnership with financial literacy
experts, integrate and align the financial literacy learning standards and resources with the Hawaii
Common Core Standards.
Profession [sic] Development. Professional development to provide teachers with the knowledge
and skills to integrate financial literacy instruction into their classrooms is essential. This will require
additional financial resources.
Implementation and Sustainability. There is an overarching need for a systemic effort to coordinate,
integrate, and sustain financial literacy education in the schools. This includes the engagement of
community partners and acquisition of resources to sustain the initiative. Other issues that need
further study include addressing legal and cultural concerns, identifying aligned curricula and
programs, obtaining trained and qualified financial literacy teachers, and dedicating instructional time
to teaching financial literacy.”334
The Task Force also made the following policy recommendations:
“Near Term Goals
Recommendation 1. Community stakeholders and the Department of Education collaborate to establish a
financial literacy resource page on the Department website that contains links to local and national financial
literacy resources.
Recommendation 2. The DOE Office of Curriculum, Instruction, and Student Support shall identify and align the
current content standards with financial literacy concepts.
Long Term Goals
Recommendation 3. The DOE Office of Curriculum, Instruction, and Student Support shall create and identify
professional development opportunities for teachers to become trained to deliver financial literacy in the
classroom.
Recommendation 4. The Department of Education shall consider the establishment of a position in the DOE’s
Office of Community Engagement in the Office of the Superintendent dedicated to identify [sic] schools interested
in participating in financial literacy integration projects and provide links to exiting financial literacy providers.
Recommendation 5. The Department of Education shall encourage the Hawaii Congressional Delegation to
identify and secure Federal funding to support financial literacy in Hawaii public schools.”335
The DOE has already made progress toward implementing these policy recommendations. The DOE’s public
website has a page dedicated to financial literacy that identifies and links to various resources, including those
provided by the Department of Commerce and Consumer Affairs, financial reality fairs, and additional resources,
including the personal finance course Junior Achievement Hawaii and resources provided by local banks and credit
unions.336 The DOE also created a matrix identifying DOE standards with opportunities to integrate financial
literacy concepts.337
334 Financial Literacy Task Force Final Report, pp. 7-8. 335 Ibid, p.24. 336 State of Hawaii, Department of Education. (2017). Financial Literacy Website. Retrieved from:http://www.hawaiipublicschools.org/TeachingAndLearning/StudentLearning/FinLit/Pages/default.aspx. 337 State of Hawaii, Department of Education. (2016). Hawaii Department of Education standards with Opportunities to Integrate Financial Literacy Concepts. Retrieved from:http://www.hawaiipublicschools.org/DOE%20Forms/Standards/HIDOEStandards_FinLit.pdf.
PAGE 127
In addition, as the Financial Literacy Task Force acknowledges, there are several schools, particularly those in the
Hawaii Academy Schools Consortium, that have already integrated financial literacy education into their Career
and Technical Education pathways. Model examples include Kapaa High School and Waipahu High School.338
The Hawaii 2050 Sustainability Plan also encouraged the State to provide after-school and extra-curricular
programs to enable Hawaii’s youth to broaden their life experiences; therefore, §302A-1149 of the Hawaii Revised
Statutes establishes the Department of Education’s authority to enter into agreements and contracts with
individuals, organizations, and agencies for the use of facilities for the operation of after-school child care
programs. To this end, the DOE oversees and manages several different out-of-school time programs, including
the following339:
A+
The DOE contracts with partners to provide after-school care for children of working parents. Each contractor
operates programs at specified school sites, where students have the opportunity to work on homework and
participate in enrichment activities including arts, crafts, drama, dance, sports, and games. Fees for this program
are nominal to ensure that it is an affordable option for as many families as possible.
REACH
The Resources for Enrichment, Athletics, Culture, and Health program provides an organizational framework for
after-school programs for students in grades 6-8. The stated purpose of the program is to provide academic and
social foundations to serve as a buffer against high school dropout. The initiative uses federal and state funds to
implement a community-based approach through partnerships with schools, parents, and the private sector to
provide after-school programs that focus on academic enrichment, athletics, and arts and culture.
UPLINK
The Uniting Peer Learning, Integrating New Knowledge program is an after-school program for middle-school-aged
children using funds from the Temporary Assistance for Needy Families (TANF) federal grant. This activity-based
program is intended to proactively counter risky behavior during after-school hours and includes offerings such as
cooking, gardening, music, dance, seasonal sports, crafts, and math classes; math and science clubs; and
multimedia and computer activities, all with an emphasis on character-building and good decision-making. The
program also offers homework assistance and tutoring.
Along with these programs, there continues to be an emphasis on providing out-of-school time programs. In 2016,
the Hawaii State Legislature adopted House Concurrent Resolution 137 Senate Draft 1, Requesting the Department
of Education to Convene a Working Group to Review After-school Programs in Hawaii’s Public Middle and
Intermediate Schools.340 The working group, convened by the Director of the DOE’s Community Engagement
Office, met four times between June 30, 2016, and November 17, 2016 to assess the landscape of middle and
intermediate after-school programs and provide recommendations for future action. The result was a final report
that detailed common assumptions, collected data, and recommendations, including the continuation of the
Working Group.341
338 Financial Literacy Task Force Final Report, pp. 19-20. 339 State of Hawaii, Department of Education. (2017). After School Programs Website. Retrieved from: http://www.hawaiipublicschools.org/BeyondTheClassroom/AfterSchoolPrograms/Pages/home.aspx. 340 H.C.R. 137, S.D.1, 28th Leg., Reg. Sess. (Haw. 2016). Retrieved from: https://www.capitol.hawaii.gov/session2016/bills/HCR137_SD1_.PDF. 341 State of Hawaii, Department of Education. (2016). After School Programs for Public Middle and Intermediate Schools Final Report. Retrieved from: http://www.hawaiipublicschools.org/Reports/LEG16_afterschool.pdf.
PAGE 128
Goal 5: Sustaining Kanaka Maoli Culture and Island Values
The Hawaii 2050 Sustainability Plan highlighted that with no aloha, there is no sustainability. Among the Hawaii
2050 Task Force’s statewide measurement of Hawaii’s residents’ sustainability goals, one of the strongest themes
that emerged from the surveyed residents, whether they were born locally in Hawaii or not, was their attraction to
and wish to remain in Hawaii because of our unique island values and lifestyle. Hawaii residents statewide
expressed their respect and aloha for the traditions and values of our Kanaka Maoli and diverse island cultures that
makes Hawaii unique.
To measure the goal to sustain our Kanaka Maoli culture and island values, the Hawaii 2050 Sustainability Plan
provided four strategic actions and the following eight indicators:
STRATEGIC ACTIONS:
1. Honor Kanaka Maoli.
2. Celebrate our cultural diversity and island way of life.
3. Enable Kanaka Maoli and others to pursue traditional Kanaka Maoli lifestyles
and practices.
4. Provide support for subsistence based businesses and economies.
EIGHT INDICATORS:
1. Percentage of students enrolled in Kanaka Maoli language classes at the secondary
and post-secondary levels.
2. Number of teachers teaching the language of the Kanaka Maoli.
3. Number of hula halau and ethnic dance groups.
4. Per capita government and private expenditures on culture and the arts.
5. Attitudinal survey of the perpetuation of Kanaka Maoli culture and island values (aka
the “aloha index”).
6. Number of laws enacted that protect Kanaka Maoli intellectual property and traditional
knowledge, cultural expressions, art forms and site-specific areas including language
dialects, place names, and resource practices.
7. Number of community programs and projects that promote Hawaiian culture,
knowledge, traditions and practices through the means of the Hawaiian language.
8. Amount of capital provided to sustain subsistence-based businesses and economies.
PAGE 129
Summary of Progress toward the “Sustaining Kanaka Maoli Culture and Island Values”
Strategic Actions and Indicators:
The Hawaii 2050 Sustainability Plan’s fifth goal, to ensure that our Kanaka Maoli and island cultures and values are
thriving and perpetuated, has slowly progressed over the past decade.
Outdated Indicators/Terminology
The majority of this goal’s indicators were not tracked, unmeasurable, or outdated. Should the State fund an
update to the Hawaii 2050 Sustainability Plan, this report recommends the update of cultural indicators to
measure a sustainable island culture. Members of the Native Hawaiian community should provide insight to
better develop the cultural goals for Hawaii’s sustainability.
PAGE 130
Measurement of Indicators:
1.1 Percentage of Students Enrolled in Kanaka Maoli Language Classes at the Secondary and
Post-Secondary Levels:
Department of Education
Over the past ten years, the DOE invested many of its resources to integrate and sustain Kanaka Maoli culture and
values throughout the public school system. The Office of Hawaiian Education (OHE), established in 2014 and led
by community leader and educator Kau‘i Sang, has made great strides in further developing the Hawaiian
Language Immersion Program, supporting Hawaiian Language Immersion Charter Schools, and bringing together
the Kanaka Maoli community to work toward common education goals.
In addition, the 2017-2020 Joint DOE-BOE Strategic Plan includes Na Hopena Aʻo values as an all-encompassing
starting point for how the DOE intends to approach its work and the education of our keiki. Nā Hopena Aʻo (HĀ) is
a Hawaii Department of Education system-wide framework and Board of Education Policy to develop the skills,
behaviors and dispositions that are reminiscent of Hawaii’s unique context and to honor the qualities and values of
the indigenous language and culture of Hawaii.
OHE is still in its formative years and has prioritized relevant capacity-building and outreach foci; much of the data
the DOE has collected is qualitative in nature with quantitative data likely to come in the future. In laying a
foundation for cultural sustainability, OHE has developed a strategic plan with community input gathered at annual
Native Hawaiian Education Summits, which led several major initiatives within the DOE: the creation of a Hawaiian
Language assessment and assessments for language arts and math in the Hawaiian language, the development of a
Hawaiian Language Immersion Program Strategic Plan, and the department-wide integration of Nā Hopena A‘o.
Working with community partners, including the Curriculum Research and Development Group, Aha Kauleo, and
the Office of Hawaiian Affairs, OHE has led the effort in the development of Hawaiian Language Immersion
Assessments. Rather being translating of existing assessments, these assessments are fully developed in the
Hawaiian language to assess academic achievement against the Hawaii Common Core State Standards for students
in the Hawaiian Language Immersion program.
In addition, OHE has been instrumental in facilitating the implementation of Nā Hopena A‘o throughout the DOE.
Nā Hopena A‘o is a department-wide framework to develop the skills, behaviors, and dispositions that are
reminiscent of Hawaii’s unique context. It is intended to honor the qualities and values of the indigenous language
and culture of Hawaii. Former Board of Education member Cheryl Lupenui began developing the framework in
2013; it was approved in June of 2015. The Board of Education Policy, Policy E-3: Nā Hopena A‘o reads as
follows342:
Nā Hopena A‘o (“HĀ”) is a framework of outcomes that reflects the Department of Education’s core
values and beliefs in action throughout the public educational system of Hawaii. The Department of
Education works together as a system that includes everyone in the broader community to develop the
competencies that strengthen a sense of belonging, responsibility, excellence, aloha, total well-being and
Hawaii (“BREATH”) in ourselves, students and others. With a foundation in Hawaiian values, language,
culture and history, HĀ reflects the uniqueness of Hawaii and is meaningful in all places of learning. HĀ
supports a holistic learning process with universal appeal and application to guide learners and leaders in
the entire school community.
342 State of Hawaii, Board of Education. (2016). BOE Policy E-3 Nā Hopena Aʻo (HĀ). Retrieved from: https://www.hawaiipublicschools.org/DOE%20Forms/HA-Article-July2016.pdf.
PAGE 131
The following guiding principles should lead all efforts to use HĀ as a comprehensive outcomes
framework:
All six outcomes are interdependent and should not be used separately.
Support systems and appropriate resources should be in place for successful and thoughtful
implementation.
Planning and preparation should be inclusive, collective and in a timeframe that is sensitive to the
needs of schools and their communities.
Current examples of HĀ in practice can be drawn on as sources for expertise.
All members of the school community share in the leadership of HĀ.
(Hawaii Board of Education, Policy E-3)
OHE has hosted several different events as part of the Nā Hopena A‘o implementation process, including a HĀ
Designers Convening as a start to hosting HĀ Community Days and an Annual HĀ Summit, as well as several
publications to assist school in integrating HĀ into their curriculum.343
Additionally, the development of programs and networks like Kanaeokana, which is a network of ʻōlelo Hawaii,
Hawaiian culture, and ʻāina-based schools (pre-school through university level) strengthen Hawaiian education
help to ensure that schools with Hawaiian language programs continue to grow and thrive. Kanaeokana is
primarily funded through the Kamehameha Schools, which highlights the important role private funders play in
progressing this portion of the Hawaii 2050 Sustainability Plan. Additionally, the Hawaii Association of
Independent Schools (HAIS) and local Western Catholic Education Association (WCEA) schools continue to add and
increase their ‘ōlelo Hawaii programming.
343 State of Hawaii, Department of Education. (2017). Nā Hopena Aʻo (HĀ) Website. Retrieved from: http://www.hawaiipublicschools.org/TeachingAndLearning/StudentLearning/HawaiianEducation/Pages/HA.aspx.
PAGE 132
University of Hawaii
The University of Hawaii’s Kawaihuelani Center for Hawaiian Language provided their most recent enrollment data
for the purposes of this report. The Kawaihuelani Center for Hawaiian Language’s had a total student enrollment
of 7,310 students between Fall 2013 and Spring 2017; however, the data show a steady decrease of student
enrollment within the Kawaihuelani Center for Hawaiian Language.
Between these academic years, the University of Hawaii’s Kawaihuelani Center for Hawaiian Language also
provided the data of student enrollment of the HAW 101-Elementary Hawaiian course. The HAW-101 course is the
entry-level course to the Kawaihuelani Center for Hawaiian Language and concurrently serves as a course
fulfillment for the University’s Hawaiian or Second Language Requirement. Contrary to the data of the
Kawaihuelani Center for Hawaiian Language’s total student enrollment shown in Figure 63, the HAW-101
Elementary Hawaiian course student enrollment shown in Figure 64 is more stable.
920826 761 766
61 91 82
1,041948 922 892
0
200
400
600
800
1,000
1,200
2013 2014 2015 2016 2017
UH Kawaihuelani Center for Hawaiian Language Total Student Enrollment (2013-2017)
Spring Enrollment Summer Enrollment Fall Enrollment
Figure 63. University of Hawaii Kawaihuelani Center for Hawaiian Language Total Student Enrollment. Source: University of Hawaii Kawaihuelani Center for Hawaiian Language.
9783
100
12 5
188160
172
0
50
100
150
200
2014 2015 2016 2017
UH Student Enrollment in HAW-101"Elementary Hawaiian" Classes (2014-2017)
Spring Enrollment Summer Enrollment Fall Enrollment
Figure 64. University of Hawaii Student Enrollment in HAW-101: Elementary Hawaiian (2014-2017). Source: University of Hawaii Kawaihuelani Center for Hawaiian Language.
PAGE 133
1.2 Number of Teachers Teaching the Language of the Kanaka Maoli:
This report was unable to identify the exact number of teachers statewide teaching the Hawaiian language;
however, this report will highlight the recent initiatives being made to revitalize Hawaiian language teaching and
immersion.
Department of Education
The Department of Education and Hawaii’s Public Charter Schools jointly participate in the Kaiapuni Schools, which
provide Hawaiian language immersion. These Hawaiian language Immersion Schools are revitalizing the Hawaiian
language through the education of students grades K-12. Kaiapuni Schools deliver instruction exclusively through
the medium of the Hawaiian language until grade 5, whereupon English is formally introduced. Presently there are
23 Hawaiian language immersion schools: 17 HIDOE sites under the jurisdiction of the Superintendent and 6
Charter School sites under the jurisdiction of the Board of Education.344
DOE Schools: Island of Hawaii: Grades:
'Ehunuikaimalino K-12
Hilo High 9-12
Maui:
Hāna School K-12
Kalama Intermediate 6-8
King Kekaulike High 9-12
Lahaina Intermediate 6-8
Lahainaluna High 9-12
Nāhi'ena'ena Elementary K-5
Pā'ia Elementary K-6
Molokai:
Molokai Middle 7-8
Molokai High 9-12
Oahu:
Ānuenue K-12
Hau'ula Elementary K-6
Kahuku High & Intermediate 7-12
Nānākuli Elementary K-6
Pū‘ōhala Elementary K-6
Waiau Elementary K-6
344 State of Hawaii, Department of Education. (2017). Kaiapuni Schools-Hawaiian language immersion listing. Retrieved from: http://www.hawaiipublicschools.org/TeachingAndLearning/StudentLearning/HawaiianEducation/Pages/Hawaiian-language-immersion-schools.aspx.
PAGE 134
Charter Schools: Island of Hawaii: Grades: Ka 'Umeke Kā'eo PCS K-10 Nāwahīokalani'ōpu'u Iki Lab PCS K-8 Molokai: Kualapu'u El NCPCCS K-6 Oahu Kamakau Lab PCS K-12 Kauai: Ke Kula Niihau o Kekaha K-12 Kawaikini NCPCS K-11
5.3 Number of Hula Halau and Ethnic Dance Groups:
There is no data available of the total number of hula halau
and ethnic dance groups throughout the state over the past
ten years.
Mele.com, a website that serves as an online source for
Hawaiian music since 1995, provides a worldwide listing of
halau hula as a resource service for students wishing to study Hawaiian hula as well as kumu hula. According to
Mele.com, in 2017 there were a total of 203 halau hula statewide: 42 on the Island of Hawaii, 20 on the Island of
Maui, 2 on the Island of Molokai, 20 on the Island of Kauai, and 116 on the Island of Oahu.345
5.4 Per Capita Government and Private Expenditures on Culture and the Arts:
Due to the lack of a permanent government sustainability coordinating entity, no measurement was conducted
measuring the per capita government and private expenditures on culture and the arts over the past ten years.
Government entities, however, including the Hawaii Tourism Authority and the Office of Hawaiian Affairs and
private funders have provided grants and funding to support culture and the arts.
The Hawaii Tourism Authority (HTA) funds cultural events through its Kūkulu Ola Living Hawaiian Culture Program.
These programs, initiated by the community and supported by HTA, showcase the unique and diverse experiences
available for resident and visitor participation and attendance across the Hawaiian Islands. Since 2010, the HTA
has awarded a total of $4,670,899.81 to 166 community organizations to host cultural events across the islands
between 2010 and 2016, shown in Figure 66. In 2017, HTA funded 124 programs statewide through their
community enrichment program, aloha aina program, and kukulu ola program.346
5.5 Attitudinal Survey of the Perpetuation of Kanaka Maoli Culture and Island Values
(AKA The “Aloha Index”):
Due to the lack of a permanent government sustainability coordinating entity over the previous decade, no
measurement of an attitudinal survey of the perpetuation of Kanaka Maoli culture and island values (aka the
“Aloha Index”) was conducted over the past ten years, elements of this should be integrated into the Hawaii
Tourism Authority Resident Sentiment Study.347
346 State of Hawaii, Hawaii Tourism Authority. (2017). 2018 Community Enrichment Program. Retrieved from: http://www.hawaiitourismauthority.org/default/assets/File/Community%20Programs%202018.pdf. 347 State of Hawaii, Hawaii Tourism Authority. (2016). Annual Report to the Hawaii State Legislature. Retrieved from: http://www.hawaiitourismauthority.org/default/assets/File/2016HTAFinalAnnualReport%20Modified%20033017.pdf.
Figure 65. Hawaii Tourism Authority Kukulu Ola Living Hawaiian Culture Program Funding (2010-2016). Source: Hawaii Tourism Authority
HTA Kukulu Ola Living Hawaiian Culture Program Funding (2010 - 2016)
PAGE 136
5.6 Number of Laws Enacted that Protect Kanaka Maoli Intellectual Property and Traditional
Knowledge, Cultural Expressions, Art Forms and Site-Specific Areas including Language
Dialects, Place Names, and Resource Practices:
Between 2008 and 2017, this report found that no state laws were enacted to protect the intellectual property of
the Kanaka Maoli. An American University 2011 Intellectual Property Brief highlighted local history of Native
Hawaiian needs for cultural trademarks and intellectual property rights to protect Native Hawaiian culture and
recommended the establishment of a Native Hawaiian cultural trademark program as an important yet
incremental step toward protecting native Hawaiian culture to build momentum of a larger dialogue in Hawaii of
creating customized solutions to protect and preserve the indigenous intellectual property rights of Native
Hawaiian culture.348 Most recently, at the 2017 Association of Hawaiian Civic Clubs 58th Annual Convention, a
resolution (2017-57) urging the Hawaii State Legislature to support indigenous intellectual property rights
passed.349
5.7 Number of Community Programs and Projects that Promote Hawaiian Culture, Knowledge,
Traditions and Practices through the Means of the Hawaiian Language:
Due to the lack of a permanent government sustainability coordinating entity over the previous decade, the
number of community programs and projects that promote Hawaiian culture, knowledge, traditions, and practices
through the means of the Hawaiian language was not measured over the past ten years; however, government
entities, including the Hawaii Tourism Authority and the Office of Hawaiian Affairs, could possibly begin to
coordinate and measure the number of these community programs through their grant funding to improve the
availability of data in future measurements.
348 Mantilla, N. (2011). American University Intellectual Property Brief, The New Hawaiian Model: The Native Hawaiian Cultural Trademark Movement and the Quest for Intellectual Property Rights to Protect and Preserve Native Hawaiian Culture. Retrieved from: http://digitalcommons.wcl.american.edu/cgi/viewcontent.cgi?article=1038&context=ipbrief. 349 The Association of Hawaiian Civic Clubs. (2017). Resolution 2017-57: Urging the Hawaii State Legislature to Support the Intellectual Property Rights and Traditional Cultural Expressions in our Fashion Industry to Promote Productivity, Competitiveness, and Economic Growth. http://www.aohcc.org/images/stories/2017/Resolutions/2017-AHCC-Resolutions-Nos-41---58.pdf.
PAGE 137
5.8 Amount of Capital Provided to Sustain Subsistence-Based Businesses and Economies:
The Office of Hawaiian Affairs’ Strategic Plan was initiated in 2010 with goals to be achieved in 2018. The first data
available toward these goals began in 2011-2012. The Office of Hawaiian Affairs (OHA) began reporting itemized
information of the grants awarded to beneficiaries in 2012 through their annual reports, shown in Figure 66.
Many of the programmatic grants for culture and land reflected traditional Hawaiian teachings of subsistence-
based economies and businesses between 2012 and 2016.
Similarly, the Hawaii Tourism Authority offers Aloha ‘Āina awards to community-based projects and programs that
enhance, strengthen, and perpetuate the Hawaiian culture and community. Protecting Hawaii’s natural resources
was identified as necessary for achieving the vision of the Hawaii Tourism Authority’s (HTA) Five Year Strategic
Plan.350 The Aloha ‘Āina Program supports projects that ensure that the heart of Hawaii’s resources are protected,
respected, and perpetuated. This HTA program provides funding through requests for proposals to support
organizations that manage, improve, and protect Hawaii's natural environment and areas frequented by visitors.
The program awards funds up to $100,000 to organizations statewide. Figure 67 describes that between 2010 and
2016, HTA awarded $5,907,563.97 to 195 organizations statewide to protect Hawaii’s natural resources through its
Aloha ‘Āina program statewide. As of 2017, HTA awarded 26 organizations through its Aloha ‘Āina Program.351
350 State of Hawaii, Hawaii Tourism Authority. (2016). Five Year Strategic Action Plan. Retrieved from: http://www.hawaiitourismauthority.org/default/assets/File/HTA15001-Strategic%20Plan_web.pdf. 351 State of Hawaii, Hawaii Tourism Authority. (2017). 2018 CEP Awardees. Retrieved from: http://www.hawaiitourismauthority.org/default/assets/File/Community%20Programs%202018.pdf.
$505,500 $377,585
$977,920
$743,510
$1,063,500
$733,113
$383,885
$1,064,284
$459,840
$726,500
$0
$200,000
$400,000
$600,000
$800,000
$1,000,000
$1,200,000
2012 2013 2014 2015 2016
OHA Programmatic Grants Awarded to Sustain Subsistence-Based Businesses and Economies (2012 - 2016)
Programmatic Grants for Land Programmatic Grants for Culture
Figure 66. OHA Programmatic Grants Awarded to Sustain Subsistence-Based Businesses and Economies (2012-2016). Source: Office of Hawaiian Affairs Annual Reports 2012-2016.
$1,000,000
$616,000
$727,424.97
$900,000 $800,000
$1,000,139
$864,000
$0
$200,000
$400,000
$600,000
$800,000
$1,000,000
$1,200,000
2010 2011 2012 2013 2014 2015 2016
HTA Aloha Aina Program Awards (2010 - 2016)
Figure 67. HTA Aloha Aina Program Awards (2010-2016). Source: Hawaii Tourism Authority
PAGE 138
Conclusion
The State of Hawaii published the Hawaii 2050 Sustainability Plan in 2008, ten years later Hawaii
continues to work toward these same goals and issues. The State of Hawaii is fortunate to have an
established sustainability plan, however, Hawaii must focus more on this plan’s implementation,
especially when this plan’s priority actions to meet the “2020 benchmarks” are approaching.
Hawaii’s sustainability ethic strengthened over the last decade, but this ethic was externally driven
through climate change mitigation and adaptation reports and data, and recent international, national,
and local sustainability efforts. Many of the sustainability efforts and indicators were not implemented
by government in a coordinated manner.
Hawaii lacked a permanent governmental sustainability coordinating entity over the past ten years to
assist with the implementation of the Hawaii 2050 Sustainability Plan and its sustainability goals.
To improve the implementation and update of this plan, a stronger legislative framework about
sustainability, the permanent establishment of a governmental sustainability coordinating entity with
recognized responsibilities and authorities, and budgetary funding are necessary.
The Hawaii 2050 Sustainability Plan is outdated with some unmeasurable indicators. Funding will be
necessary to perform a ten year update of this large plan pursuant to Act 8, Special Session Laws of
2005, with current scientific data, best management practices, and modern indicators to measure the
sustainability of Hawaii, its economy, society, and natural resources. Future sustainability coordination
should include but are not limited to: assessments of Hawaii’s infrastructure, water security planning
and strategies, sustainable land use recommendations, and local food security planning and strategies.
These areas must be examined to prepare for a sustainable Hawaii by 2050.
PAGE 139
Recommended Actions
1. Develop a Governmental Sustainability Entity
If creating a sustainability ethic within Hawaii’s government is indeed a priority, then the permanent
establishment of a government sustainability coordinating entity is necessary to help implement sustainable
practices within government.
A Hawaii State Sustainability Office or Program should be created with additional staffing and a budget.
The Hawaii State Sustainability Coordinator (or similar position) will need to be provided certain
responsibilities and authorities to execute and ensure sustainability planning and implementation statewide.
The following legislation, staffing, and funding is recommended:
Stronger Sustainability Legislative Framework
A sustainability framework that both defines and establishes more in-depth goals to achieve sustainability
within state operations beyond Hawaii’s Sustainability Priority Guidelines for the Hawaii State Plan will
strengthen the implementation of sustainable practices for the State of Hawaii.
Statewide Sustainability Coordination
Additional staffing is necessary to ensure successful sustainability coordination and implementation
statewide.
Interagency Sustainability Planning and Coordination
An interagency sustainability network can to serve as an informal forum of state agency personnel to
exchange information and develop new approaches on sustainability among state agencies. This network
could meet every two months to ensure that state agencies collaborate on sustainability programs and
projects, and develop agency sustainability plans.
Dedicated Funding
Although the State of Hawaii presently has a state Sustainability Coordinator to assist the State in
achieving its sustainability goals, no budget was provided to the Sustainability Coordinator for
implementation purposes.
PAGE 140
2. Update the Hawaii 2050 Sustainability Plan
Act 8, Special Session Laws of 2005 requires that the State Auditor with the assistance of the Office of Planning
to update Hawaii 2050 Sustainability Plan every ten years. Since the Hawaii 2050 Sustainability Plan was
published in 2008, the next update should take place in 2018. As noted in this report, many of the indicators
are not current and need modernization.
Furthermore, the Hawaii 2050 Sustainability Plan should emphasize the need to focus more on Hawaii’s water
sustainability, as well as the sustainability of Hawaii’s existing infrastructure as the State faces future climate
change. Improved metrics and updated best practices should be incorporated into an updated Hawaii 2050
Sustainability Plan. Many new and updated best practices to improve various aspects of sustainability were
published over the past decade that can assist with the update of the Hawaii 2050 Sustainability Plan,
especially those from the American Planning Association, the Institute for Local Government, the US Green
Building Council, and many other distinguished organizations. Funding, however, is necessary to perform an
effective and comprehensive update to the Hawaii 2050 Sustainability Plan for the next ten years.
3. Update the Hawaii State Functional Plans
The State of Hawaii’s Sustainability Plan should not replace the Hawaii State Plan. Since the Hawaii State Plan
has incorporated sustainability as one of its priority guidelines and principles through §226-108 of the Hawaii
Revised Statutes, sustainability, ideally, should now be practiced through the Hawaii State Plan as a guiding
principle.
The 2008 publication of the Hawaii 2050 Sustainability Plan highlighted the 2050 Plan’s intent to serve as a
replacement to the Hawaii State Plan, due to the Hawaii State Plan being outdated. The Hawaii State Plan
serves as the guiding plan and policy to direct and officiate the State of Hawaii; its functional plans need to be
updated to tackle more modern issues and challenges of the 21st century.
The Hawaii 2050 Sustainability Plan should serve as the guiding plan and framework to direct and achieve the
State of Hawaii’s sustainability goals; smaller department-level sustainability plans could be created for
improved interagency sustainability coordination.
4. Provide Regular Reporting
Although Act 8, Special Session Laws of 2005 requires an update of the Hawaii 2050 Sustainability Plan every
ten years, and the Hawaii 2050 Sustainability Plan called for the Sustainability Council to issue a report card
measuring progress. Many government entities perform regular annual reports to assess their progress.
The appropriate permanent government sustainability coordinating entity could begin annual reports on
Hawaii’s sustainability performance to better assist decision-makers with a consistently updated baseline and
concept of Hawaii’s progress toward sustainability.
PAGE 141
References
AARP Policy Institute. (2011). Aging in Place: A State Survey of Liveability Policies and Practices. Retrieved from: https://assets.aarp.org/rgcenter/ppi/liv-com/aging-in-place-2011-full.pdf.
Achieve and the Education Trust. (2008). Making college and Career Readiness the Mission for High Schools: A Guide for State
Act 4, Session Laws of Hawaii. (2013). Hawaii Revised Statutes §195-6. Retrieved from:
https://www.capitol.hawaii.gov/session2013/bills/HB941_.pdf. Act 5, Session Laws of Hawaii (2017). Hawaii Revised Statutes §174C-31. Retrieved from:
http://www.capitol.hawaii.gov/Archives/measure_indiv_Archives.aspx?billtype=HB&billnumber=1509&year=2017. Act 31, Session Laws of Hawaii. (2015). Hawaii Revised Statutes §226-7. Retrieved from:
https://www.capitol.hawaii.gov/session2015/bills/SB434_HD1_.pdf. Act 31, Session Laws of Hawaii. (2015). Hawaii Revised Statutes §711-1108. Retrieved from:
https://www.capitol.hawaii.gov/session2015/bills/SB434_HD1_.pdf. Act 32, Session Laws of Hawaii. (2017). Hawaii Revised Statutes §225P, Hawaii Climate Change Mitigation and Adaptation Initiative.
http://www.capitol.hawaii.gov/Archives/measure_indiv_Archives.aspx?billtype=SB&billnumber=559&year=2017. Act 47, Session Laws of Hawaii. (2016). Retrieved from: http://www.capitol.hawaii.gov/session2016/bills/SB3126_CD1_.pdf. Act 72, Session Laws of Hawaii. (2016). Appropriating the Kahoolawe Island Reserve. Retrieved from:
http://www.capitol.hawaii.gov/Archives/measure_indiv_Archives.aspx?billtype=HB&billnumber=1714&year=2014. Act 104, Session Laws of Hawaii (2014). Hawaii Revised Statutes §26-15. Retrieved from:
https://www.capitol.hawaii.gov/session2014/bills/HB1618_CD1_.pdf. Act 107, Session Laws of Hawaii. (2011). Hawaii Revised Statutes §321-4.7. Producers of hand-pounded poi; exemption. Retrieved
from: https://www.capitol.hawaii.gov/hrscurrent/Vol06_Ch0321-0344/HRS0321/HRS_0321-0004_0007.htm. Act 169, Session Laws of Hawaii. (2015). Hawaii Revised Statutes §10, Part III. Retrieved from:
https://www.capitol.hawaii.gov/hrscurrent/Vol01_Ch0001-0042F/HRS0010/HRS_0010-0041.htm Act 169, Session Laws of Hawaii. (2016). Water Audit. Retrieved from:
https://www.capitol.hawaii.gov/session2016/bills/SB2645_CD1_.pdf. Act 195, Session Laws of Hawaii. (2011). Hawaii Revised Statutes §10H. Native Hawaiian Recognition. Retrieved from:
https://www.capitol.hawaii.gov/hrscurrent/Vol01_Ch0001-0042F/HRS0010H/HRS_0010H-.htm. Act 210, Session Laws of Hawaii. (2010). Hawaii Revised Statutes §171-28. Government-owned Hawaiian fishponds; sale prohibition.
Retrieved from: https://www.capitol.hawaii.gov/hrscurrent/Vol03_Ch0121-0200D/HRS0171/HRS_0171-0028.htm Act 210, Session Laws of Hawaii. (2011). Hawaii Revised Statutes §206E, Part VIII. Heeia Community Development District. Retrieved
from: https://www.capitol.hawaii.gov/hrscurrent/Vol04_Ch0201-0257/HRS0206E/HRS_0206E-0201.htm. Act 224. Session Laws of Hawaii. (2008). Establishing the Hawaii Long Term Care Commission. Retrieved from:
https://www.capitol.hawaii.gov/session2008/bills/SB3255_CD1_.htm. Act 229, Session Laws of Hawaii. (2015). Water Reclamation. Retrieved from:
https://www.capitol.hawaii.gov/Archives/measure_indiv_Archives.aspx?billtype=HB&billnumber=1394&year=2015. Act 230, Session Laws of Hawaii. (2015). Hawaii Revised Statutes §342D-6.5. Hawaiian Loko iʻa. Retrieved from:
Act 248, Session Laws of Hawaii. (2016). Hawaii Revised Statutes §342D-50.5. Retrieved from: http://www.capitol.hawaii.gov/Archives/measure_indiv_Archives.aspx?billtype=HB&billnumber=2030&year=2016.
Ahahui Kaahumanu. (2017). Retrieved from: http://www.kaahumanu.org/. Aha Hipuu. (2017). Background of the Aha Hipuu. Retrieved from: http://www.ahahipuu.org/about/. American Healthcare Association. (2010). LTC stats: Nursing facility operational characteristics report: September 2010 Update.
Washington, DC: American Health Care Association. Retrieved from: http://www.ahcancal.org/research_data/oscar_data/Nursing%20Facility%20Operational%20Characteris tics/OperationalCharacteristicsReport_Sep2010.pdf.
American Healthcare Association. (2013). Trends and Statistics. Retrieved from:
http://www.ahcancal.org/research_data/trends_statistics/Pages/default.aspx. American Planning Association. (2017). PAS Report: Planners and Water. Retrieved from:
https://www.planning.org/publications/report/9131532/. Bassionuini, M. and Oki DS. (2013). Trends and shifts in streamflow in Hawaii, 1913-2008. Hydrological Processes, 27, 1484-1500. BBC News. (October 2017). The Chinese Blockage in the Global Waste Disposal System. Retrieved from:
http://www.bbc.com/news/business-41582924. Brown, K. 1973. “Malama” before the seminar titled “The Spectrum of Influences Affecting Quality Growth”. Retrieved from:
http://archive.hokulea.com/index/founder_and_teachers/kenny_brown.html. Cesar, H and van Beukering, P. (2004). Economic Valuation of the Coral Reefs of Hawaii. Retrieved from:
https://scholarspace.manoa.hawaii.edu/bitstream/10125/2723/1/vol58n2-231-242.pdf. City and County of Honolulu, Board of Water Supply. (2016). Water Master Plan. Retrieved from:
https://www.boardofwatersupply.com/bws/media/files/water-master-plan-final-2016-10.pdf. City and County of Honolulu, Board of Water Supply. (2017). Board of Water Supply to Test Online WaterSmart Program. Retrieved
City and County of Honolulu, City Council. (2017). Bill 59 (2016), FD1, CD3. Retrieved from:
http://www4.honolulu.gov/docushare/dsweb/Get/Document-195377/BILL059(16)%2c%20FD1%2c%20CD3.pdf City and County of Honolulu, Department of Environmental Services. (2017). Recycling and Landfill Diversion Rates. Retrieved from:
http://www.opala.org/solid_waste/archive/facts2.html. City and County of Honolulu, Department of Environmental Services. (2017) 3-Cart Refuse/ Recycling Collection. Retrieved from:
http://www.opala.org/solid_waste/curbside.htm City and County of Honolulu, Department of Planning and Permitting. (2004). Primary Urban Center Development Plan. Retrieved
from:http:/www.honoluludpp.org/Portals/0/pdfs/planning/PUC/PrimaryUrbanCenterDP.pdf. City and County of Honolulu, Department of Planning and Permitting. (2011). Honolulu General Plan Update. Sustainability Trend
Report. Prepared by Herbert Hastart & Fee. Retrieved from: http://www.honoluludpp.org/Portals/0/pdfs/planning/generalplan/GPUpdate/TrendReports/Sustainability.pdf.
City and County of Honolulu, Department of Planning and Permitting. (2011). North Shore Sustainable Communities Plan. Retrieved
from: http://www.honoluludpp.org/Portals/0/pdfs/planning/NorthShore/NSSCP_May_2011.pdf. City and County of Honolulu, Department of Planning and Permitting. (2012). Koolau Loa Sustainable Communities Plan. Retrieved
from: http://www.honoluludpp.org/Portals/0/pdfs/planning/Koolauloa/Kloa5Yr/Final/Final_KLSCP(Dec2012).pdf. City and County of Honolulu, Department of Planning and Permitting. (2012). Waianae Sustainable Communities Plan. Retrieved from:
City and County of Honolulu, Department of Planning and Permitting. (2013). Ewa Development Plan. Retrieved from: http://www.honoluludpp.org/Portals/0/pdfs/planning/ewa/ewa5yr/Ewa_DP_2013_securedcopy.pdf.
City and County of Honolulu, Department of Planning and Permitting. (2016). Central Oahu Communities Plan. Retrieved from:
http://www.honoluludpp.org/Portals/0/pdfs/planning/CentralOahu/2016%20COSCP%20Proposed%20Clean.pdf. City and County of Honolulu, Department of Planning and Permitting. (2017). Koolau Poko Sustainable Communities Plan. Retrieved
from: http://www.honoluludpp.org/Portals/0/pdfs/planning/Koolaupoko/2017-08.KPSCP.pdf. City and County of Honolulu, Department of Planning and Permitting. (2017). East Honolulu Sustainable Communities Plan Website.
Retrieved from: http://www.honoluludpp.org/Planning/DevelopmentSustainableCommunitiesPlans/EastHonoluluPlan.aspx. City and County of Honolulu, Department of Planning and Permitting, TOD Honolulu. Retrieved from: https://www.honolulu.gov/tod. City and County of Honolulu, Department of Transportation Services, Honolulu Complete Streets. (2017). What are Complete Streets?
Retrieved from: http://www.honolulu.gov/completestreets. City and County of Honolulu, Office of the City Auditor. (2017). Audit of the City’s Recycling Program.
https://www.honolulu.gov/rep/site/oca/oca_docs/City_Recycling_Program_Final_Report_rev._102717.pdf. CNN Money. (Sept 2017). China to US: Please Stop Sending Us Your Junk. Retrieved from:
http://money.cnn.com/2017/09/11/news/china-scrap-ban-us-recycling/index.html. County of Hawaii Department of Environmental Management, Solid Waste Division-Recycling Section. County of Hawaii, Department of Environmental Management, Solid Waste Division- Recycling Section. (2014). Plastic Bag Reduction
County of Hawaii, Department of Environmental Management. (2017). Solid Waste and Recycling Division. Retrieved from:
http://www.hawaiizerowaste.org/. County of Hawaii, Planning Department. (2010). Envision Downtown Hilo 2025. Retrieved from: http://www.hawaiicounty.gov/pl-
edh2025. County of Hawaii, Planning Department. (2011). Puna Community Development Plan. Retrieved from:
http://www.hawaiicountycdp.info/puna-cdp/draft-plan-recommendations. County of Hawaii, Planning Department. (2017). Kau Community Development Plan. Retrieved from:
http://www.hawaiicountycdp.info/kau-cdp. County of Hawaii, Planning Department. Hamakua Community Development Plan. Retrieved from:
http://www.hawaiicountycdp.info/hamakua-cdp. County of Hawaii, Planning Department. Kona Community Development Plan. Retrieved from:
http://www.hawaiicountycdp.info/north-and-south-kona-cdp. County of Hawaii, Planning Department. North Kohala Community Development Plan. Retrieved from:
http://www.hawaiicountycdp.info/north-kohala-cdp. County of Hawaii, Planning Department. South Kohala Community Development Plan. Retrieved from:
http://www.hawaiicountycdp.info/south-kohala-cdp. County of Hawaii, Department of Water Supply. County of Kauai, Department of Public Works, Solid Waste Recycling Program. County of Kauai, Department of Public Works, Solid Waste Recycling Program. (2015). Plastic Bag Reduction Ordinance. Retrieved
from: http://www.kauai.gov/BagOrdinance.
PAGE 144
County of Kauai, Department of Public Works. (May 2016). FEA-FONSI for the Environmental Assessment of Materials Recycling Facility for County of Kauai to the State Office of Environmental Quality and Control. Retrieved from: http://oeqc.doh.hawaii.gov/Shared%20Documents/EA_and_EIS_Online_Library/Kauai/2010s/2016-06-08-KA-5B-FEA-Materials-Recycling-Facility.pdf.
County of Kauai, Department of Water. County of Kauai, Planning Department. (2015). Important Agricultural Lands Study. Retrieved from:
https://sites.google.com/site/kauaiial/. County of Kauai, Planning Department. (2015). Lihue Community Plan. Retrieved from:
County of Kauai, Planning Department. (2017). Kauai County Draft General Plan. Retrieved from: http://plankauai.com/. County of Kauai, Planning Department. East Kauai Development Plan. Retrieved
County of Maui, Department of Water Supply. County of Maui, Environmental Management, Environmental Protection & Sustainability Services. County of Maui, Environmental Management, Environmental Protection & Sustainability Services. (2010). Plastic Bag Reduction –
B.Y.O. Bag. Retrieved from: https://www.mauicounty.gov/1688/Plastic-Bag-Reduction---BYOBag. County of Maui, Environmental Management. (2017). Curbside Collection - The 3 Can Plan. Retrieved from:
https://www.mauicounty.gov/1869/Curbside-Collection---The-3-Can-Plan. County of Maui, Planning Department. (1994). Hana Community Plan. Retrieved from:
https://www.mauicounty.gov/DocumentCenter/Home/View/1710. County of Maui, Planning Department. (1995). Paia-Haiku Community Plan. Retrieved from:
https://www.mauicounty.gov/DocumentCenter/Home/View/1717. County of Maui, Planning Department. (1996). Makawao-Pukalani-Kula Community Plan. Retrieved from:
https://www.mauicounty.gov/DocumentCenter/Home/View/1714. County of Maui, Planning Department. (1996). West Maui Community Plan. Retrieved from:
https://www.mauicounty.gov/DocumentCenter/Home/View/1720. County of Maui, Planning Department. (1998). Kihei-Makena Community Plan. Retrieved from:
https://www.mauicounty.gov/DocumentCenter/Home/View/1712. County of Maui, Planning Department. (2002). Wailuku-Kahului Community Plan. Retrieved from:
https://www.mauicounty.gov/DocumentCenter/Home/View/1717. County of Maui, Planning Department. (2010). Countywide Policy Plan. Retrieved from:
https://www.mauicounty.gov/420/Countywide-Policy-Plan. County of Maui, Planning Department. (2012). Maui Island Plan. Retrieved from: https://www.mauicounty.gov/1503/Maui-Island-
Plan. County of Maui, Planning Department. (2016). Lanai Community Plan. Retrieved from: https://hi-
County of Maui, Planning Department. (2016). Molokai Community Plan. Retrieved from: https://www.mauicounty.gov/DocumentCenter/View/103666.
Energy-Efficiency Portfolio Standards Act. (2009). Hawaii Revised Statutes §269-96. Glasmier, Amy, PhD and the Massachusetts Institute of Technology. (2016). Living wage Calculator: New Data: Calculating the Living
Wage for US States, Counties and Metro Areas. Retrieved from: http://livingwage.mit.edu/articles/19-new-data-calculating-the-living-wage-for-u-s-states-counties-and-metro-areas.
Glasmier, Amy, PhD, and Carey Anne Nadeau, Opendata.com and the Massachusetts Institute of Technology. (13 April 2017). Results
from the 2016 Data Update. Retrieved from: http://livingwage.mit.edu/articles/23-results-from-the-2016-data-update. Glass Container Recovery Act. (1994). Hawaii Revised Statutes §342G-Part VII. Retrieved from:
https://www.capitol.hawaii.gov/hrscurrent/Vol06_Ch0321-0344/HRS0342G/HRS_0342G-0081.htm. Godschalk, David and William Anderson. (2012). Sustaining Places: The Role of the Comprehensive Plan (PAS Report 567). Chicago:
American Planning Association. Retrieved from: https://www.planning.org/publications/report/9026891/. Godschalk, David and David Rouse. (2015). Sustaining Places: Best Practices for Comprehensive Plans (PAS Report 578). Chicago:
https://www.capitol.hawaii.gov/session2016/bills/HCR137_SD1_.PDF. Hawaii 2050 Sustainability Task Force. (2007). Hawaii 2050 Issue Book: Building A Shared Future. Retrieved from:
http://hipaonline.com/images/uploads/HI2050_Issue_Book.pdf. Hawaii 2050 Sustainability Task Force. (2008). Hawaii 2050 Sustainability Plan. Retrieved from: http://www.oahumpo.org/wp-
content/uploads/2013/02/Hawaii2050_Plan_FINAL.pdf. Hawaii Appleseed Center for Law and Economic Justice. (2016). The State of Poverty in Hawaii. Retrieved from:
http://hiappleseed.org/sites/default/files/State%20of%20Poverty%20%5BFINAL%5D.pdf. Hawaii Association on Watershed Partnerships. (2017). Watershed Partnerships. Retrieved from: http://hawp.org/partnerships/. Hawaii Clean Energy Initiative Program Act. (2010). Hawaii Revised Statutes §196-10.5. Hawaiʻi Climate Change Mitigation and Adaptation Commission. (2017). Hawaiʻi Sea Level Rise Vulnerability and Adaptation Report.
Prepared by Tetra Tech, Inc. and the State of Hawaiʻi Department of Land and Natural Resources, Office of Conservation and Coastal Lands, under the State of Hawaiʻi Department of Land and Natural Resources Contract No: 64064. Retrieved from: https://climateadaptation.hawaii.gov/wp-content/uploads/2017/12/SLR-Report_Dec2017.pdf.
Hawaii Community Foundation. (2013). Caring for Our Kupuna Study. Retrieved from:
https://www.hawaiicommunityfoundation.org/file/pdfs/Caring-for-Our-Kupuna-Study.pdf. Hawaii Community Foundation, Hawaii Freshwater Initiative. (2016). A Blueprint for Action: Water Security for an Uncertain Future
(2016-2018). Retrieved from: https://www.hawaiicommunityfoundation.org/strengthening/fresh-water. Hawaii Long-Term Care Association. (undated). An Overview. Honolulu: Hawaii Long-Term Care Association. Hawaii Long Term Care Commission. (2011). An Overview of Long-Term Care in Hawaii, Final Report for the Hawaii Long Term Care
Hawaii P-20 Partnerships for Education. (2017). College and Career Readiness Indicators Reports. Retrieved from:
http://www.p20hawaii.org/resources/college-and-career-readiness-indicators-reports/. Hawaii Renewable Portfolio Standards Act. (2001). Hawaii Revised Statutes §269-92 (L 2001, c 272, §3; am L 2004, c 95, §5; am L
2006, c 162, §5; am L 2009, c 155, §3; am L 2015, c 97, §2). Hawaii Revised Statutes §103D-1005. (1994). Recycled Products. (L 1994, c 186, pt of §1; am L 1997, c 352, §23). Retrieved from:
Hawaii Revised Statutes §107-24. Retrieved from: http://capitol.hawaii.gov/measure_indiv.aspx?billtype=HB&billnumber=637&year=2017.
Hawaii Revised Statutes §174C-31. Hawaii Water Plan. Retrieved from:
https://www.capitol.hawaii.gov/session2016/bills/HB1749_CD1_.pdf. Hawaii Revised Statutes §193, Part IV. Hawaii Youth Conservation Corps. Retrieved from:
https://www.capitol.hawaii.gov/hrscurrent/Vol03_Ch0121-0200D/HRS0193/HRS_0193-0031.htm. Hawaii Revised Statutes §196-9. Energy Efficiencies and Environmental Standards for State Facilities, Motor Vehicles, and
Hawaii Revised Statutes §201-3 (5). Retrieved from: https://www.capitol.hawaii.gov/hrscurrent/Vol04_Ch0201-
0257/HRS0201/HRS_0201-0003.htm. Hawaii Revised Statutes §201-19. Research and Statistics for Growth Industries. Retrieved from:
https://www.capitol.hawaii.gov/hrscurrent/Vol04_Ch0201-0257/HRS0201/HRS_0201-0019.htm Hawaii Revised Statutes §205-18. Periodic Review of Land Use Districts. Retrieved from:
https://www.capitol.hawaii.gov/hrscurrent/Vol04_Ch0201-0257/HRS0205/HRS_0205-0018.htm. Hawaii Revised Statutes Chapter 205, Part III. Important Agricultural Lands Law. Hawaii Revised Statutes §225P-3. (L 2014, c 83, pt of §2; am L 2017, c 32, §5). Hawaii Revised Statutes §226-108. (2011). Sustainability Priority Guidelines and Principles. Retrieved from:
http://www.capitol.hawaii.gov/hrscurrent/Vol04_Ch0201-0257/HRS0226/HRS_0226-0109.htm. Hawaii Revised Statutes Chapter 342B-Part VI. Hawaii Revised Statutes §342G-2. (1991). Solid Waste Management Priorities. Retrieved from:
https://www.capitol.hawaii.gov/hrscurrent/Vol06_Ch0321-0344/HRS0342G/HRS_0342G-0002.htm. Hawaii Revised Statutes §342G-3. (1991). Goals. Retrieved from: https://www.capitol.hawaii.gov/hrscurrent/Vol06_Ch0321-
0344/HRS0342G/HRS_0342G-0003.htm. Hawaii Revised Statutes §342G-41. (1991).Goals for Recycled Product Procurement. Retrieved from:
https://www.capitol.hawaii.gov/hrscurrent/Vol06_Ch0321-0344/HRS0342G/HRS_0342G-0041.htm. Hawaii Revised Statutes §342G-43. (1991). Reporting. Retrieved from: https://www.capitol.hawaii.gov/hrscurrent/Vol06_Ch0321-
0344/HRS0342G/HRS_0342G-0043.htm. Hawaii Revised Statutes §342G-45. (1991). Establishment of an Office Paper and Other Materials Recycling Program. Retrieved from:
https://www.capitol.hawaii.gov/hrscurrent/Vol06_Ch0321-0344/HRS0342G/HRS_0342G-0043.htm. Hawaii Revised Statutes §349-31. (2012). Aging and Disability Resource Centers Program. Retrieved from:
https://www.capitol.hawaii.gov/hrscurrent/Vol07_Ch0346-0398/HRS0349/HRS_0349-0031.htm Hawaii State Senate. (2017). Senate Resolution 74. Retrieved from:http://www.capitol.hawaii.gov/session2017/bills/SR74_SD1_.pdf. Hawaii Sustainable Schools Initiative, Act 176, Session Laws of Hawaii 2016. (2016). Hawaii Revised Statutes §302A-1510. Retrieved
from: https://www.capitol.hawaii.gov/hrscurrent/Vol05_Ch0261-0319/HRS0302A/HRS_0302A-1510.htm. Hoa ʻĀina O Mākaha. (2017). Na Keiki O Ka ʻĀina Program. Retrieved from:http://www.hoaainaomakaha.org/programs-3/na-keiki-o-
https://sites.google.com/a/kaneohe.k12.hi.us/internet/. Kaohao School. (2017). Zero Waste Revolution Website. Retrieved from: http://kaohaoschool.org/zero-waste-revolution/. Kokua Hawaii Foundation. (2017). 2016-2017 Year End Report. Retrieved from: https://kokuahawaiifoundation.org. Kokua Hawaii Foundation. (2017). 3R’s School Recycling Program. Retrieved from: https://www.kokuahawaiifoundation.org/3rs. Kokua Hawaii Foundation. (2017). Aina in Schools. Retrieved from: https://www.kokuahawaiifoundation.org/aina. Kokua Hawaii Foundation. (2017). Plastic Free Hawaii. Retrieved from: https://www.kokuahawaiifoundation.org/pfh. Konrad, C.P. 2003. “Effects of Urban Development on Floods.” USGS Fact Sheet 076-03. Retrieved from:
https://pubs.usgs.gov/fs/fs07603. Legislature grants $1.2M for school kitchen facility. (2015, May 8), West Hawaii Today. Retrieved from:
http://westhawaiitoday.com/news/local-news/legislature-grants-12m-school-kitchen-facility. Malaai. (2016). Malaai Annual Report. Retrieved from:http://malaai.org/wp-content/uploads/Malaai-Annual-Report-2015-2016.pdf. Mantilla, N. 2011. American University Intellectual Property Brief, The New Hawaiian Model: The Native Hawaiian Cultural Trademark
Movement and the Quest for Intellectual Property Rights to Protect and Preserve Native Hawaiian Culture. Retrieved from: http://digitalcommons.wcl.american.edu/cgi/viewcontent.cgi?article=1038&context=ipbrief.
Marek, K. D., Popejoy, L., Petroski, G., Mehr, D., Rantz, M., & Lin, W.-C. "Clinical Outcomes of Aging in Place." Nursing Research 54.3
(2005): 202-11. Marek, K D., F Stetzer, S J. Adams, L L. Popejoy, and M Rantz. "Aging in place versus nursing home care: comparison of costs to
Medicare and Medicaid." Research in Gerontological Nursing 5.2 (2012): 123-29. Mele.com. 2017. Worldwide Halau Hula (Hula Schools). http://www.mele.com/resources/hula.html. Miller, L., U.S. Geological Survey. (2013). Presentation to the Hawaii Water Works Association Conference. “Water Use in Hawaii”.
Retrieved from: https://hi.water.usgs.gov/presentations/HWWA_20131023_WaterUse.pdf. Na Lei Naauao, Native Hawaiian Charter School Alliance. (2017). Retrieved
from:http://www.kalo.org/apps/pages/index.jsp?uREC_ID=209524&type=d&pREC_ID=465138. National Low Income Housing Coalition. (2017). 2017 Annual Report: Out of Reach 2017: The High Cost of Living. Retrieved from:
http://nlihc.org/sites/default/files/oor/OOR_2017.pdf. National Oceanic and Atmospheric Association. (2007). Ocean and Coastal Resource Management, Managed Retreat Strategies.
Retrieved from: https://web.archive.org/web/20150905055350/http://coastalmanagement.noaa.gov/initiatives/shoreline_ppr_retreat.html, or http://www.adaptationclearinghouse.org/resources/managed-retreat-strategies.html.
National Oceanic and Atmospheric Association. (2015). Coral Reef Watch. NOAA Declares Third Ever Global Coral Bleaching Event.
National Oceanic and Atmospheric Administration. (2016). Sea Level Rise Trends, Mean Sea Level Trends of Hilo, Hawaii (1900-2020). Retrieved from: https://tidesandcurrents.noaa.gov/sltrends/sltrends_station.shtml?stnid=1617760.
National Oceanic and Atmospheric Administration. (2016). Sea Level Rise Trends, Mean Sea Level Trends of Honolulu, Oahu (1900-
2020). Retrieved from: https://tidesandcurrents.noaa.gov/sltrends/sltrends_station.shtml?stnid=1612340. National Oceanic and Atmospheric Administration. (2016). Sea Level Rise Trends, Mean Sea Level Trends of Kahului, Maui (1900-
2020). Retrieved from: https://tidesandcurrents.noaa.gov/sltrends/sltrends_station.shtml?stnid=1615680. National Oceanic and Atmospheric Administration. (2016). Sea Level Rise Trends, Mean Sea Level Trends of Nawiliwili, Kauai (1900-
2020). Retrieved from: https://tidesandcurrents.noaa.gov/sltrends/sltrends_station.shtml?stnid=1611400. National Restaurant Association. (2017). ProStart Culinary Curriculum. Retrieved from: http://www.goprostart.com/. National Student Clearinghouse. (2017). Retrieved from: http://www.studentclearinghouse.org/. Niu Valley Middle School. (2017). Sustainability. Retrieved from: http://www.niuvalleymiddle.org/sustainability/. Oki DS. (2004). Trends in streamflow characteristics at long-term gaging stations, Hawaii. Scientific Investigations Report 2004-5080,
US Geological Survey. Oki, D.S., Rosa, S.N., and Yeung C.W., (2010). Flood-frequency estimates for streams on Kauai, Oahu, Molokai, Maui, and Hawaii, State
of Hawaii: U.S. Geological Survey Scientific Investigations Report 2010-5035. Retrieved from: http://pubs.usgs.gov/sir/2010/5035.
Pacific Cartography for the Hawaii Conservation Alliance. (2016). Marine Managed Acres in Hawaii State Waters Out to 3 NM. Map
compiled from the National Oceanic and Atmospheric Association Marine Protected Areas Center 2014 data and the Hawaii State GIS Program, 2015 data.
Pearl Ridge Elementary School. (2017). MS4 Water Pollution Prevention Program. Retrieved from: http://pearlrid.k12.hi.us/ (bottom
of the webpage). Polynesian Voyaging society. (2017). Malama Honua Worldwide Voyage Factsheet. Retrieved from:
https://drive.google.com/file/d/0BwB6gTJso7ZmekVOdFR3TGptWGs/view Royal Order of Kamehameha. (2017). Retrieved from: http://www.mamalahoa.org/kamehameha/royal-order-of-kamehameha-i/. S.C.R. 69, S.D.1, 27th Leg., Reg. Sess. (Haw. 2014). S.C.R. 97, S.D.1, 28th Leg., Reg. Sess. (Haw. 2015). Retrieved from: https://www.capitol.hawaii.gov/session2015/bills/SCR97_SD1_.pdf. Sustainability Priority Guidelines, Hawaii State Planning Act, Hawaii Revised Statutes §226-108 (2011).
https://www.capitol.hawaii.gov/hrscurrent/Vol04_Ch0201-0257/HRS0226/HRS_0226-0108.htm. State of Hawaii. (2017). Hawaii Clean Energy Initiative. Retrieved from: http://www.hawaiicleanenergyinitiative.org/about-the-hawaii-
clean-energy-initiative/. State of Hawaii. (2017 Feb). Transforming Power in Paradise: The Hawaii Clean Energy Initiative. Retrieved from:
http://www.hawaiicleanenergyinitiative.org/wp-content/uploads/2015/02/HCEI_FactSheet_Feb2017.pdf. State of Hawaii Administrative Rules. (2014). Hawaii Administrative Rules Chapter 11-60.1. Retrieved from:
http://health.hawaii.gov/cab/files/2014/07/Highlights-GHG-RulesFinal.pdf. State of Hawaii, Board of Education. (2015). Board of Education Policy 301-9. Retrieved from:
http://boe.hawaii.gov/policies/Board%20Policies/Sustainability.pdf. State of Hawaii, Board of Education. (2016). BOE Policy E-3 Nā Hopena Aʻo (HĀ). Retrieved from:
https://www.hawaiipublicschools.org/DOE%20Forms/HA-Article-July2016.pdf. State of Hawaii, Board of Education. (2017). Sustainability Policy. Retrieved
State of Hawaii, Commission on Water Resources Management. State of Hawaii, Commission on Water Resources Management. (2017). Hawaii Water Audit Validation Effort (WAVE). Retrieved from:
http://www.hawaiiwaterloss.org/. State of Hawaii Data Book. (2016). Retrieved from: http://dbedt.hawaii.gov/economic/databook/db2016/. State of Hawaii, Department of Agriculture. (2015). Statewide Agricultural Land Use Baseline, 2015. Prepared by: The University of
Hilo, Spatial Data Analysis & Visualization Research Lab. Retrieved from: Retrieved from: http://hdoa.hawaii.gov/wp-content/uploads/2016/02/StateAgLandUseBaseline2015.pdf.
State of Hawaii, Department of Business Economic Development and Tourism; Energy, Resources, and Technology Division, and
Department of Health, Clean Air Branch. (1997). Inventory of Hawaii Greenhouse Gas Emissions Estimates for 1990. State of Hawaii, Department of Business Economic Development and Tourism, Energy Resources and Technology Division. (2000).
Hawaii Energy Strategy 2000. Retrieved from: http://www.hawaiicleanenergyinitiative.org/storage/hes2000.pdf. State of Hawaii, Department of Business Economic Development and Tourism, Information Services. (2008). Frequently Asked
Questions Webpage. Retrieved from: http://dbedt.hawaii.gov/economic/library/faq/faq08/. State of Hawaii, Department of Business Economic Development and Tourism. (2008). Measuring Economic Diversification in Hawaii.
State of Hawaii, Department of Business Economic Development and Tourism, Greenhouse Gas Emissions Reduction Task Force.
(2009). Report to the 2010 Legislature: Work Plan for Greenhouse Gas Emissions Reductions. Retrieved from: http://files.hawaii.gov/dbedt/annuals/2015/2015-greenhouse-gas-program.pdf.
State of Hawaii, Department of Business Economic Development and Tourism. (2009). Report to the 2009 Legislature: Efforts to
Support Emerging Growth Industries. Retrieved from: http://files.hawaii.gov/dbedt/annuals/2009/PerformReport09Final.pdf. State of Hawaii, Department of Business Economic Development and Tourism. (2011). Measuring Economic Diversification in Hawaii.
Retrieved from: http://files.hawaii.gov/dbedt/economic/data_reports/reports-studies/2011-12-diversification.pdf State of Hawaii, Department of Business Economic Development and Tourism. (2015). Commuting Patterns in Hawaii. Retrieved from:
http://files.hawaii.gov/dbedt/economic/data_reports/briefs/Commuting_Patterns_Apr2015.pdf. State of Hawaii, Department of Business Economic Development and Tourism. (2009). Self-Sufficiency Income Standard Estimates for
Hawaii 2007. Retrieved from: http://files.hawaii.gov/dbedt/economic/reports/self-sufficiency/self-sufficiency_2007.pdf. State of Hawaii, Department of Business Economic Development and Tourism. (2011). Self-Sufficiency Income Standard Estimates for
Hawaii 2009. Retrieved from: http://files.hawaii.gov/dbedt/economic/reports/self-sufficiency/self-sufficiency_2009.pdf. State of Hawaii, Department of Business Economic Development and Tourism. (2012). Self-Sufficiency Income Standard Estimates for
Hawaii 2012. Retrieved from: http://files.hawaii.gov/dbedt/economic/reports/self-sufficiency/self-sufficiency_2011.pdf. State of Hawaii, Department of Business Economic Development and Tourism. (2014). Self-Sufficiency Income Standard Estimates for
Hawaii 2013. Retrieved from: http://files.hawaii.gov/dbedt/economic/reports/self-sufficiency/self-sufficiency_2013.pdf. State of Hawaii, Department of Business Economic Development and Tourism. (2015). Self-Sufficiency Income Standard Estimates for
Hawaii 2014. Retrieved from: http://files.hawaii.gov/dbedt/economic/reports/self-sufficiency/self-sufficiency_2014.pdf. State of Hawaii, Department of Business Economic Development and Tourism. (2017). Self-Sufficiency Income Standard Estimates for
Hawaii 2016. Retrieved from: http://files.hawaii.gov/dbedt/economic/reports/self-sufficiency/self-sufficiency_2016.pdf. State of Hawaii, Department of Business and Economic Development and Tourism. (2016). Hawaii Rankings and Comparisons.
http://dbedt.hawaii.gov/economic/ranks/. State of Hawaii, Department of Business Economic Development and Tourism. (2016). Hawaii’s Targeted and Emerging Industries:
State of Hawaii, Department of Business Economic Development and Tourism. (2017). Summary of Consumer Spending by County: 2014. Retrieved from: http://files.hawaii.gov/dbedt/economic/reports/CE_Comparison_Final.pdf.
State of Hawaii, Department of Business Economic Development and Tourism. (2017). Monthly Energy Trends. Retrieved from:
http://dbedt.hawaii.gov/economic/energy-trends-2/. State of Hawaii, Department of Business Economic Development and Tourism. (2017). Monthly Energy Data: Historical data from
January 2006 to December 2017. Retrieved from: http://files.hawaii.gov/dbedt/economic/data_reports/energy-trends/Monthly_Energy_Data.xlsx.
State of Hawaii, Department of Business Economic Development and Tourism, Hawaii Strategic Development Corporation. (2017). HI
Growth Initiative. Retrieved from: http://hsdc.hawaii.gov/hi-growth-initiative/. State of Hawaii, Department of Business Economic Development and Tourism, Hawaii State Energy Office. (2017). Hawaii Energy Facts
and Figures, May 2017. Retrieved from: https://energy.hawaii.gov/wp-content/uploads/2011/10/HSEOFactsFigures_May2017_2.pdf
State of Hawaii, Department of Education, Accountability Section, Assessment and Accountability Branch – Office of Strategy,
Innovation and Performance. State of Hawaii, Department of Education, Career and Technical Education. (undated). Hawaii Career Pathway System Handbook.
Retrieved from: http://www.hawaiipublicschools.org/DOE%20Forms/CTE/CTEhandbook.pdf. State of Hawaii, Department of Education. (2013). Community Kokua Makes Keoneula Elementary Garden, Learning Center, a Reality.
State of Hawaii, Department of Education. (2015). Financial Literacy Task Force Final Report. Retrieved from:
https://www.hawaiipublicschools.org/Reports/leg15_finlit.pdf. State of Hawaii, Department of Education. (2016). After School Programs for Public Middle and Intermediate Schools Final Report.
Retrieved from: http://www.hawaiipublicschools.org/Reports/LEG16_afterschool.pdf. State of Hawaii, Department of Education. (2016). Hawaii Department of Education Standards with Opportunities to Integrate
State of Hawaii, Department of Education. (2016). Report to the 2017 Legislature: Pursuant to Act 176 (2016). Retrieved from:
http://www.hawaiipublicschools.org/Reports/LEG16_Energy.pdf. State of Hawaii, Department of Education. (2017). After School Programs Website. Retrieved from:
http://www.hawaiipublicschools.org/BeyondTheClassroom/AfterSchoolPrograms/Pages/home.aspx. State of Hawaii, Department of Education. (2017). Career and Technical Education webpage. Retrieved from:
http://www.hawaiipublicschools.org/TeachingAndLearning/StudentLearning/C2C/Pages/CTE.aspx. State of Hawaii, Department of Education. (2017). Connect to Careers – C2C. Retrieved from:
http://www.hawaiipublicschools.org/TeachingAndLearning/StudentLearning/C2C/Pages/home.aspx. State of Hawaii, Department of Education. (2017). Every Student Succeeds Act. Retrieved from:
http://www.hawaiipublicschools.org/VisionForSuccess/AdvancingEducation/StriveHIPerformanceSystem/Pages/ESSA.aspx. State of Hawaii, Department of Education. (2017). Financial Literacy Website. Retrieved from:
http://www.hawaiipublicschools.org/TeachingAndLearning/StudentLearning/FinLit/Pages/default.aspx. State of Hawaii, Department of Education. (2017). Heat Abatement Program at Public Schools. Retrieved from:
http://www.hawaiipublicschools.org/ConnectWithUs/Organization/SchoolFacilities/Pages/Heat-Abatement.aspx. State of Hawaii, Department of Education. (2017). Ka Hei Program. Retrieved from:
State of Hawaii, Department of Education. (2017). Ka Hei Program Curriculum. Retrieved from: http://www.hawaiipublicschools.org/VisionForSuccess/SuccessStories/Partners/Pages/KaHeiCurriculum.aspx.
State of Hawaii, Department of Education. (2017). Kaiapuni Schools-Hawaiian language immersion listing. Retrieved from:
State of Hawaii, Department of Education. (2017). Nā Hopena Aʻo (HĀ) Website. Retrieved from:
http://www.hawaiipublicschools.org/TeachingAndLearning/StudentLearning/HawaiianEducation/Pages/HA.aspx. State of Hawaii, Department of Education and Board of Education. (2016). Strategic Plan 2017-2020. Retrieved from:
http://www.hawaiipublicschools.org/DOE%20Forms/Advancing%20Education/SP2017-20.pdf. State of Hawaii, Department of Health, Clean Air Branch. (2013). Highlights for State Greenhouse Gas (GHG) Rules. Retrieved from:
http://health.hawaii.gov/cab/files/2013/10/Highlights__post-comment-period.pdf. State of Hawaii, Department of Health, Clean Air Branch. (2017). 9th Annual Hawaii Clean Energy Day, GHG Rules & Statewide GHG
State of Hawaii Department of Health, Clean Water Branch, Polluted Runoff Control Program. (2015). Hawaii’s Nonpoint Source
Management Plan (2015-2020). Retrieved from: http://health.hawaii.gov/cwb/files/2013/05/2015-Hawaii-NPS-Management-Plan.pdf.
State of Hawaii, Department of Health, Clean Water Branch System. (2017). Retrieved from: https://eha-
cloud.doh.hawaii.gov/cwb/#!/home. State of Hawaii, Department of Health, Executive Office on Aging. (2016). 2017-2019 Hawaii State Plan on Aging. Retrieved from:
https://www.mediafire.com/file/y6cj61v3276tcbe/ExtensionPlan.pdf. State of Hawaii, Department of Health, Executive Office on Aging. (2016). Report to the 2017 State Legislature. Retrieved from:
http://health.hawaii.gov/opppd/files/2016/10/Act-138-EOA-Annual-Report-111416.pdf State of Hawaii, Department of Health, Healthy Hawaii Initiative. (2017). Community Design and Active Living. Retrieved from:
http://health.hawaii.gov/physical-activity-nutrition/home/community-design-active-living/. State of Hawaii, Department of Health, Office of Health Care Assurance. (2017). Assisted Living Facilities. Retrieved from:
https://health.hawaii.gov/ohca/files/2013/06/Assisted-Living-Facilities-11-2017.pdf. State of Hawaii, Department of Health, Office of Health Care Assurance. (2017). Combined ARCH expanded ARCH Vacancy Report- by
State of Hawaii, Department of Health, Office of Health Care Assurance. (2017). Community Care Foster Homes. Retrieved from:
https://health.hawaii.gov/ohca/files/2013/06/Community-Care-Foster-Family-Homes-11-2017.pdf. State of Hawaii, Department of Health, Office of Solid Waste Management. (2009). 2010 Annual Report to the Legislature. Retrieved
from: https://health.hawaii.gov/shwb/files/2013/06/2010_OSWM_Annual_Report.pdf. State of Hawaii, Department of Health, Office of Solid Waste Management. (2010). 2011 Annual Report to the Legislature. Retrieved
from: https://health.hawaii.gov/shwb/files/2013/06/2011_OSWM_Annual_Report.pdf. State of Hawaii, Department of Health, Office of Solid Waste Management. (2011). 2012 Annual Report to the Legislature. Retrieved
from: https://health.hawaii.gov/shwb/files/2013/06/2012_OSWM_Annual_Report.pdf. State of Hawaii, Department of Health, Office of Solid Waste Management. (2012). 2013 Annual Report to the Legislature. Retrieved
from: https://health.hawaii.gov/shwb/files/2013/06/2013_OSWM_Annual_Report.pdf. State of Hawaii, Department of Health, Office of Solid Waste Management. (2014). 2015 Annual Report to the Legislature. Retrieved
State of Hawaii, Department of Health, Office of Solid Waste Management. (2015). 2016 Annual Report to the Legislature. Retrieved from: https://health.hawaii.gov/shwb/files/2013/06/2016_OSWM_Annual_Report.pdf.
State of Hawaii, Department of Health, Wastewater Branch Recycled Water Program. State of Hawaii, Department of Health, Wastewater Branch, Recycled Water Program. (2016). Retrieved from:
http://health.hawaii.gov/wastewater/home/reuse/. State of Hawaii, Department of Labor and Industrial Relations, Research and Statistics. (2017). Job Count by Industry 2007-2016
reports. Retrieved from: https://www.hiwi.org/gsipub/index.asp?docid=421. State of Hawaii, Department of Land and Natural Resources. (2011). Hawaii’s Watershed Priority Areas. Retrieved from:
http://dlnr.hawaii.gov/rain/. State of Hawaii, Department of Land and Natural Resources. (2014). DLNR Accelerating Forest Protection to Secure Hawaii’s Water
Supply. Retrieved from: http://dlnr.hawaii.gov/blog/2014/02/14/nr14-025/. State of Hawaii, Department of Land and Natural Resources, Division of Forestry and Wildlife. (2016). Hawaii Forest Action Plan.
Retrieved from: https://dlnr.hawaii.gov/forestry/files/2013/09/Hawaii-Forest-Action-Plan-2016.pdf. State of Hawaii, Department of Land and Natural Resources, Division of Aquatic Resources. (2017). Coral Bleaching Recovery Plan:
Identifying Management Responses to Promote Coral Recovery in Hawaii. Retrieved from: https://dlnr.hawaii.gov/dar/files/2017/04/Coral_Bleaching_Recovery_Plan_final.pdf.
State of Hawaii, Department of Land and Natural Resources, Division of Forestry and Wildlife. (2017). About Watershed Partnership
Program. Retrieved from: http://dlnr.hawaii.gov/ecosystems/wpp/about/. State of Hawaii, Department of Transportation. (2017). Daniel K. Inouye International Airport Emergency Power Facility in Full
State of Hawaii, Department of Transportation. (2017). Feasibility Scalping on the Use of Water Scalping Technology at Honolulu International Airport, Kahului Airport, Kona International Airport at Keahole, and Hilo International Airport. Prepared by CH2M Hill, Inc. https://hidot.hawaii.gov/wp-content/uploads/2017/01/2017-ACT229-Water-Scalping-Report.pdf.
State of Hawaii, Hawaii Climate Change Mitigation and Adaptation Commission. (2017). Hawaii Climate Adaptation Portal, Impacts of
Sea Level Rise. Retrieved from: http://climateadaptation.hawaii.gov/impacts-of-sea-level-rise/. State of Hawaii, Hawaii Housing Finance and Development Corporation. (2006).Hawaii Housing Planning Study. Retrieved from:
State of Hawaii, Hawaii Housing Finance and Development Corporation. (2017). 2017 Income, Sales, and Rent Guidelines. Retrieved
from: http://dbedt.hawaii.gov/hhfdc/developers/copy2_of_copy_of_copy2_of_copy_of_income-sales-rent-guidelines/. State of Hawaii, Hawaii Housing Finance and Development Corporation. (2017). State Housing Functional Plan. Retrieved from:
https://dbedt.hawaii.gov/hhfdc/files/2017/03/Housing_2017.pdf. State of Hawaii, Hawaii Interagency Biosecurity Plan: 2017-2027. (2017). Retrieved
from:https://dlnr.hawaii.gov/hisc/files/2017/02/Hawaii-Interagency-Biosecurity-Plan.pdf. State of Hawaii, Hawaii Tourism Authority. Culture and Art Grant Award data 2010-2016. State of Hawaii, Hawaii Tourism Authority. (2016). 2015 HTA Resident Sentiment Study. Prepared by: QMark Research. Retrieved
from: http://www.hawaiitourismauthority.org/default/assets/File/reports/2015%20Resident%20Sentiment.pdf State of Hawaii, Hawaii Tourism Authority. (2016). Annual Report to the Hawaii State Legislature. Retrieved from:
State of Hawaii, Hawaii Tourism Authority. (2016). Five Year Strategic Action Plan. Retrieved from: http://www.hawaiitourismauthority.org/default/assets/File/HTA15001-Strategic%20Plan_web.pdf.
State of Hawaii, Hawaii Tourism Authority. (2017). 2018 Community Enrichment Program. Retrieved from:
http://www.hawaiitourismauthority.org/default/assets/File/Community%20Programs%202018.pdf. State of Hawaii, Hawaii Tourism Authority. (2017). 2018 CEP Awardees. Retrieved from:
http://www.hawaiitourismauthority.org/default/assets/File/Community%20Programs%202018.pdf. State of Hawaii, Office of Hawaiian Affairs. (2012). 2012 Office of Hawaiian Affairs Annual Report. Retrieved from:
https://19of32x2yl33s8o4xza0gf14-wpengine.netdna-ssl.com/wp-content/uploads/2015/01/OHA2012AR.pdf. State of Hawaii, Office of Hawaiian Affairs. (2013). 2013 Office of Hawaiian Affairs Annual Report. Retrieved from:
https://19of32x2yl33s8o4xza0gf14-wpengine.netdna-ssl.com/wp-content/uploads/2015/01/OHA2013AR.pdf. State of Hawaii, Office of Hawaiian Affairs. (2014). 2014 Office of Hawaiian Affairs Annual Report. Retrieved from:
https://19of32x2yl33s8o4xza0gf14-wpengine.netdna-ssl.com/wp-content/uploads/2015/01/OHA2014AR.pdf. State of Hawaii, Office of Hawaiian Affairs. (2015). 2015 Office of Hawaiian Affairs Annual Report. Retrieved from:
https://19of32x2yl33s8o4xza0gf14-wpengine.netdna-ssl.com/wp-content/uploads/OHA2015AR.pdf. State of Hawaii, Office of Hawaiian Affairs. (2016). 2016 Office of Hawaiian Affairs Annual Report. Retrieved from:
https://19of32x2yl33s8o4xza0gf14-wpengine.netdna-ssl.com/wp-content/uploads/2016-OHA-Annual-Report_FINALweb.pdf. State of Hawaii, Office of Planning. (1996). Hawaii’s Coastal Nonpoint Pollutant Control Program. Retrieved from:
http://files.hawaii.gov/dbedt/op/czm/initiative/nonpoint/cnpcp_mgmt_plan.pdf. State of Hawaii, Office of Planning. (2012). Increased Food Security and Food Self-Sufficiency Strategy. Retrieved from:
http://files.hawaii.gov/dbedt/op/spb/INCREASED_FOOD_SECURITY_AND_FOOD_SELF_SUFFICIENCY_STRATEGY.pdf. State of Hawaii, Office of Planning. (2013). Hawaii Ocean Resources Management Plan. Retrieved from:
http://files.hawaii.gov/dbedt/op/czm/ormp/ormp_update_reports/final_ormp_2013.pdf. State of Hawaii, Office of Planning. (2017). Carbon Farming Task Force. Retrieved from: http://planning.hawaii.gov/carbon-farming-
task-force/. State of Hawaii, Office of the Auditor. (2017). Audit of Hawaii Department of Agriculture’s Plant Quarantine Branch (Report 17-05).
Retrieved from: http://files.hawaii.gov/auditor/Reports/2017/17-05.pdf. State of Hawaii, Office of the Auditor. (2017). Financial and Program Audit of the Deposit Beverage Container Program, June 30, 2016.
Retrieved from: http://files.hawaii.gov/auditor/Reports/2017/17-02.pdf. State of Hawaii, Office of the Auditor. (2017). Follow-Up on Recommendations from Report No. 14-16, Audit of the Department of
Health’s Glass Advance Disposal Fee Program. Retrieved from: http://files.hawaii.gov/auditor/Reports/2017/17-04.pdf. State of Hawaii, Office of the Lieutenant Governor. (2017). Farm to School Initiative. Retrieved from: http://ltgov.hawaii.gov/farm-to-
school-initiative/. State of Hawaii, Public Utilities Commission. (2014). State of Hawaii Energy Efficiency Potential Study. Retrieved from:
http://puc.hawaii.gov/wp-content/uploads/2013/04/State_of_HI_Potential_Study_Final.pdf. State of Hawaii, “Report to the 28th Legislature, 2015 Regular Session, Aloha+ Challenge: Recommendations for Taking Action and
Tracking Progress,” December 2014. State of Hawaii, Special Action Team on Affordable Housing. (2018). Ten Year Plan and Report to the 2018 State Legislature. Sullivan, Katherine, Administrator, National Oceanic and Atmospheric Agency. (2016). Remarks, American Planning Association
National Planning Conference, Phoenix. Sustainability Priority Guidelines, Hawaii State Planning Act, Hawaii Revised Statutes §226-108 (2011).
Sweet, W.V., R. Horton, R.E. Kopp, A.N. LeGrande, and A. Romanou, 2017: Sea level rise. In: Climate Science Special Report: Fourth National Climate Assessment, Volume I [Wuebbles, D.J., D.W. Fahey, K.A. Hibbard, D.J. Dokken, B.C. Stewart, and T.K. Maycock (eds.)]. U.S. Global Change Research Program, Washington, DC, USA, pp. 333-363, doi: 10.7930/J0VM49F2.
Texas A&M University, Transportation Institute Urban Mobility Information. (2017). Congestion Data for Honolulu (2007-2014).
Retrieved from: https://static.tti.tamu.edu/tti.tamu.edu/documents/ums/congestion-data/honolulu.pdf. U.S. Census. (2017). American Community Survey 2010-2015 5-year Estimate. U.S. Census. (2016). State Exports from Hawaii. (2013-2016). Retrieved from: https://www.census.gov/foreign-
trade/statistics/state/data/hi.html. U.S. Census. (2016). State Imports for Hawaii (2013-2016). Retrieved from: https://www.census.gov/foreign-
trade/statistics/state/data/imports/hi.html. U.S. Corporation for National and Community Service. (2015). State Rankings by Volunteer Rate. Retrieved from:
https://www.nationalservice.gov/vcla/state-rankings-volunteer-rate. U.S. Corporation for National and Community Service. (2017). National Service in Hawaii. Retrieved from:
https://www.nationalservice.gov/sites/default/files/upload/states/HI-StateGraphic.png. U.S. Department of Agriculture, National Agricultural Statistics Service, Hawaii Field Office. U.S. Department of Agriculture, National Agricultural Statistics Service, Hawaii Field Office. (2007). Hawaii Department of Agriculture
Annual Report Fiscal Year 2008 & Statistics of Hawaii Agriculture. Retrieved from: https://www.nass.usda.gov/Statistics_by_State/Hawaii/Publications/Annual_Statistical_Bulletin/2007/all2007.pdf.
U.S. Department of Agriculture, National Agricultural Statistics Service, Hawaii Field Office. (2008). Statistics of Hawaii Agriculture.
U.S. Department of Agriculture, National Agricultural Statistics Service, Hawaii Field Office. (2016). State Agricultural Overview:
Hawaii. Retrieved from: https://www.nass.usda.gov/Quick_Stats/Ag_Overview/stateOverview.php?state=HAWAII U.S. Department of Agriculture, National Agricultural Statistics Service, Hawaii Field Office. (2017). Hawaii 2016 Tropical Fruit and
Crops Valued at $7.5 Million. Retrieved from: https://www.nass.usda.gov/Statistics_by_State/Hawaii/Publications/Sugarcane_and_Specialty_Crops/Sugarcane/2017/201709tropicalspecialtiesHI.pdf.
U.S. Department of Agriculture, National Agricultural Statistics Service, Hawaii Field Office. (2017). Hawaii 2016 Vegetable Crop Value
Increases to $47.9 Million (2015-2016). Retrieved from: https://www.nass.usda.gov/Statistics_by_State/Hawaii/Publications/Vegetables/2017/201701vegrv.pdf.
PAGE 155
U.S. Department of Agriculture, National Agricultural Statistics Service, Hawaii Field Office. (2017). Hawaii Coffee Marketings: Preliminary Season Estimates (2014-2017). Retrieved from: https://www.nass.usda.gov/Statistics_by_State/Hawaii/Publications/Sugarcane_and_Specialty_Crops/Coffee/2017/201702coffee.pdf.
U.S. Department of Agriculture, National Agricultural Statistics Service, Hawaii Field Office. (2017). Hawaii Macadamia Nuts: Final Season Estimates (2012-2017). Retrieved from: https://www.nass.usda.gov/Statistics_by_State/Hawaii/Publications/Fruits_and_Nuts/072017MacNutFinal.pdf.
U.S. Department of Agriculture, National Agricultural Statistics Service, Hawaii Field Office. (2017). Quick Stats Searchable Database:
Hawaii 2007-2016. Retrieved from: https://quickstats.nass.usda.gov/. U.S. Department of Education, National Center for Education Statistics. (2016). 2008-2016 Digest of Education Statistics. Retrieved
from: https://nces.ed.gov/programs/digest/index.asp. U.S. Department of Energy, Office of Energy Efficiency & Renewable Energy. (2017). Achieving 70% Clean Energy by 2030 in Hawaii.
Retrieved from: https://energy.gov/eere/technology-to-market/achieving-70-clean-energy-2030-hawaii. U.S. Department of Health and Human Services, Substance Abuse and Mental Health Services Administration. (2016). National Survey
on Drug Use and Health: Comparison of 2008-2009 and 2014-2015 Population Percentages. Retrieved from: https://www.samhsa.gov/data/sites/default/files/NSDUHsaeLongTermCHG2015/NSDUHsaeLongTermCHG2015.htm.
U.S. Environmental Protection Agency. (2014). Hawaii Water Quality Assessment Report.
https://iaspub.epa.gov/waters10/attains_index.control?p_area=HI#STREAM/CREEK/RIVER U.S. Geological Survey. Pacific Islands Water Resource Science Center. U.S. Green Building Council. (2017). State Market Brief: Hawaii. Retrieved from: https://www.usgbc.org/advocacy/state-market-brief. U.S. Environmental Protection Agency. (2016). Sustainable Management of Food: About the 2016 Food Recovery Challenge Award
University of Hawaii at Manoa, Kawaihuelani Center for Hawaiian Language. University of Hawaii Economic Research Organization. (2012). Financing Watershed Conservation. Retrieved from:
http://www.uhero.hawaii.edu/news/view/185. University of Hawaii Economic Research Organization. (2014). Hawaii’s Environmental Response, Energy, and Food Security Tax Credit
(aka Barrel Tax). Retrieved from: http://www.uhero.hawaii.edu/news/view/269. University of Hawaii System, Institutional Research & Analysis Office. (2017). Degrees Table 7: Historical Table of STEM Degrees and
Certificates Earned by College, Fiscal Years (July 1 to June 30) 2008-09 to 2016-17. Retrieved from: https://www.hawaii.edu/institutionalresearch/degreeReport.action?FISCAL_YEAR=2017&IRO_INSTITUTION=&drillThruLevel=&agglevel=&reportId=DEH6&campusContext=&drillId=&VALUE=&exportType=&drillValue=&drillTarget=
The Association of Hawaiian Civic Clubs. (2017). Retrieved from: http://www.aohcc.org/index.php/en/. The Association of Hawaiian Civic Clubs. (2017). Resolution 2017-57: Urging the Hawaii State Legislature to Support the Intellectual
Property Rights and Traditional Cultural Expressions in our Fashion Industry to Promote Productivity, Competitiveness, and Economic Growth. http://www.aohcc.org/images/stories/2017/Resolutions/2017-AHCC-Resolutions-Nos-41---58.pdf.
The Annie C. Casey Foundation. Kids Count Data Center. (2017). Young Children Not in School. Retrieved from:
The Clift Tsuji Act, Act 163. (2017). Hawaii Revised Statutes §150A-53. Retrieved from:
http://www.capitol.hawaii.gov/session2017/bills/HB1325_CD1_.pdf. The Economic Research Organization of the University of Hawaii. (2016). The Evolution of the Hawaii Growth Initiative. Retrieved
The Economic Research Organization at the University of Hawaii. (2017). UHERO Report: A New Perspective on Hawaii’s Economy: Understanding the Role of Clusters. Retrieved from: http://www.uhero.hawaii.edu/assets/New_Perspective_Hawaii.pdf.
The Kohala Center. (2012). Growing School Learning Gardens: A Summary of the 2012 Statewide School Garden Survey. Retrieved
from: http://kohalacenter.org/schoolgardenhui/pdf/HFSSGH_Final_Summary_Report_2012.pdf. The Ocean Agency. (2015). The Third Global Coral Bleaching Event 2014/2017. Retrieved from: http://www.globalcoralbleaching.org/. The School for Examining Essential Questions of Sustainability. (2017). Retrieved from: http://www.seeqs.org/. The Sovereign Councils of Hawaiian Homesteads Assembly. (2017). Retrieved from: http://www.schha.info/. The World Bank. (April 2017). Brief: Solid Waste Management. Retrieved from:
http://www.worldbank.org/en/topic/urbandevelopment/brief/solid-waste-management. United Brotherhood of Carpenters and Joiners of America. (2017). Career Connections Curriculum. Retrieved
from:https://www.carpenters.org/citf-training/citf-training-programs/career-connections/. United Nations, Sustainable Development Goals. (Dec 2016). More than 5 per cent of world’s oceans now protected with more
Walk Score. (2017). Retrieved from: https://www.walkscore.com/. WaterSmart Software. (2017). About Us. Retrieved from: https://www.watersmart.com/. World Trade Organization. (July 2017). Catologue of Solid Wastes Forbidden to Import into China by the End of 2017. Retrieved from:
https://resource-recycling.com/resourcerecycling/wp-content/uploads/2017/07/CHN1211.pdf. Wuebbles, D.J., D.W. Fahey, K.A. Hibbard, B. DeAngelo, S. Doherty, K. Hayhoe, R. Horton, J.P. Kossin, P.C. Taylor, A.M. Waple, and C.P.
Weaver, 2017: Executive summary. In: Climate Science Special Report: Fourth National Climate Assessment, Volume I [Wuebbles, D.J., D.W. Fahey, K.A. Hibbard, D.J. Dokken, B.C. Stewart, and T.K. Maycock (eds.)]. U.S. Global Change Research Program, Washington, DC, USA, pp. 12-34, doi: 10.7930/J0DJ5CTG.