25
Shannon Okinaka - CFO HAWAIIAN HOLDINGS, INC. (HA) 1

Shannon Okinaka - CFO
HAWAIIAN HOLDINGS, INC. (HA)
1
This presentation contains “forward-looking statements” within the meaning of the Private Securities Litigation Reform Act
of 1995 that reflect the Company’s current views with respect to certain current and future events and financial
performance. Words such as “expects,” “anticipates,” “projects,” “intends,” “plans,” “believes,” “estimates,” variations of
such words, and similar expressions are also intended to identify such forward-looking statements. These forward-looking
statements are and will be, as the case may be, subject to many risks, uncertainties and assumptions relating to the
Company’s operations and business environment, all of which may cause the Company’s actual results to be materially
different from any future results, expressed or implied, in these forward-looking statements. These risks and uncertainties
include, without limitation, the Company’s ability to accurately forecast quarter and year-end results; economic volatility;
the price and availability of aircraft fuel; fluctuations in demand for transportation in the markets in which the Company
operates; the Company’s dependence on tourist travel; foreign currency exchange rate fluctuations; and the Company’s
ability to implement its growth strategy.
The risks, uncertainties and assumptions referred to above that could cause the Company’s results to differ materially from
the results expressed or implied by such forward-looking statements also include the risks, uncertainties and assumptions
discussed from time to time in the Company’s public filings and public announcements, including the Company’s Annual
Report on Form 10-K for the year ended December 31, 2015 and the Company’s Quarterly Reports on Form 10-Q, as well
as other documents that may be filed by the Company from time to time with the Securities and Exchange Commission. All
forward-looking statements included in this document are based on information available to the Company on the date
hereof. The Company does not undertake to publicly update or revise any forward-looking statements to reflect events or
circumstances that may arise after the date hereof even if experience or future changes make it clear that any projected
results expressed or implied herein will not be realized.
Forward-looking statements
2
3
• Successful travel carrier to and within Hawai‘i
– Unique business model• Neighbor Island shuttle service with 160 daily flights• Leisure carrier from North America to Hawai‘i serving 11 cities• Leisure carrier from International to Hawai‘i serving 7 countries
– Carried 10.7 million passengers in 2015– Our fleet of 48 aircraft are configured for the Hawai‘i mission– Industry leading service, safety and reliability
• Growing financial strength
– Profitable since 2007– Strong revenue growth with a diversified network– Strong financial performance– Strengthening balance sheet– Generating free cash flow
Hawai‘i’s Destination Carrier

MAUI
Seattle
Portland
New York/Kennedy
Sacramento
Oakland
Hilo
Kailua-Kona
Las Vegas
PhoenixLos Angeles
San Francisco
Kahului
MOLOKA‘I
NORTH AMERICA
Osaka/Kansai
Sapporo/Chitose
Beijing
Seoul/Incheon
Sydney
Brisbane
Auckland
Pago Pago
KAHO‘OLAWE
O‘AHU
KAUA‘I
Honolulu
Līhu‘e
Tokyo/Haneda
San Diego
SEASONAL SUMMER ROUTES
Kailua-Kona – OaklandLīhu‘e – OaklandKailua Kona – Los AngelesLīhu‘e – Los Angeles
Papeete
LĀNA‘I
San Jose
JAPAN
HAWAI‘I ISLAND
NI‘IHAU
SOUTHKOREACHINA
AUSTRALIA
NEWZEALAND
AMERICAN SAMOA TAHITI
Where we fly – Hawai‘i’s destination carrier
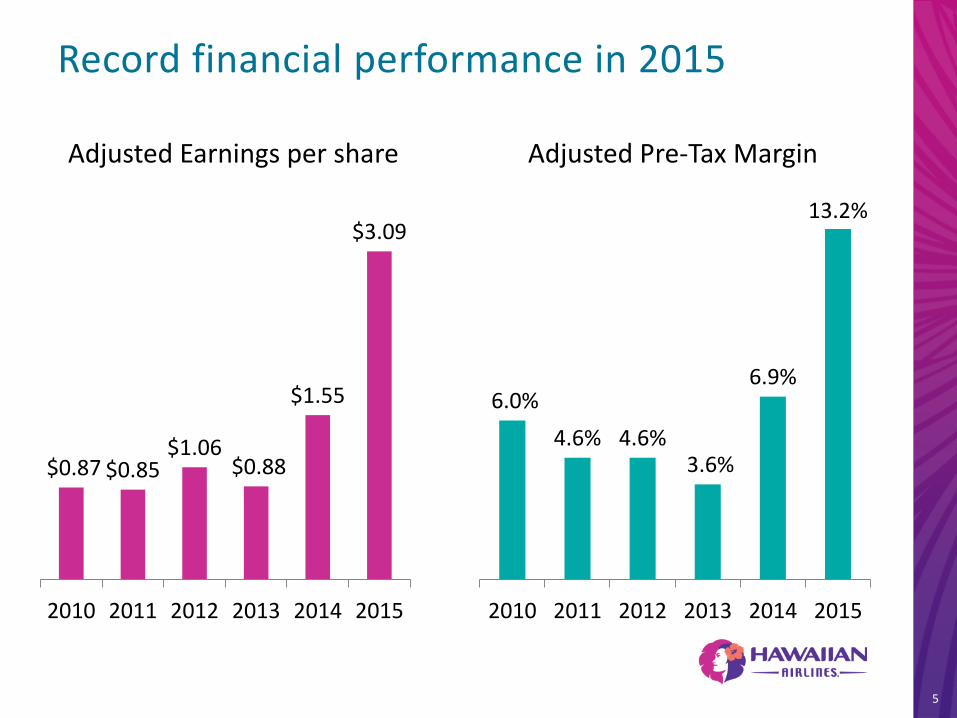
Record financial performance in 2015
$0.87 $0.85$1.06
$0.88
$1.55
$3.09
2010 2011 2012 2013 2014 2015
Adjusted Earnings per share Adjusted Pre-Tax Margin
6.0%
4.6% 4.6%3.6%
6.9%
13.2%
2010 2011 2012 2013 2014 2015
5

We are generating returns on our investments
15.6%
27.5%
2010 2011 2012 2013 2014 2015
Pre-Tax ROIC
6
• Solid demand for travel to Hawai‘i from all of our geographies
• Manageable industry capacity growth to Hawai‘i
• Maturation of routes
• Lapping of FX / fuel surcharge headwinds
• Continued growth of value-added products
• Cost control
• Low fuel prices
2016 is expected to be a better year than 2015
7

North America – improving unit revenue trend
8
Note: Capacity is defined as the industry seats from the West Coast to Hawai‘i in HA’s markets
11.3%
4.0%
-2.8% -3.3%
-9.5%-7.2%
-1.6%
2.8%
-1%
6%9%
11% 10%
13%
6% 5%
1Q14 2Q14 3Q14 4Q14 1Q15 2Q15 3Q15 4Q15PRASM yoy Annual capacity growth
Moderate industry capacity growth is driving better results

Neighbor Island – fleet optimization in 2015
9
0.0%
-5.0%
-1.7%
2.6%
1Q15 2Q15 3Q15 4Q15
PRASM Year over Year 18 B717 retrofitted to a standard seat count of 128 seats
125 additional seats
Equivalent to an additional very cost effective B717
Completion of interior modifications and refinement of capacity drove improvements

International – improving market performance with moderating FX headwinds
2014 MarketPerformanceand Network
Changes
FX FuelSurcharge
2015
International PRASM
¥100
¥105
¥110
¥115
¥120
¥125
Jan Mar May Jul Sep Nov
JPY / $
1.00
1.10
1.20
1.30
1.40
1.50
Jan Mar May Jul Sep Nov
2014 2015
AUD / $

Growing sales of value-added products
• Averaging $3.5M/month*
• Growth will come from additional inventory, pricing optimization, and new distribution channels
• >10% credit card portfolio growth
• >20% growth in credit card spend
$14.69
$19.72$22.01
2013 2014 2015
Other
Baggage
Sales of HawaiianMiles
Extra Comfort / Preferred Seat Sales
Value-added revenue per passenger
Note: “Other” includes ticket fees, first class upgrades, vacation commissions and on-board sales* Includes Extra Comfort and Preferred Seat revenue 11
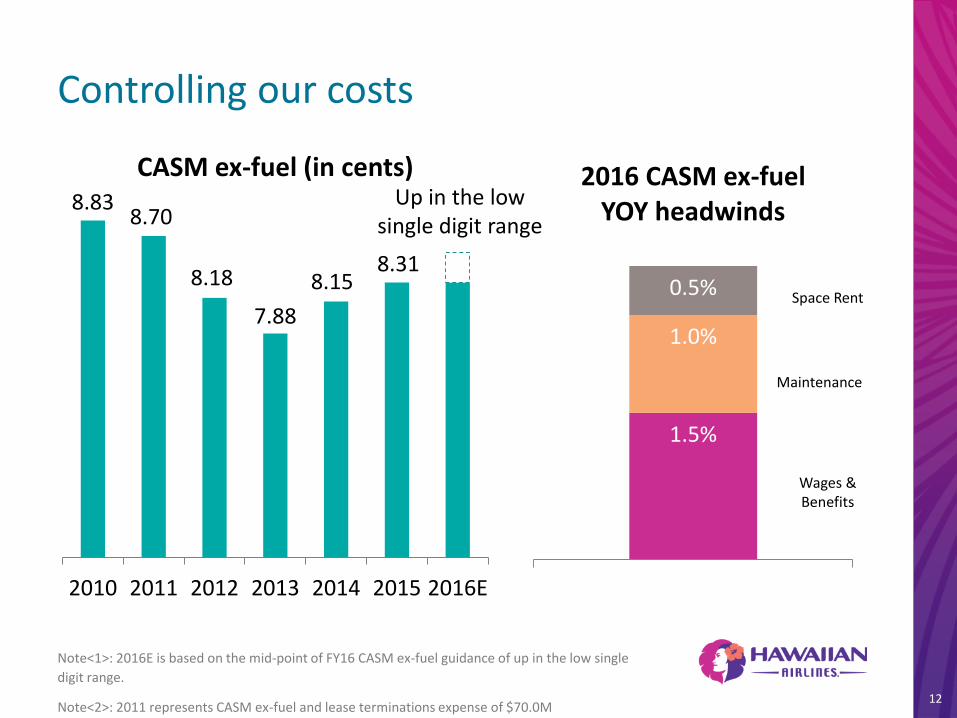
1.5%
1.0%
0.5%
2016 CASM ex-fuel YOY headwinds
Controlling our costs
Note<1>: 2016E is based on the mid-point of FY16 CASM ex-fuel guidance of up in the low single
digit range.
Note<2>: 2011 represents CASM ex-fuel and lease terminations expense of $70.0M
Maintenance
Wages & Benefits
Space Rent
12
8.838.70
8.18
7.88
8.158.31
2010 2011 2012 2013 2014 2015 2016E
CASM ex-fuel (in cents)Up in the low
single digit range

Lower fuel costs provide a tailwind
Note<1>: 2016E economic fuel cost per gallon estimates are based on the forward fuel curve as of
January 25, 2016.
Note<2>: Based on the Company’s hedge portfolio as of January 25, 2016
% Hedged Price
1Q16 60% $1.85
2Q16 46% $1.72
3Q16 30% $1.63
4Q16 15% $1.58
Heating Oil Hedge Position
$2.31
$3.13 $3.20 $3.15 $3.03
$2.04
2010 2011 2012 2013 2014 2015 2016E
Economic Fuel Cost per gallon
13
$1.35 - $1.45

Free cash flow strengthens our balance sheet
14
$476M
$101M
Sources of FCF
Aircraft SLB
Property, Equipment, and PDP
Cash from Operations
2015 FCF = $460M
$124M
$90M
$40M
$71M
$114M
Aircraft Debt before Maturity
Scheduled Principal Debt Repayment
Share Buy Back
Convertible Notes Buy Back: Original Principal Outstanding
Convertible Notes Outstanding: Equity
Uses of FCF = $440
$(118)M
Moderate capital expenditures in 2016
15
$80M
$45M
$40M
Pre-delivery PaymentsMaintenanceOther Modifications
2016 CapEx Breakdown
$140M
$282M$291M
$342M
$442M
$118M
2010 2011 2012 2013 2014 2015 2016E
$160M-$170M
Capital Expenditures

Early retirement of debt has lowered our leverage
Note: Aircraft Rent is capitalized at 7x.
16
$189M
$462M
$661M
$806M $772M
2010 2011 2012 2013 2014 2015 2014 2015
4.2x
2.7x
Debt Obligation Leverage
Optimize our capitalization and minimize cost of capital
$1,050M

Shareholder returns
Represents ~9% of our outstanding market cap
2015
Convertible Note – Equity Repurchase $114M
Share Repurchases $40M
Total Equity Repurchases $154M
17

30%
2014 2015
We’ve maintained a strong liquidity ratio
• Generating more excess cash with the current favorable operating environment
• Growing liquidity even with debt retirement and share repurchases
• 8% above our target is ~$185M
* Cash = cash, cash equivalents, short term investments and $175M availability under the revolving
credit facility
32%
18
Cash * / TTM revenue
• Hawai‘i’s leading airline
• Profitable with growing financial metrics
• Generating free cash flow and strengthening our
balance sheet
• Creating long-term value for our shareholders
Conclusion
19

Mahalo.20
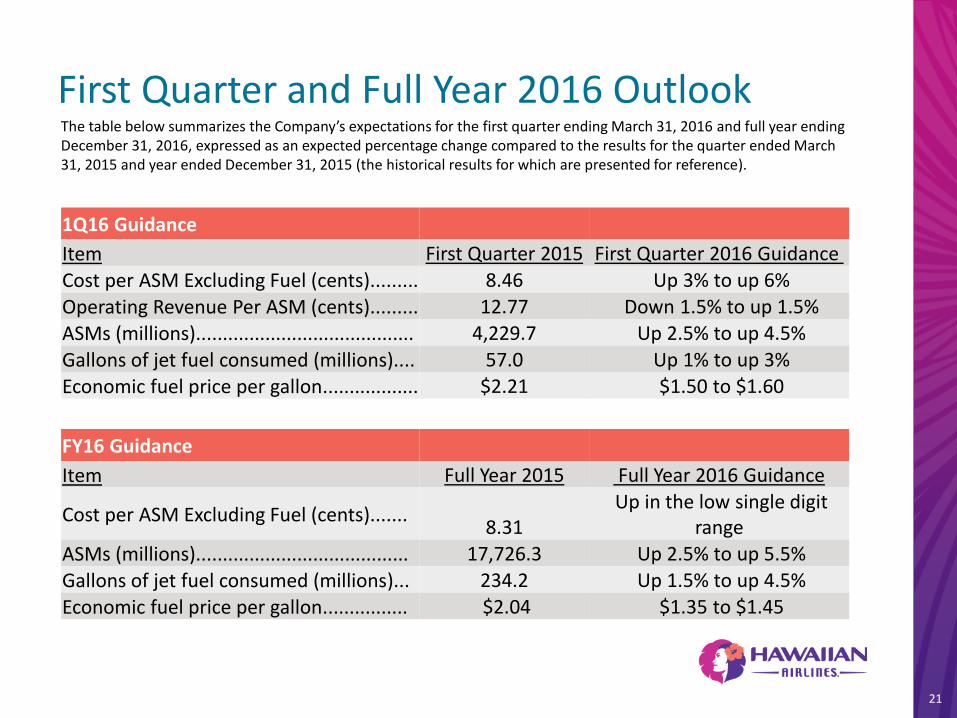
First Quarter and Full Year 2016 Outlook
21
FY16 Guidance
Item Full Year 2015 Full Year 2016 Guidance
Cost per ASM Excluding Fuel (cents).......8.31
Up in the low single digit range
ASMs (millions)........................................ 17,726.3 Up 2.5% to up 5.5%
Gallons of jet fuel consumed (millions)... 234.2 Up 1.5% to up 4.5%
Economic fuel price per gallon................ $2.04 $1.35 to $1.45
The table below summarizes the Company’s expectations for the first quarter ending March 31, 2016 and full year ending December 31, 2016, expressed as an expected percentage change compared to the results for the quarter ended March 31, 2015 and year ended December 31, 2015 (the historical results for which are presented for reference).
1Q16 Guidance
Item First Quarter 2015 First Quarter 2016 Guidance
Cost per ASM Excluding Fuel (cents)......... 8.46 Up 3% to up 6%
Operating Revenue Per ASM (cents)......... 12.77 Down 1.5% to up 1.5%
ASMs (millions)......................................... 4,229.7 Up 2.5% to up 4.5%
Gallons of jet fuel consumed (millions).... 57.0 Up 1% to up 3%
Economic fuel price per gallon.................. $2.21 $1.50 to $1.60

Non-GAAP Reconciliations
NON-GAAP RECONCILIATIONS
($ in thousands, except CASM data) FY 2010 FY 2011 FY 2012 FY 2013 FY 2014 FY 2015
GAAP Operating Expenses $1,218,815 $1,630,176 $1,832,955 $2,022,118 $2,069,747 $1,891,364
Less: aircraft fuel, including taxes and delivery (322,999) (513,284) (631,741) (698,802) (678,253) (417,728)
Less: lease termination expense - (70,014) - - - -
Adjusted operating expenses - excluding aircraft fuel and lease termination
$895,816 $1,046,878 $1,201,214 $1,323,316 $1,391,494 $1,473,636
Available Seat Miles 10,150,659 12,039,933 14,687,472 16,785,827 17,073,630 17,726,322
CASM - GAAP (in cents) 12.01 13.54 12.48 12.05 12.12 10.67
Less: aircraft fuel and lease termination expense (in cents) (3.18) (4.84) (4.30) (4.16) (3.97) (2.36)
CASM Excluding Fuel and lease termination expense (in cents)
8.83 8.70 8.18 7.88 8.15 8.31
NON-GAAP RECONCILIATIONS
($ in thousands) FY 2010 FY 2011 FY 2012 FY 2013 FY 2014 FY 2015
Net Income (Loss), GAAP $110,255 $(2,649) $53,237 $51,854 $68,926 $182,646
Add: lease termination expense, net of tax - 42,008 - - - -
Add: loss on extinguishment of debt, net of tax - - - - 2,331 7,235
Add: changes in fair value of fuel derivatives, net of tax3,859 3,859
2,375 (5,210) 25,864 (609)
Add: non-recurring tax benefits (62,546) - - - - -
Adjusted Net Income, Non-GAAP $45,405 $43,218 $55,612 $46,644 $97,121 $189,272
The Company evaluates its financial performance utilizing various GAAP and non-GAAP financial measures, including operating income and CASM. Pursuant to Regulation G, the Company has included the following reconciliation of reported non-GAAP financial measures to comparable financial measures reported on a GAAP basis. The Company believes that excluding fuel costs from certain measures is useful to investors because it provides an additional measure of management’s performance excluding the effects of a significant cost item over which management has limited influence.
22
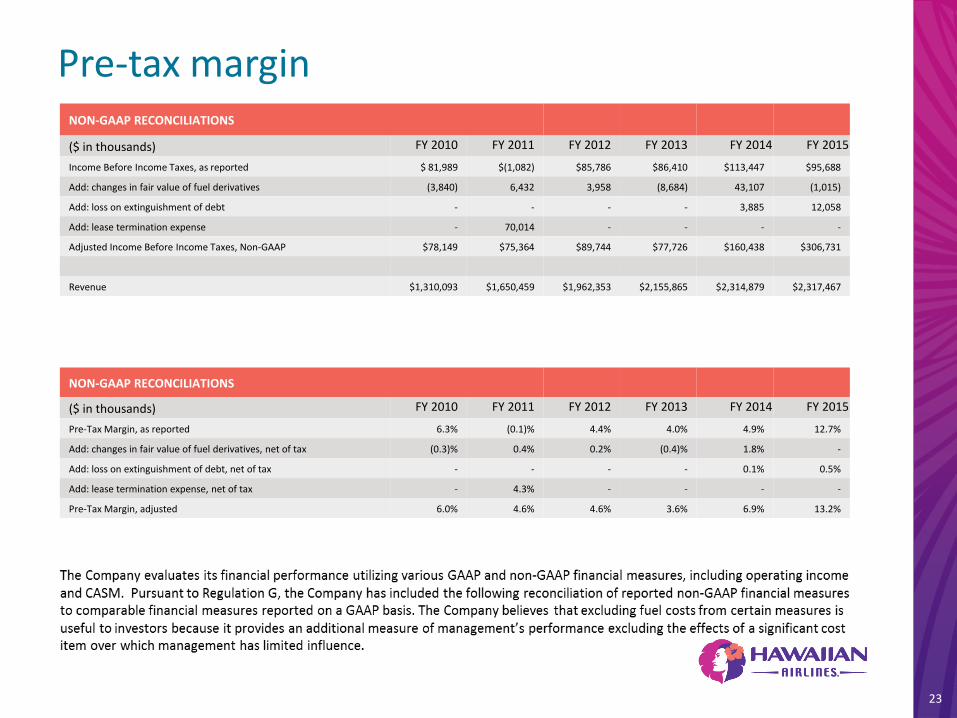
Pre-tax marginNON-GAAP RECONCILIATIONS
($ in thousands) FY 2010 FY 2011 FY 2012 FY 2013 FY 2014 FY 2015
Income Before Income Taxes, as reported $ 81,989 $(1,082) $85,786 $86,410 $113,447 $95,688
Add: changes in fair value of fuel derivatives (3,840) 6,432 3,958 (8,684) 43,107 (1,015)
Add: loss on extinguishment of debt - - - - 3,885 12,058
Add: lease termination expense - 70,014 - - - -
Adjusted Income Before Income Taxes, Non-GAAP $78,149 $75,364 $89,744 $77,726 $160,438 $306,731
Revenue $1,310,093 $1,650,459 $1,962,353 $2,155,865 $2,314,879 $2,317,467
NON-GAAP RECONCILIATIONS
($ in thousands) FY 2010 FY 2011 FY 2012 FY 2013 FY 2014 FY 2015
Pre-Tax Margin, as reported 6.3% (0.1)% 4.4% 4.0% 4.9% 12.7%
Add: changes in fair value of fuel derivatives, net of tax (0.3)% 0.4% 0.2% (0.4)% 1.8% -
Add: loss on extinguishment of debt, net of tax - - - - 0.1% 0.5%
Add: lease termination expense, net of tax - 4.3% - - - -
Pre-Tax Margin, adjusted 6.0% 4.6% 4.6% 3.6% 6.9% 13.2%
23

LeverageNON-GAAP RECONCILIATIONS
($ in thousands) FY 2014 FY 2015
Debt and capital lease obligations 1,049,637 772,144
Plus: Aircraft leases capitalized at 7x last 12 months’ aircraft rent 744,954 809,571
Adjusted debt and capital lease obligations 1,794,691 1,581,715
Income Before Income Taxes 112,634 295,688
Add back:
Interest and amortization of debt expense 64,420 55,678
Depreciation and amortization 96,374 105,581
Aircraft Rent 106,422 115,653
EBITDAR 379,850 572,600
Adjustments:
Add: changes in fair value of derivative contracts 43,108 (1,015)
Add: Loss on extinguishment of debt 3,885 12,058
Adjusted EBITDAR 426,843 583,643
Leverage Ratio 4.2x 2.7x
The Company evaluates its financial performance utilizing various GAAP and non-GAAP financial measures, including operating income and CASM. Pursuant to Regulation G, the Company has included the following reconciliation of reported non-GAAP financial measures to comparable financial measures reported on a GAAP basis. The Company believes that excluding fuel costs from certain measures is useful to investors because it provides an additional measure of management’s performance excluding the effects of a significant cost item over which management has limited influence.
24

25
Return on Invested CapitalHAWAIIAN AIRLINES – RETURN ON INVESTED CAPITAL (ROIC) – WORKING CAPITAL CASH METHODOLOGY 1
(in ‘000s) 2010 2011 2012 2013 2014 2015
Operating Income $91,278 $20,283 $129,400 $133,745 $245,132 $426,103
Add Back One-Time Charges $0 $70,014 $0 $0 $0 $0
Operating Income Less One-Time Charges $91,278 $90,297 $129,400 $133,745 $245,132 $426,103
Add Back Aircraft Rent Expense for Operating Leases $112,721 $112,883 $98,784 $108,535 $106,422 $115,653
Add Depreciation for Operating Lease Add Back 2 ($28,406) ($28,446) ($24,894) ($27,351) ($26,818) ($29,144)
Add Return on Invested Cash $197 $248 $294 $323 $347 $347
Adjusted Operating Income $175,790 $174,981 $203,585 $215,253 $325,083 $512,959
After Tax Adjusted Operating Income $108,990 $101,489 $122,130 $129,131 $195,050 $306,890
Average Total Debt and Capital Leases $225,170 $341,899 $616,704 $735,676 $1,017,084 $931,756
Common Equity $199,368 $286,499 $249,384 $302,141 $407,234 $361,014
Average Capitalized Operating Leases 3 $789,047 $790,180 $691,486 $759,747 $744,957 $809,575
Remove Average Excess Cash ($90,295) ($64,407) ($115,173) ($122,710) ($179,626) ($241,520)
Average Invested Capital $1,123,290 $1,354,171 $1,442,401 $1,674,855 $1,989,649 $1,860,827
Pre-Tax ROIC 15.6% 12.9% 14.1% 12.9% 16.3% 27.5%
After-Tax ROIC 9.7% 7.5% 8.5% 7.7% 9.8% 16.5%
Notes:1 All unrestricted cash removed from invested capital, except for working capital required to operate the business, defined as unrestricted cash equal to 15% of TTM total revenue2 Assumes 25 years useful life of aircraft and 10% salvage value3 Average capitalized operating leases equals TTM rent multiplied by 7


![THE HAWAIIAN PLANTERS' MONTHLY - University of Hawaii · 2012-09-05 · THE HAWAIIAN PLANTERS' MONTHLY PUBLISHED FOR THE HA WAIIAN SUGAR PLANTEHS' ASSOCIATION. Vol. XXI!.] HONOLULU,](https://static.documents.pub/doc/80x56/5f3c65e98c7b8c02031a6f17/the-hawaiian-planters-monthly-university-of-hawaii-2012-09-05-the-hawaiian.jpg)


