125
report HB2 Implementation Policy Guide prepared for Commonwealth Transportation Board date August 1, 2015

report
HB2 Implementation Policy Guide
prepared for
Commonwealth Transportation Board
date
August 1, 2015


HB2 Implementation Policy Guide
Table of Contents 1.0 Introduction ............................................................................................................ 1
1.1 HB2 Legislation Requirements .................................................................... 1 1.2 Roles and Responsibilities ............................................................................ 3 1.3 Stakeholder Input .......................................................................................... 4 1.4 Annual HB2 Cycle ......................................................................................... 5
2.0 Project Eligibility and Application Process ...................................................... 7 2.1 Eligibility Requirements ............................................................................... 7 2.2 Screening ....................................................................................................... 10 2.3 Application Process ..................................................................................... 11
3.0 Evaluation Measures ........................................................................................... 15 3.1 Safety Measures ........................................................................................... 16 3.2 Congestion Mitigation Measures............................................................... 16 3.3 Accessibility Measures ................................................................................ 17 3.4 Environmental Quality Measures ............................................................. 17 3.5 Economic Development Measures ............................................................ 18 3.6 Land Use Coordination Measures ............................................................. 18
4.0 Project Evaluation and Rating ........................................................................... 20 4.1 Calculation of HB2 Measures ..................................................................... 20 4.2 Internal/External Review ........................................................................... 21 4.3 Factor Weighting ......................................................................................... 21 4.4 Project Cost ................................................................................................... 25 4.5 Project Scoring .............................................................................................. 26
5.0 CTB Prioritization and Programming .............................................................. 29 5.1 Public Comment Period .............................................................................. 31 5.2 Adoption of SYIP ......................................................................................... 31 5.3 Annual Process Issues ................................................................................. 32 5.4 Improvements to Process and Measures .................................................. 33
6.0 Appendix A: Safety Measures .......................................................................... 34 S.1 Number of Fatal and Severe Injury Crashes ................................ 34 S.2 Rate of Fatal and Severe Injury Crashes ....................................... 37
7.0 Appendix B: Congestion Mitigation Measures ............................................. 38
i

HB2 Implementation Policy Guide
C.1 Person Throughput ......................................................................... 38 C.2 Person Hours of Delay ................................................................... 42
8.0 Appendix C: Accessibility Measures .............................................................. 47 A.1 Access to Jobs................................................................................... 47 A.2 Access to Jobs for Disadvantaged Populations ........................... 49 A.3 Access to Multimodal Choices ...................................................... 50
9.0 Appendix D: Environmental Quality Measures ........................................... 53 E.1 Air Quality and Energy Environmental Effect ............................ 53 E.2 Impact to Natural and Cultural Resources .................................. 55
10.0 Appendix E: Economic Development Measures ........................................... 58 ED.1 Project Support for Economic Development ............................. 58 ED.2 Intermodal Access and Efficiency ............................................... 62 ED.3 Travel Time Reliability ................................................................. 64
11.0 Appendix F: Land Use Coordination Measure .............................................. 70 L.1 Future Land Use Policy Consistency ............................................. 70
12.0 Appendix G: Application Guide ...................................................................... 74
ii

HB2 Implementation Policy Guide
List of Tables Table 1.1 HB1887 Eligibility ....................................................................................... 3
Table 2.1 Eligibility to Submit Projects ..................................................................... 9
Table 2.2 HB2 Measure Data Responsibility .......................................................... 14
Table 3.1 Safety Measures ......................................................................................... 16
Table 3.2 Congestion Mitigation Measures ............................................................ 16
Table 3.3 Accessibility Measures ............................................................................. 17
Table 3.4 Environmental Quality Measures ........................................................... 17
Table 3.5 Economic Development Measures ......................................................... 18
Table 3.6 Land Use Coordination Measure ............................................................ 19
Table 4.1 PDC-MPO Factor Weighting Typology ................................................. 24
Table 4.2 Factor Weights by Category .................................................................... 25
Table 4.3 Step 1: Congestion Mitigation Measure C.2 ......................................... 27
Table 4.4 Step 2: Congestion Mitigation Measure C.2 ......................................... 27
Table 4.5 Step 3: Congestion Mitigation Measure C.2 ......................................... 27
Table 4.6 Sample Project Scoring ............................................................................. 28
Table 6.1 Safety Factor – Measures Summary ....................................................... 34
Table 7.1 Congestion Mitigation Factor – Measures Summary ........................... 38
Table 8.1 Accessibility Factor – Measures Summary ............................................ 47
Table 9.1 Environmental Quality Factor – Measures Summary ......................... 53
Table 10.1 Economic Development Factor – Measures Summary ........................ 58
Table 11.1 Land Use Factor – Measure Summary ................................................... 70
Table 11.2 Land Use Policy Consistency/Transportation-Efficient Land Use Support ............................................................................................... 71
iii


HB2 Implementation Policy Guide
List of Figures Figure 1.1 Anticipated HB2 Yearly Cycle................................................................... 6
Figure 2.1 HB2 Project Eligibility and Pre-Application Process ............................. 8
Figure 4.1 HB2 Project Evaluation Process .............................................................. 20
Figure 5.1 CTB Prioritization and Programming Process ...................................... 30
v


HB2 Implementation Policy Guide
1.0 Introduction Transportation needs will almost always be greater than the funds available to address them. The signing of House Bill 2313 in 2013 created a more sustainable revenue source supporting transportation funding. While passage of this bill enabled the CTB to add approximately $4 billion in funding to the six-year improvement program, there are still many transportation needs that cannot be addressed with available revenues. To find a way to better balance transportation needs and prioritize investments for both urban and rural communities throughout the Commonwealth, new legislation – House Bill 2 (HB2) – was signed into law in 2014. HB2 requires the Commonwealth Transportation Board (CTB) to develop and implement a quantifiable and transparent prioritization process for making funding decisions for capacity- enhancing projects within the six-year improvement program.
The ultimate goal in the implementation of HB2 is to ensure the best use of limited transportation funds. Transparency and accountability are crucial aspects of delivering a process that project sponsors will support. HB2 projects will be evaluated based on a uniform set of measures that are applicable statewide, while recognizing that factors should be valued differently based on regional priorities.
The HB2 implementation process will start in August 2015, with projects initially selected by the CTB for inclusion in the draft Six-Year Improvement Program (SYIP) by April 2016. The HB2 process does not cover all types of projects within the SYIP. There are many other sources of funding including maintenance and rehabilitation, safety, operations, and other Federal and Commonwealth funding categories detailed later in this guidance document.
This guidance document provides the CTB’s policy direction on process roles and responsibilities, project eligibility, the project application process, evaluation measure definitions, project cost and scoring, and prioritization and programming considerations and rules.
1.1 HB2 LEGISLATION REQUIREMENTS Virginia House Bill 2, signed by Governor Terry McAuliffe on April 6, 2014 and effective as of July 1, 2014, requires the development of a prioritization process and directs the CTB to develop and use a scoring process for project selection by July 2016. The prioritization process will evaluate projects in the following factor areas: congestion mitigation, economic development, accessibility, safety, environmental quality and land use coordination (in areas with over 200,000 population). Factor areas will be weighted in each highway construction district, and may be weighted differently within each highway construction district. Candidate projects will be screened to determine if they qualify to be scored.
1

HB2 Implementation Policy Guide
Projects will be scored based on an objective and fair analysis applied statewide. HB2 also requires project benefits be analyzed relative to project cost. The Secretary of Transportation and CTB will make the evaluation process and results available to the public, so that the public will know how each project is scored and the rationale behind the CTB’s project selections.
The CTB will review the prioritized project list once the evaluation has been released, and will use the scoring, along with other information submitted to the CTB about each project to inform their funding decisions for the Six-Year Improvement Program (SYIP). The CTB is not required to fund the highest scoring projects but is expected to be able to provide a rational basis for funding a project with a lower score over projects with higher scores.
House Bill 1887 HB 1887, approved by the General Assembly in February 2015, establishes a new transportation funding formula, specifically the State of Good Repair Program, High-Priority Projects Program, and Construction District Grant Program. Both the High-Priority Projects Program and the Construction District Grant Program are subject to HB2.
The High-Priority Projects Program (as defined in § 33.2-370) refers to projects of regional or statewide significance that address a transportation need identified for a corridor of statewide significance or a regional network in the Statewide Transportation Plan VTrans2040. In this program, projects and strategies are compared to projects and strategies submitted statewide.
The construction district grant programs (as defined in § 33.2-371) refers to projects and strategies solicited from local governments that address a need for a corridor of statewide significance, regional network, improvements to promote urban development areas, or safety improvements identified in the Statewide Transportation Plan. In this program, candidate projects and strategies from localities within a highway construction district are compared against projects and strategies within the same construction district.
For both programs, projects and strategies are to be screened, evaluated, and selected according to the process established pursuant to HB2.
2

HB2 Implementation Policy Guide
Table 1.1 HB1887 Eligibility
High Priority Projects
Program District Grant Programa
Capacity Need on Corridors of Statewide Significance Yes Yes
Capacity Need on Regional Networks Yes Yes
Improvement to Support Urban Development Areas No Yes
aOnly projects submitted by localities are eligible. Projects addressing a safety need identified in VTrans2040 are also eligible under the District Grant Program.
1.2 ROLES AND RESPONSIBILITIES Commonwealth Transportation Board The CTB will oversee the HB2 project evaluation process. The CTB will review the scored project list once the evaluation has been released, and will use the scoring, along with other information submitted to the CTB about each project to inform their funding decisions regarding the allocation of funds for the High-Priority Projects Program and the Construction District Grant Program in the SYIP. The CTB is not required to fund the highest-scoring projects and may use other considerations, in addition to the HB2 process, to make final funding decisions. However, if the CTB makes funding decisions that are not consistent with the HB2 evaluation scoring, they will be able to provide a rationale for their decision.
Office of the Secretary of Transportation Under the Secretary of Transportation’s Office, the Office of Intermodal Planning and Investment (OIPI), Virginia Department of Transportation (VDOT), and Department of Rail and Public Transportation (DRPT) will manage the application process. OIPI will screen and review the projects against the HB2 screening criteria to determine which projects will be eligible to compete in the HB2 project prioritization review and evaluation. VDOT and DRPT will perform the calculations and determine the ratings for each project. The Secretary of Transportation’s Office will provide the final evaluation to the CTB and will make the final evaluation public.
Technical Evaluation Team A technical evaluation team will be responsible for conducting the measure calculations and making the measure qualitative rating assessments for each factor area, for each of the submitted, screened projects in the HB2 process. This evaluation team will be comprised of technical staff from DRPT and VDOT. The staff appointed to the technical evaluation team will be subject matter experts from both the District and Central Office that are experienced with the data,
3

HB2 Implementation Policy Guide
analytical tools, and qualitative content reported for each measure. Duties of the internal technical evaluation team may include:
• Evaluating project preparation; and
• Calculating scores for submitted projects according to the methodologies set out in Appendices A-F.
A second technical evaluation team may conduct evaluations for a selection of projects to ensure consistency.
External Peer Review To ensure the quality assurance and control (QA/QC) of the HB2 evaluation process, an external peer review group, consisting of staff representatives from groups such as the Virginia Association of Counties (VACO), Virginia Municipal League (VML), and the Federal Highway Administration (FHWA) will be assembled to provide a review of the calculated measures for each group of projects. Once the technical evaluation team finalizes the scoring of all submitted projects, the external peer group will assemble to review projects, evaluations, and scores to determine whether there are inconsistencies in scoring.
1.3 STAKEHOLDER INPUT To develop a fair and informed HB2 project prioritization process that would work across all modes and throughout the Commonwealth, extensive stakeholder input was considered in the development of the HB2 prioritization process. Numerous meetings were held to obtain the input of jurisdictions, agency stakeholders and the public body across the Commonwealth.
In the Fall of 2014, the Deputy Secretary met with each MPO across the state to discuss the HB2 prioritization process. The draft revised FY 2015-2020 Six-Year Improvement Program, including information on the HB2 prioritization process, was shared with the public during fall public meetings held in nine districts in September and October. A well-attended HB2 information session was also held at the Governor’s Transportation Conference in November, and a stakeholder survey was distributed at the session.
On January 8, 2015, a stakeholder outreach session was broadcast to each of the District offices and gave stakeholders an opportunity to provide feedback on potential measures and process issues. Additional outreach meetings were conducted on-site in each of the district with agency stakeholders in February and March.
Stakeholder engagement will continue to be required for each annual implementation of the HB2 submission process and evaluation. Collaboration and involvement will continue throughout the entire process. At a minimum, the opportunities for stakeholder input will include the following:
4

HB2 Implementation Policy Guide
• Application phase: Stakeholders will have the opportunity to provide input as to what projects the jurisdictions/MPOs/PDCs should consider moving forward in the process through the development of an application for HB2 funds as well as by providing feedback to the CTB during the annual Fall Transportation Meetings. Stakeholders will also work with the state to ensure that projects are defined in sufficient detail for HB2 evaluation.
• Analysis and Scoring phase: By January of each HB2 cycle, it is anticipated that the evaluation of projects selected for HB2 prioritization evaluation will be complete, and a scoring will be made public. Stakeholders will have the opportunity to review assumptions and calculations and see each project’s score.
• Results and Programming phase: Every year, during the development of the SYIP, stakeholder input is received during public hearings held following the release of the draft SYIP in April. Stakeholders will have the opportunity to provide input upon the projects that were selected for funding for both grant programs.
1.4 ANNUAL HB2 CYCLE Each year, HB2 is planned to operate according to the anticipated yearly cycle illustrated in Figure 1.1. Candidate projects will be solicited from eligible entities in August of each year, with project applications due September 30th. From there, OIPI, VDOT and DRPT will screen, review, and evaluate the projects per the HB2 process from October through early January. By mid-January, the list of projects and scores will be released to the public and the CTB, allowing the CTB to consider the evaluated project lists for inclusion in the SYIP. In April, the draft SYIP will be released by the CTB, followed by public hearings to gather input. In June, the revised final SYIP will be released and considered for adoption by the CTB. The following July, the next year’s process begins again.
5

HB2 Implementation Policy Guide
Figure 1.1 Anticipated HB2 Yearly Cycle
As currently identified, the application and evaluation process timeline will proceed as follows:
• July – Early coordination with DRPT and VDOT prior to application submissions
• August – Call for applications and notification of estimated amount and types of funding available
• August through September – Applicants coordinate with DRPT staff and VDOT District staff on candidates and submit applications
• September 30 – Applications due. All applications will be made public after the deadline to submit has passed
• October through January – Submitted projects are screened and evaluated
• Mid January – Results of HB2 screening/scoring presented to CTB and public
• February through June – HB2-funded projects will follow existing public comment period and SYIP approval process
6

HB2 Implementation Policy Guide
2.0 Project Eligibility and Application Process This section summarizes general project eligibility, screening, and application process considerations for HB2 implementation. Prospective projects must meet or exceed certain qualifications to be considered for evaluation in HB2, and sponsors must provide specific information for eligible projects. The types of projects and entities eligible for consideration are described in this section, along with funding sources not affected by HB2, and characterizations of entities eligible to submit projects. Figure 2.1 illustrates the process of determining whether a project has been developed enough to assess its benefits according to the HB2 factors and measures.
2.1 ELIGIBILITY REQUIREMENTS A large part of the HB2 process is dependent on the types of projects submitted. When determining eligibility considerations for HB2, a number of considerations were taken into account, including:
– Providing an opportunity for all levels of government to apply;
– Regional priority setting prior to project submittal;
– Project preparation to ensure that projects can be reliably evaluated;
– Linking the type of project an applicant may submit to the scale of the capacity need being addressed;
– Regional politics as an obstacle to some jurisdictions submitting projects;
– Some projects may fall into more than one project type category;
– Eligibility of CTB for submitting projects; and
– Federal requirements for statewide and metropolitan transportation planning.
Types of Projects Within the HB2 process, there are several types of projects that will be considered for funding. Highway, transit, rail, road, operational improvements and transportation demand management projects and strategies will be considered. However, projects must meet a need identified in VTrans 2040 for a CoSS, Regional Network or UDA to be considered.
7

HB2 Implementation Policy Guide
Figure 2.1 HB2 Project Eligibility and Pre-Application Process
PreapplicationCoordination
Does project address a need in VTrans for COSS,
Regional Network, or UDA?
Does submitting entity meet eligibility criteria?
Internal QA/AC ReviewDRPT and VDOT Districts
• Project Scope• Project Schedule• Cost Estimate
Does project have a clear scope, reasonable cost
estimate, and schedule?
Is there sufficient information/data to assess
project benefits?
Prepare HB2 project submission application
Develop schedule to conduct analysis needed
to evaluate following cycle
Is there enough time to refine scope and estimates
and/or compile needed information before
application deadline?
District/CO work to collect data and/or develop
assumptions
Provide information on alternative funding
program or develop project for reconsideration
No
No
Yes
Yes
Yes
Yes
NoNo
No
Funding Sources A variety of funding sources are subject to allocation according to the HB2 process. Projects seeking funding from most state and Federal discretionary fund categories are required to go through the HB2 process. However, the following funding categories are exempt from the HB2 process: Congestion Mitigation and Air Quality, Highway Safety Improvement Program, Transportation Alternatives, Revenue Sharing program, and secondary/urban formula funds. Regional funds for Northern Virginia and Hampton Roads are also exempt from the HB2 process.
8

HB2 Implementation Policy Guide
As described in Section 1, HB 1887 establishes two new funding programs; the High-Priority Projects Program and the Construction District Grant Program. These programs, and the new State of Good Repair Program also established by HB1887, replace the previous 40-30-30 system formula and the CTB alternate formula. The High-Priority Projects Program will address projects of regional or statewide significance and projects will compete statewide for funding. The Construction District Grant Program will set aside funds for each district and projects will compete for funding only with projects submitted by other localities within the same district.
Although both state and Federal funds are expected to be available through the HB2 process, all projects selected for funding that can qualify for Federal funds shall be developed as Federally eligible projects.
Entities Eligible to Submit Projects While many entities across the Commonwealth have expressed a desire to be part of the HB2 process, a select group of entities are eligible to submit projects for consideration. Non-profit public transit agencies, and regional entities (Metropolitan Planning Organizations (MPO), the Northern Virginia Transportation Authority, and Planning District Commissions (PDCs)) are eligible to submit projects, along with counties, cities, and those towns that maintain their own infrastructure. A summary of the entities eligibly to submit projects for HB2 is presented below in Table 2.1.
Table 2.1 Eligibility to Submit Projects
Project Type Regional Entity (MPOs, PDCs) Locality* (Counties, Cities,
and Towns) Public Transit Agencies
Corridor of Statewide Significance
Yes Yes, with a resolution of support from relevant regional entity
Yes, with resolution of support from relevant regional entity
Regional Network
Yes Yes Yes, with resolution of support from relevant entity
Urban Development Area
No Yes No
*Localities are also eligible to submit projects addressing a safety need identified in VTrans2040 under the District Grant Program.
Applications for funding through either the High Priority Projects Program or the Construction District Grant Program must relate to projects located within the boundary of the qualifying entity. By majority vote, the CTB may choose to submit up to two projects for funding through the High Priority Projects Program for each application cycle.
9

HB2 Implementation Policy Guide
2.2 SCREENING Screening Process and Administration All projects submitted for the HB2 process must pass through an initial screening process conducted by the OIPI team. The project screening is a critical component because it links the planning and programming processes to ensure the overarching transportation goals of the Board are advanced. If a project does not meet the capacity and operations is not consistent with the assessment of needs of VTrans2040, it cannot move forward in the HB2 process.
VTrans2040 assesses the State’s transportation needs at four scales, with each scale receiving its own set of guiding principles and approach in the plan:
• Corridor of Statewide Significance (COSS) – key multimodal travel corridors that move people and goods within and through Virginia, serving primarily long-distance / interregional travel;
• Regional Networks (RN) – multimodal networks that facilitate intraregional travel within urbanized areas;
• Urban Development Areas (UDA) – areas where jurisdictions intend to concentrate future population growth and development consistent with the UDA section within the Code of Virginia (§15.2-2223.1) (UDA)1; and
• Transportation Safety Needs – statewide safety needs identified in VTrans2040 will be eligible for funding under the District Grant Program.
The High-Priority Projects Program (as defined in § 33.2-370) will include projects that address a transportation need identified for a corridor of statewide significance (COSS) or a regional network (RN) in VTrans2040. The district grant programs will include COSS and RN needs, as well as needs identified for UDAs. District grant programs may also include safety projects that address a statewide safety need identified in VTrans2040.
Reflecting the organization of VTrans2040, applicants will need to identify which of the three scales primarily best fit their candidate project. This geographic designation will determine which screening criteria that VDOT, DRPT, and OIPI will apply to the proposal. OIPI is in the process of determining the geographic definition and needs assessment methodology for each of the three scales. See the VTrans2040 website for current information on the Virginia Multimodal Transportation Plan (VMTP) Needs Assessment
1 Including any locally designated growth areas that have a comprehensive plan reference to the UDA section as qualified for HB2 screening, even if they are not named as UDAs. Designated growth areas with the proper code reference submitted after October 1, 2015 will still be included in the VTrans2040 Multimodal Needs Assessment (VMTP) in an ongoing fashion; however they will not be considered in the first round of HB2 project screening.
10
HB2 Implementation Policy Guide
(http://www.vtrans.org/vtrans2040.asp). In general, the intent is to be inclusive with respect to both the definition of the networks and the identification of needs. Needs are not expected to be project specific or route specific, but rather broadly defined strategies that address a particular gap in transportation conditions.
The VMTP Transportation Needs Assessment will be used for screening candidate projects submitted under the HB2 process. A process for screening HB2-nominated projects against Needs will be developed the Office of Intermodal Planning and Investment. This screening will occur on a rolling basis, with review of projects beginning in Mid-August after CTB adoption of the VTrans2040 Needs Assessment.
Projects will first be screened by an external team of consultant experts that helped develop the methodology for and conduct the Needs Assessment. Their initial recommendations for a project’s ability to meet a need, along with the documentation for each decision, will then be reviewed by an internal screening committee consisting of state representatives from the transportation agencies, with the possible inclusion of other agencies that have helped develop the needs assessment methodology through their contributions on the Multimodal Advisory Committee. Projects found to be eligible thought this screening process will be forwarded to VDOT and DRPT for evaluation according to the HB2 factors and measures.
Although it will not be possible to run performance measurement testing for individual projects at the needs screening stage (as this will be done at the HB2 project evaluation stage), professional judgment will be used to compare candidate projects against identified needs. The goal of the needs screen process of the Transportation Needs Assessment is to have a flexible process that will allow a variety of different project solutions to be eligible for meeting any identified transportation need in a region, and not to presuppose any one particular project or project type for meeting a particular transportation need.
The draft VMTP Transportation Needs Assessment will be completed by early August 2015, which will allow it to be used by project sponsors in the application process and for screening candidate projects submitted under the HB2 process.
2.3 APPLICATION PROCESS In order to support the success of the evaluation process, project sponsors will need to coordinate with VDOT and DRPT early in the process to share information on prospective applications. This coordination phase will allow project descriptions and scopes of work, cost estimates, and potential benefits to be developed and refined and will facilitate the application and evaluation process. HB2 project submittals are encouraged to include sufficient information to be evaluated and also need to meet specific application requirements.
11

HB2 Implementation Policy Guide
Project Preparation Projects submitted as candidates for HB2 funding will be held to a basic standard of development to assure that they can be evaluated reliably. VDOT and DRPT intend to provide support to project sponsors prior to application to help project sponsors understand and meet expectations. Project sponsors are encouraged to initiate coordination with VDOT and DRPT staff prior to the application period to ensure that candidate projects are adequately developed.
HB2 project applications must include the following information:
• Scope – At a minimum, the scope should define the limits of the project, its physical and operational characteristics, and physical and/or operational footprint.
• Schedule – At a minimum, the schedule should clearly define the expected process for further project development including key milestones, work activities, related activities, approvals/approval timelines. The schedule should be realistic and reflect the complexity of the project and identify durations for project phases (PE, RW, CN).
• Cost – At a minimum, the cost estimate should be as realistic as possible and should account for applicable risk and contingencies based on the size and complexity of the project. Projects incurring one-time and ongoing operations and non-construction costs (i.e., purchase of transit vehicles) should clearly identify those costs.
The estimated cost to be used on the project application will be significant in determining each project’s final score or ranking. Prior to submitting project applications, applicants should work in conjunction with VDOT and DRPT staff to develop reliable cost estimates as part of the application process.
For projects in which the applicant requests VDOT to administer the project, VDOT will be responsible for providing the applicant with a cost estimate for each project application. If the applicant has provided an estimate, VDOT will be required to validate the estimate for use on each project application.
For projects in which the applicant requests to locally administer the project (and for all DRPT oversight projects), the applicant may provide a cost estimate for each project application, however VDOT and/or DRPT staff must validate the estimate for use on each project application
If there is disagreement concerning the estimate that cannot be resolved between the applicant and the VDOT/DRPT local contact, the applicant may request resolution from the VDOT District Engineer/Administrator or the DRPT Director.
Certain projects that are based on conceptual planning-level recommendations and have not been formally scoped or defined, may require additional planning/pre-scoping level work before their benefits can be adequately assessed according to the HB2 factors and measures. Planning and pre-scoping
12

HB2 Implementation Policy Guide
resources exist within VDOT, DRPT, localities, regional planning bodies, and some other entities (e.g., SPR, PL, Pre-scoping, FTA 5303, FTA 5304, etc.). However, resources are unlikely to be sufficient to fund every potential request for assistance for project development related to the HB2 process.
Application Submittal VDOT and DRPT’s goal is to formulate an application process that remains simple and straightforward for applicants. Additionally, staff from both agencies is available for support throughout the process. It is important for applicants to reach a consensus with VDOT and DRPT staff on the scope, schedule and estimate for project submission. A key guiding theme is to develop a process that does not require applicants to invest significant time and resources for submission of project information, or require the use of consultants to develop an eligible application. VDOT and DRPT staff will be available to provide support and tools for applicants in compiling data and information needed for application.
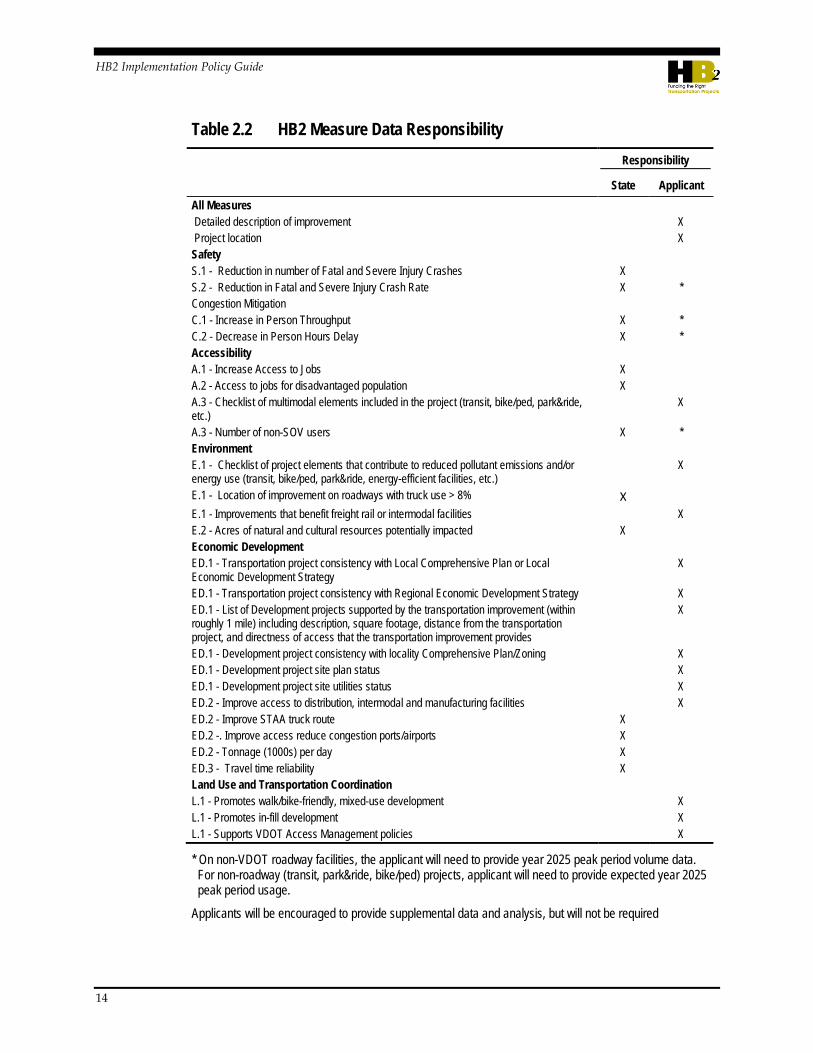
Table 2.2 lists the types of information needed to calculate the prioritization measures and highlights which items will need to be provided by the applicant and which items will be calculated by the state. The application process is expected to be electronic and map-based (i.e., VA Roads) to facilitate automated population of key data elements. This has the potential to reduce the likelihood of data entry errors and improve consistency with VDOT’s current scoping form.
Early coordination between project sponsors and VDOT and DRPT staff is strongly encouraged as it provides an opportunity to compile and develop necessary data ahead of the screening and application process. Note that if an applicant submits more than one project for consideration, as part of the application process, each applicant will be asked to rank their submitted projects in order of priority. VDOT/DRPT will evaluate projects in order of priority.
Appendix G contains an Application Guide that provides more detailed information on the application process and the inputs needed for a successful application.
13
HB2 Implementation Policy Guide
Table 2.2 HB2 Measure Data Responsibility
Responsibility
State Applicant All Measures Detailed description of improvement X Project location X Safety S.1 - Reduction in number of Fatal and Severe Injury Crashes X S.2 - Reduction in Fatal and Severe Injury Crash Rate X * Congestion Mitigation C.1 - Increase in Person Throughput X * C.2 - Decrease in Person Hours Delay X * Accessibility A.1 - Increase Access to Jobs X A.2 - Access to jobs for disadvantaged population X A.3 - Checklist of multimodal elements included in the project (transit, bike/ped, park&ride, etc.)
X
A.3 - Number of non-SOV users X * Environment E.1 - Checklist of project elements that contribute to reduced pollutant emissions and/or energy use (transit, bike/ped, park&ride, energy-efficient facilities, etc.)
X
E.1 - Location of improvement on roadways with truck use > 8% X E.1 - Improvements that benefit freight rail or intermodal facilities X E.2 - Acres of natural and cultural resources potentially impacted X Economic Development ED.1 - Transportation project consistency with Local Comprehensive Plan or Local Economic Development Strategy
X
ED.1 - Transportation project consistency with Regional Economic Development Strategy X ED.1 - List of Development projects supported by the transportation improvement (within roughly 1 mile) including description, square footage, distance from the transportation project, and directness of access that the transportation improvement provides
X
ED.1 - Development project consistency with locality Comprehensive Plan/Zoning X ED.1 - Development project site plan status X ED.1 - Development project site utilities status X ED.2 - Improve access to distribution, intermodal and manufacturing facilities X ED.2 - Improve STAA truck route X ED.2 -. Improve access reduce congestion ports/airports X ED.2 - Tonnage (1000s) per day X ED.3 - Travel time reliability X Land Use and Transportation Coordination L.1 - Promotes walk/bike-friendly, mixed-use development X L.1 - Promotes in-fill development X L.1 - Supports VDOT Access Management policies X
* On non-VDOT roadway facilities, the applicant will need to provide year 2025 peak period volume data. For non-roadway (transit, park&ride, bike/ped) projects, applicant will need to provide expected year 2025 peak period usage.
Applicants will be encouraged to provide supplemental data and analysis, but will not be required
14

HB2 Implementation Policy Guide
3.0 Evaluation Measures This section summarizes the evaluation measures that will be used in the HB2 evaluation process, and the methods in which those evaluation measures were selected for use. HB2 legislation requires that the measures be quantifiable and objective, that the analysis of a project’s benefits are relative to its cost (essentially a benefit-cost analysis using the HB2 factors), and that the CTB consider all modes of transportation. The law requires that the measures fall into six factor areas, listed below:
• Safety;
• Congestion Mitigation;
• Accessibility;
• Environmental Quality;
• Economic Development; and
• Land Use Coordination (for areas over 200,000 population).
Using the framework of the six factor areas, VDOT and DRPT used an extensive process to develop the measures for HB2. The team researched best practices from other state DOTs and MPOs, established a sub-work group focused on measures, held a peer exchange workshop, surveyed stakeholders, and held outreach meetings with key stakeholders. From these working groups and activities, the team gained a key understanding of some guiding principles that should be included in HB2, formalized into six guiding principles:
• Analyze what matters to people and has a meaningful impact;
• Ensure fair and accurate benefit-cost analysis;
• Be both transparent and understandable;
• Work for both urban and rural areas;
• Work for all modes of transportation; and
• Minimize overlap between measures.
15

HB2 Implementation Policy Guide
3.1 SAFETY MEASURES The goal of the HB2 safety measures is to address multimodal transportation safety concerns through best practice crash reduction strategies. Listed below in Table 3.1 are brief summaries of the two measures. Additional information about the measures, methodologies, and other details are available in Appendix A.
Table 3.1 Safety Measures
ID Measure Name Measure Description Measure Objective Measure Weight
S.1 Number of Fatal and Severe Injury Crashes
Number of fatal and severe injury crashes expected to be avoided due to project implementation
Estimate number of fatalities and severe injury crashes at the project location and the expected effectiveness of project specific counter-measures in reducing crash occurrence
50%a
S.2 Rate of Fatal and Severe Injury Crashes
Number of fatal and severe injury crashes per 100 million vehicle miles traveled (VMT) expected to be avoided due to project implementation
Similar to S.1, but by focusing on the change in fatality and severe injury crashes resulting from crashes per VMT, the measure considers projects that address areas with a high rate of crashes that may be outside of high-volume roadways
50%
a 100% for Transit Projects.
3.2 CONGESTION MITIGATION MEASURES The goal of the two HB2 congestion mitigation measures are to enhance the ability of the transportation system to move people and reduce travel delay across the State. Listed below in Table 3.2 are brief summaries of the measures. Additional information about the measures, methodologies, and other details are available in Appendix B.
Table 3.2 Congestion Mitigation Measures
ID Measure Name Measure Description Measure Objective Measure Weight
C.1 Person Throughput Increase in corridor total (multimodal) person throughput attributed to the project
Assess the potential benefit of the project in increasing the number of users served within the peak period.
50%
C.2 Person Hours of Delay
Decrease in the number of person hours of delay in the corridor
Assess the potential benefit of the project in reducing peak period person hours of delay.
50%
16

HB2 Implementation Policy Guide
3.3 ACCESSIBILITY MEASURES The goal of the three HB2 accessibility measures is to enhance worker and overall household access to jobs and other opportunities, and provide multiple and connected modal choices. Listed below in Table 3.3 are brief summaries of the measures, and additional information is available in Appendix C.
Table 3.3 Accessibility Measures
ID Measure Name Measure Description Measure Objective Measure Weight
A.1 Access to Jobs Change in cumulative jobs accessibility within 45 minutes (within 60 minutes for transit projects)
Measure assesses the change in cumulative access to employment opportunities as a result of project implementation based on the Virginia accessibility tool.
60%
A.2 Access to Jobs for Disadvantaged Populations
Change in cumulative job accessibility for disadvantaged populations and accessibility within 45 minutes (within 60 minutes for transit projects)
Measure assesses the change in existing cumulative access to employment opportunities as a result of project implementation based on the Virginia accessibility tool.
20%
A.3 Access to Multimodal Choices
Assessment of the project support for connections between modes, and promotion of multiple transportation choices
Measure assigns more points for projects that enhance interconnections among modes, provide accessible and reliable transportation for all users, encourage travel demand management, and potential to support emergency mobility.
20%
3.4 ENVIRONMENTAL QUALITY MEASURES The goals of the two HB2 environmental quality measures are to reduce pollutant emissions and energy consumption, and minimize the impact on natural and cultural resources. Listed below in Table 3.4 are brief summaries of the measures, and additional information is available in Appendix D.
Table 3.4 Environmental Quality Measures
ID Measure Name Measure Description Measure Objective Measure Weight
E.1 Air Quality and Energy Environmental Effect
Potential of project to improve air quality and reduce greenhouse gas emissions
Measure rates a project’s potential benefit to air quality and ability to increase energy efficiency or alternative energy use weighted by the total number of users served.
50%
E.2 Impact to Natural and Cultural Resources
Potential of project to minimize impact on natural and cultural resources located within project buffer
Measure evaluates how much sensitive land would be affected within project buffer around the project, and rates projects highest that have minimal or no impacts.
50%
17

HB2 Implementation Policy Guide
3.5 ECONOMIC DEVELOPMENT MEASURES Particularly for rural areas across the Commonwealth, economic development is a critical issue. The goals of the three HB2 economic development measures are to support regional and local economic development plans and new development activity, to improve intermodal freight movement access and efficiency, and to improve travel time reliability to support the movement of goods and people. Listed below in Table 3.5 are brief summaries of the measures. Additional information about the measures, methodologies, and other details are available in Appendix E.
Table 3.5 Economic Development Measures
ID Measure Name Measure Description Measure Objective Measure Weight
ED.1 Project Support for Economic Development
Project consistency with regional and local economic development plans and policies and support for local development activity
The intent of this measure is to assess if the project is supporting new and existing economic development and the progress made toward development in the project corridor at the local level. Progress will be assessed through use of a checklist of desired actions.
60%
ED.2 Intermodal Access and Efficiency
Rate projects based on the extent to which the project is deemed to enhance access to critical intermodal locations, interregional freight movement, and/or freight intensive industries
The intent of this measure is to assess the: Level to which the project enhances access to distribution centers, intermodal facilities, manufacturing industries or other freight intensive industries; Level to which the project supports enhanced efficiency on a primary truck freight route (or high volume/ high value truck or rail freight corridor); Level to which the project enhances access or reduces congestion at or adjacent to VA ports/ airports
20%
ED.3 Travel Time Reliability
Improvement in travel time reliability attributed to the project
The intent of this measure is to determine the project’s expected impact on improving reliability which supports efforts to retain businesses and increase and economic activity.
20%
3.6 LAND USE COORDINATION MEASURES The coordination between transportation and land use is an important issue within jurisdictions throughout Virginia. HB2 legislation mandates the use of this factor area for metropolitan areas in the State with a 2010 total population of 200,000 or more. Localities with a 2010 population beneath that threshold were given the opportunity to voluntarily choose to use this factor area as well. The goals of the HB2 land use coordination measure is to improve the consistency of the connection between local comprehensive plan goals for transportation-efficient land use and transportation infrastructure design, multimodal
18

HB2 Implementation Policy Guide
accommodation, and system operations. Listed in Table 3.6 is a brief summary of the measure, and additional information is available in Appendix F.
Table 3.6 Land Use Coordination Measure
ID Measure Name Measure Description Measure Objective Measure Weight
L.1 Land Use Policy Consistency
Project support for mixed-use development with multimodal choices, in-fill development, and corridor access management policies
The intent of this measure is to determine degree to which the project and adjacent future land use will help achieve goals for transportation- efficient land use.
100%
19

HB2 Implementation Policy Guide
4.0 Project Evaluation and Rating This section summarizes how projects will be evaluated and rated once submitted for consideration in the HB2 process. The CTB’s aim is to keep the entire process transparent, allowing for the comments of the public and stakeholders to be heard. The flowchart in Figure 4.1 below illustrates the general process of HB2 project evaluation and rating, and will be explored in more details within this section.
Figure 4.1 HB2 Project Evaluation Process
Screened HB2 Project
Calculation of HB2 Measures
Internal/External Review for QA/QC
Measure Valuesand Weighting
FactorWeighting
ProjectCost
Project Scoring
Advance list of scored projectsto CTB for Prioritization
4.1 CALCULATION OF HB2 MEASURES The technical evaluation team will collect and calculate measures listed in Section 3, spanning the six factor areas. This will be an open process and will involve State collaboration and review from an external team of stakeholders to ensure transparency. Methodologies and specific scoring methods are listed in Appendix A-F for each of the factor areas. As noted in Section 2.3, any applicant submitting multiple projects will be asked to rank their submitted projects in order of priority. VDOT/DRPT will evaluate projects in order of priority.
20

HB2 Implementation Policy Guide
4.2 INTERNAL/EXTERNAL REVIEW A key step in the rating process will be to perform QA/QC review of the calculated measures for each project. This review will be conducted by an internal technical group as well as by an external policy group. The internal technical evaluation team, consisting of VDOT and DRPT staff, will be responsible for developing and reviewing the scoring and evaluations of submitted projects in the HB2 process. Duties of this group may include:
• Evaluating project preparation; and
• Calculating measure scores for submitted projects according to the methodologies set out in Appendices A-F B-G.
Once the technical evaluation team finalizes the measures scoring of all submitted projects, the results will be reviewed by a policy review group consisting of stakeholder representatives such as VACO and VML staff. Scoring inconsistencies will be identified. Finally, once a reviewed set of measures scores is finalized, projects will move on to factor weighting process, by region, listed below.
4.3 FACTOR WEIGHTING HB2 legislation (includes the following language related to factor weighting:
B.1. The prioritization process shall be based on an objective and quantifiable analysis that considers, at a minimum, the following factors relative to the cost of the project or strategy: congestion mitigation, economic development, accessibility, safety, and environmental quality.
B.3. The Commonwealth Transportation Board shall weight the factors used in subdivision 1 for each of the state’s highway construction districts (9). The Commonwealth Transportation Board may assign different weights to the factors, within each highway construction district, based on the unique needs and qualities of each highway construction district.
B.4. The Commonwealth Transportation Board shall solicit input from localities, metropolitan planning organizations, transit authorities, transportation authorities, and other stakeholders in its development of the prioritization process pursuant to this section. Further, the Board shall explicitly consider input provided by an applicable metropolitan planning organization or the Northern Virginia Transportation Authority when developing the weighting of factors pursuant to subdivision 3 for a metropolitan planning area with a population over 200,000 individuals.
6. That, for Northern Virginia and Hampton Roads highway construction districts, the Commonwealth Transportation Board, pursuant to subdivision B.3 of § 33.1-23.5:5 as created by this act, shall ensure that congestion mitigation, consistent with § 33.1-13.03:1 of the Code of Virginia, is weighted highest among the factors in the prioritization process. For metropolitan planning areas with a population over 200,000,
21

HB2 Implementation Policy Guide
the prioritization process shall also include a factor based on the quantifiable and achievable goals pursuant to subsection B of § 33.1-23.03 of the Code of Virginia.
The language within subdivision B.3 related to weighting factors by construction districts and within districts recognizes the diversity within each of the nine construction districts as it relates to transportation needs and investment priorities. The development of the weighting scheme must also consider two special cases (noted in subdivision 6):
1. In the Northern Virginia and Hampton Roads construction districts, congestion mitigation should be weighted the highest of the six factors (greater than 16.7% if within an MPO boundary) or the five factors (greater than 20.0% if outside an MPO boundary, this case only applies in the Hampton Roads district).
2. Metropolitan planning areas (as defined by the U.S. Census Bureau) with a population over 200,000 will include a factor based on the goals, objectives, and priorities of the Statewide Transportation Plan (VTrans), referred to as the land use coordination factor.
Approach for Subdividing Construction Districts Within the Commonwealth, there are 21 PDCs and 15 MPOs. The PDC and MPO boundaries were compared with construction district boundaries to inform subdividing construction districts for factor weighting. As a starting point for developing potential factor weights, an individual weighting approach for each of the 36 MPO and PDC areas was deemed overly complex.
The alternative approach organized weighting through an analysis of transportation, land use and demographic indicators of each of the 36 areas. Similar areas were grouped, based on the quartile for each indicator, the average quartile, and other factors, with the overall intent to have MPOs and PDCs with similar key indicator results to be subject to a similar factor weighting type. The draft typology weighting categories were released for comment in March 2015 and numerous comments were received from MPOs, PDCs, and local governments on their preferred weighting category.
Figure 4.2 and Table 4.1 present the final factor weighting categories assigned to each MPO and PDC area.
22

HB2 Implementation Policy Guide
Figure 4.2 PDC – MPO Factor Weighting Typology Map
23

HB2 Implementation Policy Guide
Table 4.1 PDC-MPO Factor Weighting Typology Name Typology Northern Virginia Regional Commission (NVTA)/ Transportation Planning Board (TPB)2
Category A
Hampton Roads TPO (HRTPO)1 Category A Richmond Regional TPO (RRTPO) Category B WinFred MPO Category C Fredericksburg Area MPO (FAMPO) Category A Northern Shenandoah Valley RC* Category D George Washington RC* Category D Richmond Regional PDC* Category D Charlottesville-Albemarle MPO Category B Harrisonburg-Rockingham MPO Category C New River Valley MPO Category C Rappahannock-Rapidan RC Category C Thomas Jefferson PDC* Category C New River Valley PDC* Category C Roanoke Valley TPO (RVTPO) Category B Staunton-Augusta-Waynesboro MPO Category C Tri-Cities MPO Category C Roanoke Valley-Alleghany PDC* Category D Bristol MPO Category D Central Virginia MPO Category C Crater PDC* Category D Region 2000 LGC* Category D Accomack-Northampton PDC Category D Central Shenandoah PDC* Category D Danville MPO Category D Kingsport MPO Category D Middle Peninsula PDC Category D Mount Rogers PDC* Category D Commonwealth RC Category D Lenowisco PDC Category D Northern Neck PDC Category D West Piedmont PDC* Category D Cumberland Plateau PDC Category D Hampton Roads PDC* Category D Southside PDC Category D
Note 1: Glouchester County portion of HRTPO included within Middle Peninsula PDC typology. Note 2: Fauquier County portion of TPB included within Rappahannock-Rapidan RC typology. * PDC defined as the remainder of the region outside the MPO boundary. In many cases, these regions include partial counties (eg. Goochland County is partially within RRTPO and the Richmond Regional PDC). If a project is within the MPO boundary in a partial county, the project should use the weighting associated with the MPO.
24

HB2 Implementation Policy Guide
The final weighting scheme by category is presented in Table 4.2. Where MPO boundaries cover a partial county, the assumption is that any project partially or wholly within the MPO boundary will use the assigned MPO weighting approach unless noted otherwise in Table 4.1.
Table 4.2 Factor Weights by Category
Factor Congestion Mitigation
Economic Development Accessibility Safety
Environmental Quality Land Use
Category A 45%b 5% 15% 5% 10% 20%a
Category B 15% 20% 25% 20% 10% 10%a
Category C 15% 25% 25% 25% 10%
Category D 10% 35% 15% 30% 10%
a For metropolitan planning areas with a population over 200,000, the prioritization process shall also include a factor based on the quantifiable and achievable goals in VTrans. TPB, HRTPO, RRTPO, FAMPO and RVTPO all meet this definition. b For Northern Virginia and Hampton Roads construction districts, congestion mitigation is weighted highest
among the factors in the prioritization process.
4.4 PROJECT COST HB2 mandates that the prioritization process be based on several factors relative to the cost of the project:
“The prioritization process shall be based on an objective and quantifiable analysis that considers, at a minimum, the following factors relative to the cost of the project or strategy: congestion mitigation, economic development, accessibility, safety, and environmental quality.”
For the purposes of HB2 project scoring, project benefits will be calculated relative to HB2-funded costs only. The calculation of scores based on total cost will be provided to the CTB for comparison purposes.
Using only the HB2 costs directly accounts for the financial benefit of private, local, or other funding, and reflects the increased leveraging power of state resources. It is acknowledged that this definition of project cost may favor localities with more local financial resources to commit to transportation projects as well as localities with access to regional funds (e.g., Regional Surface Transportation Program, Congestion Mitigation and Air Quality improvement program, Hampton Roads Transportation Accountability Commission, Northern Virginia Transportation Authority). However, it is also noted that projects in these large urbanized areas tend to be more extensive due to higher right-of-way and construction costs, and additional regional resources may reduce the HB2 funding request so that benefits can be compared equally.
25

HB2 Implementation Policy Guide
HB2 costs will be used as the basis for the official project score. However information on both HB2 cost and total cost will be provided to the Board for comparison purposes and to show the range of the score between two costs.
4.5 PROJECT SCORING HB2 requires an analysis of the project benefits for each factor relative to the cost of the project. Each project will be scored by calculating values for each of the evaluation measures, converting those values into a score for each factor, and then by weighting the factor scores according to one of several potential weighting frameworks approved by the CTB. Ultimately, a weighted project score will be developed based on the project score divided by the cost of the project.
Key Terms Measure Value – Data calculated for the project that describes the characteristics of the project. Wherever possible, the HB2 measure values should be calculated so they are proportional to the size or impact of the project, even for qualitative measures.
Measure Score – Numerical score given to each measure based on the measure value as a percentage of the maximum value.
Weighted Measure Score – Measure scores within a factor area multiplied by their measure weights.
Raw Factor Score – Sum of the weighted measure scores within a factor area.
Weighted Factor Score – Raw Factor Scored multiplied by the factor weight for using the appropriate weighting framework based on the project location.
Project Score – Sum of the Weighted Factor Scores for each factor area. This represents the total benefits of the project.
Project Cost-Effectiveness Index – Project score divided by the HB2-funded cost of the project. This index will allow projects to be compared in terms of their benefit per HB2 dollar invested. Project costs will be applied in units of tens of millions of dollars ($10 millions).
Methodology Step 1 – Normalization of the Measure Values. Within each factor, for each measure, the highest value will be determined after calculating the measures for each project. The highest measure value will be given a score of 100 percent. Other measure values will be compared to the highest value, and the percentage of the highest value will be used as the measure score. An example of normalization is shown in Table 4.3 below.
26

HB2 Implementation Policy Guide
Table 4.3 Step 1: Congestion Mitigation Measure C.2 Project 1 Project 2 Project 3
Measure Value 10 hours 500 hours 900 hours
Measure Score 1.1 55.5 100
Step 2 – Apply Measure Weights. Once each measure score has been assigned for a factor, the measure weighting is applied. Each measure within the five or six factors will have a measure weight which will determine the percentage of the factor score carried by each measure. Once the measure weighting has been applied, the sum of the weighted measure scores will produce the raw factor score.
Table 4.4 Step 2: Congestion Mitigation Measure C.2
C.1: Person Throughput
C.2: Reduction in Person Hours of Delay Raw Factor Score: Congestion
Measure Weight 50% 50%
Value Score Value Score
Project 1 1,200 8 10 1.1 (50% * 8) + (50% * 1.1) = 4.55
Project 2 6,000 40 500 55.5 (50% * 40) + (50% * 55.5) = 47.8
Project 3 15,000 100 900 100 (50% * 100) + (50% * 100) = 100
Step 3 – Apply Factor Weights. The raw factor score is then multiplied by the weighting percentage assigned to that factor by the predetermined weighting typology. This process is repeated for all applicable factors – their sum producing the final HB2 project score.
Table 4.5 Step 3: Congestion Mitigation Measure C.2 Project 2 (Category B Weights)
Congestion Mitigation
Economic Development Accessibility Safety
Environmental Quality
Land Use
Final Project Score
Weight 15% 20% 25% 20% 10% 10%
Factor Score 47.8 76.4 49.1 58.9 81.9 68.3
Weighted Score 7.17 15.28 12.27 11.78 8.19 6.83 61.5
Step 4 – Calculate Cost-Effectiveness. The project score is then divided by the HB2-funded cost of the project (in $ 10 millions) to determine the value of score for every dollar invested. For example, assume that Project 2 is requesting $15 million in HB2 funds out of a total cost of $30 million. The project score is 61.5, the cost-effectiveness index would be 41 per $ 10 million dollars of HB2 funds invested. If the total project costs were used, instead of HB2 funds only, the cost-effectiveness index would be 21 per $ 10 million dollars of cost.
Under this scoring process the maximum measure values may change on a year-to-year basis depending on the characteristics of the projects that are submitted.
27

HB2 Implementation Policy Guide
The aim of this method is to score each project on a scale proportional to its benefits and relative to its cohort of projects rather than an arbitrary scale.
Table 4.6 shows another example of sample project scoring. This shows how the measure scores and weights, combined with the factor weights, can be used to calculate the total project score.
Table 4.6 Sample Project Scoring Project located in Typology Category A Congestion Safety Accessibility Environment Econ. Dev Land Use
Thro
ughp
ut
Delay
F&SI
Cra
shes
F&SI
Cra
sh R
ate
Acce
ss to
Jobs
Acce
ss to
Jobs
(D
isadv
anta
ged
Pop)
Multi
mod
al Ch
oice
s
Air Q
ualit
y
Natu
ral a
nd C
ult.
Reso
urce
s
Econ
omic
Deve
lopm
ent
Inte
rmod
al Ac
cess
Trav
el Ti
me
Relia
bilit
y
Futu
re L
and
Use
Polic
y Con
siste
ncy
Measure Score 62 48 20 32 10 20 10 38 28 30 20 20 17
Measure Weight 50% 50% 50% 50% 60% 20% 20% 50% 50% 60% 20% 20% 100%
Weighted Measure Score 31 24 10 16 6 4 2 19 14 18 4 4 17
Raw Factor Score 55 26 12 33 26 17
Factor Weighting 45% 5% 15% 10% 5% 20%
Weighted Factor Score 24.8 1.3 1.8 3.3 1.3 3.4
Project Score 35.9
Total Project Cost $20,000,000
Score Divided by Total Cost 18.0
HB2 Cost $10,000,000
Score Divided by HB2 Cost 35.9
28

HB2 Implementation Policy Guide
5.0 CTB Prioritization and Programming This final section summarizes CTB prioritization and programming methods that will be used in the HB2 process, specifically how HB2 scored projects will be reviewed, and ultimately, incorporated into the SYIP. The flowchart in Figure 5.1 below illustrates the basic process of the final stages of the HB2 Annual Process, in which the CTB will begin with the scoring results from the HB2 evaluation and rating process, and funding decisions for the draft SYIP.
First, the HB2 review teams will present the screening and scoring results to both the CTB and the public. The CTB will give guidance on program development, and begin to narrow down their funding decisions for projects that will funded in the draft SYIP. Their decisions will be represented in the draft SYIP. After the draft SYIP is presented, VDOT and DRPT will hold a public comment period that will allow eligible entities to comment on the process, on screening decisions, and on the scoring of individual projects. CTB will take into account public comments based on the draft SYIP, ultimately approving the final SYIP for implementation in June 2016.
29

HB2 Implementation Policy Guide
Figure 5.1 CTB Prioritization and Programming Process
HB2 Scoring Results
Present Screening/Scoring Results to CTB and Public
CTB Guidance on Program Development
Funding Decisionsfor Draft SYIP
Public Comment Period
Revise and Adopt Final SYIP
Funding Decisions for Draft SYIP Pursuant to Section 33.2-214 of the Code of Virginia, each year the CTB must approve a capital improvement program that outlines planned spending for transportation projects for proposed construction development or study for the next six years. The SYIP includes projects on the interstate, primary, secondary, and urban highway systems, as well as transit and rail projects. The CTB updates the SYIP each year as revenue estimates are updated, priorities are revised, project schedules and costs change, and study results are known.
Information from the fall transportation meetings and results of the scoring process will be utilized by the CTB to direct the development of a draft SYIP. The draft SYIP is presented to the CTB each spring. At that time the draft SYIP is made available for public comment. A final SYIP is presented to the CTB in June each year for approval. Upon adoption of the SYIP by the CTB, the new SYIP goes into effect on July 1.
Once the scoring is complete, additional considerations will be used to develop a recommended list of improvements for the CTB to consider in developing the next capital improvement program. These include:
30

HB2 Implementation Policy Guide
• Public feedback from Fall Transportation Meetings;
• Overall availability of funding and eligible uses of such funding;
• Leveraging of outside funding sources and maximizing the use of Federal funds;
• Project development considerations – timeframe and extent of Federally required location studies;
• Project segmentation – starting the next phase of a multi-segment roadway improvement, e.g., to complete a major multi-segment project; and
• Other information on project status.
The prioritization process does not require that the CTB funds projects in order of their scoring. Further, the CTB is not required to select the highest scoring project. The process is a means to assist the CTB in evaluating and comparing proposed improvements. The CTB continues to retain final decision-making authority on improvements to be included in the SYIP.
5.1 PUBLIC COMMENT PERIOD The CTB provides numerous opportunities for the public to provide input on transportation projects and priorities as part of the continuing transportation planning process. VDOT and DRPT hold annual Fall Transportation Meetings in the construction districts, providing public and elected officials with an opportunity to identify transportation priorities and to review and comment on the current SYIP. VDOT and DRPT also hold an annual planning and programming meeting inviting representatives from all MPOs and PDCs to attend and provide their transportation priorities prior to the annual development of the SYIP. Each spring, the draft SYIP is made available for public comment and VDOT and DRPT host public hearings. Attendance at the Fall Transportation Meetings and spring public hearings generally includes elected state officials, city and town officials, members of County Boards of Supervisors, representatives of advocacy groups, representatives from MPOs and PDCs, and the general public. Comments are accepted both verbally and in writing at the meeting or via regular mail or email after the meeting.
5.2 ADOPTION OF SYIP Once the projects are scored and public input from the formal public comment period based on the draft SYIP are received, the CTB will select the final list of projects for funding to be included in the final program approved in June 2016 and becomes effective July 1st. Annually and in order to meet its statutory obligation, the CTB will adopt a SYIP in June of each year. Key milestones for the adoption the first SYIP (FY 2017-FY 2022) that includes HB2 projects include the following:
31

HB2 Implementation Policy Guide
• July 2015: Early coordination between project sponsors, VDOT, and DRPT staff.
• August 2015: Call for candidate projects.
• September 30, 2015: Applications due.
• Early 2016: Screening and scoring results released, followed by public input.
• Spring 2016: CTB will select the final list of projects for funding to be included in the draft SYIP.
• April 2016: Draft SYIP released, followed by public hearings.
• June 2016: Final SYIP adopted.
5.3 ANNUAL PROCESS ISSUES Changes in Project Scope/Schedule/Cost In general, once a project has been screened, scored, and selected for funding by the (CTB), it will remain in the SYIP as a funding priority. Certain circumstances may warrant a re-evaluation of the project score and funding decision.
Important Considerations:
• It is important to ensure the integrity of the HB2 scoring process, the original intent/benefits of scored projects, and the CTB’s allocation decisions. Changes to these basic elements could result in funding projects that are not as cost effective when decisions to fund those projects are made by the CTB.
• In addition, allowing minor adjustments within the established thresholds ensures that minor changes to a project scope and/or estimate can be addressed through business rules without requiring CTB action, and avoiding potential project delays.
A project that has been selected for funding must be re-scored if either of the following conditions apply:
1. A change in the scope of the project that is significant enough to impact the anticipated benefits associated with the project or to require the location decision, the environmental review process (NEPA), or public hearing to be revisited; OR
2. An estimate increase prior to contract award that forces the total cost estimate of the project over the thresholds for the original score/latest re-score, unless local or other exempt funding is identified to support the increase. The threshold for re-scoring a project should be based on the total cost estimate of the project:
– Total Cost Estimate <$5 million: 20% increase prior to award of the construction contract requires re-scoring
32

HB2 Implementation Policy Guide
– Total Cost Estimate $5 million to $10 million: $1 million or greater increase prior to award of the construction contract requires rescoring
– Total Cost Estimate > $10 million: 10% increase prior to the award of the construction contract requires re-scoring; $5 million maximum increase prior to the award of the construction contract
– CTB action is required to confirm the commitment to funding the project based on the new score prior to the transfer of previous and/or program funds. Cost increases below the thresholds above will be addressed according regular business rules in accordance with the CTB policy for fund transfers.
3. Significant reduction in the locally/regionally leveraged funds available for the project.
In order to cover estimate increases, funds will be reprogrammed from projects with surplus allocations due to estimate decreases, contract award savings, schedule changes, etc. or from the lowest priority project with eligible funds. It is recommended that an annual review will be conducted on a sampling of projects to ensure that the scope and benefit of selected projects has not changed significantly. Project estimates will also be monitored to determine if the thresholds need to be adjusted.
Re-Rating Projects If a submitted project is not selected for funding during a cycle, the CTB will allow eligible entities to re-submit the project the next cycle. If a project is selected for funding in an approved SYIP, the intent is to keep that project as a priority for funding in subsequent SYIPs even if future program constraints require temporarily de-funding lower priority HB2 selected projects beyond the current six-year window.
5.4 IMPROVEMENTS TO PROCESS AND MEASURES HB2 is a new step forward for the Commonwealth of Virginia, the CTB is breaking new ground in moving towards a prioritized transportation funding structure. As the process moves into its second and third cycle, HB2 will continue to evolve and improve. Advances in technology, data collection, and reporting tools will upgrade and modernize HB2 for a growing Virginia, and the CTB looks forward to using these tools to provide a more balanced and equitable distribution of the Commonwealth’s transportation funds.
33

HB2 Implementation Policy Guide
6.0 Appendix A: Safety Measures Table 6.1 Safety Factor – Measures Summary ID Measure Name Weight Measure Description Measure Objective
S.1 Number of Fatal and Severe Injury Crashes
50%a Number of fatal and severe injury crashes expected to be avoided due to project implementation
Estimate number of fatalities and severe injury crashes at the project location and the expected effectiveness of project specific counter-measures in reducing crash occurrence
S.2 Rate of Fatal and Severe Injury Crashes
50% Number of fatal and severe injury crashes per 100 million vehicle miles traveled (VMT) expected to be avoided due to project implementation
Similar to S.1, but by focusing on the change in fatality and severe injury crashes resulting from crashes per VMT, the measure considers projects that address areas with a high rate of crashes that may be outside of high-volume roadways
a 100% for Transit Projects
Measures Approach
S.1 Number of Fatal and Severe Injury Crashes Definition: Number of fatal and severe injury crashes expected to be reduced due to project implementation.
Data Source(s)
• Five years of crashes (anticipated 2010–2014) from VDOT Roadway Network System (RNS) GIS data maintained by Traffic Engineering Division.
• Project expected crash reduction percentage developed using FHWA’s Crash Modification Factors (CMF) Clearinghouse website2 and Virginia crash summaries and models.
• For park and ride projects, identify the location of the project using information from Census data3 to determine the average commuting distance in the area.
2 http://www.cmfclearinghouse.org/ 3 http://onthemap.ces.census.gov/
34

HB2 Implementation Policy Guide
Methodology
The methodology varies by project type, as described below.
Roadway
Step 1: VDOT will compile the latest 5 years of fatal (F) and severe injury (SI) crashes within the project limits. The project limits are defined by the begin and end milepost for roadway, pedestrian, bicycle, in-roadway transit service (e.g., bus rapid transit), in-roadway freight service corridor improvements; the ends of the turn bays on all approaches for intersection improvements; the nearest intersection(s) on the cross street for a new interchange as well as adjacent ramps on the freeway within 1,600 feet of any proposed interchange ramp; and the begin and end milepost on key parallel roadway(s) (facilities where vehicles may shift from) for transit and freight improvement projects.
Step 2: Select the most appropriate overall project expected crash reduction (PECR) percentage (PECR=1-CMF) for each proposed project based on a set of CMFs applicable to HB2 project types. Following a review of the CMF list, a project sponsor should select the CMF for each proposed improvement on the segment or spot.
Step 3: Multiply the total average annual fatal and severe injury crash frequency by the PECR to estimate the number of crashes expected to be reduced.
• For roadway widening (capacity) projects, the previously described steps are applied using crashes on the highway segment from the begin and end mile points of the project.
• For intersection projects, only crashes on the approaches to the major roadway, which is defined as the highest volume facility, within the project limits of the intersection will be used, unless the project is only intended to improve the minor roadway approaches.
• For projects on roadways on new location, crashes on the most reasonable alternative route(s) would be compiled. The statewide 5-year average fatal and severe injury crash rate for the new roadway, using the facility type of the new roadway, would represent the build condition. The difference between the expected crashes on the alternative route(s) and the expected crashes on the build corridor equals the crash reduction. The alternate routes with expected changes in traffic volumes should be identified by the applicant.
• New interchanges and interchange ramp modifications on the freeway will consider freeway and crossing route crashes depending on the specific ramp improvements in proposed projects.
Transit/Freight Rail/TDM
The methodology described for roadway projects cannot be used for transit infrastructure projects given the limited information available on safety benefits from transit measures to the roadway users. For on-road transit projects, for
35

HB2 Implementation Policy Guide
example a bus-only lane or new transit route in mixed traffic, and for off-road (dedicated guideway) transit projects, safety benefits will be estimated based on expected shift from auto to transit with the assumption that dedicated transit vehicles have minimal crash frequencies. The same approach as described for off-road transit projects would be applied to freight rail projects, except the focus will be on the 5-year average of truck-related fatal and severe injury crashes in the parallel corridor. For TDM projects like park and ride lots, the same approach as described for off-road transit projects would be applied taking into account the traffic reductions on adjacent highways.
Transit/Freight Rail/TDM service safety analysis includes the following steps:
Step 1: Project sponsor identifies segments of highway with new on-road transit service and key parallel roadway(s) to new on-road and fixed guideway transit projects that will experience the primary travel shifts. For each highway and fixed guideway transit segment with new service, the applicant sponsor shall provide the daily and hourly ridership or ride-sharing increase estimates. The highway segments impacted by a mode shift will be assessed to determine the percent VMT change on the network; that is, the expected percent modal shift from highway (VMT) to transit/ride-sharing due to the project. The after project VMT will be one minus the percent model shift (VMT After = 1 – %VMT Reduced).
Step 2: For corridor transit service projects or freight rail projects, crashes from roadway segments within the project limits (in the case of an on-street bus or rail transit project) and/or on key impacted parallel roadways from where the vehicle traffic may be reduced (in the case of a facility that is separated from the travel lanes).
Step 3: Compute the 5-year annual average F+SI crash frequencies for the on-road segments and impacted parallel roadways.
Step 4: Calculate the expected reduction of annual F+SI crash frequencies for on-road and parallel roadway segments by multiplying the existing crash frequency by the after project percent VMT change.
Step 5: Compute the total expected number of F+SI crashes reduced = annual average F+SI crashes reduced summed for all project segments.
Bicycle/Pedestrian
The methodology described for roadway projects will be used for bicycle and/or pedestrian projects based on the proposed segment and/or intersection improvement CMFs. Depending on the dependability of the CMFs from FHWA and other sources, other alternative sources of information may be developed to assess the safety benefit of these project types based on bicycle facility classification or facility separation from travel lanes.
Scoring Value
Total change in fatal and severe injury (F+SI) crash frequency.
36

HB2 Implementation Policy Guide
S.2 Rate of Fatal and Severe Injury Crashes Definition: Number of fatal and severe injury crashes per 100 million vehicle miles traveled (VMT) expected to be reduced due to project.
Data Source(s)
• Five years of crashes (anticipated 2010–2014) from VDOT RNS GIS data prepared by Traffic Engineering Division.
• Existing AADT by roadway segment from VDOT RNS or jurisdiction, and segment(s) distance to calculate annual VMT.
• Project expected crash reduction percentage developed using FHWA’s CMF Clearinghouse website and Virginia crash summaries and models.
Methodology
The methodology varies by project type, as described below.
Roadway and Bicycle/Pedestrian
Step 1: Collect and use the most recent year AADT to calculate the annual VMT for the same segment(s) used for the crash data collection for the S.1 measure.
Step 2: Match the project location segment VMT with the expected F+SI crashes reduced by the project from the S.1 measure.
Step 3: Compute the expected F+SI crash rate reduction as a result of the project improvements = the S.1 reduced annual average F+SI crashes divided by the segment VMT. For longer projects covering several segments with different AADT values, the average annual crash rate reduction is the sum of the segment reduced crashes over the sum of the segment VMTs.
The methodology varies by project type, as described above for S.1 crash frequency reduction assessments. Transit service improvements will be considered as follows:
Transit/Freight Rail/TDM
The methodology described for roadway projects cannot be used for transit projects. For on-road and off-road (dedicated guideway) transit projects, only the S.1 measure of the total F+SI crash frequency reduction will be used so the transit safety score will be based on the S.1 result. The same approach as described for transit would be applied for Freight Rail types of project except the focus will be on the 5-year average of truck-related fatal and severe injury crashes in the parallel corridor.
Scoring Value
Expected reduction in fatal and severe injury (F+SI) crash rate.
37

HB2 Implementation Policy Guide
7.0 Appendix B: Congestion Mitigation Measures Table 7.1 Congestion Mitigation Factor – Measures Summary ID Measure Name Weight Measure Description Measure Objective
C.1 Person Throughput 50% Increase in corridor total (multimodal) person throughput attributed to the project
Assess the potential benefit of the project in increasing the number of users served within the peak period.
C.2 Person Hours of Delay
50% Decrease in the number of person hours of delay in the corridor
Assess the potential benefit of the project in reducing peak period person hours of delay.
Measures Approach
C.1 Person Throughput Definition: Change in corridor total (multimodal) person throughput attributed to the project.
Data Source(s)/Analytical Tools
• Latest available 24-hour traffic count data summarized by hour, direction, and roadway segment, including vehicle classification, where applicable, from VDOT TMS, or jurisdiction.
• Latest available regional travel demand model encompassing the influence area only for projects consisting of new transportation facilities.
• Existing AADT by roadway segment from VDOT TMS or jurisdiction.
• Obtain lane capacities for different facility types (i.e., freeway, collector, etc.) and area types from the ENTRADA User’s Guide, February 2014. The urban threshold for capacity will be used statewide and is generally based on LOS D/E.
• For park and ride projects, identify the location of the project using data from the U.S. Census4 to determine the average commuting distance in the project area.
• For transit projects, Department of Rail and Public Transportation (DRPT) will provide estimated daily ridership and hourly occupancy for the proposed service.
4 http://onthemap.ces.census.gov/
38

HB2 Implementation Policy Guide
• For new managed lane projects, assumed occupancy rates will be provided by VDOT.
• For roadway projects, SPS will be used to determine number of lanes, lane widths, speed limit, terrain (e.g., level, rolling, mountainous), lateral clearance, number of driveways on arterials, interchange density on freeways, and median type on arterials.
• Latest available aerial imagery used to determine merge, diverge, and weaving lengths on freeways and verify other data from SPS.
• FHWA Cap-X: evaluation tool that uses critical lane volumes (CLV) to evaluate the efficiency of intersections and interchanges.
• Potential traffic growth rate sources include VTrans2040, SPS, and travel demand model
• Highway Capacity Software (HCS) 2010 – Freeway Facilities Module
• Modified Bureau of Public Roads (BPR) spreadsheet
Methodology
The methodology is a quantitative, corridor-based analysis that requires an estimate of future no-build (without the project) and build (with the project) person throughput. It is anticipated that project corridor will consist of an intersection or segment within the corridor depending on the project type. The segment within the corridor with the highest volume-to-capacity ratio was used for analysis purposes to compare without project to with project conditions.
The methodologies to determine person throughput for roadway, bicycle/pedestrian, transit, TDM (including park and ride lots), and freight projects are described below, starting with roadway projects.
For all project types described in this section, person throughput is only credited/ scored if the facility is over capacity in the no-build project condition (has a volume to capacity ratio greater than 1.0)
Roadway: There are four types of analyses used to quantify the change in person throughput as a result of a proposed roadway project:
• Basic roadway segment (freeway, rural multilane, rural two-lane)
• Freeway facility (diverge, merge, weave)
• Intersection or interchange
• New facility
The methodology to compute the change in person throughput will be described for each of the four facility types listed above. The methodology for the analysis of first two facility types is the same.
Basic Roadway Segment / Freeway Facility
39

HB2 Implementation Policy Guide
Basic segments represent uninterrupted-flow conditions and have no fixed causes of delay or interruption external to the traffic stream. This category includes two-lane highways, multilane highways, and basic freeway segments as defined in the 2010 Highway Capacity Manual. Freeway facilities also represent uninterrupted-flow facilities consisting of continuously connected segments that include: basic freeway, weaving, merge, and diverge segments.
A modified Bureau of Public Roads (BPR) equation is used for the analysis of these types of facilities. Nationally, the BPR equation is the mostly widely used volume-delay function for road segments. The equation addresses the relationship between volume and capacity on the segment, with the result being the delay associated with traffic volumes. Capacity in the BPR equation is based on the area type and facility type.
Step 1: Compute future 2025 peak period traffic volumes within the project corridor using some of the aforementioned data sources, including traffic growth rates and the existing peak period traffic count data from VDOT TMS.
Step 2: Determine the peak period flow rate on the roadway segment without the project and with the project. Using the capacity values from the ENTRADA User’s Guide, compute the vehicle throughput without the project and with the project.
Step 3. Compute the change in peak period vehicle throughput by subtracting the no-build vehicle throughput from the build vehicle throughput.
Step 4: Compute the peak period person throughput for no-build and build conditions by multiplying an average vehicle occupancy rate by the vehicle throughput.
Intersection / Interchange
Intersections and interchanges represent interrupted flow conditions with features that create delay such as traffic signals.
Step 1: Compute future 2025 peak period traffic volumes within the project corridor using the aforementioned data sources, including traffic growth rates and the existing peak period traffic count data from VDOT TMS.
Step 2: Use FHWA CAP-X analysis tool to determine the intersection / interchange critical lane volumes and to estimate the vehicle throughput for the no-build and build conditions.
Step 3: Compute the change in peak period vehicle throughput by subtracting the no-build vehicle throughput from the build project vehicle throughput.
Step 4: Compute the peak period person throughput for without and with conditions by multiplying an average vehicle occupancy rate by the vehicle throughput.
40

HB2 Implementation Policy Guide
New Roadway Facilities
Estimating vehicle throughput for new roadway facilities requires the use of a regional travel demand model. The project is added to the regional travel demand model and model outputs are then used to summarize with project vehicle throughput.
Step 1: Code the new facility into the regional travel demand model with assumed posted speed limit, facility type, and number of lanes.
Step 2: Determine the future vehicle hours traveled (VHT) on the impacted segments in the network for the no-build model and the build model. Compute the average system with project throughput by multiplying the difference between the no-build VHT from the build VHT by 60 to convert to vehicles minutes traveled, and dividing this difference by the average trip length (expressed in minutes).
Step 3: Compute the peak period person throughput for no-build and build conditions by multiplying an average vehicle occupancy rate by the vehicle throughput.
The methodology described below varies by project type. Park and ride lots are included in the TDM category.
Transit / Bicycle/Pedestrian / Freight Rail / TDM
New service for alternative modes supports change in throughput both on the other mode and on highway network. For trips on other modes, estimate total person throughput for existing and new users in the peak period. The person throughput reduction for new users is associated with any throughput savings associated with a shift from auto to the other mode. For the highway network, total demand is reduced, which may lead to a reduction in vehicle demand on parallel facilities. For transit projects, compute the number of equivalent vehicles on roadway(s) within the impacted area using a forecasted 2025 ridership per hour and an assumed transit occupancy. Once the number of vehicles on impacted roadway(s) is computed, determine the peak period person throughput for no-build and build conditions by multiplying an average vehicle occupancy rate by the vehicle throughput.
Scoring Value
Total change in person throughput due to the project.
41

HB2 Implementation Policy Guide
C.2 Person Hours of Delay Definition: Decrease in the number of peak period person hours of delay in the project corridor.
Data Sources/Analytical Tools
• Latest available 24-hour traffic count data summarized by hour, direction, and roadway segment, including vehicle classification, where applicable, from VDOT TMS, or jurisdiction.
• Latest available regional travel demand model encompassing the influence area only for projects consisting of new transportation facilities.
• Existing AADT by roadway segment from VDOT TMS or jurisdiction.
• Obtain lane capacities for different facility types (i.e., freeway, collector, etc.) and area types from the ENTRADA User’s Guide, February 2014.
• For park and ride projects, identify the location of the project using data from the U.S. Census5 to determine the average commuting distance in the project area.
• For transit projects, Department of Rail and Public Transportation (DRPT) will provide estimated daily ridership and hourly occupancy for the proposed service.
• For new managed lane projects, assumed occupancy rates will be provided by VDOT.
• For roadway projects, SPS will be used to determine number of lanes, lane widths, speed limit, terrain (e.g., level, rolling, mountainous), lateral clearance, number of driveways on arterials, interchange density on freeways, and median type on arterials.
• Latest available aerial imagery used to determine merge, diverge, and weaving lengths on freeways and verify other data from SPS.
• FHWA Cap-X: evaluation tool that uses critical lane volumes (CLV) to evaluate the efficiency of intersections and interchanges.
• Potential traffic growth rate sources include VTrans2040, SPS, and travel demand model
• Highway Capacity Software (HCS) 2010 – Freeway Facilities Module
• Modified Bureau of Public Roads (BPR) spreadsheet
5 http://onthemap.ces.census.gov/
42

HB2 Implementation Policy Guide
Methodology
The methodology is a quantitative, corridor-based analysis that requires an estimate of future no-build (without project) and build (with project) person throughput and congested travel speeds.
The methodologies to determine person hours of delay for roadway, bicycle/pedestrian, transit, and freight projects are described below, starting with roadway projects. It is anticipated that project corridor length definition will vary by mode and project type. For example, the project length for a park and ride lot project is equal to the average commuting distance determined from the census data website identified in the data sources. On the other hand, the project length for a roadway corridor improvement project is established by extending the corridor to the next adjacent signalized intersection or interchange on both ends of the corridor. If there are no adjacent signalized intersections or interchanges within one mile of the either end of the corridor, then then one mile is added to both ends of the corridor.
Roadway: There are four types of analyses used to quantify the change in person hours of delay as a result of a proposed roadway project:
• Basic roadway segment (freeway, rural multilane, rural two-lane);
• Freeway facility (diverge, merge, weave);
• Intersection or interchange; and
• New facility.
Basic Roadway Segment
Basic segments represent uninterrupted-flow conditions and have no fixed causes of delay or interruption external to the traffic stream. This category includes two-lane highways, multilane highways, and basic freeway segments as defined in the 2010 Highway Capacity Manual.
A modified Bureau of Public Roads (BPR) equation is used for the analysis of these types of facilities. Nationally, the BPR equation is the mostly widely used volume-delay function for road segments. The equation addresses the relationship between volume and capacity on the segment, with the result being the delay associated with traffic volumes. Capacity in the BPR equation is based on the area type and facility type.
Step 1: Compute future 2025 peak period traffic volumes within the project corridor using some of the aforementioned data sources, including traffic growth rates and the existing peak period traffic count data from VDOT TMS.
Step 2: Collect and document all roadway geometric features using data from SPS and supplemented by field visits and/or aerial imagery.
43

HB2 Implementation Policy Guide
Step 3: Convert the peak period traffic volumes to flow rates using methods from the 2010 Highway Capacity Manual.
Step 4: Compute no-build and build travel speeds and delays using a modified BPR equation. Delay is calculated by calculating the difference between the predicted travel speed and the posted speed limit.
Step 5: Compute the change in vehicle hours of delay by subtracting the build (with project) delay from the non-build (without project) delay.
Step 6: Compute the peak period person hours of delay for no-build and build conditions by multiplying an average vehicle occupancy rate by the vehicle delay.
Step 7: Compute the change in person hours of delay by subtracting the build (with project) delay from the non-build (without project) delay.
Freeway Facility
Freeway facilities also represent uninterrupted-flow facilities consisting of continuously connected segments that include: basic freeway, weaving, merge, and diverge segments. The HCS Freeway Facility module is based on 2010 Highway Capacity Manual procedures.
Step 1: Compute future 2025 peak period no-build and build traffic volumes within the project corridor using the aforementioned data sources, including traffic growth rates and the existing peak period traffic count data from VDOT TMS.
Step 2: Compute volume-to-capacity ratio and travel speed using HCS methodologies for no-build and build conditions.
Step 3: Compute no-build and build delay using the travel speed and segment length.
Step 4: Compute the peak period person delay for no-build and build conditions by multiplying the average vehicle delay by an average vehicle occupancy rate by the vehicle delay.
Step 5: Compute the change in person hours of delay by subtracting the build (with project) delay from the non-build (without project) delay.
Intersection / Interchange
Intersections and interchanges represent interrupted flow conditions with features that create delay such as traffic signals. Corridor travel speed and delay will be calculated based on intersection/interchange delay and segment speed and delay. Apply a capacity check for intersection/interchange and roadway segment. Use the least improved bottleneck to calculate throughput change between the no-build (without project) and the build (with project) conditions.
44

HB2 Implementation Policy Guide
Step 1: Compute future 2025 peak period traffic volumes within the project corridor using the aforementioned data sources, including traffic growth rates and the existing peak period traffic count data from VDOT TMS.
Step 2: Determine the critical lane volume for each approach to the intersection, which is defined as the movements with the maximum traffic volume per lane.
Step 3: Use FHWA CAP-X analysis tool to estimate the vehicle delay for the no-build and build conditions.
Step 4: Compute the peak period person delay for no-build and build conditions by multiplying the average vehicle delay by an average vehicle occupancy rate by the vehicle delay.
Step 5: Compute the change in peak period delay by subtracting the build (with project) delay from the non-build (without project) delay.
New Roadway Facilities
Estimating vehicle delay for new facilities requires the use of a regional travel demand model. The project is added to the regional travel demand model and model outputs are then used to summarize project build vehicle delay. The total vehicle delay reduction is the cumulative effect at a system level (total trips). Step 1: Code the new facility into the regional travel demand model with assumed posted speed limit, facility type, and number of lanes.
Step 2: Determine the future vehicle hours traveled (VHT) on the impacted segments in the network for the no-build model and the build model. Compute the “with project” average daily delay reduction by subtracting the no-build VHT from the build VHT. Next, multiply the delay reduction by the new vehicle trips on the segment and a k-factor (to reflect the peak hour volume), then dividing this difference by the total number of trips from impacted segments to get the average vehicle delay (expressed in hours).
Step 3: Compute the peak period person delay for no-build and build conditions by multiplying the average vehicle delay by an average vehicle occupancy rate.
Step 4: Compute the change in peak period delay by subtracting the build (with project) delay from the non-build (without project) delay.
The methodology described below varies by project type. Park and ride lots are included in the TDM category.
Transit / Freight Rail / TDM
New service from alternative modes supports change in delay both on the other mode and on the highway network. For trips from other modes, estimate total person travel time savings for existing and new users in the peak hour. The
45
HB2 Implementation Policy Guide
person travel time savings for existing users is associated with any improvement in frequency or travel time associated with the project. The person travel time savings for new users is associated with any travel time savings associated with a shift from auto to the other mode. For the highway network, total demand is reduced, which may lead to a reduction in delay on parallel facilities.
Bicycle/Pedestrian
No reduction in person hours of delay is assumed for a stand-alone bicycle and/or pedestrian project.
Scoring Value
Total peak-period person delay reduction.
46

HB2 Implementation Policy Guide
8.0 Appendix C: Accessibility Measures Table 8.1 Accessibility Factor – Measures Summary ID Measure Name Weight Measure Description Measure Objective
A.1 Access to Jobs 60% Change in cumulative jobs accessibility within 45 minutes (within 60 minutes for transit projects)
Measure assesses the change in cumulative access to employment opportunities as a result of project implementation based on the Virginia accessibility tool.
A.2 Access to Jobs for Disadvantaged Populations
20% Change in cumulative job accessibility for disadvantaged populations and accessibility within 45 minutes (within 60 minutes for transit projects)
Measure assesses the change in existing cumulative access to employment opportunities as a result of project implementation based on the Virginia accessibility tool.
A.3 Access to Multimodal Choices
20% Assessment of the project support for connections between modes, and promotion of multiple transportation choices
Measure assigns more points for projects that enhance interconnections among modes, provide accessible and reliable transportation for all users, encourage travel demand management, and potential to support emergency mobility.
Measures Approach
A.1 Access to Jobs Definition: The accessibility tool (currently in pilot testing) reports the existing cumulative accessibility to jobs within 45 minutes at the individual U.S. Census block group level statewide. For transit projects, accessibility will be calculated to jobs within 60 minutes. The tool is capable of calculating the cumulative accessibility to jobs by mode (auto, transit, pedestrian). The jobs are weighted based on a travel time decay function, where jobs within a shorter travel time are weighted more than jobs farther away. The decay function was developed based on travel survey data. The cumulative accessibility represents the total number of jobs reachable in a 45 minute travel time from each block group to every other block group within an area of influence of a particular project6.
6 The area of influence of a project is defined as a 45 minute radius circle around the project. Beyond this area of influence, the tool does not calculate job accessibility as it is a distance that is not relevant to the vast majority of trips.
47

HB2 Implementation Policy Guide
The tool calculates the improvement in number of jobs reachable within that travel shed resulting from a proposed transportation improvement. Therefore, the cumulative number of jobs in a region is a composite number based on total jobs accessible from each block group to every other block group and can be a very high number, especially for the auto travel mode. The actual metric relevant for HB2 prioritization purposes is the increase in cumulative job accessibility resulting from a proposed project. Travel times are based on congested roadway travel times and real transit operating schedules.
As part of the estimation of change in project corridor person hours of delay (Measure C.2), an estimate of the project build congested speed will also be developed. The project build congested speed is entered into the underlying congested network within the accessibility tool, and the difference between the build and no build congested speeds is used to calculate the change in cumulative accessibility by block group.
Data Source(s)
• Accessibility tool.
• Change in project corridor congested speed or transit operations.
Methodology
The accessibility tool currently reports a cumulative accessibility to jobs by mode for each block group in Virginia. The analysis of project benefits considers how an improvement in travel time expands accessibility to jobs at the block group level (without consideration of regional or State boundaries). Current land use forecasts will be used.
Step 1: Update congested roadway speeds or transit network. Based on analysis conducted in the congestion factor for measure C.2, post-project implementation congested speeds are generated and applied to the roadway network underlying the accessibility tool. For transit projects, the project corridor and basic operational information (peak period frequency and travel times) are coded into the transit network (based on General Transit Feed Specification (GTFS) data, which is a common format for public transportation schedules and associated geographic information) underlying the accessibility tool.
Step 2: Use the accessibility tool to calculate the current (no build) accessibility by mode for a project. The accessibility is the cumulative access to jobs from each block group to every other block group in a 45 minute travel time within the project’s area of influence.
Step 3. Use the accessibility tool to calculate the build accessibility (using post-project implementation congested speeds) by mode for a project.
Step 4. Calculate the change in accessibility scores between the build and no build conditions. For each project, a cumulative accessibility improvement is reported (depending on mode, e.g., for roadway projects the auto mode improvement is reported, for transit projects the transit mode improvement is
48

HB2 Implementation Policy Guide
reported, for multimodal projects the cumulative multimodal improvement is reported).
Scoring Value
Total change in cumulative jobs accessibility.
A.2 Access to Jobs for Disadvantaged Populations Definition: The accessibility tool (currently in pilot testing) reports the existing cumulative accessibility to jobs within 45 minutes at the individual U.S. Census block group level statewide. For transit projects, accessibility will be calculated to jobs within 60 minutes. The tool is capable of calculating the cumulative accessibility to jobs by mode (auto, transit, pedestrian). The jobs are weighted based on a travel time decay function, where jobs within a shorter travel time are weighted more than jobs farther away. The decay function was developed based on travel survey data. The cumulative accessibility represents the total number of jobs reachable in a 45 minute travel time from each block group to every other block group within an area of influence of a particular project7. For this measure, the change in cumulative job accessibility is summed for Census block groups having a share of disadvantaged population that is significantly above the regional average.
Data Source(s)
• Accessibility tool.
• 2013 U.S. Census American Community Survey 5-year estimates.
Methodology
For the purposes of this analysis, “disadvantaged population” is calculated as having a regionally-significant share of low-income, minority, or limited-English proficiency (LEP) population. To calculate which Census tracts could be classified as “disadvantaged,” the following steps were taken:
• Obtained Virginia census tract data from American Community Survey (5 year sample) for population by income, minority, and LEP.
• Grouped all the tracts by county/city/PDC and developed PDC averages for the share of population by tract for each disadvantaged population group.
• Identified tracts for each category that exceeded the 75th percentile share.
• Identified “disadvantaged” tracts as those that had at least one category over the 75th percentile share.
7 The area of influence of a project is defined as a 45 minute radius circle around the project. Beyond this area of influence, the tool does not calculate job accessibility as it is a distance that is not relevant to the vast majority of trips.
49

HB2 Implementation Policy Guide
All Census tracts in Virginia were analyzed to determine which tracts had “regionally significantly” populations of low-income minority, or limited English speaking persons (LEP), using the 75th percentile of the Planning Development Commission (PDC) averages.
For instance, a Census tract within Augusta County would be considered to have a “regionally significant low-income population” if the tract’s share of low-income population (from the 2010 Census American Fact Finder – 15.1%) was higher than the 75th percentile of the Central Shenandoah PDC (12.3%). If a Census tract was found to be “regionally significant” in at least one of the three topics ( low-income, minority, or LEP), the tract was characterized as “disadvantaged.”
The accessibility tool calculates job accessibility by Census block group so the block group would be flagged as “disadvantaged” based on the Census tract where it is located. The change in cumulative job accessibility is summed for Census block groups having a “regionally-significant” share of at least one of the disadvantaged population groups.
Scoring Value
Total change in cumulative jobs accessibility for areas that are identified as having a regionally-significant share of disadvantaged populations
A.3 Access to Multimodal Choices Definition: This measure considers the relationship of the project corridor (based on proximity to other modes and sponsor input on project definition) to alternative transportation modes, and the quality of those modes. The objective is to recognize projects that enhance connections between modes or create new connections.
Data Source(s)
• GIS data of transit routes or transit service areas, all rail transit stations (from GTFS data as described for accessibility tool).
• DRPT/VDOT GIS data of park-and-ride lots.
• VDOT GIS data of on and off-road bicycle facilities (incomplete dataset at this time).
50

HB2 Implementation Policy Guide
Methodology
Step 1: The project sponsor provides project level detail on the extent of connections and accommodation of multiple modes as part of the project definition and self assign points in consistent with descriptions in Table 8.2.
Step 2: The project corridor is entered into a GIS database and overlaid with a layer including all multimodal transportation options. The GIS analysis is recommended to inform the validation of sponsor scoring in Table 8.2.
For roadway or multimodal projects this includes: type of bicycle facility, type of pedestrian facilities, connection to park-and-ride locations or inclusion of managed lanes, inclusion of technology supporting traveler information, or wayfinding signage to other modes, and accommodation of on-road transit vehicles.
For transit projects, depending on transit mode, this includes: associated bike and pedestrian facilities, bicycle parking, accommodation of bike on transit vehicles, park-and-ride facilities, traveler information, affiliation or presence of local TDM programs, and transfers with other transit modes.
For bike and pedestrian projects, this includes: class of bicycle facility, type of pedestrian improvements, connections to other on- or off-road bicycle facilities, connections to transit facilities, and affiliation or presence of local TDM programs.
Freight related accessibility is considered in the economic development factor.
Step 3: HB2 review staff review project scoring and work with project sponsor to adjust scoring as necessary.
Scoring Value
Total project points are then multiplied (scaled) by the number of peak period non-SOV users.
51

HB2 Implementation Policy Guide
Table 8.2 A.3 Access to Multimodal Choices – Scoring Approach Project Type (Mode) and Characteristics Points (If Yes)
Project includes transit system improvements or reduces delay on a roadway with scheduled peak service of 1 transit vehicle per hour.
5
Project includes improvements to an existing or proposed park-and-ride lot. Ex. New lot, more spaces, entrance/exit, technology (payment, traveler information).
4
Project includes construction or replacement of bike facilities. For bicycle projects, off-road or on-road buffered or clearly delineated facilities are required.
1.5
Project includes construction or replacement of ped facilities. For pedestrian projects, sidewalks, pedestrian signals, marked crosswalks, refuge islands, and other treatments are required (as appropriate).
1.5
Project includes improvements to existing or new HOV/HOT lanes or ramps to HOV/HOT.
2
Project provides real-time traveler information or wayfinding specifically for intermodal connections (access to transit station or park&ride lot).
1
Provides traveler information or is directly linked to an existing TMC network/ITS architecture.
1
Total Points Possible 5 points maximum
Measure Scaling: Points are multiplied by the number of peak period non-SOV users
52

HB2 Implementation Policy Guide
9.0 Appendix D: Environmental Quality Measures Table 9.1 Environmental Quality Factor – Measures Summary ID Measure Name Weight Measure Description Measure Objective
E.1 Air Quality and Energy Environmental Effect
50% Potential of project to improve air quality and reduce greenhouse gas emissions
Measure rates a project’s potential benefit to air quality and ability to increase energy efficiency or alternative energy use weighted by the total number of users served.
E.2 Impact to Natural and Cultural Resources
50% Potential of project to minimize impact on natural and cultural resources located within project buffer
Measure evaluates how much sensitive land would be affected within project buffer around the project, and rates projects highest that have minimal or no impacts.
Measures Approach
E.1 Air Quality and Energy Environmental Effect Definition
The Air Quality and Energy Environmental Effect measure describes the level of benefit that a project is projected to have on air quality and greenhouse gas emissions (or alternative energy use). The objective of this measure is to recognize projects that are expected to contribute to improvements in air quality and reductions in greenhouse gas emissions.
Data Source(s)
• Project sponsor answers defined qualifiers as described below based on project definition.
• Total project corridor passenger throughput (as determined in the congestion factor).
Methodology
Air quality and energy effect is determined by reviewing a project sponsor responses (collected through the project nomination) to the qualifications identified in Table 9.2. The methodology applies to all project types.
Step 1: The project sponsor self assesses the project based on Table 9.2 (10 point potential maximum). The nomination form includes space for the sponsor to provide clarifications/justifications for the points awarded.
53

HB2 Implementation Policy Guide
Step 2: HB2 review staff receive each project nomination and reviews the information provided. As appropriate, staff contact project sponsors to address any questions or unexplained scoring.
Table 9.2 E.1 Air Quality and Energy Environmental Effect – Scoring Approach
Project Type (Mode) and Characteristics Points (If Yes)
Project includes construction or replacement of bike facilities. For bicycle projects, off-road or on-road buffered or clearly delineated facilities are required.*
2
Project includes construction or replacement of ped facilities. For pedestrian projects, sidewalks, pedestrian signals, marked crosswalks, refuge islands, and other treatments are required (as appropriate).*
2
Project includes improvements to rail transit or passenger rail facilities.*
3
Project includes improvements to an existing or proposed park-and-ride lot. Ex. New lot, more spaces, entrance/exit, technology (payment, traveler information).*
2
Project includes bus facility improvements or reduces delay on a roadway with scheduled peak service of 1 transit vehicle per hour.*
1
Project reduces traffic delay at a congested intersection, interchange, or other bottleneck with a high percentage of truck traffic (greater than 8 percent of AADT).**
1
Project includes improvements to freight rail network or intermodal (truck to rail) facilities/ports/terminals.**
0.5
Project include special accommodations for hybrid or electric vehicles, or space or infrastructure for electric vehicle parking/charging).*
0.5
Project includes energy efficient infrastructure or fleets, including: hybrid or electric buses, LED lights and signals, electronic/open road tolling, alternative energy infrastructure (e.g., roadside solar panels).*
0.5
Total Points Possible 10 points maximum
Measure Scaling: *Points are multiplied by the number of peak period non-SOV users. **Points are multiplied by peak period truck volumes
Scoring Value
After HB2 staff review and confirm points assigned in Table 9.2, total project points are multiplied (scaled) by the number of users (for each individual mode, e.g., if the project supports pedestrian activity, how many potential pedestrians).
54

HB2 Implementation Policy Guide
E.2 Impact to Natural and Cultural Resources Definition: This measure considers the potential of a project to minimize the impact on natural and cultural resources located within the project buffer.
Data Source(s)
GIS layers for each of four categories. For cultural resources, associated non-spatial data (“Property Evaluation Status” or “Site Evaluation Status”) will be used to determine eligibility for listing in the National Register of Historic Places. For threatened and endangered species, species status will be referenced to appropriately filter the spatial data and is limited to state endangered, state threatened, federal endangered, federal threatened.
Methodology
The potential of the project to minimize impact on natural and cultural resources is conducted by considering the existing acres of sensitive areas and resources located within a ¼ mile buffer around the project, as well as the type of environmental document (EIS, EA, CE) expected to be required for the project. The score for the project will be based on a portion of acres affected relative to the total project buffer.
Step 1: Using a ¼ mile buffer around each project, total the acreage of land in four categories – 1) Conservation Land, 2) Species/Habitat, 3) Cultural Resources, and 4) Wetlands. The specific GIS layers used in each category are as follows:
Conservation Lands
• Virginia Outdoor Foundation Protected Easements
• Virginia Department of Conservation and Recreation 6F properties
• Virginia Department of Conservation and Recreation Conservation Lands
• Virginia Department of Forestry Agricultural/Forest Districts
• Virginia Department of Historic Resources Protected Easements
Species/Habitat
• Virginia Department of Game and Inland Fisheries Threatened and Endangered Species
• Virginia Center for Conservation Biology (Eagles)
Cultural Resources
• National Park Service, American Battlefield Protection Program Potential National Register (POTNR) Areas
55

HB2 Implementation Policy Guide
• Virginia Department of Historic Resources Architecture layer: properties listed in, or determined eligible for listing in the National Register of Historic Places (“Evaluation Status”)
• Virginia Department of Historic Resources Archeology layer: sites listed in, or determined eligible for listing in the National Register of Historic Places
Wetlands
• U.S. Fish and Wildlife Service National Wetlands Inventory
An example of how the acreage in each category is totaled within the ¼ mile foot buffer is shown in Table 9.3 below.
Table 9.3 E.2 Example SteStep 2: Determine the level of environmental documentation required for the federal action. This information will be used to assess and scale the potential natural resource impacts. If not already determined by the appropriate federal agency with the action, VDOT/DRPT environmental staff will determine the anticipated level of environmental documentation required for the project using the best available information. Concurrence by the federal agency is required prior to initiation of environmental documentation. The amount of potentially impacted acreage that will be counted towards the score is different based on the type of environmental document required:
• Environmental Impact Statement – 50% of acreage will be used for scoring –
• Environmental Assessment –30% of acreage will be used for scoring
• Categorical Exclusion – 10% of acreage will be used for scoring
This process of scaling acres based on the type of environmental document is illustrated in Table 9.4.
Table 9.4 Example of Potentially Impacted Acres by Type of Environmental Document
Project Conservation Species/Habitat Cultural Resources Wetlands Total Acres
A 100 25 25 150 300
Project Conservation Species/ Habitat
Cultural Resources Wetlands
Total Acres
Environmental Document
Acres
Counted
A 100 25 25 150 300 EA 100
B 100 25 25 150 300 EIS 150
C 20 0 0 5 25 CE 2.5
56

HB2 Implementation Policy Guide
Step 3: Divide the amount of potentially impacted acres by the total buffer area in acres.
Scoring Value
Points will be scaled according to the amount of potentially impacted area divided by the total buffer area. This ratio will be normalized on a 0 to 100 scale, with the projects having the smallest proportional acreage potentially impacted receiving 100 points.
57

HB2 Implementation Policy Guide
10.0 Appendix E: Economic Development Measures Table 10.1 Economic Development Factor – Measures Summary ID Measure Name Weight Measure Description Measure Objective
ED.1 Project Support for Economic Development
60% Project consistency with regional and local economic development plans and policies and support for local development activity
The intent of this measure is to assess if the project is supporting new and existing economic development and the progress made toward development in the project corridor at the local level. Progress will be assessed through use of a checklist of desired actions.
ED.2 Intermodal Access and Efficiency
20% Rate projects based on the extent to which the project is deemed to enhance access to critical intermodal locations, interregional freight movement, and/or freight intensive industries.
The intent of this measure is to assess the: Level to which the project enhances access to distribution centers, intermodal facilities, manufacturing industries or other freight intensive industries; Level to which the project supports enhanced efficiency on a primary truck freight route (or high volume/ high value truck or rail freight corridor); Level to which the project enhances access or reduces congestion at or adjacent to VA ports/ airports
ED.3 Travel Time Reliability 20% Improvement in travel time reliability attributed to the project
The intent of this measure is to determine the project’s expected impact on improving reliability which supports efforts to retain businesses and increase and economic activity.
Measures Approach
ED.1 Project Support for Economic Development Definition: Assessment of project based on sponsor input regarding the project support of economic development priorities as stated in jurisdiction/ MPO/PDC/other regional plans; as well as steps achieved toward specific developments, zoning actions, and utility provisions for specific economic development sites supported by the project. Progress will be assessed through use of a checklist of desired actions.
58

HB2 Implementation Policy Guide
Data Sources: Project description and supporting information provided by the project sponsor.
Methodology: The focus of this measure is on project consistency/support of local/county/PDC/regional economic development plans and support of real, planned non-residential development (residential only developments are not considered) within the project corridor (what is included in the project corridor is clarified in steps below). Project assessment is based on the use of a checklist, which is shown in Table 10.2 below. Validation (a brief narrative) of the existence of the actions in the checklist is included as part of the project nomination. The project would be awarded up to 1 point for each question below, points are summed. Detail to support development of a response to each question follows Table 10.2.
Table 10.2 ED.1 - Project Support for Economic Development – Scoring Approach
Rating Description Points Value
Transportation project consistency with local Comprehensive Plan or local Economic Development Strategy
Consistent with: 0.5 Referenced in: 1
Transportation project consistency with Regional Economic Development Strategy Consistent with: 0.5 Referenced in: 1
Development project consistent with local comprehensive plan’s (future land use or zoning map, and or zoning code/ordinance
Consistent with: 0.5 Referenced in: 1
Development project site plan status Submitted: 0.5 Approved: 1
Development project site utilities status (sewer/water, broadband, etc…) Programmed: 0.5 In place: 1
Total (maximum points in rows above) 5
Measure Scaling: Points are multiplied by development building square footage (does not include residential-only property) near the project. Suggested distance within 1 mile. Square footage is discounted by the following:
Project provides primary access to the site or is adjacent to the site 100% of sq. footage
Project enhances access in the vicinity of the site but is not physically adjacent 50% of sq. footage
Development sites that are greater than 1 mile away < 50% of sq. footage is counted based on distance
Guidance for Questions 1-5:
Question 1 guidance: To determine whether a project is consistent with local Comprehensive Plan or local Economic Development Strategy, the project sponsor should conduct the following steps:
Step 1: Identify the local Comprehensive Plan or local Economic Development Strategy for the geographic area in which the transportation project is proposed (the strategy or goals may be found in a stand alone document or as part of another document, such as a comprehensive plan).
59

HB2 Implementation Policy Guide
Step 2: Review the goals, objectives and strategies noted in the document(s).
Step 3: Review the document to determine if the proposed transportation project is specifically cited in the document(s) as a key project desired to support local/regional economic development.
Step 4: Award points to the proposed project as follows:
• If the proposed transportation project is specifically mentioned as a key project in at least one of the local Comprehensive Plan or local Economic Development Strategy documents, the project is considered “referenced in,” and is awarded 1 pt.
• If the proposed transportation project clearly supports an economic development objective or strategy, that project is considered “consistent” and is awarded 0.5 pts.
Question 2 guidance: To determine whether a project is consistent with the Regional Economic Development Strategy, the project sponsor should conduct the following steps:
Step 1: Identify the Regional Economic Development Strategy for the geographic area in which the transportation project is proposed (the strategy or goals may be found in a stand-alone document or as part of another document).
Step 2: Review the goals, objectives and strategies noted in the document(s).
Step 3: Review the document to determine if the proposed transportation project is specifically cited in the document(s) as a key project desired to support local/regional economic development.
Step 4: Award points to the proposed project as follows:
• If the proposed transportation project is specifically mentioned as a key project in the Regional Economic Development Strategy, the project is considered “referenced in,” and is awarded 1 pt.
• If the proposed transportation project clearly supports an economic development objective or strategy, that project is considered “consistent” and is awarded 0.5 pts.
Question 3 guidance:
To determine whether each development site (do not include residential only developments) within the project corridor (1 mile buffer) is consistent with the local Comprehensive Plan future land use or zoning map, and or zoning code/ordinance, the project sponsor should conduct the following steps:
Step 1: Identify the local Comprehensive Plan future land use or zoning map, and the zoning code/ordinance for the geographic area in which the transportation project is proposed.
Step 2: Review future land use or zoning map and or zoning code/ordinance for the project area.
60

HB2 Implementation Policy Guide
Step 3: List each development site within 1 mile of the project corridor (do not include residential only developments) and for each, provide the projected square footage and distance from the project corridor.
Step 4: Award points to the proposed project as follows:
• If the development project is specifically mentioned as a key project in the local comprehensive plan, the project is awarded 1 pt.
• If the development project is considered “consistent” with the local comprehensive plan (future land use or zoning map) and or zoning code/ordinance, it is awarded 0.5 pts.
Question 4 Guidance:
To assess each development project’s site plan status, review the jurisdiction information regarding development review and approval of development projects adjacent to the project corridor (for the same set of development projects identified in Question 3).
• If the site plan has been “approved,” (or the equivalent, dependent upon local terminology), by the jurisdiction, the project should be awarded 1 point.
• If the site plan has the status of “submitted,” the project receives 0.5 points.
Question 5 Guidance:
To assess each development project site’s utility provision status (for the same set of development projects identified in Question 3), the local jurisdiction information regarding utility systems and provision, including current and planned utilities, should be reviewed.
• If the development project site has utilities (sewer/water, broadband, etc…) that have been programmed, the project receives 0.5 points.
• If the development project site has utilities (sewer/water, broadband, etc…) that are in place, the project receives 1 point.
Scoring Value
The total points from Table 10.2 above are multiplied (scaled) by the proposed or projected square footage of each development to reflect the magnitude of the development supported by the transportation project.
Measure Scaling: Points are multiplied by the proposed or potential development building square footage (does not include residential-only property) near the project. Suggested distance within 1 mile.
Step 1: Award Points to each development using the checklist in Table 10.2. (ED.1 Economic Development Support – Scoring Approach)
61

HB2 Implementation Policy Guide
Step 2: Determine total square footage: acquire the proposed or potential development building square footage (does not include residential-only property) near the project.
Step 3: Next adjust for provision of access as shown in Table 10.3 below to calculate the adjusted square footage value.
Table 10.3 Adjustment for Provision of Access
Project provides new direct access to the site or improves existing access to the site (site must be physically adjacent to the project)
Project enhances economic development by improving congestion, mobility, access, or operations in the vicinity of the site but the site is not physically
adjacent to the project
Multiply by 1 Multiply by 0.5
Step 4: Next, results of Step 3 are adjusted for distance from the project:
For any development sites that are greater than 1 mile away, the adjusted square footage value must be divided by the distance in miles. See the example in Table 10.4 for illustration of this calculation.
Step 5: Finally, the points awarded in Step 1 are factored by the adjusted square footage value to obtain the project score.
Table 10.4 Sample Calculation for Adjusting Square Footage of Development
Development
Development Square Footage
Project provides
direct access
Distance in miles from the project Calculation
Adjusted Square
footage value
Development 1 30,000 No 0.5 miles 30,000*0.5 15,000
Development 2 20,000 No 2 miles (20,000*0.5)/2 5,000
Development 3 12,000 Yes 0.1 miles N/A 12,000
Development 4 24,000 No 3 miles (24,000*0.5)/3 4,000
Total 86,000 N/A 36,000
ED.2 Intermodal Access and Efficiency Definition: Measure rates each project based on the extent to which the project is deemed to enhance access to critical intermodal locations and/or freight intensive industries and supports increased efficiency for freight movement in congested corridors.
62

HB2 Implementation Policy Guide
Data Sources:
• Project description and supporting information provided by project sponsor
• Project description, if applicable, in the Virginia Multimodal Freight Study (2014)
• STAA Truck Routes and Restrictions8
Methodology
Project description will be reviewed and assessed based on the extent to which the project is deemed to enhance access to critical intermodal locations and/or freight intensive industries and supports increased efficiency for freight movement in congested corridors.
Points are assigned through a qualitative assessment of the project description and supplementary information submitted by the project sponsor. Flexibility is provided in the project nomination for sponsors to describe the manner in which the project is expected to enhance access to critical intermodal locations, interregional freight movement, and/or freight intensive industries and supports increased efficiency for freight movement in congested corridors. The project rating is based on the extent to which the project is deemed to enhance access to critical intermodal locations, freight networks, and/or freight intensive industries and supports increased efficiency for freight movement in congested corridors.
This comparison supports a determination of the level of economic enhancement on a 0 to 6 scale as summarized in Table 10.7.
8 http://gis.vdot.virginia.gov/vatruckweb/VaTruckRestrictions.aspx
63

HB2 Implementation Policy Guide
Table 10.7 - Intermodal Access and Efficiency – Scoring Approach Rating Description Value
1. Level to which the project enhances access to existing or planned distribution centers, intermodal transfer facilities (excluding ports and airports), manufacturing industries or other freight intensive industries
Project provides direct access (within 1 mile) to existing or planned locations 2
Project provides indirect access (greater than 1 mile, less than 3 miles) to existing or planned locations
1
No direct or indirect access 0
2. Level which the project supports enhanced efficiency on a primary truck freight route
Project is on the designated STAA National and Virginia Network or a STAA Virginia Access Route9
2
Project directly connects to designated STAA National and Virginia Network or a STAA Virginia Access Routes
1
Project is not on and does not connect to the designated STAA National and Virginia Network 0
3. Level to which the project enhances access or reduces congestion at or adjacent to Virginia ports or airports
Project provides direct access to (within 1 mile) existing or planned ports or airports (measured from designated entry gates to port or air cargo facilities)
2
Project provides indirect access to (greater than 1 mile, less than 3 miles) existing or planned ports or airports (measured from designated entry gates to port or air cargo facilities)
1
No direct or indirect access 0
Total (sum of score) 0 – 6
Scoring Value
Total points received based on the assessment in Table 10.7 are multiplied (scaled) by total freight tonnage within the project corridor.
ED.3 Travel Time Reliability Definition: Change in travel time reliability attributed to the project.
Data Source(s)
• Five years of crashes (anticipated 2010 – 2014) from VDOT Roadway Network System (RNS) GIS data maintained by Traffic Engineering Division.
• Buffer index (BI) from I-95 Corridor Coalition/University of Maryland Regional Integrated Transportation Information System.
• Weather information from VDOT VATraffic database.
• AASHTO Highway Safety Manual (HSM), 2010
9http://gis.vdot.virginia.gov/vatruckweb/VaTruckRestrictions.aspx
64

HB2 Implementation Policy Guide
Methodology
The methodology to compute travel time reliability for a project is a quantitative, corridor-based analysis with two components: impact and frequency. Impact is defined as the ability of a project to reduce the impact of the four contributors for unreliable travel time:
• Highway incidents
• Weather events
• Work zones
• Capacity bottlenecks
Since other HB2 measures account for the impacts of work zones and capacity bottlenecks, only the impacts of highway incidents and weather events will be accounted for in the computation of travel time reliability.
Frequency is defined as the likelihood of unanticipated delays due to highway incidents and weather events. Estimates of frequency are based on segment data for incidents and weather.
For each project, VDOT will compile information to compute five factors to be used in evaluating the reliability of the proposed project:
• Buffer index (BI)
• Incident impact
• Incident frequency
• Weather impact
• Weather frequency
The buffer index is defined as the extra time travelers should add to average travel times to ensure on-time arrival. This index is expressed as a percentage of the average time. A buffer index of 0.20 means that a travelers needs to increase their time cushion by an extra 20% from the average travel time. This index value is computed by dividing the difference between the 95th percentile travel time and mean travel time by the mean travel time for a segment. For long corridors, the index is averaged using a weighted factor based on VMT.
The methodology to compute travel time reliability for roadway projects is defined in the following steps:
Step 1: Determine the impact of incidents on the network. The effectiveness of the project to reduce the impact of incidents within the project study area will be based on the type of project. Table 1 present the impact values of both roadway and transit projects. Project types that are most effective at reducing the impacts of incidents will receive the highest scores as identified in the following scoring criteria:
65

HB2 Implementation Policy Guide
2: Projects directly improving incident frequency and duration (e.g., interchange improvements, truck run-away ramps, queue warning)
1: Projects improving incident management response (e.g., traveler information systems, location signs, reversible lanes)
0: No impact
While most projects provide one benefit in incident reduction per the project type listed in Table 1, there are complex projects that provide more than one benefit. For those projects, the total score of the impact of incidents is found by adding the maximum value of one benefit (i.e., 1 or 2) to 10% of the value of the remaining benefits. For example, if a project adds a travel lane and a truck runaway ramp, its score is 2 (travel lane) + 10%x 2 (truck runaway ramp) = 2.2
Step 2: Determine the frequency of crashes using historical crash data. VDOT will compile the latest 5 years of crashes within the project limits. An Equivalent Property Damage Only (EPDO) value is obtained through data from the Virginia Traffic Records Electronic Data System. EPDO will be used as a surrogate measure to determine the frequency and duration of incidents, since more severe crashes will typically cause a longer traffic disruption. The EPDO equates injury and fatal crashes to property damage only crashes, thus reflecting the severity. Project types that are most effective at reducing the frequency and severity of incidents will receive the highest scores as identified in the following scoring criteria:
5: EPDO greater than 300
4: EPDO between 200 and 300
3: EPDO between 125 and 200
2: EPDO between 75 and 125
1: EPDO between 25 and 75
0: EPDO less than 25
Step 3: Determine the impact of weather events. The effectiveness of the project to reduce the impact of weather within the project study area will be based on the type of project. Project types that are most effective at reducing the impacts of weather will receive the highest scores as identified in the following scoring criteria:
2: Projects directly mitigate weather impacts by geometric improvements or end-to-end detection or warning systems
1: Projects that contain a component of an end-to-end detection or warning system or mitigate the event (e.g., improved detour routes, expanded transit operations)
0: No impact
66

HB2 Implementation Policy Guide
While most projects provide one benefit in mitigating weather events per the project type listed in Table 1, there are complex projects that provide more than one benefit. For those projects, the total score of the impact of weather events is found by adding the maximum value of one benefit (i.e., 1 or 2) to 10% of the value of the remaining benefits. For example, if a project adds a bridge heating system and a reversible lane, its score is 2 (bridge heating system) + 10%x 1 (reversible lane) = 2.1
Step 4: Determine the frequency of weather events using historical weather data. VDOT will compile 3 years historical weather data within the project limits. The magnitude of weather events will be determined from historical data and scores will be assigned according to the following criteria:
2: More than 40 hours of combined moderate/severe snow events and flood events per year
1: Between 20 and 40 hours of combined moderate/severe snow events and flood events per year
0: Less than 20 hours of combined moderate/severe snow events and flood events per year
Step 5: Compute the buffer index of the roadway. The Regional Integrated Travel Information System (RITIS), offered through VDOT’s participation with the I-95 Corridor Coalition provides a tool to calculate the buffer index. The RITIS system can provide the buffer index for all interstates and most primary routes. For other routes in developed areas, the buffer index from a nearby point can be submitted or manually calculated if data is available. For remote locations, it can be assumed that the buffer index is zero if no congestion or reliability issues are observed.
Step 6: Compute the travel time reliability measure. To compute travel time reliability, add the product of the incident impact (from Step 1) and the incident frequency (from Step 2) to the product of the weather impact (from Step 3) and the weather frequency (from Step 4), then multiply this result by the buffer index (from Step 5).
The methodology to determine travel time reliability for transit, and TDM (including park and ride lots) use this defined process as they are include as project impacts in Table 10.8. Bicycle/pedestrian projects are not applicable.
Scoring Value
Travel time reliability index.
67

HB2 Implementation Policy Guide
Table 10.8 Incident, Weather and Work Zone Impact Scoring
Major Project Type Sub Project Type Incidents
Impact Weather Impact
Median Design Emergency crossovers, Controlled/Gated turnaround 2 1
Moveable traffic barriers 0 1
Movable cable median barrier 1 1
High median barriers 1 0
Traversable medians 1 0
Accessible/widen shoulder to 10 ft 2 1
Shoulder Design Drivable shoulder to 11-12 ft 2 1
Hard shoulder running/Dynamic shoulders 2 1
Emergency pull-offs/Turnouts, Crash investigation sites
2 0
Bus turnouts 0 0
Ramps Design and Use Ramp widening (All lanes) 2 1
Ramp closure (time of day) 1 1
Off-ramp terminal traffic control 2 0
Ramp turn restrictions (time of day) 0 0
Truck Incident Design Runaway truck ramps 2 0
Travel Lanes Design Add travel lanes 2 1
Interchange modifications – ramps 2 1
Intersection modifications – turning lanes 2 1
Animal-Vehicle Collision Wildlife fencing over/underpass 1 0
Lane Types and Use Contra-flow lanes – (no-notice evacuation will be scored w/ weather)
0 2
Adding HOV lanes / HOT lanes 2 1
Dual facilities (bypass lanes) 2 1
Reversible lanes 1 1
Lane reconfigurations to improve capacity or improve safety (static change, i.e., lane stripes)
1 0
Traffic Signals Emergency vehicle traffic signal improvements 2 0
Signal timing systems 1 0
Active Traffic Mgmt Dynamic ramp metering / flow signals 1 1
Variable speed limit / reduction 2 2
Connected Vehicle System integration 2 2
Over-height vehicle detection system 2 0
Truck roll over warning 2 0
Queue warning 2 0
Integrated Corridor Management (alt routes/modes) 1 1
68

HB2 Implementation Policy Guide
Dynamic lane merging 1 0
Tolling Converting to all electronic tolling 1 0
Weather Fog detection warning system 0 2
RWIS 0 2
Flood warning systems / Wind warning systems 0 2
Bridge heating systems / Anti-icing 0 2
Drainage improvements 0 2
Incident Management Incident clearance – pre staged incident response, incentive based towing, emergency relocation programs
2 0
Safety Service Patrol 2 1
Improvements to detour routes 2 1
Reference location signs 1 0
Incident detection / CAD integration 2 0
Traffic Demand Management
Park and Ride Lots 0 0
Traveler Information/ Travel Time Information: DDMS 1 1
Transit Additional trains on existing rail lines 0 1
New rail lines 0 1
New rail station / intermodal connection 0 1
Transit AVL – Traveler Information 0 0
Shorter headway 0 0
New bus route 0 1
Larger bus capacity 0 0
Additional bus stops 0 0
69

HB2 Implementation Policy Guide
11.0 Appendix F: Land Use Coordination Measure Table 11.1 Land Use Factor – Measure Summary ID Measure Name Weight Measure Description Measure Objective
L.1 Future Land Use Policy Consistency
100% Project support for mixed-use development with multimodal choices, in-fill development, and corridor access management policies
The intent of this measure is to determine degree to which the project and adjacent future land use will help achieve goals for support transportation- efficient land use patterns and local policies.
Measures Approach
L.1 Future Land Use Policy Consistency Definition: Measure reports the project consistency with policies and planning activities that support land use and transportation planning coordination. The approach is consistent for bicycle, pedestrian, transit, roadway and multimodal projects. The VDOT Transportation Efficient Land Use and Design Guide, VDOT Access Management Policies, and the Commonwealth’s Multimodal System Design Guide are good resources to understand the objectives and scoring details of this measure.
Data Sources: Project Application. Proposed/planned development listed in measure ED.1.
Methodology: Projects applications should indicate the project’s ability to address the policy and planning criteria listed in Table 11.2. A project is assessed for how well the project (or region that the project is in) addresses the land use evaluation questions. With the exception of the question regarding in-fill development, points are assessed based on yes/no responses to the qualitative questions. VDOT staff will review the project application against these criteria to confirm consistency. See the guidance provided for specific steps and resources to support response to the evaluations questions in Table 11.2.
70

HB2 Implementation Policy Guide
Table 11.2 Land Use Policy Consistency/Transportation-Efficient Land Use Support
Policy and Planning Criteria
Points (up to 1 per
question)
1. Does the project promote walkable/bicycle friendly, mixed-use development? 2
2. Does the project promote in-fill development? 2
3. Is there a locally/regionally adopted corridor/access management plan for the project area that addresses interparcel connectivity and exceeds VDOT’s minimum spacing standards?
1
Total (maximum points in rows above) 5
Measure Scaling: Points will be multiplied by the activity density of the area surrounding the project. (1-mile buffer)
Scoring Value
Within the application process, sponsors self assign points and provide associated documentation and rationalization for the point assessment. HB2 staff will review the application details and clarify information with sponsors as necessary. Total points received based on the assessment in Table 11.2 are multiplied (scaled) by the activity density of the area within the one-mile buffer surrounding the project.
Specific steps and resources to support response to the evaluations questions in Table 11.2: 1. Does the project promote walkable/bicycle friendly, mixed-use development?
Point are awarded based on responses to the questions below.
Step 1: Is the project buffer area zoned for, or indicated on future land use maps, as “mixed use,” or the equivalent.
• If “no” then 0 points are awarded to this criteria.
• If “yes,” then points are awarded as shown in Step 2.
Step 2: Based on the project description of the proposed project, please respond to the following questions
• Does the project add or improve pedestrian or bicycle facilities and/or operations? (Yes, 1 point, No, 0 points)
• Does the project add or improve transit facilities and/or operations? (Yes, 1 point, No, 0 points)
The applicant may receive a maximum of two points.
To support the applicant response, more information about the types of projects that would be appropriate for “yes” responses is provided below, please use this information to assess the project and the land use at/adjacent to the project.
71

HB2 Implementation Policy Guide
Assessment of a Project or Project Component
To assess if the project “enhances a walkable/bicycle friendly environment” the guide provides the following examples of project types below:
• Bicycle and pedestrian facilities. Does the project incorporate facilities to improve bicycle and pedestrian mobility and safety? For example, bicycle projects could include off-road or on-road buffered or clearly delineated facilities. Pedestrian projects examples might include pedestrian signals, marked crosswalks, refuge islands, and other treatments are required (as appropriate). For more information, you may also refer to DRPT Multimodal System Design Guidelines, Chapter 6 “Key Intersection Elements for Transit, Pedestrians and Bicyclists”10
• Multimodal street improvements. Projects that improve the grid of streets by adding a new street to shorten blocks, or alter a major roadway to a boulevard design. For more information, you may also refer to DRPT Multimodal System Design Guidelines and the associated VDOT Appendix B(2) “Multimodal Design Standards for Mixed-Use Centers”11
• Transit center or facility improvements at or adjacent to mixed-use development.
Assessment of “Mixed Use Development” Status To confirm that the proposed project is within or directly adjacent to a place zoned for mixed use development, please follow the steps below:
Step 1: Draw a ¼ mile buffer around the project boundaries.
Step 2: Review the existing zoning and planned land use: Is any of the land within the buffer drawn in Step 1 above currently zoned as mixed use or does the future land use plan for the jurisdiction identify any of the land within the buffer as planned mixed-use development?
2. Does the project promote in-fill development?
Does the project support local/regional redevelopment or in-fill development?
“In-fill development” includes development or redevelopment that occurs on an underutilized or vacant tract of land encompassed by a larger area that is mostly developed. For example, in-fill development might include the construction of a new building in a small town center on a parcel that was previously vacant. Another example might be construction a development on a parcel that was previously a surface parking lot in an urban center. Examples of development that should not be included as in-fill include
10 http://www.drpt.virginia.gov/media/1055/drpt_mmsdg_final_full.pdf 11
http://www.extranet.vdot.state.va.us/locdes/Electronic_Pubs/2005%20RDM/AppendB(2).pdf
72

HB2 Implementation Policy Guide
development projects on “greenfields” (large tracts of undeveloped land), projects that require expansion of the service utility area, and projects that are to be built in areas that are largely undeveloped.
To respond to this question, please assess the planned or proposed projects identified and used for calculation in the Economic Development measure 1 (ED.1) to determine if these projects are in-fill projects. In addition, please consider planned or active residential in-fill development projects (these are excluded from ED.1). Points are awarded based on whether or not there is in-fill development, and if that development is active or planned development.
If the In-fill projects described in ED are:
• Active: 2 points
• Proposed: 1 points
3. Is there a locally/regionally adopted corridor/access management plan for the project area that addresses interparcel connectivity and exceeds VDOT’s minimum spacing standards?
Yes, 1 points. No, 0 Points. For more information on VDOT’s minimum entrance spacing standards, see Appendix F of the Virginia Road Design Manual.
Corridor access management plans offer flexibility in the application of the access management regulations and standards to meet the special needs of different areas of the state. In addition to entrance spacing, corridor/access management plans should include recommendations for cross-parcel access, shared entrances. These plans may also establish a network of parallel roadways to the main corridor that would serve to divert traffic. The plans may include recommendations regarding turn lanes, limiting entrance movements, signal synchronization, closing median crossovers and locations for new median crossovers.
Scaling
To calculate activity density, a one-mile buffer will be drawn (by HB2 staff) around the project. The projected future employment for the horizon year will be added to the projected future population for the horizon year, the sum is then divided by the square mileage within the buffered area.
Activity Density =
projected future employment + projected future population
acres within the buffered area
73

HB2 Implementation Policy Guide
12.0 Appendix G: Application Guide
74

report
HB2 Application Guide
prepared for
Commonwealth Transportation Board
date
August 1, 2015


HB2 Application Guide
i
Table of Contents 1.0 Introduction ............................................................................................................ 4
1.1 Purpose of this Document ............................................................................ 4
1.2 Overview of the HB2 Prioritization Process .............................................. 4
1.3 Application ..................................................................................................... 5
1.4 Schedule/Deadlines ...................................................................................... 6
1.5 Application Assistance .................................................................................. 7
2.0 General Project Information ................................................................................ 9 2.1 Applicant Information .................................................................................. 9
2.2 Type of Improvement ................................................................................... 9
2.3 Project Description ...................................................................................... 10
2.4 VTrans2040 Need ......................................................................................... 11
2.5 Project Location ............................................................................................ 12
3.0 Evaluation Factor Inputs..................................................................................... 13 3.1 Safety and Congestion ................................................................................ 13
3.2 Accessibility .................................................................................................. 13
3.3 Environment ................................................................................................. 14
3.4 Economic Development .............................................................................. 14
3.5 Land Use and Transportation Coordination ........................................... 18
4.0 Project Delivery and Funding ........................................................................... 23 4.1 Planning Status ............................................................................................ 23
4.2 Project Administration ................................................................................ 23
4.3 Phase and Schedule ..................................................................................... 23
4.4 Cost Estimate ................................................................................................ 26
4.5 Funding Sources .......................................................................................... 26
5.0 Attachment: Pre-Application Form ................................................................. 29


HB2 Application Guide
Cambridge Systematics, Inc. iii
List of Tables Table 1.1 VDOT Representatives: Highway Projects ............................................. 8
Table 1.2 DRPT Representatives Transit/Rail Projects ............................................. 8
Table 2.1 Examples of Project Scope Description .................................................. 10
Table 3.1 A.3 – Access to Multimodal Choices Applicant Information ................. 13
Table 3.2 E.1 – Air Quality and Energy Environmental Effect Applicant Information .................................................................................................. 14
Table 3.3 ED.1 – Project Support for Economic Development Applicant Information .................................................................................................. 15
Table 3.4 ED.1 – Project Support for Economic Development, Summary of Project Inputs ........................................................................................ 18
Table 3.5 L1 – Land Use Policy Consistency/Transportation-Efficient Land Use Support Applicant Information ................................................ 19
List of Figures Figure 2.1 Example of Project Sketch ........................................................................ 11

HB2 Application Guide
4
1.0 Introduction
1.1 PURPOSE OF THIS DOCUMENT The purpose of the Application Guide is to provide detailed information on the HB2 application process and inputs needed for project screening and scoring. A copy of the pre-application coordination form is attached to this guide and is available for download. Applicants can use this worksheet to compile all data and information necessary to complete the online application. This pre-application form may also be used to discuss project-related application questions and share compiled data to be used for the application. The Application Guide gives an overview of key inputs needed to complete the application to assist in this process.
1.2 OVERVIEW OF THE HB2 PRIORITIZATION PROCESS HB2 requires the Commonwealth Transportation Board (CTB) to develop and implement a quantifiable and transparent prioritization process for making funding decisions for capacity and safety-enhancing projects within the Six-Year Improvement Program (SYIP). The HB2 Policy Guide provides the background and details of the methodology for implementing the prioritization process.
Candidate projects will be solicited from eligible entities beginning in August of each year, with project applications due September 30th. From there, the Office of Intermodal Planning and Investment (OIPI), Virginia Department of Transportation (VDOT), and Department of Rail and Public Transportation (DRPT) staffs will screen, review, and evaluate the projects per the HB2 process from October through early January. By mid-January, the list of projects and scores will be released to the public and the CTB, allowing the CTB to consider the evaluated project lists for inclusion in the SYIP. In April, the draft SYIP will be released by the CTB, followed by public hearings to gather input. In June, the revised final SYIP will be released and considered for adoption by the CTB. The following July, the next year’s process begins again.
The HB2 application, screening, and project evaluation and scoring methods will be reviewed and potentially updated on an annual basis. This review will consider the availability of new analysis tools or data and general feedback from project applicants, the HB2 review team, and the CTB on the overall strengths and weaknesses of the entire process.
More information can be found at the following website: http://virginiahb2.org.

HB2 Application Guide
5
1.3 APPLICATION A pre-application coordination form is available for potential applicants to download and print prior to submitting application information online. The purpose of this form is to provide the potential applicants with a clear understanding of the information and data that will be required for submission in the online application.
Once the applicant is ready to submit, the online application can be completed and submitted via the following website:
http://www.virginiahb2.org/
Eligible entities must identify a staff person to serve as the Administrator for the online HB2 application system.
Designated Administrators will be provided login credentials via email. If the Administrator experiences any problems they should submit an email to [email protected].
For the online application, visit the link provided at http://www.virginiahb2.org/. Those that have completed the pre-application coordination form may transfer the information and data from the document in to the on-line application..
Note: The organization Administrator and Submitter will receive and email confirmation that the application submission has been received.
Applicants will be required to provide the following information when submitting a project:
Point of contact – Metropolitan Planning Organization (MPO), Planning District Commission (PDC), or locality (county, city, or town) project specific contact. This person will be contacted by OIPI, VDOT, or DRPT with any questions on the content of the application during the screening and scoring process.
Who will administer project? – The project applicant should confirm with VDOT or DRPT prior to submission if the project is to be locally administered. This impacts the role of the applicant and VDOT or DRPT in developing project cost estimates.
Project priority (if submitting more than one) – If the applicant is submitting more than one project, they must rank each project in priority order. During the evaluation process, VDOT and DRPT will evaluate the highest ranked priority projects first.
Detailed project description/scope – The scope should define the limits of the project, its physical and operational characteristics, and physical and/or operational footprint (see details in Section 2).

HB2 Application Guide
6
Project sketch (see Section 2.3 for an example), or operational transit routes or rail-line maps.
Project status, cost estimate and duration by phase – Cost estimate should be as realistic as possible – considering known information and should account for possible risk and contingencies. Anticipated schedule should be realistic and reflect complexity of project and identify phase durations (PE, RW, CN or other entered milestones). Please refer to the details presented in Section 4.
Measure information related to Accessibility, Economic Development, Environment, and Land Use factors
Amount of HB2 funding requested – The cost estimate reflects to total implementation cost for the project. This input details the total project cost share to be covered by HB2 funding.
Description of any non-HB2 funding committed to project– – For the remainder of project funding, the applicant should describe the funding sources involved.
Any applicable supporting documents (local resolutions, plans, studies, etc.) beyond the documents required in the information above can also be uploaded. The more relevant information provided for a project, the more robust and efficient the scoring process. Note, however, providing the succinctly relevant portions of reports rather than the entire document is preferred.
Additional information on the specific information required to complete an application is contained in this Application Guide.
Ultimately the final application for each project must be submitted prior to the September 30th deadline. A key guiding theme in developing the application was that it should not require applicants to invest significant time and resources for submission of project information, or require the use of consultants to develop an eligible application. VDOT and DRPT staff will be available to provide support and tools for applicants in compiling data and information needed for application. For more information on who can submit an application, please see Table 2.1 of the HB2 Policy Guide.
1.4 SCHEDULE/DEADLINES The application and evaluation process timeline for the first HB2 implementation cycle includes:
July – Early coordination with DRPT and VDOT prior to application submissions.
August 1 – Call for applications and notification of estimated amount and types of funding available.
August through September – Applicants coordinate with DRPT staff and VDOT District staff on candidate projects and submit applications.

HB2 Application Guide
7
September 30 – Applications due. All applications will be made public after the deadline to submit has passed. Applications may be edited after they are submitted up until the end of the application period, September 30, 2015. No additional information may be submitted after September 30, 2015 for consideration in this HB2 Cycle, except that resolutions of support from relevant entities may be submitted to [email protected] up until December 1, 2015.
If the project is submitted to promote a locally designated growth area with a code reference to the Code of Virginia (§15.2-2223.1), the project applicant submitter must confirm with OIPI prior to October 1st the validity of the code reference or the status of the designated Urban Development Area in the jurisdiction’s current comprehensive plan.
October through January – Submitted projects are screened and evaluated by OIPI, VDOT and DRPT.
Mid-January – Results of HB2 screening/scoring presented to CTB and public.
February through June – HB2-funded projects will follow existing public comment period and SYIP approval process.
1.5 APPLICATION ASSISTANCE For highway projects, localities should work initially with the VDOT RA/RE, and regional entities (MPOs/PDCs) should work with the PIM/DPM to address questions and compile information. Depending on the project, district resources will be made available to assist with refining project scopes, schedules, and estimates. These resources may include the District Project Development Engineer (PE Manager), District Bridge Engineer, District Construction Engineer, Regional ROW Manager, District Traffic Engineer/ Operations, and District Planning Manager (DPM).
A list of VDOT and DRPT contacts is shown in Table 1.1 below and will also be available through the on-line application.

HB2 Application Guide
8
Table 1.1 VDOT Representatives: Highway Projects VDOT District Representative Phone Email Address
Bristol Donny Necessary 276-669-9956 ex. 256
Culpeper Dan Painter 540-829-7687 [email protected]
Fredericksburg Allison Richter 540-899-4103 [email protected]
Hampton Roads Dawn Odom 757-925-1581 [email protected]
Lynchburg Rick Youngblood 434-856-8331 [email protected]
Northern Virginia Andy Beacher 703-259-2239 [email protected]
Richmond Mark Riblett 804-524-6151 [email protected]
Salem Michael Gray 540-375-3565 [email protected]
Staunton Terry Short 540-332-9057 [email protected]
For transit and rail projects applicants should work with the applicable DRPT Project Manager, listed in Table 1.2 below:
Table 1.2 DRPT Representatives Transit/Rail Projects
DRPT Project Manager Representative Phone Email Address
Rail Jeremy Latimer 804-225-4016 [email protected]
Transit (Central) Patrice Strachan 804-786-7940 [email protected]
Transit (Hampton Roads) Steven Hennessee 804-225-4157 [email protected]
Transit (Southwest) Neil Sherman 804-786-1154 [email protected]
Transit (NoVa) Todd Horsley 703-259-2117 [email protected]

HB2 Application Guide
9
2.0 General Project Information Projects submitted as candidates for HB2 funding will be held to a basic standard of development to assure that they can be evaluated reliably. VDOT and DRPT intend to provide support to project submitters prior to entering applications to help applicants understand and meet expectations. Project applicants are encouraged to initiate coordination with VDOT and DRPT staff prior to the application period to ensure that candidate projects are adequately developed.
Certain projects that are based on conceptual planning-level recommendations and have not been formally scoped or defined, may require additional planning/pre-scoping level work before their benefits can be adequately assessed according to the HB2 factors and measures. Planning and pre-scoping resources exist within VDOT, DRPT, localities, regional planning bodies, and some other entities (e.g., SPR, PL, Pre-scoping, FTA 5303, FTA 5304, etc.). However, resources are unlikely to be sufficient to fund every potential request for assistance for project development related to the HB2 process. In these cases, VDOT/DRPT may recommend to applicant the need for additional study prior to HB2 submittal.
2.1 APPLICANT INFORMATION Non-profit public transportation agencies, and regional entities (Metropolitan Planning Organizations (MPO), the Northern Virginia Transportation Authority, and Planning District Commissions (PDCs)) are eligible to submit projects, along with counties, cities, and those towns that maintain their own infrastructure. A summary of the entities eligibly to submit projects for HB2 is presented in Table 2.1 of the HB2 Policy Guide.
In addition to the applicant name, the application will request a Project Point of Contact. This person should be able to provide general project information, particularly during the pre-application phase when questions about the project’s completed level of planning are being addressed.
2.2 TYPE OF IMPROVEMENT Highway, bus and rail transit, freight rail, road, operational improvements and transportation demand management projects and strategies will be considered. In the Pre-Application Coordination Form, the applicant will be asked to main or primary intent of the project. In addition, the Project Improvements section of the application provides a list of types of improvements that are associated with the project application.

HB2 Application Guide
10
For more information on project eligibility, please see the HB2 Policy Guide: Section 2, Project Eligibility and Application Process; Section 4, Project Evaluation and Rating; and, Section 5, CTB Prioritization and Programming.
2.3 PROJECT DESCRIPTION Projects submitted must have a clear scope, schedule, and budget. The Project Description should provide specific details of the proposed project and associated improvements, and describe the specific improvements and their location. The Project Description field in the on-line application has a 2,000 character limit.
More information will need to be provided regarding the phasing, schedule, and cost estimate in the section of the application titled Project Delivery/Funding.
At a minimum, the scope should define the limits of the project, its physical and operational characteristics, and physical and/or operational footprint.
Examples of adequate and inadequate scope descriptions are shown in Table 2.1.
Table 2.1 Examples of Project Scope Description Adequate Scope/Description Inadequate Scope/Description
Improve I-64/95 interchange by extending the NB to EB ramp by 1000ft and widen NB right shoulder by 4ft
Improve I-64/95 interchange
Add one additional GS-1 through lane in each direction from Rt 602 to Rt 1 and construct dual left turn lanes WB at the Rt 1 intersection.
Widen Route 58
Install signal system at the intersection of Route 49 and 610. Construct 200ft right turn lane and 200ft taper and provide crosswalk and pedestrian heads at new signal.
Improve intersection to address congestion
A further example of an adequate scope description is provided below:

HB2 Application Guide
11
A project sketch, plan, or drawing of infrastructure improvements or maps of routes or rail-lines with transit, freight and operational improvements should be uploaded to document the project location and features, as illustrated in Figure 2.1.
Figure 2.1 Example of Project Sketch
2.4 VTRANS2040 NEED OIPI is leading the effort to develop and implement the Statewide Transportation Needs Assessment process as part of the VTrans Multimodal Transportation Plan (VMTP). The VMTP, along with the VTrans Vision Plan make up the overall Statewide Transportation Plan, VTrans2040. One of the key purposes of the Needs Assessment is to serve as a screen for projects applying for consideration through HB2.
All projects submitted for the HB2 process must pass through an initial screening process. This initial screening process is a critical step because it links the planning and programming processes to ensure the overarching transportation goals of the CTB are advanced. If a project does not meet a capacity and operations need or a safety need under the Transportation Needs Assessment of VTrans2040, it will not move forward in the HB2 process. The Transportation Needs Assessment will assess the State’s transportation needs at three scales, listed below, and will include a statewide assessment of safety needs:
Corridor of Statewide Significance (CoSS)– – Interregional or interstate travel market
Regional Networks – Intraregional travel market

HB2 Application Guide
12
Urban Development Areas (UDAs) – Local activity center market
For projects to advance under the District Grant Program (as defined in § 33.2-371), they must meet a need on:
A Corridor of Statewide Significance
A Regional Network
An Urban Development Area
A Statewide Safety Need
For projects to advance under the high priority projects program (as defined in § 33.2-370), they must meet a need on:
A Corridor of Statewide Significance
A Regional Network
In the on-line application, the applicant will be required to select the appropriate scale (or scales) in which the project meets a VTrans need. The applicant will also be able to describe how the proposed project meets a VTrans need on any of the scales selected (Corridors of Statewide Significance, Regional Network, Urban Development Area, and/or Saftey).
Details on HB1887 funding sources and project eligibility are provided in Section 2.1 of the Policy Guide. Details on the screening process are provided in Section 2.2 of the Policy Guide.
2.5 PROJECT LOCATION As part of the application, the applicant is requested to use the MapIt tool (embedded in the on-line application) to identify the project area (footprint or service limits). VDOT and DRPT will use the mapped project location for multiple aspects of the project analysis, including the safety, congestion, and accessibility measures. The project sketch, plan, or drawing of infrastructure improvements should match the limits of the area(s) drawn. For transit, TDM, rail and operational projects drawn to cover larger geographical areas, maps of coverage, routes or rail-lines with operational improvements should be uploaded to document the project affected location(s) and features details.

HB2 Application Guide
13
3.0 Evaluation Factor Inputs Detailed descriptions of the methodology that will be used to evaluate projects is contained in Appendices A through F of the HB2 Policy Guide. The following is an overview of the specific inputs that will need to be provided to complete the application.
3.1 SAFETY AND CONGESTION The safety and congestion factor areas contain measures that will be calculated by VDOT and DRPT staff using information provided on the project description and location.
Measures S.2, C.1, and C.2– – If the project is located on a non-VDOT roadway facility, the project applicant must provide existing (most recent year available) AADT by roadway segment within the project limits.
3.2 ACCESSIBILITY Measure A.3– – The applicant needs to respond Yes or No to each of the questions noted in Table 3.1. (additional space is provided in the application to explain the response if not clear in project scope)
Table 3.1 A.3 – Access to Multimodal Choices Applicant Information
Project Type (Mode) and Characteristics Applicant Response
Project includes transit system improvements or reduces delay on a roadway with scheduled peak service of 1 transit vehicle per hour.
Yes/No
Project includes improvements to an existing or proposed park-and-ride lot. Examples include: new lot, more spaces, new or improved entrance/exit, technology (payment, traveler information).
Yes/No
Project includes construction or replacement of bike facilities. For bicycle projects, off-road or on-road buffered or clearly delineated facilities are required.
Yes/No
Project includes construction or replacement of pedestrian facilities. For pedestrian projects, sidewalks, pedestrian signals, marked crosswalks, refuge islands, and other treatments are required (as appropriate).
Yes/No
Project includes improvements to existing or new HOV/HOT lanes or ramps to HOV/HOT.
Yes/No
Project provides real-time traveler information or wayfinding specifically for intermodal connections (access to transit station or park and ride lot).
Yes/No

HB2 Application Guide
14
Project Type (Mode) and Characteristics Applicant Response
Project provides traveler information or is directly linked to an existing traffic management center (TMC) network or ITS architecture.
Yes/No
3.3 ENVIRONMENT Measure E.1 – The applicant needs to respond Yes or No to each of the questions noted in Table 3.2. (additional space is provided in the application to explain the response if not clear in project scope)
Table 3.2 E.1 – Air Quality and Energy Environmental Effect Applicant Information
Project Type (Mode) and Characteristics Applicant Response
Project includes construction or replacement of bike facilities. For bicycle projects, off-road or on-road buffered or clearly delineated facilities are required.
Yes/No
Project includes construction or replacement of pedestrian facilities. For pedestrian projects, sidewalks, pedestrian signals, marked crosswalks, refuge islands, and other treatments are required (as appropriate).
Yes/No
Project includes improvements to rail transit or passenger rail facilities. Yes/No
Project includes improvements to an existing or proposed park-and-ride lot. Examples include: new lot, more spaces, new or improved entrance/exit, technology (payment, traveler information).
Yes/No
Project includes bus facility improvements or reduces delay on a roadway with scheduled peak service of 1 transit vehicle per hour.
Yes/No
Project reduces traffic delay at a congested intersection, interchange, or other bottleneck with a high percentage of truck traffic (greater than 8 percent of AADT).
Yes/No
Project includes improvements to freight rail network or intermodal (truck to rail) facilities/ports/terminals.
Yes/No
Project include special accommodations for hybrid or electric vehicles, or space or infrastructure for electric vehicle parking/charging).
Yes/No
Project includes energy efficient infrastructure or fleets, including: hybrid or electric buses, LED lights and signals, electronic/open road tolling, alternative energy infrastructure (e.g., roadside solar panels).
Yes/No
3.4 ECONOMIC DEVELOPMENT Measure ED.1– – The focus of this measure is on project consistency/support of local/county/PDC/regional economic development plans and support of real, planned non-residential development (residential-only developments are not considered) within the project corridor (what is included in the project corridor is clarified in steps below). Project assessment is based on the use of a checklist,

HB2 Application Guide
15
which is shown in Table 3.3 below. Validation (a brief narrative) of the existence of the actions in the checklist is included as part of the project application. Detail to support development of a response to each question follows Table 3.3.
Table 3.3 ED.1 – Project Support for Economic Development Applicant Information
Question Response
1. Transportation project consistency with local Comprehensive Plan or local Economic Development Strategy
Consistent with/ Referenced in
2. Transportation project consistency with Regional Economic Development Strategy
Consistent with/ Referenced in
3. Development project consistent with local comprehensive plan’s (future land use or zoning map, and or zoning code/ordinance
Consistent with/ Referenced in
4. Development project site plan status Submitted or Approved
5. Development project site utilities status (sewer/water, broadband, etc…)
Programmed or In place
Note: To help facilitate VDOT/DRPT review of the response to questions 1 – 3, the project submitter is requested to attach any referenced documents (or relevant portions).
Question 1 Guidance: To determine whether a project is consistent with a local Comprehensive Plan or local Economic Development Strategy, the project applicant should conduct the following steps:
Step 1: Identify the local Comprehensive Plan or local Economic Development Strategy for the geographic area in which the transportation project is proposed (the strategy or goals may be found in a stand-alone document or as part of another document, such as a comprehensive plan).
Step 2: Review the goals, objectives and strategies noted in the document(s).
Step 3: Review the document to determine if the proposed transportation project is specifically cited in the document(s) as a key project desired to support local/regional economic development.
Step 4: Categorize the proposed project as follows:
If the proposed transportation project is specifically mentioned as a key project in at least one of the local Comprehensive Plan or local Economic Development Strategy documents, the project is considered “referenced in”
If the proposed transportation project clearly supports an economic development objective or strategy, that project is considered “consistent”

HB2 Application Guide
16
Question 2 Guidance: To determine whether a project is consistent with the Regional Economic Development Strategy, the project applicant should conduct the following steps:
Step 1: Identify the Regional Economic Development Strategy for the geographic area in which the transportation project is proposed (the strategy or goals may be found in a stand-alone document or as part of another document).
Step 2: Review the goals, objectives and strategies noted in the document(s).
Step 3: Review the document to determine if the proposed transportation project is specifically cited in the document(s) as a key project desired to support local/regional economic development.
Step 4: Categorize the proposed project as follows:
If the proposed transportation project is specifically mentioned as a key project in the Regional Economic Development Strategy, the project is considered “referenced in”
If the proposed transportation project clearly supports an economic development objective or strategy, that project is considered “consistent”
Question 3 Guidance: To determine whether each development site (do not include residential only developments) within the project corridor (1 mile buffer) is consistent with the local Comprehensive Plan future land use or zoning map, and or zoning code/ordinance, the project sponsor should conduct the following steps:
Step 1: Identify the local Comprehensive Plan future land use or zoning map, and the zoning code/ordinance for the geographic area in which the transportation project is proposed.
Step 2: Review future land use or zoning map and or zoning code/ordinance for the project area.
Step 3: List each development site within 1 mile of the project corridor (do not include residential only developments) and for each, provide the projected square footage and distance from the project corridor.
Step 4: Categorize each development site as follows:
Is the development project specifically mentioned as a key project in the local comprehensive plan?
Is the development project considered “consistent” with the local comprehensive plan (future land use or zoning map) and or zoning code/ordinance?
Question 4 Guidance:
To assess development project site plan status, the applicant must provide information regarding the status of development review and approval of development projects adjacent to the project corridor (for the same set of

HB2 Application Guide
17
development projects identified in Question 3). The information required in the application includes:
Has the development site plan been “approved”? (or the equivalent, dependent upon local terminology)
Has the site plan been “submitted”?
Question 5 Guidance:
To assess each development project site’s (for the same set of development projects identified in Question 3) utility provision status, the applicant must provide information regarding utility systems and provision, including current and planned utilities for each individual development site.
Does the development project site have utilities (sewer/water, broadband, etc…) that have been programmed?, or
Does the development project site have utilities (sewer/water, broadband, etc…) that are in place?
A summary of all information required for the transportation project and each associated development project within the project corridor, and the corresponding points awarded, is provided in Table 3.4 below.

HB2 Application Guide
18
Table 3.4 ED.1 – Project Support for Economic Development, Summary of Project Inputs
Economic Development (ED.1) Tools – Use Google Earth or tool such as – http://www.freemaptools.com/area-calculator.htm
Question 1 Transportation Project consistency with Local Comprehensive Plan/Economic Development Strategy
Question 2 Transportation Project consistency with Regional Economic Development Strategy
Question 3 Development consistent with Comprehensive Plan/Zoning
Question 4 Development site plan status
Question 5 Development site utilities status
Development proposed (or projected) building square footage
Distance from Project
Transportation Project
Consistent With / Referenced In
Consistent With / Referenced In
[Site 1 Name] Consistent With / Referenced In
Submitted / Approved
Programmed / In place Total sf mi.
[Site 2 Name] Consistent With / Referenced In
Submitted / Approved
Programmed / In place Total sf mi.
[Site 3 Name] Consistent With / Referenced In
Submitted / Approved
Programmed / In place Total sf mi.
[Site 4 Name] Consistent With / Referenced In
Submitted / Approved
Programmed / In place Total sf mi.
[Site 5 Name] Consistent With / Referenced In
Submitted / Approved
Programmed / In place Total sf mi.
3.5 LAND USE AND TRANSPORTATION COORDINATION Measure L.1 – Projects applications should indicate the project’s ability to address the policy and planning criteria listed in Table 3-4. A project is assessed for how well the project (or the jurisdiction or region that the project is located in) addresses the land use evaluation questions. With the exception of the question regarding in-fill development, points are assessed based on yes/no responses. VDOT/DRPT staff will review the project application against these criteria to confirm consistency. See the guidance provided for specific steps and resources to support response to the evaluations questions in Table 3.5.

HB2 Application Guide
19
Table 3.5 L1 – Land Use Policy Consistency/Transportation-Efficient Land Use Support Applicant Information
Policy and Planning Criteria Applicant Response
1. Does the project promote walkable/bicycle friendly, mixed-use development? Yes/No
2. Does the project promote in-fill development? Yes/No
3. Is there a locally/regionally adopted corridor/access management plan for the project area that addresses interparcel connectivity and exceeds VDOT’s minimum spacing standards?
Yes/No
For all questions, applicants should provide associated documentation and rationalization for “Yes” answers. HB2 staff will review the application details and clarify information with submitters as necessary.
1. Does the project promote walkable/bicycle friendly, mixed-use development?
To answer “Yes,” you should be able to answer “Yes” to both A and B questions below:
a. Is the project buffer area (¼ mile) zoned for, or indicated on future land use maps, as “mixed use,” or the equivalent.
b. Does the project add or improve pedestrian or bicycle facilities and/or operations? Or does the project add or improve transit facilities and/or operations?
To support the applicant response, more information about the types of projects that would be appropriate for “Yes” responses is provided below, please use this information to assess the project and the land use at/adjacent to the project.
Assessment of a Project or Project Component
Question 1A. To confirm that the proposed project is within or directly adjacent to a place zoned for mixed use development, please follow the steps below:
Step 1: Draw a ¼ mile buffer around the project boundaries.
Step 2: Review the existing zoning and planned land use: Is any of the land within the buffer drawn in Step 1 above currently zoned as mixed use or does the future land use plan for the jurisdiction identify any of the land within the buffer as planned mixed-use development?
Question 1B. To assess if the project “enhances a walkable/bicycle friendly environment” the guide provides the following examples of project types below:
Bicycle and pedestrian facilities. Does the project incorporate facilities to improve bicycle and pedestrian mobility and safety? For example, bicycle projects could include off-road or on-road buffered or clearly delineated
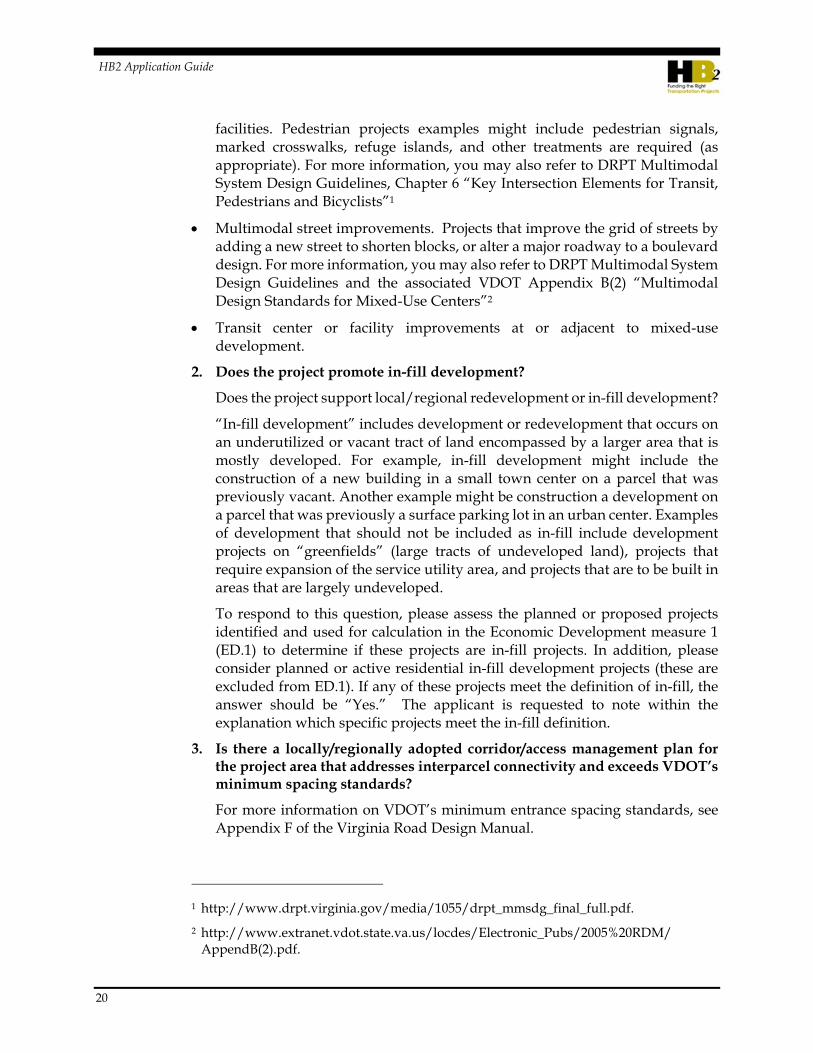
HB2 Application Guide
20
facilities. Pedestrian projects examples might include pedestrian signals, marked crosswalks, refuge islands, and other treatments are required (as appropriate). For more information, you may also refer to DRPT Multimodal System Design Guidelines, Chapter 6 “Key Intersection Elements for Transit, Pedestrians and Bicyclists”1
Multimodal street improvements. Projects that improve the grid of streets by adding a new street to shorten blocks, or alter a major roadway to a boulevard design. For more information, you may also refer to DRPT Multimodal System Design Guidelines and the associated VDOT Appendix B(2) “Multimodal Design Standards for Mixed-Use Centers”2
Transit center or facility improvements at or adjacent to mixed-use development.
2. Does the project promote in-fill development?
Does the project support local/regional redevelopment or in-fill development?
“In-fill development” includes development or redevelopment that occurs on an underutilized or vacant tract of land encompassed by a larger area that is mostly developed. For example, in-fill development might include the construction of a new building in a small town center on a parcel that was previously vacant. Another example might be construction a development on a parcel that was previously a surface parking lot in an urban center. Examples of development that should not be included as in-fill include development projects on “greenfields” (large tracts of undeveloped land), projects that require expansion of the service utility area, and projects that are to be built in areas that are largely undeveloped.
To respond to this question, please assess the planned or proposed projects identified and used for calculation in the Economic Development measure 1 (ED.1) to determine if these projects are in-fill projects. In addition, please consider planned or active residential in-fill development projects (these are excluded from ED.1). If any of these projects meet the definition of in-fill, the answer should be “Yes.” The applicant is requested to note within the explanation which specific projects meet the in-fill definition.
3. Is there a locally/regionally adopted corridor/access management plan for the project area that addresses interparcel connectivity and exceeds VDOT’s minimum spacing standards?
For more information on VDOT’s minimum entrance spacing standards, see Appendix F of the Virginia Road Design Manual.
1 http://www.drpt.virginia.gov/media/1055/drpt_mmsdg_final_full.pdf.
2 http://www.extranet.vdot.state.va.us/locdes/Electronic_Pubs/2005%20RDM/AppendB(2).pdf.

HB2 Application Guide
21
Corridor access management plans offer flexibility in the application of the access management regulations and standards to meet the special needs of different areas of the state. In addition to entrance spacing, corridor/access management plans should include recommendations for cross-parcel access, shared entrances. These plans may also establish a network of parallel roadways to the main corridor that would serve to divert traffic. The plans may include recommendations regarding turn lanes, limiting entrance movements, signal synchronization, closing median crossovers and locations for new median crossovers.


HB2 Application Guide
23
4.0 Project Delivery and Funding
4.1 PLANNING STATUS The applicant will be asked to provide information on the types of planning studies or plans that have identified the need, scope, design, etc. for the proposed improvement. Specifically, the application will ask whether the project was included in any of the following:
Constrained Long Range Plan (MPO)
Vision Long-Range Plan (MPO)
Rural Long Range Plans
Other Regional Plan
Transportation Element of Local Comprehensive Plan
Planning / Safety Study
State Transportation Plan
Transit Development Plan (TDP)
National Environmental Policy Act (NEPA) Study
4.2 PROJECT ADMINISTRATION Localities can indicate their desire to administer the project as part of the HB2 application process. Per the HB2 Implementation Policy Guide, estimates to be used for scoring purposes on proposed locally administered projects should still be validated by VDOT and/or DRPT staff. Any projects selected for funding that fall under DRPT oversight should follow the DRPT Project Partnership process. Any projects selected for funding that fall under VDOT oversight should follow the guidelines as outlined in the Locally Administered Projects Manual.
4.3 PHASE AND SCHEDULE At a minimum, the schedule should clearly define the expected process for further project development including key milestones, work activities, related activities, and approvals/approval timelines. The schedule should be realistic and reflect the complexity of the project and identify the ad date, and the duration for each project phase (PE, RW, CN or other entered milestones).

HB2 Application Guide
24
Preliminary Engineering (PE) Phase
For existing underway phases, % complete indicates level of completion to date for all required tasks or milestones identified as a part of the phase; this will be used to provide qualitative feedback to the CTB regarding project efforts to date (e.g., NEPA complete, Preliminary Field Inspection level plans, RW level plans, etc).
For future planned phases, % complete should be “0.”
Phase estimate should account for the total cost of the phase to include future planned costs and costs of any previous work or accomplishments to date on existing phases. To the extent possible, PE phase costs should attempt to exclude planning level activities unless directly assigned to the project’s budget. If planning level activities are included as a part of the phase’s cost estimate, the funding sources utilized to accomplish those activities should be included under the Project Funding Sources described below.
For existing underway phases, phase start date should reflect the date in which the state or applicant received Federal authorization or state equivalent to begin the PE phase (or planning efforts if those efforts are being included in the estimate/funding) or applicant began substantial preliminary engineering activities such as survey, environmental, or design related activities such as initiating in-house or consultant procured design.
For a future planned PE phase, all applicants should assume a start date of August 1, 2016. Actual dates will depend on actions required to obtain Federal and/or state authorization to begin the phase.
Phase end date is not required for the PE phase as it is understood that the PE phase may run concurrently with future planned phases of work.
RW Phase (Right-of-way and Easement Acquisition, Utility Relocation)
For existing underway phases, % complete indicates level of completion to date for all required tasks or milestones identified as a part of the phase.
For future planned phases, % compete should be “0.”
Phase estimate should account for the total cost of the phase to include future planned costs and costs of any previous work or accomplishments to date on existing phases. To the extent possible, RW phase costs should attempt to exclude the value of donated land or easements or other RW phase related in-kind contributions. If such aspects are included as a part of the phase’s cost estimate, the applicant should denote that the value of such items are reflected as “Local Funds” in the Project Funding Sources described below under Previous or Future Commitments depending on the current status of project development.

HB2 Application Guide
25
For existing underway phases, phase start date should reflect the date in which the state or applicant received Federal authorization or state equivalent to begin RW phase or the date in which the applicant issued notice to proceed to in house or consultant staff to proceed with the RW acquisitions or Utility Relocations.
Phase end date is not required for the RW phase as it is understood that the RW phase may run concurrently with future planned phases of work.
CN Phase (Construction)
It is assumed that the CN phase status should be “not started”– – this program is to fund projects for construction and while a PE and RW phase may or may not be required or has already been completed, the CN phase is required.
% complete should be “0” for most projects. If it is greater than “0%” complete, an explanation must be provided.
Phase estimate should account for the total planned cost of the Construction phase to include the expected cost of construction, appropriate construction engineering and inspection costs, appropriate contingencies, and any appropriate non-contract specific costs (such as state or local police costs, etc.). To the extent possible, CN phase costs should attempt to exclude the estimated costs of in-plan utility betterment that is expected to be at the locality or other regional entity’s cost unless the project has progressed sufficiently through design that a more accurate estimate for such costs has been established. If such aspects are included as a part of the phase’s cost estimate, the applicant should denote that the value of such items are reflected as “Local Funds” in the Project Funding Sources table below under Previous or Future Commitments depending on the current status of project development.
For CN phases, the applicant should provide a planned start date that reflects the anticipated date that the state and/or applicant is expecting to advertise the construction phase to industry. For multi-segment or multi-phase construction phases, the planned start date should reflect the expected date the next segment of construction could begin if appropriate funding was programmed to the project. The construction phase estimate should be inflated to the planned construction start date.
The applicant should provide a planned end date that reflects the anticipated date of fixed completion for the construction project. This date is important in order for the state to adequately program project funding in accordance with the project’s projected schedule and cash flow requirements.

HB2 Application Guide
26
4.4 COST ESTIMATE Accurate cost estimates are critical because cost impacts the project score and cost estimate increases could force the project to be rescored in subsequent HB2 cycles. VDOT and DRPT will assist applicants with the development of cost estimates. Prior to submitting project applications, applicants should work in conjunction with VDOT and DRPT staff to develop reliable cost estimates as part of the application process.
For projects in which the applicant requests VDOT to administer the project, VDOT will be responsible for providing the applicant with a cost estimate for each project application. If the applicant has provided an estimate, VDOT will be required to validate the estimate for use on each project application.
For projects in which the applicant requests to locally administer the project (and for all DRPT oversight projects), the applicant may provide a cost estimate for each project application, however VDOT and/or DRPT staff must validate the estimate for use on each project application
If there is disagreement concerning the estimate that cannot be resolved between the applicant and the VDOT/DRPT local contact, the applicant may request resolution from the VDOT District Engineer/Administrator or the DRPT Director.
At a minimum, the cost estimate should be as realistic as possible and should account for applicable risk and contingencies based on the size and complexity of the project. Projects incurring one-time and ongoing operations and non-construction costs (i.e., purchase of transit vehicles) should clearly identify those costs.
VDOT’s Project Cost Estimating System (PCES) workbook is the preferred tool for developing cost estimates for roadway projects. If quantities are known, TRANSPORT can be used for cost estimates. It is important that the applicant works directly with VDOT staff through project specific scope and costing issues.
For the HB2 application, the cost estimate for each phase should be based on the schedule shown in the application. To the extent possible, document all assumptions and contingencies used.
4.5 FUNDING SOURCES
Six Year Improvement Program Allocations
Provide the total amount of allocations listed in the most recently adopted Six Year Improvement Program (SYIP) for all fiscal years, regardless of the type of funding. A VDOT UPC or DRPT project number must be provided.

HB2 Application Guide
27
Other Committed Funding Sources (not shown in SYIP)
Provide the total amount of funding committed to the project that is not already shown in the most recently adopted SYIP. This may include local funding, proffers, in-kind contributions, etc.
Other Requested Funding Sources
Provide the total amount of funding requested for the project that is not already shown in the most recently adopted SYIP. This may include applications for VDOT or DRPT funding programs (Revenue Sharing, TAP, FTA Programs), regional funding (CMAQ/RSTP), or local funds requested from the Board of Supervisors (BOS) or City/Town Council. An explanation of the source of the requested funding must be provided.
HB2 Request (Total of High Priority and District Grant Program Requests, if Applying for Both)
Provide the total amount of funding requested through the HB2 Grant programs. If funds are being requested from both grant programs, the total request should be entered. This should reflect the difference between the total project cost estimate (to include all phases) and the sum of SYIP, committed, and requested fund sources. Projects selected for funding under HB2 that are Federally eligible, will be developed as Federal projects.


HB2 Application Guide
29
5.0 Attachment: Pre-Application Form

UPDATED 7/27/15 1
This form was developed to provide preliminary guidance to assist HB2 applicants with the development and refinement of potential projects to be considered through the HB2 process. This form is not the official application, so all applicants will be required to enter project requests into the HB2 Web Application portal that will be available starting in August. When navigating between fields in this form, only use the Tab key. For specific help information on the data entry fields, refer to either the Status Bar on the bottom left of the window or the associated Pre‐Application Cordination Form Help Information. Fields with additional help information are denoted with numbers.
GENERAL DATE (MM/DD/YYYY):
Applicant Information (Select one of the following) MPO PDC NVTA Public Transit Agency Local Government (City, Town, County)
Applicant Name:
Project Point of Contact Information The primary person that the State can contact for information during the screening process. Point of Contact Name:
Point of Contact Phone Number:
Point of Contact Email Address:
Project Information Project Title: 60 character max, Project Description: 2,000 character max, VTRANS Need: 1,300 character max
Project Title:
Principal Improvement: (Select one of the following) The main or primary intent of the proposed improvement. Highway Bike/Pedestrian Bus Transit Rail Transit Freight Rail TDM
Does This Project Include Improvements to Non‐VDOT Maintained Roadways? Yes No If yes, please enter available traffic volume data on those roadways in Attachment A.
Project Description:
HB2 Need Categories: (Select all that apply) The sponsoring applicant must meet the eligibility requirements for submittal based on the selected project type as outlined in Table 2.1 of the HB2 Policy Guide (http://virginiahb2.org/).
Corridor of Statewide Significance Regional Network Urban Development Area Safety Application Program: (Select all that apply) HB 1887 funding eligibility is based on the selected HB 2 need category as outlined in Table 1.1 of the HB2 Policy Guide (http://virginiahb2.org/).
High Priority District Grant
How Does This Project Address a VTrans 2040 Need?

UPDATED 7/27/15 2
LOCATION
Please include a project sketch, design plan and/or map that details the location, elements, and limits of the proposed improvements. For the HB2 Web Application, applicants will be required to locate the proposed project on a map. The space provide below can be used to import a sketch of the project.
VDOT District(s) (Select all that apply)
Bristol Culpeper Fredericsburg Hampton Roads
Lynchburg Northern Virginia Richmond Salem Staunton
In What Jurisdiction(s) is this Project Located?
Project Sketch
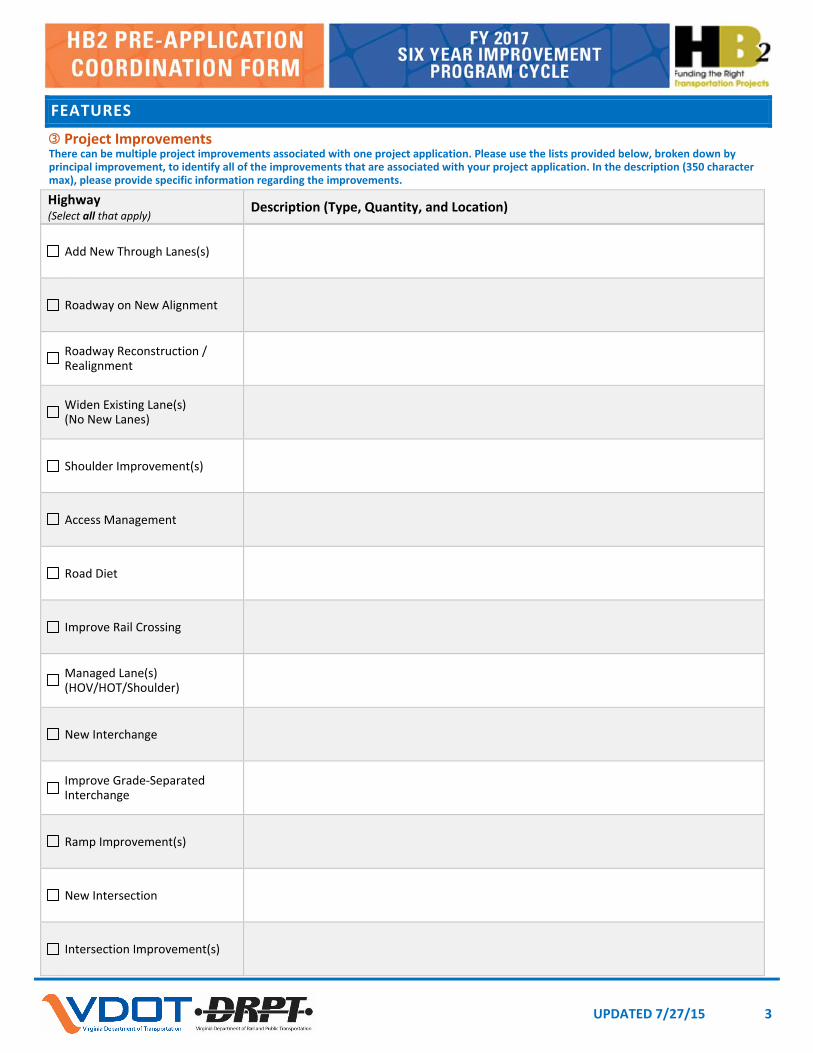
UPDATED 7/27/15 3
FEATURES
Project Improvements There can be multiple project improvements associated with one project application. Please use the lists provided below, broken down by principal improvement, to identify all of the improvements that are associated with your project application. In the description (350 character max), please provide specific information regarding the improvements. Highway (Select all that apply)
Description (Type, Quantity, and Location)
Add New Through Lanes(s)
Roadway on New Alignment
Roadway Reconstruction / Realignment
Widen Existing Lane(s) (No New Lanes)
Shoulder Improvement(s)
Access Management
Road Diet
Improve Rail Crossing
Managed Lane(s) (HOV/HOT/Shoulder)
New Interchange
Improve Grade‐Separated Interchange
Ramp Improvement(s)
New Intersection
Intersection Improvement(s)

UPDATED 7/27/15 4
FEATURES
Project Improvements (continued)
Highway (continued) (Select all that apply)
Description (Type, Quantity, and Location)
Turn Lane Improvement(s)
New Traffic Signal / Signal Optimization
ITS Improvement(s)
New Bridge
Improve / Replace Existing Bridge
Highway Other
Bike / Pedestrian (Select all that apply)
Description (Type, Quantity, and Location)
Add / Construct Bike Lane
Paved Shoulder (Minimum 4‐ft Ridable Surface)
Construct Shared‐Use Path
Construct Sidewalk
Improve Bike / Pedestrian Crossing (At Grade)
Improve Bike / Pedestrian Crossing (Grade Separated)
Bike / Pedestrian Other

UPDATED 7/27/15 5
FEATURES
Project Improvements (continued)
Bus Transit (Select all that apply)
Description (Type, Quantity, and Location)
Provide New Service Routes
Increase Existing Service – Additional Vehicles or Increased Frequency
Convert Existing Lane to Dedicated Bus Service Lane
Construct Bus Stop / Shelter
Improve Bus Stop / Shelter
Bus Transit Other
Rail Transit (Select all that apply)
Description (Type, Quantity, and Location)
Additional Track
Increase Existing Rail Service – Additional Cars or Routes
New Terminal
New Station
Station or Terminal Improvements
Rail Transit Other

UPDATED 7/27/15 6
FEATURES
Project Improvements (continued)
Freight Rail (Select all that apply)
Description (Type, Quantity, and Location)
Additional Track
Freight Haul Increase
New Rail Yard
Rail Yard Improvements
Heavy Rail Other
Travel Demand Management (TDM) (Select all that apply)
Description (Type, Quantity, and Location)
New Park and Ride Lot
Improve Park and Ride Lot
New / Expanded Vanpool or On‐Demand Transit Service
TDM Other
Right of Way Description (Type, Quantity, and Location)
Right of Way / Easements Acquisition Required

UPDATED 7/27/15 7
FACTORS
Respond yes or no to each of the comments for each factor and provide information (250 character max) to support your response. Accessibility (Please reference Appendix C from the HB2 Policy Guide – http://virginiahb2.org/)
Accessibility Response Supporting Information
Project includes transit system improvements or reduces delay on a roadway with scheduled peak service of one transit vehicle per hour.
Yes No
Project includes improvements to an existing or proposed park and ride lot (e.g., new lot, more spaces, entrance/exit, technology (payment, traveler information)).
Yes No
Project includes construction or replacement of bike facilities. For bicycle projects, off‐road or on‐road buffered or clearly delineated facilities are required.
Yes No
Project includes construction or replacement of pedestrian facilities. For pedestrian projects, sidewalks, pedestrian signals, marked crosswalks, refuge islands, and other treatments are required (as appropriate).
Yes No
Project includes improvements to existing or new HOV/HOT lanes or ramps to HOV/HOT.
Yes No
Project provides real‐time traveler information or wayfinding specifically for intermodal connections (access to transit station or park and ride lot).
Yes No
Provides traveler information or is directly linked to an existing TMC network/ITS architecture.
Yes No
Land Use and Transportation Coordination (Please reference Appendix F from the HB2 Policy Guide)
Land Use (Only applicable to Categories A and B typologies) Response Supporting Information
Does the project promote walkable/bicycle friendly, mixed‐use development?
Yes No
Does the project promote in‐fill development? Yes No
Is there a locally/regionally adopted and corridor/access management plan for the project area that addresses interparcel connectivity and exceeds the VDOT’s minimum spacing standards?
Yes No

UPDATED 7/27/15 8
FACTORS
Environment (Please reference Appendix D from the HB2 Policy Guide)
Environment Response Supporting Information
Project includes construction or replacement of bike facilities. For bicycle projects, off‐road or on‐road buffered or clearly delineated facilities are required.
Yes No
Project includes construction or replacement of pedestrian facilities. For pedestrian projects, sidewalks, pedestrian signals, marked crosswalks, refuge islands, and other treatments are required (as appropriate).
Yes No
Project includes improvements to rail transit or passenger rail facilities.
Yes No
Project includes improvements to an existing or proposed park‐and‐ride lot (e.g., new lot, more spaces, entrance/exit, technology (payment, traveler information)).
Yes No
Project includes bus facility improvements or reduces delay on a roadway with scheduled peak service of one transit vehicle per hour.*
Yes No
Project includes improvements to freight rail network or intermodal (truck to rail) facilities/ports/terminals.
Yes No
Project include special accommodations for hybrid or electric vehicles, or space or infrastructure for electric vehicle parking/charging).
Yes No
Project includes energy efficient infrastructure or fleets, including: hybrid or electric buses, LED lights and signals, electronic/open road tolling, alternative energy infrastructure (e.g., roadside solar panels).
Yes No

UPDATED 7/27/15 9
FACTORS
Economic Development (Please reference Appendix E from the HB2 Policy Guide) Commercial, industrial or mixed‐used developments only. Transportation Project – Consistency with Local Comprehensive Plan or Local Economic Development Strategy:(Select one of the following)
Consistent with Referenced in (documentation will be required)
Transportation Project – Consistency with Regional Economic Development Strategy: (Select one of the following) Consistent with Referenced in (documentation will be required)
Site Name:
Development Project (Consistent With Locality Comprehensive Plan / Zoning) (Select one of the following)
Consistent with Comprehensive Plan Future Land UseSpecific Reference (documentation will be required)
Development Project (Site Planning Status) (Select one of the following)
Submitted Site Plan (documentation will be required)Approved Site Plan (documentation will be required)
Development Project (Site Utilities Status) (Select one of the following)
Programmed (documentation will be required) In Place
Development Project (Proposed / Projected Building Square Footage)
square feet
Does Transportation Project Provide Direct or Indirect Access to the Development Site?
Provides Primary Access to the Site or is Adjacent to the Site Enhances Access Near the Site But is Not Adjacent to the Site
Driving Distance to Development Project From Transportation Project
miles
Additional Economic Development Sites
Site Name:
Development Project (Consistent With Locality Comprehensive Plan / Zoning) (Select one of the following)
Consistent with Comprehensive Plan Future Land Use Specific Reference (documentation will be required)
Development Project (Site Plan Status) (Select one of the following)
Submitted Site Plan (documentation will be required)
Approved Site Plans (documentation will be required)
Development Project (Site Utilities Status) (Select one of the following)
Programmed (documentation will be required) In Place
Development Project (Proposed / Projected Building SquareFootage)
square feet
Does Transportation Project Provide Direct or Indirect Access to the Development Site?
Provides Primary Access to the Site or is Adjacent to the Site Enhances Access Near the Site But is Not Adjacent to the Site
Driving Distance to Development Project From Transportation Project
miles
Site Name:
Development Project (Consistent With Locality Comprehensive Plan / Zoning) (Select one of the following)
Consistent with Comprehensive Plan Future Land UseSpecific Reference (documentation will be required)
Development Project (Site Plan Status) (Select one of the following)
Submitted Site Plan (documentation will be required)Approved Site Plans (documentation will be required)
Development Project (Site Utilities Status) (Select one of the following)
Programmed (documentation will be required) In Place
Development Project (Proposed / Projected Building SquareFootage)
square feet
Does Transportation Project Provide Direct or Indirect Access to the Development Site?
Provides Primary Access to the Site or is Adjacent to the Site Enhances Access Near the Site But is Not Adjacent to the Site
Driving Distance to Development Project From Transportation Project
miles
To identify information for additional development sites, make copies of this sheet.

UPDATED 7/27/15 10
11
DELIVERY / FUNDING
Project Delivery Information Project Planning Status: (Select all that reference this project)
Constrained Long Range Plan (MPO) Vision Long‐Range Plan (MPO) Rural Long Range Plans Other Regional Plan Transportation Element of Local Comprehensive Plan Planning / Safety Study State Transportation Plan Transit Development Plan (TDP) NEPA Study
Existing Project VDOT UPC(s) or DRPT Project Number(s), if applicable:
Project Administered By: (Select one of the following) VDOT Locality Other:
Project Designed By Please Indicate Who is Responsible for the Design of this Project: (Select all that apply) If more than one of the entities below is responsible for the design, then please note the percentage for which each entity is responsible.
VDOT % Locality % Consultant %
Project Delivery Method: (Select one of the following) Not Determined Design‐Bid‐Build Design‐Build State Forces Locality Forces Other:
Cost Estimate and Schedule Estimates and schedules should reflect the fact that all work that is federally eligible will be performed following the federal process. If needed, please describe what activities are covered in the other phase (100 character max).
Phase Milestone Status
(Select one of the following for each phase)
% Complete
Cost Estimate
Start Date
(dd/mm/yyyy)
EndDate*
(dd/mm/yyyy)
PE (Survey, Environmental, Design)
Not needed Not started Underway Complete
% $
RW (Right of Way and Easement Acquisition, Utility Relocation)
Not needed Not started Underway Complete
% $
CN (Construction, Oversight, Inspection, Contingencies)
Not needed Not started Underway Complete
% $
Other
Not needed Not started Underway Complete
% $
Total Cost Estimate $ * End Date not required for PE and RW phases – allows for project development phase overlap.
Project Funding Sources Other Committed Funding Source(s) and Other Requested Funding Source(s): 200 character max
Six Year Improvement Program Allocations (Previous Years Through Program Year Allocations) $
Other Committed Funding Source(s) (Not Included in SYIP) $
Other Requested Funding Source(s) $
HB 2 Request (Total of High Priority and District Grant Program Requests If Applying for Both) $
Total Project Funding $
10

UPDATED 7/27/15 11
SUPPORTING DOCUMENTS
The following checklist will help you prepare and compile supporting documentation that can be uploaded into the web-based application.
Required
Project Improvement Sketch
Resolution of Support from Responsible Regional Entity (MPO, PDC, NVTA) {by public transit agencies and localities on CoSS}
Resolution of Support from Relevant Entity (MPO, PDC, NVTA, Locality) {by public transit agencies on regional network}
Detailed Project Cost Estimate
Local Comprehensive Plan, if applicable
Local/Regional Economic Development Strategy, if applicable
Site Development References per Economic Development Responses, if applicable
Optional – Strongly Recommended
Previous Study(ies)

UPDATED 7/27/15 12
ATTACHMENT A – TRAFFIC VOLUME INFORMATION
Please provide the following traffic volume information if the proposed project is not on a VDOT‐maintained facility.
Non‐VDOT Maintained Roadway Segment Traffic Volume Information
Segment Number
Route Number
Route Name From To AADT %
TrucksYear
1
2
3
4
5
6


