HBCH is the leading resource for employers dedicated to improving the health and wellness of their employees. HBCH brings together all stakeholders to lower costs and improve quality, which contributes to the economic viability of the Houston business community.
Transcript
HBCH is the leading resource for employers dedicated to improving the health and wellness of
their employees. HBCH brings together all stakeholders to lower costs and improve quality, which contributes to the economic viability of the
Houston business community.
Cumulative Increases in Health Insurance Premiums, Workers’ Contributions to Premiums, Inflation, and Workers’ Earnings, 1999-2013
SOURCE: Kaiser/HRET Survey of Employer-Sponsored Health Benefits, 1999-2013. Bureau of Labor Statistics, Consumer Price Index, U.S. City Average of Annual Inflation (April to April), 1999-2013; Bureau of Labor Statistics, Seasonally Adjusted Data from the Current Employment Statistics Survey, 1999-2013 (April to April).
2015 Events DATE EVENT
February 19 HBCH Networking Social March 10 Actionable Data Employers Should Demand in Health Plan Reports April 23 HBJ Healthiest Employers / HBCH Paragon Awards May Employer Best Practices to Demonstrate Wellness ROI June Employer Transparency Tools (co-presented with CEBS) July HBCH Networking Social September Houston’s Healthcare Delivery System–an Employer’s Perspective October Employer Survey on Purchasing Value in Healthcare December HBCH Networking Social
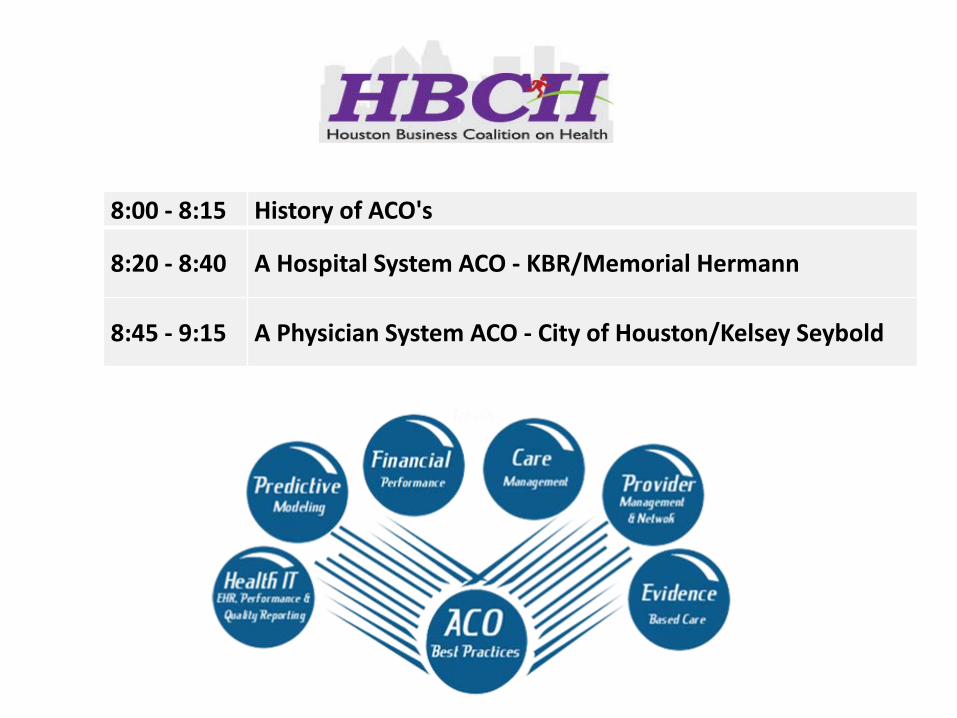
8:00 - 8:15 History of ACO's
8:20 - 8:40 A Hospital System ACO - KBR/Memorial Hermann
8:45 - 9:15 A Physician System ACO - City of Houston/Kelsey Seybold
ACCOUNTABLE CARE ORGANIZATIONS WHAT ARE THEY; WHY ARE THEY NEEDED; HOW DO THEY WORK; DO THEY WORK
– January
21, 2015
6
The Changing Health Care Landscape
Implications for Employers
Legislative Uncertainty The Changing Practice of Medicine
Health Technology
Provider System Redefinition
New Entrants and Disintermediators
Change and the Employee Value Proposition
Understand impact of generational shift of employees Leverage technology to create new ways to engage Build a work environment that supports a culture of health and well-being
Workforce
Enhance employee value with more flexibility and choice in benefit arrangements Provide simplification and personalization with high tech and high touch support Consider emerging models to deliver care an at affordable price
Benefits
Focus on positioning health care within the total rewards strategy and EVP Understand the impact of health on sustainable engagement Ensure culture and work environment are well aligned
Business
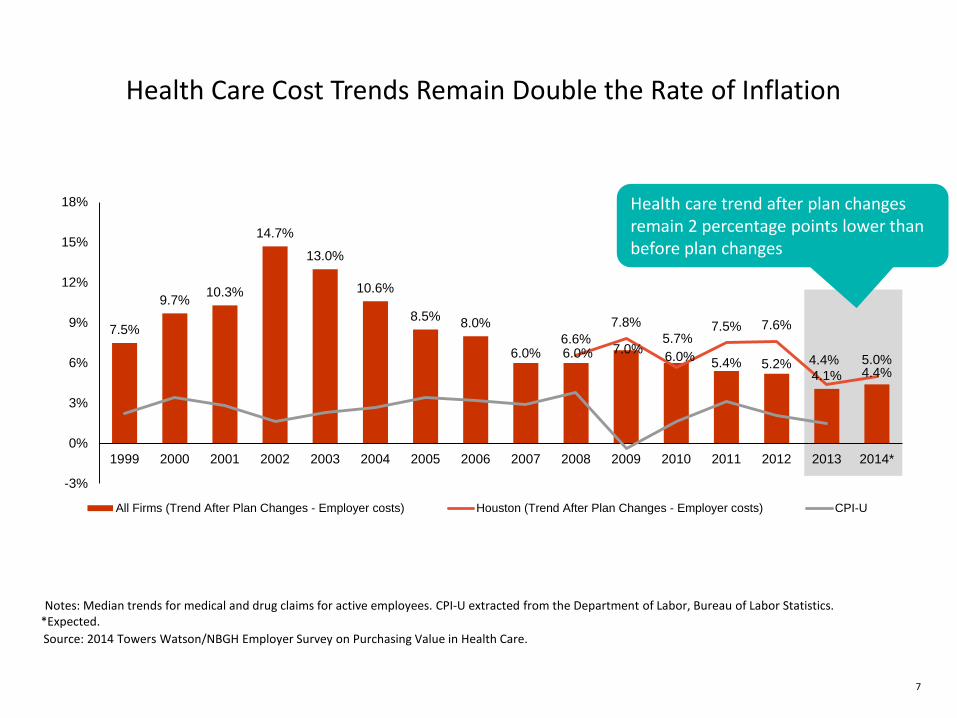
Health Care Cost Trends Remain Double the Rate of Inflation
All Firms (Trend After Plan Changes - Employer costs) Houston (Trend After Plan Changes - Employer costs) CPI-U
Notes: Median trends for medical and drug claims for active employees. CPI-U extracted from the Department of Labor, Bureau of Labor Statistics. *Expected.
Health care trend after plan changes remain 2 percentage points lower than before plan changes
Source: 2014 Towers Watson/NBGH Employer Survey on Purchasing Value in Health Care.
7
8
ACOs — The New Face of Health Care Integration
Doctors Hospitals ACO
What is an ACO?
Physicians (PCPs and Specialists) and hospital(s) working together to coordinate care and held accountable for the cost and quality of care delivered to a defined set of individuals
Care is managed across the continuum of inpatient and ambulatory settings
What is the purpose of an ACO?
Provide integrated care to improve outcomes and reduce cost
Provide a counter-balance to the fee-for-service system that incents volume rather than value of services
Accountability and financial risk is focused directly on providers and the delivery systems instead of health plans
What is the goal of an ACO (the triple aim)?
Reduce the per capita cost of healthcare
Improve the health of populations
Improve the patient experience of care including quality and satisfaction
9
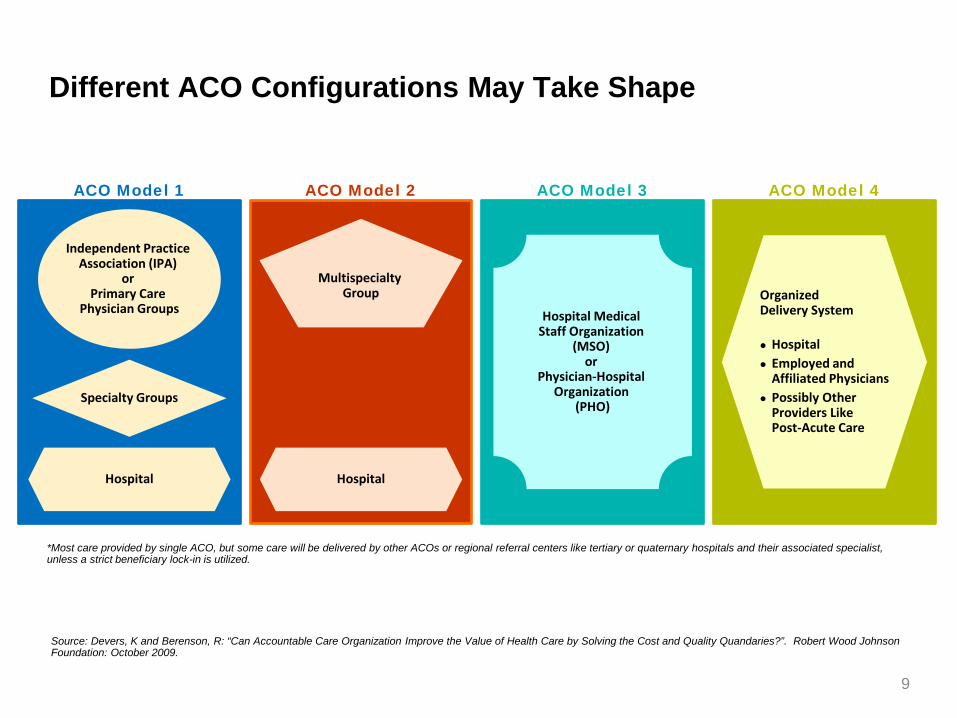
ACO Model 1 ACO Model 2 ACO Model 3 ACO Model 4
Different ACO Configurations May Take Shape
Source: Devers, K and Berenson, R: “Can Accountable Care Organization Improve the Value of Health Care by Solving the Cost and Quality Quandaries?”. Robert Wood Johnson Foundation: October 2009.
Independent Practice Association (IPA)
or Primary Care
Physician Groups
Specialty Groups
Hospital
Multispecialty Group
Hospital
Hospital Medical Staff Organization
(MSO) or
Physician-Hospital Organization
(PHO)
Organized Delivery System
Hospital Employed and
Affiliated Physicians Possibly Other
Providers Like Post-Acute Care
*Most care provided by single ACO, but some care will be delivered by other ACOs or regional referral centers like tertiary or quaternary hospitals and their associated specialist, unless a strict beneficiary lock-in is utilized.
Value-Based Payment Models are Developing Rapidly
U.S. state containing an emerging market Not a leading market
San Francisco
San Jose St. Louis
Los Angeles
Seattle
Portland
Boise
San Diego Phoenix
Salt Lake City Sacramento
Las Vegas
Albuquerque
Denver
San Antonio
Austin Houston
Dallas/Ft. Worth
Oklahoma City
Tulsa
Kansas City
Minneapolis
Chicago
Milwaukee
Memphis Nashville
Miami
Tampa
Jacksonville
Orlando
Atlanta
Greenville
Columbia
Charlotte
Raleigh Durham Louisville
Indianapolis Cincinnati
Cleveland
Columbus
Detroit
DC/Northern VA
Philadelphia Pittsburgh
New York City
Boston/Worcester
Hartford
Newark
Baltimore
Providence
4 Vendor Presence
2 Vendor Presence
1 Vendor Presence
3 Vendor Presence
Legend
Models include: ACOs, PCMHs, Narrow Networks and High Performing Networks National Vendors include: Aetna, Cigna, Anthem/BCBS and UHC Top 50 U.S. Markets with National Vendor Presence
10
Valerie Hulse, Vice President Global Compensation and Benefits
KBR's Experience with the Memorial Hermann ACO
KBR — A Leading Global E&C Provider
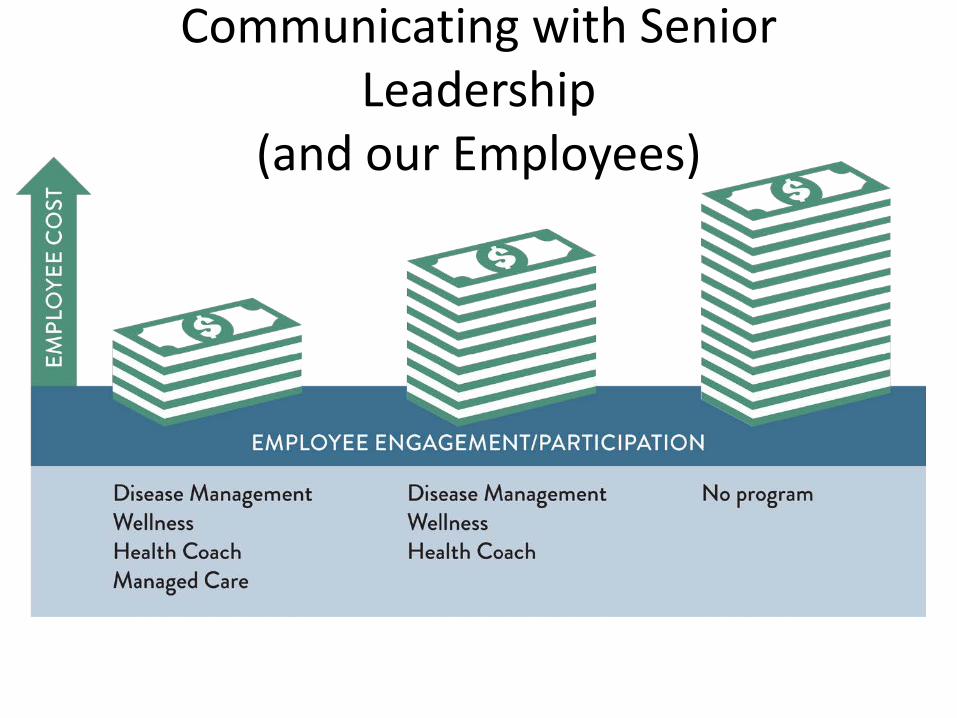
Communicating with Senior Leadership
(and our Employees)
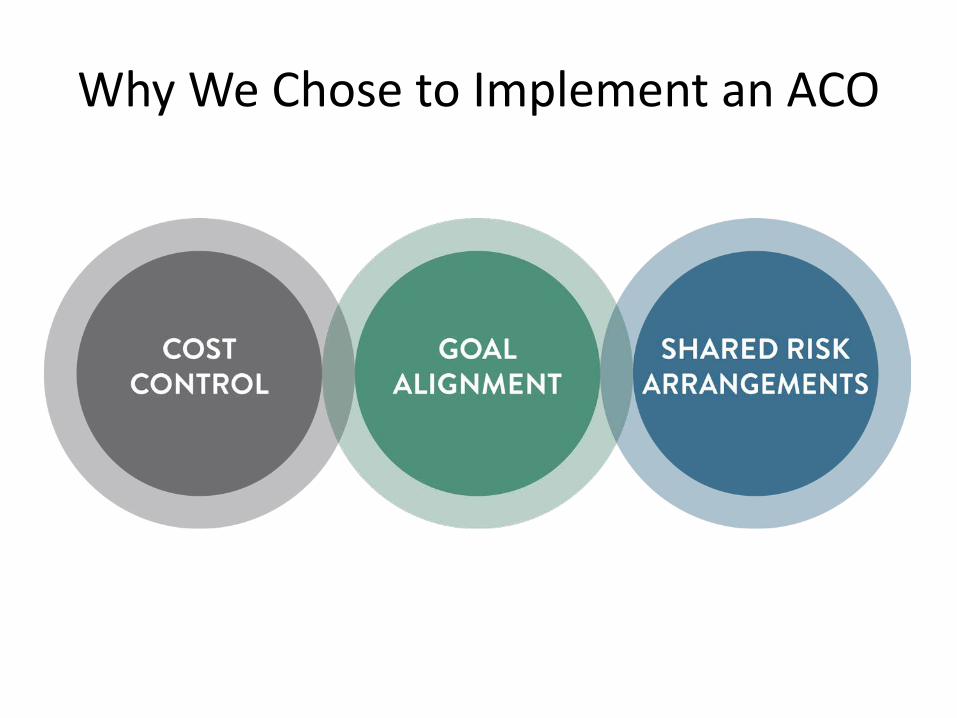
Why We Chose to Implement an ACO
Goal Alignment Cost Control Shared Risk Arrangements
Why We Chose Memorial Hermann + Aetna
• A broad network of physicians and hospitals with national support from Aetna
— Over 1,700 physicians of all specialties
• A familiar network for our employees — The year prior to implementation,
Memorial Hermann accounted for 30% of providers utilized in the Houston area
• Mobile tools and technology — Access to iTriage and Aetna Mobile
• Quality providers and hospital system
Memorial Hermann Health System – Strategy & Implementation of ACO
The Memorial Hermann Physician Network
D. Keith Fernandez MD President and Physician in Chief MHMD, CMO Memorial Hermann ACO
Memorial Hermann Health System MHMD
3500 practicing physicians
2000 Clinically Integrated 1850 CI physicians in MHACO 300 Advanced Primary Care
Practices (PCMH) 250 additional PCPs High Performance Specialty
Physicians (250) 200 employed (MHMG)
University of Texas Physicians 800 physicians CI and ACO affiliates
Memorial Hermann
Second Largest Non-Profit in Texas 6,000 staff physicians 9 Acute Hospitals, 3 Heart &
Vascular Institutes Children’s & Rehabilitation
Hospitals 100 Outpatient Sites: Ambulatory
Surgery, Imaging Sports Medicine, Neuroscience,
Transplant COE’s The nation’s busiest Trauma
program
18
Clinical Integration
19
Clinical Integration is… Integration of Physicians with each other (and often
with a hospital or hospital system) on a clinical basis to Determine the right and best ways to practice
medicine Commit to practice that way Commit to mutual accountability Develop active performance improvement
programs to enhance healthcare quality and efficiency
The MHMD Compact: Trust
MHMD agrees to: Maintain primary loyalty to physicians Negotiate well to align incentives Include physicians in work and decision making Provide clear and timely information
Provide physicians with information, services, and education to ensure high quality and ease practice burdens
Seek feedback from its physicians Maintain confidentiality Communicate, communicate, communicate Make meetings worthwhile and engaging Create leadership training programs
20
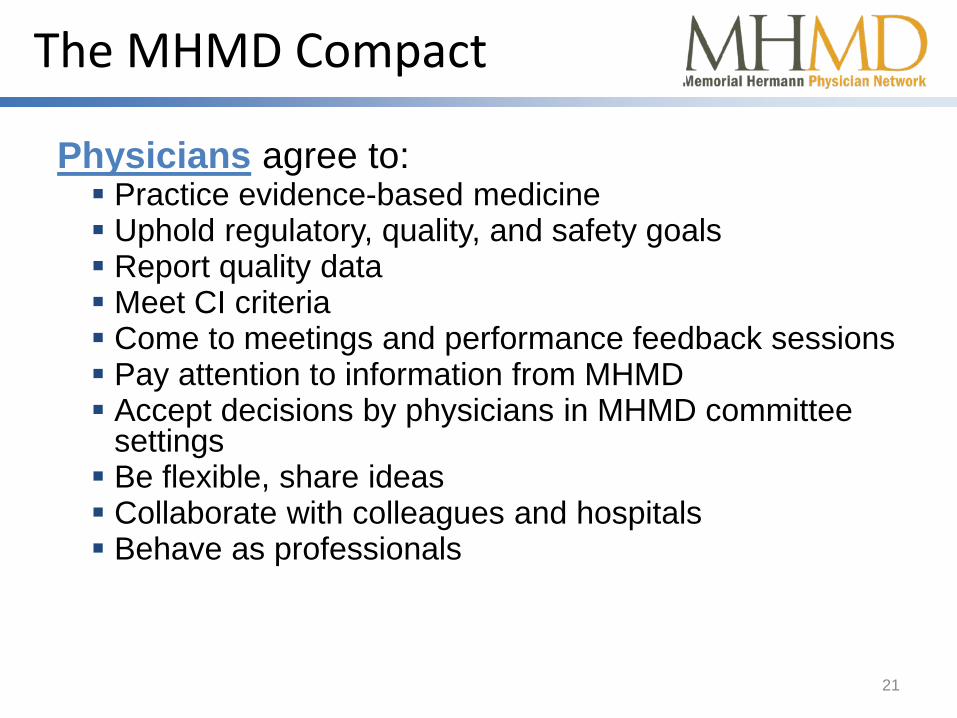
The MHMD Compact
Physicians agree to: Practice evidence-based medicine Uphold regulatory, quality, and safety goals Report quality data Meet CI criteria Come to meetings and performance feedback sessions Pay attention to information from MHMD Accept decisions by physicians in MHMD committee
settings Be flexible, share ideas Collaborate with colleagues and hospitals Behave as professionals
21
Physician Governance
MHMD Board of Directors
Clinical Programs Committee
H&V
Cardiology
CV Surgery
Neuro
Neurology
Neurosurgery
Woman/Child
Neonatal
OB/Gyn
Surgery
Anesthesia
Bariatrics
Orthopedics
ENT
Allergy
Medicine
Critical Care
Emergency
Ad hoc
Hospital Medicine
Post Acute
Oncology
Oncology
Contract
Imaging
Pathology
Primary Care
Adult PCP
Peds
Peer Review
Clinical Ethics & Palliative Care
Order Set Editorial Board
Informatics
Acute Surgery
DVT/PE JOC
End of Life Care JOC
Pediatric Head CT JOC
Surgical Home JOC
22
Hayes
23
The Advanced Primary Care Practice: Quality Engine
24
Access
Quality
Technology
Accountable Care
Health Information
Exchange
Electronic Medical Record
Point Of
Care Tool
Advanced Primary Care Practice
Clinical Integration
Practice Assessment
e Notify
Patient Portal
NCQA Level 3
Schedule NOW
Patient Education
Quality Metrics
Document Training
HCC Training
Case Management
Claims Files/Data
Single Signature
Contracting Marketing
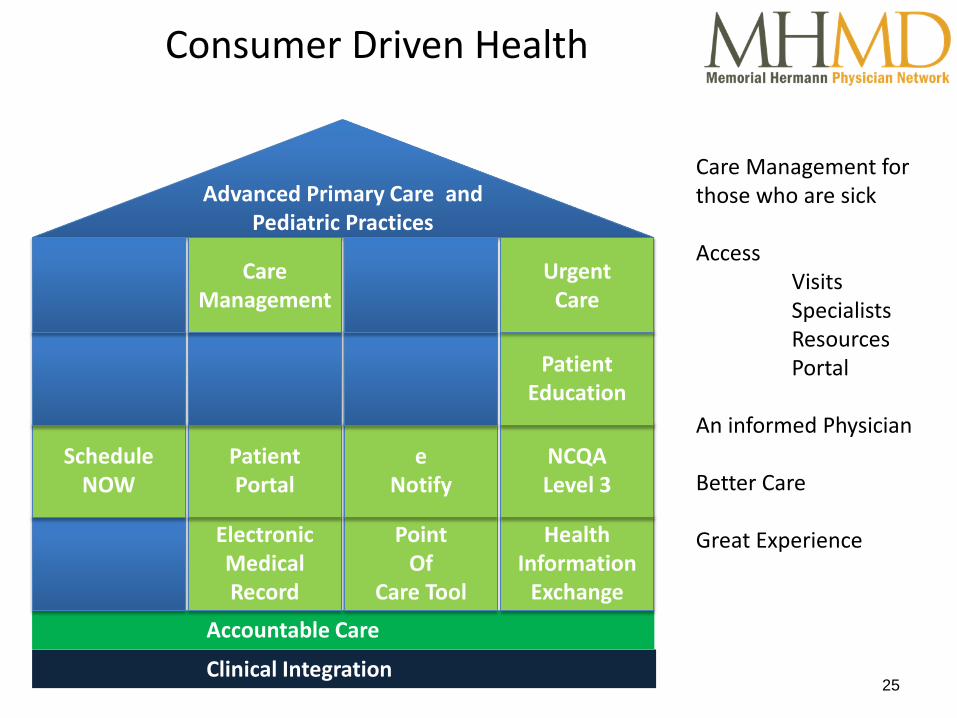
Consumer Driven Health
25
Accountable Care
Health Information
Exchange
Electronic Medical Record
Point Of
Care Tool
Advanced Primary Care and Pediatric Practices
Clinical Integration
e Notify
Patient Portal
NCQA Level 3
Schedule NOW
Patient Education
Care Management
Urgent Care
Care Management for those who are sick Access Visits Specialists Resources Portal An informed Physician Better Care Great Experience
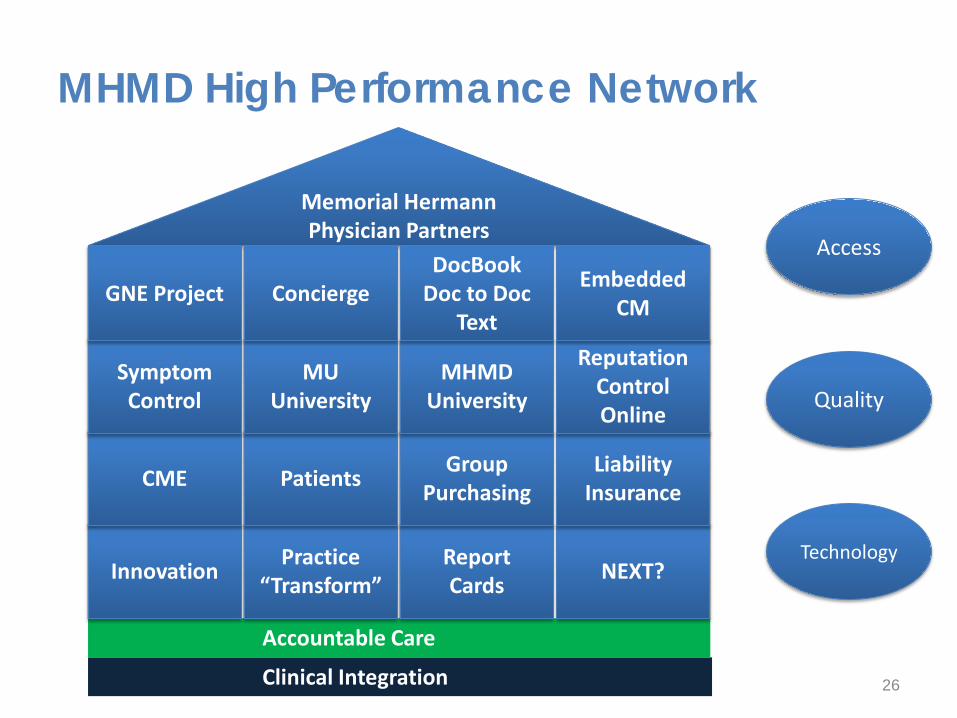
MHMD High Performance Network
26
Access
Quality
Technology
Accountable Care
NEXT? Practice “Transform”
Report Cards
Memorial Hermann Physician Partners
Clinical Integration
Innovation
Group Purchasing Patients Liability
Insurance CME
Reputation Control Online
MHMD University
MU University
Symptom Control
Concierge GNE Project DocBook
Doc to Doc Text
Embedded CM
High Performance Specialist Network
27
Access
Quality
Technology
Accountable Care
Great Experience
Memorial Hermann Physician Partners
Clinical Integration
Innovation
MH-- A National Provider
High Reliability
Bundled Payments
Price Transparency
Symptom Control
Concierge Service
Line Performance
Access Care Managers
PCMH
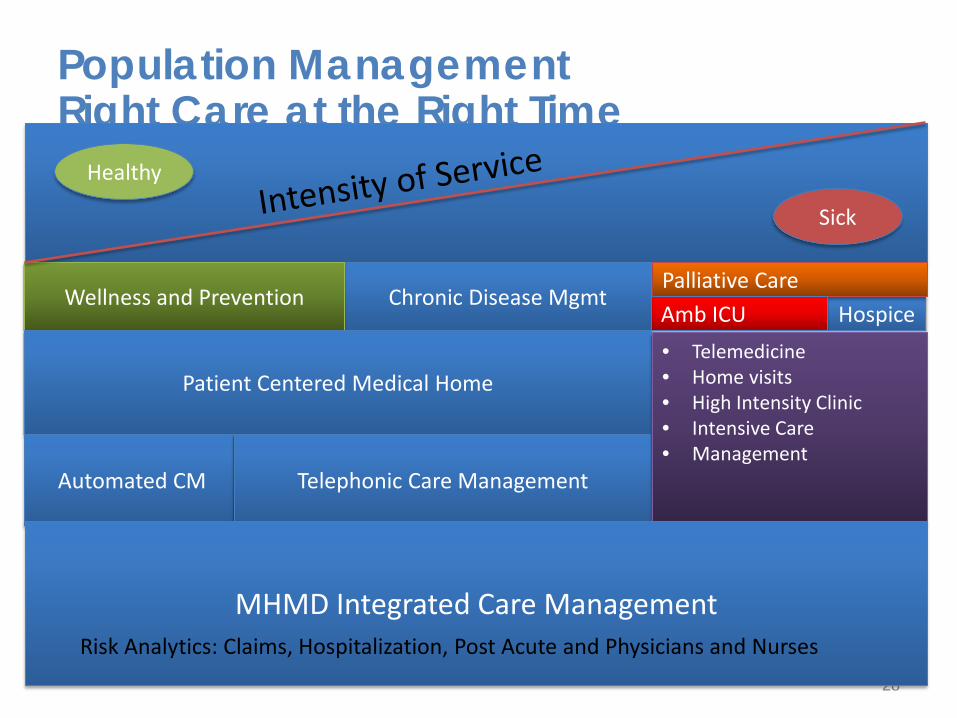
Population Management Right Care at the Right Time
28
Healthy
Sick
Hospice Palliative Care Amb ICU
Chronic Disease Mgmt Wellness and Prevention
Patient Centered Medical Home
Automated CM Telephonic Care Management
• Telemedicine • Home visits • High Intensity Clinic • Intensive Care • Management
MHMD Integrated Care Management Risk Analytics: Claims, Hospitalization, Post Acute and Physicians and Nurses
Counts as of 12/18/2013 Physician counts do not include physician extenders or hospital based physicians. *Includes UT Pediatricians, some specialty Pediatricians, and some IM and FP’s with a secondary subspecialty
1 Additional SMR in Nederland 3 Additional MDs in Bay City: 1 MHMG PCP, 1 MHMG Specialist, 1 CI Specialist.
Consumer Driven Care There are many kinds of consumers who want
different types of care Doctors (elderly, chronic disease) Nurse Practitioners, PAs (young, well) Other advanced specialty level providers Not so advanced providers (task oriented) Helpers (challenged demographics) Communities (services) EMTs/Medics (challenged demographics) Churches (known peers) An App (young and tech oriented)
30
Consumer Driven Care There are many kinds of consumers who want or need different “stuff” Telemedicine Digital diagnostics
– Watches – Bands
Ultra-fast scans Wearables Digital therapy Concierge Networks and coaching Self-insured people
31
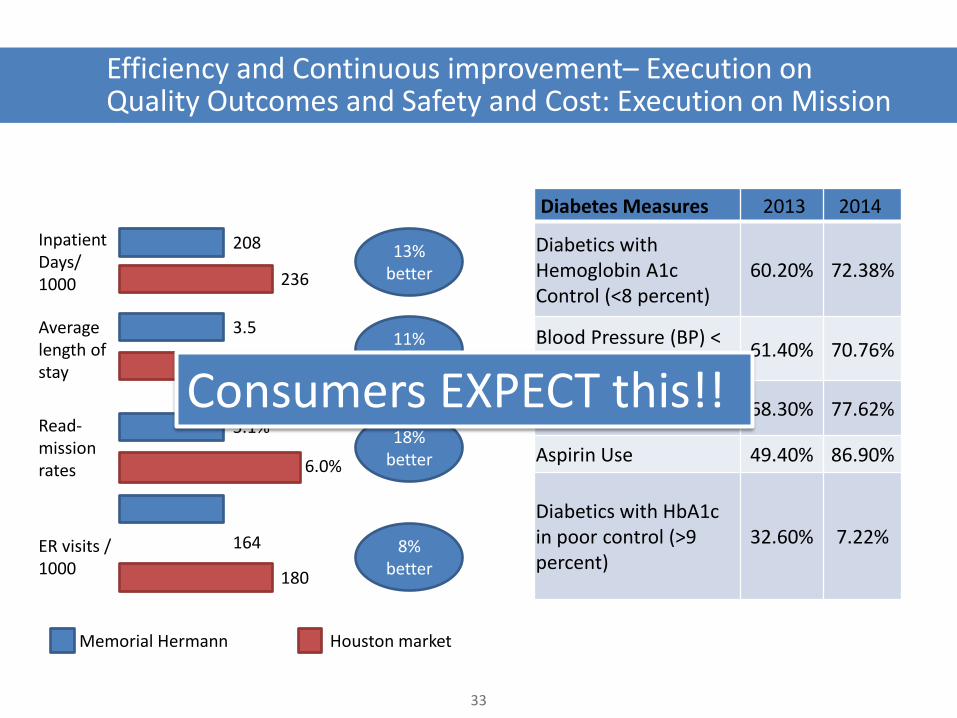
Efficiency and Continuous improvement– Execution on Quality Outcomes and Safety and Cost: Execution on Mission
Inpatient Days/ 1000
Read-mission rates
ER visits / 1000
208
236
5.1%
6.0%
Memorial Hermann
180
Average length of stay
3.5
3.9
13% better
18% better
11% better
8% better
Houston market
164
32
Diabetes Measures 2013 2014
Diabetics with Hemoglobin A1c Control (<8 percent)
60.20% 72.38%
Blood Pressure (BP) < 140/90 61.40% 70.76%
Tobacco Non-Use 68.30% 77.62%
Aspirin Use 49.40% 86.90%
Diabetics with HbA1c in poor control (>9 percent)
32.60% 7.22%
10% Lower Cost
Best in Quality
$58,000,000 year one savings
Efficiency and Continuous improvement– Execution on Quality Outcomes and Safety and Cost: Execution on Mission
Inpatient Days/ 1000
Read-mission rates
ER visits / 1000
208
236
5.1%
6.0%
Memorial Hermann
180
Average length of stay
3.5
3.9
13% better
18% better
11% better
8% better
Houston market
164
33
Diabetes Measures 2013 2014
Diabetics with Hemoglobin A1c Control (<8 percent)
60.20% 72.38%
Blood Pressure (BP) < 140/90 61.40% 70.76%
Tobacco Non-Use 68.30% 77.62%
Aspirin Use 49.40% 86.90%
Diabetics with HbA1c in poor control (>9 percent)
32.60% 7.22%
Consumers EXPECT this!!
Early Success
34
Edge Clinically Integrated, Proven Results
$7,162 $7,076
$7,725 $7,408
$7,672 $8,071
$7,162 $7,664
$8,008
$8,569 $8,869
$9,328
$7,162
$7,747
$8,444
$9,190
$9,910
$10,770
$6,000
$7,000
$8,000
$9,000
$10,000
$11,000
$12,000
FY 2010 FY 2011 FY 2012 FY 2013 Projected FY2014
Projected FY2015
Actual/ProjectedPEPY Claims Cost
MHHS TrendedPEPY Claims Cost
National TrendedPEPY Total ClaimsCost
Early Success
35
Edge Clinically Integrated, Proven Results
$7,162 $7,076
$7,725 $7,408
$7,672 $8,071
$7,162 $7,664
$8,008
$8,569 $8,869
$9,328
$7,162
$7,747
$8,444
$9,190
$9,910
$10,770
$6,000
$7,000
$8,000
$9,000
$10,000
$11,000
$12,000
FY 2010 FY 2011 FY 2012 FY 2013 Projected FY2014
Projected FY2015
Actual/ProjectedPEPY Claims Cost
MHHS TrendedPEPY Claims Cost
National TrendedPEPY Total ClaimsCost
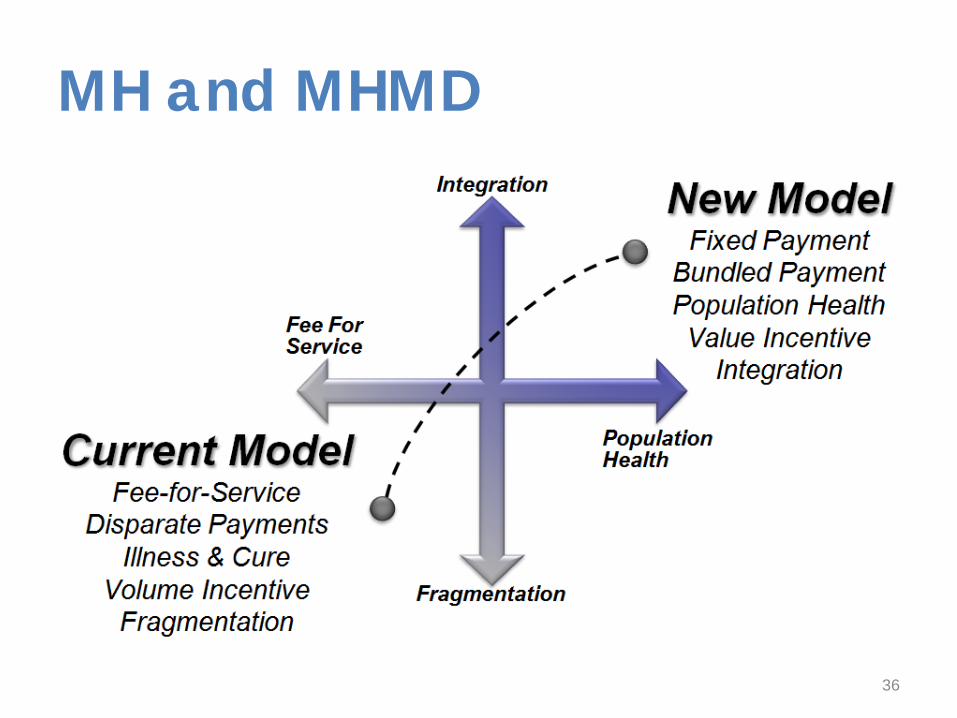
MH and MHMD
36
Implementation Communications KBR used a multi-pronged media strategy to communicate the new ACO to Houston employees
Expectations and Results
Yr-1: 12%
Enrollment (Houston) Age Distribution
Utilization Cost Savings Member Satisfaction
Expectations Monitoring claim utilization for improvement
Reduction in unit cost trend
Better care experience and lower out-of-pocket costs
Results Early indicators are promising for key ACO metrics
Greater average discounts than national network
Positive feedback and $400+ savings last year in out-of-pocket cost
Key Takeaways
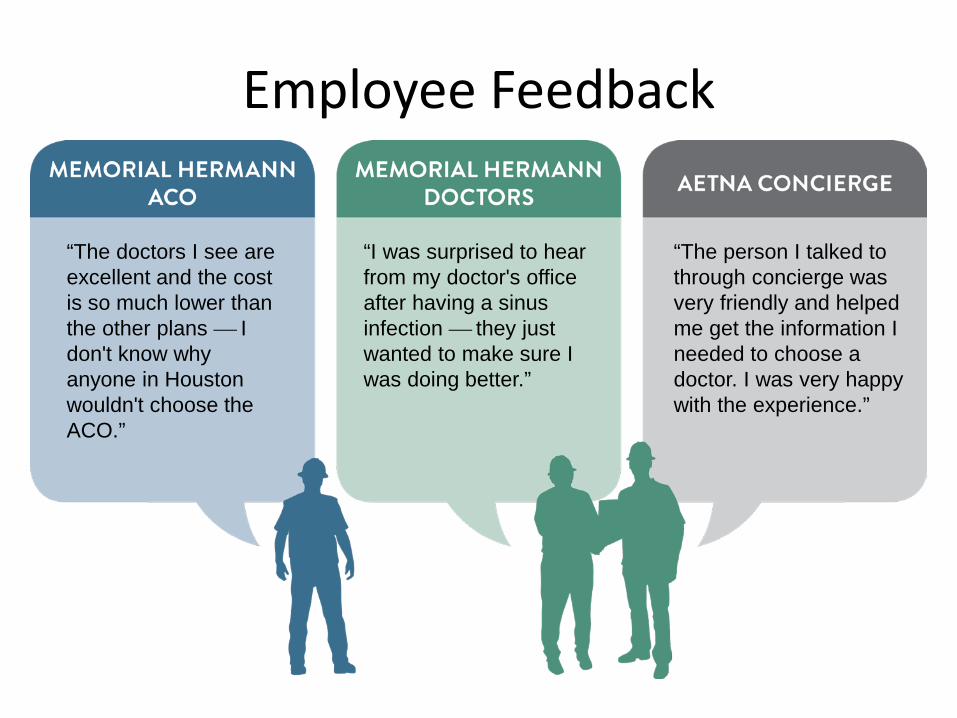
Employee Feedback
“The doctors I see are excellent and the cost is so much lower than the other plans I don't know why anyone in Houston wouldn't choose the ACO.”
“The person I talked to through concierge was very friendly and helped me get the information I needed to choose a doctor. I was very happy with the experience.”
“I was surprised to hear from my doctor's office after having a sinus infection they just wanted to make sure I was doing better.”
ACO Partnership
Strategies for Achieving a Healthy Bottom Line
Omar C. Reid
Human Resources Director City of Houston
42
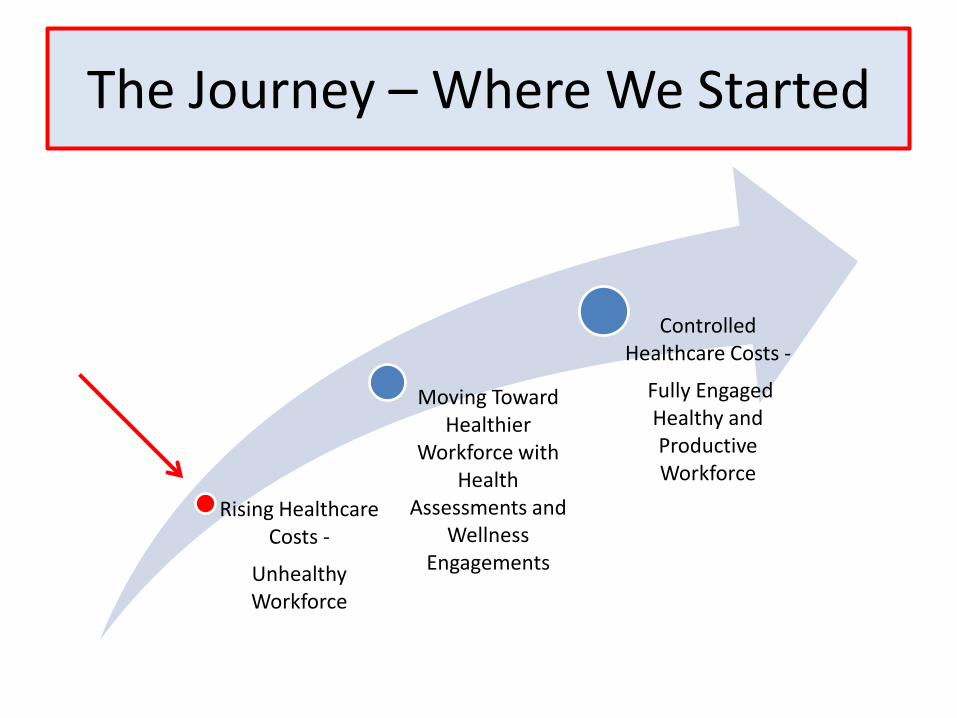
The Journey – Where We Started
Rising Healthcare Costs -
Unhealthy Workforce
Moving Toward Healthier
Workforce with Health
Assessments and Wellness
Engagements
Controlled Healthcare Costs -
Fully Engaged Healthy and Productive Workforce
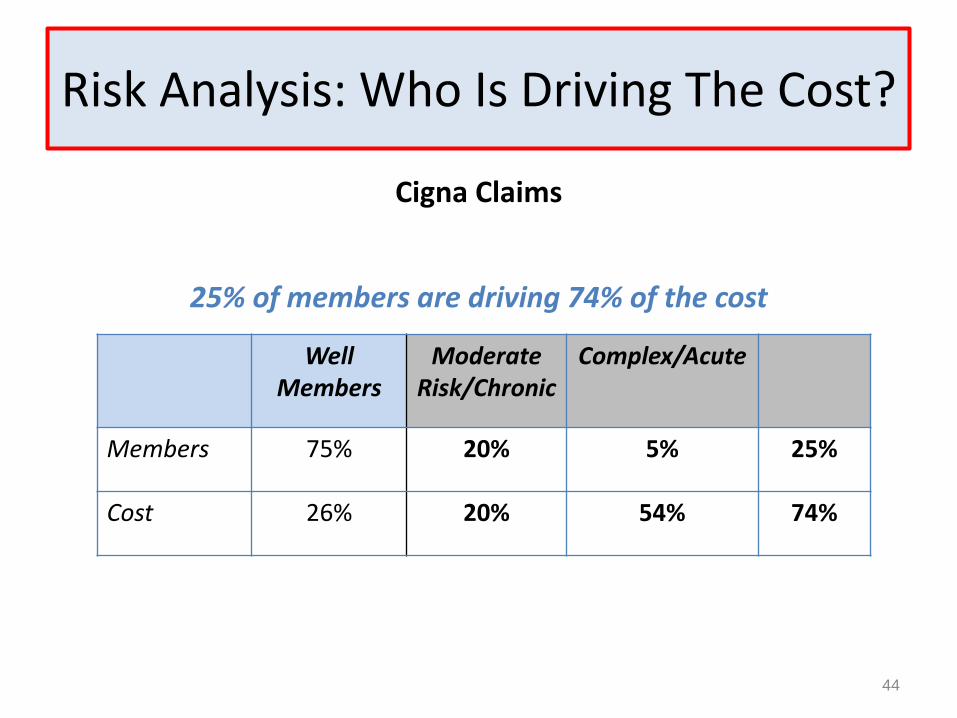
Risk Analysis: Who Is Driving The Cost?
Cigna Claims
25% of members are driving 74% of the cost
Well Members
Moderate Risk/Chronic
Complex/Acute
Members 75% 20% 5% 25%
Cost 26% 20% 54% 74%
44
45
The Strategy
45
• Change culture:
Reactive to proactive Employees become educated consumers and assume
accountability/ownership City assumes the financial risk and aggressively manages the
program • Strong foundation with HRA and biometrics • Align with IPAs working through a capitated model • Engage at-risk individuals and provide tools for those not yet at
risk • Encourage employees to use highest quality, best value
community reflective physicians (Kelsey #1)
Bottom line: Improved Health = Higher Cost Avoidance and Higher Productivity
STRATEGIES THAT IMPACTED THE BOTTOM LINE
ENGAGEMENT, ALIGNMENT, AGILITY
“Effort Is Nice Results Count”
46
Results of Increased Accountability Engagement
• Health Assessments lead to increased awareness and targeted programs – Increased chronic illness management
• Increased awareness leads to increased utilization of preventive care services – Increased from 29% to 52%
• Increased preventive care leads to more proactive care, improved quality of life, more productive workforce and ultimately, reduces the rate that costs increase – 30% increase in maintenance prescriptions
47
Results of Increased Affordability Alignment
• No health premium increases in last two years – Decreased premiums by 8.6% in 2012
• Decreased co-payments and co-insurance
– Decreased specialist payments for COH employees
• Increased preventive care leads to more proactive care, improved quality of life, more productive workforce and ultimately, reduces the rate that costs increase – Increased Generic Dispense Rate over 85%
48
Results of Increased Accessibility Agility
• Kelsey Clinics are located where our employees live and work – By having convenient neighborhood clinics
increases probability of scheduling and keeping appointments
• City initial concerned about increased
appointment wait times never materialized – Employees are seen with 24 to 48 hours
• Employees report increased satisfaction
because all services under one roof – Kelsey received the highest level of satisfaction in
Note: Trend rate is calculated from the claim costs per employee per month using a least squares regression analysis. Claims represent total City of Houston expenditures including pooled claims but excluding claims for Grand retirees and for Vision. No adjustment is made for plan design changes over the period. Experience from May through August 2011 is excluded due to influence of BCBS run-out.