January 2016 1 HBM Pharma/Biotech M&A Report 2016 Biopharma M&A in 2015 including in-depth analysis of trade sales of US and European biopharma companies backed by venture and private-equity investors Key Findings Record worldwide biopharma M&A volume in 2015 of $430 billion (including contingent payments, asset deals and announced deals, such as the $160 billion merger of Allergan/Pfizer). Record deal value of $216 billion in 2015 from completed US and European transactions (company trade sales and asset deals). $196 billion deal volume from completed US transactions (up from $90 billion in 2014), lower transaction volume in Europe of $20 billion (down from $50 billion in 2014). Largest completed transactions in 2015 (target/buyer): $70.5 billion Allergan (US)/Actavis (renamed to Allergan), $21 billion Pharmacyclics (US)/Abbvie, $17 billion Hospira (US)/Pfizer, $10.9 billion Salix (US)/Valeant. Largest announced (not completed) deals: $160 billion takeover of Allergan by Pfizer, $40.5 billion sale of Allergan’s generics business to Teva and the acquisition of Dyax (US) for $5.9 billion by Shire (UK). Modest $6 billion M&A volume in Asia and rest-of-the-world (down from $12 billion in 2014). Largest deal: Acquisition of Mexican generics firm Rimsa by Teva for $2.3 billion. 21 US and European biopharma companies sold for at least $1 billion (up from 14 in 2014). Trade sales of PE- and VC-backed US and European biopharma firms generated record transaction volume with strong returns to investors. About the HBM Pharma/Biotech M&A Report The HBM Pharma/Biotech M&A Report covers all completed trade sales of US and European biotechnology and pharma companies with a therapeutic focus (Rx incl. generics as well as OTC). For 2014 and 2015, additional data for asset deals, announced deals and transactions outside of US and Europe is provided. The report does not cover nutritional supplements, diagnostics, medical technology, digital health, life sciences tools, CROs, pharma manufacturing and services. Reverse mergers or minority investments are not included. Acquisitions that were structured as mergers for tax or other reasons are included. Upfront transaction value is defined in this report as the upfront consideration in cash and/or shares. By contrast, the total transaction value also includes contingent (“biodollar”) payments linked to reaching certain milestones. Additional data such as invested capital, exit multiples, stage of lead product etc were collected from various sources. Please note that such data may be based on estimates and may not have been available for all transactions. Also, the results presented in this report may deviate from our earlier reports due to subsequent reclassification or correction of data. Further information about the HBM Pharma/Biotech M&A Report including a list of all transactions can be found under www.hbmpartners.com/report. The use of data and charts is permitted with reference to “HBM Partners Pharma/Biotech M&A Report”. The authors of the report welcome any feedback or corrections: Dr. Ulrich Geilinger, [email protected], Dr. Chandra Leo, [email protected]and Dr Emil Bujak, [email protected]
Transcript
January 2016
1
HBM Pharma/Biotech M&A Report 2016 Biopharma M&A in 2015 including in-depth analysis of trade sales of US and European biopharma companies backed by venture and private-equity investors
Key Findings
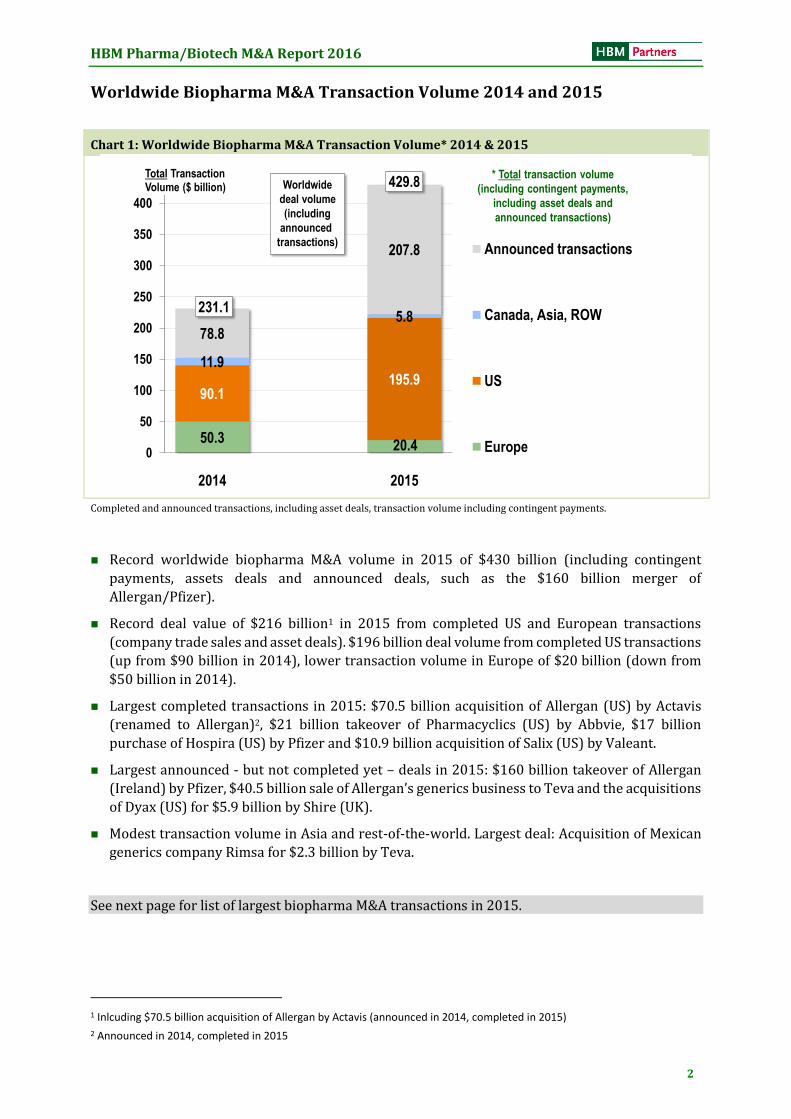
Record worldwide biopharma M&A volume in 2015 of $430 billion (including
contingent payments, asset deals and announced deals, such as the $160 billion merger
of Allergan/Pfizer).
Record deal value of $216 billion in 2015 from completed US and European transactions
(company trade sales and asset deals). $196 billion deal volume from completed US
transactions (up from $90 billion in 2014), lower transaction volume in Europe of
$20 billion (down from $50 billion in 2014).
Largest completed transactions in 2015 (target/buyer):
$70.5 billion Allergan (US)/Actavis (renamed to Allergan), $21 billion Pharmacyclics
Largest announced (not completed) deals: $160 billion takeover of Allergan by Pfizer,
$40.5 billion sale of Allergan’s generics business to Teva and the acquisition of Dyax
(US) for $5.9 billion by Shire (UK).
Modest $6 billion M&A volume in Asia and rest-of-the-world (down from $12 billion in
2014). Largest deal: Acquisition of Mexican generics firm Rimsa by Teva for $2.3 billion.
21 US and European biopharma companies sold for at least $1 billion (up from 14 in
2014).
Trade sales of PE- and VC-backed US and European biopharma firms generated record
transaction volume with strong returns to investors.
About the HBM Pharma/Biotech M&A Report
The HBM Pharma/Biotech M&A Report covers all completed trade sales of US and European biotechnology and pharma companies with a therapeutic focus (Rx incl. generics as well as OTC). For 2014 and 2015, additional data for asset deals, announced deals and transactions outside of US and Europe is provided.
The report does not cover nutritional supplements, diagnostics, medical technology, digital health, life sciences tools, CROs, pharma manufacturing and services. Reverse mergers or minority investments are not included. Acquisitions that were structured as mergers for tax or other reasons are included.
Upfront transaction value is defined in this report as the upfront consideration in cash and/or shares. By contrast, the total transaction value also includes contingent (“biodollar”) payments linked to reaching certain milestones.
Additional data such as invested capital, exit multiples, stage of lead product etc were collected from various sources. Please note that such data may be based on estimates and may not have been available for all transactions. Also, the results presented in this report may deviate from our earlier reports due to subsequent reclassification or correction of data.
Further information about the HBM Pharma/Biotech M&A Report including a list of all transactions can be found under www.hbmpartners.com/report. The use of data and charts is permitted with reference to “HBM Partners Pharma/Biotech M&A Report”.
The authors of the report welcome any feedback or corrections:
Trade Sales of Private PE-Backed Biopharma Companies
incl. $13.7 bn
Nycomed/
Takeda
incl. $8.7 bn
Bausch&L./
Valeant
Number of PE-backed
private companies sold
incl. $4.5 bn
Omega/
Perrigo
Trade sales of private US & European biopharma companies (completed transactions)
incl. $8.05 bn
Par Pharm./
Endo
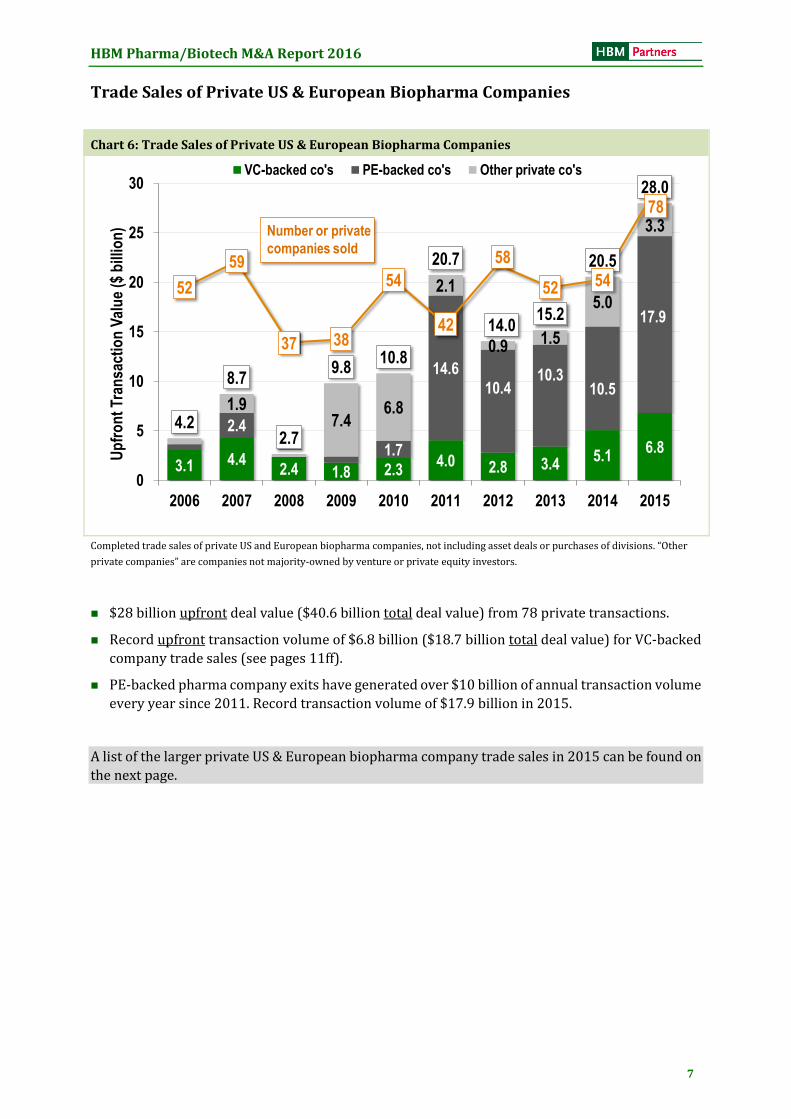
Completed trade sales of PE-backed private US and European biopharma companies
As in previous years, buyout funds took advantage of the good exit environment selling 8 PE-
backed pharma companies with a record total deal value of $17.9 billion. 6 private-equity-
backed companies were sold for over $1 billion each, with the sale of Par Pharmaceuticals (US)
to Endo (Ireland) for $8.05 billion as the largest transaction.
While investor returns from these deals were not as spectacular as in some trade sales of VC-
backed biopharma companies, multiples were generally strong with some high absolute gains.
It is rumored that TPG made a $5 billion gain on its investment in Par Pharmaceuticals.
More details on PE-backed biopharma company trade sales in 2015 can be found on the next page.
Private-Equity Funds Investing in the Pharma Sector
During the last 10 years (2006-2015) buyout and private-equity funds have purchased 24 biopharma companies (mainly in specialty pharma, generics and OTC fields) for a total transaction volume of around $6 billion. Most such transactions were done in the recovery period after the financial crisis (2011-2013). As valuations in the sector increased, financial buyers were less active and in 2015 only one significant buyout was recorded: the purchase of a majority in PaxVax (US) by Cerberus for $105 million. Additionally, a few acquisitions have been completed by PE-backed pharma firms such as the purchase of US Vista Pharm by Vertice (value not disclosed), an acquisition vehicle financed by Warburg Pincus.
Based on the strong returns from the sale of PE-backed pharma companies, we expect the appetite of buyout funds for the sector to increase, especially if valuations come back to lower levels.
HBM Pharma/Biotech M&A Report 2016
10
Trade Sales of Private Equity-Backed Pharma Companies During 2015 (ranked by transaction value, headline: Target Company / Buyer / Transaction Value / Business)
Par Pharmaceuticals (US) / Endo (Ireland) / $8.05 billion / Specialty generics In May 2015, Endo International announced the takeover of Par Pharmaceutical for $8.05 billion which includes certain debt. TPG Capital took Par private in a $1.84 billion transaction in 2012. It was reported that TPG Capital will score a $5 billion profit, or about 6.5 times its investment, from its sale of Par Pharmaceutical, holding the company for less than three years.
AMCo (US) / Concordia Healthcare (Canada) /$3.54 billion / Generics In October 2015, AMCo was sold to Concordia Healthcare, in a deal that values the maker of generic drugs at £2.3 billion ($3.5 billion) including debt. Generics producer Amdipharm was acquired in October 2012 by UK buyout house Cinven for £367 million ($590 million). The private company, founded in 2002, had revenues of over £110 million. Cinven reported that Amdipharm was combined with Mercury Pharma, acquired in September 2012. Thereafter Amdipharm Mercury (AMCo) acquired Abcur in 2013, Focus Pharma in 2014 and Primegen in 2015. Investment returns for Cinven were not disclosed. Considering the original purchase price for Amdipharm, a multiple of over 3x can be estimated.
Ikaria (US) / Malinckrodt (UK) / $2.3 billion / Neonatal intensive care In Q2 15, Mallinckrodt, a leading global specialty biopharmaceutical company, purchased Ikaria in a transaction valued at approximately $2.3 billion. In early 2014, Madison Dearborn Partners bought hospital therapy provider Ikaria Inc. in a transaction that valued the company at $1.6 billion. Existing venture investors in Ikaria reinvested some of the proceeds into a 45 percent stake in the company. The sale is expected to produce a 140% IRR for Madison Dearborn or a multiple of over 2x. Not a bad outcome, considering that the investment was held not much longer than one year.
Therakos (US) / Malinckrodt (UK) / $1.325 billion / Palliative treatment In August 2015, Mallinckrodt, the global specialty pharma company, purchased Therakos for $1.325 billion. In October 2012, the Gores Group acquired Therakos from Ortho Clinical Diagnostics, a Johnson & Johnson Company. Deal terms were not disclosed. Therakos offers extracorporeal photopheresis immune modulation therapy for the palliative treatment of certain skin cancers. The company has sales of close to $200 million. Investment returns for Gores are not known. However, the investment multiple is believed to be attractive.
The Harvard Drug Group (US) / Cardinal Health (US) / $1.1 billion / Drug distribution, generics In June 2015, Cardinal Health agreed to buy Harvard Drug Group for about $1.12 billion in a move aimed at boosting the drug wholesaler’s core generics business. Court Square acquired Harvard Drug, mainly active in drug distribution, in 2010 from H.I.G. Capital. No return multiples are available for the transaction.
Cord Blood Registry CBR (US) / AMAG Pharmaceuticals (US) / $700 million / Newborn stem cells In June 2015, GTCR announced that CBR will be acquired by AMAG Pharmaceuticals, Inc. a specialty pharmaceutical company that focuses on maternal health and hematology, for $700 million. Founded in 1992, Cord Blood registry (CBR) is the world’s largest newborn stem cell company. In September 2012, GTCR partnered with life sciences executive Geoffrey Crouse to acquire CBR. No investment returns for the deal are available.
Crealta (US) / Horizon Pharma (US) / $510 million / Specialty pharma, gout treatment In December 2015, Horizon Pharma acquired Crealta for $510 million in cash. Crealta was formed in 2013 by Ed Fiorentino and GTCR, a private equity fund, to acquire specialty pharma products. Still in 2013, the company acquired the assets of Savient (for $120 milllion) including its product Krystexxa to treat chronic refractory gout. It is estimated that Crealta had sales of over $50 million in 2015. Investment multiples for GTCR are not disclosed, but is estimated the multiple was around 3x to 5x.
IDIS (UK) / Clinigen (UK) / $340 million / Distribution of unlicensed medicines In April 2015, IDIS was sold to Clinigen Group plc, the AIM-listed specialty pharmaceuticals and pharmaceuticals services company, for an enterprise value of $338 million (£225 million). UK CBPE capital acquired IDIS in 2005 for approximately $35 million. IDIS is the global leader in providing regulatory and ethically compliant access to unlicensed medicines for healthcare professionals and their patients in over 100 countries. The sale to Clinigen represents a money multiple of 22x to CBPE on its approx. $15 million (£9.4 million) investment in IDIS.
HBM Pharma/Biotech M&A Report 2016
11
Trade Sales of Private VC-Backed US and European Biopharma Companies
Chart 8: Trade Sales of Private VC-Backed US and European Biopharma Companies
11Source: HBM Pharma/Biotech M&A Report
Trade Sales of VC-Backed Private Biopharma Companies
3.14.4
2.4 1.8 2.34.0
2.8 3.45.1
6.8
3.55.2
3.6 4.7 4.7
6.7
7.4
6.88.4
18.7
28
31
25
18
2827
28
2325
35
0
5
10
15
20
2006 2007 2008 2009 2010 2011 2012 2013 2014 2015
Tran
sact
ion
Val
ue
($ b
illio
n)
Upfront transaction value
Total transaction value
Number of VC-backed
companies sold
Trade sales of private VC-backed US & European biopharma companies
Chart 9: Upfront Transaction Volumes US vs. Europe
Trade Sales of VC-Backed Private Pharma/Biotech Companies
1.20.5 0.8 0.7 0.3 0.4 0.6
1.00.5
3.9
1.9
3.8
1.61.1
1.9
3.6
2.1 2.4
4.5
2.9
14 14 14
98
910
5
98
16
14
1716
10
19
17
23
14
17
0
1
2
3
4
5
6
2006 2007 2008 2009 2010 2011 2012 2013 2014 2015
Up
fro
nt
Tran
sact
ion
Val
ue
($ b
illio
n)
Upfront Transaction Value Europe US
Number of US
trade sales
Trade sales of private VC-backed US & European biopharma companies
Number of European
trade sales
Completed trade sales of private VC-backed US and European biopharma companies.
The 35 VC-backed companies sold in 2015 generated record upfront and total deal values.
The $2.5 billion purchase of 55% of Acerta (Netherlands) 1 by Astra Zeneca pushed European
deal values in 2015 above US numbers.
2014 and 2015 were the best “exit years” for VC-backed US and European biopharma companies
(see next pages).
1 Note: Acerta also had operations in the US. In addition to the upfrtont, AstraZenaca will make an unconditional payment
of $1.5 billion and has the right to acquire the remaining 45% for $3 billion. The deal is recorded in our database with $2.5 billion upfront and $7 billion total deal value.
HBM Pharma/Biotech M&A Report 2016
12
Average Values of VC-Backed US & European Biopharma Companies Sold
Chart 10: Average Investment Amounts & Transaction Values
13Source: HBM Pharma/Biotech M&A Report
161
191171
313
203
317 320
376
420
667
139
161
113 119 103
192
126
190
267 251
51 6643 58 48
66 56 53 47 45
0
100
200
300
400
500
600
700
2006 2007 2008 2009 2010 2011 2012 2013 2014 2015
Ave
rag
e V
alu
es (
$ m
illio
n)
Average Total Transaction Value
Average Upfront Transaction Value
Average Invested Capital
Average Investment / Average Upfront and Total Deal Values
Only for transactions where respective
information was available.
Trade sales of private VC-backed US & European biopharma companies
Trade sales of private VC-backed US and European biopharma companies
High average upfront and record average total deal values in 2015 from VC-backed company
exits. Average upfront payments in 2014 and 2015 over $250 million. Average total deal value
in 2015 over $600 million!
Median deal values are substantially lower (especially in years such as 2015 with many smaller
transactions and a few large deals):
2013 2014 2015
Median upfront deal values ($ million): 155 133 100
Median total deal values ($ million): 314 221 190
Exceptional Deals in 2015
In 2015, quite a number of VC-backed biopharma companies were sold for high upfront and even higher total multiple. We would like to mention just three exceptional deals:
AstraZeneca purchased 55% of Acerta Pharma (with operations in the Netherlands and the US) for $2.5 billion upfront plus a further unconditional payment of $1.5 billion. AstraZeneca has the right to acquire the remaining 45% for $3 billion. Investors are reported to have invested $550 million in the company.
Investors in US Sprout Pharmaceuticals with an approved women’s sexual health drug also made an estimated 8x on their $1 billion sale to Valeant.
Only an estimated $20 million was invested in Dutch Dezima which was sold to Amgen for $300 million upfront plus over $1 billion contingent payments. Mitsubishi Tanabe from which Dezima licensed its cholesterol lowering drug, will also get a part of the deal proceeds.
HBM Pharma/Biotech M&A Report 2016
13
Contingent Payments in VC-Backed Biopharma Trade Sales
Comment: Acquisitions of VC-backed biopharma companies, especially pre-commercial ones, are often
structured as staged deals, whereby a significant portion (sometimes the majority) of payments are linked to
the achievement of certain milestones. Whereas in the years up to 2008, fewer deals were staged, contingent
payment structures are quite common.
Chart 11: Contingent „Biodollar“ Payments as % of Total Deal Value
Average Multiples On Total Deal Value – US vs. Europe
Only for transactions where respective
information was available.
36%
29%
36%39%
36%
19%
7%9% 8%
0%
21%
26%
32%
22%
29%31%
29%
48%
44%
60%
0%
10%
20%
30%
40%
50%
60%
2006 2007 2008 2009 2010 2011 2012 2013 2014 2015
% of All VC-Backed Company Trade Sales
"Losers" (loss making deals)
"Winners" (at least 3x return to investors)
Trade sales of private VC-backed US & European biopharma companies
Trade sales of private VC-backed US and European biopharma companies. Only transaction were return estimates were available.
“Losers” = Transactions with upfront value below investment amount.
“Winners” = Transactions were investors made 3x or more (based in estimates in some cases)
Up to 2010, the number of “losers” was higher than the number of “winners”.
In 2015, no trade sale of a VC-backed biopharma company (with reported deal values) produced
a loss. Note: As deal values were not reported for all transactions, it may well be that there was
a “loser” in 2015.
60% of transactions in 2015 generated a 3x or more on invested capital.
Investor Returns and Stage of Lead Product
Multi-year return multiples for companies of all stages have on average been quite similar (with an upward trend for all stages after 2012). Pre-clinical and phase I companies sold in the ten years from 2006-2015 generated on average slightly higher multiples than later-stage companies (which generally generated higher absolute gains). In 2015, however, pre-clinical and phase I companies were sold at a (non-weighted) average multiple of around 11x* (upfront value divided by investment) vs. an average of 5x for the later-stage companies. Thus, early-stage companies with “hot” drugs or discovery platforms have generated great investor returns recently.
As there was a high variance in exit multiples (from company to company and from year to year), any such conclusion should be interpreted with caution.
* 14x for pre-clinical/phase I oncology companies and 9.6x for other pre-clinical/phase I companies
HBM Pharma/Biotech M&A Report 2016
16
Investor Returns US vs. Europe
Chart 14: Investor Returns US vs. Europe (Upfront Multiples)
17Source: HBM Pharma/Biotech M&A Report
Average Multiples On Upfront Deal Value – US vs. Europe
Only for transactions where respective
information was available.
2.4x
3.2x
2.1x2.0x
2.0x
3.2x2.7x
3.4x
6.6x7.0x
3.5x
1.0x
3.4x
1.9x
1.2x 1.2x1.5x
4.2x
2.6x
4.3x
0
1
2
3
4
5
6
7
8
9
2006 2007 2008 2009 2010 2011 2012 2013 2014 2015
Rat
io /
Mu
ltip
le
Weighted-average upfront multiples US
Weighted-average upfront multiples Europe
Trade sales of private VC-backed US & European biopharma companies
Actual investor multiples
approx. 20%-25% lower!
Trade sales of private US and European VC-backed biopharma companies. Weighted-average total multiples calculated by dividing
sum of upfront deal value by sum of invested capital.
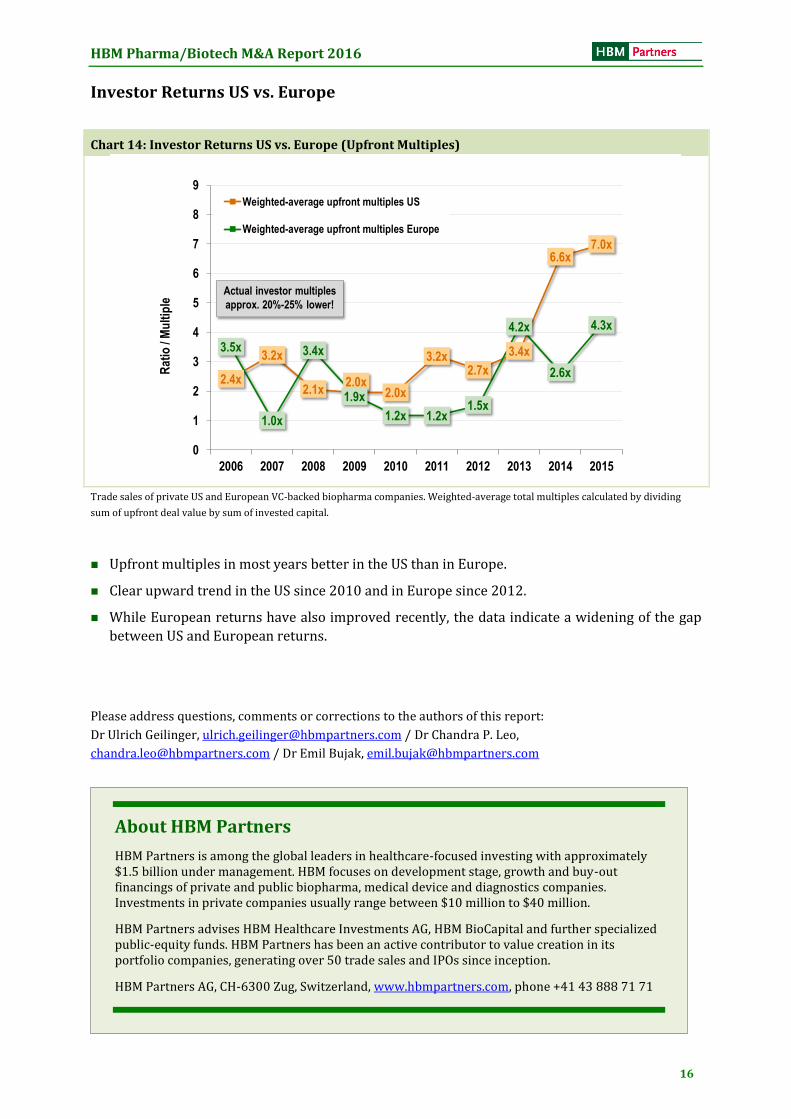
Upfront multiples in most years better in the US than in Europe.
Clear upward trend in the US since 2010 and in Europe since 2012.
While European returns have also improved recently, the data indicate a widening of the gap
between US and European returns.
Please address questions, comments or corrections to the authors of this report:
HBM Partners is among the global leaders in healthcare-focused investing with approximately $1.5 billion under management. HBM focuses on development stage, growth and buy-out financings of private and public biopharma, medical device and diagnostics companies. Investments in private companies usually range between $10 million to $40 million.
HBM Partners advises HBM Healthcare Investments AG, HBM BioCapital and further specialized public-equity funds. HBM Partners has been an active contributor to value creation in its portfolio companies, generating over 50 trade sales and IPOs since inception.