66
e Irish Health Behaviour in School-aged Children (HBSC) Study 2010
| Date post: | 20-Feb-2017 |
| Category: |
Documents |
| Upload: | samantha-loughrey |
| View: | 28 times |
| Download: | 1 times |

The Irish Health Behaviour in School-aged Children (HBSC) Study 2010

ii

1
The Irish Health Behaviour in School-aged Children (HBSC) Study 2010
February 2012
Colette Kelly, Aoife Gavin, Michal Molcho and Saoirse Nic Gabhainn.
Health Promotion Research CentreNational University of Ireland, Galwaywww.nuigalway.ie/hbsc

2
The Irish Health Behaviour in School-aged Children (HBSC) Study 2010
© Copyright 2012Health Promotion Research Centre, National University of Ireland, GalwayDepartment of Health, Government of Ireland, Dublin
Published by the Department of Health and National University of Ireland, Galway.
ISBN: 978-1-908358-02-8
A version of the report in Irish is available online at: www.nuigalway.ie/hbsc
The Irish Health Behaviour in School-aged Children (HBSC) Study 2010
3
Foreword .............................................................................4
Introduction .......................................................................5
Executive Summary ..........................................................6
Methodology ......................................................................9
Results ................................................................................11
General Health ............................................................13
Smoking ........................................................................19
Alcohol ..........................................................................23
Drug Use .......................................................................27
Food and Dietary Behaviour ....................................29
Exercise and Physical Activity .................................41
Self-care ........................................................................47
Injuries ..........................................................................51
Physical Fighting and Bullying ................................53
Sexual Health Behaviours ........................................57
Appendix ...........................................................................59
Project Team .....................................................................62
Acknowledgements .........................................................63
Contents
Entries below are clickable links.

4
Foreword
Once again, we have been given a window into the health behaviours of school-going children – an insight that is invaluable for how we approach policy in various domains. This adds to the body of research already available on the lifestyles and health behaviours of Irish people; and we use this information with one aim in mind: To improve and protect the health of the Irish population.
The Health Behaviour in School-aged Children (HBSC) survey provides us with a roadmap for the future direction of policy to improve and protect the health of the nation: It tells us the areas where policy needs to adjust and focus; the future trends in relevant behaviours; so as to assist Government in addressing
the behavioural trends that are a source of concern, or indeed to prevail with existing policy where encouraging positive behaviour trends have been reported.
The context of this research study is the World Health Organization: HBSC is a cross-national research study conducted in collaboration with the WHO Regional Office for Europe that has 43 participating countries and regions; and this is the fourth time that my Department has funded the Irish phase of the study. This gives us the opportunity to continue monitoring and identifying health behaviour trends in a way that is comparable with other participating countries.
The survey describes health behaviours in children aged between 9 to 18 years. While some responses from children indicate little change from those reported in 2006, other data are encouraging: I am heartened that the proportion of children who have smoked tobacco has decreased, similar to the trend in alcohol consumption and use of cannabis; nutrition and dietary trends also appear to be – on balance – positive with more children eating vegetables and a decrease in the consumption of sweets and soft drinks; but I am disheartened to note that an overall increase has been reported in the proportion of children who report experiencing hunger. Finally, for the first time, the study includes the sexual health behaviours of children aged between 15 and 17 years. Overall the survey provides us with essential lifestyle information that my Department will use in promoting healthy lifestyles in health and other sectors.
I wish to acknowledge the work of the Health Promotion Research Centre at the National University of Ireland, Galway in compiling this study. Finally I would like to thank all those students who took time to complete the questionnaires, their parents and the staff from the participating schools for their support.
Dr James ReillyMinister for Health

5
Introduction
This report presents data from the HBSC Ireland 2010, the Irish Health Behaviour in School-aged Children survey. The 2010 HBSC survey is the fourth time that data of this kind have been collected from young people across the Republic of Ireland; previous surveys were conducted in 2006, 2002 and 1998 (www.nuigalway.ie/hbsc).
HBSC is a cross-sectional research study conducted in collaboration with the World Health Organization (WHO) Regional Office for Europe. The HBSC international survey runs on an academic 4-year cycle and in 2009/2010 there were 43 participating countries and regions (www.hbsc.org). The overall study aims to gain new insight into, and increase our understanding of young people’s health and well-being, health behaviours and their social context. As well as serving a monitoring and a knowledge-generating function, one of the key objectives of HBSC has been to inform policy and practice.
Cross-nationally, HBSC collects information on the key indicators of health, health attitudes and health behaviour, as well as the context of health for young people. HBSC is a school-based survey with data collected through self-completion questionnaires administered by teachers in the classroom. The HBSC survey instrument is a standard questionnaire developed by the international research network. The areas of interest are chosen in collaboration with the WHO and are designed to help assist developments at a national and international level in relation to youth health.
The issues identified for inclusion in this first report from the 2010 Irish survey mirror the 2006 national HBSC report and were identified by the Advisory Board and within key national Strategy documents. These include general health, smoking, use of alcohol and other substances, food and dietary behaviour, exercise and physical activity, self-care, injuries and bullying. In addition, children aged 15 and over were also asked, for the first time in the Irish HBSC survey, to report their sexual health behaviours and these data are presented here. Statistically significant differences by gender, age and social class are presented in this report.
The HBSC study was funded by the Department of Health and the Department of Children and Youth Affairs. The survey and analyses were carried out at the Health Promotion Research Centre, National University of Ireland, Galway (NUI Galway).

6
Executive Summary
A summary of the main findings from HBSC Ireland 2010 is provided below:
General HealthOverall, the proportion of children who report excellent health (33%), feeling very happy (50%) and high life satisfaction (76%) remains stable from HBSC 2006. In general, younger children and boys are more likely to report positive health. Children from lower social class groups are less likely to report excellent health and high life satisfaction.
The proportion of 3rd and 4th class children who report excellent health (39%) and feeling very happy (70%) remains stable from 2006. There are no significant differences across gender or social class groups.
Substance useOverall, there is a decrease from 2006 in reports of tobacco, alcohol and cannabis use among school children in Ireland.
SmokingReports of current smoking (12%) and having ever smoked (27%) have declined since 2006 (15% and 36% respectively). Differences by age and social class are evident for both measures of smoking, with older children and those from lower social classes more likely to report both behaviours. Boys are more likely to report having ever smoked than girls, with a notable drop in ever smoking among older girls (47% in 2010 vs. 57% in 2006).
The proportion of 3rd and 4th class children who report that they have ever smoked (3%) has decreased from 2006 and reports of current smoking status remains the same (1%) as in 2006. Boys are more likely than girls to report such behaviours. There are no significant differences across social class groups.
AlcoholReports of alcohol consumption have decreased among school children in Ireland since 2006 with 46% of children reporting ever drinking (53% in 2006) and 21% reporting being current drinkers (26% in 2006). Rates of drunkenness (28% in 2010 vs. 32% in 2006) and reports of been drunk in the last 30 days (18% in 2010 vs. 20% in 2006) have also decreased. Age and gender differences are observed for all four measures of alcohol consumption, with older children and boys more likely to report drinking and drunkenness. Children from lower social classes are more likely to report having been ‘really drunk’.
Drug UseReported cannabis use, both in the past 12 months (8% in 2010 vs. 16% in 2006) and in the past 30 days (5% in 2010 vs. 7% in 2006), has decreased. Boys and older children are more likely to report use of cannabis. No social class differences are evident.

7
Food and Dietary BehaviourFood (e.g., vegetable) and dietary behaviours (e.g., dieting to lose weight) among school children in Ireland have improved or remain stable since HBSC 2006.
Food consumptionOverall, 20% of children report that they consume fruit more than once a day (19% in 2006) and 20% report eating vegetables more than once a day (18% in 2006). Girls, younger children and those from higher social classes are more likely to report regular fruit and vegetable consumption.
Overall the proportion of children who report eating sweets daily or more often (37% in 2010 vs. 39% in 2006), and who report soft drink consumption daily or more often (21% in 2010 vs. 26% in 2006) have decreased from 2006. Older children and children from lower social class groups are more likely to report regular consumption of sweets and soft drinks. Gender differences are also observed, with girls more likely to report frequent sweet consumption (39% girls vs. 34% boys) and boys more likely to report frequent intake of soft drinks (23% boys vs. 19% girls).
Similar patterns are evident among 3rd and 4th class children, with an increase in vegetable consumption (26% in 2010 vs. 21% in 2006), no change in fruit intake (30%) or sweets consumption (28%), and a decrease in soft drink consumption (15% in 2010 vs. 18% in 2006).
Food behavioursReports of never having breakfast on weekdays have not changed from 2006 (13% in 2010 vs. 14% in 2006). Girls, older children and those from lower social class groups are more likely to report that they never have breakfast on weekdays. The proportion of 3rd and 4th class children who report never having breakfast on weekdays also remains stable from 2006 (2%).
Children were asked to report how often they go to school or to bed hungry because there was not enough food at home. Overall, 21% of children report ever going to school or to bed hungry, an increase from 2006 (17%). Boys, younger children and those from lower social classes are all more likely to report going to school or to bed hungry.
Reports of dieting (or doing something else) to lose weight in 2010 (13%) remain stable from 2006 (12%). Girls and older children are more likely to report dieting (or trying) to lose weight.
Exercise and physical activityThere has been little change in reported frequency of exercise, physical activity and inactivity in HBSC 2010. Overall 51% of children report exercising four or more times a week (53% in 2006), 9% of children report participating in vigorous exercise less than weekly (10% in 2006) and 25% of children report being physically active on 7 days in the last week (27% in 2006). With each of these three measures, gender and age group differences are evident. In general, boys and younger children are more likely to be active. Children from lower social classes are

8
The Irish Health Behaviour in School-aged Children (HBSC) Study 2010
more likely to report inactivity and those from middle social classes are more likely to report being physically active on 7 days in the last week.
Among 3rd and 4th class children 70% report exercising four or more times a week (72% in 2006) and 7% report participating in vigorous exercise less than weekly (8% in 2006).
Self-careSelf-reported tooth brushing, at a frequency of more than once a day (67%), remains stable from 2006 (63%), with the same pattern evident among 3rd and 4th class children (66% in 2010 vs. 64% in 2006). Girls and children in higher social class groups are more likely to report brushing their teeth more than once a day. There are no significant differences across age groups.
Children were asked how often they use a seatbelt when in a car. Overall, 81% of children report always wearing a seatbelt, which remains stable from 2006 (79%). Girls and younger children are more likely to report always using a seatbelt.
InjuriesThere is an overall decrease in the number of children who report being injured and needing medical attention once or more in the last 12 months (37% in 2010 vs. 43% in 2006). Boys and older children are more likely to report ever being injured. Of those reporting an injury, 57% report that they missed 3 or more days of usual activity in the past year due to injury (56% in 2006). Gender and age differences are similar to those reported for injury prevalence, with no social class effect observed.
BullyingThe rates of children reporting ever being bullied remain unchanged since 2006 at 24%. However, the proportion of children reporting bullying others in the past couple of months has decreased (17% in 2010 vs. 22% in 2006). Boys are more likely to report both ever being bullied and that they have bullied others. Younger children are more likely to report having been bullied, while older children are more likely to report bullying others. There are no differences across social class groups.
The percentage of 3rd and 4th class children who report ever being bullied (37%) remains unchanged from 2006. There are no significant differences across gender or social class groups.
Sexual BehaviourOverall, 27% of 15-17 year olds report that they have ever had sex. Boys and those from lower social class groups are more likely to report ever having sex.
Of those who report ever having had sex, 93% report using a condom the last time they had sex and 59% report that they had used the birth control pill. Girls are more likely to report using the birth control pill as a form of contraceptive with no gender differences in reports of condom use as a form of contraceptive. There are no differences across social class groups.

The Irish Health Behaviour in School-aged Children (HBSC) Study 2010
9
Methodology
HBSC 2010 & Middle Childhood Survey
The HBSC survey is a WHO (European) collaborative study. Principal investigators from all countries/regions co-operate in relation to survey content, methodology and timing, and an international protocol is developed. Strict adherence to the protocol is required for inclusion in the international database and this has been achieved with the current study.
In the Republic of Ireland, sampling was conducted in order to be representative of the proportion of children in each of the 8 geographical regions. The objective was to achieve a nationally representative sample of school-aged children, and the procedures employed were the same as those for the 1998, 2002 and 2006 HBSC Ireland surveys. Data from the 2006 census was employed to provide a picture of the population distribution across geographical regions. The sampling frame consisted of primary and post-primary schools, lists of which were provided by the Department of Education and Science. A two-stage process identified study participants. Individual schools within regions were first randomly selected and subsequently, class groups within schools were randomly selected for participation. In primary schools classes from 3rd to 6th class groups were included, while in post-primary schools all classes, with the exception of Leaving Certificate groups (i.e., final year examination classes) were sampled.
School principals were first approached by post and when positive responses were received, HBSC questionnaires in Irish or English were offered, along with blank envelopes to facilitate anonymity, parental consent forms, information sheets for teachers and classroom feedback forms. All returns were facilitated through the provision of FREEPOST envelopes. In order to maximise response rates, postal reminders were sent to schools, followed by telephone calls from research staff at the Health Promotion Research Centre, NUI Galway. Data entry was conducted according to the International HBSC protocol. A summary of the methodology employed can be found in Table 1.
Data were collected from children in 3rd and 4th class, using an abbreviated version of the main HBSC questionnaire. Data on sexual health behaviours were only collected from the older age group.

10
The Irish Health Behaviour in School-aged Children (HBSC) Study 2010
Table 1: Summary of methodology for the HBSC Survey
Population School going children aged 9-18 years
Sampling Frame Department of Education and Science school lists
Sample Cluster sample of students in a given classroom
StratificationProportionate to the distribution of pupils across geographical regions
Survey Instrument Self-completion questionnaire
Delivery/RemindersPostal delivery via principals and teachers, letter and telephone reminders
Return Freepost addressed envelopes provided
Response Rate 67% of invited schools / 85% of students
Obtained Sample 256 schools / 16,060 pupils
Data Quality Data were entered according to the HBSC international protocol
EthicsFull ethical approval was granted by the National University of Ireland, Galway Research Ethics Committee
Details of the demographic representativeness of the sample can be found in the Appendix.
The results section outlines children’s perceptions and behaviours relating to health. Data are presented for HBSC and Middle Childhood studies seperately. Data are illustrated by gender, age and social class (SC). Social class is represented by SC 1-2, SC 3-4 and SC 5-6 corresponding to high, middle and low social classes, respectively. The categories used for social class are standard and were determined by parental occupation. Social class 1 represent professional occupations (i.e., solicitor, doctor), social class 2 represent managerial occupations (i.e., nurse, teacher), social class 3 represent non-manual occupations (i.e., sales person, office clerk), social class 4 represent skilled-manual occupations (i.e., hairdresser, carpenter), social class 5 represent semi-skilled occupations (i.e., postman, driver), social class 6 represent unskilled occupations (i.e., cleaner, labourer).
Statistical analysis
Statistical analyses were carried out to determine if differences by gender, age group and social class were statistically significant. Differences at p<0.05 are described in the report.

The Irish Health Behaviour in School-aged Children (HBSC) Study 2010
11
Results

12

13
General Health
Children were asked a number of general questions concerning their lives and perceived health.
Excellent Health
Children were asked to rate their health as excellent, good, fair or poor. Overall, 33% of children aged 10-17 report that they would say their health is excellent with a further 55% that it is good.
Figure 1: Percentages of boys who report their health is excellent
60
50
40
(%) 30
20
10
010-11 12-14 15-17
Age Group (Years)
4238
34
4239
33
40
33 35 SC1-2 2010SC3-4 2010SC5-6 2010
SC1-2 2006SC3-4 2006SC5-6 200644
40
4946
3539 40
34 33
Figure 2: Percentages of girls who report their health is excellent
60
50
40
(%) 30
20
10
010-11 12-14 15-17
Age Group (Years)
3835
40
3329
24 2320 18
4239 37
39
31 3025
19 18
SC1-2 2010SC3-4 2010SC5-6 2010
SC1-2 2006SC3-4 2006SC5-6 2006
There are statistically significant differences by gender, age group and social class. Overall, 38% of boys report excellent health compared to 27% of girls. Younger children are significantly more likely to report excellent health compared to older children and children from higher social class groups are more likely to report excellent health than those from

14
The Irish Health Behaviour in School-aged Children (HBSC) Study 2010
other social class groups. The proportion of children who report that their health is excellent remains unchanged from 2006 (33% in 2006).
Excellent Health – Middle Childhood Study
Overall, 49% of 3rd and 4th class children report that they would say their health is excellent. There are no statistically significant gender or social class differences. The proportion of children that report excellent health remains stable from 2006 (47% in 2006).
Figure 3: Percentages of 9 year old boys and girls who report their health is excellent
60
50
40
(%) 30
20
10
0
SC1-2 2006
SC1-2 2010
SC3-4 2006
SC3-4 2010
SC5-6 2006
SC5-6 2010
Boys GirlsGender
4650
40
47 48
4245 47 46
4952
49
The Irish Health Behaviour in School-Aged Children (HBSC) Study 2010

The Irish Health Behaviour in School-aged Children (HBSC) Study 2010
15
Life at present (happiness)
Children were asked to report how they feel about their life at present. Overall, 50% of children report feeling very happy with their lives at present with a further 41% reporting feeling quite happy.
Figure 4: Percentages of boys who report feeling very happy about their lives at present
80
(%) 40
010-11 12-14 15-17
Age Group (Years)
70
60
50
30
20
10
6265
5954 55 54
46 45 46
6467 68
55 55 57
44 4640
SC1-2 2010SC3-4 2010SC5-6 2010
SC1-2 2006SC3-4 2006SC5-6 2006
Figure 5: Percentages of girls who report feeling very happy about their lives at present
80
(%) 40
010-11 12-14 15-17
Age Group (Years)
70
60
50
30
20
10
64 66 68
5549 51
44
36 35
SC1-2 2010SC3-4 2010SC5-6 2010
SC1-2 2006SC3-4 2006SC5-6 2006
68 67 66
5255 53
3632
39
There are statistically significant differences by gender and age group. Overall, 52% of boys compared to 49% of girls report feeling very happy with their lives and younger children are more likely to report feeling very happy with their lives than older children. There are no statistically significant differences across social class groups. The proportion of children who report feeling very happy with their lives remains unchanged from 2006 (50% in 2006).
General Health

16
The Irish Health Behaviour in School-aged Children (HBSC) Study 2010
Life at present (happiness) – Middle Childhood Study
Overall, 70% of 3rd and 4th class children report feeling very happy with their lives at present. There are no statistically significant differences by gender or social class. The proportion of children who report feeling very happy with their lives remains stable from 2006 (72% in 2006).
Figure 6: Percentages of 9 year old boys and girls who report feeling very happy about their lives at present
80
(%) 40
0
70
60
50
30
20
10
SC1-2 2006
SC1-2 2010
SC3-4 2006
SC3-4 2010
SC5-6 2006
SC5-6 2010
Boys GirlsGender
6871 69 67
70 7167
77 7673 71 71
The Irish Health Behaviour in School-Aged Children (HBSC) Study 2010

The Irish Health Behaviour in School-aged Children (HBSC) Study 2010
17
Life satisfaction
Children were asked to report where they feel they stand at the moment on a scale from 0 to 10. Overall, 76% of children report high life satisfaction (rank 7 or higher on the scale).
Figure 7: Percentages of boys who report high life satisfaction
100
(%) 50
010-11 12-14 15-17
Age Group (Years)
90
80
70
60
40
30
20
10
87 8581 84 82 79
75 7367
SC1-2 2010SC3-4 2010SC5-6 2010
SC1-2 2006SC3-4 2006SC5-6 2006
86 8791
84 81 8278
7570
Figure 8: Percentages of girls who report high life satisfaction
100
(%) 50
010-11 12-14 15-17
Age Group (Years)
90
80
70
60
40
30
20
10
86 86 8981
74 73 7167
60 SC1-2 2010SC3-4 2010SC5-6 2010
SC1-2 2006SC3-4 2006SC5-6 2006
89 8691
79 79 78
6962
67
Statistically significant gender differences are apparent with fewer girls (74%) than boys (79%) reporting high life satisfaction. There are also statistically significant differences across age groups with younger children more likely to report high life satisfaction than older children, and across social class groups, with those from lower social class groups less likely to report high life satisfaction than those from other social class groups. The proportion of children who report high life satisfaction remains stable from 2006 (77% in 2006).
General Health
18
The Irish Health Behaviour in School-aged Children (HBSC) Study 2010The Irish Health Behaviour in School-Aged Children (HBSC) Study 2010

The Irish Health Behaviour in School-aged Children (HBSC) Study 2010
19
Smoking
Children were asked about two aspects of smoking tobacco: having ever smoked and current smoking behaviour, which was defined as smoking tobacco monthly or more frequently.
Ever smoked tobacco
Overall, 27% of children report that they have ever smoked tobacco, with statistically significant differences across age groups. There are statistically significant gender differences, with more boys (27%) than girls (26%) reporting having ever smoked tobacco. There are also statistically significant differences across social class groups; those from the lower social class groups are more likely to report having ever smoked tobacco compared to other social class groups. There is an overall decrease in the proportion of children who report that they have ever smoked tobacco from 2006 (36% in 2006).
Figure 9: Percentages of boys who report ever smoking tobacco
70
(%)
010-11 12-14 15-17
Age Group (Years)
60
50
40
30
20
102
610
1518
23
4348
43SC1-2 2010SC3-4 2010SC5-6 2010
SC1-2 2006SC3-4 2006SC5-6 2006
139 9
2730 30
5248 48
Figure 10: Percentages of girls who report ever smoking tobacco
70
(%)
010-11 12-14 15-17
Age Group (Years)
60
50
40
30
20
102 3
713
1721
4346
52
SC1-2 2010SC3-4 2010SC5-6 2010
SC1-2 2006SC3-4 2006SC5-6 2006
5 7 9
2428 29
5459 57

20
The Irish Health Behaviour in School-aged Children (HBSC) Study 2010
Ever smoked tobacco – Middle Childhood Study
Overall, 3% of 3rd and 4th class children report that they have ever smoked tobacco. There are statistically significant gender differences with 5% of boys compared to 2% of girls reporting that they have ever smoked tobacco. The proportion of 3rd and 4th class children who report that they have ever smoked tobacco is similar to 2006 (4% in 2006).
Figure 11: Percentages of 9 year old boys and girls who report ever smoking tobacco
70
(%)
0
60
50
40
30
20
10
SC1-2 2006
SC1-2 2010
SC3-4 2006
SC3-4 2010
SC5-6 2006
SC5-6 2010
4 3 4 63 4
1 1 3 1 2 3
Boys GirlsGender
The Irish Health Behaviour in School-Aged Children (HBSC) Study 2010

The Irish Health Behaviour in School-aged Children (HBSC) Study 2010
21
Current smoking status
Overall, 12% of children report that they are current smokers. Smoking is more prevalent among older than younger children and this difference is statistically significant. Overall, there are statistically significant differences across social class groups in current smoking status, with children from higher social class groups less likely to report current smoking behaviour. There are no statistically significant differences by gender. There is an overall decrease in the proportion of children who report that they are current smokers from 2006 (15% in 2006).
Figure 12: Percentages of boys who report that they are current smokers
40
(%) 20
010-11 12-14 15-17
Age Group (Years)
30
10
1
56 7 7
16
2219
SC1-2 2010SC3-4 2010SC5-6 2010
SC1-2 2006SC3-4 2006SC5-6 2006
1
53
810 10
18
22 23
1
Figure 13: Percentages of girls who report that they are current smokers
40
(%) 20
010-11 12-14 15-17
Age Group (Years)
30
10
2 1 25
86
19
2325
SC1-2 2010SC3-4 2010SC5-6 2010
SC1-2 2006SC3-4 2006SC5-6 2006
1 2 1
10 1113
24
3028
Smoking

22
The Irish Health Behaviour in School-aged Children (HBSC) Study 2010
Current smoking status – Middle Childhood Study
Overall, 1% of 3rd and 4th class children report that they are current smokers. There are statistically significant gender differences with 2% of boys and 1% of girls reporting that they are current smokers. There are no statistically significant social class differences. Overall, the proportion of 3rd and 4th class students who report that they are current smokers remains stable from 2006 (1% in 2006).
Figure 14: Percentages of 9 year old boys and girls who report that they are current smokers
40
(%) 20
0
30
10
SC1-2 2006
SC1-2 2010
SC3-4 2006
SC3-4 2010
SC5-6 2006
SC5-6 2010
Boys GirlsGender
1 1 2 3 2 20 1 1 0 1 1
The Irish Health Behaviour in School-Aged Children (HBSC) Study 2010

The Irish Health Behaviour in School-aged Children (HBSC) Study 2010
23
Alcohol
Never drinking
Overall, 54% of children report that they have never had an alcoholic drink. There are statistically significant differences by gender and age group. Girls are more likely than boys to report never drinking (57% and 52% respectively), and younger children are more likely to report never drinking than older children. Social class differences are not evident. There is an overall increase in the proportion of children who report that they have never had an alcoholic drink from 2006 (47% in 2006).
Figure 15: Percentages of boys who report never having had an alcoholic drink
100
(%) 50
010-11 12-14 15-17
Age Group (Years)
90
80
70
60
40
30
20
10
79 79 81
63 63 61
31 30 33
SC1-2 2010SC3-4 2010SC5-6 2010
SC1-2 2006SC3-4 2006SC5-6 2006
67 67 70
53 52 54
28 25 23
Figure 16: Percentages of girls who report never having had an alcoholic drink
100
(%) 50
010-11 12-14 15-17
Age Group (Years)
90
80
70
60
40
30
20
10
88 91 89
71 7265
29 27 25
SC1-2 2010SC3-4 2010SC5-6 2010
SC1-2 2006SC3-4 2006SC5-6 2006
89 8884
65 62 61
2820
26
24
The Irish Health Behaviour in School-Aged Children (HBSC) Study 2010
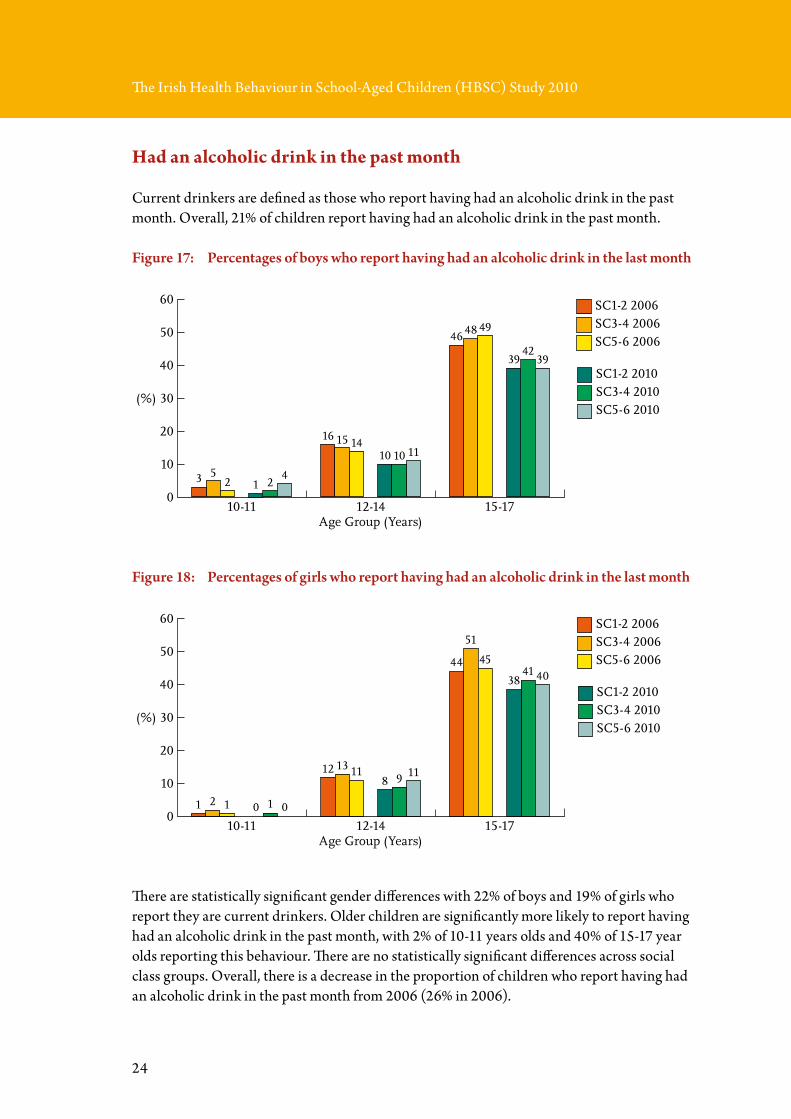
Had an alcoholic drink in the past month
Current drinkers are defined as those who report having had an alcoholic drink in the past month. Overall, 21% of children report having had an alcoholic drink in the past month.
Figure 17: Percentages of boys who report having had an alcoholic drink in the last month
60
50
40
(%) 30
20
10
010-11 12-14 15-17
Age Group (Years)
1 24
10 10 11
3942
39SC1-2 2010SC3-4 2010SC5-6 2010
SC1-2 2006SC3-4 2006SC5-6 2006
3 52
16 15 14
46 48 49
Figure 18: Percentages of girls who report having had an alcoholic drink in the last month
60
50
40
(%) 30
20
10
010-11 12-14 15-17
Age Group (Years)
0 1 0
8 9 11
3841 40
SC1-2 2010SC3-4 2010SC5-6 2010
SC1-2 2006SC3-4 2006SC5-6 2006
1 2 1
12 13 11
44
51
45
There are statistically significant gender differences with 22% of boys and 19% of girls who report they are current drinkers. Older children are significantly more likely to report having had an alcoholic drink in the past month, with 2% of 10-11 years olds and 40% of 15-17 year olds reporting this behaviour. There are no statistically significant differences across social class groups. Overall, there is a decrease in the proportion of children who report having had an alcoholic drink in the past month from 2006 (26% in 2006).

25
Drunkenness
In addition to alcohol consumption, children were asked if they had ever had so much alcohol that they were ‘really drunk’. Overall, 28% of children report having been ‘really drunk’.
Figure 19: Percentages of boys who report having been ‘really drunk’
70
(%)
010-11 12-14 15-17
Age Group (Years)
60
50
40
30
20
10 5 46
1418 19
49
55 53
SC1-2 2010SC3-4 2010SC5-6 2010
SC1-2 2006SC3-4 2006SC5-6 2006
5 7 5
1722 21
5358 56
Figure 20: Percentages of girls who report having been ‘really drunk’
70
(%)
010-11 12-14 15-17
Age Group (Years)
60
50
40
30
20
103 2 2
12 1420
47
53 55
SC1-2 2010SC3-4 2010SC5-6 2010
SC1-2 2006SC3-4 2006SC5-6 2006
1 2 0
15 17 15
51
6055
There are statistically significant gender, age group and social class differences. More boys (29%) than girls (26%) report having been ‘really drunk’ and reports of drunkenness are higher among older children: 4% of 10-11 year olds, 16% of 12-14 year olds and 52% of 15-17 year olds. Children from lower social class groups are more likely to report having been ‘really drunk’ than those from other social class groups. There is an overall decrease in the proportion of children who report having been ‘really drunk’ from 2006 (32% in 2006).
Alcohol
26
The Irish Health Behaviour in School-Aged Children (HBSC) Study 2010
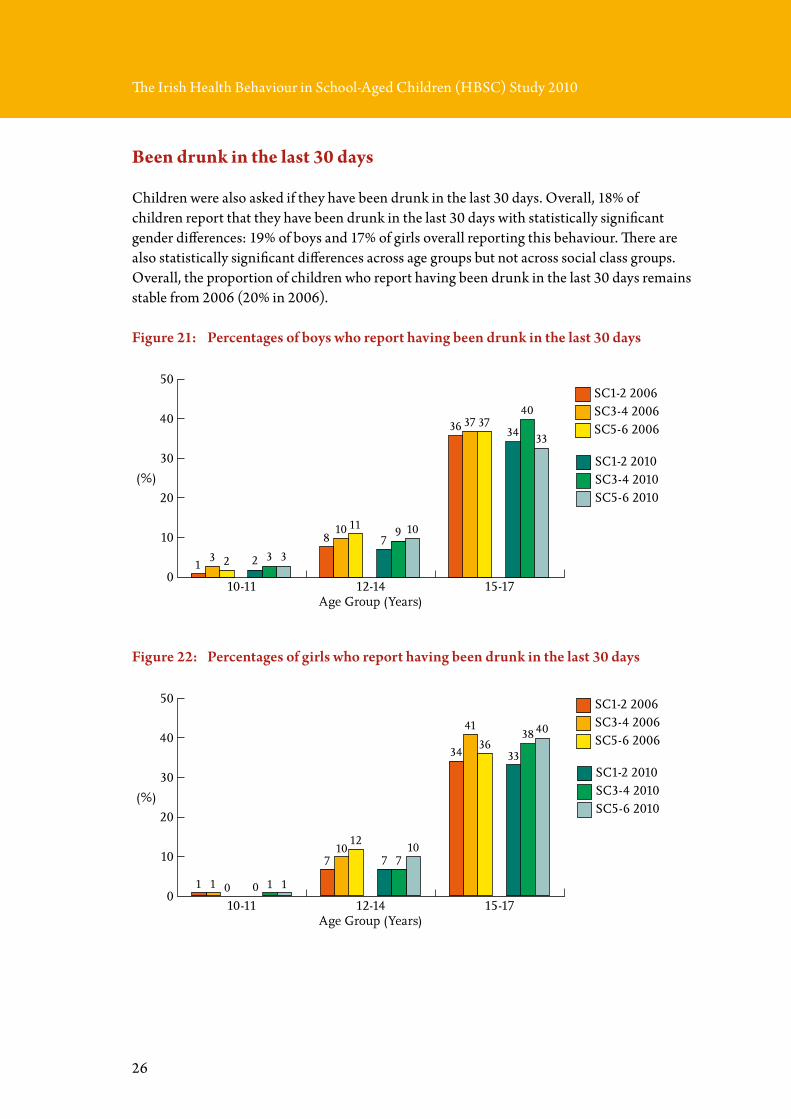
Been drunk in the last 30 days
Children were also asked if they have been drunk in the last 30 days. Overall, 18% of children report that they have been drunk in the last 30 days with statistically significant gender differences: 19% of boys and 17% of girls overall reporting this behaviour. There are also statistically significant differences across age groups but not across social class groups. Overall, the proportion of children who report having been drunk in the last 30 days remains stable from 2006 (20% in 2006).
Figure 21: Percentages of boys who report having been drunk in the last 30 days
50
(%)
0
40
30
20
10
10-11 12-14 15-17Age Group (Years)
SC1-2 2010SC3-4 2010SC5-6 2010
SC1-2 2006SC3-4 2006SC5-6 2006
2 3 37
9 10
34
40
33
13 2
810 11
36 37 37
Figure 22: Percentages of girls who report having been drunk in the last 30 days
50
(%)
0
40
30
20
10
10-11 12-14 15-17Age Group (Years)
SC1-2 2010SC3-4 2010SC5-6 2010
SC1-2 2006SC3-4 2006SC5-6 2006
0 1 1
7 710
33
38 40
1 1 0
710
12
34
41
36

27
Drug Use
Cannabis in the last 12 months
Overall, 8% of children report using cannabis in the last 12 months, with statistically significant gender and age group differences. More boys than girls report using cannabis in the last 12 months (10% vs. 6%). Additionally, older children are more likely to report cannabis use in the last 12 months: 1% of 10-11 year olds vs. 17% of 15-17 year olds. There are no statistically significant differences across social class groups. Overall, there is a decrease in the proportion of children who report using cannabis in the last 12 months from 2006 (16% in 2006).
Figure 23: Percentages of boys reporting cannabis use in the last 12 months
SC1-2 2010SC3-4 2010SC5-6 2010
SC1-2 2006SC3-4 2006SC5-6 2006
30
20
(%)
10
010-11 12-14 15-17
Age Group (Years)
0 0 012
0
4 4 568 7
17
21
17
2224 24
Figure 24: Percentages of girls reporting cannabis use in the last 12 months
SC1-2 2010SC3-4 2010SC5-6 2010
SC1-2 2006SC3-4 2006SC5-6 2006
30
20
(%)
10
010-11 12-14 15-17
Age Group (Years)
0 0 11 0 02 2 34
6 5
11 12
1817
2220

28
The Irish Health Behaviour in School-Aged Children (HBSC) Study 2010
Cannabis use in the last 30 days
Children were asked to report on using cannabis in the last 30 days. Overall, 5% of children aged 10-17 report using cannabis in the last 30 days. There are statistically significant gender and age group differences. More boys (7%) than girls (3%) and older children compared to younger children are more likely to report using cannabis in the last 30 days. There are no statistically significant differences across social class groups. Overall, there is a decrease in the proportion of children who report cannabis use in the last 30 days from 2006 (7% in 2006).
Figure 25: Percentages of boys reporting cannabis use in the last 30 days
SC1-2 2010SC3-4 2010SC5-6 2010
SC1-2 2006SC3-4 2006SC5-6 2006
20
(%) 10
010-11 12-14 15-17
Age Group (Years)
0 011
2
0
23 33
45
10
13
910
13
15
Figure 26: Percentages of girls reporting cannabis use in the last 30 days
SC1-2 2010SC3-4 2010SC5-6 2010
SC1-2 2006SC3-4 2006SC5-6 2006
20
(%) 10
010-11 12-14 15-17
Age Group (Years)
0 011
0 01 1
23 3
2
6 6
88
1110

29
Food and Dietary Behaviour
Fruit
Overall, 20% of children report that they consume fruit more than once a day. There are statistically significant differences by gender, age group and social class. A higher proportion of girls report eating fruit more than once a day compared to boys (22% and 18% respectively). Younger children (24% of 10-11; 20% of 12-14; 19% of 15-17) and those from higher social classes are more likely to report eating fruit more than once a day compared to older children and those from other social classes, respectively. The proportion of children who report eating fruit more than once a day remains stable from 2006 (19% in 2006).
Figure 27: Percentages of boys who report eating fruit more than once a day
40
(%) 20
010-11 12-14 15-17
Age Group (Years)
30
10
22
14
22
1513
1916
18
SC1-2 2010SC3-4 2010SC5-6 2010
SC1-2 2006SC3-4 2006SC5-6 2006
17
21
17 1816 16
19
1215
23
Figure 28: Percentages of girls who report eating fruit more than once a day
40
(%) 20
010-11 12-14 15-17
Age Group (Years)
30
10
2624 25
20
16
26
21
16
SC1-2 2010SC3-4 2010SC5-6 2010
SC1-2 2006SC3-4 2006SC5-6 2006
38
23
29
25
18
2225
23
19
30
30
The Irish Health Behaviour in School-Aged Children (HBSC) Study 2010
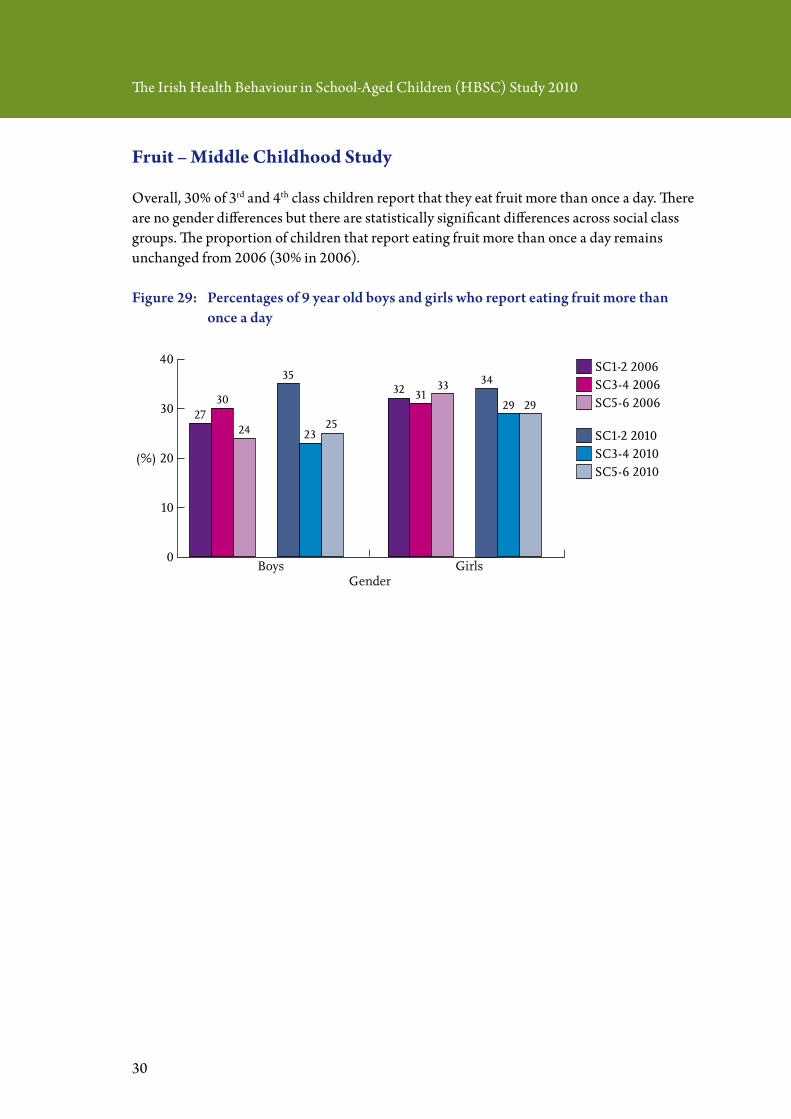
Fruit – Middle Childhood Study
Overall, 30% of 3rd and 4th class children report that they eat fruit more than once a day. There are no gender differences but there are statistically significant differences across social class groups. The proportion of children that report eating fruit more than once a day remains unchanged from 2006 (30% in 2006).
Figure 29: Percentages of 9 year old boys and girls who report eating fruit more than once a day
40
(%) 20
0
30
10
SC1-2 2006
SC1-2 2010
SC3-4 2006
SC3-4 2010
SC5-6 2006
SC5-6 2010
Boys GirlsGender
2730
24
35
2325
32 3133 34
29 29

31
Vegetables
Overall, 20% of children report eating vegetables more than once a day. Statistically significant gender differences are evident with fewer boys (19%) than girls (22%) reporting eating vegetables more than once a day. There are also statistically significant differences across age and social class groups with younger children and those from higher social classes more likely to report eating vegetables more than once a day than older children and those from other social class groups, respectively. There is an increase in the proportion of children that report eating vegetables more than once a day from 2006 (18% in 2006).
Figure 30: Percentages of boys who report eating vegetables more than once a day
40
(%) 20
010-11 12-14 15-17
Age Group (Years)
30
10
1917
25
1815
1917
19
SC1-2 2010SC3-4 2010SC5-6 2010
SC1-2 2006SC3-4 2006SC5-6 2006
13
19
11
19
14 15 16 16
12
21
Figure 31: Percentages of girls who report eating vegetables more than once a day
40
(%) 20
010-11 12-14 15-17
Age Group (Years)
30
10
20
2426
22
15
23
1921
SC1-2 2010SC3-4 2010SC5-6 2010
SC1-2 2006SC3-4 2006SC5-6 2006
26
19
24 23
19 18
26
1917
26
Food and Dietary Behaviour

32
The Irish Health Behaviour in School-Aged Children (HBSC) Study 2010
Vegetables – Middle Childhood Study
Overall, 26% of children in 3rd and 4th class report eating vegetables more than once a day. Gender differences are statistically significant, with girls more likely to report eating vegetables more than once a day then boys (29% and 23% respectively). There are no significant social class differences. There is an increase in the proportion of children who report eating vegetables more than once a day from 2006 (21% in 2006).
Figure 32: Percentages of 9 year old boys and girls who report eating vegetables more than once a day
40
(%) 20
0
30
10
SC1-2 2006
SC1-2 2010
SC3-4 2006
SC3-4 2010
SC5-6 2006
SC5-6 2010
Boys GirlsGender
2123
19
27
2119
24 2523
2831 31

33
Sweets
Children were asked to report on frequency of consuming sweets. Overall, 37% of children report eating sweets once a day or more. There are statistically significant differences by gender, age group and social class. Overall, 39% of girls report eating sweets once a day or more compared to 34% of boys. Older children and children from lower social class groups are significantly more likely to report eating sweets once a day or more compared to younger children and those from other social class groups, respectively. There is an overall decrease in the proportion of children who report eating sweets once a day or more from 2006 (39% in 2006).
Figure 33: Percentages of boys who report eating sweets daily or more
60
50
40
(%) 30
20
10
010-11 12-14 15-17
Age Group (Years)
30 32
4037
4145
SC1-2 2010SC3-4 2010SC5-6 2010
SC1-2 2006SC3-4 2006SC5-6 2006
2528
25
3337
34
3943 45
24 26
37
Figure 34: Percentages of girls who report eating sweets daily or more
60
50
40
(%) 30
20
10
010-11 12-14 15-17
Age Group (Years)
34
42 42 4145
39SC1-2 2010SC3-4 2010SC5-6 2010
SC1-2 2006SC3-4 2006SC5-6 2006
25
34 3538
44 45
39
45 44
30
35 34
Food and Dietary Behaviour
34
The Irish Health Behaviour in School-Aged Children (HBSC) Study 2010
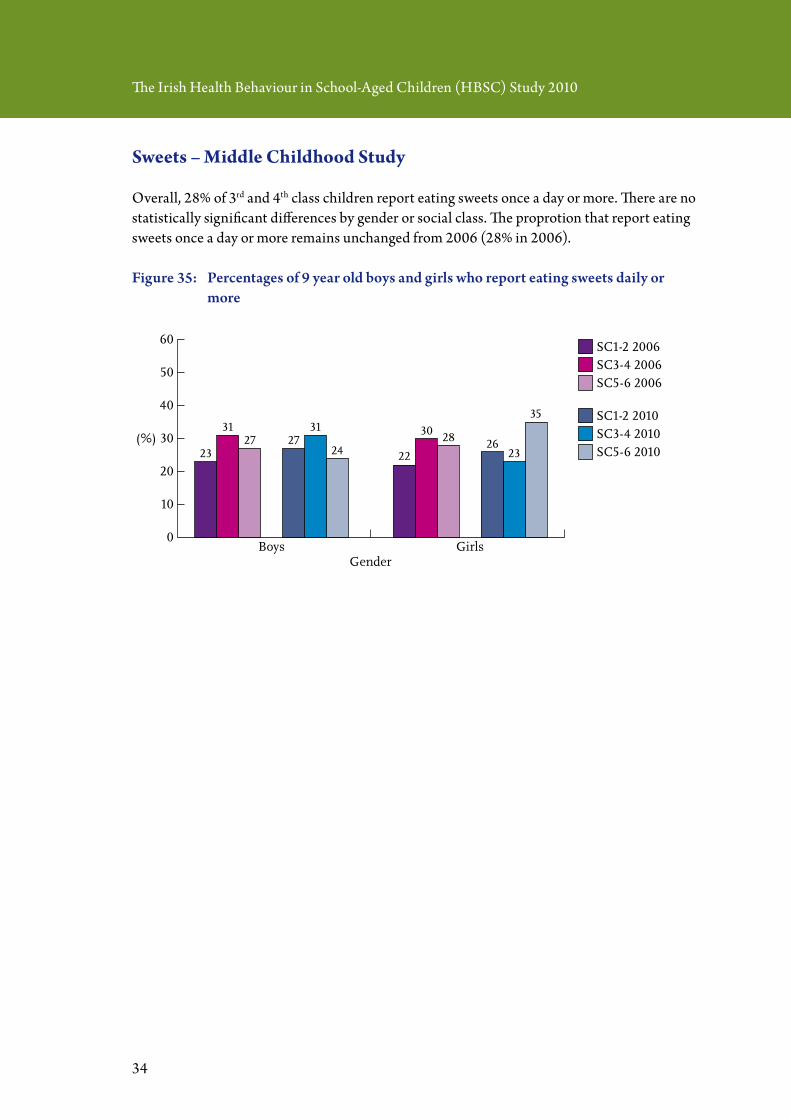
Sweets – Middle Childhood Study
Overall, 28% of 3rd and 4th class children report eating sweets once a day or more. There are no statistically significant differences by gender or social class. The proprotion that report eating sweets once a day or more remains unchanged from 2006 (28% in 2006).
Figure 35: Percentages of 9 year old boys and girls who report eating sweets daily or more
60
50
40
(%) 30
20
10
0
SC1-2 2006
SC1-2 2010
SC3-4 2006
SC3-4 2010
SC5-6 2006
SC5-6 2010
Boys GirlsGender
23
3127 27
31
24 22
30 28 2623
35

35
Soft Drinks
Overall, 21% of children report drinking soft drinks daily or more. There are statistically significant differences by gender, age group and social class. Overall, 23% of boys report drinking soft drinks daily or more compared to 19% of girls. Older children and those from lower social class groups are also significantly more likely to report drinking soft drinks daily or more. There is an overall decrease in the proportion of children who report drinking soft drinks daily or more from 2006 (26% in 2006).
Figure 36: Percentages of boys who report drinking soft drinks daily or more
50
(%)
0
40
30
20
10
10-11 12-14 15-17Age Group (Years)
SC1-2 2010SC3-4 2010SC5-6 2010
SC1-2 2006SC3-4 2006SC5-6 2006
13
18 18
23
29
2125
33
15
2023
2830 29
37 38
1310
Figure 37: Percentages of girls who report drinking soft drinks daily or more
50
(%)
0
40
30
20
10
10-11 12-14 15-17Age Group (Years)
SC1-2 2010SC3-4 2010SC5-6 2010
SC1-2 2006SC3-4 2006SC5-6 2006
15
21
12
19
24
14
21
26
11
17 16
2326
15
2927
23
10
Food and Dietary Behaviour
36
The Irish Health Behaviour in School-Aged Children (HBSC) Study 2010
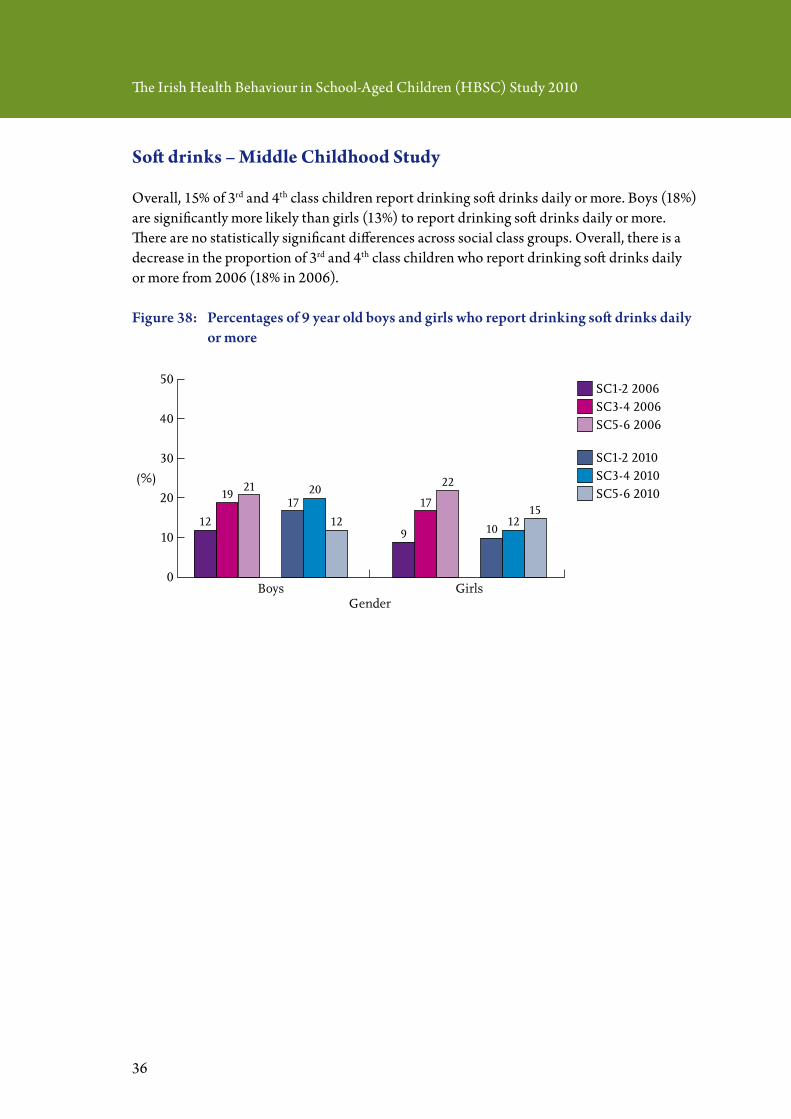
Soft drinks – Middle Childhood Study
Overall, 15% of 3rd and 4th class children report drinking soft drinks daily or more. Boys (18%) are significantly more likely than girls (13%) to report drinking soft drinks daily or more. There are no statistically significant differences across social class groups. Overall, there is a decrease in the proportion of 3rd and 4th class children who report drinking soft drinks daily or more from 2006 (18% in 2006).
Figure 38: Percentages of 9 year old boys and girls who report drinking soft drinks daily or more
SC1-2 2006
SC1-2 2010
SC3-4 2006
SC3-4 2010
SC5-6 2006
SC5-6 2010
Boys GirlsGender
12
1921
1720
129
17
22
1012
15
50
(%)
0
40
30
20
10

37
Not having breakfast
Overall, 13% of children aged 10-17 report that they never have breakfast during weekdays. There are statistically significant differences by gender, age group and social class. Overall, 15% of girls report that they never have breakfast during weekdays compared to 11% of boys. Older children and those from lower social class groups are significantly more likely to report that they never have breakfast during weekdays compared to younger children and children from other social class groups, respectively. Overall, the proportion of children who report that they never have breakfast during weekdays remains stable from 2006 (14% in 2006).
Figure 39: Percentages of boys who report not having breakfast on weekdays
40
(%) 20
010-11 12-14 15-17
Age Group (Years)
30
106
8 810
1411
14 15
SC1-2 2010SC3-4 2010SC5-6 2010
SC1-2 2006SC3-4 2006SC5-6 2006
46
3
8 9 10 11
1618
5
Figure 40: Percentages of girls who report not having breakfast on weekdays
40
(%) 20
010-11 12-14 15-17
Age Group (Years)
30
105
7
11
16 1715
24 23 SC1-2 2010SC3-4 2010SC5-6 2010
SC1-2 2006SC3-4 2006SC5-6 2006
58
16
12
17 16 16
2825
5
Food and Dietary Behaviour

38
The Irish Health Behaviour in School-Aged Children (HBSC) Study 2010
Not having breakfast – Middle Childhood Study
Overall, 2% of 3rd and 4th class children report not having breakfast on any day of the week. There are no statistically significant differences by gender or social class. The proportion of children who report not having breakfast on any day of the week remains unchanged from 2006 (2% in 2006).
Figure 41: Percentages of 9 year old boys and girls who report not having breakfast during the week or the weekend
40
(%) 20
0
30
10
SC1-2 2006
SC1-2 2010
SC3-4 2006
SC3-4 2010
SC5-6 2006
SC5-6 2010
Boys GirlsGender
2 3 2 2 3 2 13 2 2 2 2
39
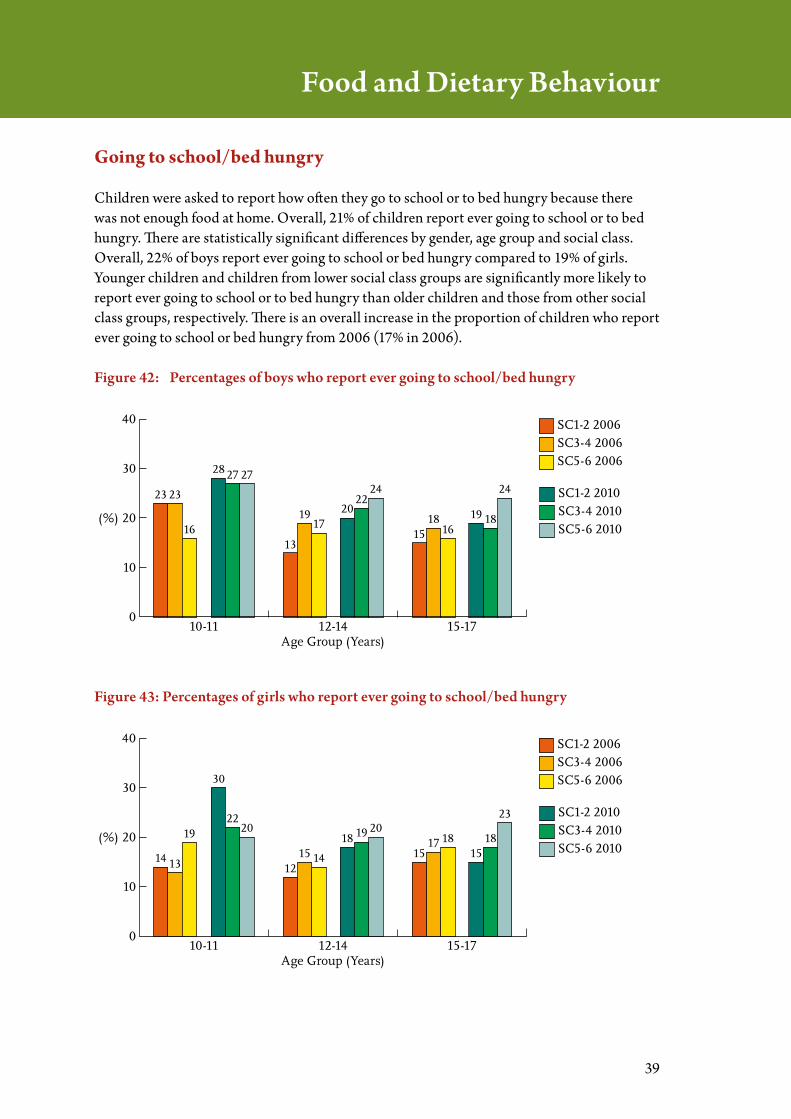
Going to school/bed hungry
Children were asked to report how often they go to school or to bed hungry because there was not enough food at home. Overall, 21% of children report ever going to school or to bed hungry. There are statistically significant differences by gender, age group and social class. Overall, 22% of boys report ever going to school or bed hungry compared to 19% of girls. Younger children and children from lower social class groups are significantly more likely to report ever going to school or to bed hungry than older children and those from other social class groups, respectively. There is an overall increase in the proportion of children who report ever going to school or bed hungry from 2006 (17% in 2006).
Figure 42: Percentages of boys who report ever going to school/bed hungry
40
(%) 20
010-11 12-14 15-17
Age Group (Years)
30
10
27 27
2022
24
19 18
24 SC1-2 2010SC3-4 2010SC5-6 2010
SC1-2 2006SC3-4 2006SC5-6 2006
23 23
1613
1917
1518
16
28
Figure 43: Percentages of girls who report ever going to school/bed hungry
40
(%) 20
010-11 12-14 15-17
Age Group (Years)
30
10
2220
18 19 20
1518
23 SC1-2 2010SC3-4 2010SC5-6 2010
SC1-2 2006SC3-4 2006SC5-6 2006
14 13
19
1215 14 15
17 18
30
Food and Dietary Behaviour
40
The Irish Health Behaviour in School-Aged Children (HBSC) Study 2010
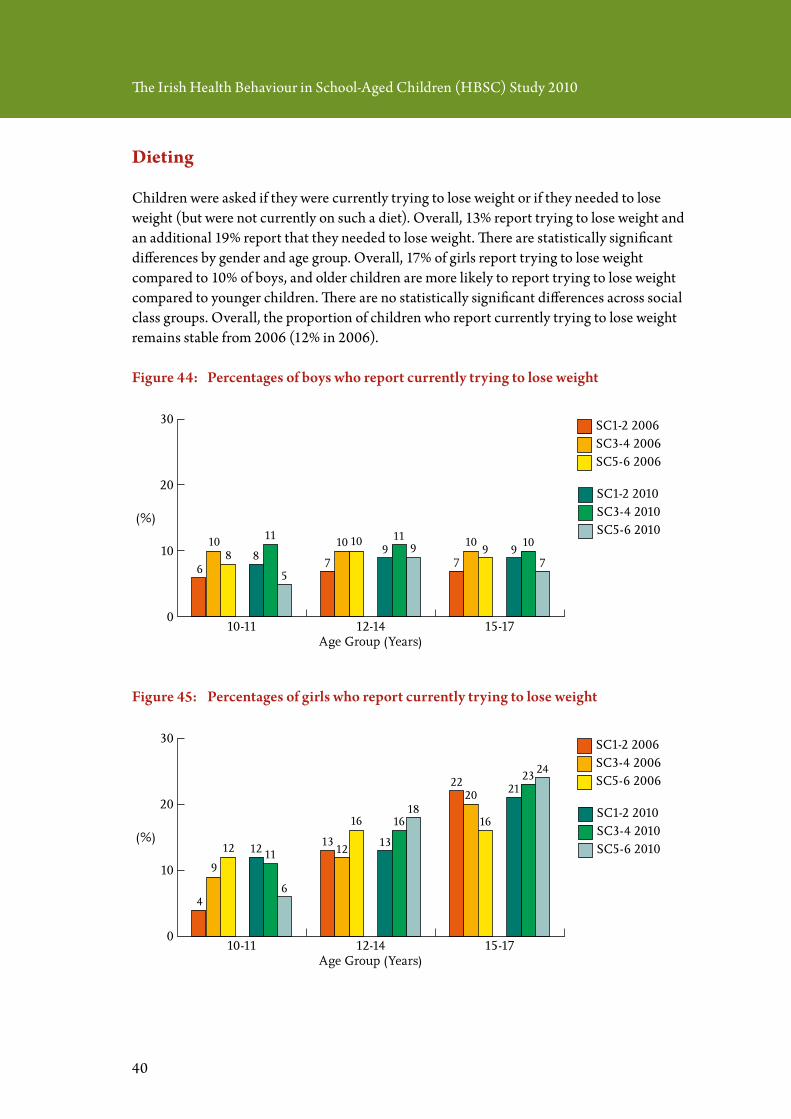
Dieting
Children were asked if they were currently trying to lose weight or if they needed to lose weight (but were not currently on such a diet). Overall, 13% report trying to lose weight and an additional 19% report that they needed to lose weight. There are statistically significant differences by gender and age group. Overall, 17% of girls report trying to lose weight compared to 10% of boys, and older children are more likely to report trying to lose weight compared to younger children. There are no statistically significant differences across social class groups. Overall, the proportion of children who report currently trying to lose weight remains stable from 2006 (12% in 2006).
Figure 44: Percentages of boys who report currently trying to lose weight
SC1-2 2010SC3-4 2010SC5-6 2010
SC1-2 2006SC3-4 2006SC5-6 2006
30
20
(%)
10
010-11 12-14 15-17
Age Group (Years)
8
11
56
108 9
119
7
10 109
10
77
109
Figure 45: Percentages of girls who report currently trying to lose weight
SC1-2 2010SC3-4 2010SC5-6 2010
SC1-2 2006SC3-4 2006SC5-6 2006
30
20
(%)
10
010-11 12-14 15-17
Age Group (Years)
12 11
64
9
12 13
1618
1312
16
2123 24
2220
16

41
Exercise and Physical Activity
Children were asked about their participation in exercise in their free time. They were asked the frequency with which they exercised so much that they get out of breath or sweat. Presented here are data illustrating the percentages reporting that they exercise in such a way four or more times a week and those reporting that they exercise less than weekly.
Vigorous exercise ≥ 4 times/week
Overall, 51% of children report exercising four or more times a week. There are statistically significant differences by gender and age group. Overall, 60% of boys report exercising four or more times a week compared to 40% of girls. Younger children are significantly more likely to report exercising four or more times a week compared to older children (62% of 10-11; 54% of 12-14; 41% of 15-17). There are no statistically significant differences across social class groups. Overall, the proportion of children who report exercising four or more times a week remains stable from 2006 (53% in 2006).
Figure 46: Percentages of boys who report participating in vigorous exercise four or more times per week
80
(%) 40
010-11 12-14 15-17
Age Group (Years)
70
60
50
30
20
10
6467 68 67 65
5955
51
58
SC1-2 2010SC3-4 2010SC5-6 2010
SC1-2 2006SC3-4 2006SC5-6 2006
6874 73 71
6569
55 55 56
Figure 47: Percentages of girls who report participating in vigorous exercise four or more times per week
80
(%) 40
010-11 12-14 15-17
Age Group (Years)
70
60
50
30
20
10
6056
64
45 4438
3127 28
SC1-2 2010SC3-4 2010SC5-6 2010
SC1-2 2006SC3-4 2006SC5-6 200661
56 5750 51 53
29 27 27

42
The Irish Health Behaviour in School-Aged Children (HBSC) Study 2010
Vigorous exercise ≥ 4 times/week – Middle Childhood Study
Overall, 70% of 3rd and 4th class children report exercising four or more times a week, with statistically significant gender differences (72% of boys and 67% of girls). There are no statistically significant differences across social class groups. The proportion of children who report exercising four or more times a week remains stable from 2006 (72% in 2006).
Figure 48: Percentages of 9 year old boys and girls who report participating in vigorous exercise four or more times per week
80
(%) 40
0
70
60
50
30
20
10
SC1-2 2006
SC1-2 2010
SC3-4 2006
SC3-4 2010
SC5-6 2006
SC5-6 2010
Boys GirlsGender
76 74 74 73 7469 69 70 71 72
65 66

43
Physical inactivity
Overall, 9% of children report participating in vigorous exercise less than weekly. There are statistically significant differences by gender, age group and social class. Overall 6% of boys report participating in vigorous exercise less than weekly compared to 13% of girls. Older children and children from lower social class groups are more likely to report participating in vigorous exercise less than weekly compared to younger children and those from other social class groups, respectively. The proportion of children who report being inactive remains stable from 2006 (10% in 2006).
Figure 49: Percentages of boys who report participating in vigorous exercise less than weekly
SC1-2 2010SC3-4 2010SC5-6 2010
SC1-2 2006SC3-4 2006SC5-6 2006
30
20
(%)
10
010-11 12-14 15-17
Age Group (Years)
45
3
9
6 64 4 55 4 4
6
987
911
Figure 50: Percentages of girls who report participating in vigorous exercise less than weekly
SC1-2 2010SC3-4 2010SC5-6 2010
SC1-2 2006SC3-4 2006SC5-6 2006
30
20
(%)
10
010-11 12-14 15-17
Age Group (Years)
5 6
97 8 9 8 9
13
8 97
13
22 22
19
22
26
Exercise and Physical Activity

44
The Irish Health Behaviour in School-Aged Children (HBSC) Study 2010
Physical inactivity - Middle Childhood Study
Overall, 7% of 3rd and 4th class children report participating in vigorous exercise less than weekly with no statistically significant gender differences. Children from lower social class groups are significantly more likely to report inactivity than those from other social class groups. The proportion of children who report inactivity remains stable from 2006 (8% in 2006).
Figure 51: Percentages of 9 year old boys and girls who report participating in vigorous exercise less than weekly
30
20
(%)
10
0
SC1-2 2006
SC1-2 2010
SC3-4 2006
SC3-4 2010
SC5-6 2006
SC5-6 2010
Boys GirlsGender
6 6 7 6 6
11
35 5
3
79

45
Physically active on 7 days in the last week
Overall, 25% of children report being physically active on 7 days in the last week. There are statistically significant differences by gender, age group and social class. Overall, 31% of boys report being physically active on 7 days in the last week compared to 18% of girls. Younger children are more likely to report being physically active on seven days in the last week compared to older children. Overall, the proportion of children who report being physically active on 7 days in the last week remains stable from 2006 (27% in 2006).
Figure 52: Percentages of boys who report being physically active on 7 days in the last week
70
(%)
010-11 12-14 15-17
Age Group (Years)
60
50
40
30
20
10
4144
38
3134 34
24 2320
SC1-2 2010SC3-4 2010SC5-6 2010
SC1-2 2006SC3-4 2006SC5-6 2006
44
5350
39 38 37
22 22 24
Figure 53: Percentages of girls who report being physically active on 7 days in the last week
70
(%)
010-11 12-14 15-17
Age Group (Years)
60
50
40
30
20
10
30 29
37
18 20 21
9 913
SC1-2 2010SC3-4 2010SC5-6 2010
SC1-2 2006SC3-4 2006SC5-6 2006
35 3641
23 22 23
9 9 10
Exercise and Physical Activity

46
The Irish Health Behaviour in School-Aged Children (HBSC) Study 2010

47
Self-care
Tooth-brushing
Children were asked to report how often they brush their teeth. Overall, 67% of children report brushing their teeth more than once a day, with a further 27% brushing their teeth once a day. There are statistically significant differences by gender and social class. Overall, 77% of girls compared to 59% of boys, and children in higher social class groups compared to other social class groups, are more likely to report brushing their teeth more than once a day. There are no statistically significant differences across age groups. The proportion of children who report brushing their teeth more than once a day remains stable from 2006 (63% in 2006).
Figure 54: Percentages of boys who report brushing their teeth more than once a day
100
(%) 50
010-11 12-14 15-17
Age Group (Years)
90
80
70
60
40
30
20
10
60
69 70
60 6054
61 5852
SC1-2 2010SC3-4 2010SC5-6 2010
SC1-2 2006SC3-4 2006SC5-6 2006
6356
52 5550
54 57 55 53
Figure 55: Percentages of girls who report brushing their teeth more than once a day
100
(%) 50
010-11 12-14 15-17
Age Group (Years)
90
80
70
60
40
30
20
10
73 7268
77 7773
80 8076
SC1-2 2010SC3-4 2010SC5-6 2010
SC1-2 2006SC3-4 2006SC5-6 200675
66 64
7368
7278 79
74

48
The Irish Health Behaviour in School-Aged Children (HBSC) Study 2010
Tooth-brushing – Middle Childhood Study
Overall, 66% of 3rd and 4th class children report brushing their teeth more than once a day. There are statistically significant differences by gender with 69% of girls compared to 63% of boys who report that they brush their teeth more than once a day. There are no statistically significant differences across social class groups. The proportion of children who report brushing their teeth more than once a day remains stable from 2006 (64% in 2006).
Figure 56: Percentages of 9 year old boys and girls who report brushing their teeth more than once a day
100
(%) 50
0
90
80
70
60
40
30
20
10
SC1-2 2006
SC1-2 2010
SC3-4 2006
SC3-4 2010
SC5-6 2006
SC5-6 2010
Boys GirlsGender
61 59 5663 63 65
70 69 66 6872
66

49
Seatbelt use
Children were asked to report how often they use a seatbelt when in a car. Overall, 81% of children report always wearing a seatbelt when in a car. There are statistically significant differences by gender and age group. Overall, 84% of girls compared to 79% of boys report always wearing a seatbelt when in a car and younger children are more likely to report this behaviour compared to older children. There are no statistically significant differences across social class groups. Overall, the proportion of children who report always wearing a seatbelt when in a car remains stable from 2006 (79% in 2006).
Figure 57: Percentages of boys who report always wearing a seatbelt
100
(%) 50
010-11 12-14 15-17
Age Group (Years)
90
80
70
60
40
30
20
10
8086
77 78 78 77 80 80 79
SC1-2 2010SC3-4 2010SC5-6 2010
SC1-2 2006SC3-4 2006SC5-6 200676
88 90
76 78 75 76 76 74
Figure 58: Percentages of girls who report always wearing a seatbelt
100
(%) 50
010-11 12-14 15-17
Age Group (Years)
90
80
70
60
40
30
20
10
8892
87 84 8480
84 84 84
SC1-2 2010SC3-4 2010SC5-6 2010
SC1-2 2006SC3-4 2006SC5-6 2006
89 88 90
81 82 84 81 83 83
Self Care

50
The Irish Health Behaviour in School-Aged Children (HBSC) Study 2010
Seatbelt use – Middle Childhood Study
Overall, 87% of 3rd and 4th class children report always wearing a seatbelt when in a car. There are statistically significant differences by gender with 90% of girls compared to 85% of boys who report always wearing a seatbelt when in a car. There are no statistically significant differences across social class groups. Overall, the proportion of children who report always wearing a seatbelt when in a car remains stable from 2006 (88% in 2006).
Figure 59: Percentages of 9 year old boys and girls who report always wearing a seatbelt
100
(%) 50
0
90
80
70
60
40
30
20
10
SC1-2 2006
SC1-2 2010
SC3-4 2006
SC3-4 2010
SC5-6 2006
SC5-6 2010
Boys GirlsGender
86 87 85 85 8782
89 91 89 91 89 90

51
Injuries
Ever injured
Overall, 37% of children report being injured once or more in the last 12 months, and requiring medical attention. There are statistically significant differences by gender and age group. Overall, boys and older children, compared to girls and younger children respectively, are more likely to report ever being injured. There are no statistically significant differences across social class groups. There is an overall decrease in the proportion of children who report being injured from 2006 (43% in 2006).
Figure 60: Percentages of boys who report ever being injured in the last 12 months
60
50
40
(%) 30
20
10
010-11 12-14 15-17
Age Group (Years)
43 4540
4648
45
SC1-2 2010SC3-4 2010SC5-6 2010
SC1-2 2006SC3-4 2006SC5-6 2006
38
45 47
52 52 52 51 5350
38
45 45
Figure 61: Percentages of girls who report ever being injured in the last 12 months
60
50
40
(%) 30
20
10
010-11 12-14 15-17
Age Group (Years)
30 3229 28
30 30SC1-2 2010SC3-4 2010SC5-6 2010
SC1-2 2006SC3-4 2006SC5-6 2006
31 30
3734 36 37
33 3228
25 25 24
52
The Irish Health Behaviour in School-Aged Children (HBSC) Study 2010
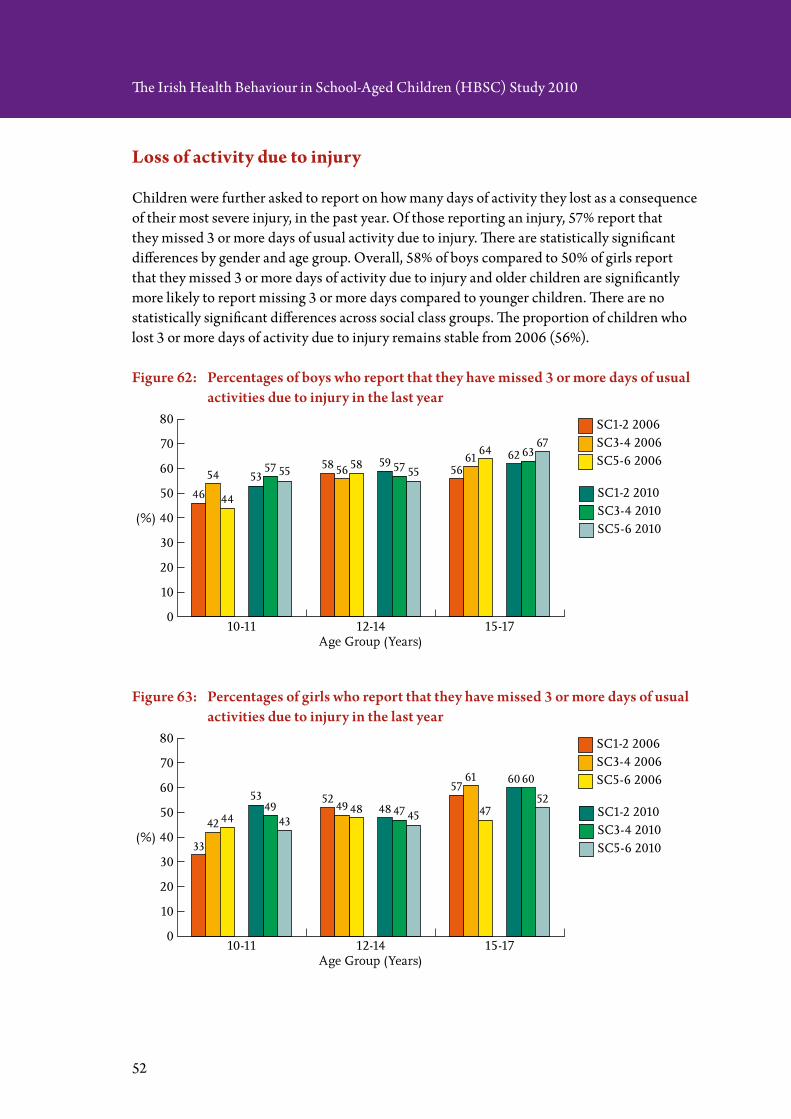
Loss of activity due to injury
Children were further asked to report on how many days of activity they lost as a consequence of their most severe injury, in the past year. Of those reporting an injury, 57% report that they missed 3 or more days of usual activity due to injury. There are statistically significant differences by gender and age group. Overall, 58% of boys compared to 50% of girls report that they missed 3 or more days of activity due to injury and older children are significantly more likely to report missing 3 or more days compared to younger children. There are no statistically significant differences across social class groups. The proportion of children who lost 3 or more days of activity due to injury remains stable from 2006 (56%).
Figure 62: Percentages of boys who report that they have missed 3 or more days of usual activities due to injury in the last year
80
(%) 40
010-11 12-14 15-17
Age Group (Years)
70
60
50
30
20
10
5357 55
59 57 55
62 6367
SC1-2 2010SC3-4 2010SC5-6 2010
SC1-2 2006SC3-4 2006SC5-6 2006
46
54
44
58 56 58 5661
64
Figure 63: Percentages of girls who report that they have missed 3 or more days of usual activities due to injury in the last year
80
(%) 40
010-11 12-14 15-17
Age Group (Years)
70
60
50
30
20
10
5349
4348 47 45
60 60
52SC1-2 2010SC3-4 2010SC5-6 2010
SC1-2 2006SC3-4 2006SC5-6 2006
33
42 44
5249 48
5761
47

53
Physical Fighting and Bullying
Physical fight
Children were asked if they had been in a physical fight in the last 12 months. Overall, 35% of children report having been in a physical fight during the last 12 months. Gender and social class differences are statistically significant. Overall, boys (48%) compared to girls (20%), and children from lower social classes compared to other social class groups, are significantly more likely to report fighting. There are no statistically significant differences across age groups. Overall, the proportion of children who report being in a physical fight remains stable from 2006 (38% in 2006).
Figure 64: Percentages of boys who report ever being in a physical fight in the last 12 months
70
(%)
010-11 12-14 15-17
Age Group (Years)
60
50
40
30
20
10
49 48 47 49 47 4944 44
52
SC1-2 2010SC3-4 2010SC5-6 2010
SC1-2 2006SC3-4 2006SC5-6 200651 51
36
54 56 56
4248
53
Figure 65: Percentages of girls who report ever being in a physical fight in the last 12 months
70
(%)
010-11 12-14 15-17
Age Group (Years)
60
50
40
30
20
1013
17 15 1722 20 18
2421
SC1-2 2010SC3-4 2010SC5-6 2010
SC1-2 2006SC3-4 2006SC5-6 2006
1721
2420
26 2621
26 27
54
The Irish Health Behaviour in School-Aged Children (HBSC) Study 2010
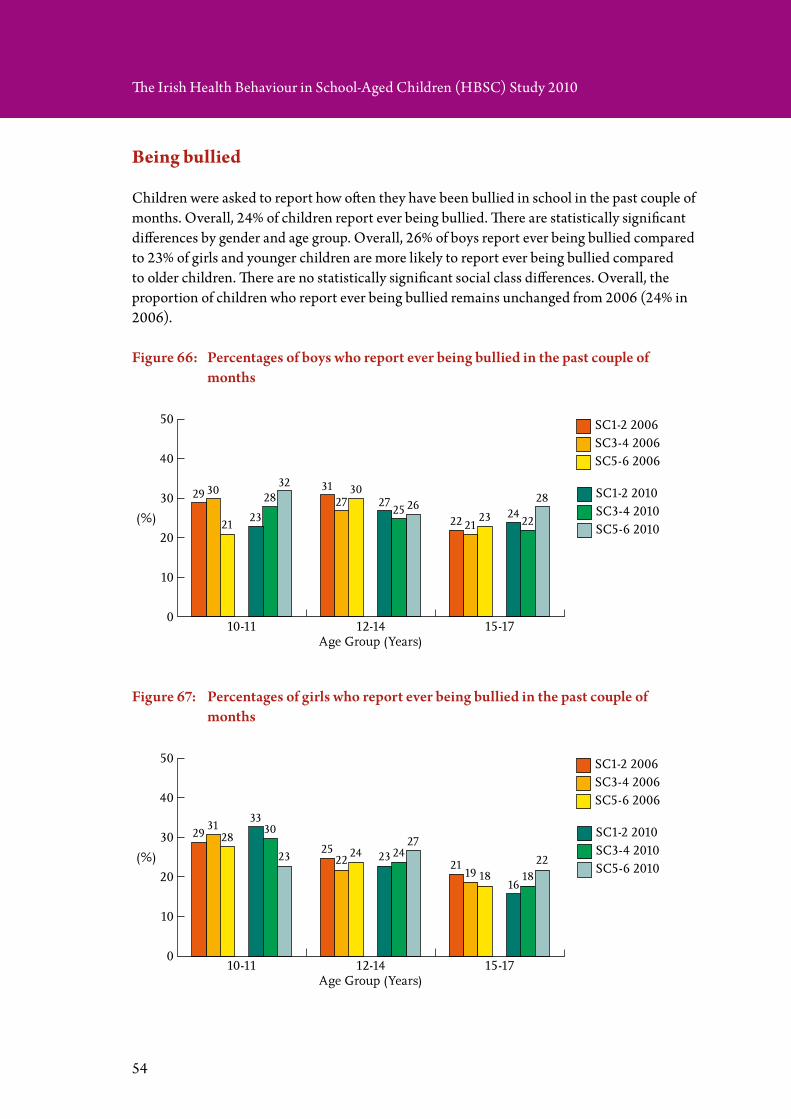
Being bullied
Children were asked to report how often they have been bullied in school in the past couple of months. Overall, 24% of children report ever being bullied. There are statistically significant differences by gender and age group. Overall, 26% of boys report ever being bullied compared to 23% of girls and younger children are more likely to report ever being bullied compared to older children. There are no statistically significant social class differences. Overall, the proportion of children who report ever being bullied remains unchanged from 2006 (24% in 2006).
Figure 66: Percentages of boys who report ever being bullied in the past couple of months
50
(%)
0
40
30
20
10
10-11 12-14 15-17Age Group (Years)
SC1-2 2010SC3-4 2010SC5-6 2010
SC1-2 2006SC3-4 2006SC5-6 2006
2832
2725 26
2422
2829 30 3127
30
22 2123
2123
Figure 67: Percentages of girls who report ever being bullied in the past couple of months
50
(%)
0
40
30
20
10
10-11 12-14 15-17Age Group (Years)
SC1-2 2010SC3-4 2010SC5-6 2010
SC1-2 2006SC3-4 2006SC5-6 2006
30
23 23 2427
1618
22
2931
2522
2421
19 18
28
33

55
Being bullied – Middle Childhood Study
Overall, 37% of 3rd and 4th class children report ever being bullied in school in the past couple of months. There are no statistically significant differences across gender and social class groups. The proportion of children who report ever being bullied remains unchanged from 2006 (37% in 2006).
Figure 68: Percentages of 9 year old boys and girls who report ever being bullied in the past couple of months
SC1-2 2006
SC1-2 2010
SC3-4 2006
SC3-4 2010
SC5-6 2006
SC5-6 2010
Boys GirlsGender
38 3840
3336
32
3735 36
4038
35
50
(%)
0
40
30
20
10
Physical Fighting and Bullying

56
The Irish Health Behaviour in School-Aged Children (HBSC) Study 2010
Bullied others
Children were also asked to report how often they took part in bullying another student at school in the past couple of months. Overall, 17% of children report ever bullying others at school. Gender and age group differences are statistically significant with more boys than girls reporting that they have bullied others (22% and 10% respectively) and older children more likely to report bullying others than younger children. There are no statistically significant differences across social class groups. There is a decrease in the proportion of children who report bullying others from 2006 (22% in 2006).
Figure 69: Percentages of boys who report ever bullying others in the past couple of months
50
(%)
0
40
30
20
10
10-11 12-14 15-17Age Group (Years)
SC1-2 2010SC3-4 2010SC5-6 2010
SC1-2 2006SC3-4 2006SC5-6 2006
15
21 21 21 2024 23
2527
21
29 29 29 3032
35
15 15
Figure 70: Percentages of girls who report ever bullying others in the past couple of months
50
(%)
0
40
30
20
10
10-11 12-14 15-17Age Group (Years)
SC1-2 2010SC3-4 2010SC5-6 2010
SC1-2 2006SC3-4 2006SC5-6 2006
9 911 10 9 8
10 911
1512
16 1512
141112
10
57
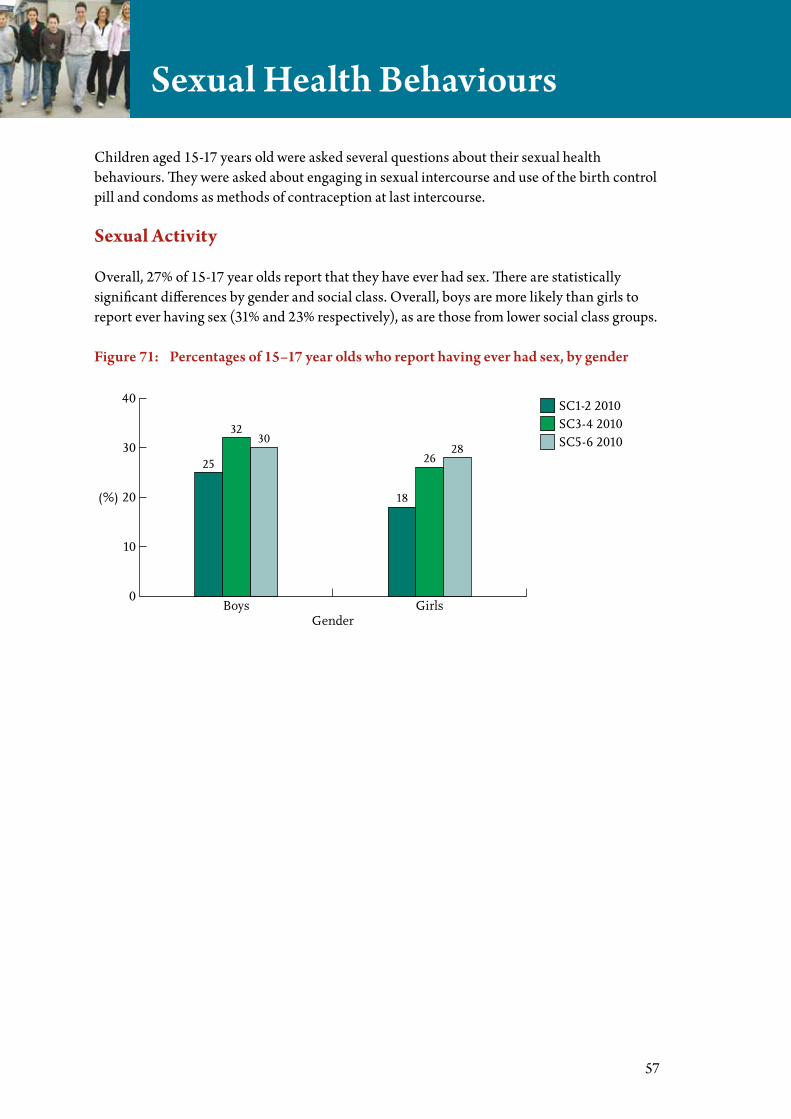
Sexual Health Behaviours
Children aged 15-17 years old were asked several questions about their sexual health behaviours. They were asked about engaging in sexual intercourse and use of the birth control pill and condoms as methods of contraception at last intercourse.
Sexual Activity
Overall, 27% of 15-17 year olds report that they have ever had sex. There are statistically significant differences by gender and social class. Overall, boys are more likely than girls to report ever having sex (31% and 23% respectively), as are those from lower social class groups.
Figure 71: Percentages of 15–17 year olds who report having ever had sex, by gender
40
(%) 20
0
30
10
SC1-2 2010SC3-4 2010SC5-6 2010
Boys GirlsGender
25
3230
18
2628

58
Use of birth control pill
Of those who report ever having had sex, 59% report that they used the birth control pill as a form of contraceptive at last intercourse. Gender differences are statistically significant with girls more likely to report using the birth control pill as a form of contraceptive than boys. There are no statistically significant differences across social class groups.
Figure 72: Percentages of 15–17 year olds who report using the birth control pill, by gender (of those who have ever had sex).
100
(%) 50
0
90
80
70
60
40
30
20
10
SC1-2 2010SC3-4 2010SC5-6 2010
Boys GirlsGender
5751
39
6861
72
Condom use
Of those who report ever having had sex, 93% report that they used condoms as a form of contraceptive at last intercourse. There are no statistically significant differences by gender or social class.
Figure 73: 15–17 year olds who report using condoms, by gender (of those who have ever had sex)
100
(%) 50
0
90
80
70
60
40
30
20
10
SC1-2 2010SC3-4 2010SC5-6 2010
Boys GirlsGender
94 9297 98
94 93
The Irish Health Behaviour in School-Aged Children (HBSC) Study 2010
59
Appendix
Demographic Representativeness of Respondents: HBSC 2010 Survey
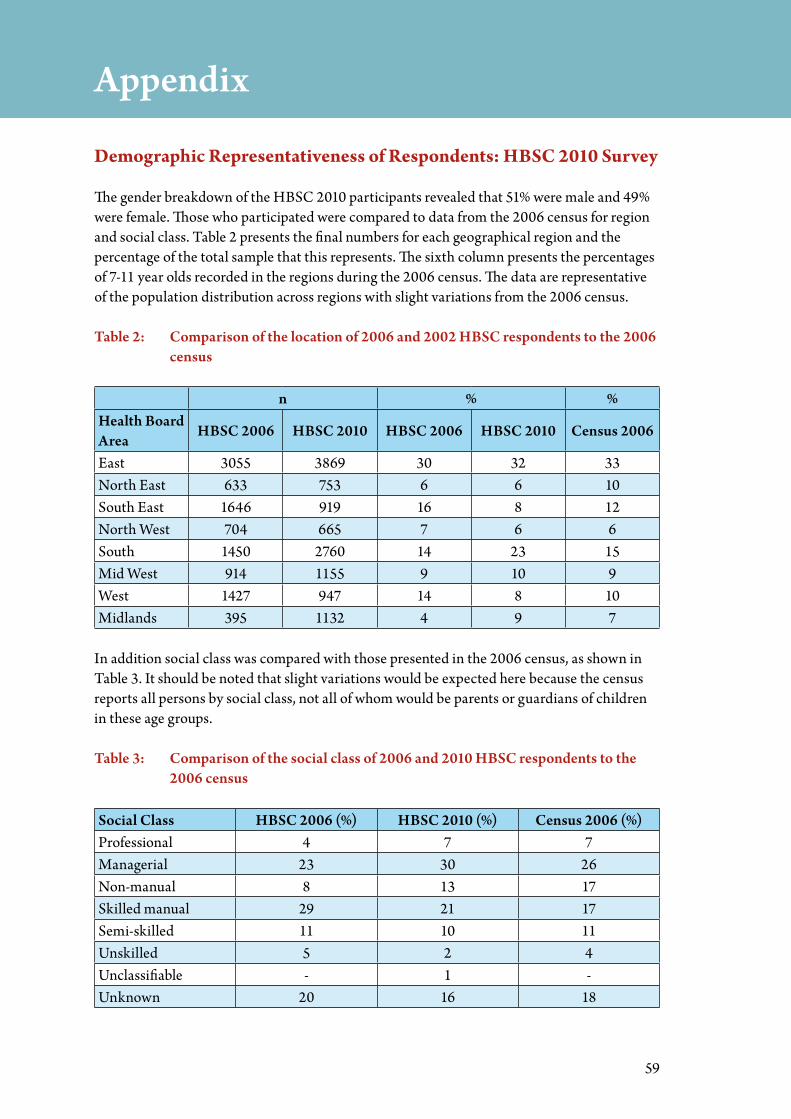
The gender breakdown of the HBSC 2010 participants revealed that 51% were male and 49% were female. Those who participated were compared to data from the 2006 census for region and social class. Table 2 presents the final numbers for each geographical region and the percentage of the total sample that this represents. The sixth column presents the percentages of 7-11 year olds recorded in the regions during the 2006 census. The data are representative of the population distribution across regions with slight variations from the 2006 census.
Table 2: Comparison of the location of 2006 and 2002 HBSC respondents to the 2006 census
n % %Health Board Area
HBSC 2006 HBSC 2010 HBSC 2006 HBSC 2010 Census 2006
East 3055 3869 30 32 33North East 633 753 6 6 10South East 1646 919 16 8 12North West 704 665 7 6 6South 1450 2760 14 23 15Mid West 914 1155 9 10 9West 1427 947 14 8 10Midlands 395 1132 4 9 7
In addition social class was compared with those presented in the 2006 census, as shown in Table 3. It should be noted that slight variations would be expected here because the census reports all persons by social class, not all of whom would be parents or guardians of children in these age groups.
Table 3: Comparison of the social class of 2006 and 2010 HBSC respondents to the 2006 census
Social Class HBSC 2006 (%) HBSC 2010 (%) Census 2006 (%)Professional 4 7 7Managerial 23 30 26Non-manual 8 13 17Skilled manual 29 21 17Semi-skilled 11 10 11Unskilled 5 2 4Unclassifiable - 1 -Unknown 20 16 18
60
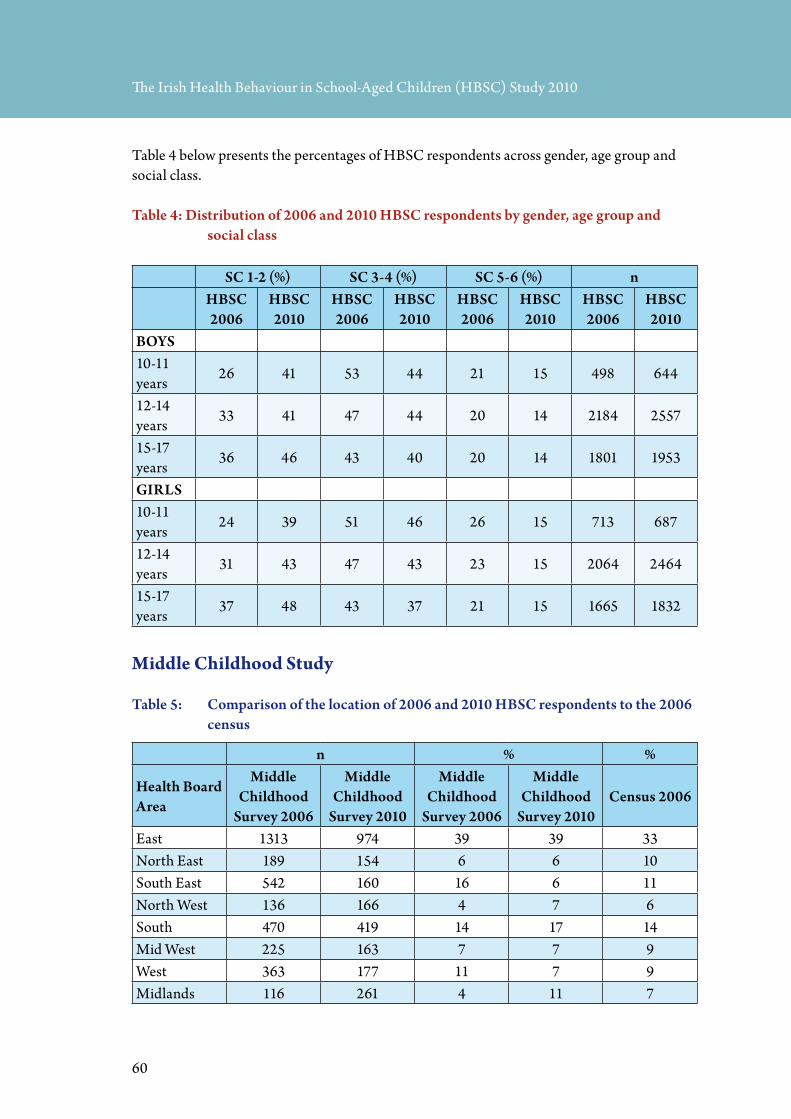
Table 4 below presents the percentages of HBSC respondents across gender, age group and social class.
Table 4: Distribution of 2006 and 2010 HBSC respondents by gender, age group and social class
SC 1-2 (%) SC 3-4 (%) SC 5-6 (%) nHBSC 2006
HBSC 2010
HBSC 2006
HBSC 2010
HBSC 2006
HBSC 2010
HBSC 2006
HBSC 2010
BOYS10-11 years
26 41 53 44 21 15 498 644
12-14 years
33 41 47 44 20 14 2184 2557
15-17 years
36 46 43 40 20 14 1801 1953
GIRLS10-11 years
24 39 51 46 26 15 713 687
12-14 years
31 43 47 43 23 15 2064 2464
15-17 years
37 48 43 37 21 15 1665 1832
Middle Childhood Study
Table 5: Comparison of the location of 2006 and 2010 HBSC respondents to the 2006 census
n % %
Health Board Area
Middle Childhood
Survey 2006
Middle Childhood
Survey 2010
Middle Childhood
Survey 2006
Middle Childhood
Survey 2010Census 2006
East 1313 974 39 39 33North East 189 154 6 6 10South East 542 160 16 6 11North West 136 166 4 7 6South 470 419 14 17 14Mid West 225 163 7 7 9West 363 177 11 7 9Midlands 116 261 4 11 7
The Irish Health Behaviour in School-Aged Children (HBSC) Study 2010

61
Table 6: Comparison of the social class of 2006 and 2010 HBSC respondents to the 2006 census
Social Class HBSC 2006 (%) HBSC 2010 (%) Census 2006 (%)Professional 6 6 7Managerial 20 23 26Non-manual 14 13.5 17Skilled manual 21 20 17Semi-skilled 21 14.5 11Unskilled 4 2 4Unclassifiable 2.5Unknown 14 18 18
Table 7: Distribution of 2006 and 2010 HBSC respondents by gender and social class
SC 1-2 (%) SC 3-4 (%) SC 5-6 (%) nHBSC 2006
HBSC 2010
HBSC 2006
HBSC 2010
HBSC 2006
HBSC 2010
HBSC 2006
HBSC 2010
BOYS9 year olds
32 36 39 44 29 20 1490 921
GIRLS9 year olds
27 37 43 40 30 23 1435 1035
Appendix

62
Project Team
Health Promotion Research Centre, National University of Ireland, Galway
Dr Saoirse Nic Gabhainn Principal Investigator, HBSC IrelandDr Michal Molcho Deputy Principal Investigator, HBSC IrelandDr Colette Kelly Project Manager/Senior Researcher, HBSC IrelandMs Aoife Gavin ResearcherMs Natasha Clarke ResearcherMs Katie Murphy ResearcherDr Amanda Fitzgerald ResearcherDr Siobhan O’Higgins ResearcherMs Larri Walker Research AssistantMs Christina Costello Administrative SupportDr Viv Batt Administrative Director
Advisory Committee
Mr Robbie Breen Department of HealthMs Annemarie Brooks Department of Children and Youth AffairsMr Seán Denyer Health Service ExecutiveDr John Devlin Department of HealthDr Sinead Hanafin Department of Health / Children and Youth AffairsMr Hugh Magee Department of HealthMr Liam McCormack Department of HealthMr Shay McGovern Department of HealthDr Brian Neeson Health Service ExecutiveMs Ursula O’Dwyer Department of HealthDr Stephanie O’Keefe Crisis Pregnancy AgencyMs Biddy O’Neill Health Service ExecutiveMs Claire O’Reilly Department of Health

63
Acknowledgements
The parents and children who consented and participated.
The Management Authorities, Principals and Teachers in all schools who participated.
International Co-ordinator: Prof Candace Currie, University of St. Andrews, Scotland.
International Databank Manager: Prof Oddrun Samdal, University of Bergen, Norway.
The Department of Health; The Department of Children and Youth Affairs; The Department of Education and Science
We would also like to thank Gail Cummins, Emiliano Curetti, Priscilla Doyle, Marie Galvin, Yetunde John-Akinola, Samantha Loughrey, Amy Magill, Peter Manley, Joe Mullen, Christina Murphy, Geraldine Nolan, Brían O’Connor, Ronan O’Connor, Ailbhe Spillane, Susan Spillane, Aisling Walsh and all other NUI Galway staff and services.
Data Entry: e-Celtic, Co. Dublin and Larri Walker.
Design and layout: Rob Smyth.

64


