40
HCAI Technology Innovation Programme Showcase Hospitals report number 2 The 3M TM Clean-Trace TM Clinical Hygiene Monitoring System
HCAI Technology Innovation Programme Showcase Hospitals report number 2
The 3MTM Clean-TraceTM Clinical Hygiene Monitoring System
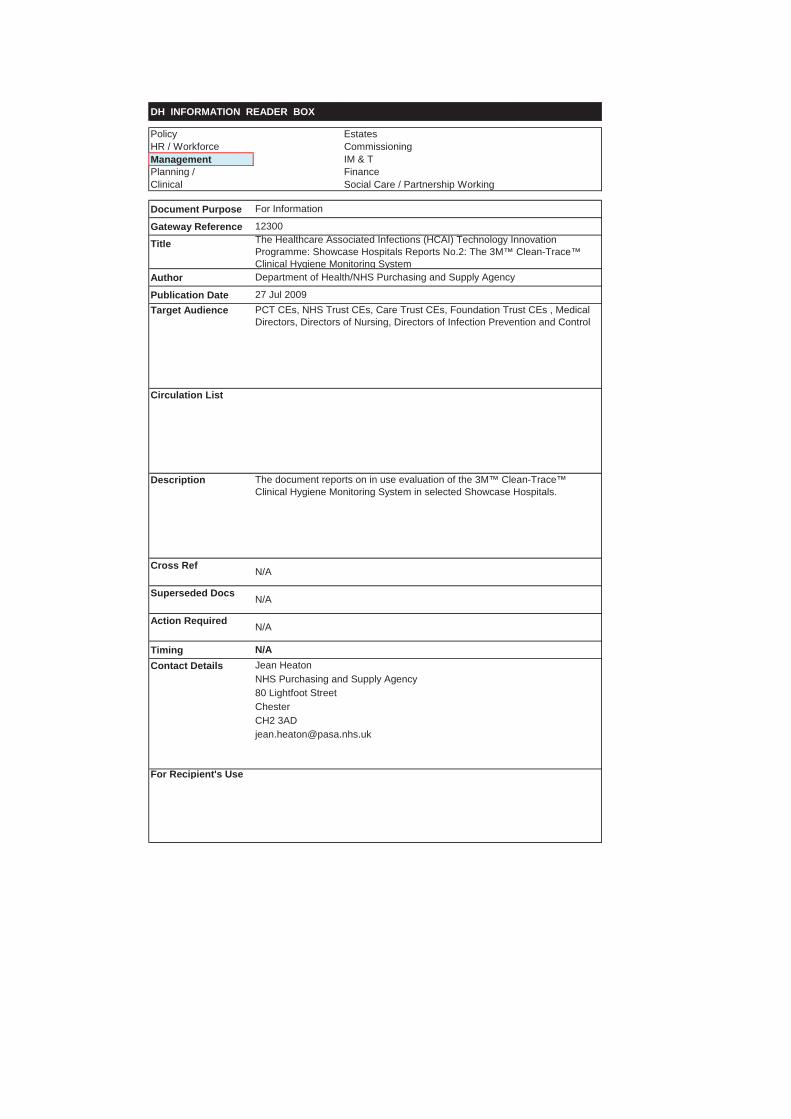
DH INFORMATION READER BOX
Policy EstatesHR / Workforce CommissioningManagement IM & T Manageme
Planning / FinanceClinical Social Care / Partnership Working
Document Purpose
Gateway ReferenceTitle
Author
Publication DateTarget Audience
Circulation List
Description
Cross Ref
Superseded Docs
Action Required
TimingContact Details
Chester
The document reports on in use evaluation of the 3M™ Clean-Trace™Clinical Hygiene Monitoring System in selected Showcase Hospitals.
N/A
Department of Health/NHS Purchasing and Supply Agency
27 Jul 2009PCT CEs, NHS Trust CEs, Care Trust CEs, Foundation Trust CEs , MedicalDirectors, Directors of Nursing, Directors of Infection Prevention and Control
#VALUE!
N/A
N/A
N/A
0
12300
For Information
For Recipient's Use
The Healthcare Associated Infections (HCAI) Technology InnovationProgramme: Showcase Hospitals Reports No.2: The 3M™ Clean-Trace™Clinical Hygiene Monitoring System
Jean HeatonNHS Purchasing and Supply Agency80 Lightfoot Street
The Healthcare Associated Infections (HCAI) TechnologyInnovation Programme
The basic ways of preventing and reducing healthcare associated infections (HCAIs)are largely unchanging. The principal strategies for combating HCAIs are thoseassociated with hand hygiene/aseptic techniques, prudent antibiotic prescribing andgood clinical practice. However, new technologies and equipment can support these strategies by helping get things done differently, more swiftly or more reliably.
As part of the strategy set out in Clean, Safe Care1 the Department of Health is funding the HCAI Technology Innovation Programme2. The Programme aims to
Speed up the development and adoption of technologies to further helpcombat HCAIs Identify which new technologies provide the best value and will have the mostimpact
The Showcase Hospitals Programme
In 2004 the Department of Health set up the Rapid Review Panel (RRP) to “provide a prompt assessment of new and novel equipment, materials and other products thatmay be of value to the NHS in improving hospital infection control and reducinghospital acquired infection”. The RRP does not undertake any product trials itself butmakes recommendations based on written evidence provided by industry.3 The highest recommendation (Recommendation 1) is Basic research and development, validation and recent in use evaluations have shown benefits that should be available to NHS bodies to include as appropriate in theircleaning, hygiene or infection control protocols.
As part of the HCAI Technology Innovation Programme, technologies which havegained a RRP Recommendation 1 are being placed in up to 7 Showcase Hospitalsaround the country for periods up to six months during which time a detailed evaluation of their in-use and economic features along with adoption characteristics is undertaken. The current Showcase Hospitals are The Royal WolverhamptonHospitals NHS Trust, Imperial College Healthcare NHS Trust, Calderdale andHuddersfield NHS Foundation Trust, Southampton University Hospitals NHS Trust,County Durham and Darlington NHS Foundation Trust, The Lewisham Hospital NHS Trust and Central Manchester University Hospitals NHS Foundation Trust.
These are service evaluations, as defined by the National Patient Safety Agency’sNational Research Ethics Service, and do not therefore require Research Ethics Committee review.4
1 Clean, safe care: Reducing infections and saving lives. Department of Health, 9 January2008.2 For further information on the Programme see http://www.clean-safe-care.nhs.uk/index.php?pid=283 For more information on the Rapid Review Panel seehttp://www.hpa.org.uk/webw/HPAweb&Page&HPAwebAutoListName/Page/1158313434380?p=11583134343804 See leaflet on defining research at http://www.nres.npsa.nhs.uk/news-and-publications/publications/nres-research-leaflets/

Acknowledgements
We would like to acknowledge the support of the NHS Purchasing and Supply Agency Centre for Evidence-based Purchasing and NHS National Technology Adoption Centre in the compilation of this report.
Showcase Hospitals report number 2
The 3MTM Clean-TraceTM Clinical Hygiene MonitoringSystem
Contents
Executive summary 2
Introduction 3
The problem
Monitoring hospital cleanliness 3
The product
The 3M™ Clean-Trace™ Clinical Hygiene Monitoring System 3
The knowledge base
What was known before this evaluation 4
The evaluation
How the evaluation was done 5
Does the product help improve cleanliness? 5
How easy was the product to use? 8
What issues arose in relation to implementation and adoption? 8
What did staff think of the product? 9
Advice and tools for trusts considering introducing the 3M™ Clean-Trace™ Clinical Hygiene Monitoring System
Important points to consider 11
Costs and benefits 13
Annex - Graphs showing average readings for each swab site 15
References 36
1
Executive summary
The Department of Health has set up a Rapid Review Panel (RRP) to assess new and novel technologies and consider their potential for reducing hospital infections.As part of the Department’s Healthcare Associated Infections (HCAI) TechnologyInnovation Programme, technologies that have received an RRP1 recommendation (“basic research and development, validation and in-use evaluations have shown benefits that should be available to NHS bodies”) have been placed in selected Showcase Hospitals for review of their acceptability in everyday use and to gatherinformation that may be useful for other hospitals.
The 3M™ Clean-Trace™ Clinical Hygiene Monitoring System helps assessstandards of hygiene by measuring the amount of adenosine triphosphate (ATP) in a sample, indicating overall biocontamination on surfaces and equipment. The Clean-Trace Clinical ATP system was awarded Rapid Review Panel (RRP) recommendation 1 in 2007.
The system was used in seven Showcase Hospitals for five months to monitorbiocontamination levels. In each hospital the product was used on four wards and swab readings were taken at twenty different points in each ward seven days a week– a total of over 53,000 readings. Reductions in biocontamination levels were observed.
Staff opinions of the product were favourable, hygiene awareness improved and in some hospitals a spirit of healthy competition developed that helped staff focus on the value of cleanliness. However, swabbing routines at the levels used in thisevaluation were time-consuming and in some cases this had a negative impact on enthusiasm to use the product.
The showcase project demonstrated that the Clean-Trace Clinical ATP system can be safely implemented in NHS hospitals and that its use was popular with staff, patients and visitors. As there are no standards for acceptable levels of ATP-measured biocontamination in hospital settings, the Clean-Trace Clinical ATP system is best used for comparing levels of contamination in different areas and/orover time. A variety of possible uses of the Clean-Trace Clinical ATP system are suggested.
Keywords: Hygiene monitoring, HCAI, ATP Clean-Trace Clinical, Rapid ReviewPanel
2
Introduction
This report sets out the findings from an evaluation in NHS Showcase Hospitals of the in-use and economic features and adoption characteristics of the 3M™ Clean-Trace™ Clinical Hygiene Monitoring System. The Rapid Review Panel whichassesses new and novel products which may help infection prevention and control has concluded that basic research and development, validation and recent in use evaluations have shown benefits that should be available to NHS bodies to include as appropriate in their cleaning, hygiene or infection control protocols.
The objective of this document is to help Directors of Infection Prevention and Control and other stakeholders to decide whether they should consider the Clean-Trace Clinical ATP system as part of their trust’s strategy to reduce healthcareassociated infections.
The problem Monitoring hospital cleanliness
Patients rightly expect hospitals to be clean and to deliver safe care. Effective cleaning protocols are important for building a strong reputation for high-quality care.
Hospital cleanliness is primarily monitored by visual inspection. This involves the person assessing the surface as being free from debris and soil without sampling aids. This may include looking at the surface, feeling the surface for signs of“invisible” deposits and even smelling the surface. However, visual inspection maynot be sufficient if small amounts of soil are present and microbiological swabbing can only provide a partial answer since samples must be sent for time-consuming culture and analysis, and it only measures contamination on the areas that are swabbed. The assessment of a marker, which could be present in many types of soiling, such as adenosine triphosphate (ATP)5 can be useful.
The product The 3M™ Clean-Trace™ Clinical Hygiene Monitoring System
The Clean-Trace Clinical ATP system uses swabs and a hand-held light meter, a ‘luminometer’, to measure biocontamination on surfaces and equipment. Iteliminates time-consuming culture and analysis, but, as with any swabbing, can only measure contamination on the areas that are swabbed.
The Clean-Trace Clinical ATP system detects adenosine triphosphate (ATP), a substance which is present in all animal, plant, bacterial, yeast and mould cells, whether living or dead. The amount of ATP on a surface is an indicator of the level of biocontamination, though it does not distinguish whether the biocontamination isfrom live or dead bacterial cells or from other organic sources such as body fluids.
A swab is used to collect a sample from an appropriate surface (e.g. a door handle). After swabbing it is returned to the swab tube and is activated by fully depressing the
5 Adenosine-5’-triphosphate (ATP) is a multifunctional nucleotide, and plays an important role in cell biology as a coenzyme that is the “molecular unit of currency” of intracellular energy transfer.
3
swab handle into the tube. Activation of the test brings ATP from organic residuescollected on the swab into contact with the reagent combination luciferin/luciferase,resulting in the production of light. The light produced is measured in a luminometer and provides a result in Relative Light Units (RLU) in less than 10 seconds.
To monitor biocontamination across a whole ward, swab points can be chosen to cover areas of interest and concern (including bed spaces, communal areas and nurse stations) and readings can be taken as required at each point. Theluminometer automatically stores all readings, allowing the results to be reviewed.
Data held on the luminometer can be downloaded to a computer to store swab results for analysis. ATP records can be kept in accordance with quality assurance requirements, and the Clean-Trace™ data trending software can be used to produce a range of reports.
The 3M™ Clean-Trace™ Clinical Hygiene Monitoring System was awarded Rapid Review Panel (RRP) recommendation 1 in 2007. The panel concluded that the Clean-Trace Clinical ATP system can be used to measure “cleanliness” within a clinical setting on inanimate surfaces, but that the impact of this on infection transmission in hospitals was unknown.
The knowledge base What was known before this evaluation
ATP monitoring has been advocated as the preferred method of hygiene monitoringin the food industry, particularly through its effectiveness on both wet and dry surfaces [ ]1 .
The technical performance of the Clean-Trace Clinical ATP system and other ATP monitors has been assessed through a wide range of tests [ ][ ][ ]2 3 4 . The repeatabilityof results varied by ATP monitor. This may have been due to the variability in swabbing materials and methods used,[3] but higher levels of contamination lead to consistently higher RLU readings, demonstrating that ATP is a useful marker forcontamination.
In a study funded by NHS Estates and published in 2007, ATP bioluminescence swabbing (using an alternative method whose performance may differ from that of the Clean-Trace Clinical ATP system) was compared with visual inspection and microbiological swabbing for hygiene monitoring in a hospital setting. Whilst visual inspection was best for detecting dust, the other methods were better at detecting contamination on patient equipment and commodes and ATP bioluminescence swabbing was particularly sensitive to contamination of clinical workstationscompared with other methods. The study demonstrated that ATP bioluminescence swabbing was a useful indicator of cleanliness in the hospital environment, and gavean indication that it may be useful as an educational tool. The authors recommended that a longer-term study should be undertaken in order to determine how frequently ATP swabbing should be used to verify cleaning procedures and how frequently staff need to be re-trained in order to sustain an improvement in ward cleanliness.[ ]5
4
The evaluation How the evaluation was done
As part of the Showcase Hospitals programme, the 3M™ Clean-Trace™ ClinicalHygiene Monitoring System was introduced for five months in selected NHS hospitals with the aim of establishing how far its use:
was practical and economicprovided data that might be used as a surrogate marker for general cleanliness
and to investigate if the frequency of feedback of ATP results to matrons influenced subsequent swabbing results.
It was introduced in four ward areas in each hospital – an intensive therapy unit(ITU), a surgical ward, a medical assessment ward and a ward associated with care of older people.
Twenty points were designated as swab sites in each ward area (see Annex) and included patient bed areas, nurse stations, general areas, toilets and on medicalequipment. A different list of sites was used in ITU (see Annex) to reflect its different layout and equipment.
The intention was for daily swab readings to be taken at each of the twenty swab sites in each ward area. The swabbing time was not necessarily immediately before or after daily cleaning due to operational constraints such as the difficulty of predicting cleaning times, ad hoc cleaning, and a need to keep to a minimum the number of different people undertaking swabbing in order to maximize consistency of practice.
In two of the hospitals, matrons were given feedback on ATP readings every day, in two others feedback was given once a week, while in the remaining three feedback was given on a monthly basis. These different reporting regimes aimed to find outwhat level of feedback was practical and which might have the greatest impact on changes in the levels of biocontamination over the duration of the project. However, in the event there was insufficient evidence to draw any conclusions on this, and thisissue will not be considered further in this report.
At each hospital, records of the monitoring were kept, any difficulties with data capture or other negative or positive experiences were captured, and a ‘web-forum’ was also set up to allow project leads in each hospital to share experiences.
Did the product help improve cleanliness?
There was considerable variation in the results of the swabs. This is not surprising, as swabs were taken at different times in the cleaning cycle and surfaces should have the least contamination immediately after cleaning, but will become progressively more contaminated until they are cleaned again.
Statistically, there is strong evidence that RLU levels reduced over the time of the study, and that this change is well modelled by a straight line, which is well defined, but the magnitude of this systematic decrease is small compared to day to day variations (see Figure 1).
5
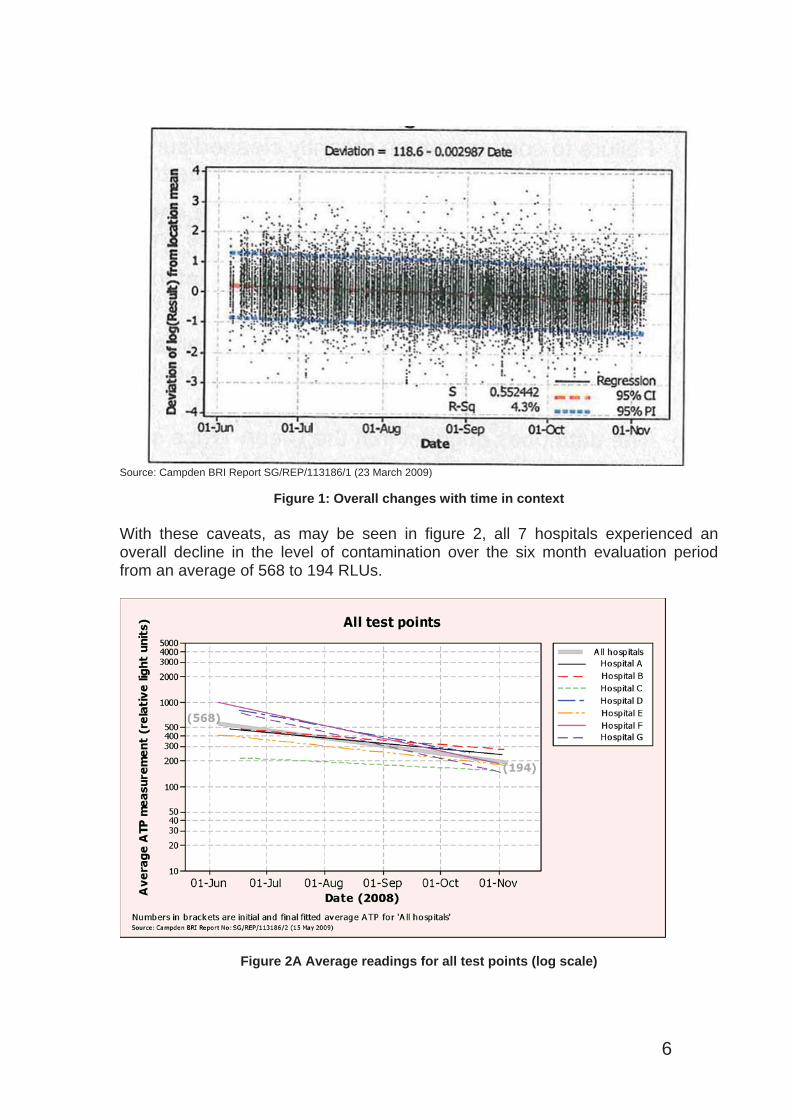
ource: Campden BRI Report SG/REP/113186/1 (23 March 2009)
Figure 1: Overall changes with time in context
S
With these caveats, as may be seen in figure 2, all 7 hospitals experienced an overall decline in the level of contamination over the six month evaluation period from an average of 568 to 194 RLUs.
Figure 2A Average readings for all test points (log scale)
6
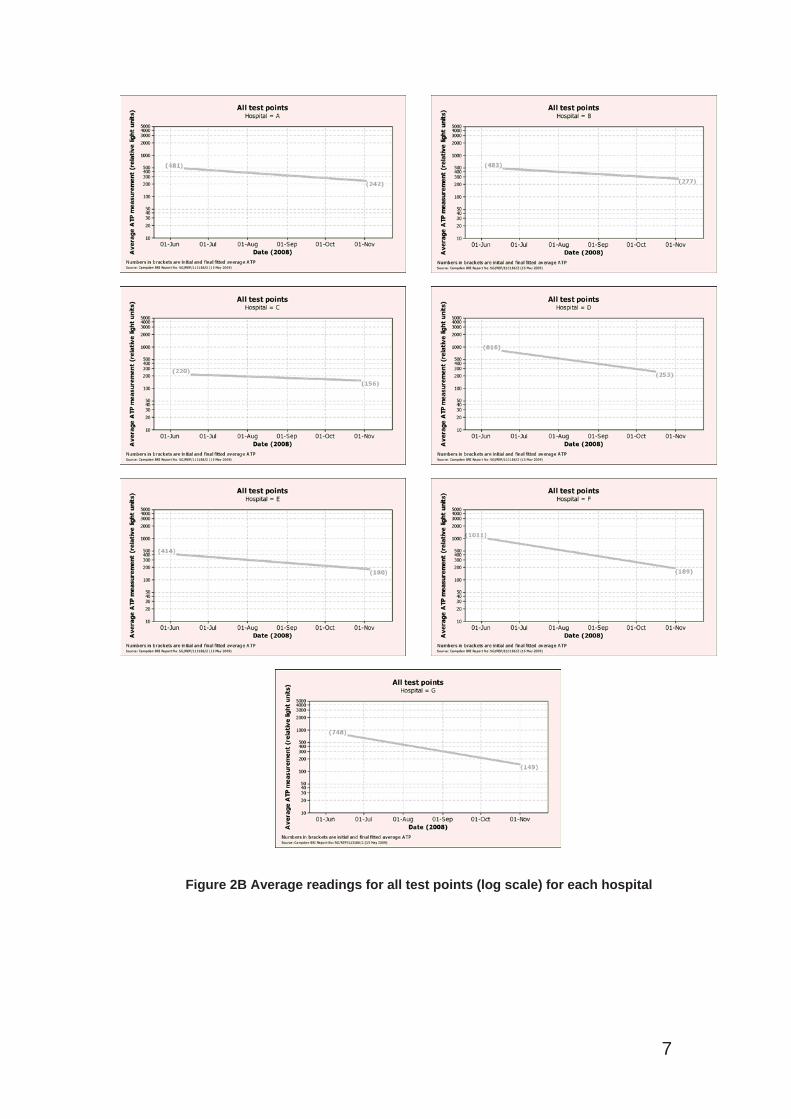
Figure 2B Average readings for all test points (log scale) for each hospital
7
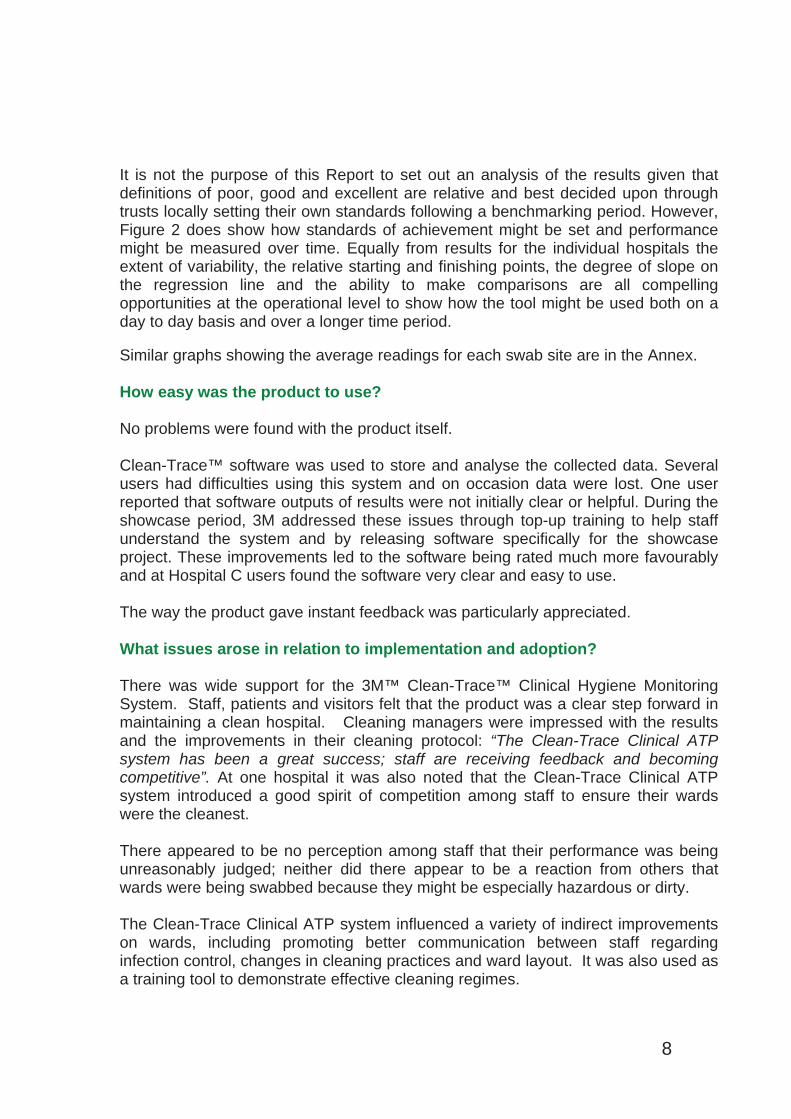
It is not the purpose of this Report to set out an analysis of the results given that definitions of poor, good and excellent are relative and best decided upon through trusts locally setting their own standards following a benchmarking period. However, Figure 2 does show how standards of achievement might be set and performance might be measured over time. Equally from results for the individual hospitals the extent of variability, the relative starting and finishing points, the degree of slope on the regression line and the ability to make comparisons are all compelling opportunities at the operational level to show how the tool might be used both on a day to day basis and over a longer time period.
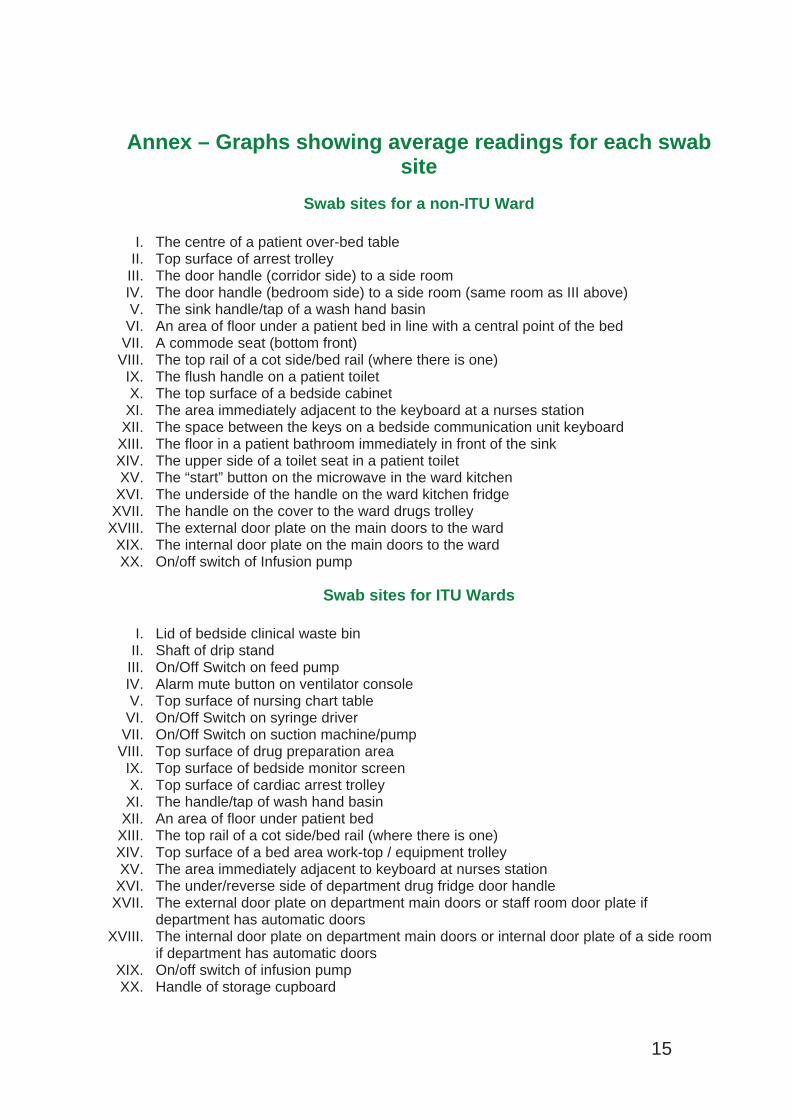
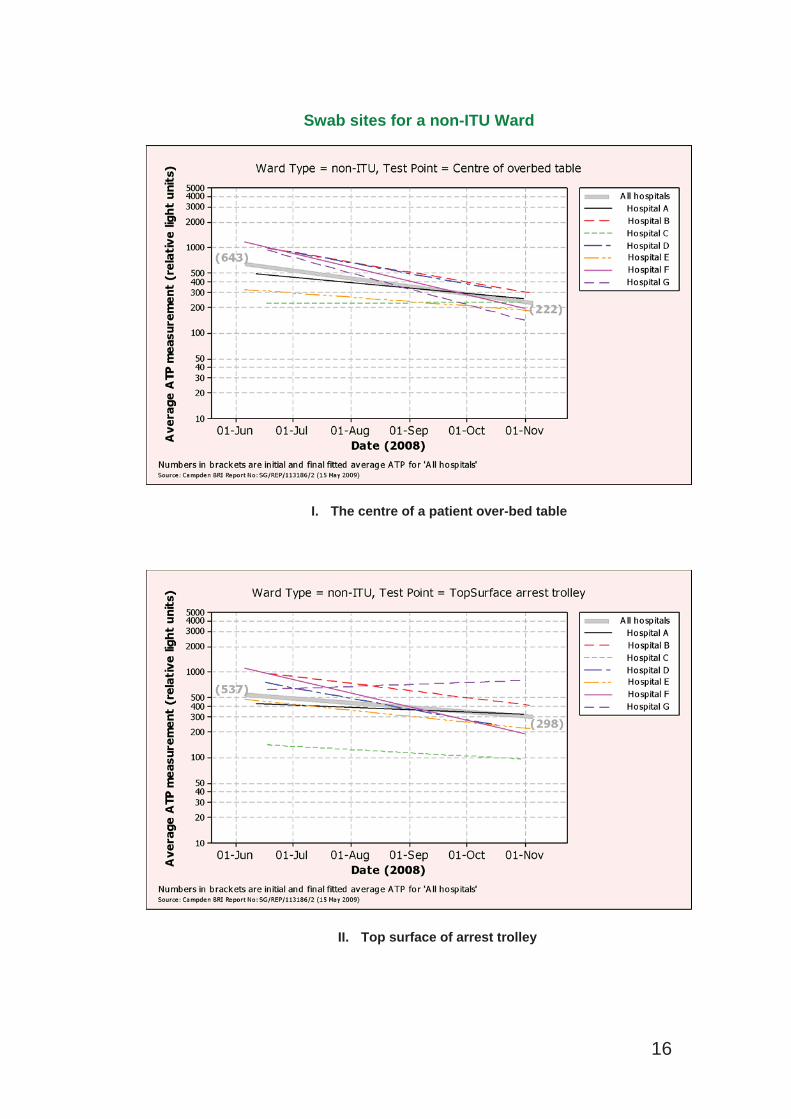
Similar graphs showing the average readings for each swab site are in the Annex.
How easy was the product to use?
No problems were found with the product itself.
Clean-Trace™ software was used to store and analyse the collected data. Several users had difficulties using this system and on occasion data were lost. One user reported that software outputs of results were not initially clear or helpful. During the showcase period, 3M addressed these issues through top-up training to help staff understand the system and by releasing software specifically for the showcase project. These improvements led to the software being rated much more favourablyand at Hospital C users found the software very clear and easy to use.
The way the product gave instant feedback was particularly appreciated.
What issues arose in relation to implementation and adoption?
There was wide support for the 3M™ Clean-Trace™ Clinical Hygiene Monitoring System. Staff, patients and visitors felt that the product was a clear step forward in maintaining a clean hospital. Cleaning managers were impressed with the results and the improvements in their cleaning protocol: “The Clean-Trace Clinical ATPsystem has been a great success; staff are receiving feedback and becomingcompetitive”. At one hospital it was also noted that the Clean-Trace Clinical ATP system introduced a good spirit of competition among staff to ensure their wards were the cleanest.
There appeared to be no perception among staff that their performance was being unreasonably judged; neither did there appear to be a reaction from others that wards were being swabbed because they might be especially hazardous or dirty.
The Clean-Trace Clinical ATP system influenced a variety of indirect improvements on wards, including promoting better communication between staff regarding infection control, changes in cleaning practices and ward layout. It was also used as a training tool to demonstrate effective cleaning regimes.
8
However, a number of points arose which will need to be borne in mind by any trust considering making use of the 3M™ Clean-Trace™ Clinical Hygiene Monitoring System.
Wards are busy environments where staff must prioritise their time to deliver the best possible patient care. Swabbing twenty test points seven days a weekpresented many challenges, and several hospitals experienced significant numbers of missed days, particularly at weekends and when key staff were on leave. It was possible for “momentum to be lost” and for swabbing to become “hit and miss”. One hospital even commented that “the novelty was wearing off”. Another found that training administration and support staff to do some of the swabbing helped to achieve continuity of results.
The Clean-Trace™ luminometers used in this evaluation were preloaded with a “traffic light” function indicating “fail”, “caution” and “pass”. Setting “pass”, “caution”and “fail” levels is a prerequisite for using the 3M data logging facility and as such levels needed to be set on the instruments. 3M selected levels based on previous experience in hospital settings. In the view of 3M, they represented a typical start point that would cater for the level of cleaning being achieved in a range of different hospitals and wards within each hospital. These levels were left unchanged for the duration of the evaluation. However, the system is not intended to be used withpreset levels as it was in this evaluation. Rather, 3M suggest that initial samplingshould be used to set appropriate “fail”, “caution” and “pass” levels, which may need to vary between different test points and areas – for example, high dependency or intensive care wards may have stricter cleaning regimes. “Fail”, “caution” and “pass” levels can be set for individual test points to take account of this.
A particular risk with “traffic lights” is that improvements within a broad band will be hidden, making it appear that improvements are not being made, which is likely to be demoralising and discouraging of further efforts at improvement. Clearly, this effect may be mitigated (though not entirely removed) by reducing “bandwidth”.
Finally, best practice is for swabs to be stored in a refrigerator, though they can be stored for a period of up to 4 weeks in ambient conditions, provided the temperatureis below 21°C. Arrangements for storage of the swabs and for access to them need to be considered before introducing the Clean-Trace Clinical ATP system.
What did staff think of the product?
Staff were asked to give the Clean-Trace Clinical ATP system a score out of 10 for 31 different factors. Figure 3 shows the scores. High scores are always good (e.g. ahigh score for “Errors” means that errors were thought unlikely). Thirty-five people took part in the survey and each red bar on the graph represents the average rating for a particular factor.
9
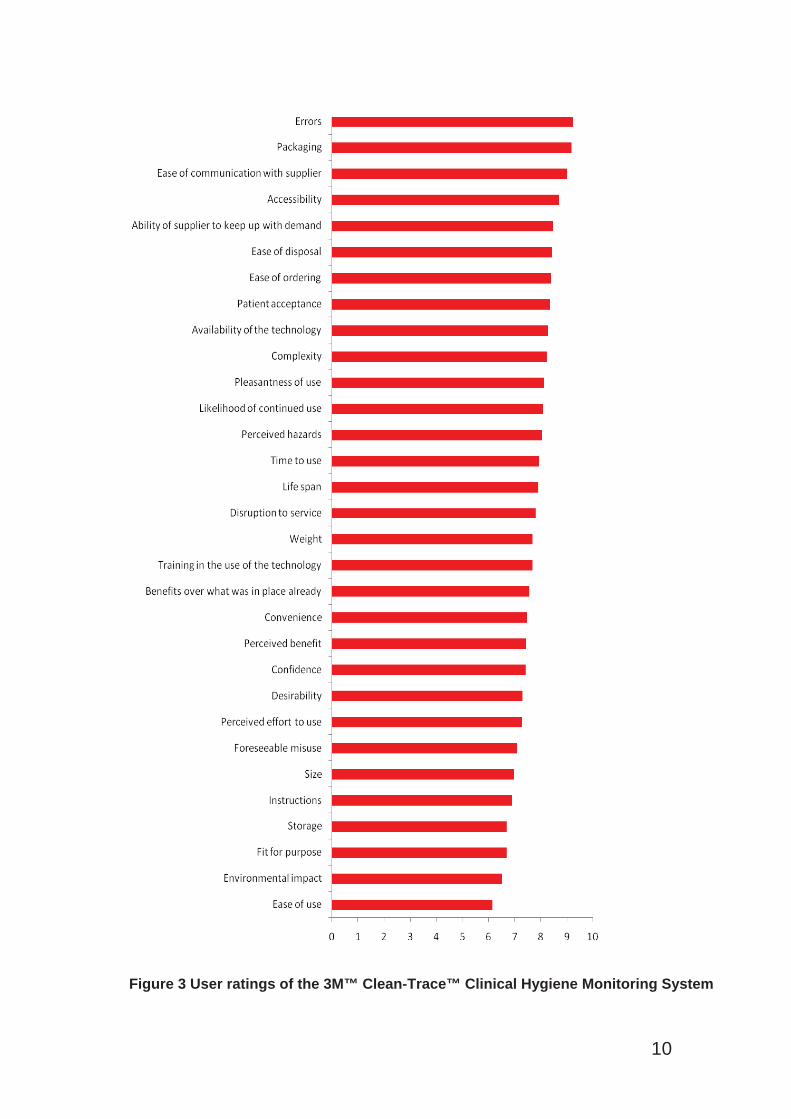
Figure 3 User ratings of the 3M™ Clean-Trace™ Clinical Hygiene Monitoring System
10
Advice and tools for trusts considering introducing the 3M™ Clean-Trace™ Clinical Hygiene Monitoring System Important points to considerThere are a range of possible uses for the Clean-Trace Clinical ATP system in the hospital setting. Besides routine monitoring, which is considered in more detailbelow, these include
monitoring of decontamination where it is particularly important that cleaning is carried out effectively, for example after the discharge of patients withinfectionscomparison of levels of contamination
o to show which areas are most likely to be heavily contaminated, and therefore may require more frequent cleaning, or particular attention to the removal of biocontaminant.
o to compare post-cleaning levels of contamination across different parts of a hospital.
training – showing the effect of cleaning on a “before and after” basis, and showing whether further cleaning has an effect on levels of contamination indication of the effectiveness of different cleaning products or methods – using “before and after” testing
The detailed charts in the Annex show the range of information that can be derived from the use of the Clean-Trace Clinical ATP system. By way of example:-
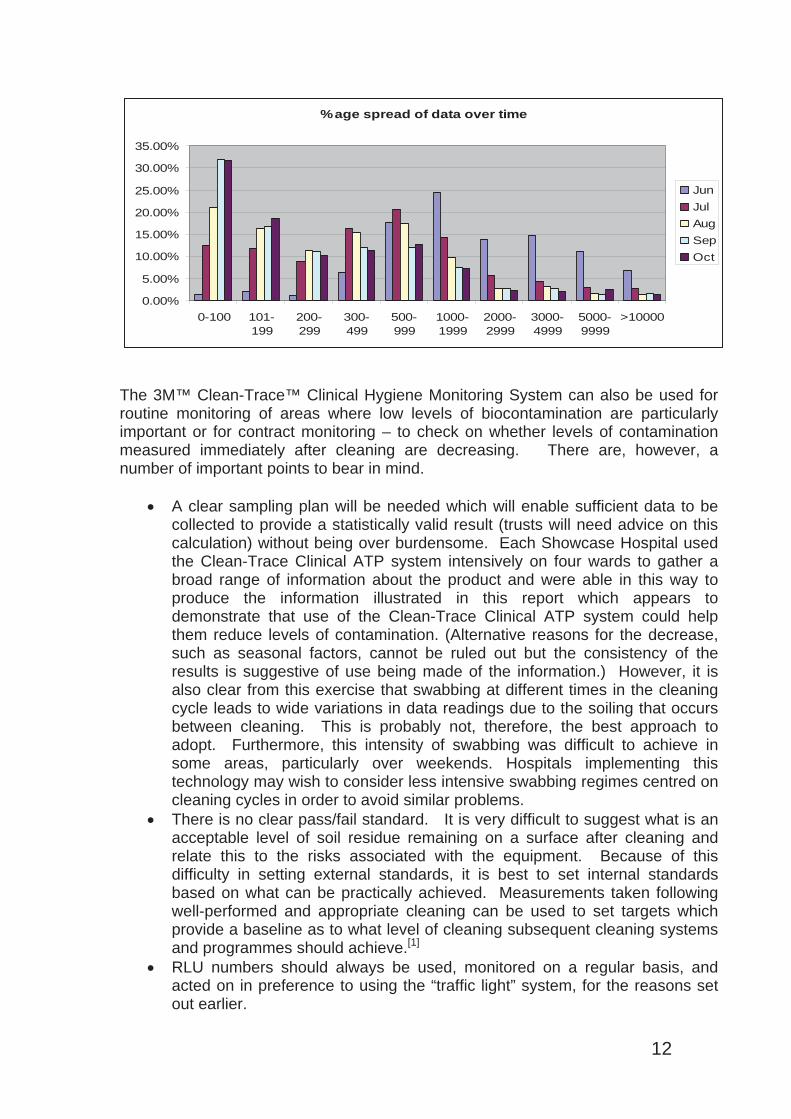
In the Showcase Hospitals the most contaminated sites overall at the start of the evaluation were the floor under a patient’s bed, the handle on the wardkitchen fridge, and the floor in a patient bathroom. At the end of the evaluation, although the level of contamination had reduced significantly,these were still the most contaminated sites, though the order had changed.However, these were not necessarily the most contaminated sites in any individual hospital. For example, at Hospital F the most contaminated sites atthe start of the evaluation were a commode seat, a toilet seat, and a toilet flush handle. The overall results for all of the 40 sites improved over the period of the evaluation, but, at hospital level, results were more mixed, with Hospital C inparticular showing deteriorating performance over a significant number of sitesAlthough the data from the Showcase Hospitals were not always collected immediately after cleaning, they were used to demonstrate how levels of contamination reduced over time, as in this chart prepared by the RoyalWolverhampton Hospitals NHS Trust.
11
%age spread of data over time
0.00%
5.00%
10.00%
15.00%
20.00%
25.00%
30.00%
35.00%
0-100 101-199
200-299
300-499
500-999
1000-1999
2000-2999
3000-4999
5000-9999
>10000
JunJulAugSepOct
The 3M™ Clean-Trace™ Clinical Hygiene Monitoring System can also be used for routine monitoring of areas where low levels of biocontamination are particularlyimportant or for contract monitoring – to check on whether levels of contamination measured immediately after cleaning are decreasing. There are, however, a number of important points to bear in mind.
A clear sampling plan will be needed which will enable sufficient data to be collected to provide a statistically valid result (trusts will need advice on thiscalculation) without being over burdensome. Each Showcase Hospital usedthe Clean-Trace Clinical ATP system intensively on four wards to gather a broad range of information about the product and were able in this way toproduce the information illustrated in this report which appears to demonstrate that use of the Clean-Trace Clinical ATP system could help them reduce levels of contamination. (Alternative reasons for the decrease, such as seasonal factors, cannot be ruled out but the consistency of the results is suggestive of use being made of the information.) However, it is also clear from this exercise that swabbing at different times in the cleaning cycle leads to wide variations in data readings due to the soiling that occursbetween cleaning. This is probably not, therefore, the best approach to adopt. Furthermore, this intensity of swabbing was difficult to achieve in some areas, particularly over weekends. Hospitals implementing thistechnology may wish to consider less intensive swabbing regimes centred on cleaning cycles in order to avoid similar problems. There is no clear pass/fail standard. It is very difficult to suggest what is an acceptable level of soil residue remaining on a surface after cleaning and relate this to the risks associated with the equipment. Because of this difficulty in setting external standards, it is best to set internal standards based on what can be practically achieved. Measurements taken following well-performed and appropriate cleaning can be used to set targets whichprovide a baseline as to what level of cleaning subsequent cleaning systems and programmes should achieve.[1]
RLU numbers should always be used, monitored on a regular basis, and acted on in preference to using the “traffic light” system, for the reasons setout earlier.
12
Before introducing the product, trusts should make a realistic plan to allow for sufficient training of staff and raise awareness of the new technology and the reasons for its introduction. Trusts should make use of resources offered by the company representatives, including posters, ward visits and stands in staff areas. The implementation plan should
o set out what using the product is expected to achieve o cover the areas where swabbing will be introduced o specify in detail what points will be swabbed, how frequently and by
whom.Before introducing the product, trusts should be clear what action is to be taken in the light of results indicating a high level of contamination.When the product is introduced, Trusts should ensure that there is a plan tocover how results will be reported back to relevant staff and how performance will be monitored over time – for example using charts displayed in staff areas. The showcase project showed that a healthy spirit ofcompetition among staff helped maintain hygiene awareness. There should also be plans to involve the multi-disciplinary team in reviewing the success of product implementation to inform decisions regarding its continued useand possible extension into a wider range of ward areas. Such an auditshould involve some analysis of the hygiene results achieved and also a consideration of the opinions of key staff members. Arrangements will need to be made for refrigerated storage of the swabs and their distribution to those carrying out the swabbing.It should also always be remembered that (as with any other measure of cleanliness) the 3M™ Clean-Trace™ Clinical Hygiene Monitoring Systemcan only measure contamination on surfaces which are swabbed, and that results are only valid for the point in time at which they were taken.
While the showcase project found staff and patients broadly welcomed the introduction of the Clean-Trace Clinical ATP system, buy-in from key staff is crucial for successful introduction of new technologies and a multi-disciplinary approach isencouraged. Relevant ‘stakeholders’ should be identified at the outset and keptinformed throughout the process.
Costs and Benefits Patients expect hospitals to be clean, and that visible efforts to achieve and monitorcleanliness are reassuring for patients.
Maintaining appropriate standards of cleanliness is a requirement under the Health and Social Care Act 2008 (Registration of Regulated Activities) Regulations 2009[ ]6 ,and the provision of a clean environment is one of the criteria set out in the Code ofPractice for the prevention and control of healthcare associated infections[ ]7 againstwhich the Care Quality Commission will judge compliance with the statutoryrequirements. The guidance in the Code refers to cleaning arrangements which detail the standards of cleanliness required.
The Clean-Trace Clinical ATP system provides one way of helping detail standardsof cleanliness, through the setting of local standards for ATP-measured
13
contamination, based on effective and appropriate cleaning regimes, as discussed above.
The Royal College of Nursing and the Infection Prevention Society have called for “an easy to use tool that nurses can use to measure environmental cleanliness”8.The 3M™ Clean-Trace™ Clinical Hygiene Monitoring System is not a complete answer to that call, because it can only measure biocontamination at particularpoints in time on swabbed surfaces, but it does provide calibrated measurements which, if used as part of a systematic sampling programme, enables levels of ATP-measured contamination to be compared.
There are three ways in which the Clean-Trace Clinical ATP system can be purchased
1) Direct purchase from the manufacturer
2) Reagent Rental agreement with the manufacturer – in this case a contract is agreed with the manufacturer to supply luminometers on a rental basis. The rentalfee is covered by a small premium on the price of each swab, and includes service and calibration throughout the duration of the contract. Pricing is based on a numberof variables such as the number of luminometers required, number of swabsrequired per month and length of contract.
3) Purchase through NHS Supply Chain. Current (June 2009) prices from the NHS Supply Chain catalogue are Luminometer £2058 Luminometer docking station £109100 Clean-Trace™ swabs £153
Calculating the number of swabs required should be a straightforward part of planning for implementation of the Clean-Trace Clinical ATP system. Working outhow many luminometers will be needed is less straightforward. Clearly, this will depend on the number of sites, the size of the hospital(s) and the purposes for whichthe Clean-Trace Clinical ATP system is to be used. The experience of thisevaluation suggests that the system is likely to be most effective if instant feedbackis provided. This suggests that luminometers should be readily available to those undertaking the swabbing.
Having calculated costs, trusts will need to consider whether any savings are likelyto be achieved through the use of the Clean-Trace Clinical ATP system. In the absence of any data linking a reduction in HCAI prevalence to an improvement in environmental hygiene, it is difficult to develop a quantitative business case. Better training and better monitoring is likely to lead to improved standards of cleaning and more effective use of the time of cleaning staff.
14
Annex – Graphs showing average readings for each swab site
Swab sites for a non-ITU Ward
I. The centre of a patient over-bed table II. Top surface of arrest trolley
III. The door handle (corridor side) to a side room IV. The door handle (bedroom side) to a side room (same room as III above) V. The sink handle/tap of a wash hand basin
VI. An area of floor under a patient bed in line with a central point of the bed VII. A commode seat (bottom front)
VIII. The top rail of a cot side/bed rail (where there is one)IX. The flush handle on a patient toilet X. The top surface of a bedside cabinet
XI. The area immediately adjacent to the keyboard at a nurses stationXII. The space between the keys on a bedside communication unit keyboard
XIII. The floor in a patient bathroom immediately in front of the sinkXIV. The upper side of a toilet seat in a patient toilet XV. The “start” button on the microwave in the ward kitchen
XVI. The underside of the handle on the ward kitchen fridge XVII. The handle on the cover to the ward drugs trolley
XVIII. The external door plate on the main doors to the wardXIX. The internal door plate on the main doors to the wardXX. On/off switch of Infusion pump
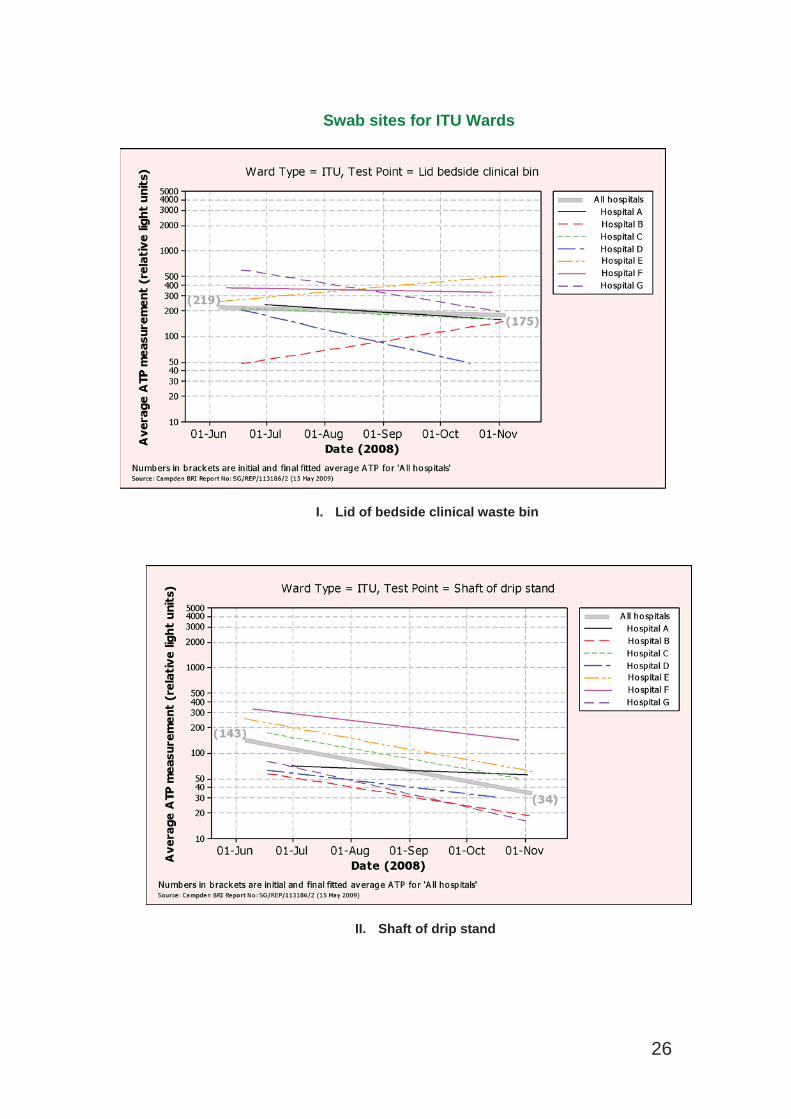
Swab sites for ITU Wards
I. Lid of bedside clinical waste bin II. Shaft of drip stand
III. On/Off Switch on feed pumpIV. Alarm mute button on ventilator consoleV. Top surface of nursing chart table
VI. On/Off Switch on syringe driver VII. On/Off Switch on suction machine/pump
VIII. Top surface of drug preparation areaIX. Top surface of bedside monitor screen X. Top surface of cardiac arrest trolley
XI. The handle/tap of wash hand basin XII. An area of floor under patient bed
XIII. The top rail of a cot side/bed rail (where there is one)XIV. Top surface of a bed area work-top / equipment trolley XV. The area immediately adjacent to keyboard at nurses station
XVI. The under/reverse side of department drug fridge door handle XVII. The external door plate on department main doors or staff room door plate if
department has automatic doors XVIII. The internal door plate on department main doors or internal door plate of a side room
if department has automatic doors XIX. On/off switch of infusion pump XX. Handle of storage cupboard
15
Swab sites for a non-ITU Ward
I. The centre of a patient over-bed table
II. Top surface of arrest trolley
16
III. The door handle (corridor side) to a side room
IV. The door handle (bedroom side) to a side room
17
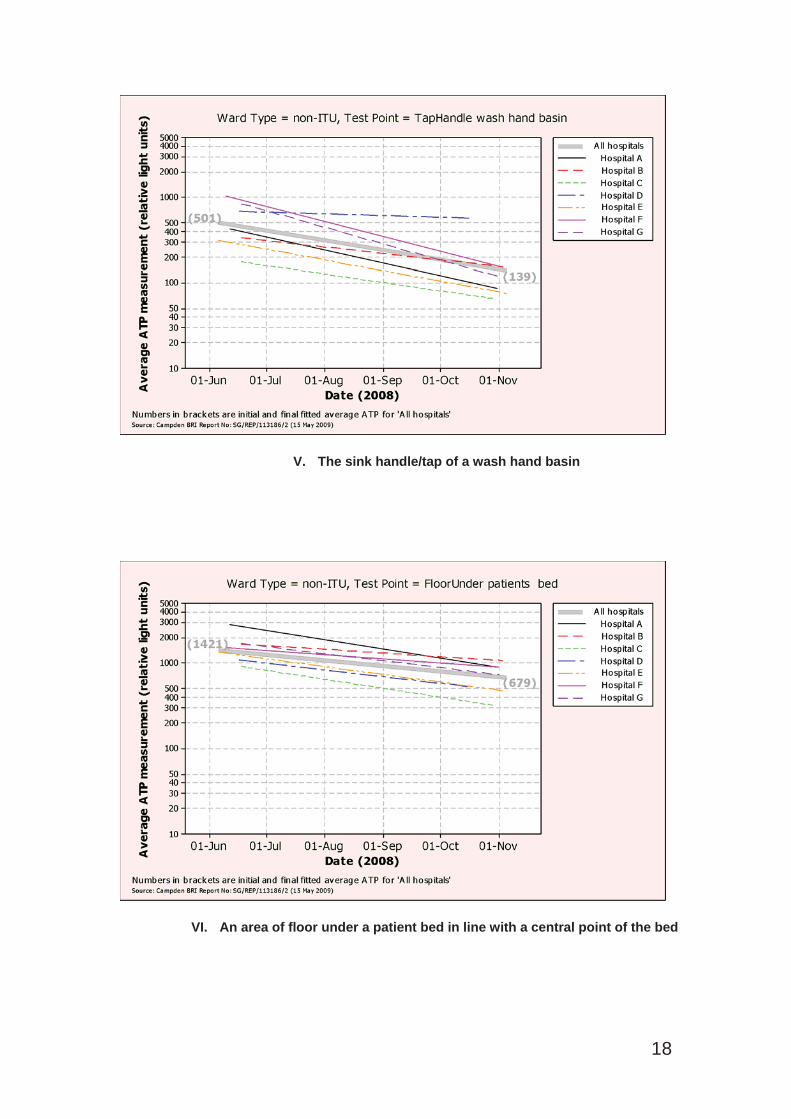
V. The sink handle/tap of a wash hand basin
VI. An area of floor under a patient bed in line with a central point of the bed
18
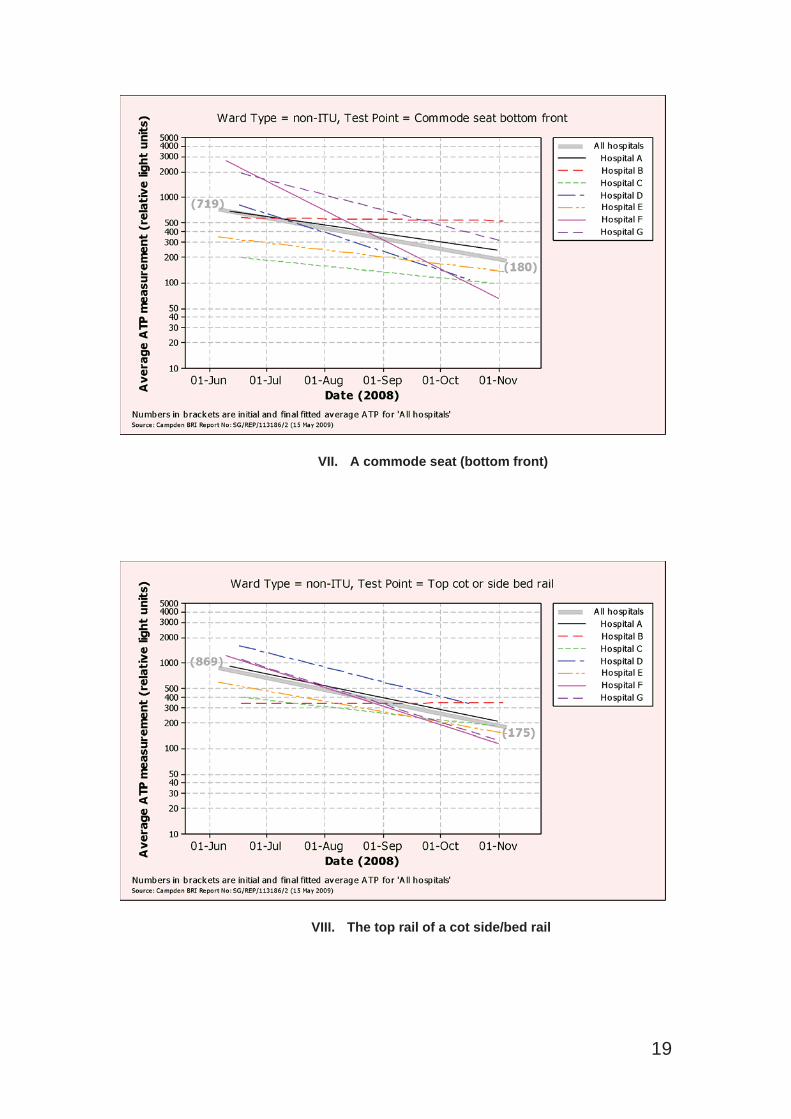
VII. A commode seat (bottom front)
VIII. The top rail of a cot side/bed rail
19
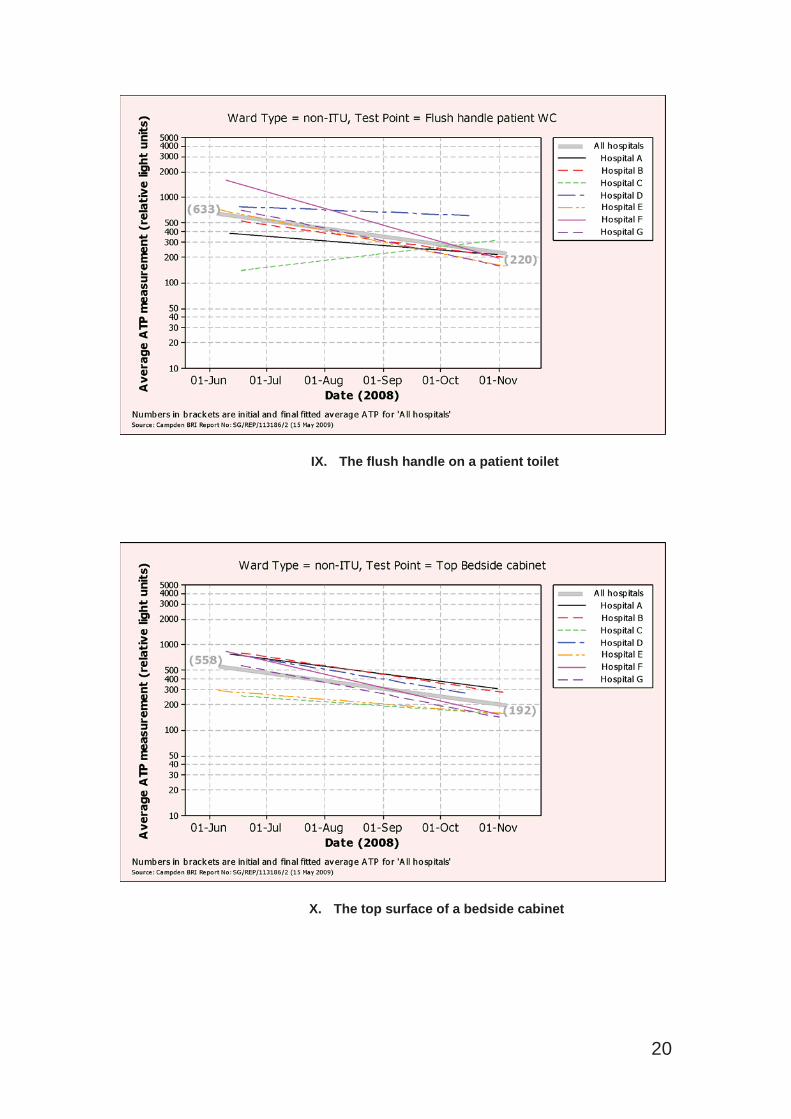
IX. The flush handle on a patient toilet
X. The top surface of a bedside cabinet
20
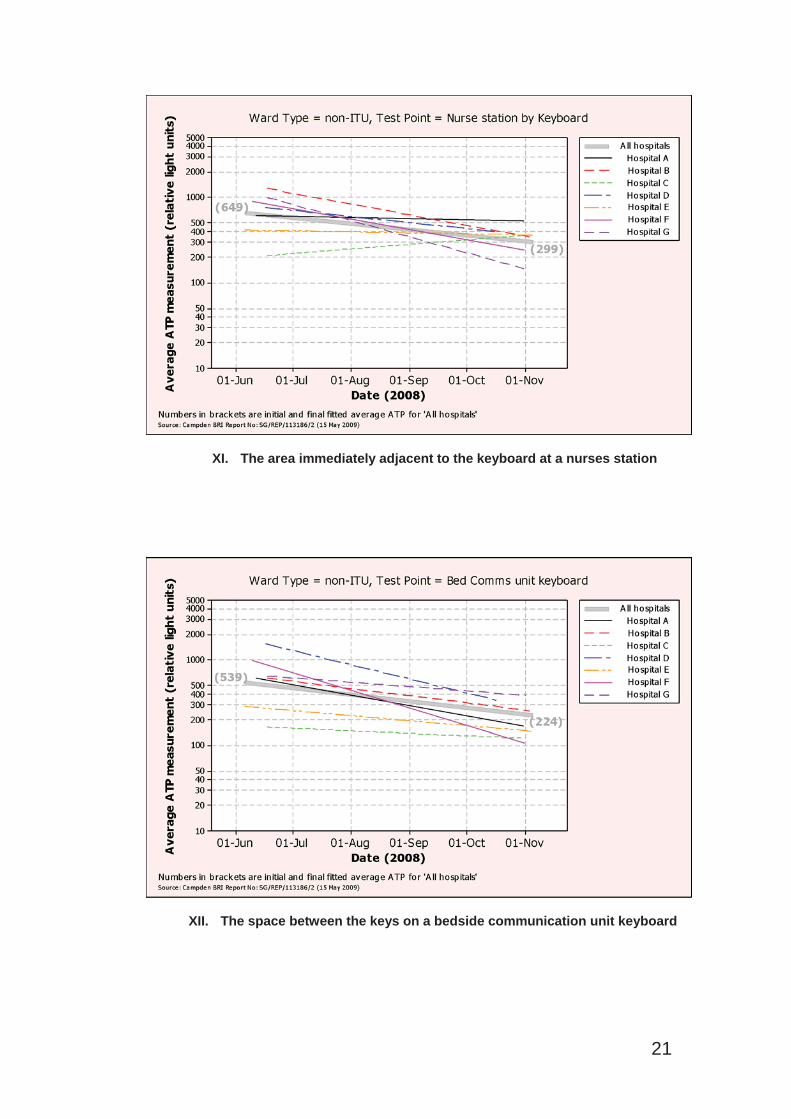
XI. The area immediately adjacent to the keyboard at a nurses station
XII. The space between the keys on a bedside communication unit keyboard
21
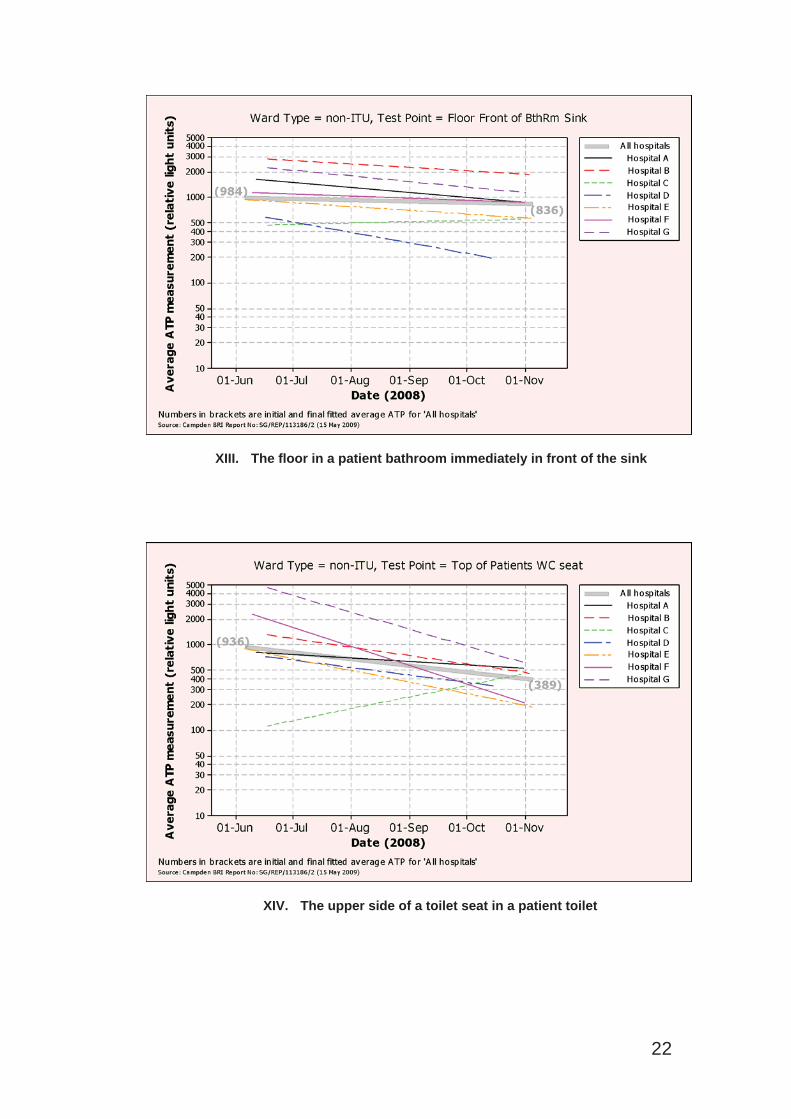
XIII. The floor in a patient bathroom immediately in front of the sink
XIV. The upper side of a toilet seat in a patient toilet
22
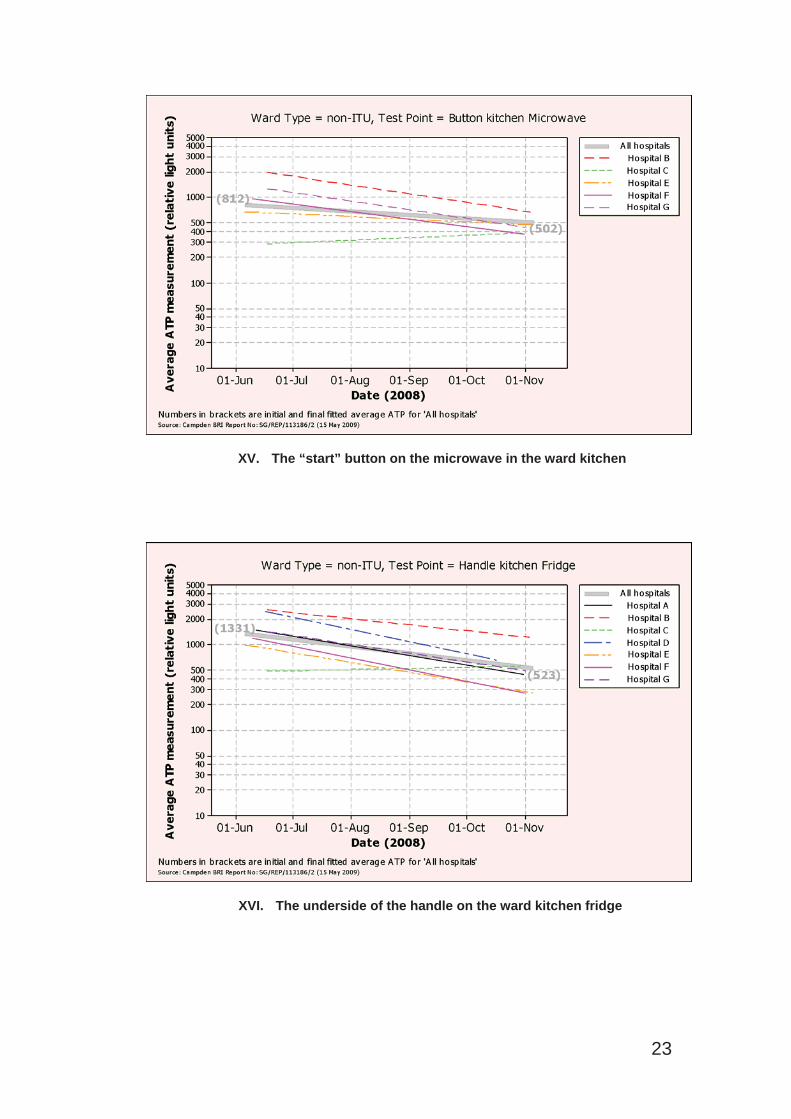
XV. The “start” button on the microwave in the ward kitchen
XVI. The underside of the handle on the ward kitchen fridge
23
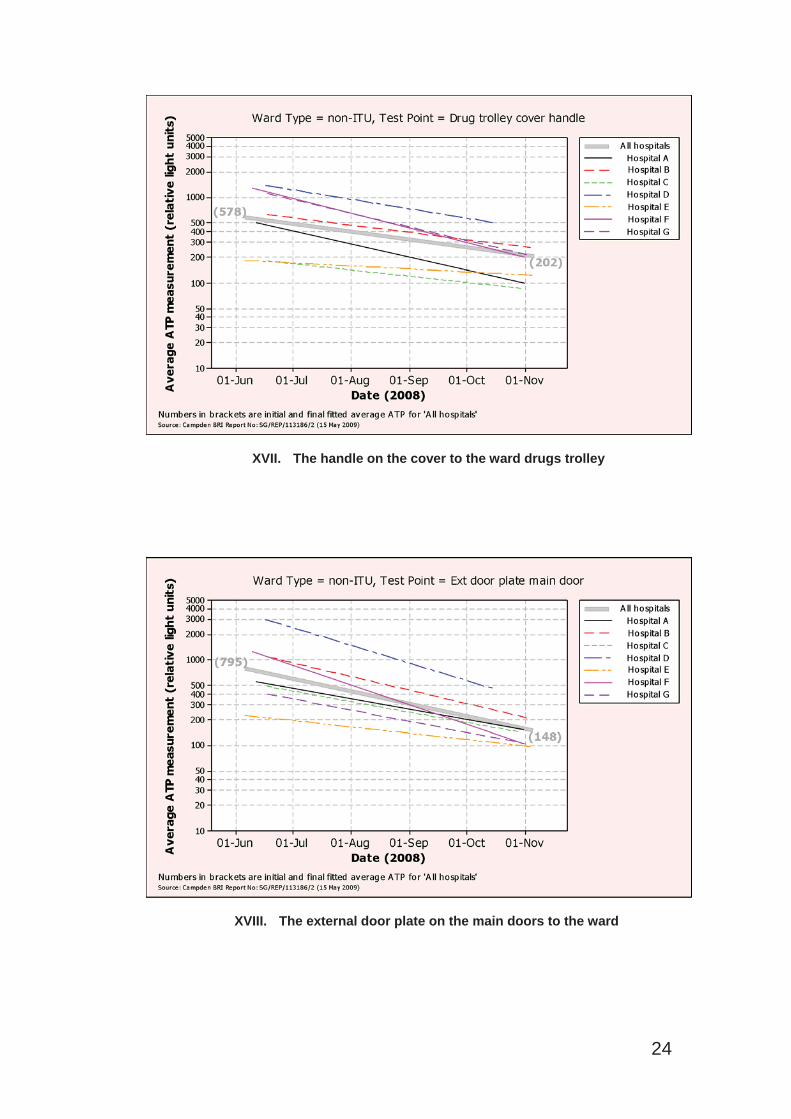
XVII. The handle on the cover to the ward drugs trolley
XVIII. The external door plate on the main doors to the ward
24
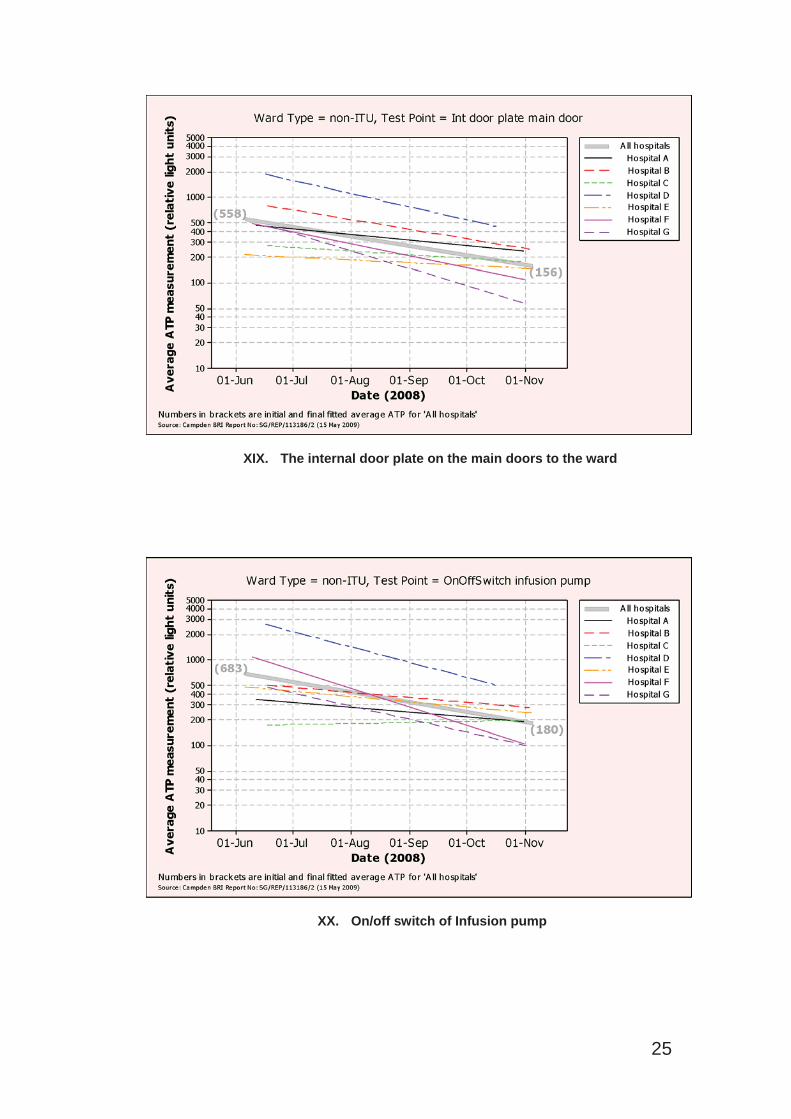
XIX. The internal door plate on the main doors to the ward
XX. On/off switch of Infusion pump
25
Swab sites for ITU Wards
I. Lid of bedside clinical waste bin
II. Shaft of drip stand
26
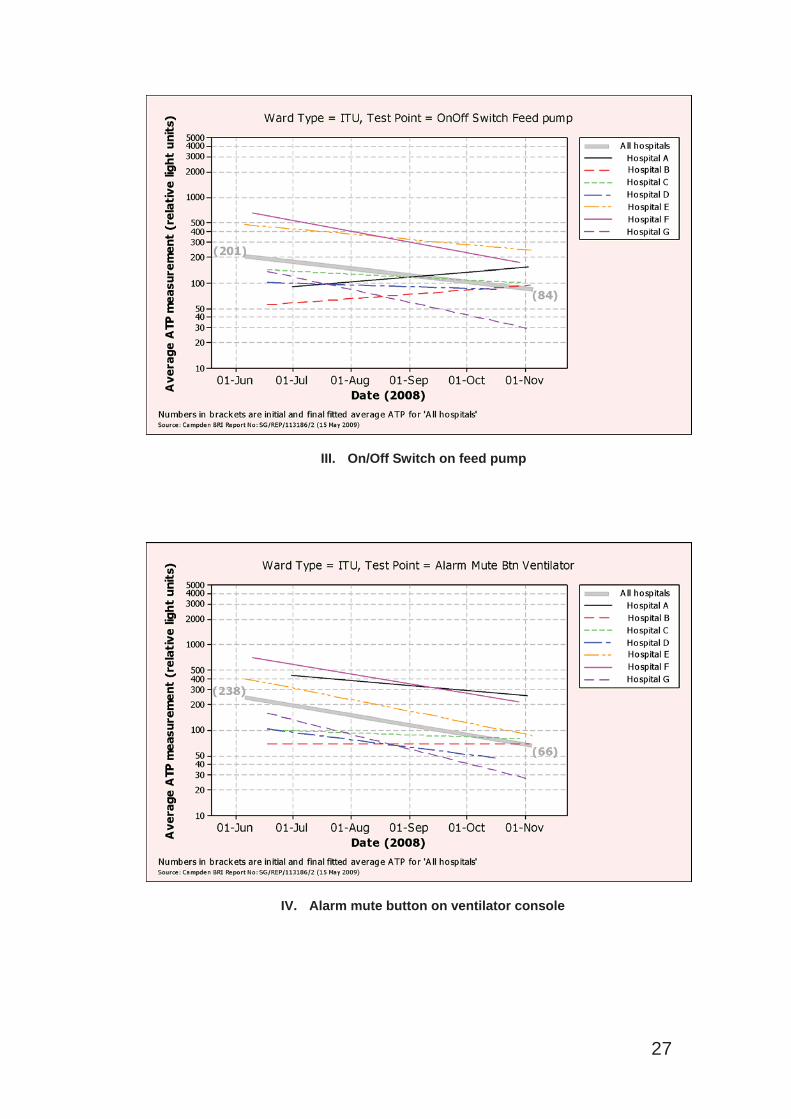
III. On/Off Switch on feed pump
IV. Alarm mute button on ventilator console
27
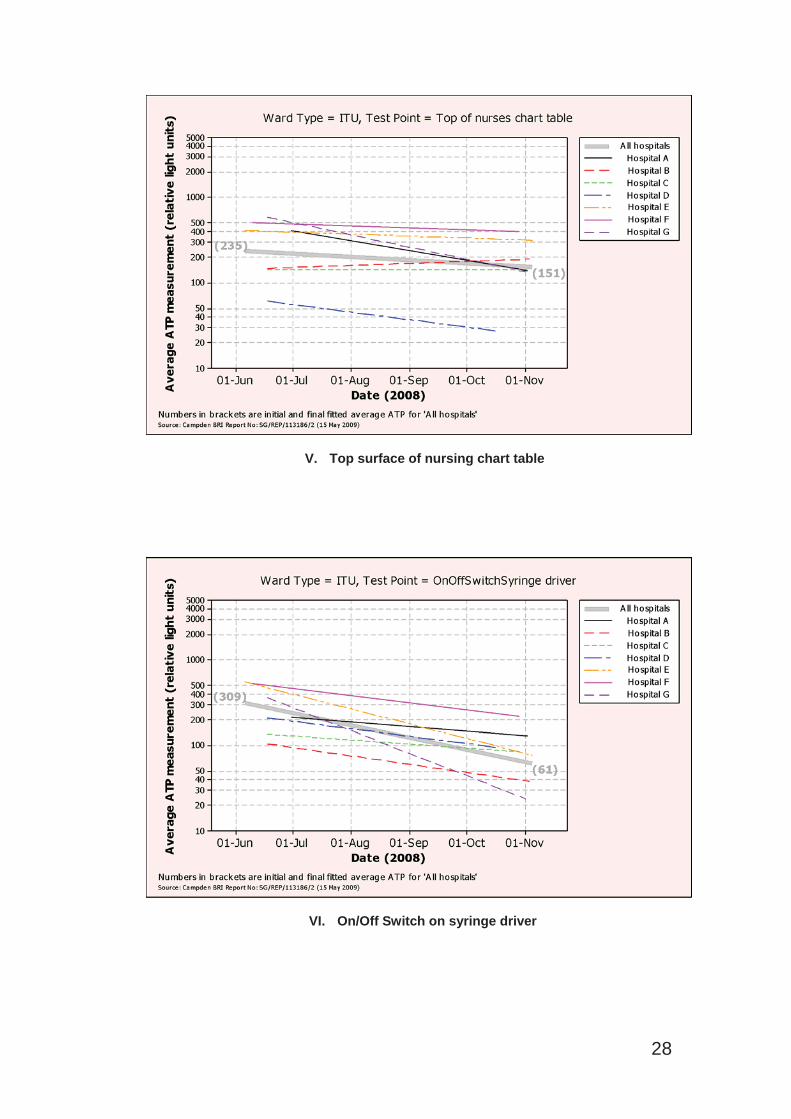
V. Top surface of nursing chart table
VI. On/Off Switch on syringe driver
28
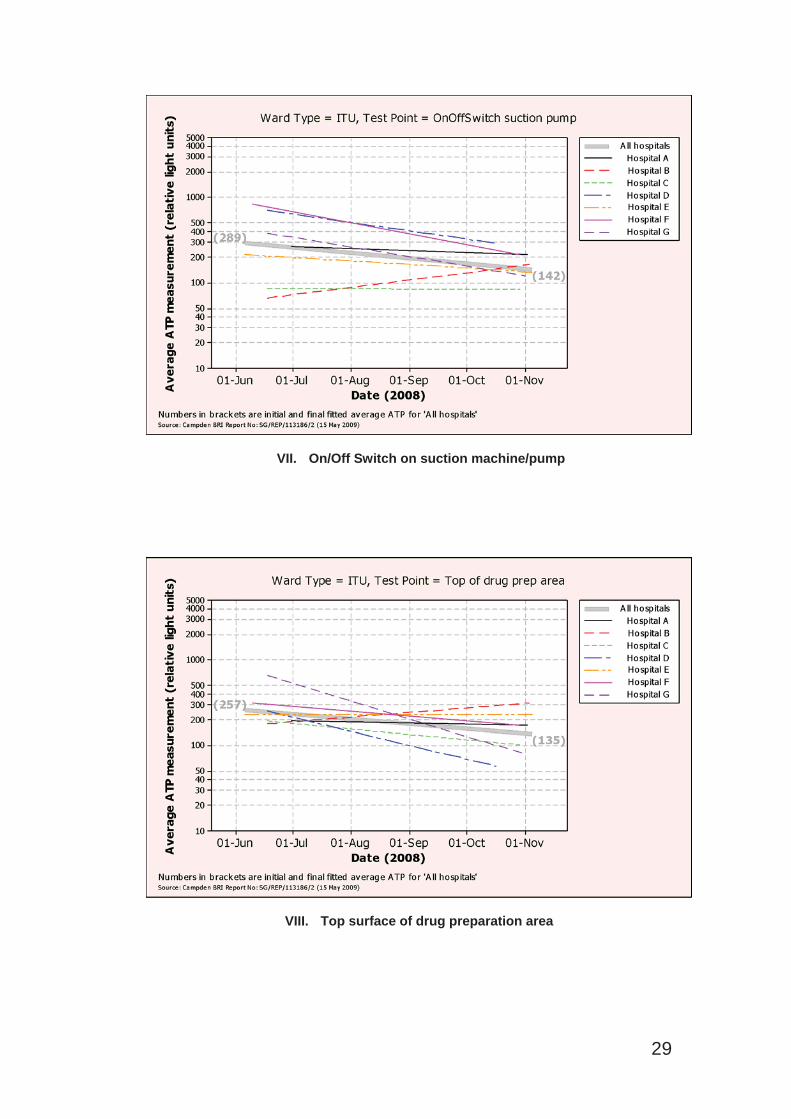
VII. On/Off Switch on suction machine/pump
VIII. Top surface of drug preparation area
29
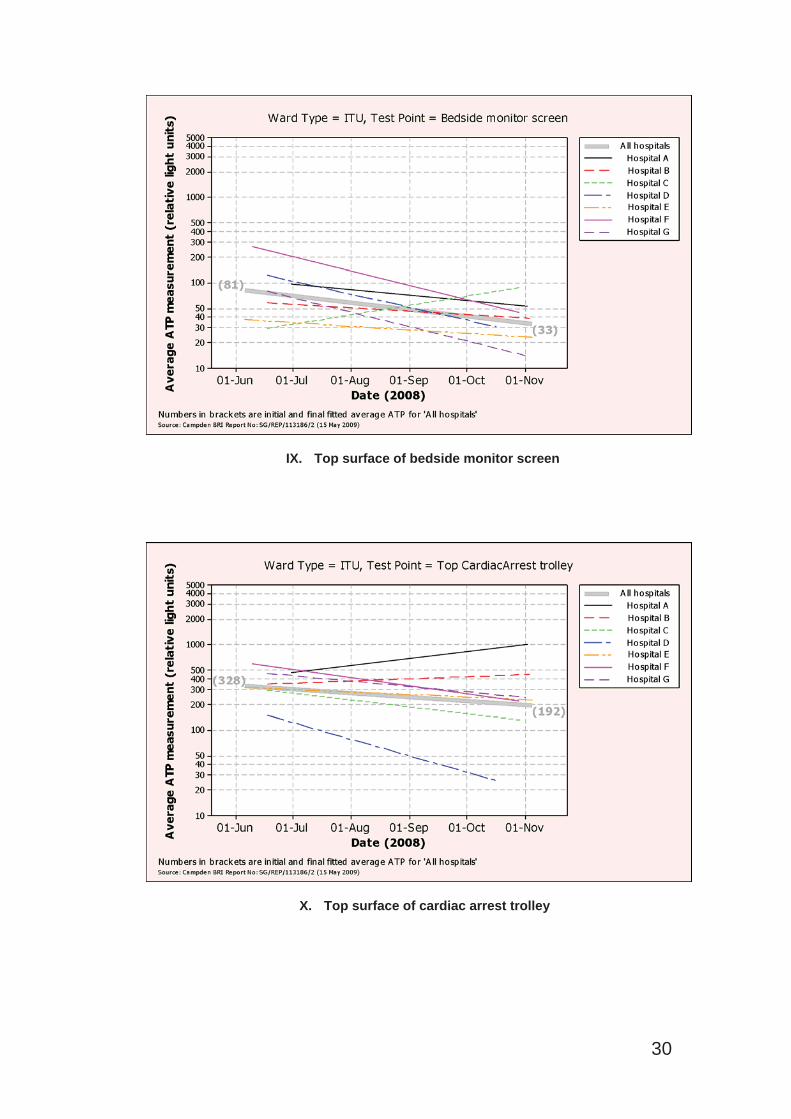
IX. Top surface of bedside monitor screen
X. Top surface of cardiac arrest trolley
30
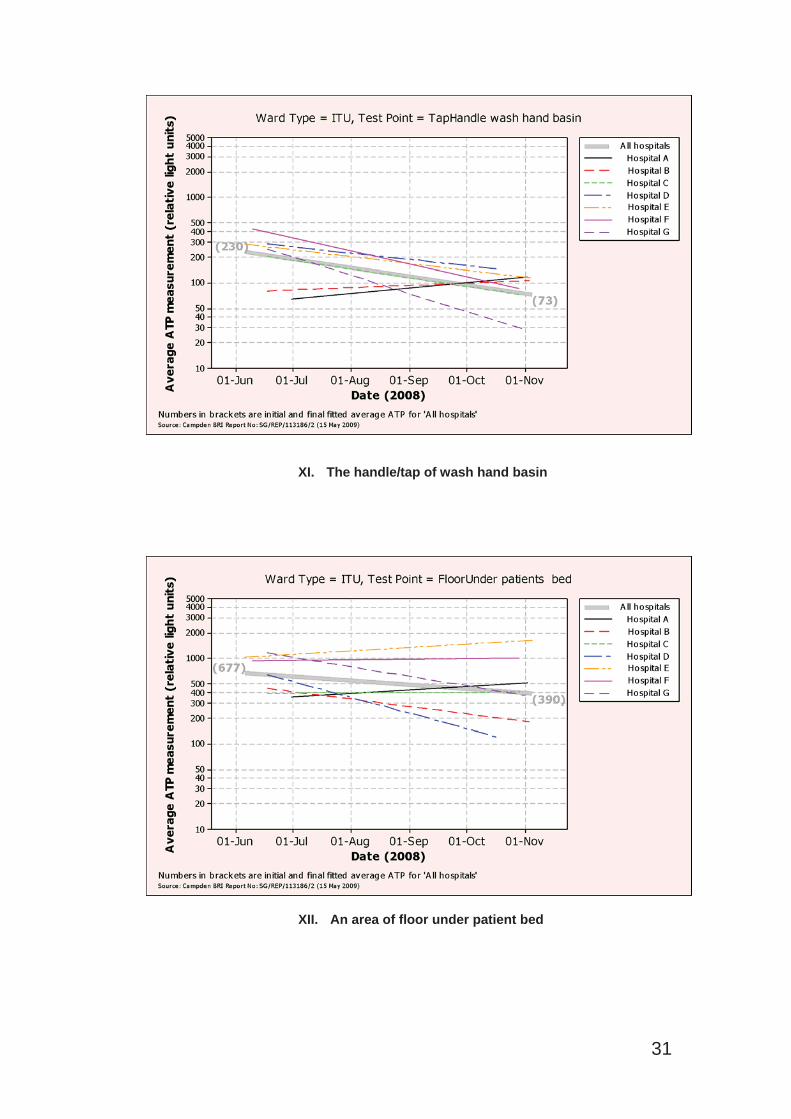
XI. The handle/tap of wash hand basin
XII. An area of floor under patient bed
31
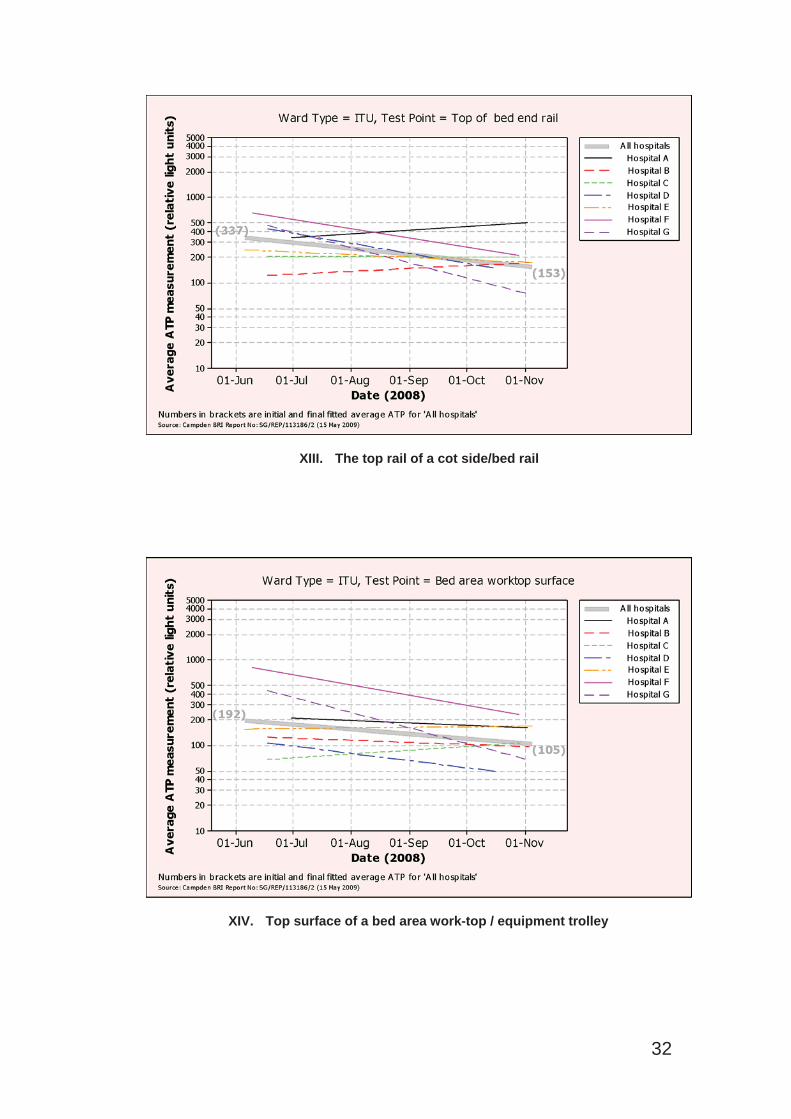
XIII. The top rail of a cot side/bed rail
XIV. Top surface of a bed area work-top / equipment trolley
32
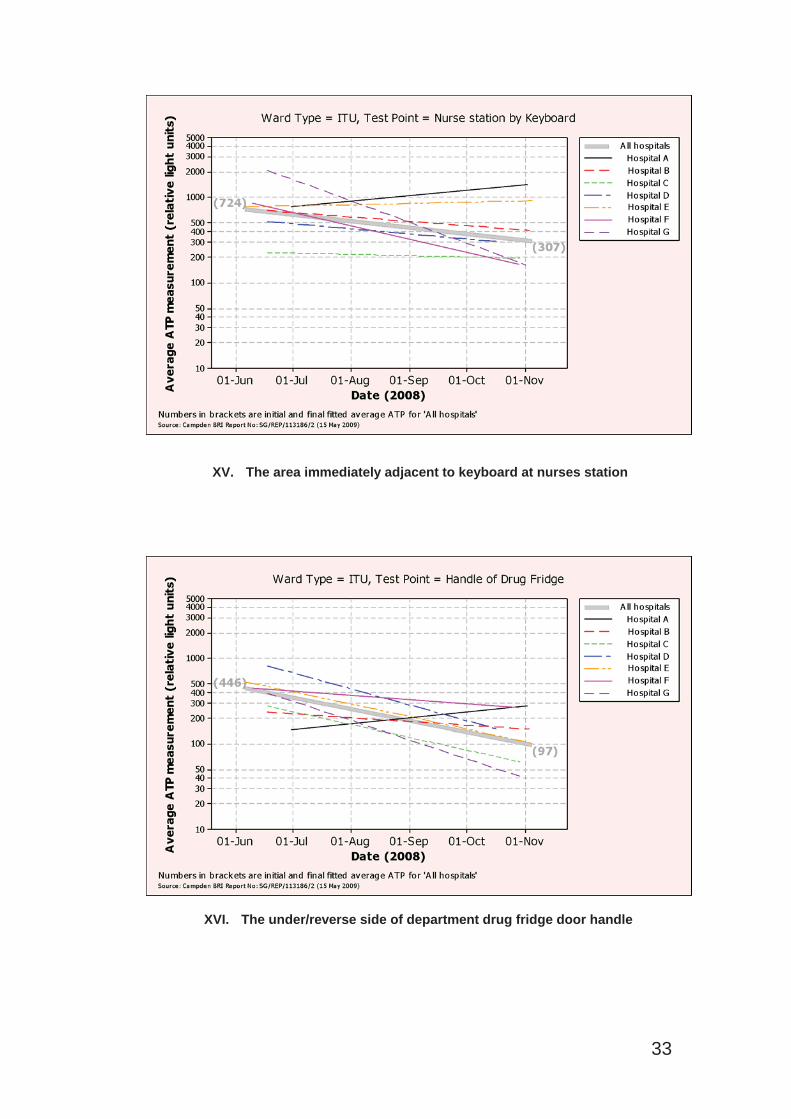
XV. The area immediately adjacent to keyboard at nurses station
XVI. The under/reverse side of department drug fridge door handle
33
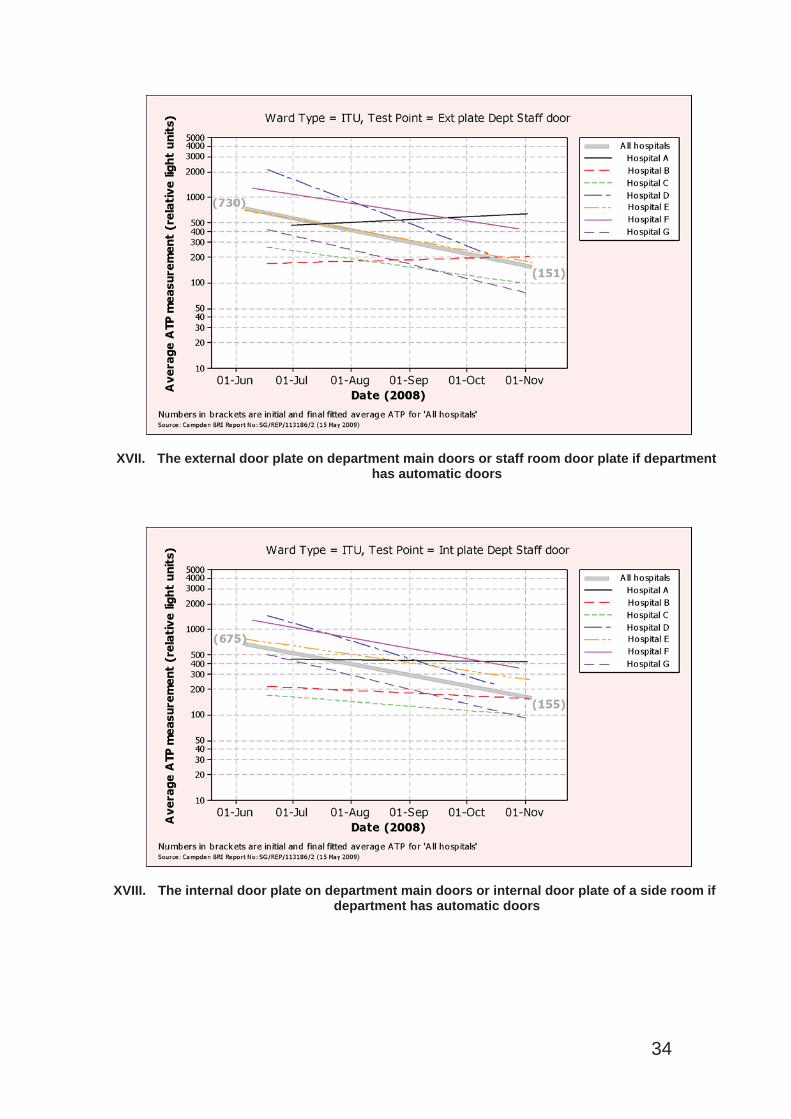
XVII. The external door plate on department main doors or staff room door plate if departmenthas automatic doors
XVIII. The internal door plate on department main doors or internal door plate of a side room if department has automatic doors
34
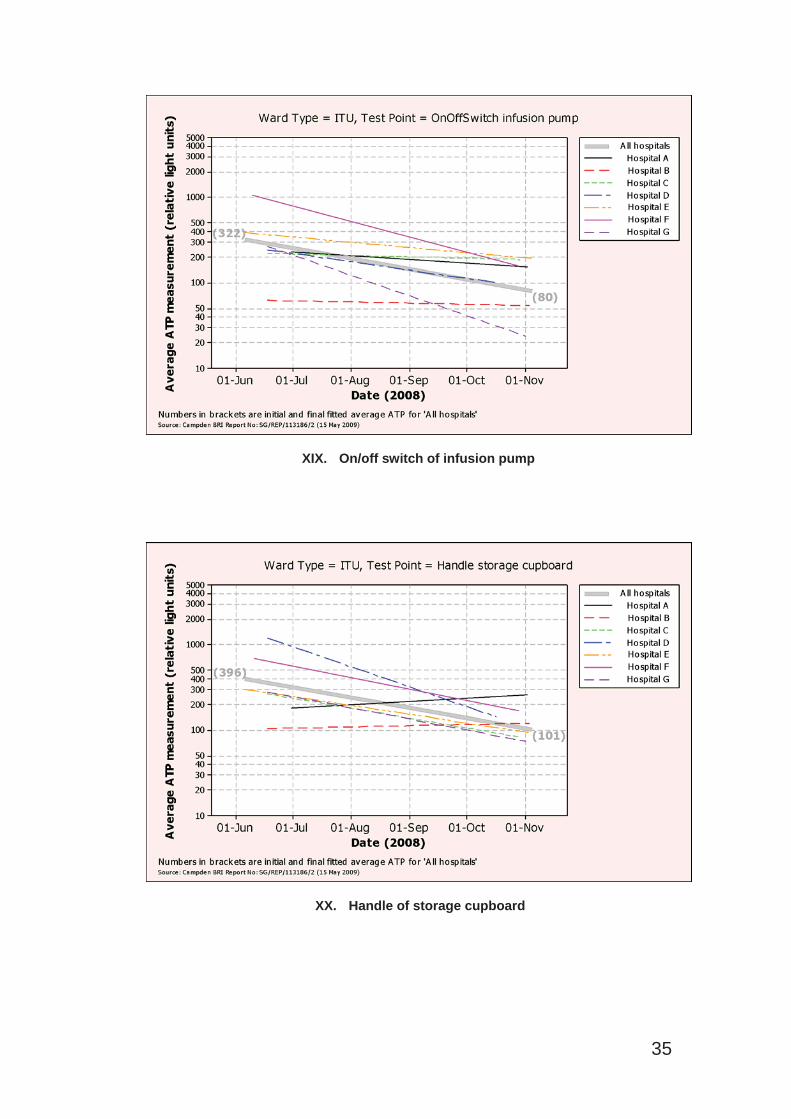
XIX. On/off switch of infusion pump
XX. Handle of storage cupboard
35
References
1. Middleton K.E. and Holah J.T. Guideline No 55 Cleaning and Disinfection of food factories: a practical guide. Campden and Chorely Wood Food Research Association Group; 2008.
2. Colquhoun KO, Timms S, Fricker CR. A simple method for the comparison of commercially available ATP hygiene-monitoring systems. Journal of Food Protection. 1998; 61(4): 499-501.
3. Carrick K, Barney M, Navarro A et al. The comparison of four bioluminometers and their swab kits for instant hygiene monitoring and detection of microorganisms in the brewery. Journal of the Institute of Brewing. 2001; 107(1): 31-37.
4. Report 120906 Protocol for assessing the sensitivity of hygiene test systems for live microorganisms and food residues. Simpson WJ, Archibald JL, Giles CJ. Cara Technology Limited; 2006.
5. Willis C, Morley R, Westbury J et al. Evaluation of ATP bioluminescenceswabbing as a monitoring and training tool for effective hospital cleaning.British Journal of Infection Control. 2007; Vol. 8, No. 5: 17-21.
6. The Health and Social Care Act 2008 (Registration of Regulated Activities)Regulations. S.I. 2009/660
7. The Health and Social Care Act 2008: Code of Practice for the NHS on the prevention and control of Healthcare associated infections and related guidance. Department of Health 2009.
8. Infection prevention and control – Minimum standards. Royal College of Nursing. January 2009
36


