52
Evaluation
Evaluation
Why Evaluate?
• In HCI we evaluate interfaces and systems to:– Determine how usable they are for different
user groups– Identify good and bad features to inform
future design – Compare design choices to assist us in
making decisions– Observe the effects of specific interfaces on
users
Why now?
Evaluation is key component of HCI Evaluation is a process, not an event Design ideas from evaluation of existing
technologies Making things better starts by evaluation
Evaluation Methods
• Inspection methods (no users needed!)– Heuristic evaluations– Walkthroughs– Other Inspections
• User Tests (users needed!)– Observations/Ethnography– Usability tests/ Controlled Experiments

Heuristic Evaluation
• Heuristic evaluation (what is it?)– Method for finding usability problems– Popularised by Jakob Nielsen
• “Discount” usability engineering– Use with working interface or scenario– Convenient– Fast– Easy to use
Heuristic Evaluation
• Systematic inspection to see if interface complies to guidelines
• Method– 3-5 inspectors– usability engineers, end users, double experts…– inspect interface in isolation (~1–2 hours for simple
interfaces)• compare notes afterwards
– single evaluator only catches ~35% of usability problems, 5 evaluators catch 75%
• Works for paper, prototypes, and working systems
Points of Variation
• Evaluators• Heuristics used• Method employed during inspection
Evaluators
• These people can be novices or experts– “novice evaluators”– “regular specialists”– “double specialists” (- Nielsen)
• Each evaluator finds different problems• The best evaluators find both hard and easy
problems
Heuristics
• Heuristics are rules that are used to inform the inspection…
• There are many heuristic sets
Nielsen's Heuristics
Visibility of system status Match between system & real world User control and freedom Consistency & standards Error prevention Recognition rather than recall Flexibility & efficiency of use Minimalist design Help error recovery Help & documentation
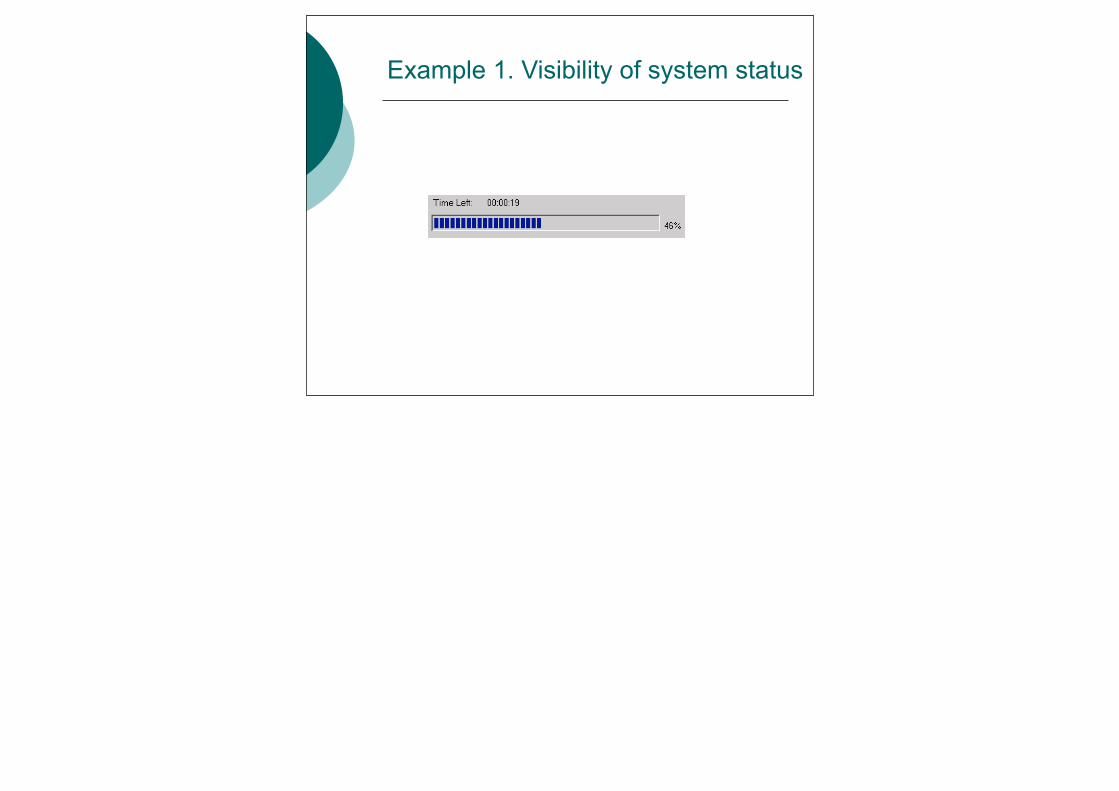
Example 1. Visibility of system status

What is “reasonable time”?
0.1 sec: Feels immediate to the user. No additional feedback needed.
1.0 sec: Tolerable, but doesn’t feel immediate. Some feedback needed.
10 sec: Maximum duration for keeping user’s focus on the action.
For longer delays, use % done progress bars.
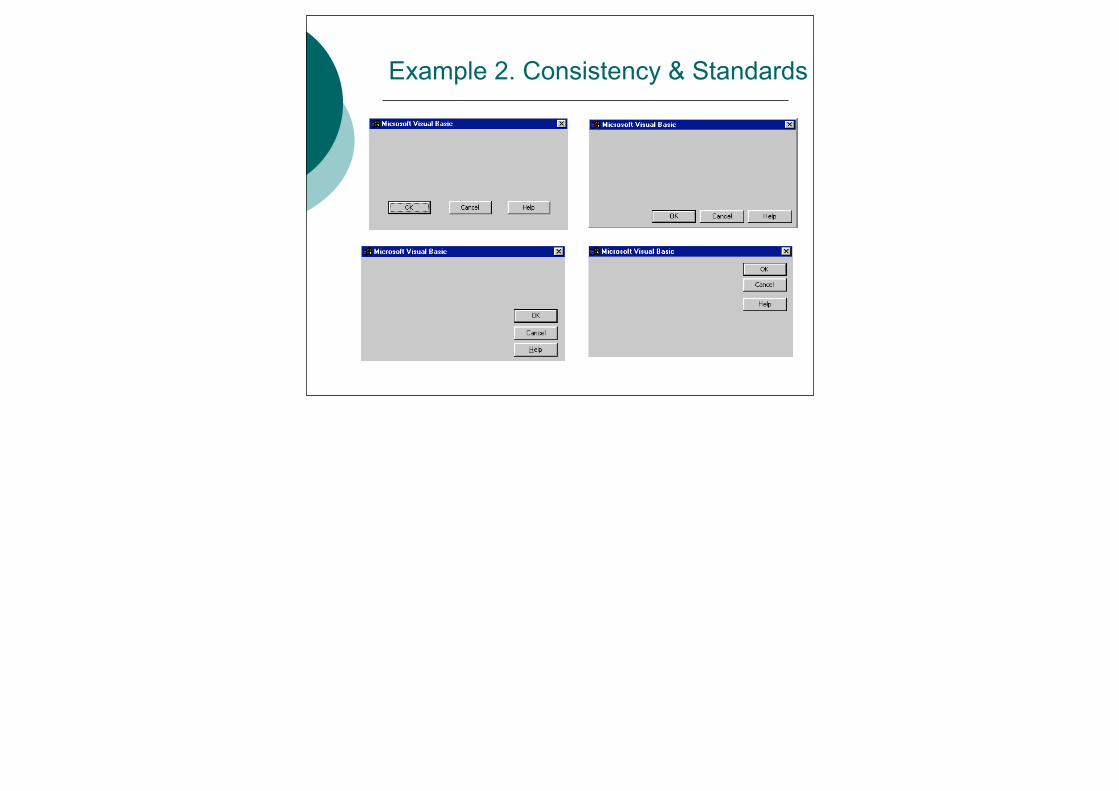
Example 2. Consistency & Standards
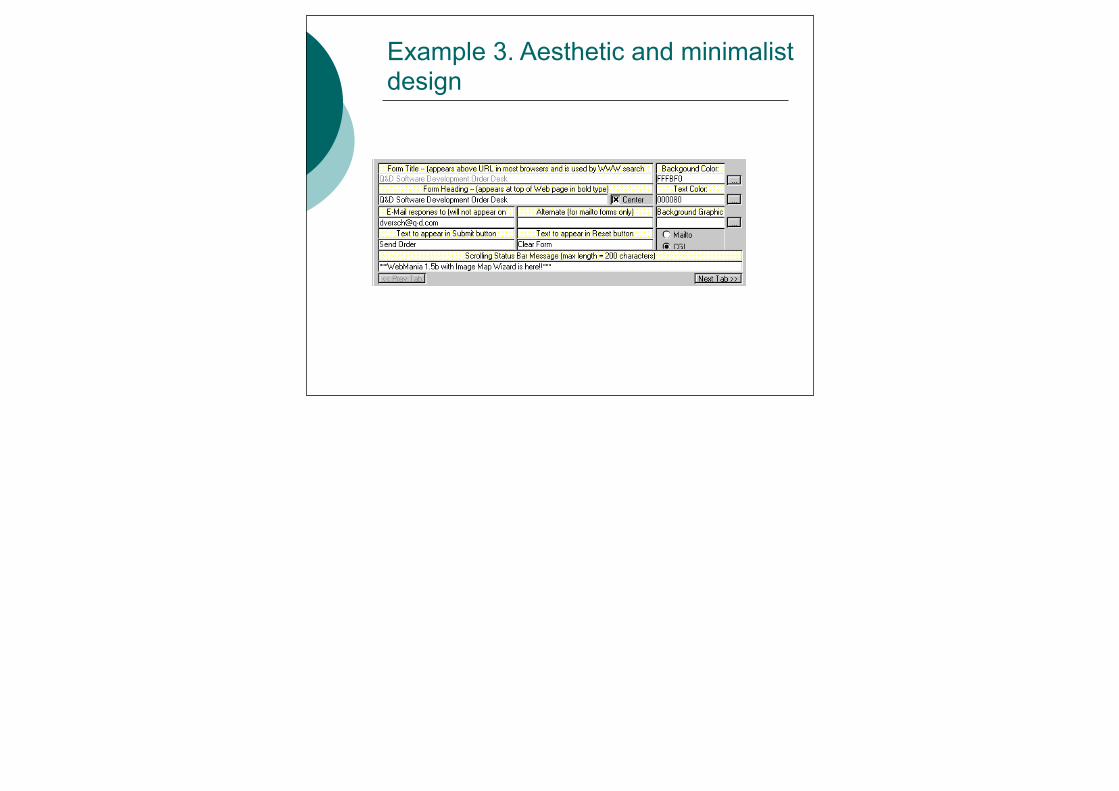
Example 3. Aesthetic and minimalist design

Phases of a heuristic evaluation
1. Pre-evaluation training – give evaluators needed domain knowledge and information on the scenario
2. Evaluate interface independently 3. Rate each problem for severity 4. Aggregate results 5. Debrief: Report the results to the interface
designers
Severity ratings
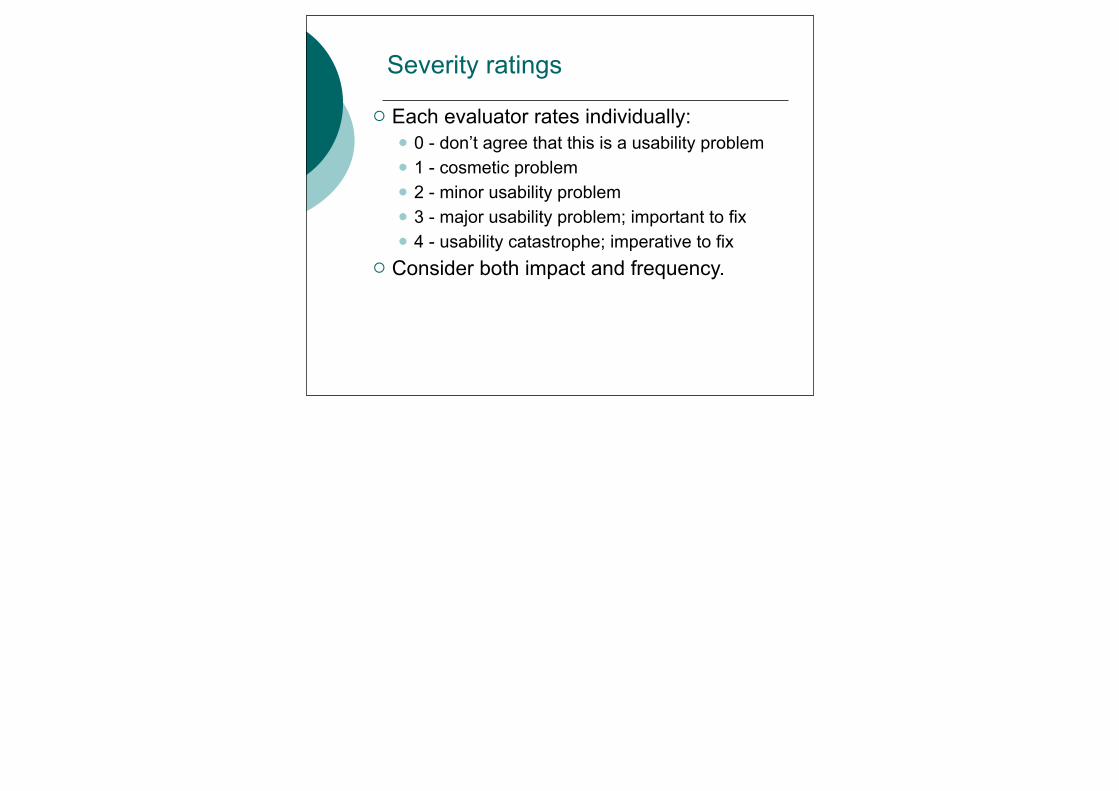
Each evaluator rates individually: 0 - don’t agree that this is a usability problem 1 - cosmetic problem 2 - minor usability problem 3 - major usability problem; important to fix 4 - usability catastrophe; imperative to fix
Consider both impact and frequency.

Styles of Heuristic evaluation
Problems found by a single inspector Problems found by multiple inspectors Individuals vs. teams Goal or task? Structured or free exploration?

Problems found by a single inspector Average over six case studies
35% of all usability problems; 42% of the major problems 32% of the minor problems
Not great, but finding some problems with one evaluator is much better than finding no problems with no evaluators!
Problems found by a single inspector
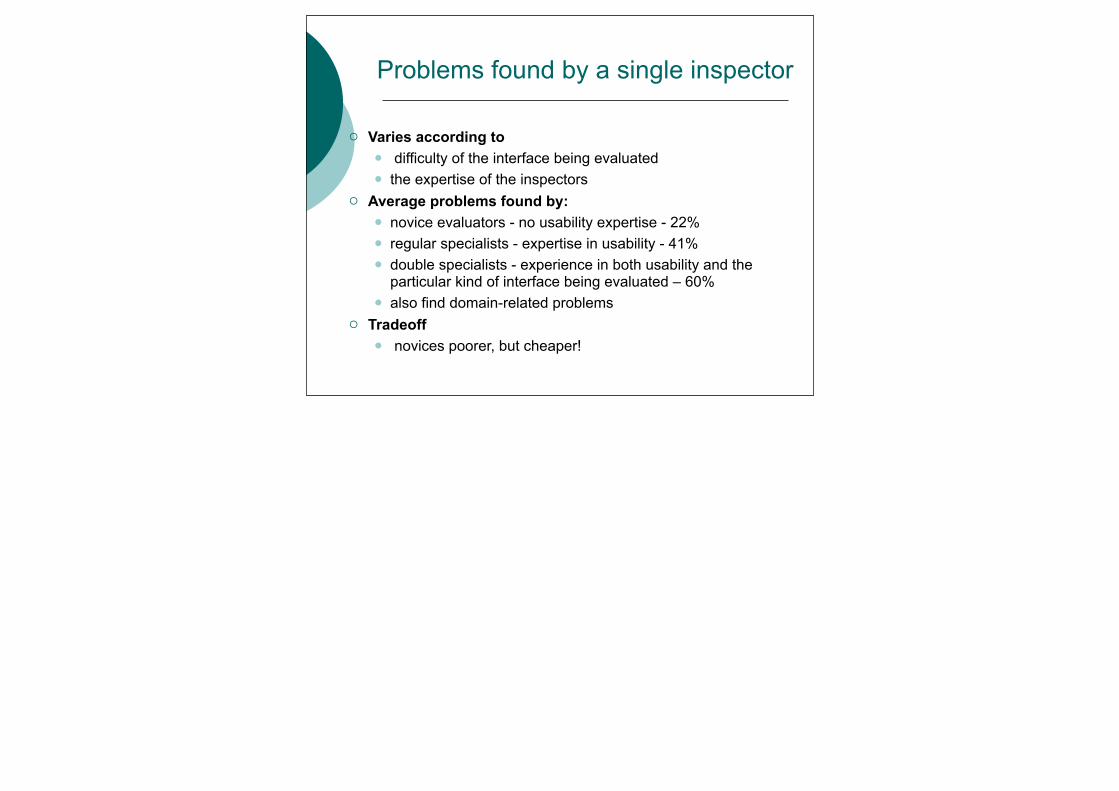
Varies according to difficulty of the interface being evaluated the expertise of the inspectors
Average problems found by: novice evaluators - no usability expertise - 22% regular specialists - expertise in usability - 41% double specialists - experience in both usability and the
particular kind of interface being evaluated – 60% also find domain-related problems
Tradeoff novices poorer, but cheaper!
Problems found by multiple evaluators
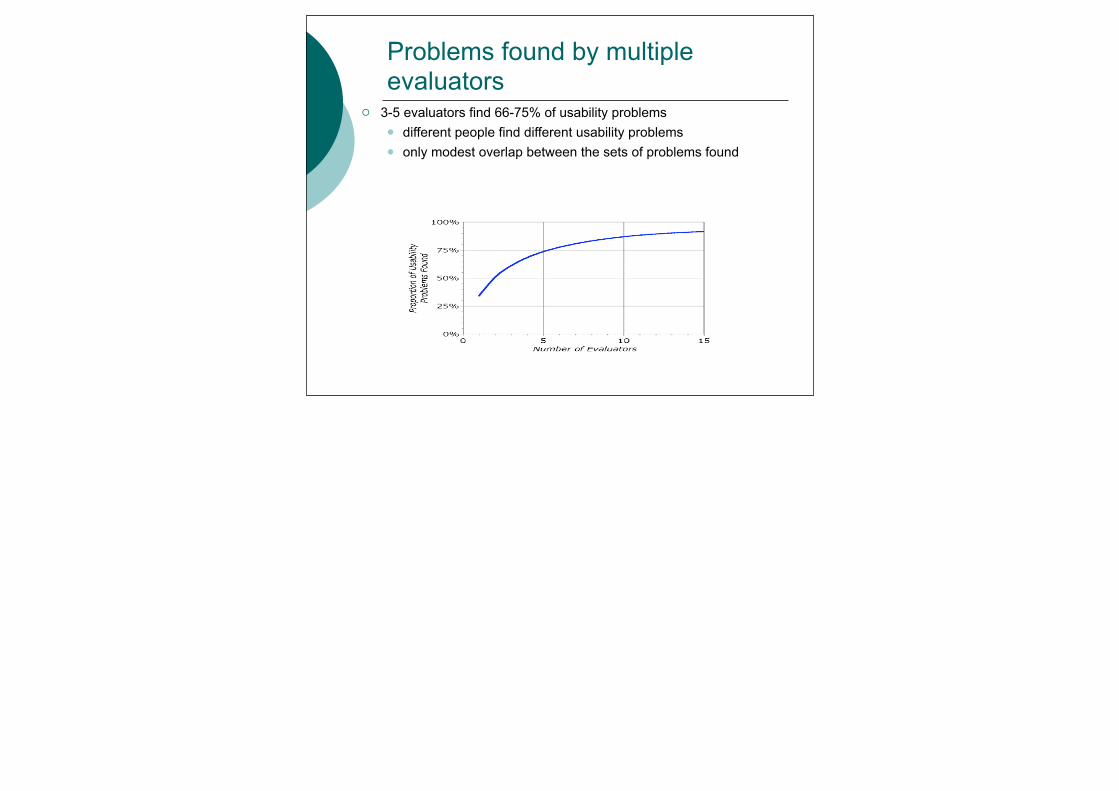
3-5 evaluators find 66-75% of usability problems different people find different usability problems only modest overlap between the sets of problems found

Individuals vs. teams
Nielsen recommends individual evaluators inspect the
interface alone Why?
evaluation is not influenced by others independent and unbiased greater variability in the kinds of errors found no overhead required to organize group meetings
Self Guided vs. Scenario Exploration
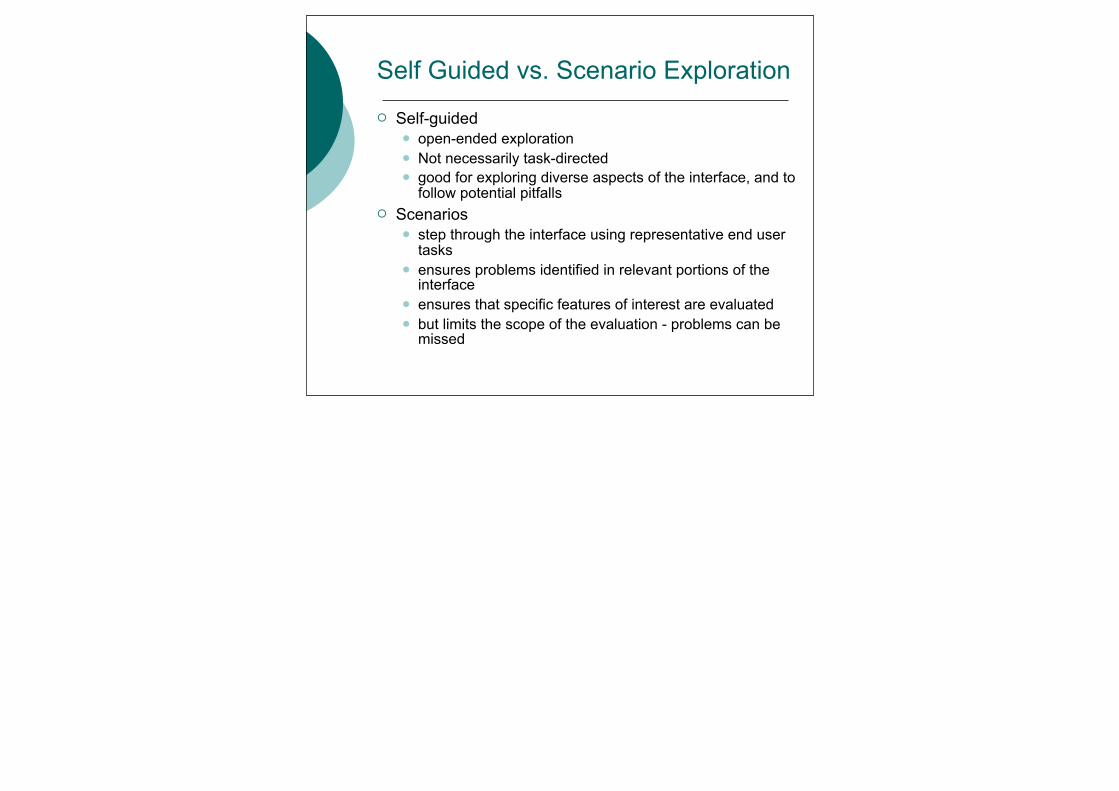
Self-guided open-ended exploration Not necessarily task-directed good for exploring diverse aspects of the interface, and to
follow potential pitfalls Scenarios
step through the interface using representative end user tasks
ensures problems identified in relevant portions of the interface
ensures that specific features of interest are evaluated but limits the scope of the evaluation - problems can be
missed

How useful are they?
Inspection methods are discount methods for practitioners. They are not rigorous scientific methods. All inspection methods are subjective. No inspection method can compensate for
inexperience or poor judgement. Using multiple analysts results in an inter-subjective
synthesis.
How useful are multiple analysts?
However, this also a) raises the false alarm rate, unless a voting
system is applied b) reduces the hit rate if a voting system is applied! Group synthesis of a prioritized problem list seems
to be the most effective current practical approach.
Ethnography
Observation of users in their natural environment e.g. where the product is used
Can lead to insight into Problems (amount and significance) in
interaction Ideas for solutions– http://www.youtube.com/watch?
v=vbx739sIS00
A bit like a professional stalker/ interviewer

Ethnography
Examples of data collected Conversations and semi structured
interviews Researcher observations and question
answers Descriptions of activities or environments Memos and notices in the environment User stories

Ethnography
Benefits High ecological validity Great for identifying how design fits into the “real
world” Drawbacks
Lack of control in design Data can be tricky and cumbersome to analyse
Video, audio coding etc Fluidity of interpretation
Information free for all
Controlled Experiments/ User Studies
More Scientific Method Control is key
Reduction of confounds Aim to investigate hypotheses about how
the designs affect: User Performance (Time or Error rate) Satisfaction Emotions/other psychological constructs
Pre-defined task/goal
Controlled Experiments/ User Studies
Comparison of design solutions Results can feedback into redesign Typically termed usability engineering Robust study design
Randomisation/Counterbalancing Ensures effect is due to the manipulation of
your independent variable

Example: A/B testing
Two minor variants of a web page Show design A to every even-
numbered visitor to web site Show design B to every odd number Monitor site to see which has higher
dwell rate/click-through rate Choose better design Repeat
30

Good news
Google can do this for you https://support.google.com/
analytics/bin/answer.py?hl=en&answer=1745147&topic=1745207&ctx=topic
31

Variables in Controlled Experiments
Independent variables (IV’s) Variables controlled by the experimenter
Design option Interaction at Time 1 and Time 2
Dependent variables (DV’s) Variables being observed
Completion time (for efficiency) Satisfaction Measure (SUMI)
Types of Experiment Design
Between-subjects Within-subjects Benefits and drawbacks This will link to how you analyse your
data (more about this later)
BS- positives- independent groups ; no experience effect;
BS- negatives- individual abilities affect the data (although this can be minimised by random allocation to conditions; heavy need for participants for a valid experimentWS- positives- takes into account individual differences; less participants to have good robust statistics
WS- negatives- practice effect (although this can be minimised by counterbalancing of conditions)
The ecological validity conundrum
Controlled experiments are useful Causal inference Specificity of effect (sort of) Replicable and robust
But are they realistic? Artificiality of scenario/lab environment Hawthorne effect
Do they hinder creative design?
We can never tell if a variable is influenced by something we haven’t measured. In fact it is likely I.e. individual differences of the users in cognitive ability or personality for instance but random allocation of users to conditions helps with this.
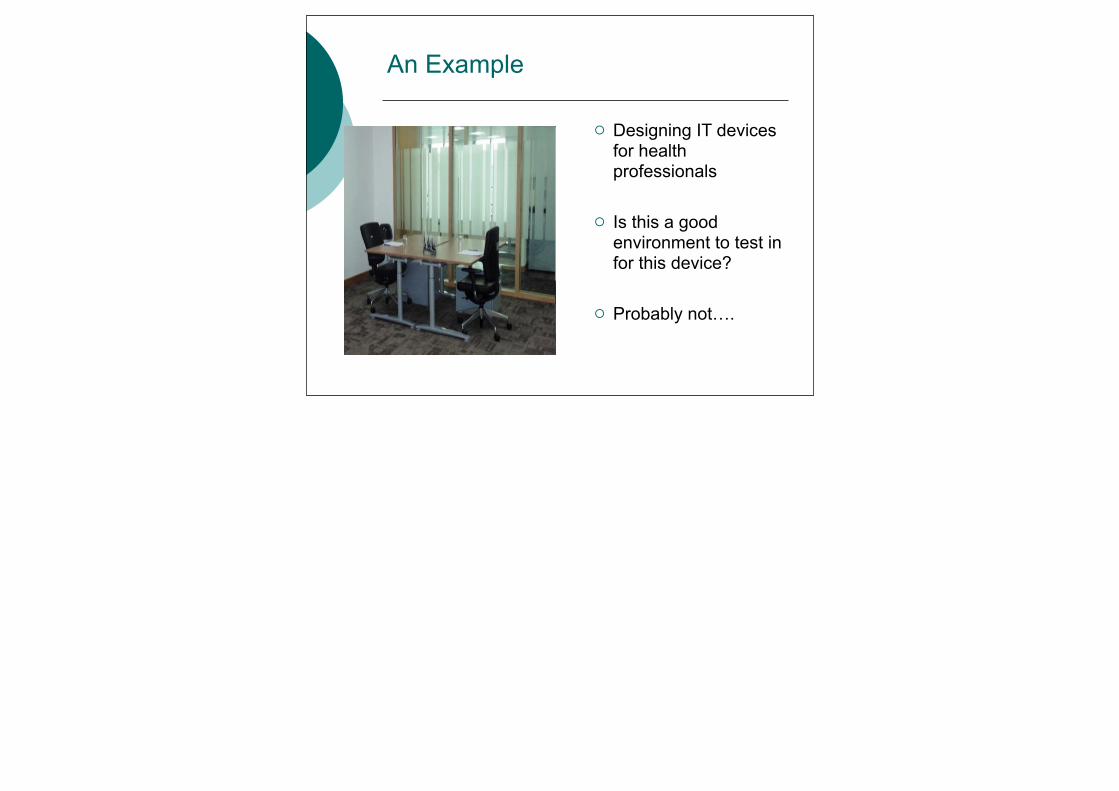
An Example
Designing IT devices for health professionals
Is this a good environment to test in for this device?
Probably not….
Increasing ecological validity in experiments
Use representative participants
Make the environment as realistic as possible
Make the tasks and scenario as realistic as possible
Which is the most valid method?
Triangulation is the key and some will be more valid in certain scenarios e.g. where you have some designs you want to test then experiments might be good but if you are at an early stage then inspection methods or observations may be better.
Whether you want to be theoretical I.e. see the effect of interfaces on users (in which case the psychological methods of controlled experiments will give you sound scientific data) or want to design a product where causal inference may not be so important
Dependent on constraints (time/budget)

Statistics for evaluation
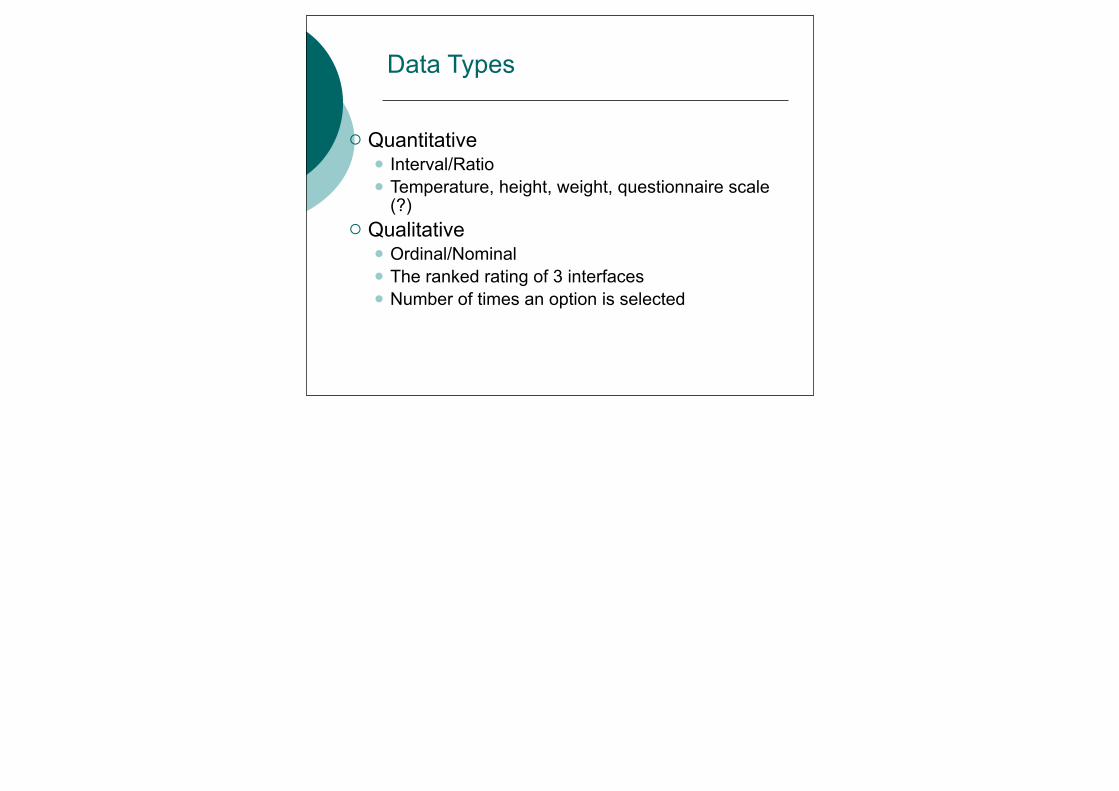
Data Types
Quantitative Interval/Ratio Temperature, height, weight, questionnaire scale
(?) Qualitative
Ordinal/Nominal The ranked rating of 3 interfaces Number of times an option is selected

Data Analysis
Your data type will influence how you analyse your data
Parametric- Interval/Ratio Non Parametric- Ordinal/Nominal Study design will also affect analysis
Between or Within Subjects Analysis Correlation Analysis

Statistical Assumptions
Very important and again will influence your analysis The most important one of these needs to be
demonstrated…… Tall Medium Height Smaller
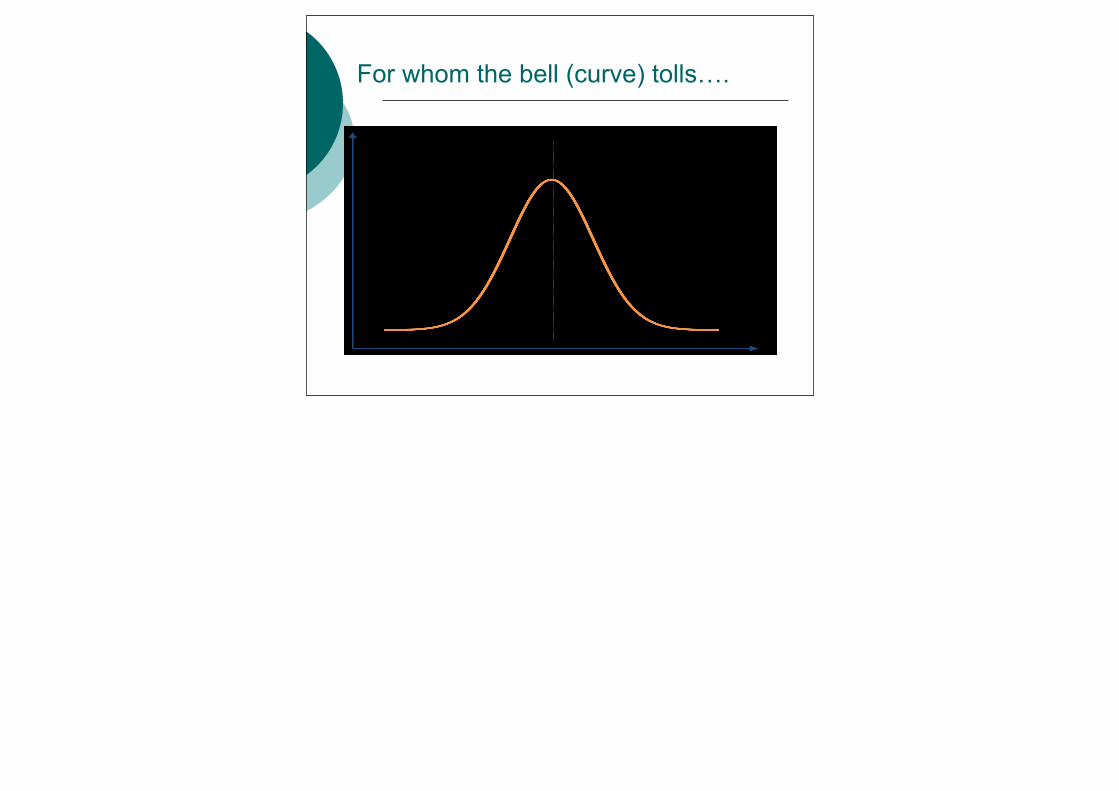
For whom the bell (curve) tolls….
Other assumptions of parametric analysis
Interval/Ratio data Equality of variance/ Sphericity
Depends on study design Independence of data
Depends on study design
Help….my data meets none of these!
Qualitative analysis should be used But….
Less power than parametric Lose quantity differences when comparing
measures Ranked data

Statistical Significance
What does it mean? The probability that the difference/
relationship between the groups/variables is due to chance
Conventional levels p<0.05, p<0.01, p<0.001 Infer strength of relationship

Available tests
Correlation analysis (Pearson’s r) Linear relationship between two continuous variables Pearson’s r= strength of that relationship + or - = Direction No causality only relationship!
Student t-test Compares means of 2 groups on the DV to see if they
are significantly different E.g. Interface 1 vs Interface 2 Between (independent) or Within (dependent) t-tests
Available tests
ANOVA Compares means of 3 or more groups on the
DV to see if they are significantly different Between, Within and Mixed Interaction Effects
The Importance of N
The amount of participants (N) is important Effect size/Statistical Power Central limit theorem and normality of data Reduces effects of outliers on statistics Representative sample Nielsen’s 5 = bad stats if used for experiments Why?
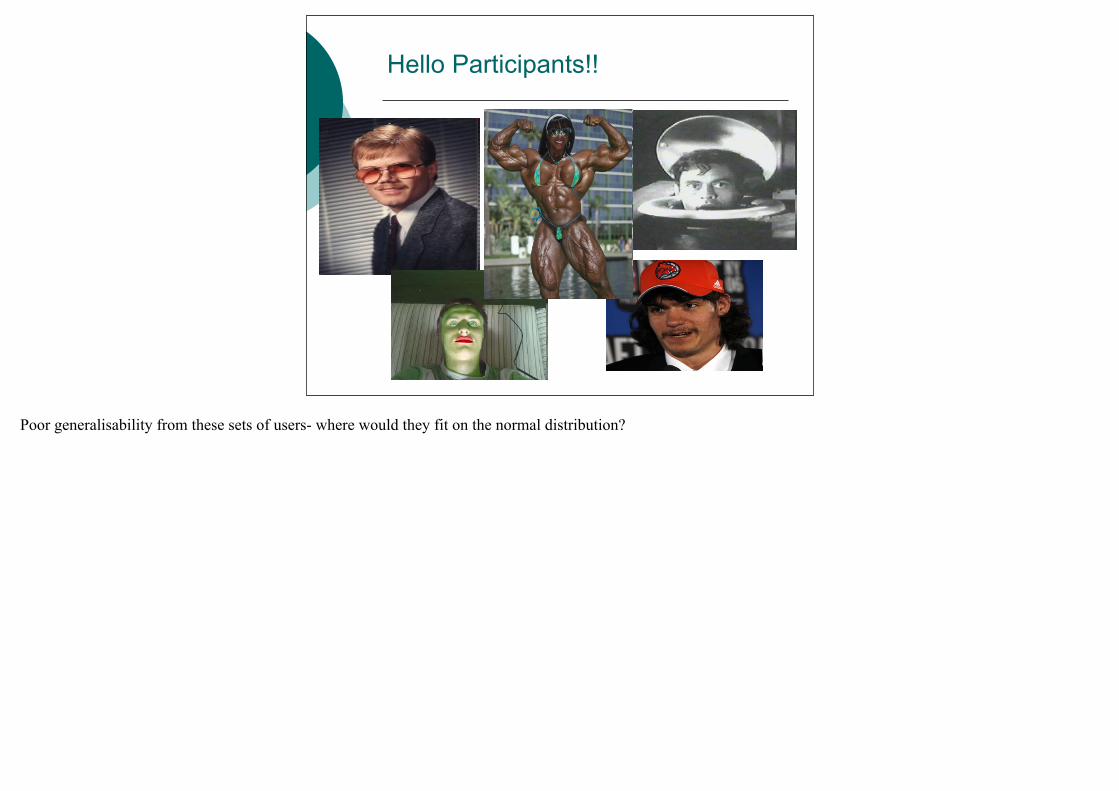
Hello Participants!!
Poor generalisability from these sets of users- where would they fit on the normal distribution?
The Importance of Test Focus
Family-wise error rate As you increase the amount of tests on the
data the chance of gaining a false positive (Type 1 error) is increased
Keep sight of what you are measuring E.g. Spurious correlations (Long hair and IQ)
With lots of tests (e.g. Correlation matrix) the strength of effect is important
What we have covered today
Evaluation methods No users needed (e.g. Heuristic Eval, Cognitive
Walkthrough) Users needed (e.g. Ethnography, Experiments) Comparative validity of these methods
Statistics in evaluation Data types Assumptions Tests Critical aspects of analysis design

Some Resources
Methods Book: Cairn & Cox (2009) Research Methods in HCI.
(Also covered in all good HCI texts) Jakob Nielsen’s Alertbox Site
www.useit.com/alertbox/ Statistics
Andy Field’s Statistics Hell Site www.statisticshell.com - actually more heaven than
hell
![[HCI] Week 14 UX Evaluation Workshop Part II](https://static.documents.pub/doc/80x56/588a344b1a28abc6168b54cd/hci-week-14-ux-evaluation-workshop-part-ii.jpg)


![[HCI] Week 14. Evaluation Reporting](https://static.documents.pub/doc/80x56/58ed5e901a28abd04c8b45f1/hci-week-14-evaluation-reporting.jpg)


![[HCI] Week 15. Evaluation Reporting](https://static.documents.pub/doc/80x56/588a344b1a28abc6168b54d7/hci-week-15-evaluation-reporting.jpg)


