68
AgendaAgenda
HSSE OverviewHSSE Overview Financial SummaryFinancial Summary StrategyStrategy
2010 Challenges2010 Challenges Where we want to be end 2012Where we want to be end 2012
Business Partner StrategyBusiness Partner Strategy AsksAsks
HSSE ManagementHSSE Management
Annual Safety planAnnual Safety plan Objectives driven by KPI performance, audit output, Senior Team and Objectives driven by KPI performance, audit output, Senior Team and
Non-Exec directorsNon-Exec directors
Regulatory BodiesRegulatory Bodies Office of Rail Regulation (ORR)Office of Rail Regulation (ORR)
Economic and Safety regulationEconomic and Safety regulation Economic regulation n/a to HexEconomic regulation n/a to Hex
HMRI inspect rail operations safety HMRI inspect rail operations safety RSSB administer industry standardsRSSB administer industry standards
AccreditationsAccreditations ISO 27001 Information Security ManagementISO 27001 Information Security Management
Security of our on line purchasing, ticketing systems (including credit card Security of our on line purchasing, ticketing systems (including credit card data etc), data etc),
Tunnel control systemTunnel control system ISO 14001 Environmental Management System ISO 14001 Environmental Management System
Waste management and disposal, energy management etc, Waste management and disposal, energy management etc,
HSSE - Health, Safety, Security and Environment
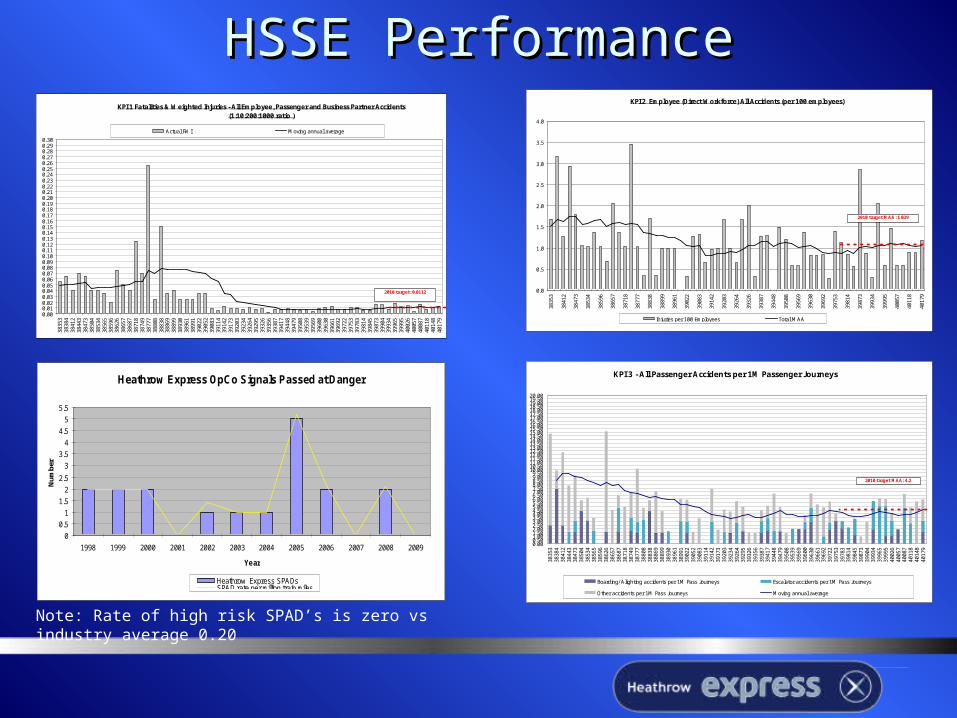
HSSE PerformanceHSSE PerformanceKPI 1 Fatalities & Weighted Injuries - All Employee, Passenger and Business Partner Accidents
(1:10:200:1000 ratio )
0.000.010.020.030.040.050.060.070.080.090.100.110.120.130.140.150.160.170.180.190.200.210.220.230.240.250.260.270.280.290.30
3835
338
384
3841
238
443
3847
338
504
3853
438
565
3859
638
626
3865
738
687
3871
838
749
3877
738
808
3883
838
869
3889
938
930
3896
138
991
3902
239
052
3908
339
114
3914
239
173
3920
339
234
3926
439
295
3932
639
356
3938
739
417
3944
839
479
3950
839
539
3956
939
600
3963
039
661
3969
239
722
3975
339
783
3981
439
845
3987
339
904
3993
439
965
3999
540
026
4005
740
087
4011
840
148
4017
9
Actual FWI Moving annual average
2010 target: 0.0112
KPI 3 - All Passenger Accidents per 1M Passenger Journeys
0.000.501.001.502.002.503.003.504.004.505.005.506.006.507.007.508.008.509.009.50
10.0010.5011.0011.5012.0012.5013.0013.5014.0014.5015.0015.5016.0016.5017.0017.5018.0018.5019.0019.5020.00
3835
338
384
3841
238
443
3847
338
504
3853
438
565
3859
638
626
3865
738
687
3871
838
749
3877
738
808
3883
838
869
3889
938
930
3896
138
991
3902
239
052
3908
339
114
3914
239
173
3920
339
234
3926
439
295
3932
639
356
3938
739
417
3944
839
479
3950
839
539
3956
939
600
3963
039
661
3969
239
722
3975
339
783
3981
439
845
3987
339
904
3993
439
965
3999
540
026
4005
740
087
4011
840
148
4017
9
Boarding/ Alighting accidents per 1M Pass Journeys Escalator accidents per 1M Pass Journeys
Other accidents per 1M Pass Journeys Moving annual average
2010 target MAA: 4.2
KPI 2 Employee (Direct Workforce) All Accidents (per 100 employees)
0.0
0.5
1.0
1.5
2.0
2.5
3.0
3.5
4.0
3835
3
3841
2
3847
3
3853
4
3859
6
3865
7
3871
8
3877
7
3883
8
3889
9
3896
1
3902
2
3908
3
3914
2
3920
3
3926
4
3932
6
3938
7
3944
8
3950
8
3956
9
3963
0
3969
2
3975
3
3981
4
3987
3
3993
4
3999
5
4005
7
4011
8
4017
9
Injuries per 100 Employees Total MAA
2010 target MAA: 1.039
Heathrow Express OpCo Signals Passed at Danger
0
0.5
1
1.5
2
2.5
3
3.5
4
4.5
5
5.5
1998 1999 2000 2001 2002 2003 2004 2005 2006 2007 2008 2009
Year
Num
ber
Heathrow Express SPADsSPAD rate per million train miles
Note: Rate of high risk SPAD’s is zero vs industry average 0.20

Financial OverviewFinancial Overview
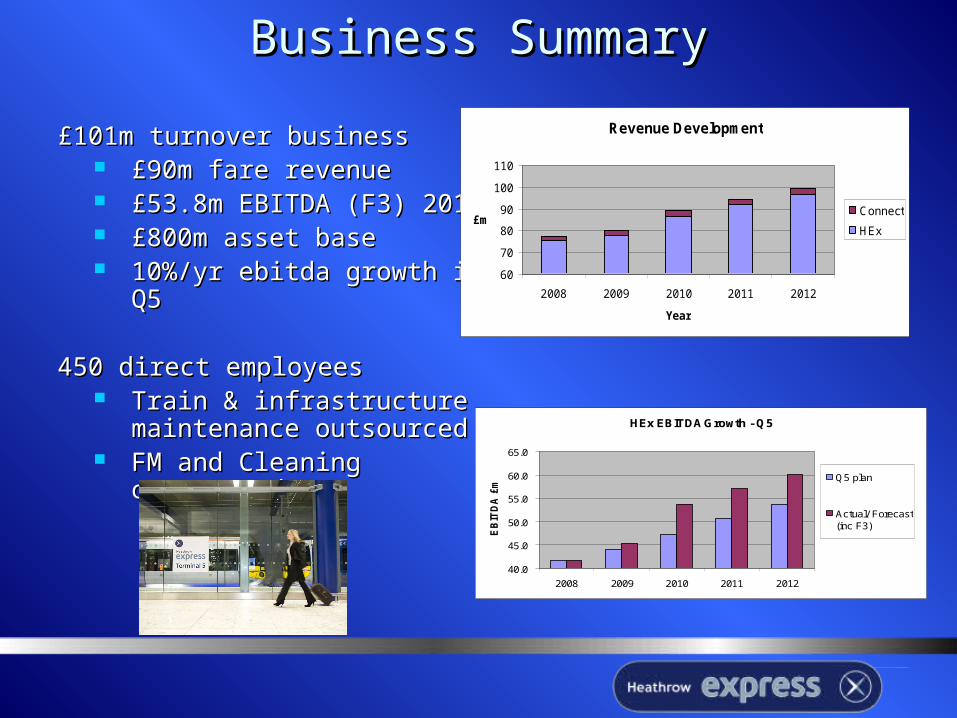
Business SummaryBusiness Summary
£101m turnover business£101m turnover business £90m fare revenue£90m fare revenue £53.8m EBITDA (F3) 2010£53.8m EBITDA (F3) 2010 £800m asset base£800m asset base 10%/yr ebitda growth in 10%/yr ebitda growth in
Q5 Q5
450 direct employees450 direct employees Train & infrastructure Train & infrastructure
maintenance outsourcedmaintenance outsourced FM and Cleaning FM and Cleaning
outsourcedoutsourced
Revenue Development
60
70
80
90
100
110
2008 2009 2010 2011 2012
Year
£mConnect
HEx
HEx EBITDA Growth - Q5
40.0
45.0
50.0
55.0
60.0
65.0
2008 2009 2010 2011 2012
EB
ITD
A £
m
Q5 plan
Actual/ Forecast(inc F3)
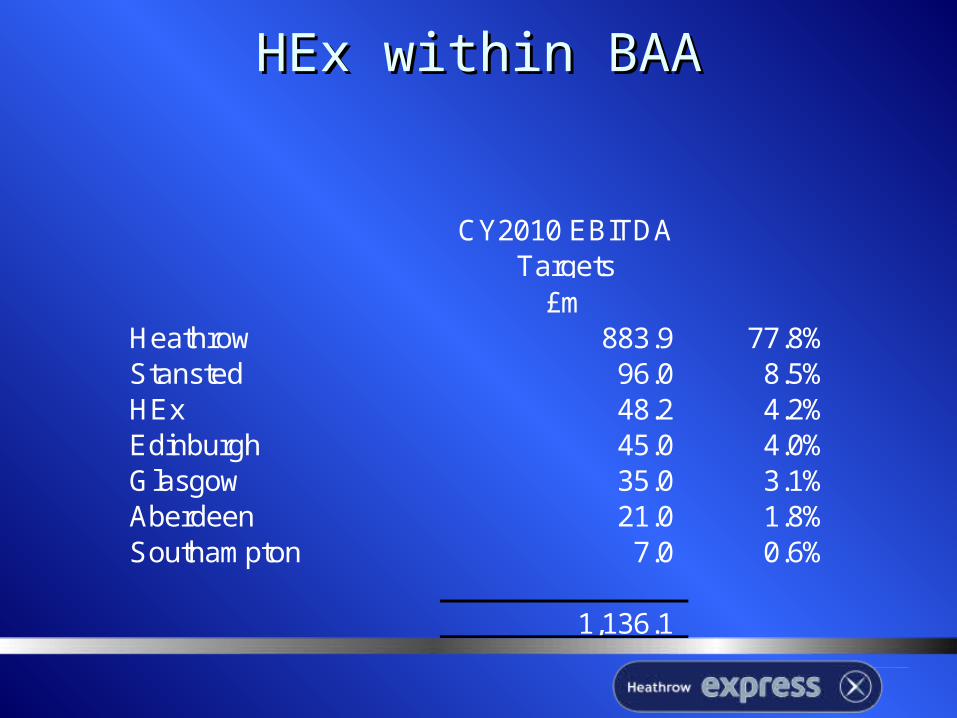
HEx within BAAHEx within BAA
CY2010 EBITDA Targets
£mHeathrow 883.9 77.8%Stansted 96.0 8.5%HEx 48.2 4.2%Edinburgh 45.0 4.0%Glasgow 35.0 3.1%Aberdeen 21.0 1.8%Southampton 7.0 0.6%
1,136.1
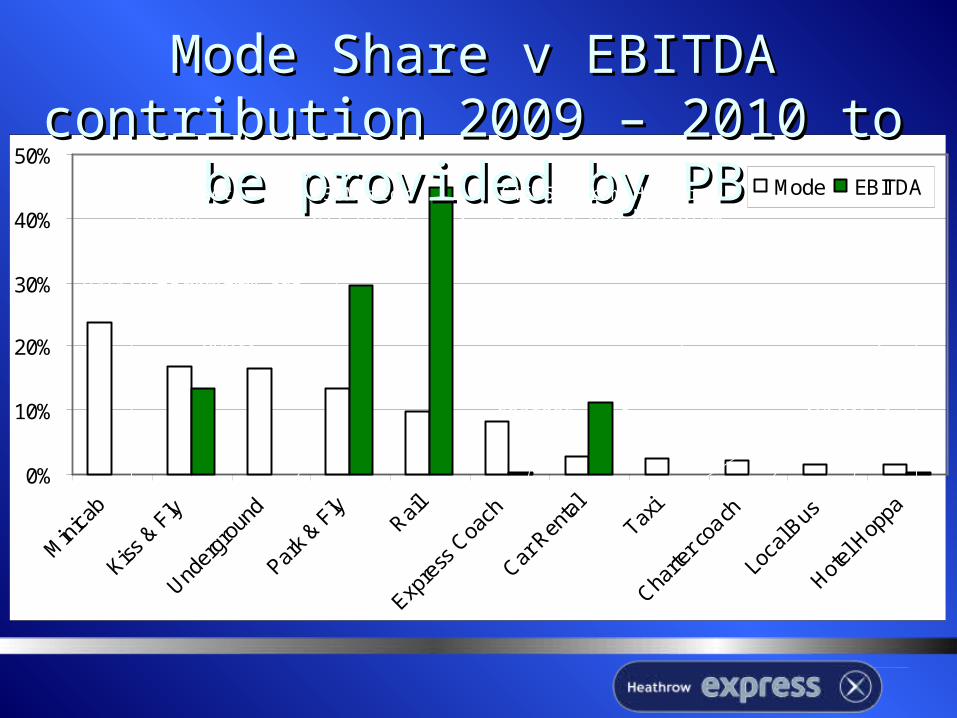
0%
10%
20%
30%
40%
50%
Min
icab
Kiss &
Fly
Under
grou
nd
Park
& Fly
Rail
Expre
ss C
oach
Car R
enta
lTax
i
Charte
r coa
ch
Loca
l Bus
Hotel
Hop
pa
Mode EBITDA
Mode Share v EBITDA contribution Mode Share v EBITDA contribution 2009 – 2010 to be provided by PB2009 – 2010 to be provided by PB
£0.2M from bus licenses
moving towards cost
recovery
£11.5M from concessions
£0.4M from departure charges
£45.5M from Heathrow Express and Heathrow Connect
£14M from car park stays less than 10 hours
£30M from all other car park
income
£0.1M direct though contributes to short
stay parking revenue
£0£0
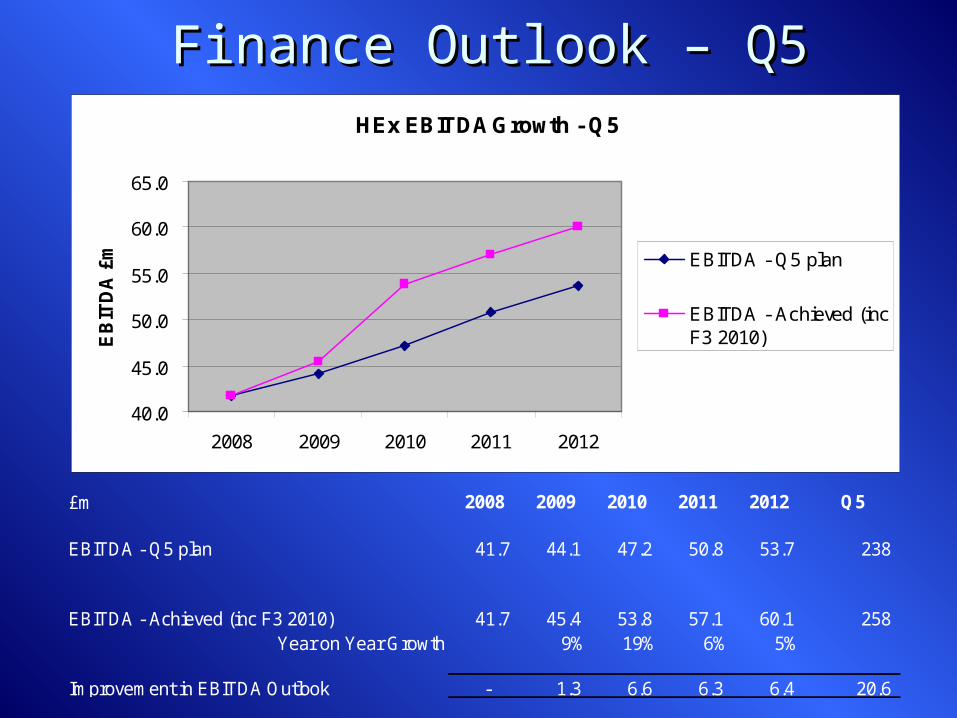
Finance Outlook – Q5Finance Outlook – Q5HEx EBITDA Growth - Q5
40.0
45.0
50.0
55.0
60.0
65.0
2008 2009 2010 2011 2012
EB
ITD
A £
m EBITDA - Q5 plan
EBITDA - Achieved (incF3 2010)
£m 2008 2009 2010 2011 2012 Q5
EBITDA - Q5 plan 41.7 44.1 47.2 50.8 53.7 238
EBITDA - Achieved (inc F3 2010) 41.7 45.4 53.8 57.1 60.1 258 Year on Year Growth 9% 19% 6% 5%
Improvement in EBITDA Outlook - 1.3 6.6 6.3 6.4 20.6
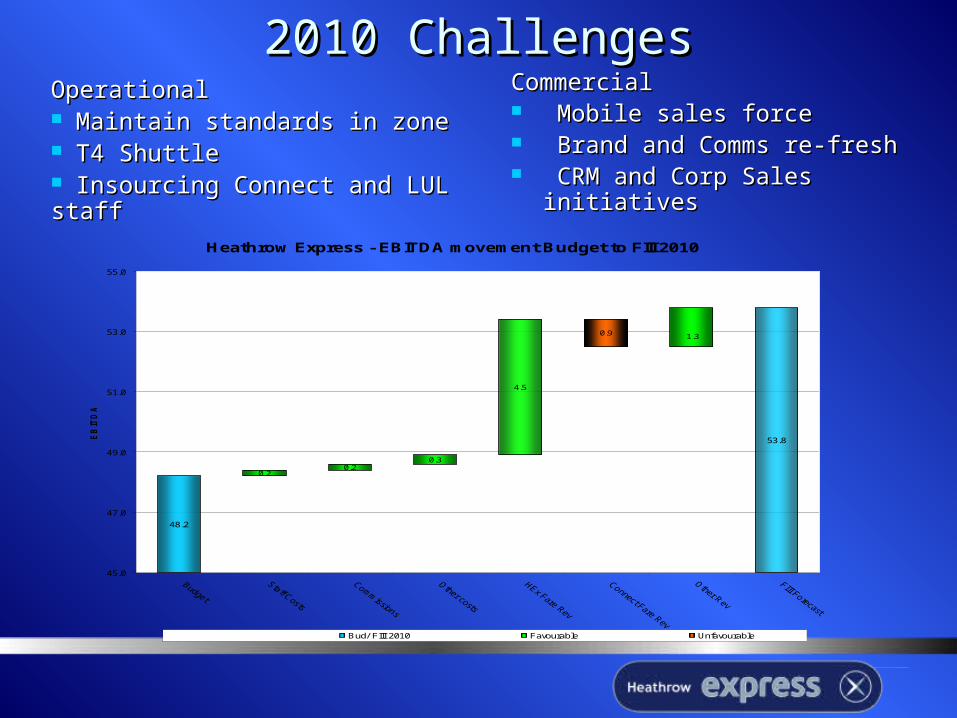
2010 Challenges2010 ChallengesOperationalOperational Maintain standards in zoneMaintain standards in zone T4 ShuttleT4 Shuttle Insourcing Connect and LUL Insourcing Connect and LUL staffstaff
CommercialCommercial Mobile sales forceMobile sales force Brand and Comms re-freshBrand and Comms re-fresh CRM and Corp Sales CRM and Corp Sales
initiativesinitiativesHeathrow Express - EBITDA movement Budget to FIII 2010
48.2
53.8
0.20.2
4.5
1.3
0.3
0.9
45.0
47.0
49.0
51.0
53.0
55.0
EB
ITD
A £
m
Bud/ FIII 2010 Favourable Unfavourable
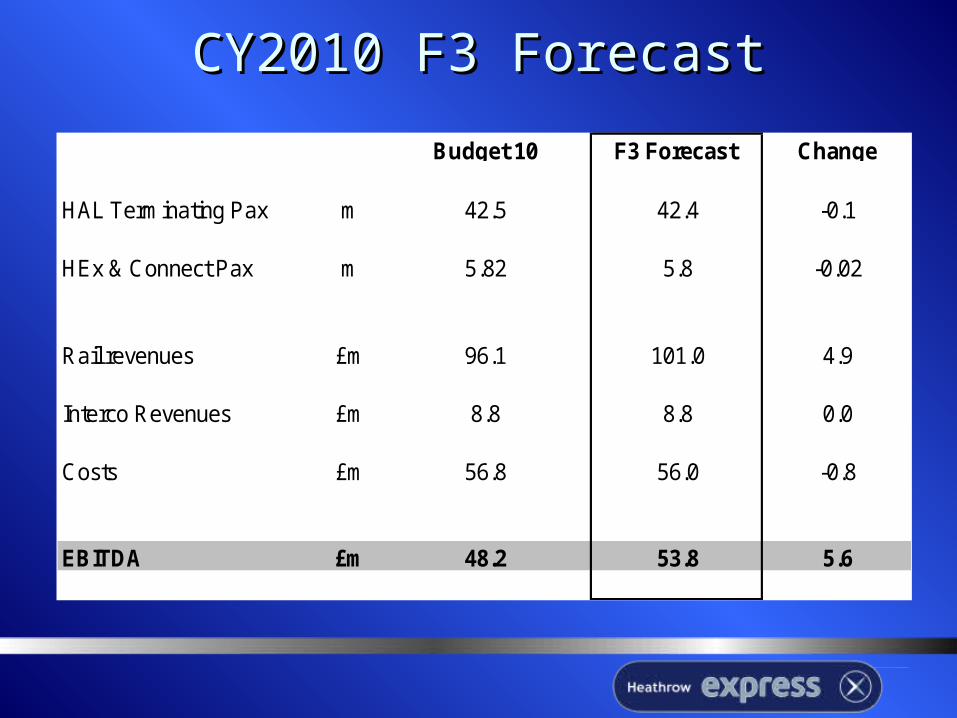
CY2010 F3 ForecastCY2010 F3 Forecast
Budget 10 F3 Forecast Change
HAL Terminating Pax m 42.5 42.4 -0.1
HEx & Connect Pax m 5.82 5.8 -0.02
Rail revenues £m 96.1 101.0 4.9
Interco Revenues £m 8.8 8.8 0.0
Costs £m 56.8 56.0 -0.8
EBITDA £m 48.2 53.8 5.6
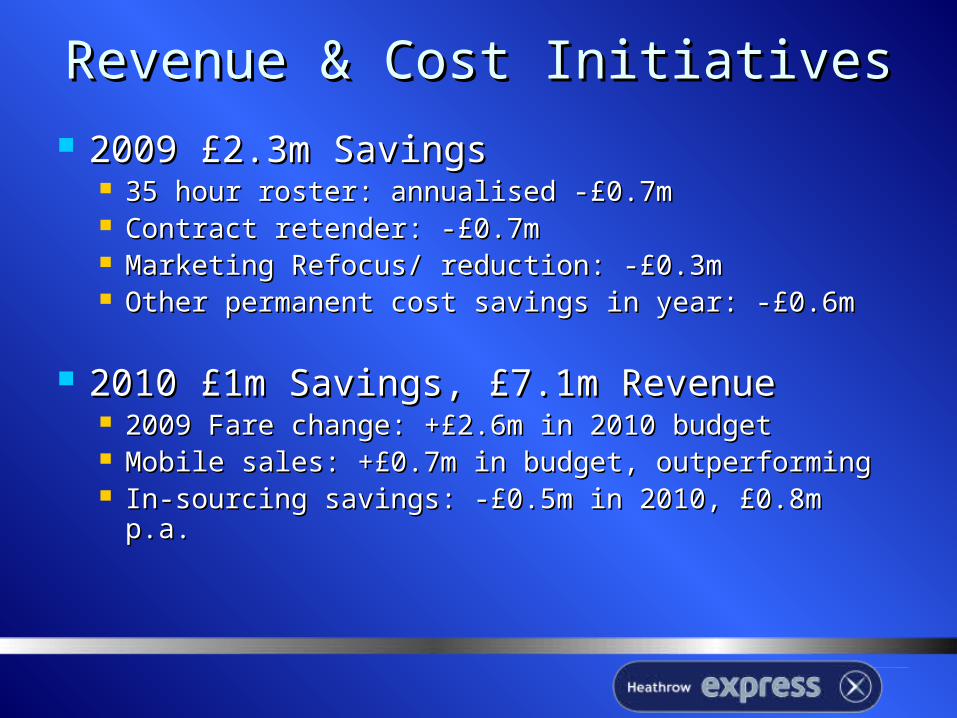
Revenue & Cost InitiativesRevenue & Cost Initiatives 2009 £2.3m Savings2009 £2.3m Savings
35 hour roster: annualised -£0.7m35 hour roster: annualised -£0.7m Contract retender: -£0.7mContract retender: -£0.7m Marketing Refocus/ reduction: -£0.3mMarketing Refocus/ reduction: -£0.3m Other permanent cost savings in year: -£0.6mOther permanent cost savings in year: -£0.6m
2010 £1m Savings, £7.1m Revenue2010 £1m Savings, £7.1m Revenue 2009 Fare change: +£2.6m in 2010 budget2009 Fare change: +£2.6m in 2010 budget Mobile sales: +£0.7m in budget, outperformingMobile sales: +£0.7m in budget, outperforming In-sourcing savings: -£0.5m in 2010, £0.8m p.a.In-sourcing savings: -£0.5m in 2010, £0.8m p.a.

Strategy OverviewStrategy Overview
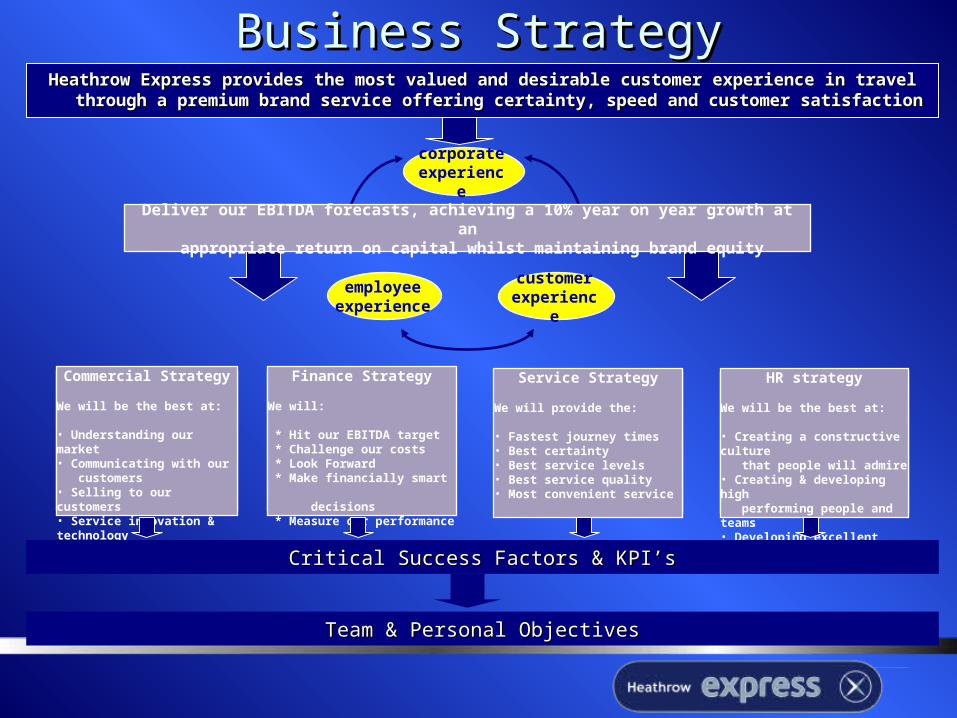
Commercial Strategy
We will be the best at:
• Understanding our market• Communicating with our customers• Selling to our customers• Service innovation & technology
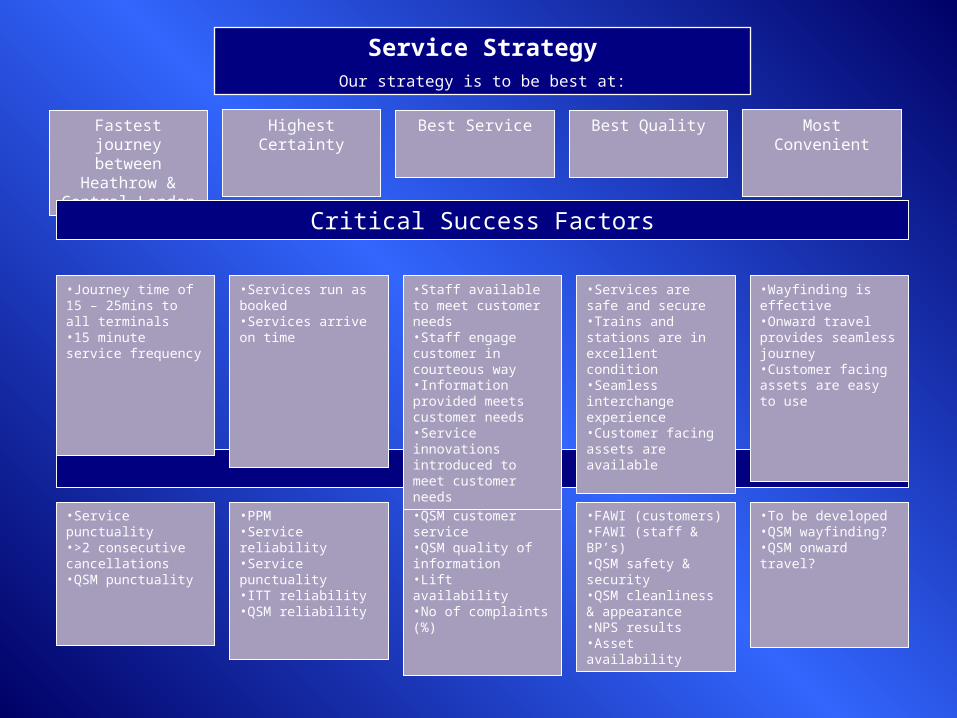
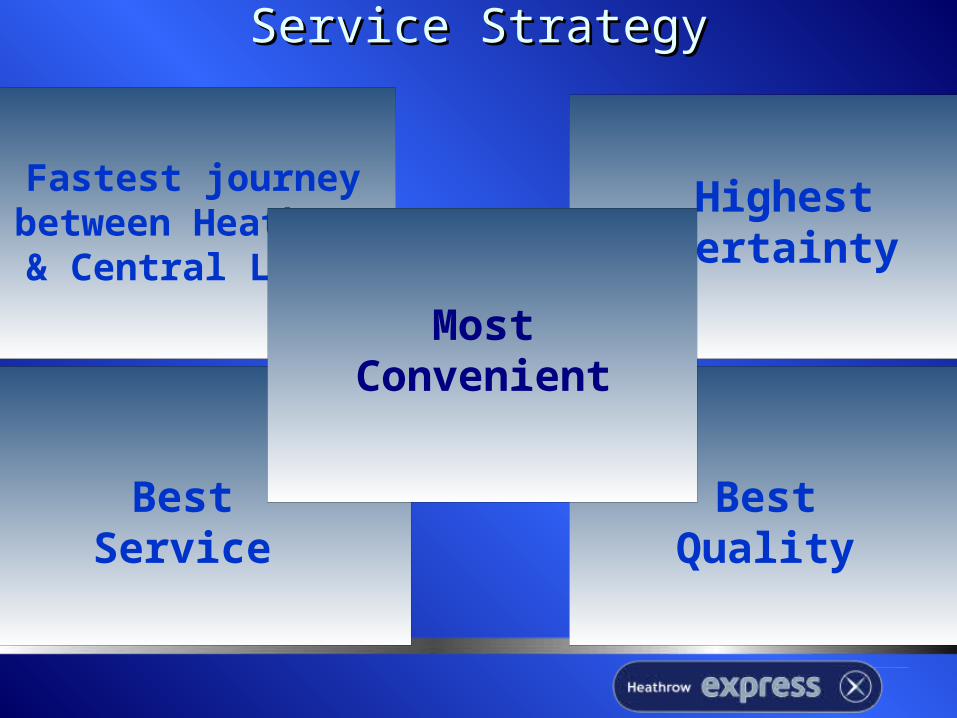
Service Strategy
We will provide the:
• Fastest journey times• Best certainty• Best service levels• Best service quality• Most convenient service
Heathrow Express provides the most valued and desirable customer experience in travel Heathrow Express provides the most valued and desirable customer experience in travel through a premium brand service offering certainty, speed and customer satisfactionthrough a premium brand service offering certainty, speed and customer satisfaction
Finance Strategy
We will:
* Hit our EBITDA target * Challenge our costs * Look Forward * Make financially smart decisions * Measure our performance
HR strategy
We will be the best at:
• Creating a constructive culture that people will admire• Creating & developing high performing people and teams• Developing excellent employee relationsCritical Success Factors & KPI’sCritical Success Factors & KPI’s
Team & Personal ObjectivesTeam & Personal Objectives
corporate
experience
employeeexperienc
e
customerexperienc
e
Deliver our EBITDA forecasts, achieving a 10% year on year growth at an appropriate return on capital whilst maintaining brand equity
Business StrategyBusiness Strategy
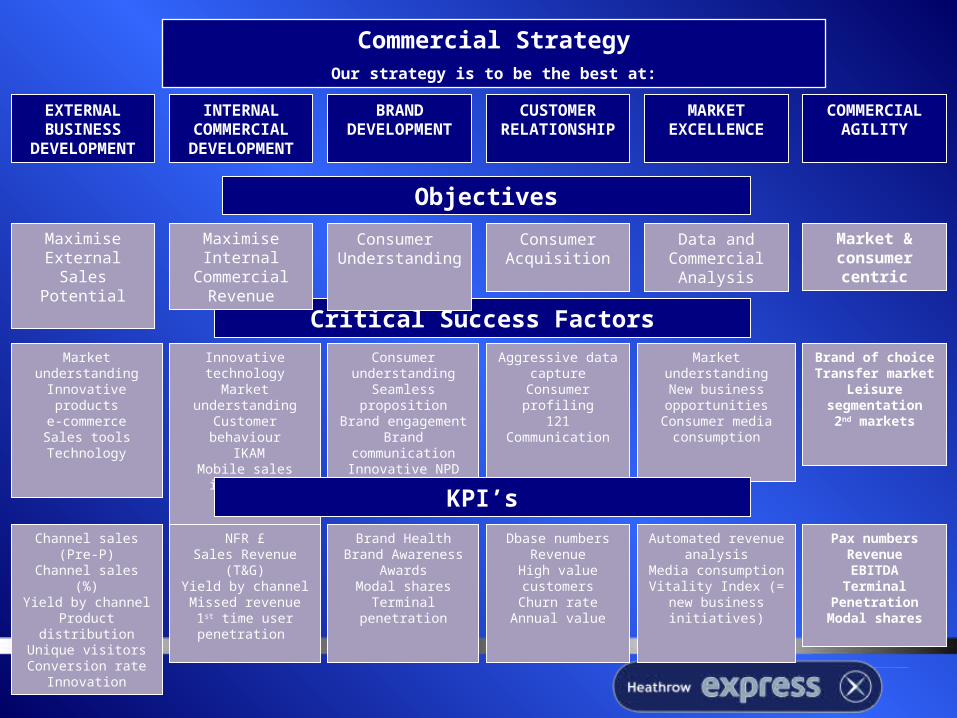
EXTERNAL BUSINESS
DEVELOPMENT
Commercial StrategyOur strategy is to be the best at:
Critical Success FactorsInnovative technology
Market understanding
Customer behaviour
IKAMMobile sales
interface
Market understanding
Innovative products
e-commerceSales toolsTechnology
Consumer understanding
Seamless proposition
Brand engagementBrand
communicationInnovative NPD
Technology
Aggressive data capture
Consumer profiling
121 Communication
Market understandingNew business opportunities
Consumer media consumption
Brand of choiceTransfer market
Leisure segmentation2nd markets
BRAND DEVELOPMEN
T
INTERNAL COMMERCIAL DEVELOPMEN
T
CUSTOMER RELATIONSHI
P
MARKET EXCELLENCE
COMMERCIAL AGILITY
Maximise External Sales
Potential
Maximise Internal
Commercial Revenue
Consumer Understanding
Consumer Acquisition
Data and Commercial
Analysis
Market & consumer
centric
Objectives
NFR £Sales Revenue
(T&G)Yield by channelMissed revenue
1st time user penetration
Channel sales (Pre-P)
Channel sales (%)Yield by channel
Product distributionUnique visitorsConversion rate
Innovation
Brand HealthBrand Awareness
AwardsModal shares
Terminal penetration
Dbase numbersRevenue
High value customersChurn rate
Annual value
Automated revenue analysis
Media consumptionVitality Index (= new business initiatives)
Pax numbersRevenueEBITDA
Terminal Penetration
Modal shares
KPI’s
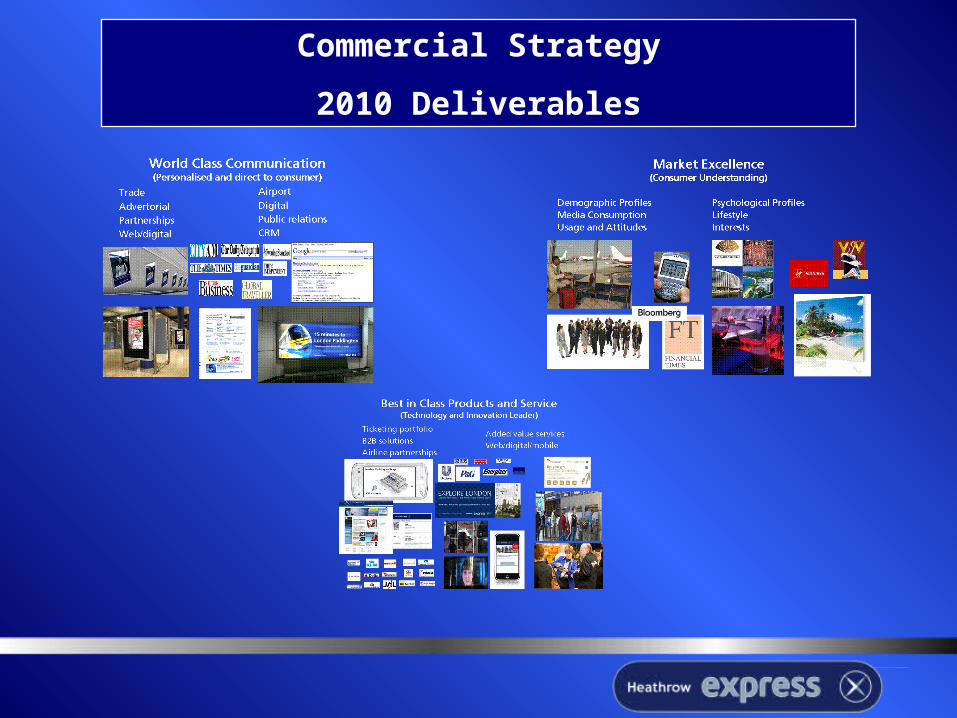
Commercial Strategy
2010 Deliverables
Fastest journey between
Heathrow & Central London
Highest Certainty
Best Service Best Quality Most Convenient
Service StrategyOur strategy is to be best at:
Critical Success Factors
KPI’s
•Services run as booked•Services arrive on time
•PPM•Service reliability•Service punctuality•ITT reliability•QSM reliability
•To be developed•QSM wayfinding?•QSM onward travel?
•FAWI (customers)•FAWI (staff & BP’s) •QSM safety & security•QSM cleanliness & appearance•NPS results •Asset availability
•QSM customer service•QSM quality of information•Lift availability•No of complaints (%)
•Service punctuality•>2 consecutive cancellations•QSM punctuality
•Journey time of 15 – 25mins to all terminals•15 minute service frequency
•Staff available to meet customer needs•Staff engage customer in courteous way•Information provided meets customer needs•Service innovations introduced to meet customer needs
•Services are safe and secure•Trains and stations are in excellent condition•Seamless interchange experience•Customer facing assets are available
•Wayfinding is effective•Onward travel provides seamless journey•Customer facing assets are easy to use
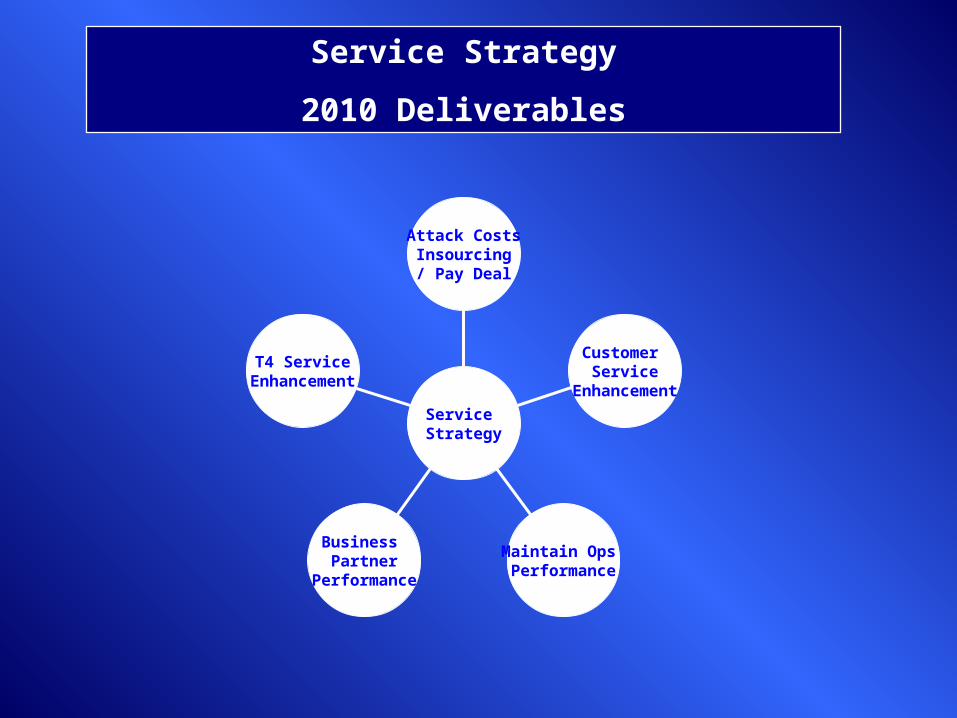
Service Strategy
2010 Deliverables
T4 ServiceEnhancement
Business Partner
Performance
Maintain Ops Performance
Customer Service
Enhancement
Attack CostsInsourcing/ Pay Deal
Service Strategy
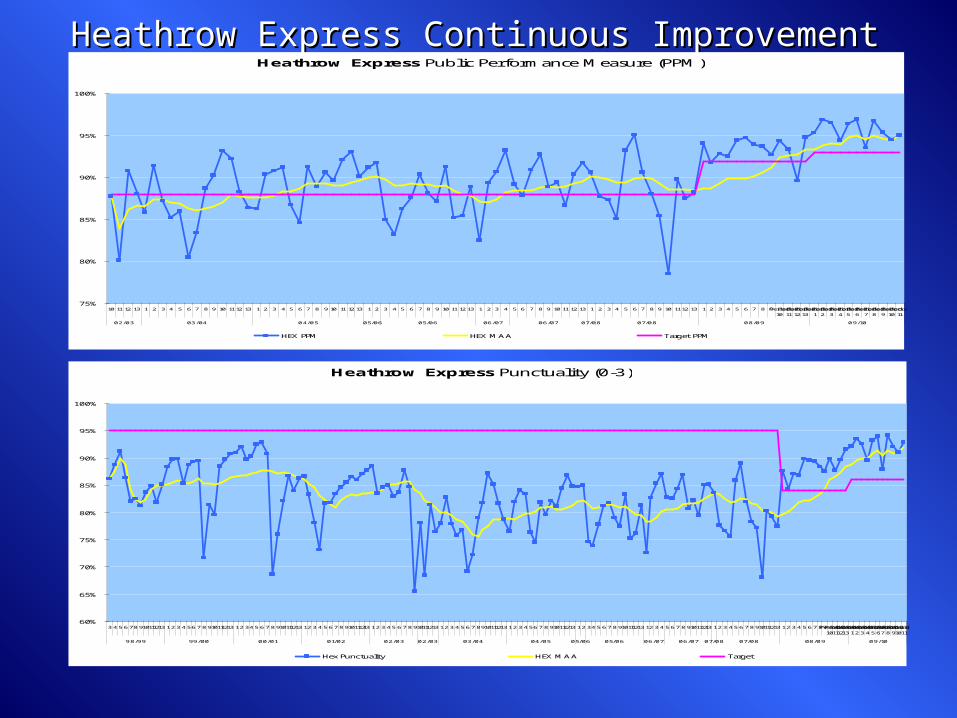
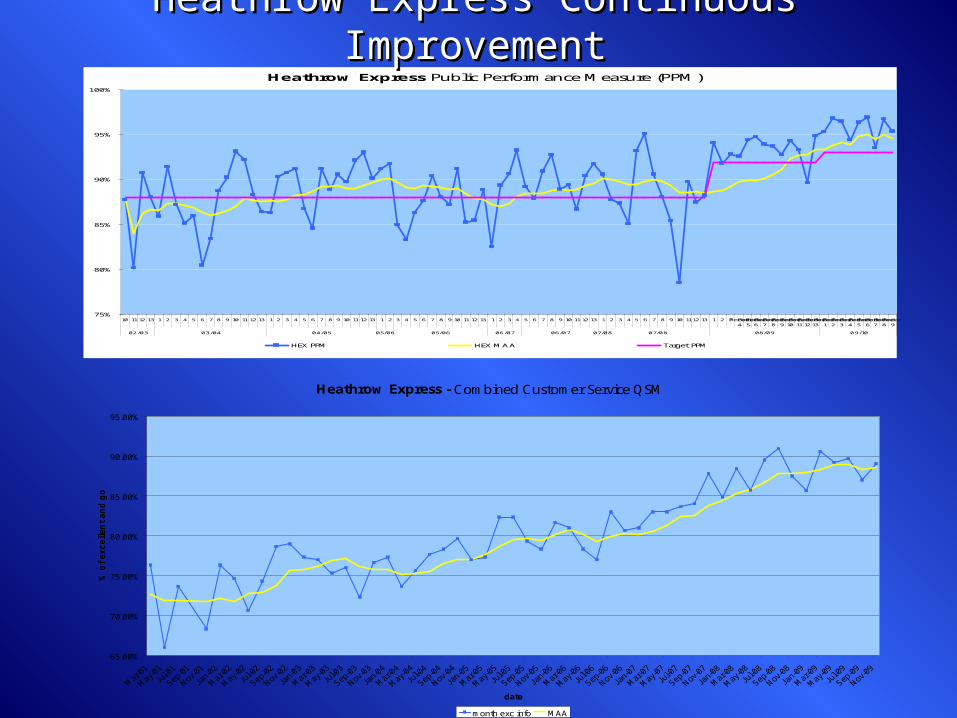
Heathrow Express Continuous ImprovementHeathrow Express Continuous ImprovementHeathrow Express Public Performance Measure (PPM)
75%
80%
85%
90%
95%
100%
10 1112 13 1 2 3 4 5 6 7 8 9 10 1112 13 1 2 3 4 5 6 7 8 9 10 111213 1 2 3 4 5 6 7 8 9 10 111213 1 2 3 4 5 6 7 8 9 10 1112 13 1 2 3 4 5 6 7 8 9 10 1112 13 1 2 3 4 5 6 7 8 9Period10Period
11Period
12Period
13Period
1Period
2Period
3Period
4Period
5Period
6Period
7Period
8Period
9Period
10Period
11
02/03 03/04 04/05 05/06 05/06 06/07 06/07 07/08 07/08 08/09 09/10
HEX PPM HEX MAA Target PPM
Heathrow Express Punctuality (0-3)
60%
65%
70%
75%
80%
85%
90%
95%
100%
345678910111213123456789101112131234567891011121312345678910111213123456789101112131234567891011121312345678910111213123456789101112131234567891011121312345678910111213123456789Period10Period
11Period
12Period
13Period
1Period
2Period
3Period
4Period
5Period
6Period
7Period
8Period
9Period
10Period
11
98/99 99/00 00/01 01/02 02/03 02/03 03/04 04/05 05/06 05/06 06/07 06/07 07/08 07/08 08/09 09/10
Hex Punctuality HEX MAA Target
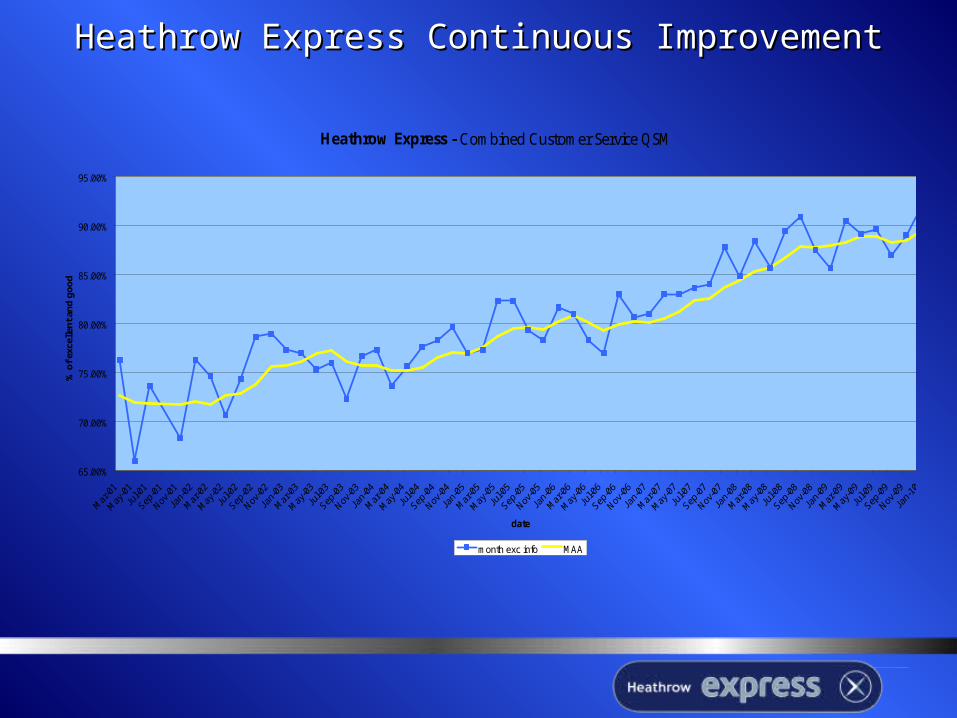
Heathrow Express Continuous ImprovementHeathrow Express Continuous Improvement
Heathrow Express - Combined Customer Service QSM
65.00%
70.00%
75.00%
80.00%
85.00%
90.00%
95.00%
date
% o
f ex
celle
nt
and
go
od
month exc info MAA
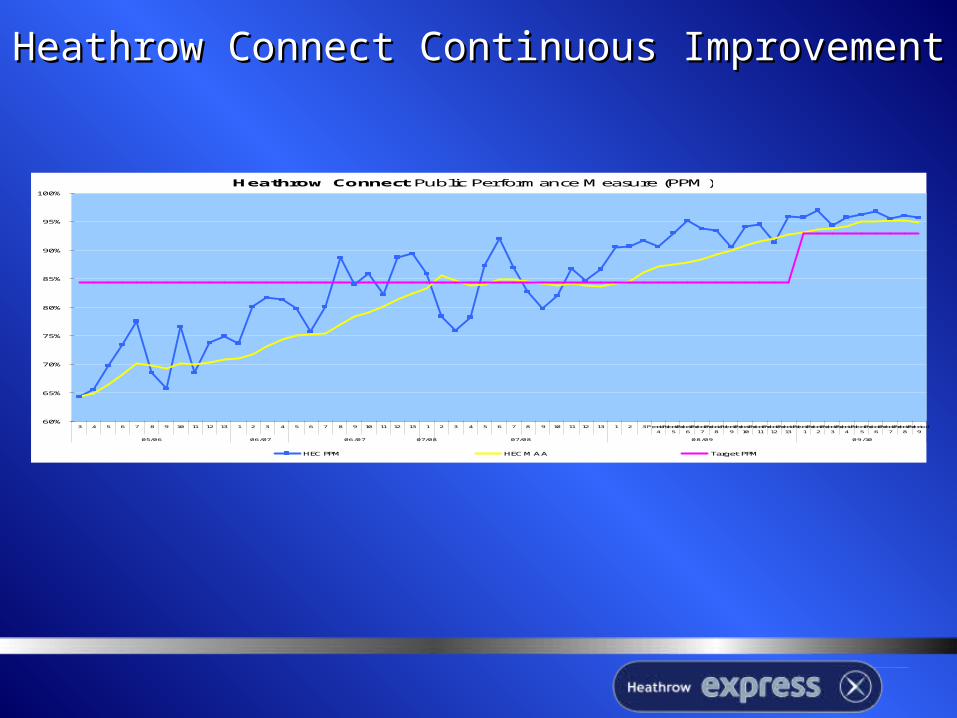
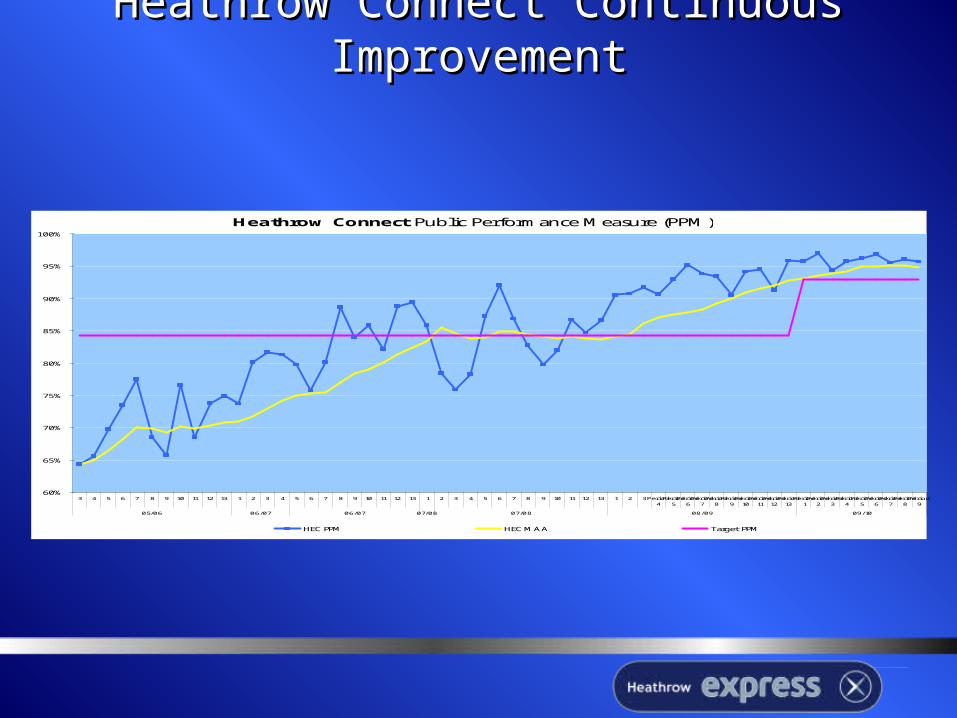
Heathrow Connect Continuous ImprovementHeathrow Connect Continuous Improvement
Heathrow Connect Public Performance Measure (PPM)
60%
65%
70%
75%
80%
85%
90%
95%
100%
3 4 5 6 7 8 9 10 11 12 13 1 2 3 4 5 6 7 8 9 10 11 12 13 1 2 3 4 5 6 7 8 9 10 11 12 13 1 2 3Period4
Period5Period
6Period
7Period
8Period
9Period
10Period
11Period
12Period
13Period
1Period
2Period
3Period
4Period
5Period
6Period
7Period
8Period
9
05/06 06/07 06/07 07/08 07/08 08/09 09/10
HEC PPM HEC MAA Target PPM
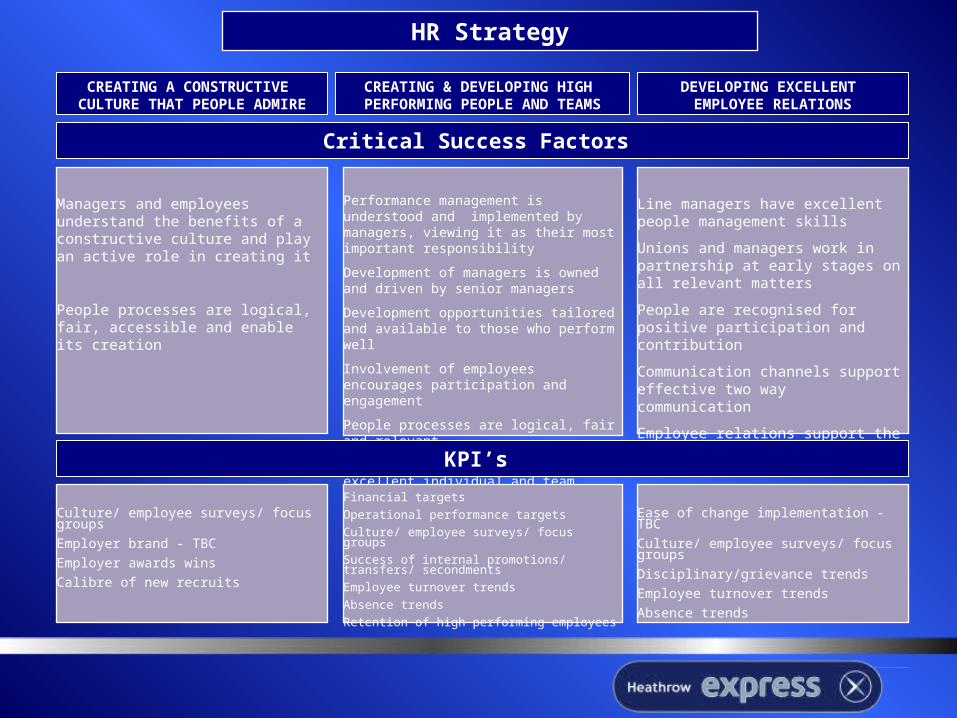
CREATING A CONSTRUCTIVE CULTURE THAT PEOPLE
ADMIRE
Critical Success Factors
Managers and employees understand the benefits of a constructive culture and play an active role in creating it
People processes are logical, fair, accessible and enable its creation
Performance management is understood and implemented by managers, viewing it as their most important responsibility
Development of managers is owned and driven by senior managers
Development opportunities tailored and available to those who perform well
Involvement of employees encourages participation and engagement
People processes are logical, fair and relevant
Rewards are fair and encourage excellent individual and team performance
Line managers have excellent people management skills
Unions and managers work in partnership at early stages on all relevant matters
People are recognised for positive participation and contribution
Communication channels support effective two way communication
Employee relations support the growth of the business
Culture/ employee surveys/ focus groups
Employer brand - TBC
Employer awards wins
Calibre of new recruits
Financial targets
Operational performance targets
Culture/ employee surveys/ focus groups
Success of internal promotions/ transfers/ secondments
Employee turnover trends
Absence trends
Retention of high performing employees
Ease of change implementation - TBC
Culture/ employee surveys/ focus groups
Disciplinary/grievance trends
Employee turnover trends
Absence trends
CREATING & DEVELOPING HIGH PERFORMING PEOPLE AND
TEAMS
DEVELOPING EXCELLENT EMPLOYEE RELATIONS
HR Strategy
KPI’s
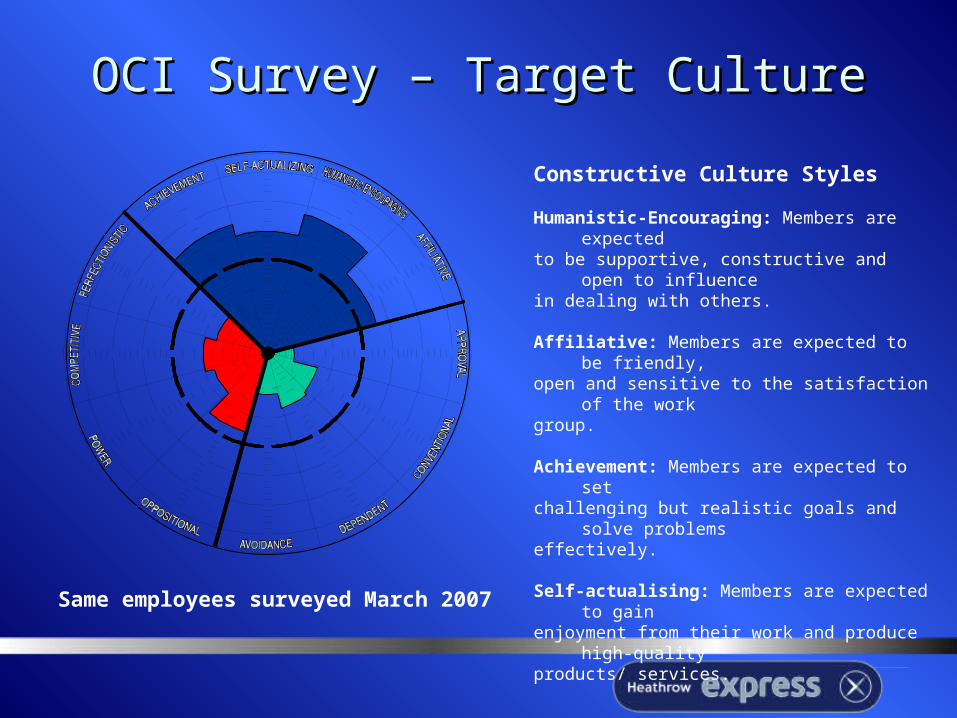
OCI Survey – Target CultureOCI Survey – Target Culture
Same employees surveyed March 2007
Constructive Culture Styles
Humanistic-Encouraging: Members are expected
to be supportive, constructive and open to influence
in dealing with others.
Affiliative: Members are expected to be friendly,
open and sensitive to the satisfaction of the work
group.
Achievement: Members are expected to setchallenging but realistic goals and solve
problemseffectively.
Self-actualising: Members are expected to gain
enjoyment from their work and produce high-quality
products/ services.
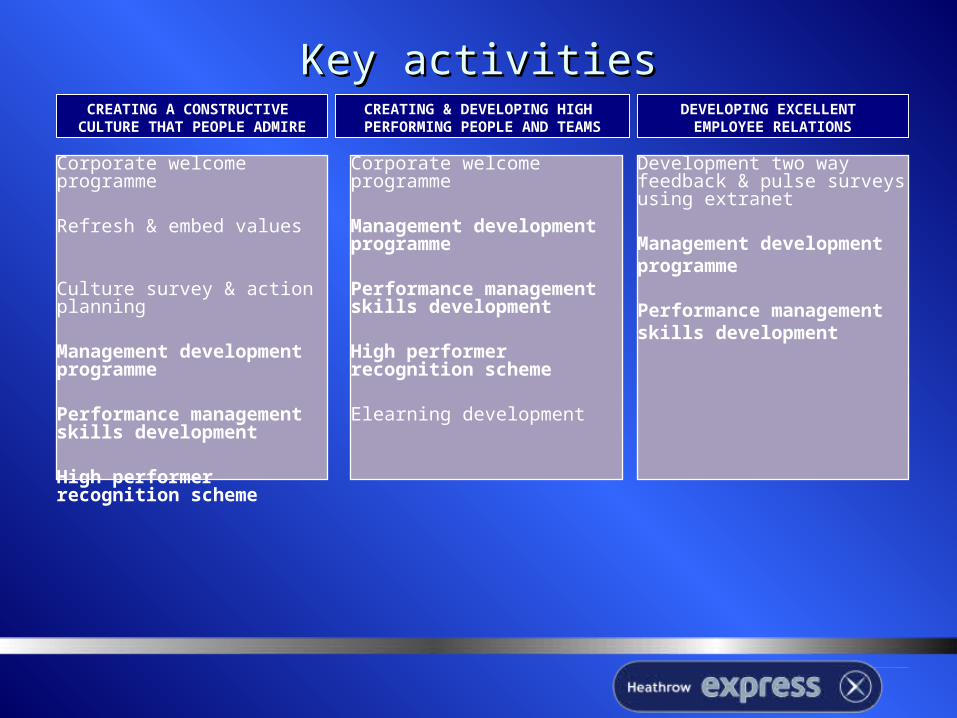
Key activitiesKey activitiesCREATING A CONSTRUCTIVE
CULTURE THAT PEOPLE ADMIRE
CREATING & DEVELOPING HIGH PERFORMING PEOPLE AND
TEAMS
DEVELOPING EXCELLENT EMPLOYEE RELATIONS
Corporate welcome programme
Refresh & embed values
Culture survey & action planning
Management development programme
Performance management skills development
High performer recognition scheme
Corporate welcome programme
Management development programme
Performance management skills development
High performer recognition scheme
Elearning development
Development two way feedback & pulse surveys using extranet
Management development programme
Performance management skills development
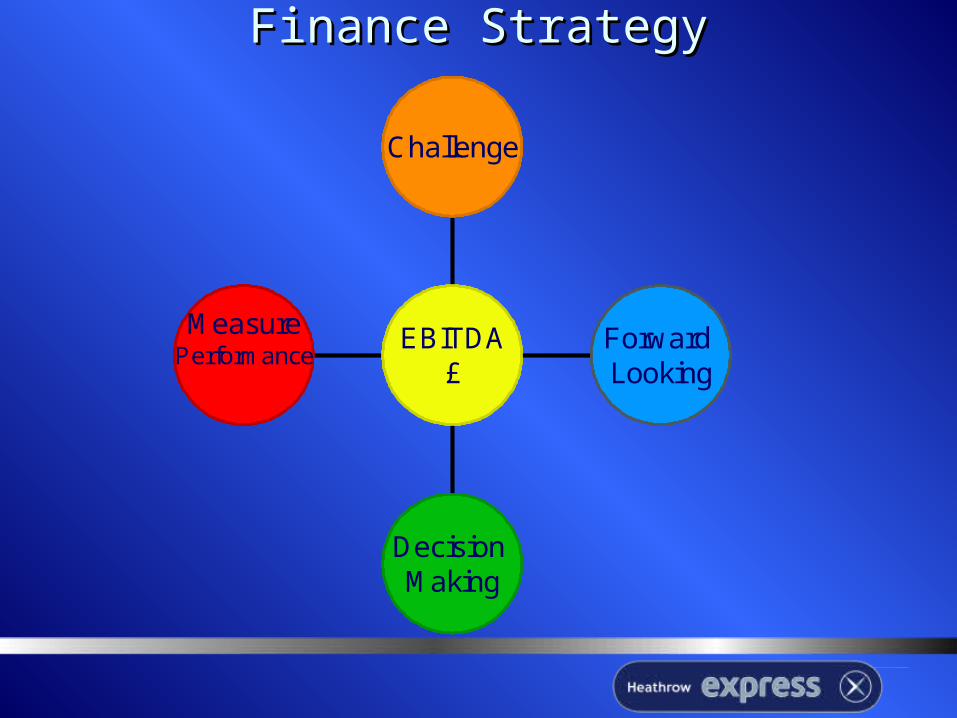
Finance StrategyFinance Strategy
MeasurePerformance
Decision Making
Forward Looking
Challenge
EBITDA£
MeasurePerformance
Decision Making
Forward Looking
Challenge
EBITDA£
Performance Systems Performance Systems &&
Top Line KPI’s Top Line KPI’s
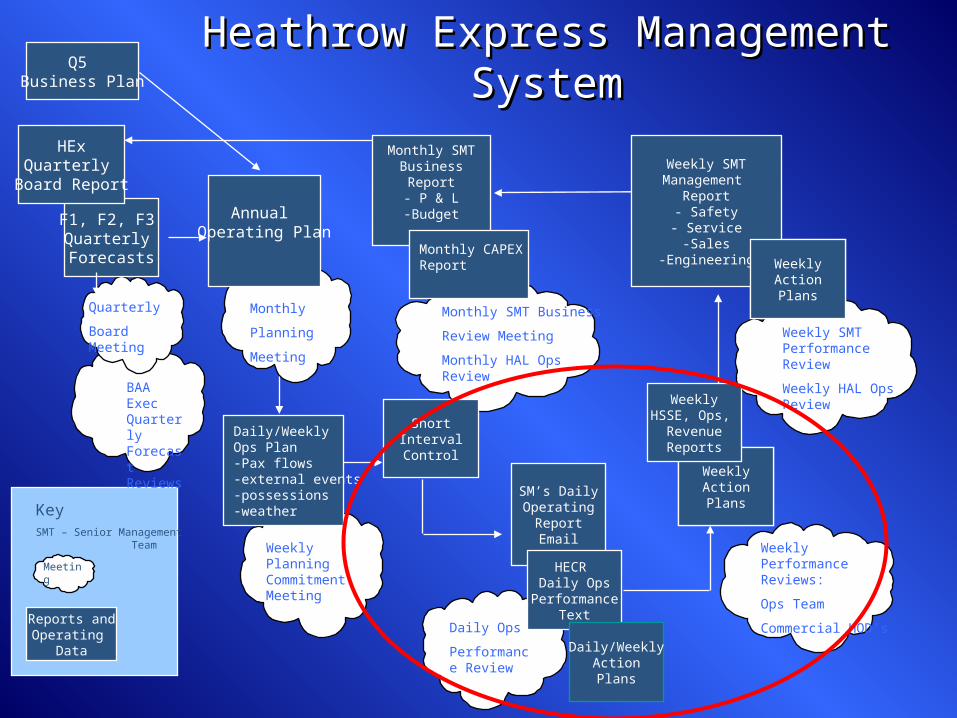
BAA Exec Quarterly Forecast Reviews
Weekly Performance Reviews:
Ops Team
Commercial HOD’s
WeeklyActionPlans
F1, F2, F3 Quarterly Forecasts
Annual Operating Plan
Daily/WeeklyOps Plan-Pax flows-external events-possessions-weather
ShortIntervalControl
SM’s DailyOperating
ReportEmail
HECR Daily Ops
PerformanceText
Daily/WeeklyActionPlans
WeeklyHSSE, Ops,
RevenueReports
Weekly SMTManagement
Report- Safety- Service
-Sales-Engineering
Monthly SMTBusinessReport- P & L-Budget
Quarterly
Board Meeting
Monthly
Planning
Meeting
Weekly Planning Commitment Meeting
Daily Ops
Performance Review
WeeklyActionPlans
KeySMT – Senior Management
Team
HExQuarterly
Board Report
Monthly CAPEXReport
Monthly SMT Business
Review Meeting
Monthly HAL Ops Review
Meeting
Reports andOperating
Data
Q5 Business Plan
Weekly SMT Performance Review
Weekly HAL Ops Review
Heathrow Express Management Heathrow Express Management SystemSystem

Top Level KPI’sTop Level KPI’s
EBITDAEBITDA ££
YieldYield £/pax£/pax
Modal ShareModal Share % airport & central london% airport & central london
Public Performance Measure (PPM)Public Performance Measure (PPM) % trains arriving 0-5mins % trains arriving 0-5mins
ReliabilityReliability % scheduled services run% scheduled services run
QSMQSM All aspects of customer experienceAll aspects of customer experience
AbsenceAbsence Annualised days/employeeAnnualised days/employee
FAWIFAWI Fatalities & Weighted Injuries indexFatalities & Weighted Injuries index
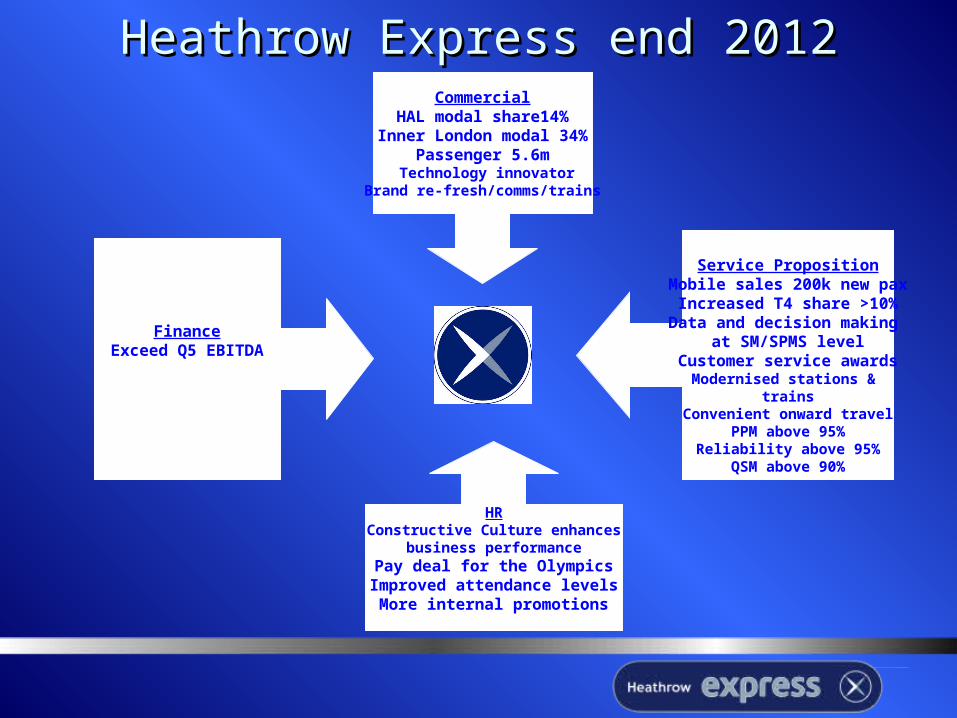
HRConstructive Culture enhances
business performancePay deal for the Olympics
Improved attendance levelsMore internal promotions
Heathrow Express end 2012Heathrow Express end 2012Commercial
HAL modal share14%Inner London modal 34%
Passenger 5.6m Technology innovator
Brand re-fresh/comms/trains
Service PropositionMobile sales 200k new paxIncreased T4 share >10%Data and decision making
at SM/SPMS levelCustomer service awards
Modernised stations & trains
Convenient onward travelPPM above 95%
Reliability above 95%QSM above 90%
FinanceExceed Q5 EBITDA

Management of Business Management of Business PartnersPartners
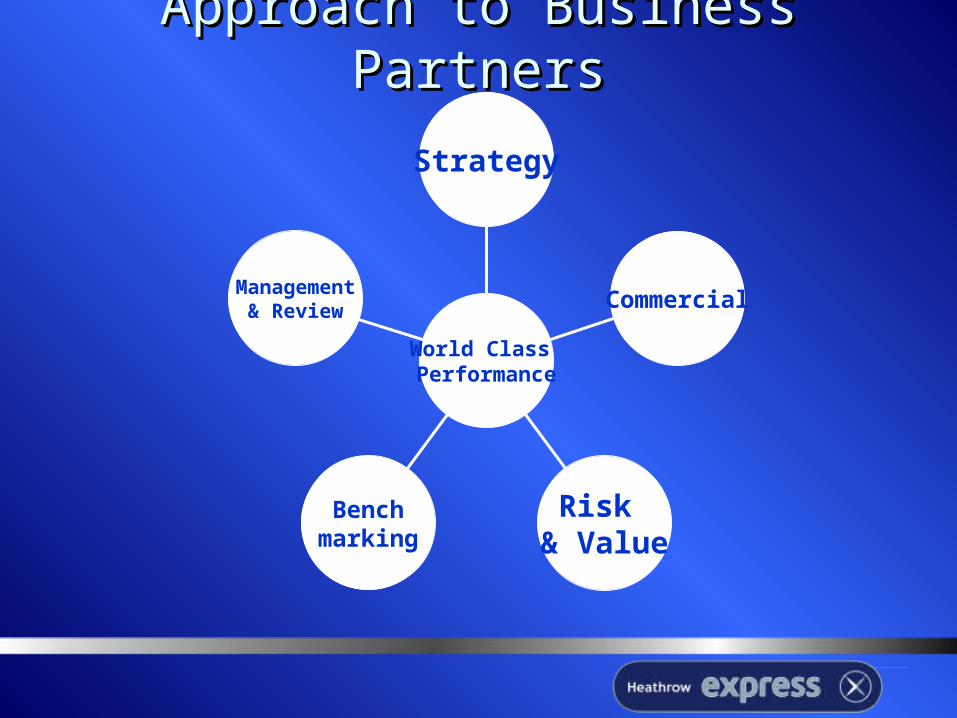
Approach to Business PartnersApproach to Business Partners
Management& Review
Benchmarking
Risk & Value
Commercial
Strategy
World Class Performance
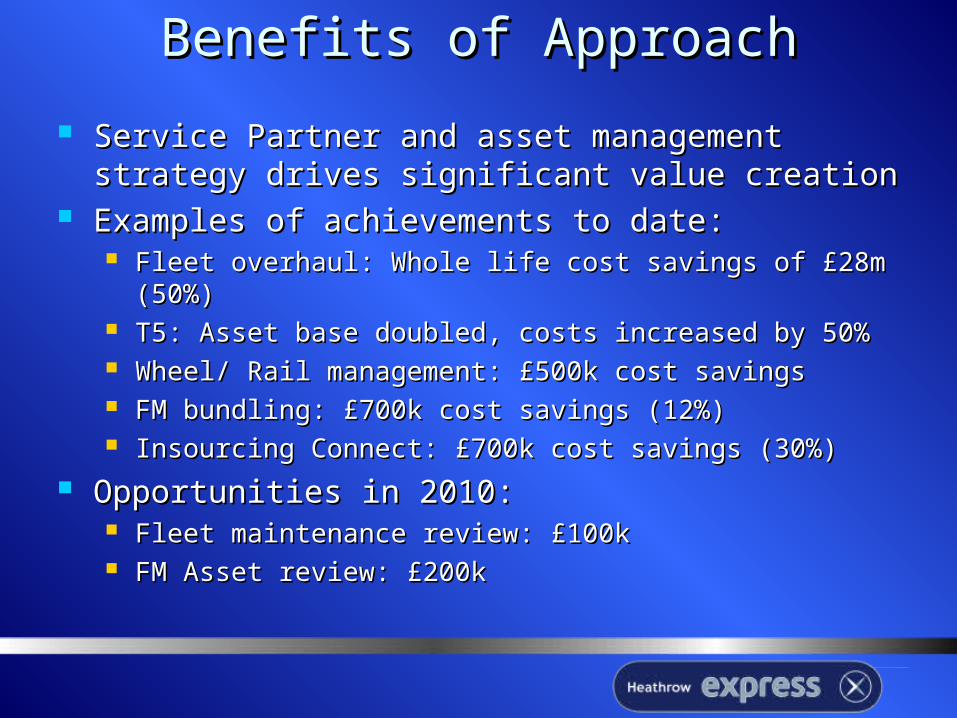
Benefits of ApproachBenefits of Approach
Service Partner and asset management strategy Service Partner and asset management strategy drives significant value creationdrives significant value creation
Examples of achievements to date:Examples of achievements to date: Fleet overhaul: Whole life cost savings of £28m (50%)Fleet overhaul: Whole life cost savings of £28m (50%) T5: Asset base doubled, costs increased by 50%T5: Asset base doubled, costs increased by 50% Wheel/ Rail management: £500k cost savingsWheel/ Rail management: £500k cost savings FM bundling: £700k cost savings (12%)FM bundling: £700k cost savings (12%) Insourcing Connect: £700k cost savings (30%)Insourcing Connect: £700k cost savings (30%)
Opportunities in 2010:Opportunities in 2010: Fleet maintenance review: £100kFleet maintenance review: £100k FM Asset review: £200k FM Asset review: £200k
BenchmarkingBenchmarking
Benchmarking carried out against comparable metro and heavy rail Benchmarking carried out against comparable metro and heavy rail systemssystems
maintenance costsmaintenance costs operating costsoperating costs revenue generationrevenue generation
Normalised against customer numbers and system size (km)Normalised against customer numbers and system size (km) Maintenance costs generally favourable although Fleet in upper Maintenance costs generally favourable although Fleet in upper
quartilequartile Operating costs generally favourable although staff costs per pax Operating costs generally favourable although staff costs per pax
higherhigher Disproportionately greater revenue generation from cost baseDisproportionately greater revenue generation from cost base => VALUE=> VALUE
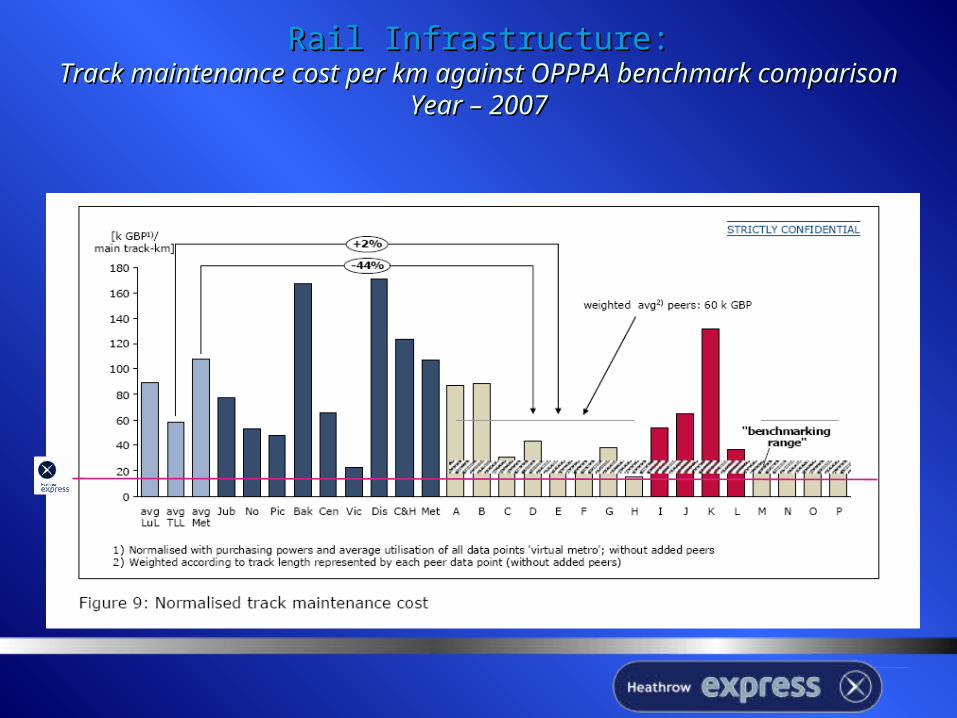
Rail Infrastructure:Rail Infrastructure:Track maintenance cost per km against OPPPA benchmark Track maintenance cost per km against OPPPA benchmark
comparison Year – 2007comparison Year – 2007
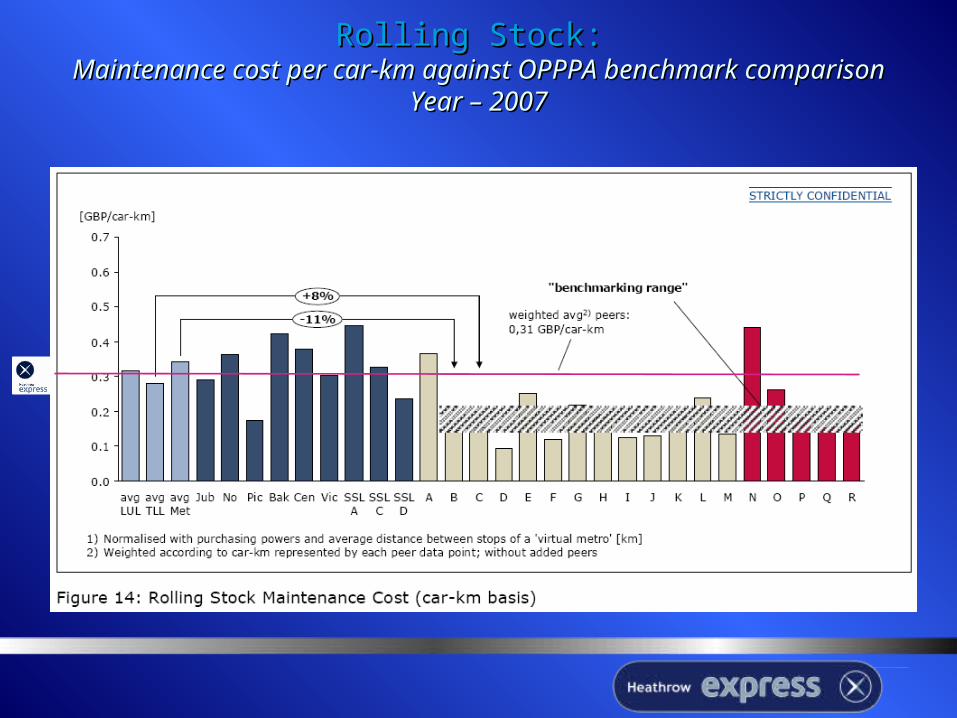
Rolling Stock:Rolling Stock: Maintenance cost per car-km against OPPPA benchmark Maintenance cost per car-km against OPPPA benchmark
comparison Year – 2007comparison Year – 2007
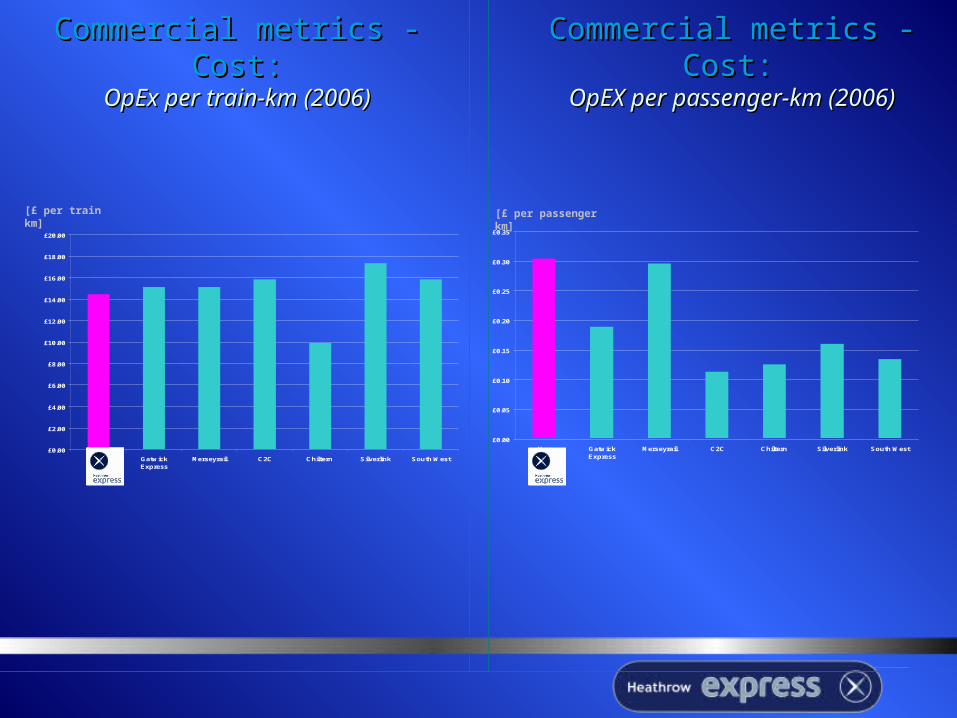
Commercial metrics - Commercial metrics - Cost:Cost:
OpEx per train-km (2006)OpEx per train-km (2006)
£0.00
£2.00
£4.00
£6.00
£8.00
£10.00
£12.00
£14.00
£16.00
£18.00
£20.00
Hex GatwickExpress
Merseyrail C2C Chiltern Silverlink South West
Commercial metrics - Cost:Commercial metrics - Cost: OpEX per passenger-km (2006)OpEX per passenger-km (2006)
£0.00
£0.05
£0.10
£0.15
£0.20
£0.25
£0.30
£0.35
Hex GatwickExpress
Merseyrail C2C Chiltern Silverlink South West
[£ per train km] [£ per passenger km]
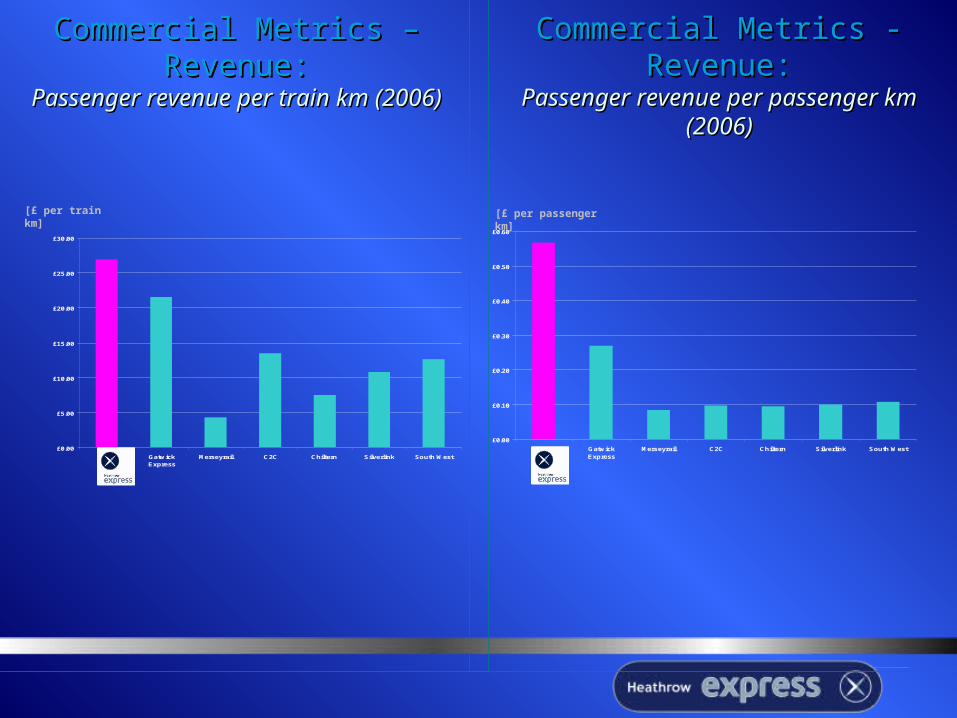
Commercial Metrics – Commercial Metrics – Revenue:Revenue:
Passenger revenue per train km Passenger revenue per train km (2006)(2006)
Commercial Metrics - Commercial Metrics - Revenue:Revenue:
Passenger revenue per passenger Passenger revenue per passenger km (2006)km (2006)
£0.00
£5.00
£10.00
£15.00
£20.00
£25.00
£30.00
Hex GatwickExpress
Merseyrail C2C Chiltern Silverlink South West
£0.00
£0.10
£0.20
£0.30
£0.40
£0.50
£0.60
Hex GatwickExpress
Merseyrail C2C Chiltern Silverlink South West
[£ per train km] [£ per passenger km]
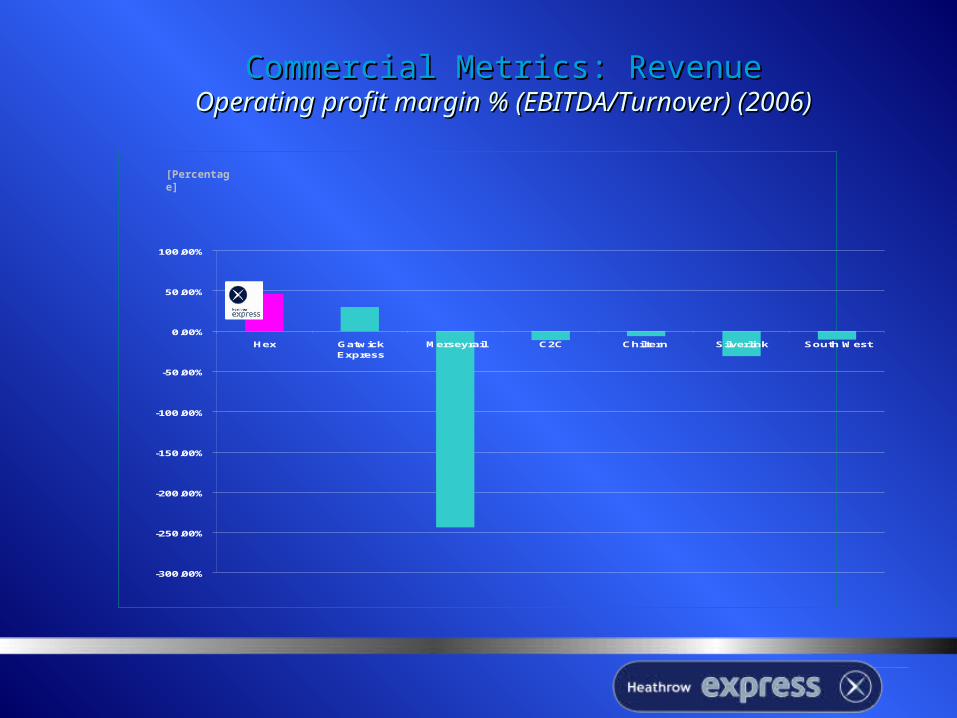
Commercial Metrics: RevenueCommercial Metrics: RevenueOperating profit margin % (EBITDA/Turnover) (2006)Operating profit margin % (EBITDA/Turnover) (2006)
-300.00%
-250.00%
-200.00%
-150.00%
-100.00%
-50.00%
0.00%
50.00%
100.00%
Hex GatwickExpress
Merseyrail C2C Chiltern Silverlink South West
[Percentage]
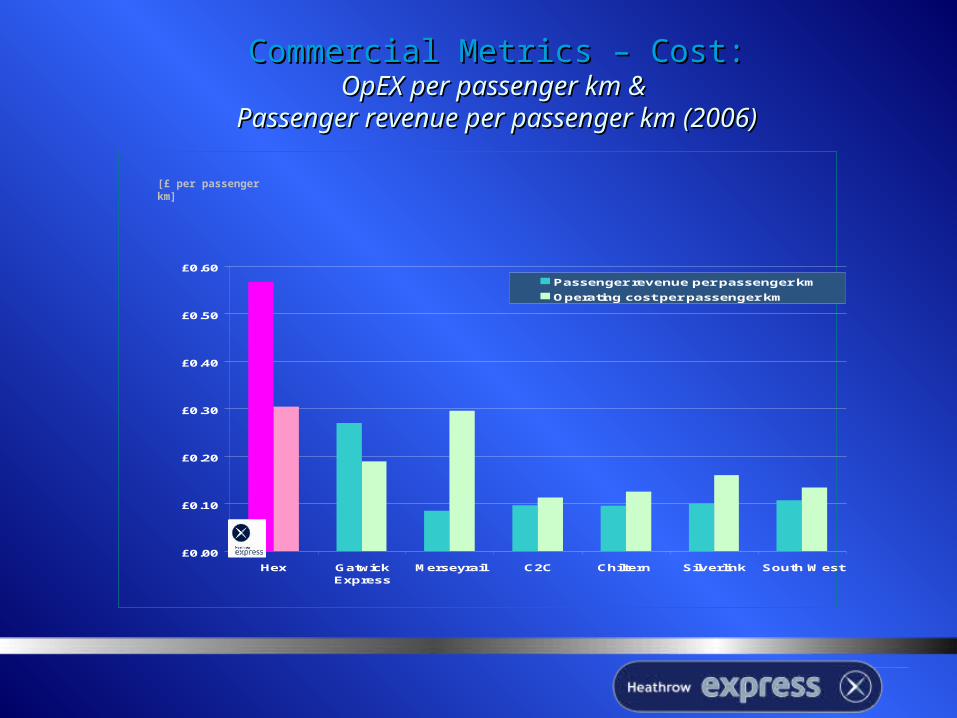
Commercial Metrics – Cost:Commercial Metrics – Cost:OpEX per passenger km & OpEX per passenger km &
Passenger revenue per passenger km (2006)Passenger revenue per passenger km (2006)
£0.00
£0.10
£0.20
£0.30
£0.40
£0.50
£0.60
Hex GatwickExpress
Merseyrail C2C Chiltern Silverlink South West
Passenger revenue per passenger km
Operating cost per passenger km
[£ per passenger km]

Asks from NCAsks from NC
Areas We Need SupportAreas We Need Support
HEx Commercial Agenda at LHRHEx Commercial Agenda at LHR WayfindingWayfinding Airside sellingAirside selling HAL ‘brand’HAL ‘brand’
CAPEX ProgramCAPEX Program Q5 programQ5 program Service modernisationService modernisation

EndEnd
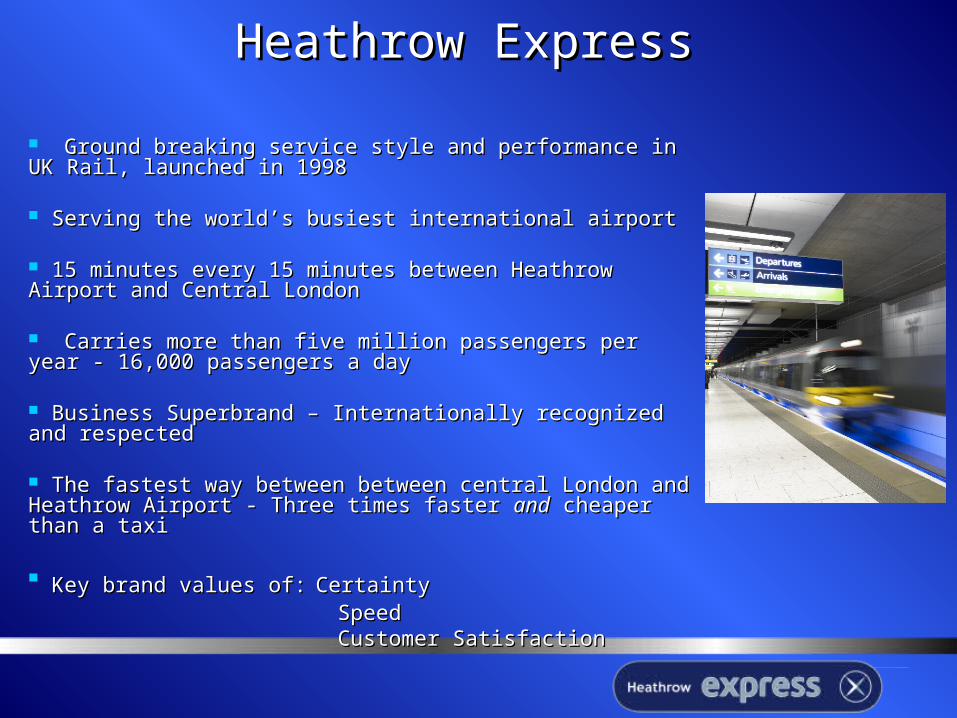
Heathrow Express Heathrow Express
Ground breaking service style and performance in UK Rail, Ground breaking service style and performance in UK Rail, launched in 1998launched in 1998
Serving the world’s busiest international airportServing the world’s busiest international airport
15 minutes every 15 minutes between Heathrow Airport and 15 minutes every 15 minutes between Heathrow Airport and Central LondonCentral London
Carries more than five million passengers per year - 16,000 Carries more than five million passengers per year - 16,000 passengers a day passengers a day
Business Superbrand – Internationally recognized and Business Superbrand – Internationally recognized and respected respected
The fastest way between between central London and The fastest way between between central London and Heathrow Airport - Three times faster Heathrow Airport - Three times faster andand cheaper than a taxi cheaper than a taxi
Key brand values of:Key brand values of: CertaintyCertaintySpeedSpeedCustomer SatisfactionCustomer Satisfaction
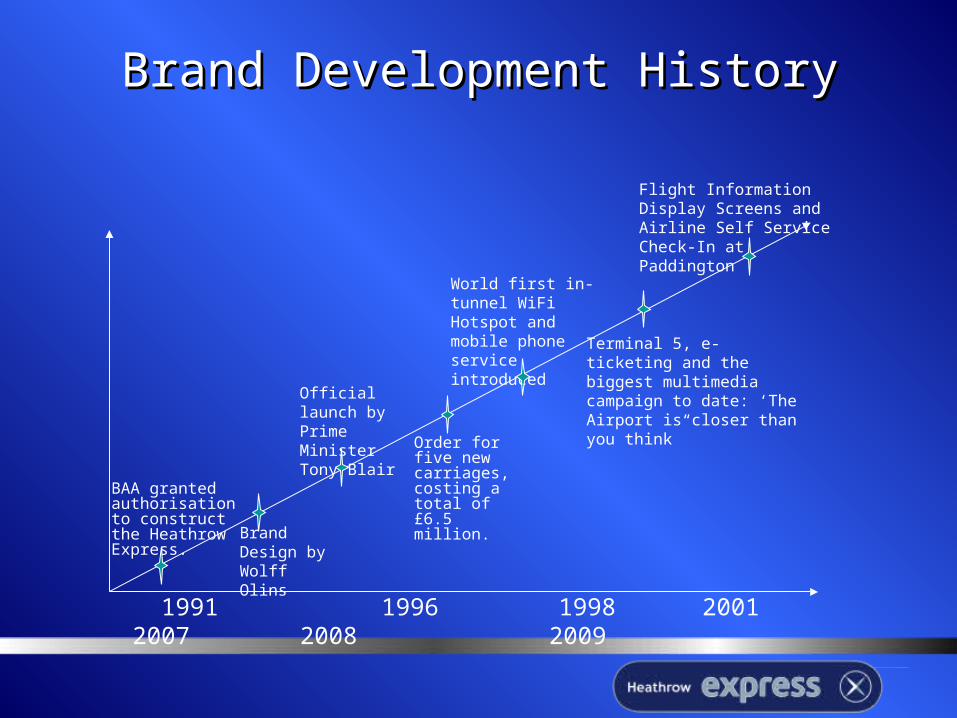
1991 1996 1998 2001 2007 2008 2009
Brand Design by Wolff Olins
BAA granted authorisation to construct the Heathrow Express.
Order for five new carriages, costing a total of £6.5 million.
Official launch by Prime Minister Tony Blair
World first in-tunnel WiFi Hotspot and mobile phone service introduced Terminal 5, e-ticketing and the
biggest multimedia campaign to date: ‘The Airport is closer than you think”
Flight Information Display Screens and Airline Self Service Check-In at Paddington
Brand Development HistoryBrand Development History
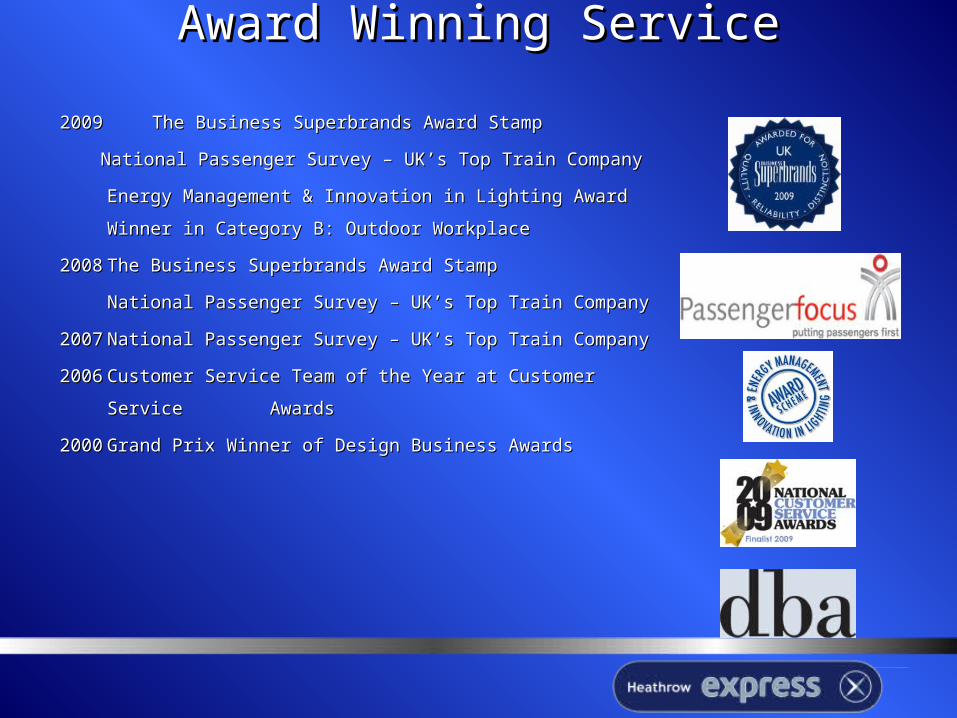
Award Winning ServiceAward Winning Service
20092009 The Business Superbrands Award StampThe Business Superbrands Award Stamp
National Passenger Survey – UK’s Top Train National Passenger Survey – UK’s Top Train
CompanyCompany
Energy Management & Innovation in Lighting Energy Management & Innovation in Lighting
AwardAward Winner in Category B: Outdoor WorkplaceWinner in Category B: Outdoor Workplace
20082008 The Business Superbrands Award StampThe Business Superbrands Award Stamp
National Passenger Survey – UK’s Top Train National Passenger Survey – UK’s Top Train
Company Company
20072007National Passenger Survey – UK’s Top Train CompanyNational Passenger Survey – UK’s Top Train Company
20062006 Customer Service Team of the Year at Customer Customer Service Team of the Year at Customer
Service Service AwardsAwards
20002000 Grand Prix Winner of Design Business AwardsGrand Prix Winner of Design Business Awards

Financial and Market OverviewFinancial and Market Overview
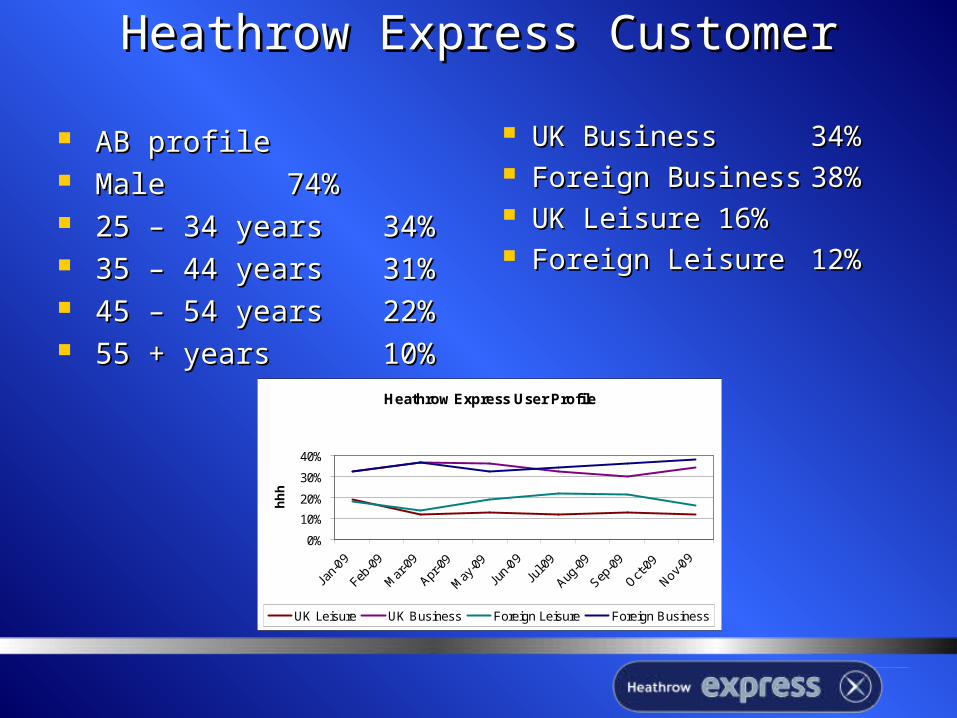
Heathrow Express CustomerHeathrow Express Customer
AB profileAB profile MaleMale 74%74% 25 – 34 years25 – 34 years 34% 34% 35 – 44 years35 – 44 years 31% 31% 45 – 54 years45 – 54 years 22%22% 55 + years55 + years 10%10%
UK BusinessUK Business 34%34% Foreign BusinessForeign Business
38%38% UK LeisureUK Leisure 16%16% Foreign LeisureForeign Leisure
12%12%
Heathrow Express User Profile
0%
10%
20%
30%
40%
Jan-
09
Feb-0
9
Mar
-09
Apr-0
9
May
-09
Jun-
09
Jul-0
9
Aug-0
9
Sep-0
9
Oct-09
Nov-09
hh
h
UK Leisure UK Business Foreign Leisure Foreign Business
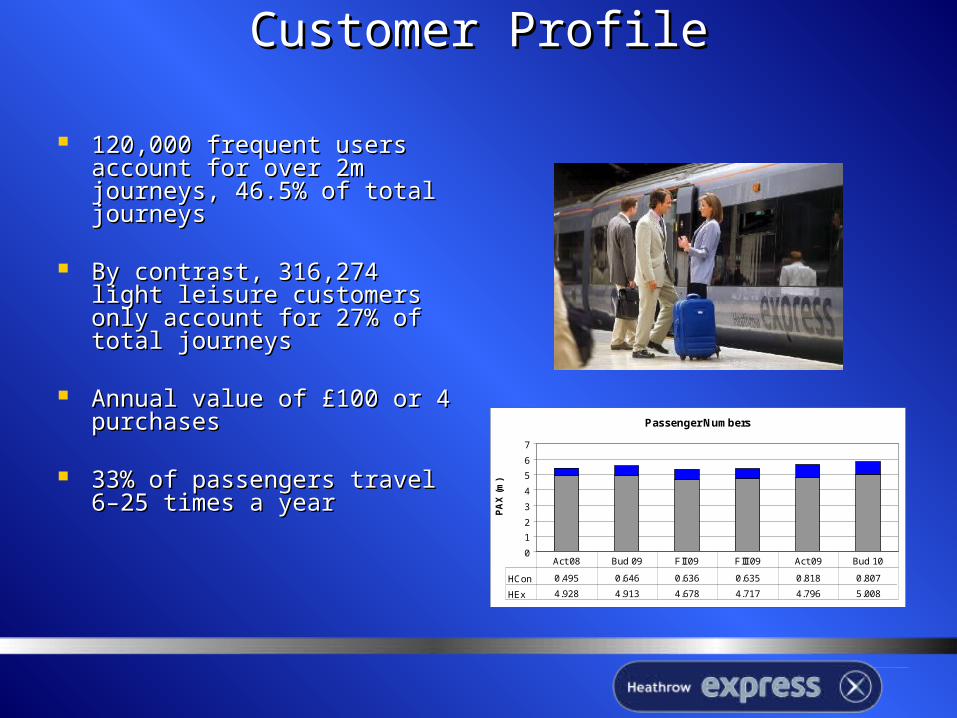
Customer ProfileCustomer Profile
120,000 frequent users 120,000 frequent users account for over 2m account for over 2m journeys, 46.5% of total journeys, 46.5% of total journeysjourneys
By contrast, 316,274 light By contrast, 316,274 light leisure customers only leisure customers only account for 27% of total account for 27% of total journeysjourneys
Annual value of £100 or 4 Annual value of £100 or 4 purchasespurchases
33% of passengers travel 6–33% of passengers travel 6–25 times a year25 times a year
Passenger Numbers
0
1
2
3
4
5
6
7
PA
X (
m)
HCon 0.495 0.646 0.636 0.635 0.818 0.807
HEx 4.928 4.913 4.678 4.717 4.796 5.008
Act 08 Bud 09 FII 09 FIII 09 Act 09 Bud 10
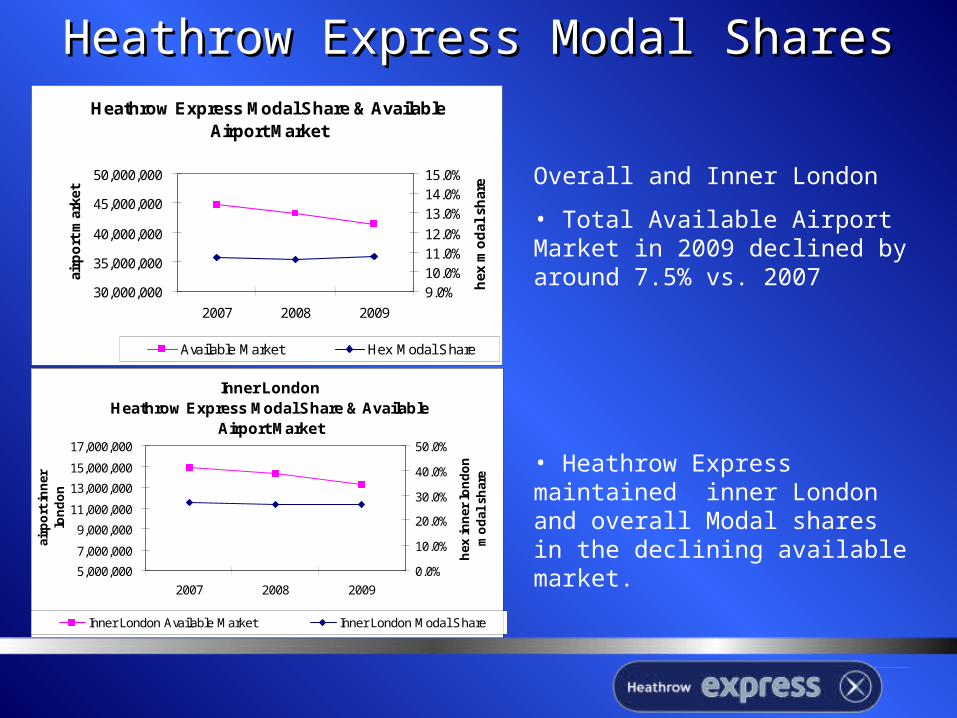
Heathrow Express Modal SharesHeathrow Express Modal SharesHeathrow Express Modal Share & Available
Airport Market
30,000,000
35,000,000
40,000,000
45,000,000
50,000,000
2007 2008 2009
airp
ort
mar
ket
9.0%10.0%11.0%12.0%
13.0%14.0%15.0%
hex
mo
dal
sh
are
Available Market Hex Modal Share
Overall and Inner London
• Total Available Airport Market in 2009 declined by around 7.5% vs. 2007
• Heathrow Express maintained inner London and overall Modal shares in the declining available market.
Inner LondonHeathrow Express Modal Share & Available
Airport Market
5,000,000
7,000,000
9,000,000
11,000,000
13,000,000
15,000,000
17,000,000
2007 2008 2009
airp
ort
in
ner
lo
nd
on
0.0%
10.0%
20.0%
30.0%
40.0%
50.0%
hex
in
ner
lo
nd
on
m
od
al s
har
e
Inner London Available Market Inner London Modal Share

Organisation and Strategy Organisation and Strategy
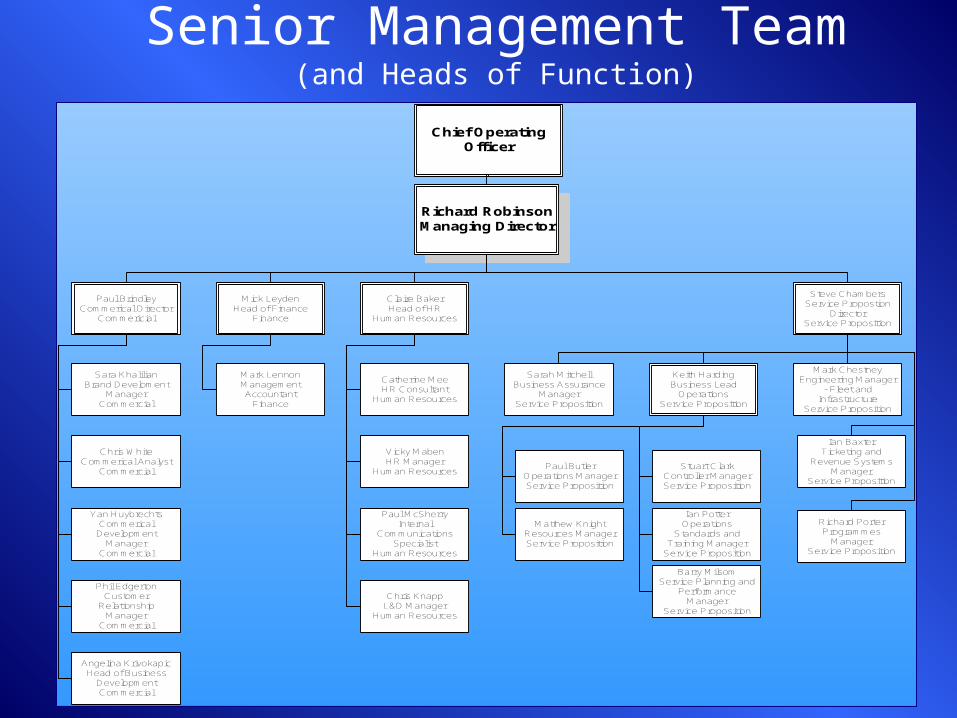
Senior Management Team(and Heads of Function)
Richard RobinsonManaging Director
Paul BrindleyCommerical Director
Commericial
Sara KhalilianBrand Develoment
ManagerCommercial
Chris WhiteCommerical Analyst
Commercial
Yan HuybrechtsCommerical
DevelopmentManager
Commercial
Phil EdgertonCustomer
RelationshipManager
Commercial
Angelina KrivokapicHead of Business
DevelopmentCommercial
Mick LeydenHead of Finance
Finance
Mark LennonManagementAccountant
Finance
Claire BakerHead of HR
Human Resources
Catherine MeeHR Consultant
Human Resources
Vicky MabenHR Manager
Human Resources
Paul McSherryInternal
CommunicationsSpecialist
Human Resources
Chris KnappL&D Manager
Human Resources
Steve ChambersService Propostion
DirectorService Proposition
Sarah MitchellBusiness Assurance
ManagerService Proposition
Keith HardingBusiness Lead
OperationsService Proposition
Stuart ClarkController ManagerService Proposition
Paul ButlerOperations ManagerService Proposition
Ian PotterOperations
Standards andTraining Manager
Service Proposition
Matthew KnightResources ManagerService Proposition
Barry MilsomService Planning and
PerformanceManager
Service Proposition
Mark ChestneyEngineering Manager
- Fleet andInfrastructure
Service Proposition
Richard PorterProgrammes
ManagerService Proposition
Ian BaxterTicketing and
Revenue SystemsManager
Service Proposition
Chief OperatingOfficer
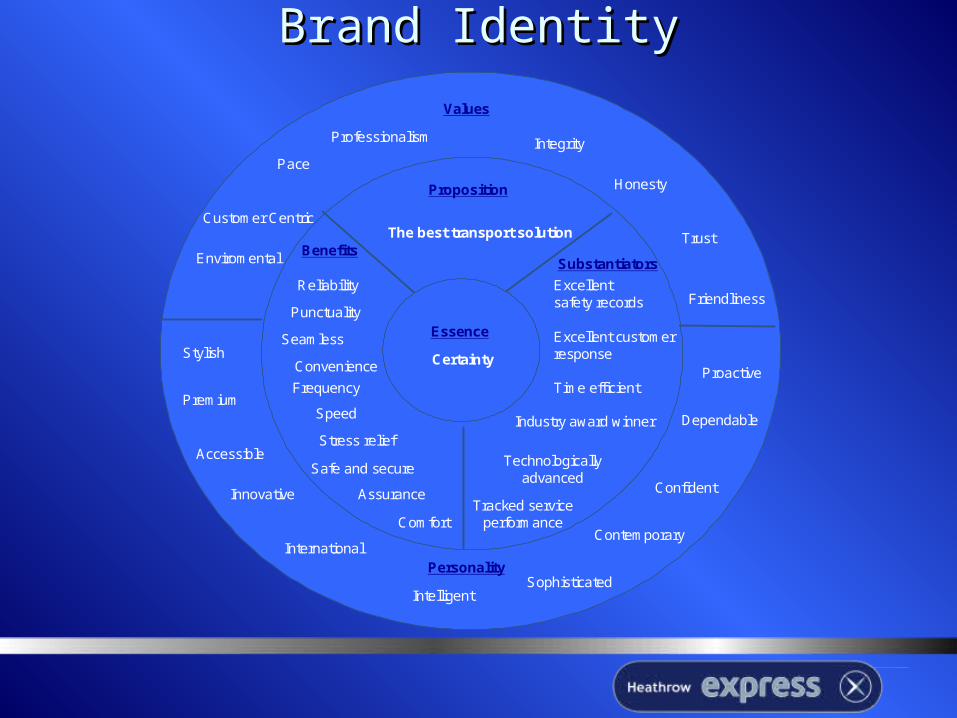
Values
Personality
Proposition
Frequency
Excellent safety records
BenefitsSubstantiators
Essence
Essence
Dependable
Accessible
Assurance
Convenience
Premium
International
Industry award winner
Intelligent
Technologically advanced
Pace
Innovative
ComfortTracked service
performance Contemporary
Stylish
Confident
Speed
Punctuality
Reliability
Excellent customer response
ProactiveTime efficient
Professionalism
Enviromental
Honesty
Integrity
Customer Centric
TrustThe best transport solution
Seamless
Safe and secure
Certainty
Stress relief
Sophisticated
Friendliness
Brand IdentityBrand Identity
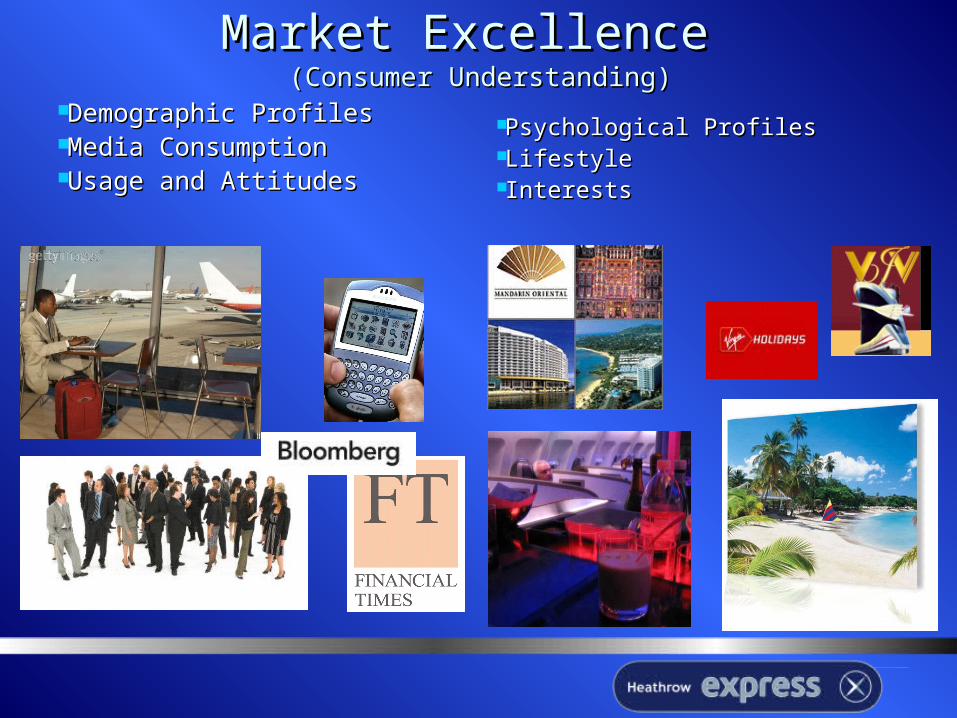
Market ExcellenceMarket Excellence (Consumer Understanding)(Consumer Understanding)
Demographic ProfilesDemographic ProfilesMedia ConsumptionMedia ConsumptionUsage and AttitudesUsage and Attitudes
Psychological ProfilesPsychological ProfilesLifestyleLifestyleInterestsInterests
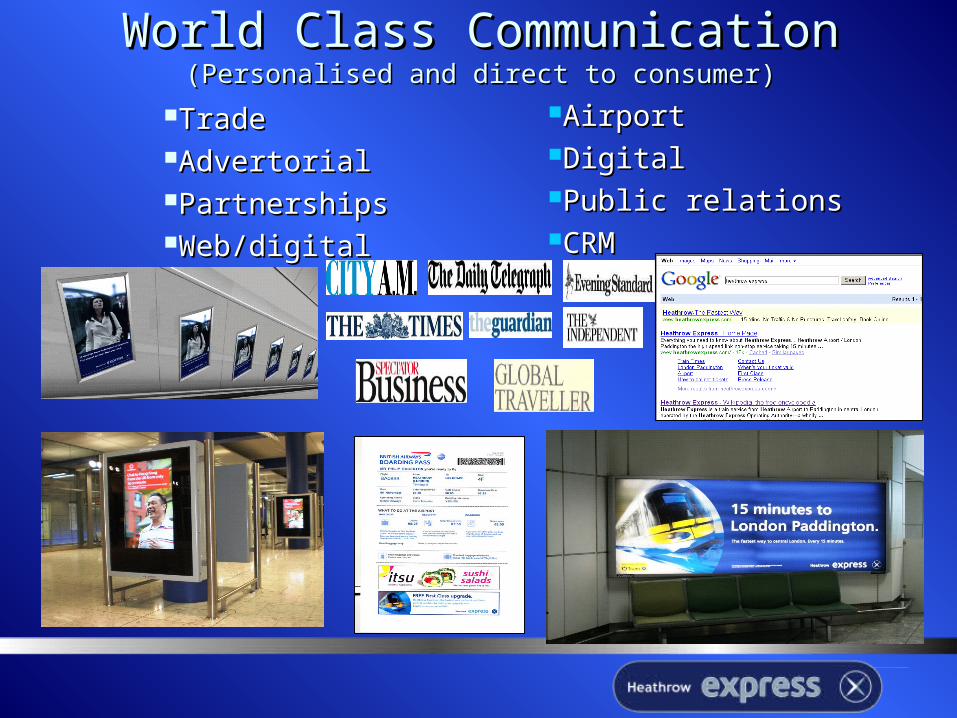
World Class CommunicationWorld Class Communication(Personalised and direct to consumer)(Personalised and direct to consumer)
TradeTradeAdvertorialAdvertorialPartnershipsPartnershipsWeb/digitalWeb/digital
AirportAirportDigitalDigitalPublic relationsPublic relationsCRMCRM
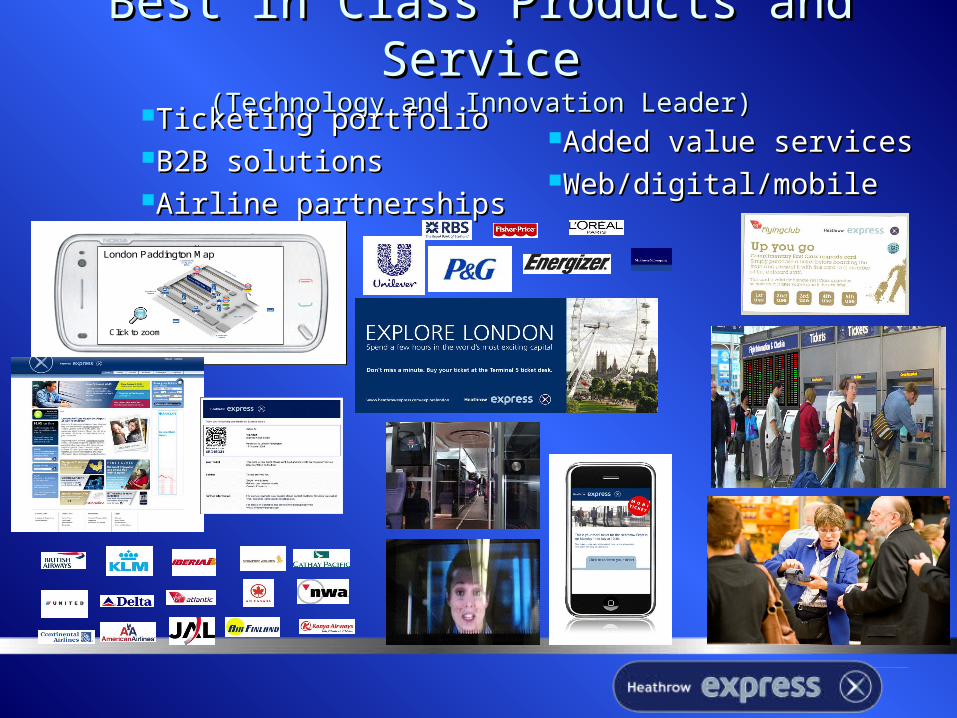
Best in Class Products and ServiceBest in Class Products and Service(Technology and Innovation Leader)(Technology and Innovation Leader)
Ticketing portfolioTicketing portfolioB2B solutionsB2B solutionsAirline partnershipsAirline partnerships
New
s
Exp
ress
Tix
Flig
htI
nfo
Cu
rren
t W
ea
ther
Lo
nd
on
Thin
gsT
oS
ee
Food
Sh
op
pin
gD
isco
unts
Exc
han
ge
TheT
ub
e
Cart
oo
ns
WorldS
port
Padd
ingto
n
New
s
Exp
ress
Tix
Flig
htI
nfo
Cu
rren
t W
ea
ther
Lo
nd
on
Thin
gsT
oS
ee
Food
Sh
op
pin
gD
isco
unts
Exc
han
ge
TheT
ub
e
Cart
oo
ns
WorldS
port
Padd
ingto
n
New
s
Exp
ress
Tix
Exp
ress
Tix
Flig
htI
nfo
Flig
htI
nfo
Cu
rren
t W
ea
ther
Lo
nd
on
Thin
gsT
oS
ee
Food
Sh
op
pin
gD
isco
unts
Exc
han
ge
TheT
ub
e
Cart
oo
ns
WorldS
port
Padd
ingto
n
L ondon P addington Map
C lick to zoom
Added value servicesAdded value servicesWeb/digital/mobileWeb/digital/mobile
Top Line KPI’s Top Line KPI’s &&
Performance SystemsPerformance Systems

BAA Exec Quarterly Forecast Reviews
Weekly Performance Reviews:
Ops Team
Commercial HOD’s
WeeklyActionPlans
F1, F2, F3 Quarterly Forecasts
Annual Operating Plan
Daily/WeeklyOps Plan-Pax flows-external events-possessions-weather
ShortIntervalControl
SM’s DailyOperating
ReportEmail
HECR Daily Ops
PerformanceText
Daily/WeeklyActionPlans
WeeklyHSSE, Ops,
RevenueReports
Weekly SMTManagement
Report- Safety- Service
-Sales-Engineering
Monthly SMTBusinessReport- P & L-Budget
Quarterly
Board Meeting
Monthly
Planning
Meeting
Weekly Planning Commitment Meeting
Daily Ops
Performance Review
WeeklyActionPlans
KeySMT – Senior Management
Team
HExQuarterly
Board Report
Monthly CAPEXReport
Monthly SMT Business
Review Meeting
Monthly HAL Ops Review
Meeting
Reports andOperating
Data
Q5 Business Plan
Weekly SMT Performance Review
Weekly HAL Ops Review
Heathrow Express Management Heathrow Express Management SystemSystem
Top Level KPI’sTop Level KPI’s
EBTIDAEBTIDA ££
YieldYield £/pax£/pax
Modal ShareModal Share % airport & central london% airport & central london
Public Performance Measure (PPM)Public Performance Measure (PPM) % trains arriving 0-5mins % trains arriving 0-5mins
ReliabilityReliability % scheduled services run% scheduled services run
QSMQSM All aspects of customer experienceAll aspects of customer experience
AbsenceAbsence Annualised days/employeeAnnualised days/employee
FAWIFAWI Fatalities & Weighted Injuries indexFatalities & Weighted Injuries index
Heathrow Express Public Performance Measure (PPM)
75%
80%
85%
90%
95%
100%
10 1112 13 1 2 3 4 5 6 7 8 9 10 1112 13 1 2 3 4 5 6 7 8 9 10 1112 13 1 2 3 4 5 6 7 8 9 10 1112 13 1 2 3 4 5 6 7 8 9 10 1112 13 1 2 3 4 5 6 7 8 9 10 1112 13 1 2 3Period4Period
5Period
6Period
7Period
8Period
9Period
10Period
11Period
12Period
13Period
1Period
2Period
3Period
4Period
5Period
6Period
7Period
8Period
9
02/03 03/04 04/05 05/06 05/06 06/07 06/07 07/08 07/08 08/09 09/10
HEX PPM HEX MAA Target PPM
Heathrow Express - Combined Customer Service QSM
65.00%
70.00%
75.00%
80.00%
85.00%
90.00%
95.00%
date
% o
f e
xc
ell
en
t a
nd
go
od
month exc info MAA
Heathrow Express Continuous Heathrow Express Continuous ImprovementImprovement
Heathrow Connect Continuous Heathrow Connect Continuous ImprovementImprovement
Heathrow Connect Public Performance Measure (PPM)
60%
65%
70%
75%
80%
85%
90%
95%
100%
3 4 5 6 7 8 9 10 11 12 13 1 2 3 4 5 6 7 8 9 10 11 12 13 1 2 3 4 5 6 7 8 9 10 11 12 13 1 2 3Period4
Period5Period
6Period
7Period
8Period
9Period
10Period
11Period
12Period
13Period
1Period
2Period
3Period
4Period
5Period
6Period
7Period
8Period
9
05/06 06/07 06/07 07/08 07/08 08/09 09/10
HEC PPM HEC MAA Target PPM

EndEnd
Service StrategyService Strategy
Fastest journey between Heathrow & Central London
HighestCertainty
BestService
BestQuality
MostConvenient
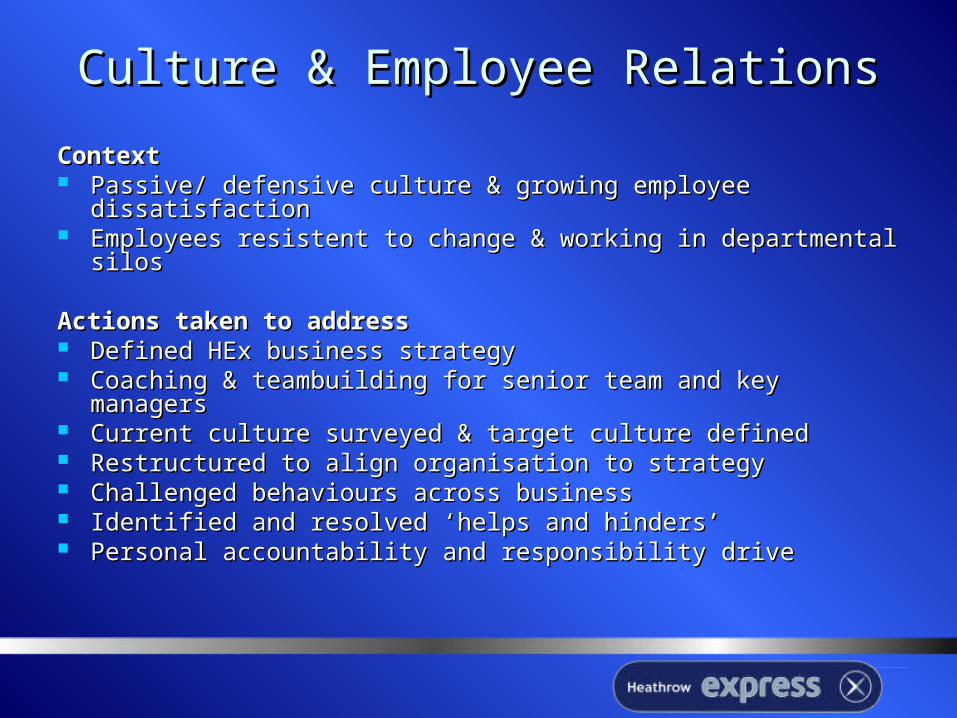
Culture & Employee RelationsCulture & Employee Relations
ContextContext Passive/ defensive culture & growing employee Passive/ defensive culture & growing employee
dissatisfactiondissatisfaction Employees resistent to change & working in departmental Employees resistent to change & working in departmental
silos silos
Actions taken to addressActions taken to address Defined HEx business strategyDefined HEx business strategy Coaching & teambuilding for senior team and key managersCoaching & teambuilding for senior team and key managers Current culture surveyed & target culture defined Current culture surveyed & target culture defined Restructured to align organisation to strategyRestructured to align organisation to strategy Challenged behaviours across businessChallenged behaviours across business Identified and resolved ‘helps and hinders’Identified and resolved ‘helps and hinders’ Personal accountability and responsibility drivePersonal accountability and responsibility drive
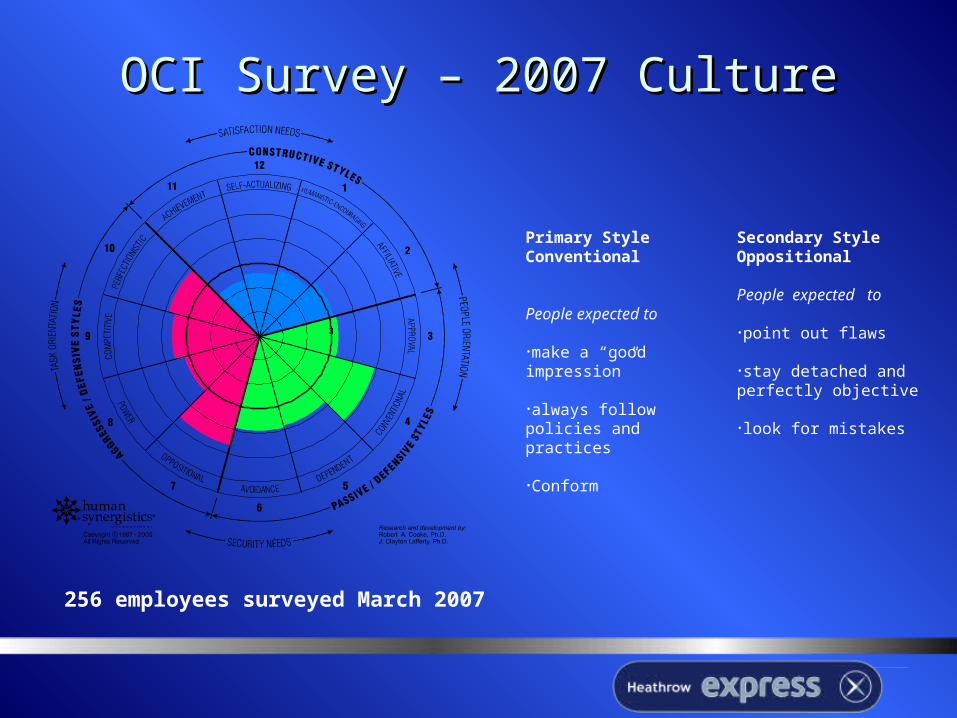
OCI Survey – 2007 CultureOCI Survey – 2007 Culture
256 employees surveyed March 2007
Primary StyleConventional
People expected to
•make a “good impression”
•always follow policies and practices
•Conform
Secondary Style Oppositional
People expected to
•point out flaws
•stay detached and perfectly objective
•look for mistakes

OCI Survey – Target CultureOCI Survey – Target Culture
Same employees surveyed March 2007
Constructive Culture Styles
Humanistic-Encouraging: Members are expected
to be supportive, constructive and open to influence
in dealing with others.
Affiliative: Members are expected to be friendly,
open and sensitive to the satisfaction of the work
group.
Achievement: Members are expected to setchallenging but realistic goals and solve
problemseffectively.
Self-actualising: Members are expected to gain
enjoyment from their work and produce high-quality
products/ services.
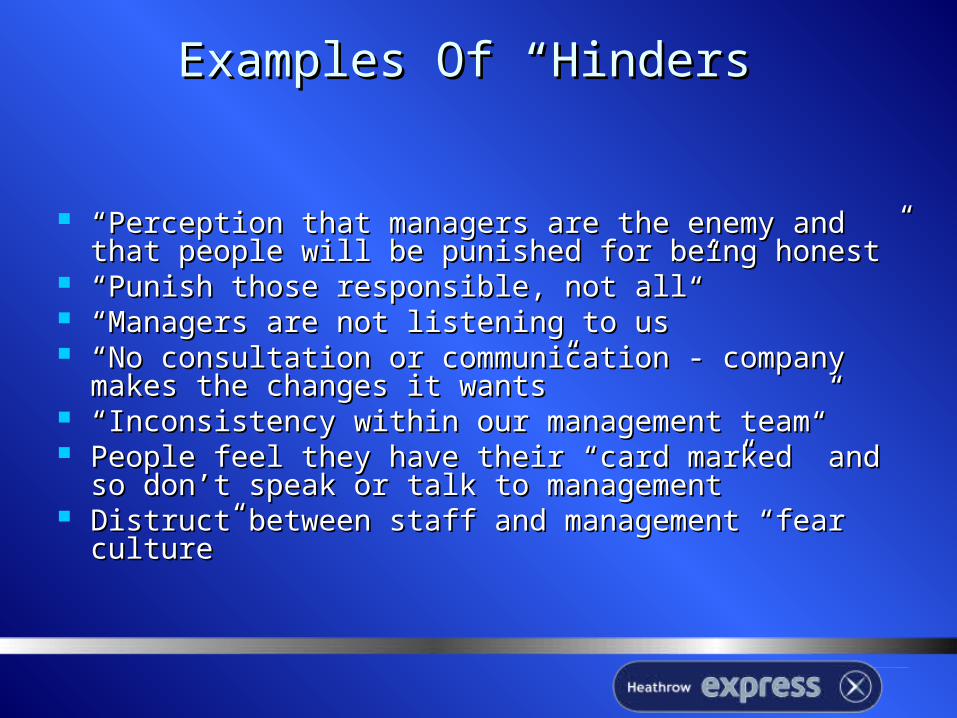
Examples Of “Hinders”Examples Of “Hinders”
““Perception that managers are the enemy and Perception that managers are the enemy and that people will be punished for being honest”that people will be punished for being honest”
““Punish those responsible, not all”Punish those responsible, not all” ““Managers are not listening to us”Managers are not listening to us” ““No consultation or communication - company No consultation or communication - company
makes the changes it wants”makes the changes it wants” ““Inconsistency within our management team”Inconsistency within our management team” People feel they have their “card marked” and so People feel they have their “card marked” and so
don’t speak or talk to management”don’t speak or talk to management” Distruct between staff and management “fear Distruct between staff and management “fear
culture”culture”
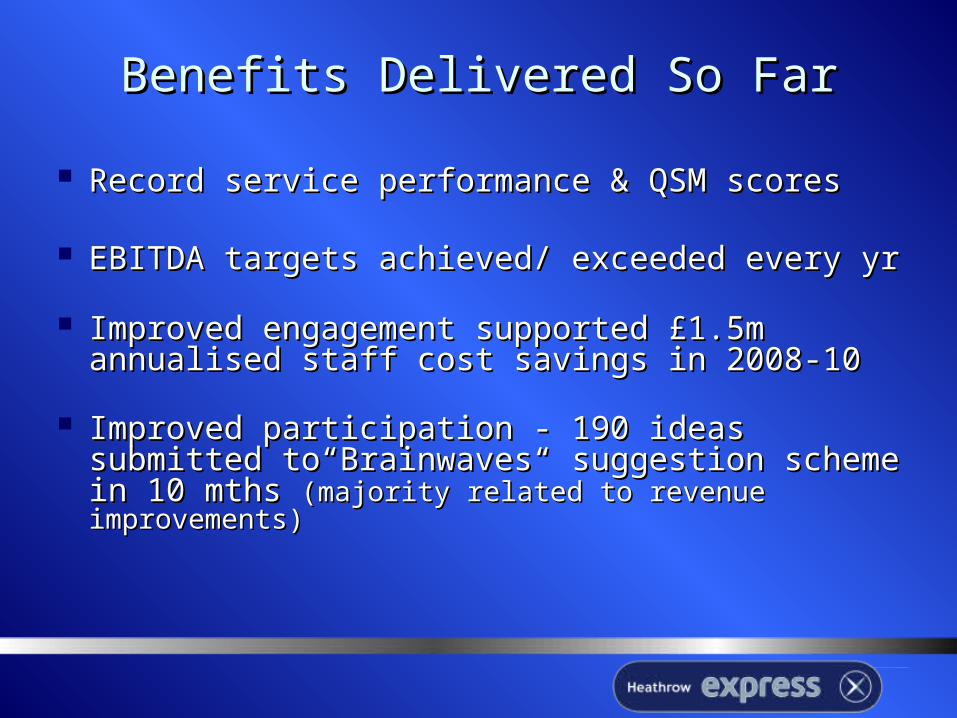
Benefits Delivered So FarBenefits Delivered So Far
Record service performance & QSM scores Record service performance & QSM scores
EBITDA targets achieved/ exceeded every yrEBITDA targets achieved/ exceeded every yr
Improved engagement supported £1.5m Improved engagement supported £1.5m annualised staff cost savings in 2008-10 annualised staff cost savings in 2008-10
Improved participation - 190 ideas submitted Improved participation - 190 ideas submitted to“Brainwaves“ suggestion scheme in 10 mths to“Brainwaves“ suggestion scheme in 10 mths (majority related to revenue improvements)(majority related to revenue improvements)
Current / Future ActivityCurrent / Future Activity
Refresh & embed values Refresh & embed values Corporate welcome programme Corporate welcome programme High performer recognition scheme High performer recognition scheme Development two way feedback & pulse Development two way feedback & pulse
surveys using new extranetsurveys using new extranet Culture re-survey Culture re-survey Management development programme Management development programme Performance management skills Performance management skills
development development


