25
This is the sole and exclusive property of HDFC Life HDFC Standard Life Insurance Company Limited Half year ended Sep 2011
| Date post: | 14-Apr-2018 |
| Category: |
Documents |
| Upload: | sukhpal-singh |
| View: | 226 times |
| Download: | 0 times |
7/27/2019 Hdfc Life q2 f3 Final
http://slidepdf.com/reader/full/hdfc-life-q2-f3-final 1/24
This is the sole and exclusive property of HDFC Life
HDFC Standard Life InsuranceCompany Limited
Half year ended Sep 2011

7/27/2019 Hdfc Life q2 f3 Final
http://slidepdf.com/reader/full/hdfc-life-q2-f3-final 2/24
9.7
13.910.3
1.8
2.0
3.4
14.0
19.426.9
0.6
0.6
1.1
H1 FY10 H1 FY11 H1 FY12
26.1
35.9
41.7
9%
-5%
35%
70%
-19%
37%
-7%
39%
9%
44%
16%
88%
38%
70%
-26%
Premium Income
2
` Bn
First Year Regular Premium(Individual)
Total Premium
Single Premium (Individual)
Renewal Premium (Individual)
Group Premium
• A growth of 16% in total premium at ` 41.7 billion in H1 FY12 led by single & renewal
premium
• Focus on persistency led to a 38% increase in renewal premium
• Group business has grown by 70% to ` 3.4 billion in H1 FY12, contributing 8.1% of
total premium
• De-growth of 26% in individual new business (regular premium) due to high base in
H1 FY 11 (pre new ULIP guidelines).However positive YoY growth seen in Sept. „11
7/27/2019 Hdfc Life q2 f3 Final
http://slidepdf.com/reader/full/hdfc-life-q2-f3-final 3/24
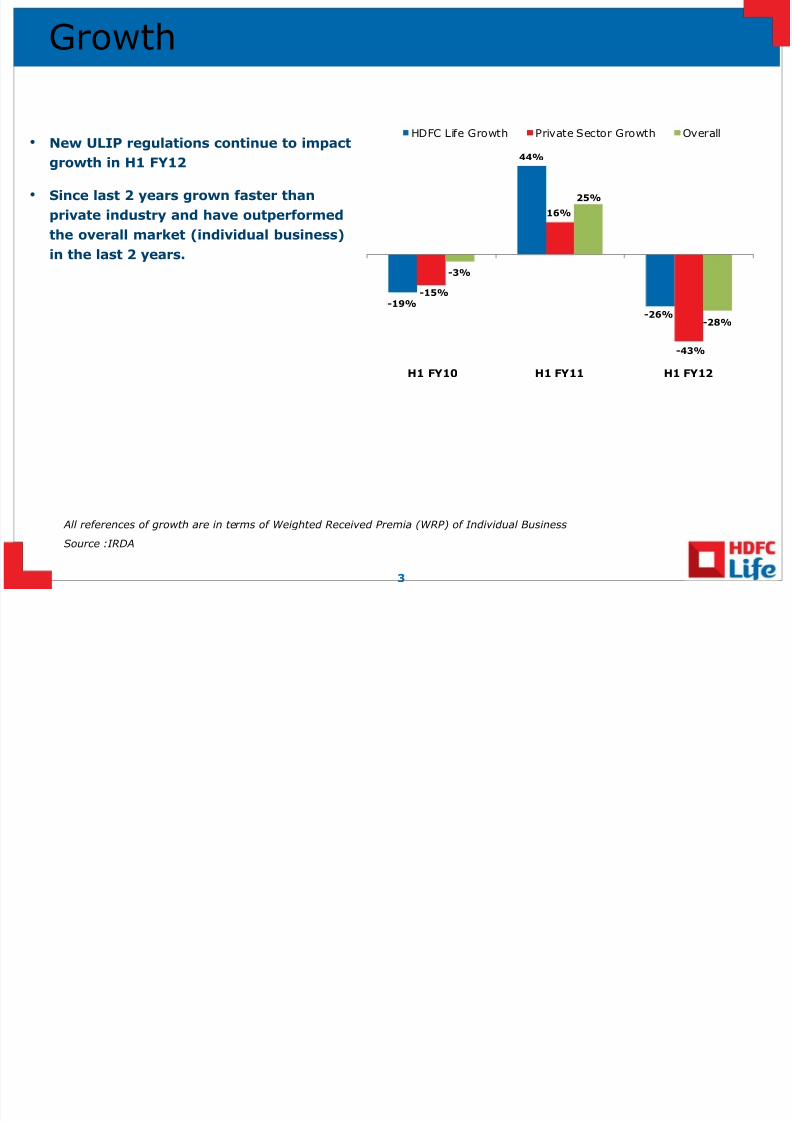
Growth
• New ULIP regulations continue to impact
growth in H1 FY12
• Since last 2 years grown faster than
private industry and have outperformed
the overall market (individual business)
in the last 2 years.
3
All references of growth are in terms of Weighted Received Premia (WRP) of Individual Business
Source :IRDA
-19%
44%
-26%
-15%
16%
-43%
-3%
25%
-28%
H1 FY10 H1 FY11 H1 FY12
HDFC Life Growth Private Sector Growth Overall
7/27/2019 Hdfc Life q2 f3 Final
http://slidepdf.com/reader/full/hdfc-life-q2-f3-final 4/24
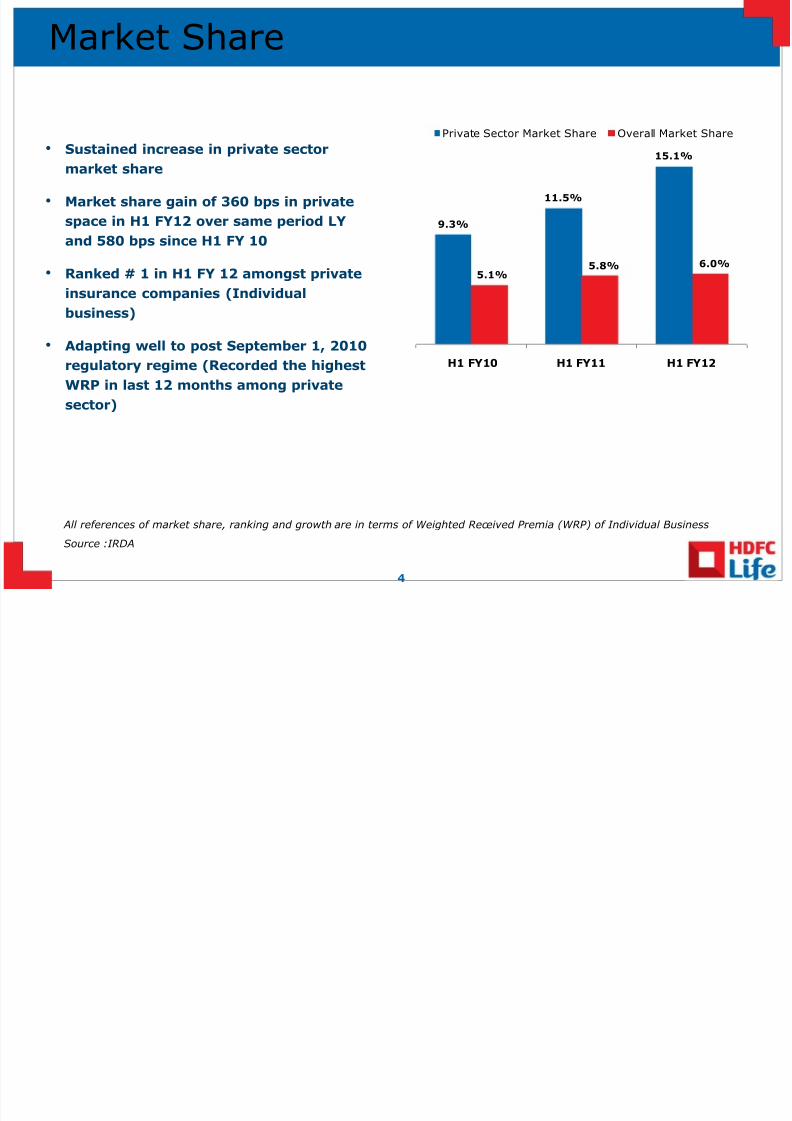
Market Share
• Sustained increase in private sector
market share
• Market share gain of 360 bps in private
space in H1 FY12 over same period LY
and 580 bps since H1 FY 10
• Ranked # 1 in H1 FY 12 amongst privateinsurance companies (Individual
business)
• Adapting well to post September 1, 2010
regulatory regime (Recorded the highest
WRP in last 12 months among private
sector)
All references of market share, ranking and growth are in terms of Weighted Received Premia (WRP) of Individual Business
Source :IRDA
4
9.3%
11.5%
15.1%
5.1%
5.8% 6.0%
H1 FY10 H1 FY11 H1 FY12
Private Sector Market Share Overall Market Share

7/27/2019 Hdfc Life q2 f3 Final
http://slidepdf.com/reader/full/hdfc-life-q2-f3-final 5/24
Distribution & Product Mix
5
35%
19%
62%
76%
2% 4%
H1 FY11 H1 FY12
Tied Agency Bancassurance Direct
89%
65%
11%
35%
H1 FY11 H1 FY12
ULIP Conventional
• Bancassuarance contribution has increased in H1 FY12 by 14%. Impact of new ULIP guideline
has been significantly negative for the agency channel across the industry
• Renewed focus on Direct distribution channel has lead to growth of 44% in the channel‟s EPI
• Par contribution in line with management strategy to keep it below 40%

7/27/2019 Hdfc Life q2 f3 Final
http://slidepdf.com/reader/full/hdfc-life-q2-f3-final 6/24
Commission Ratio
6
Commission % is equal to respective commission over respective premium
Commission % on H1 FY10 H1 FY11 H1 FY12
- First year premiums 16.0% 11.7% 15.3%
- Renewal premiums 2.9% 2.0% 1.7%
- Single premiums 0.4% 0.6% 0.7%
Total premiums 8.6% 6.2% 5.4%
• Reduction in overall commission as a proportion of total premium continues
• Increase in First Year commission due to increase in share of conventional products
7/27/2019 Hdfc Life q2 f3 Final
http://slidepdf.com/reader/full/hdfc-life-q2-f3-final 7/24
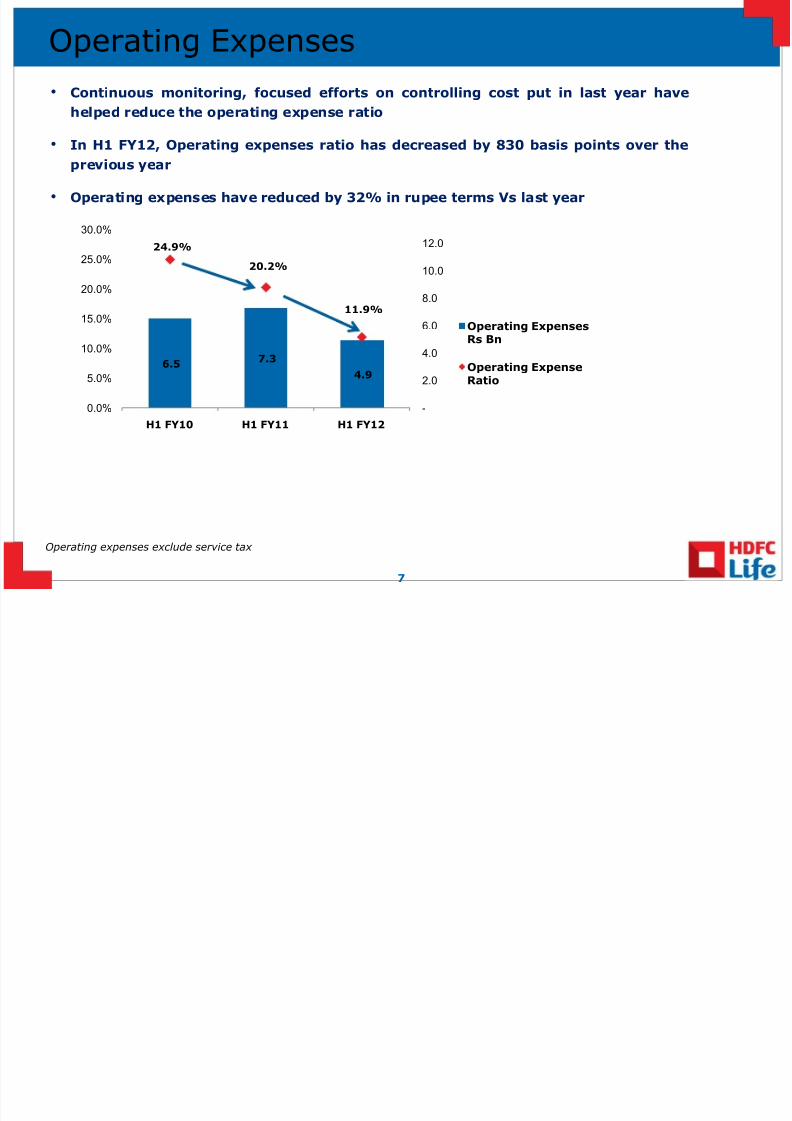
Operating Expenses
7
Operating expenses exclude service tax
• Continuous monitoring, focused efforts on controlling cost put in last year have
helped reduce the operating expense ratio
• In H1 FY12, Operating expenses ratio has decreased by 830 basis points over the
previous year
• Operating expenses have reduced by 32% in rupee terms Vs last year
6.57.3
4.9
24.9%
20.2%
11.9%
-
2.0
4.0
6.0
8.0
10.0
12.0
0.0%
5.0%
10.0%
15.0%
20.0%
25.0%
30.0%
H1 FY10 H1 FY11 H1 FY12
Operating ExpensesRs Bn
Operating ExpenseRatio

7/27/2019 Hdfc Life q2 f3 Final
http://slidepdf.com/reader/full/hdfc-life-q2-f3-final 8/24
Conservation Ratio
• Management strategy on persistency have helped maintain 80% plus conservation ratio
8
63%
81% 81%
H1 FY10 H1 FY11 H1 FY12
Conservation Ratio (Individual Business)
54%
77%80%
H1 FY10 H1 FY11 H1 FY12
13
th
month Persistency Ratio
The 13th month persistency ratio for H1 FY12 have been calculated based on data as on 31st Aug

7/27/2019 Hdfc Life q2 f3 Final
http://slidepdf.com/reader/full/hdfc-life-q2-f3-final 9/24
Indian GAAP Results
9
` Bn
(0.41)
(0.65)
0.21H1 FY10 H1 FY11 H1 FY12
• Positive trend profits continues in Q2 FY12 with ` 0.21 billion recorded in H1 FY12
• The back book has started generating sufficient profits to offset the new business
strain incurred on writing of new policies and this has resulted in improving the
Indian GAAP results

7/27/2019 Hdfc Life q2 f3 Final
http://slidepdf.com/reader/full/hdfc-life-q2-f3-final 10/24
Total Capital
10
Shareholding Pattern as at 30th Sept 2011 : HDFC 72.4%; Standard Life 26.0%; Individuals / ESOP Trust 1.6%
` Bn
• Capital infusion has scaled down over
the last 3 financial years with no
additions in the current fiscal
• Generation of surplus on existing
policies has reduced the need forcapital draw-downs
• Solvency Ratio as at 30th Sep 2011
was 183% as against a regulatory
requirement of 150%
17.96
19.71
21.60
H1 FY10 H1 FY11 H1 FY12
Closing Capital
7/27/2019 Hdfc Life q2 f3 Final
http://slidepdf.com/reader/full/hdfc-life-q2-f3-final 11/24
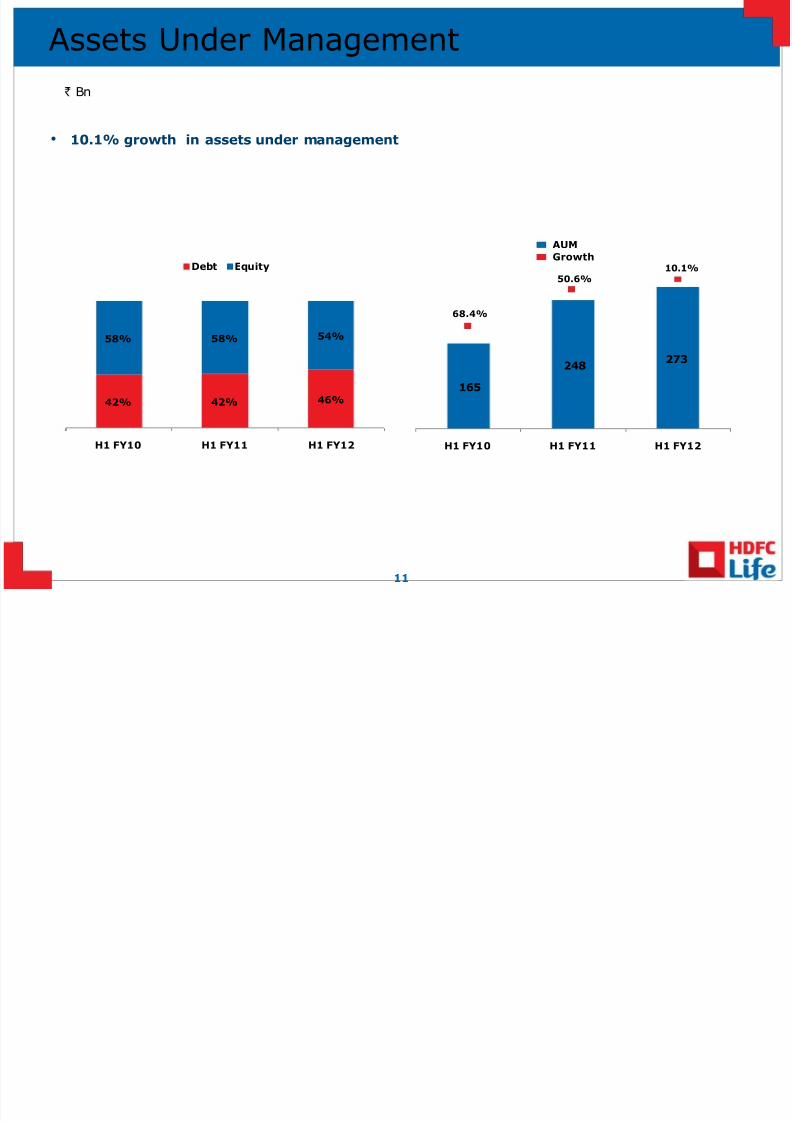
Assets Under Management
11
• 10.1% growth in assets under management
42% 42% 46%
58% 58% 54%
H1 FY10 H1 FY11 H1 FY12
Debt Equity
165
248273
H1 FY10 H1 FY11 H1 FY12
AUM
Growth
68.4%
50.6%
10.1%
` Bn
7/27/2019 Hdfc Life q2 f3 Final
http://slidepdf.com/reader/full/hdfc-life-q2-f3-final 12/24
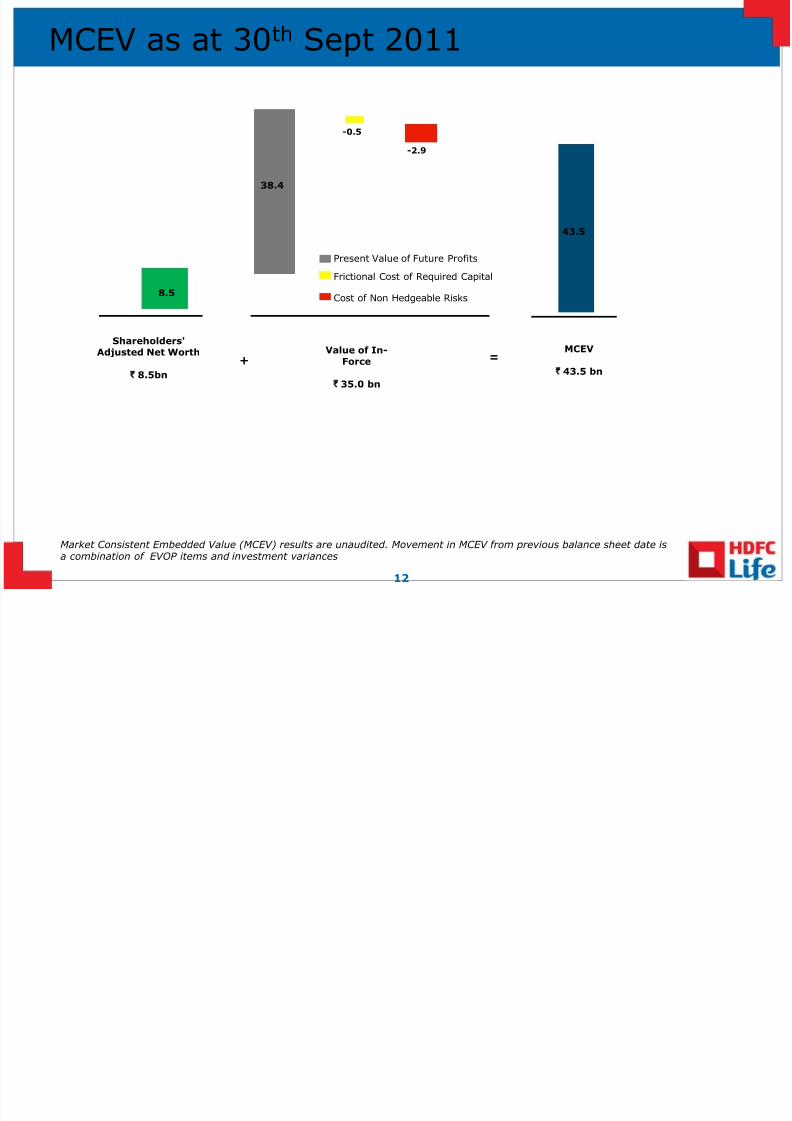
MCEV as at 30th Sept 2011
Market Consistent Embedded Value (MCEV) results are unaudited. Movement in MCEV from previous balance sheet date is
a combination of EVOP items and investment variances
12
43.5
8.5
38.4
-0.5
-2.9
Shareholders'
Adjusted Net Worth
` 8.5bn
+Value of In-
Force
` 35.0 bn
=MCEV
` 43.5 bn
Present Value of Future Profits
Frictional Cost of Required Capital
Cost of Non Hedgeable Risks
7/27/2019 Hdfc Life q2 f3 Final
http://slidepdf.com/reader/full/hdfc-life-q2-f3-final 13/2413
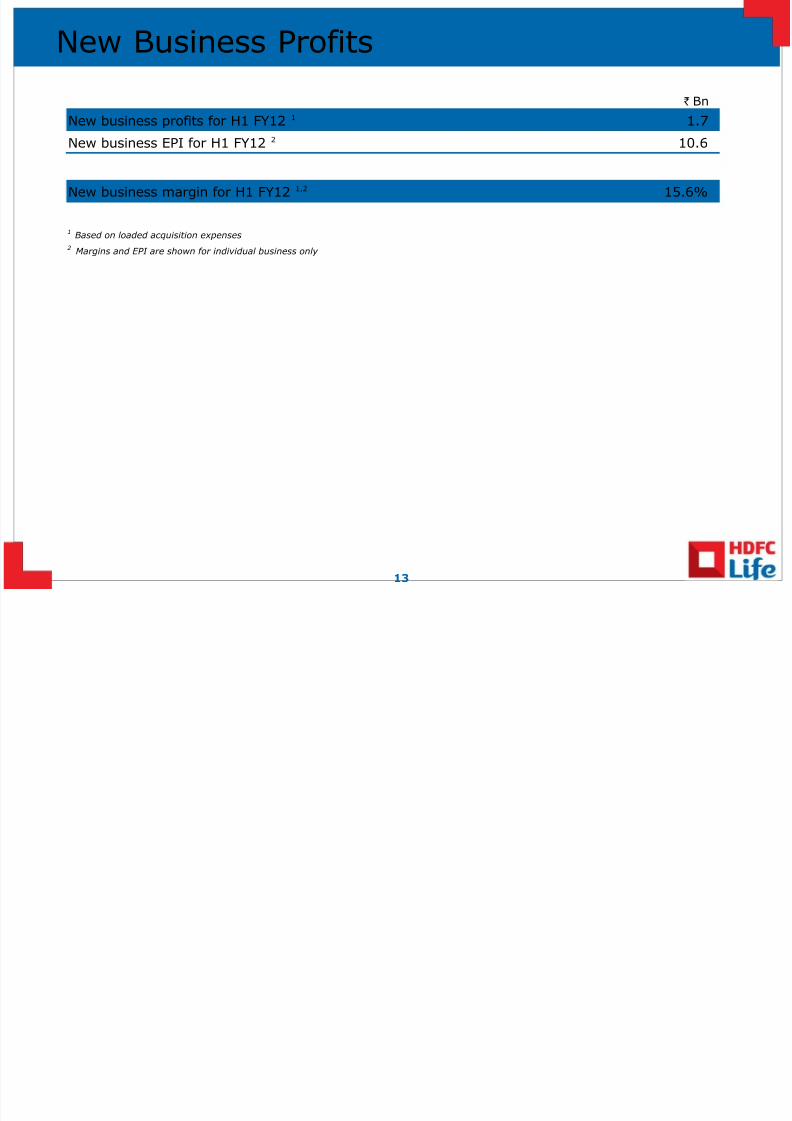
New Business Profits
` Bn
New business profits for H1 FY12 1 1.7
New business EPI for H1 FY12 2 10.6
New business margin for H1 FY12 1,2 15.6%
1Based on loaded acquisition expenses
2Margins and EPI are shown for individual business only

7/27/2019 Hdfc Life q2 f3 Final
http://slidepdf.com/reader/full/hdfc-life-q2-f3-final 14/24
Management Outlook
Business environment post the new regulatory regime (effective Sep 1, 2010) continued toimpact the industry growth in Q2‟12 given the baseline achievement in the similar period
o For Private players, individual business premium in WRP terms declined by 43% in H1’ 12 – HDFCLife ranked No.1 in the half year ended Sept’ 11
o HDFC Life years to 15% month on month market share amongst private players has nearly doubledover the last 1.5 years
o Strong renewal premium growth during the quarter – YTD growth of 36%
o Cost and Efficiency initiatives put in place in FY’ 11 leading to better expense management
o Contribution of traditional plans to the business mix has increased; reversal of some of theguidelines on Pension products would be a positive
Bancassurance channel will increase its contribution to the new business written.
o Competitive action to gain Bank distribution through offering equity stake or strategic tie-ups seenthrough deals between banks and insurers
o HDFC Life is preparing for the likely multi-tie scenario through a 3 pronged approach of fortifying
existing relationships, diversifying distribution mix and being a partner of choice. A cross-functionalprogramme is underway to address these challenges
The channel transformation program roll out across the tied agency channel is complete andthe benefits expected to accrue in H2‟12
Processes introduced to improve customer service metrics and persistency
14

7/27/2019 Hdfc Life q2 f3 Final
http://slidepdf.com/reader/full/hdfc-life-q2-f3-final 15/24
Awards and Accolades
15
Best Companies to Work for in India in 2011Adjudged as one of the Best Companies to Work for in India in 2011, for the second
consecutive year. The company ranked first in the insurance category. The study hasshown that HDFC Life does a great job in its rewards and recognition programs withnumerous events and celebrations to recognize employee contribution. HDFC Lifealso provides various self developmental and professional growth opportunities forall employees. More than 470 companies participated in the study, making it thelargest such study in India.
Indian Insurance Awards 2011
Won the 'Best Product Innovation Award 2011 - Life Insurance' for the product'HDFC SL Crest' at the Indian Insurance Awards 2011. HDFC SL Crest has been atrendsetting innovation in the market, which has made HDFC Life the winner of theaward.
CISO 100 Awards 2011Awarded the Top 100 CISO Awards 2011, for demonstrating outstandingperformance in information security and technology practices. HDFC Life's Chief
Information Security Officer (CISO) - Sharad Sadadekar, was recognized amongstthe Top 100 CISOs, for implementing one of the best Information Security practicesamongst Indian companies. The 'Top 100 CISO Awards' recognizes executives whohave demonstrated outstanding initiatives in using information security practicesand technology to secure their business and mission critical information in the mosteffective manner and deliver business value.
7/27/2019 Hdfc Life q2 f3 Final
http://slidepdf.com/reader/full/hdfc-life-q2-f3-final 16/24
Awards and Accolades
16
CIO 100 2011 AwardSelected as an honoree for CIO magazine’s 24th annual CIO 100 Awards. Chosen as
one of 100 innovative organizations that uses IT effectively to create business valueby creating competitive advantage, optimizing business processes, enabling growthand improving relationships with customers.
Asia Best Employer Brand Awards 2011Received 5 awards across diverse categories in Asia's Best Employer Brand Awards
in the CMO Asia Awards for Excellence in Branding and Marketing. The awardcategories that HDFC Life has won are: Young HR Professional of the Year, TalentManagement, Best HR Strategy in Line with Business, Innovation in Recruitmentand Brand Leadership Award For Excellence in Branding and Marketing.
Yuva Hero Award
Received Yuva Hero Award from the NGO – Yuva Unstoppable – for contributiontowards upliftment of lesser privileged children. Yuva Unstoppable is a premiervolunteer movement with a force of 60,000 young people across 30 cities of Indiahelping more than 100,000 kids in municipal schools / slums through organizationalpartnerships with schools, colleges and corporate companies.
7/27/2019 Hdfc Life q2 f3 Final
http://slidepdf.com/reader/full/hdfc-life-q2-f3-final 17/24
Awards and Accolades
17
Best Marketing Strategy - Asian Leadership Awards
The Asian Leadership Awards is about Achievers, Super Achievers and Future Business Leaders. It
recognizes and rewards their ability to steer their businesses through turbulent times, applying the
best of business modules to manage and keep their missions afloat.
Innovation in CRM award
Conferred the prestigious Innovation in CRM award by IDC Financial Insights at its inaugural
Financial Insights Innovation Awards (FIIA) â €“ Insurance or FIIA (Insurance) held at the Asian
Insurance Congress (AFS) in Singapore. HDFC Life's initiative was among the 68 high-quality
entries submitted for this award by leading insurers across the Asia Pacific (excluding Japan). HDFC
Life won this award for its Customer renewal & Retention System MINT.
India’s Most Trusted Service Brand 2011
Ranked India's Most Trusted Private Life Insurance Brand in 2011 in a survey conducted by
Economic Times-Brand Equity and the Nielsen Company.
Golden Peacock HR Excellence Award
Received the Golden Peacock HR ExcellenceAward’
for the year 2011 in the 'Banking Financial &Insurance Sector.’ This award acknowledges HDFC Life’s efforts towards innovative people
management processes and talent engagement and development initiatives in the highly dynamic
Indian life insurance industry.

7/27/2019 Hdfc Life q2 f3 Final
http://slidepdf.com/reader/full/hdfc-life-q2-f3-final 18/2418
Appendix & Glossary

7/27/2019 Hdfc Life q2 f3 Final
http://slidepdf.com/reader/full/hdfc-life-q2-f3-final 19/24
Appendix 1 : MCEV methodology and approach
MCEV methodology
The calculations of embedded value and new business profits have been performed using a market consistentembedded value (“MCEV”) approach. This approach differs from a traditional EV approach primarily in respect of theway in which allowance for risk is made.
Within the traditional EV approach allowance is made for risk through an increase in the risk discount rate used tovalue future shareholder cash flows, whilst within the MCEV calculation explicit separate allowances are made forrisk.
Components of MCEV
There are two components to the MCEV:
1. Shareholders‟ adjusted net worth –this component represents the market value of assets attributable toshareholders. This amount is derived from the Indian GAAP balance sheet adjusted to allow for assets on a marketvalue basis, elimination of intangible assets and to allow for shareholder attributable assets or liabilities residingwithin the unit-linked and non par policyholder funds.
2.Value of in-force –this component represents the discounted value of after tax shareholder attributablecashflows expected on the business as at the valuation date. No allowance is made for future new business. This
amount has been adjusted to deduct allowances for non hedgeable risk, frictional costs of required capital and thetime value associated with financial options and guarantees
19
7/27/2019 Hdfc Life q2 f3 Final
http://slidepdf.com/reader/full/hdfc-life-q2-f3-final 20/2420
Appendix 2 : Components of value of in force (“VIF”)
Present value of future profits (“PVFP”)
This component has been calculated by discounting theprojected future after tax shareholder attributablecashflows expected to arise on in-force business at thevaluation date. The cashflows have been projected on adeterministic basis using the company’s best estimate viewof future persistency, mortality and expenses. Futureinvestment returns and the risk discount rate have been setequal to the returns from the risk free yield curve at theclosing balance sheet date.
Time Value of Financial Options and Guarantees("TVFOG")
During FY2010-11, the company carried out an extensive
analysis of the profile of guarantees in its Par funds toidentify the level of guaranteed benefits occurring at futuretime periods. The investment strategy of the Par funds wasre-set to enable, where possible, hedging of theseguaranteed benefits through cashflow matching of theguarantees with fixed interest assets. As a result, thecompany is of the view that there is no residual TVFOGassociated with the Par funds.
During FY2010-11, the company launched a number of unit-linked funds incorporating various forms of investment
guarantees. The cost associated with these investmentguarantees has been allowed for in the MCEV calculationsby modelling a cost equal to the additional guaranteecharge levied on these funds. This allowance has beenfactored into the PVFP.
Frictional Costs of Required Capital (“FCRC”)
The VIF allows for a deduction in respect of the frictionalcosts of holding required capital (“FCRC”). Required capitalhas been set equal to the amount of shareholderattributable assets required to back local regulatory
solvency requirements. The FCRC has been calculated asthe discounted value of investment costs and taxes onshareholder attributable assets backing the required capitalover the lifetime of the in-force business.
Cost of non-hedgeable risk (“CNHR”)
The VIF incorporates an explicit deduction to allow for nonhedgeable and non economic risks. The CNHR has beenderived using a cost of capital approach and is calculated asthe discounted value of an annual charge applied toprojected risk bearing capital.
• The initial risk bearing capital has been calculated basedon 99.5th percentile stress events for non economicassumptions over a 1-year time horizon. This initial risk
bearing capital has been updated to be based on theportfolio of business as at 31st March 2011.
• Projected risk bearing capital has been determined byrunning-off the initial risk bearing capital in line with theexpected movement in the regulatory solvency marginrequirement.
• 99.5th Percentile stress events have been taken from theEU Solvency II, QIS 5 framework (previously QIS 4framework). In order to allow for the greater risksassociated with emerging markets, the risk bearingcapital has been uplifted by 50%.
• The annual charge applied to the projected risk bearingcapital is 4% p.a.
The stress events, uplifts to NHR, run-off pattern forprojected risk bearing capital and annual charge, arereviewed and modified if necessary on an annual basis.

7/27/2019 Hdfc Life q2 f3 Final
http://slidepdf.com/reader/full/hdfc-life-q2-f3-final 21/24
Expenses
• Maintenance expenses have been based on expense levelsincurred during FY 2009-10, inflated at 7.5%. These
assumptions incorporate no allowance for future productivityimprovements.
• Given the substantial changes in regulations the Company hasreviewed its cost structure as a result of which the long-termacquisition expense levels have been calibrated at a levellower than that used earlier. These new long-term acquisitionexpense levels, as approved by the Board in May 2011, havebeen incorporated into the pre-overrun margins disclosed forH1 FY 12.
Economic assumptions
• The closing MCEV is calculated assuming projected earnedand risk discount rates are both set equal to the risk free(government bond) yield curve at the closing balance sheetdate.
• The new business profitability is calculated with similarassumptions, except that the yield curve at the openingbalance sheet date is used.
• No allowance for any illiquidity premia is made within theearned rates, except for group credit spread products.
Mortality and morbidity
• Mortality and morbidity assumptions are set by product lineand are based on past experience.
Persistency
• Persistency assumptions are set by product line, paymentmode and duration in-force, based on past experience andexpectations of future experience. Separate decrements aremodeled for lapses, surrenders, paid-ups and partialwithdrawals.
• Due to the age of the industry, minimal experience exists onlong-term persistency assumptions and therefore theseassumptions are reviewed on an active basis and updatedwhen experience suggests a significant difference from the
assumptions used.
• The results presented incorporate a strengthening of persistency assumptions and explicit modelling of partialwithdrawals.
Tax assumptions
• Tax assumptions are based on interpretation of existing taxlegislation, where appropriate supported by legal opinion.
• Profits attributable to shareholders are assumed to be taxedat 13.52% for Life business and 0% for Pensions business.
• Allowance is made within the tax computation for dividendoffsets permitted under Section 2A of the Income Tax Act andfor losses incurred within the Shareholder Fund.
• No allowance is made for future changes to taxation such asthe Direct Tax Code. These changes will be incorporated onlyonce materially enacted. It is expected that implementation of DTC in its current form will result in a material negativeimpact to the MCEV and new business profitability.
21
Appendix 3 : Key assumptions underlying MCEV
7/27/2019 Hdfc Life q2 f3 Final
http://slidepdf.com/reader/full/hdfc-life-q2-f3-final 22/24
Glossary
22
Commission ratio – Ratio of total commissions paid out on first year, single and renewal premiumsto total premiums.
Conservation ratio – Ratio of current year renewal premiums to previous year’s renewal premium
and first year premium.
First year premiums – Regular premiums received during the year for all modes of paymentschosen by the customer which are still in the first year. For e.g. for a monthly mode policy sold inMarch 2011, the first installment would fall into first year premiums for 2010-11 and the remaining
11 installments in the first year would be first year premiums in 2011-12.
New business received premium – The sum of first year premium and single premium.
Operating expense – All expenses of management excluding service tax. It does not include
commission.
Operatingexpense ratio – Ratio of operating expenses (excluding service tax) to total premiums.
Renewal premiums– Regular recurring premiums received after the first year.
Solvency ratio – Ratio of available solvency margin to required solvency margin.
Total premiums – Total received premiums during the year including first year, single and renewalpremiums for individual and group business.
Weighted received premium – The sum of first year premium and 10% weighted single premiumsand single premium top-ups.
7/27/2019 Hdfc Life q2 f3 Final
http://slidepdf.com/reader/full/hdfc-life-q2-f3-final 23/24
Disclaimer
23
This release is a compilation of unaudited financial and other information and is not a statutory release.This may also contain statements that are forward looking. These statements are based on currentexpectations and assumptions that are subject to risks and uncertainties. Actual results could differfrom our expectations and assumptions. We do not undertake any responsibility to update any forwardlooking statements nor should this be constituted as a guidance of future performance. This release is a
privilege copy intended for reference of selected group
These disclosures are subject to the prevailing regulatory and policy framework as on September 30,2011 and do not reflect any subsequent changes
7/27/2019 Hdfc Life q2 f3 Final
http://slidepdf.com/reader/full/hdfc-life-q2-f3-final 24/24
Thank You
In partnership with Standard Life plc


