16
INSTITUTIONAL RESEARCH HDFC sec Investor Forum Consumer Sector Key takeaways Aditya Sane [email protected] +91-22-6171-7336 Naveen Trivedi [email protected] +91-22-6171-7324 19 Dec 2019
INSTITUTIONAL RESEARCH
HDFC sec Investor Forum
Consumer Sector Key takeaways
Aditya Sane [email protected] +91-22-6171-7336
Naveen Trivedi [email protected] +91-22-6171-7324 19 Dec 2019
2
HDFC sec Consumer Sector Investor Forum: Key takeaways
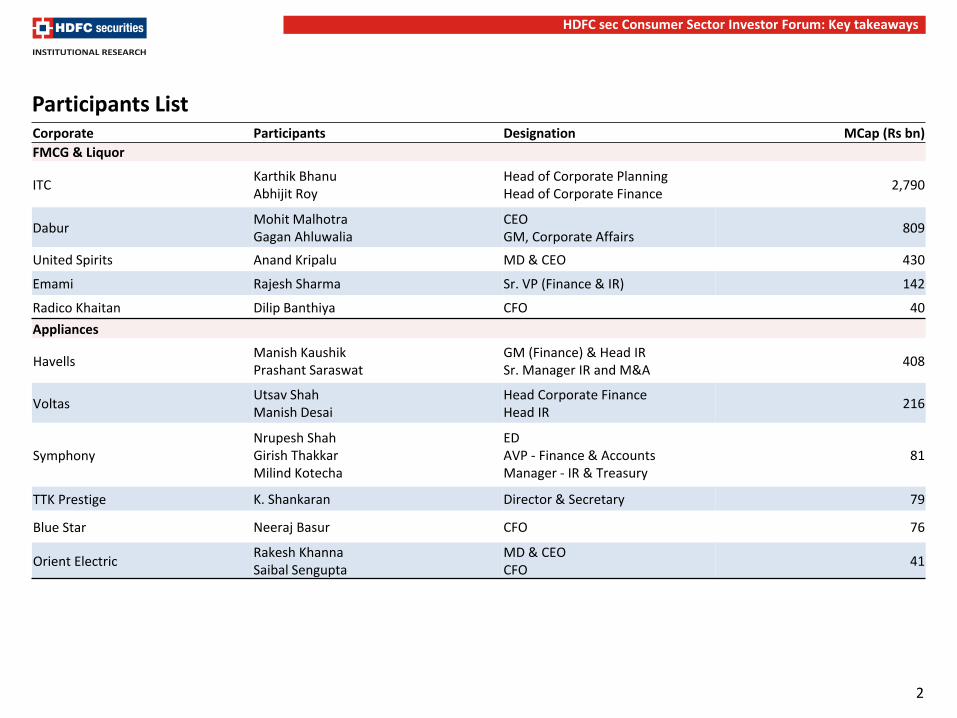
Corporate Participants Designation MCap (Rs bn)
FMCG & Liquor
ITC Karthik Bhanu Abhijit Roy
Head of Corporate Planning Head of Corporate Finance
2,790
Dabur Mohit Malhotra Gagan Ahluwalia
CEO GM, Corporate Affairs
809
United Spirits Anand Kripalu MD & CEO 430
Emami Rajesh Sharma Sr. VP (Finance & IR) 142
Radico Khaitan Dilip Banthiya CFO 40
Appliances
Havells Manish Kaushik Prashant Saraswat
GM (Finance) & Head IR Sr. Manager IR and M&A
408
Voltas Utsav Shah Manish Desai
Head Corporate Finance Head IR
216
Symphony Nrupesh Shah Girish Thakkar Milind Kotecha
ED AVP - Finance & Accounts Manager - IR & Treasury
81
TTK Prestige K. Shankaran Director & Secretary 79
Blue Star Neeraj Basur CFO 76
Orient Electric Rakesh Khanna Saibal Sengupta
MD & CEO CFO
41
Participants List
3
HDFC sec Consumer Sector Investor Forum: Key takeaways
In our two day consumer forum in Mumbai, we arranged participation from various consumer companies i.e. FMCG, Liquor and Appliances sectors. Following are the key highlights of the discussion.
FMCG Sector Recovery slower than expected
The sector overall has not witnessed any recovery in 3QFY20 and meaningful recovery is expected not sooner than 6 months. However, moderation in the base for 2HFY20 will result in slightly better reported revenue growth vs. 1HFY20.
Rural growth remains tepid (rural growing at ~0.7x urban) and all eyes will be on the Rabi crop during late Feb. Companies are focusing on pushing LUPs, moderation in new launches, distribution expansion and tactical pricing action in order to gain share and battle the slowdown.
Despite Patanjali’s healthy 1HFY20 performance (as per media reports), competitive intensity was not witnessed by cos on the ground level.
Benign RM basket (although some pockets are seeing sharp inflation i.e. palm oil, dairy, food) and cost control will expand operating margins for most companies.
However, we cut our EPS estimates for our coverage universe by 2-3% to factor delayed recovery and moderation in new launches.
Liquor Sector RM headwinds to continue
Consumption slowdown along with several trade disruptions (floods, election year, state policy change) impacted industry growth to 3.5% in 1HFY20 as compared to 9% in FY19.
Industry witnessed an ease in raw material pressure as ENA price
has declined by 3-5% vs. peak price in Sep-19 (at Rs 60/ltr). RM pressure will moderate in the near term however, ENA price is expected to be firm at Rs 60/ltr in FY21. Industry continues to lobby with various state governments for price hikes given stiff input costs.
Regulatory changes in Andhra Pradesh has had no impact on volumes for both United Spirits and Radico. UP and Maharashtra maintained healthy growth.
We cut our EPS estimates for coverage universe by 3-4% to factor delayed recovery and expectation of continued RM pressure in FY21 albeit lower than FY20.
Appliances Sector Outperformance of cooling products to continue
Slowdown impact will continue in 2HFY20 while category specific growth diversions will remain. Cooling products (ACs, Air Coolers) will continue to register strong growth led by a hot summer in 2019 and trade filling opportunities.
B-B order inflows are healthy and will help in improving growth trajectory. B-C demand remains weak due to sluggish housing demand. Switchgears, switches, cables & wires and lighting will maintain slow growth in the near term.
Companies are focusing on increasing distribution presence in semi-urban and rural markets. Rural electrification drive is expanding the addressable market.
We cut our EPS estimates for coverage universe by 2-3% to factor delayed recovery and rising competition in RAC.
Top Picks: Dabur, Jubilant FoodWorks, Britannia, United Spirits and Symphony
4
HDFC sec Consumer Sector Investor Forum: Key takeaways
ITC
Cigarette EBIT growth at 8-10%: Cigarette volume growth remained stable in 3Q and ITC maintained market leadership with 80% volume market share. Downtrading is not material despite slowdown and price hike (cumulative price hike of 4%). Cigarette volume mix between DSFT/RSFT/Kings has remained the same at a 40/40/20% mix. ITC can deliver cigarette EBIT growth of 8-10% in the medium term also if taxes are stable.
In-house capsules adding to margin: ITC is producing 70% of its capsule requirements in-house, which has given it an edge over the competition. An imported capsule is 20 paise/stick costlier than those produced in-house. Most of the competition relies on imports for their capsule requirements. ITC is only the second company in the world to produce capsules. Capsule cigarettes (switch) contributes 11-12% of revenue vs. 3-4% 2 years back.
Macro headwinds to impact FMCG growth: FMCG growth rate for ITC has moderated and is growing at par with the rest of the industry. Rural growth has been tepid in 1HFY20, growing at 0.8-0.9x of urban growth vs. 2x of urban growth in 2018. Premium biscuits continue to do well for ITC where co enjoys 20% maket share. Dark Fantasy saw a growth of 20% in 1HFY20, but the rest of the portfolio struggled. Aashirvaad Atta maintained leadership despite regional competition led by ITC’s backend agri support. The Noodles business is growing at par with Maggi, delivering a 12% growth y-o-y. Juice business struggling due to industry-wide issue (downtrading to aerated and milk based drinks). While personal care portfolio did not live up the expectation despite high marketing spend over the past many years.
FMCG margin improvement to continue: The co is now focusing on margin expansion by controlling freight costs and driving
premiumisation. Co also exited loss making businesses like apparels. Co expects to achieve 9% EBITDA margin (5% EBIT margin) in the medium term vs. 6-7% currently.
Stance: Stable taxes in FY19/1HFY20 accelerated cig volume growth to 5.5/3% vs. -5% CAGR during FY15-18. EBIT growth also accelerated to 9/8% in FY19/1HFY20 vs. 7% CAGR during FY15-18. Still ITC did not enjoy a re-rating as investors flocked towards ITC’s peers (HUL, Dabur and Britannia etc.). Rather cig business saw a de-rating (>20% fall, based on assigning fair valuation to other segments) over the last 12-months. We expect cig valuation will recover owing to (1) Continuation of stable taxes, (2) EBIT margin expansion and (3) Pickup in rural market. We believe cig valuation will recover to its avg. of 18x EV/EBITDA (still lower than 25x for Colgate which is similar wrt market leadership, vol growth trajectory and pricing power). Other catalyst in the business is FMCG, with scope for margin expansion. We continue to believe that valuation discount will narrow.
Business as usual
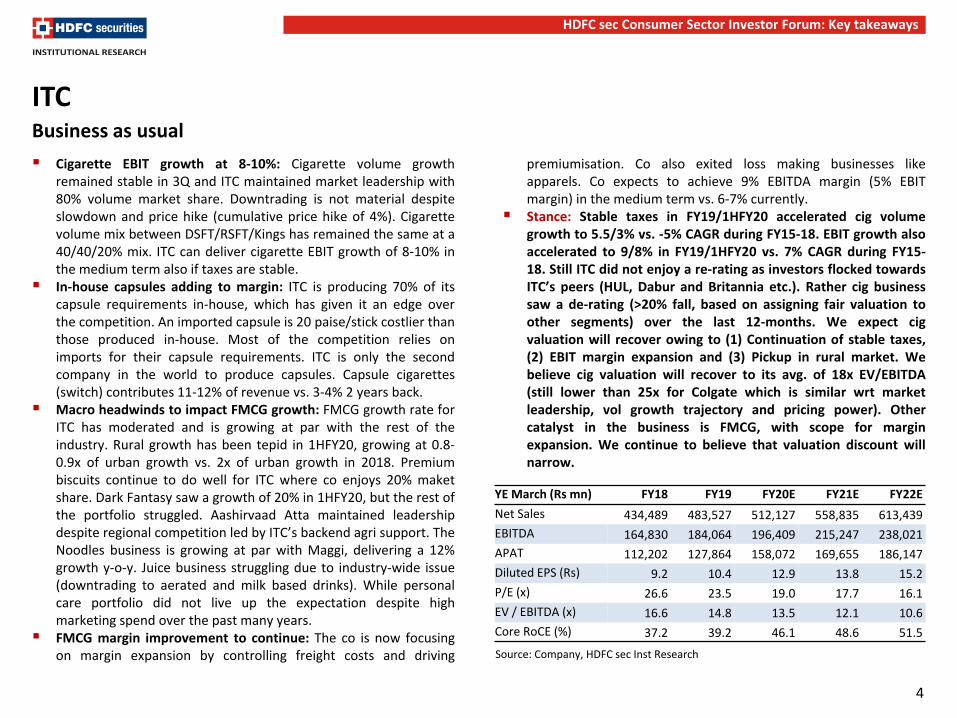
YE March (Rs mn) FY18 FY19 FY20E FY21E FY22E
Net Sales 434,489 483,527 512,127 558,835 613,439
EBITDA 164,830 184,064 196,409 215,247 238,021
APAT 112,202 127,864 158,072 169,655 186,147
Diluted EPS (Rs) 9.2 10.4 12.9 13.8 15.2
P/E (x) 26.6 23.5 19.0 17.7 16.1
EV / EBITDA (x) 16.6 14.8 13.5 12.1 10.6
Core RoCE (%) 37.2 39.2 46.1 48.6 51.5
Source: Company, HDFC sec Inst Research
5
HDFC sec Consumer Sector Investor Forum: Key takeaways
Dabur
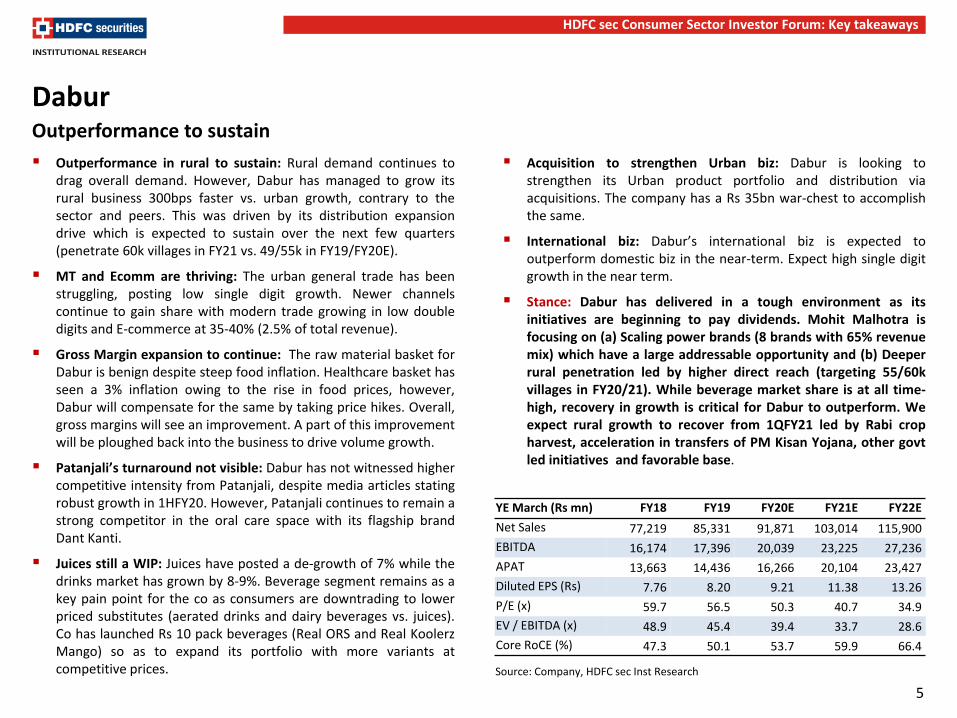
Outperformance in rural to sustain: Rural demand continues to drag overall demand. However, Dabur has managed to grow its rural business 300bps faster vs. urban growth, contrary to the sector and peers. This was driven by its distribution expansion drive which is expected to sustain over the next few quarters (penetrate 60k villages in FY21 vs. 49/55k in FY19/FY20E).
MT and Ecomm are thriving: The urban general trade has been struggling, posting low single digit growth. Newer channels continue to gain share with modern trade growing in low double digits and E-commerce at 35-40% (2.5% of total revenue).
Gross Margin expansion to continue: The raw material basket for Dabur is benign despite steep food inflation. Healthcare basket has seen a 3% inflation owing to the rise in food prices, however, Dabur will compensate for the same by taking price hikes. Overall, gross margins will see an improvement. A part of this improvement will be ploughed back into the business to drive volume growth.
Patanjali’s turnaround not visible: Dabur has not witnessed higher competitive intensity from Patanjali, despite media articles stating robust growth in 1HFY20. However, Patanjali continues to remain a strong competitor in the oral care space with its flagship brand Dant Kanti.
Juices still a WIP: Juices have posted a de-growth of 7% while the drinks market has grown by 8-9%. Beverage segment remains as a key pain point for the co as consumers are downtrading to lower priced substitutes (aerated drinks and dairy beverages vs. juices). Co has launched Rs 10 pack beverages (Real ORS and Real Koolerz Mango) so as to expand its portfolio with more variants at competitive prices.
Acquisition to strengthen Urban biz: Dabur is looking to strengthen its Urban product portfolio and distribution via acquisitions. The company has a Rs 35bn war-chest to accomplish the same.
International biz: Dabur’s international biz is expected to outperform domestic biz in the near-term. Expect high single digit growth in the near term.
Stance: Dabur has delivered in a tough environment as its initiatives are beginning to pay dividends. Mohit Malhotra is focusing on (a) Scaling power brands (8 brands with 65% revenue mix) which have a large addressable opportunity and (b) Deeper rural penetration led by higher direct reach (targeting 55/60k villages in FY20/21). While beverage market share is at all time-high, recovery in growth is critical for Dabur to outperform. We expect rural growth to recover from 1QFY21 led by Rabi crop harvest, acceleration in transfers of PM Kisan Yojana, other govt led initiatives and favorable base.
Outperformance to sustain
YE March (Rs mn) FY18 FY19 FY20E FY21E FY22E
Net Sales 77,219 85,331 91,871 103,014 115,900
EBITDA 16,174 17,396 20,039 23,225 27,236
APAT 13,663 14,436 16,266 20,104 23,427
Diluted EPS (Rs) 7.76 8.20 9.21 11.38 13.26
P/E (x) 59.7 56.5 50.3 40.7 34.9
EV / EBITDA (x) 48.9 45.4 39.4 33.7 28.6
Core RoCE (%) 47.3 50.1 53.7 59.9 66.4
Source: Company, HDFC sec Inst Research
6
HDFC sec Consumer Sector Investor Forum: Key takeaways
United Spirits
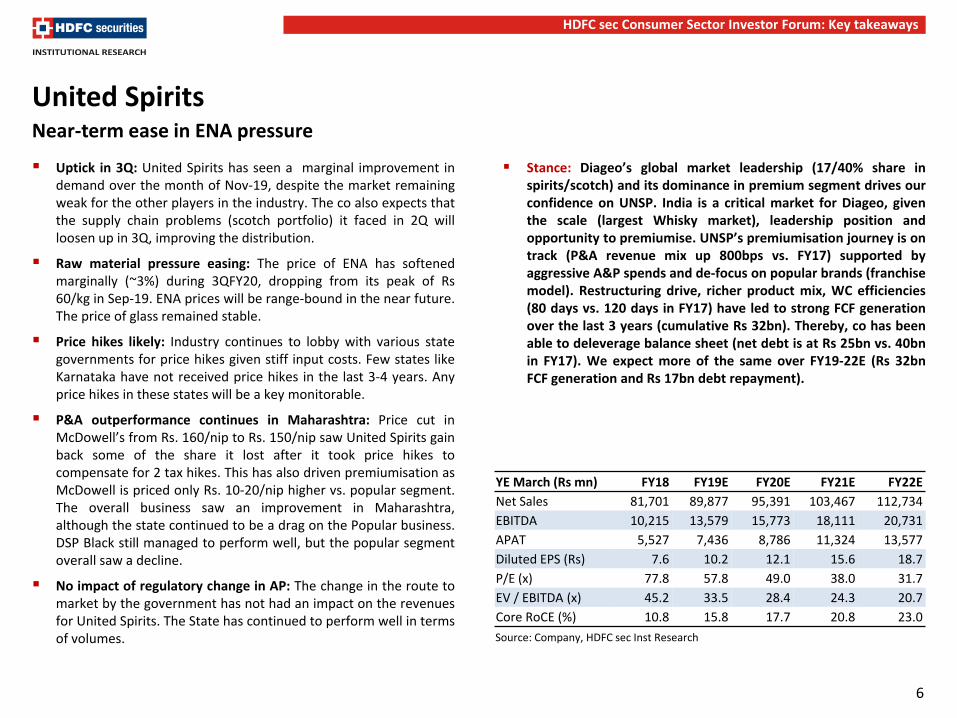
Uptick in 3Q: United Spirits has seen a marginal improvement in demand over the month of Nov-19, despite the market remaining weak for the other players in the industry. The co also expects that the supply chain problems (scotch portfolio) it faced in 2Q will loosen up in 3Q, improving the distribution.
Raw material pressure easing: The price of ENA has softened marginally (~3%) during 3QFY20, dropping from its peak of Rs 60/kg in Sep-19. ENA prices will be range-bound in the near future. The price of glass remained stable.
Price hikes likely: Industry continues to lobby with various state governments for price hikes given stiff input costs. Few states like Karnataka have not received price hikes in the last 3-4 years. Any price hikes in these states will be a key monitorable.
P&A outperformance continues in Maharashtra: Price cut in McDowell’s from Rs. 160/nip to Rs. 150/nip saw United Spirits gain back some of the share it lost after it took price hikes to compensate for 2 tax hikes. This has also driven premiumisation as McDowell is priced only Rs. 10-20/nip higher vs. popular segment. The overall business saw an improvement in Maharashtra, although the state continued to be a drag on the Popular business. DSP Black still managed to perform well, but the popular segment overall saw a decline.
No impact of regulatory change in AP: The change in the route to market by the government has not had an impact on the revenues for United Spirits. The State has continued to perform well in terms of volumes.
Stance: Diageo’s global market leadership (17/40% share in spirits/scotch) and its dominance in premium segment drives our confidence on UNSP. India is a critical market for Diageo, given the scale (largest Whisky market), leadership position and opportunity to premiumise. UNSP’s premiumisation journey is on track (P&A revenue mix up 800bps vs. FY17) supported by aggressive A&P spends and de-focus on popular brands (franchise model). Restructuring drive, richer product mix, WC efficiencies (80 days vs. 120 days in FY17) have led to strong FCF generation over the last 3 years (cumulative Rs 32bn). Thereby, co has been able to deleverage balance sheet (net debt is at Rs 25bn vs. 40bn in FY17). We expect more of the same over FY19-22E (Rs 32bn FCF generation and Rs 17bn debt repayment).
Near-term ease in ENA pressure
YE March (Rs mn) FY18 FY19E FY20E FY21E FY22E
Net Sales 81,701 89,877 95,391 103,467 112,734
EBITDA 10,215 13,579 15,773 18,111 20,731
APAT 5,527 7,436 8,786 11,324 13,577
Diluted EPS (Rs) 7.6 10.2 12.1 15.6 18.7
P/E (x) 77.8 57.8 49.0 38.0 31.7
EV / EBITDA (x) 45.2 33.5 28.4 24.3 20.7
Core RoCE (%) 10.8 15.8 17.7 20.8 23.0
Source: Company, HDFC sec Inst Research
7
HDFC sec Consumer Sector Investor Forum: Key takeaways
Emami
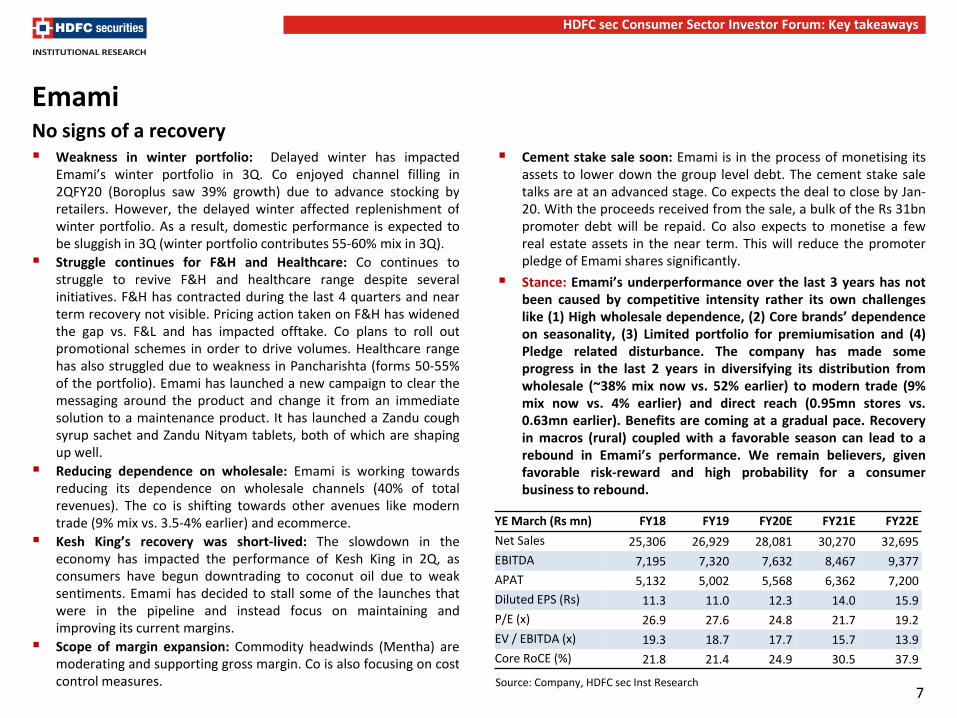
Weakness in winter portfolio: Delayed winter has impacted Emami’s winter portfolio in 3Q. Co enjoyed channel filling in 2QFY20 (Boroplus saw 39% growth) due to advance stocking by retailers. However, the delayed winter affected replenishment of winter portfolio. As a result, domestic performance is expected to be sluggish in 3Q (winter portfolio contributes 55-60% mix in 3Q).
Struggle continues for F&H and Healthcare: Co continues to struggle to revive F&H and healthcare range despite several initiatives. F&H has contracted during the last 4 quarters and near term recovery not visible. Pricing action taken on F&H has widened the gap vs. F&L and has impacted offtake. Co plans to roll out promotional schemes in order to drive volumes. Healthcare range has also struggled due to weakness in Pancharishta (forms 50-55% of the portfolio). Emami has launched a new campaign to clear the messaging around the product and change it from an immediate solution to a maintenance product. It has launched a Zandu cough syrup sachet and Zandu Nityam tablets, both of which are shaping up well.
Reducing dependence on wholesale: Emami is working towards reducing its dependence on wholesale channels (40% of total revenues). The co is shifting towards other avenues like modern trade (9% mix vs. 3.5-4% earlier) and ecommerce.
Kesh King’s recovery was short-lived: The slowdown in the economy has impacted the performance of Kesh King in 2Q, as consumers have begun downtrading to coconut oil due to weak sentiments. Emami has decided to stall some of the launches that were in the pipeline and instead focus on maintaining and improving its current margins.
Scope of margin expansion: Commodity headwinds (Mentha) are moderating and supporting gross margin. Co is also focusing on cost control measures.
Cement stake sale soon: Emami is in the process of monetising its assets to lower down the group level debt. The cement stake sale talks are at an advanced stage. Co expects the deal to close by Jan-20. With the proceeds received from the sale, a bulk of the Rs 31bn promoter debt will be repaid. Co also expects to monetise a few real estate assets in the near term. This will reduce the promoter pledge of Emami shares significantly.
Stance: Emami’s underperformance over the last 3 years has not been caused by competitive intensity rather its own challenges like (1) High wholesale dependence, (2) Core brands’ dependence on seasonality, (3) Limited portfolio for premiumisation and (4) Pledge related disturbance. The company has made some progress in the last 2 years in diversifying its distribution from wholesale (~38% mix now vs. 52% earlier) to modern trade (9% mix now vs. 4% earlier) and direct reach (0.95mn stores vs. 0.63mn earlier). Benefits are coming at a gradual pace. Recovery in macros (rural) coupled with a favorable season can lead to a rebound in Emami’s performance. We remain believers, given favorable risk-reward and high probability for a consumer business to rebound.
No signs of a recovery
YE March (Rs mn) FY18 FY19 FY20E FY21E FY22E
Net Sales 25,306 26,929 28,081 30,270 32,695
EBITDA 7,195 7,320 7,632 8,467 9,377
APAT 5,132 5,002 5,568 6,362 7,200
Diluted EPS (Rs) 11.3 11.0 12.3 14.0 15.9
P/E (x) 26.9 27.6 24.8 21.7 19.2
EV / EBITDA (x) 19.3 18.7 17.7 15.7 13.9
Core RoCE (%) 21.8 21.4 24.9 30.5 37.9
Source: Company, HDFC sec Inst Research
8
HDFC sec Consumer Sector Investor Forum: Key takeaways
Radico Khaitan
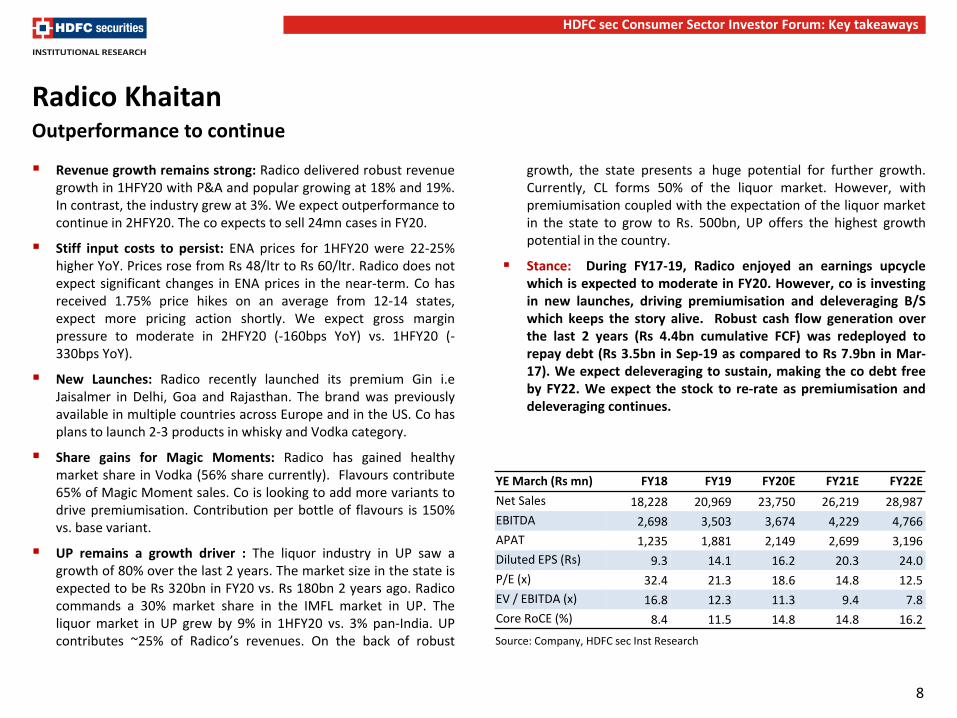
Revenue growth remains strong: Radico delivered robust revenue growth in 1HFY20 with P&A and popular growing at 18% and 19%. In contrast, the industry grew at 3%. We expect outperformance to continue in 2HFY20. The co expects to sell 24mn cases in FY20.
Stiff input costs to persist: ENA prices for 1HFY20 were 22-25% higher YoY. Prices rose from Rs 48/ltr to Rs 60/ltr. Radico does not expect significant changes in ENA prices in the near-term. Co has received 1.75% price hikes on an average from 12-14 states, expect more pricing action shortly. We expect gross margin pressure to moderate in 2HFY20 (-160bps YoY) vs. 1HFY20 (-330bps YoY).
New Launches: Radico recently launched its premium Gin i.e Jaisalmer in Delhi, Goa and Rajasthan. The brand was previously available in multiple countries across Europe and in the US. Co has plans to launch 2-3 products in whisky and Vodka category.
Share gains for Magic Moments: Radico has gained healthy market share in Vodka (56% share currently). Flavours contribute 65% of Magic Moment sales. Co is looking to add more variants to drive premiumisation. Contribution per bottle of flavours is 150% vs. base variant.
UP remains a growth driver : The liquor industry in UP saw a growth of 80% over the last 2 years. The market size in the state is expected to be Rs 320bn in FY20 vs. Rs 180bn 2 years ago. Radico commands a 30% market share in the IMFL market in UP. The liquor market in UP grew by 9% in 1HFY20 vs. 3% pan-India. UP contributes ~25% of Radico’s revenues. On the back of robust
growth, the state presents a huge potential for further growth. Currently, CL forms 50% of the liquor market. However, with premiumisation coupled with the expectation of the liquor market in the state to grow to Rs. 500bn, UP offers the highest growth potential in the country.
Stance: During FY17-19, Radico enjoyed an earnings upcycle which is expected to moderate in FY20. However, co is investing in new launches, driving premiumisation and deleveraging B/S which keeps the story alive. Robust cash flow generation over the last 2 years (Rs 4.4bn cumulative FCF) was redeployed to repay debt (Rs 3.5bn in Sep-19 as compared to Rs 7.9bn in Mar-17). We expect deleveraging to sustain, making the co debt free by FY22. We expect the stock to re-rate as premiumisation and deleveraging continues.
Outperformance to continue
YE March (Rs mn) FY18 FY19 FY20E FY21E FY22E
Net Sales 18,228 20,969 23,750 26,219 28,987
EBITDA 2,698 3,503 3,674 4,229 4,766
APAT 1,235 1,881 2,149 2,699 3,196
Diluted EPS (Rs) 9.3 14.1 16.2 20.3 24.0
P/E (x) 32.4 21.3 18.6 14.8 12.5
EV / EBITDA (x) 16.8 12.3 11.3 9.4 7.8
Core RoCE (%) 8.4 11.5 14.8 14.8 16.2
Source: Company, HDFC sec Inst Research
9
HDFC sec Consumer Sector Investor Forum: Key takeaways
Havells
Weak demand trend continues: Core business will continue to see macro headwinds. Demand trends remained tepid in Oct/Nov. Management expects recovery will be gradual and meaningful recovery will be visible in 1HFY21.
Deeper penetration in rural : Havells is focusing on driving revenues by improving its penetration in the rural markets through the REO brand, as rural electrification continues to support the core business. The co has established a presence in approximately 1000 towns with a population of between 10k and 50k. REO is not expected to be dilutive to margins as the current volumes will not be too high and it can be manufactured in the existing factories. Hence, it will provide additive revenue and might help improve margins.
ECD outperformance continues: Co has achieved 30% growth in ECD over the last 8 quarters. Successful new launches, market share gain in fans and market development supporting the growth. Fan contribution in ECD has gone down to 60% vs. 75% in 3 year back. ECD can still sustain mid-teens growth in the medium term.
Lighting performance to improve in 2HFY20: Revenue growth is expected to show strong growth in 3QFY20 after a weak 2Q. Havells has strong brand recall in the lighting business thereby co is not witnessing margin pressure unlike its peers.
Lloyd remains WIP: Havells trying to rebuild Lloyd brand by (1) Launch of superior RAC in summer 2020 from the new plant, (2) Change in communication towards quality, (3) Taking distributors (1,000 distributors) to the new plant to show Havells high quality standards in manufacturing. Trade has normal channel inventory for Lloyd RAC but co holds 60 days inventory vs. 30 days normally. TV panels outlook remains bleak and co expects contribution from
panels to fall to 10% in the near term vs. 15-20% in FY19.
RAC imports are cheaper: As a consequence of the US-China Trade war, the import prices for RAC have become cheaper despite the increase in custom duty. The provides cushion to margin in high competition.
Stance: Havells has gained market share in most of its categories even during a challenging environment. We believe co’s performance will bounce back with a recovery in macros. Lloyd will remain a WIP in FY20 with a recovery expected from summer-20. Amidst slowdown, management plans to tighten the belt on non-essential costs. We expect EBITDA margins to recover faster than volume growth. We see enough levers for margins to mean revert in the coming quarters. We recently upgraded (in 2Q) Havells to BUY (at CMP Rs 656) as risk/reward was favorable. Stock is down by 16% in the last 6-months, we believe weak performance is largely priced-in.
Roadmap for Lloyd revamp
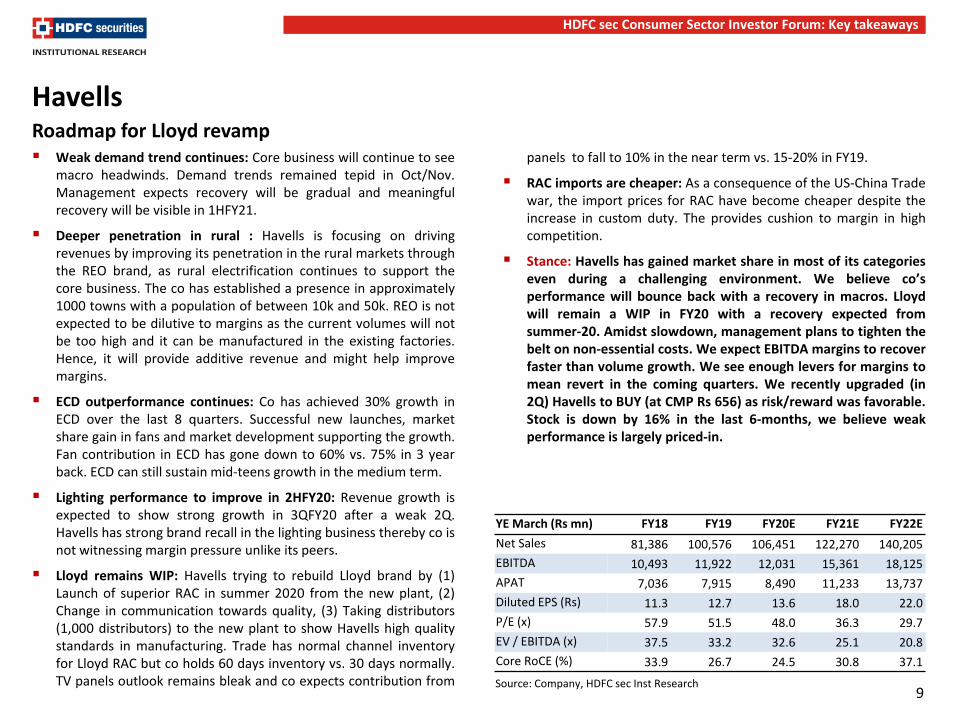
YE March (Rs mn) FY18 FY19 FY20E FY21E FY22E
Net Sales 81,386 100,576 106,451 122,270 140,205
EBITDA 10,493 11,922 12,031 15,361 18,125
APAT 7,036 7,915 8,490 11,233 13,737
Diluted EPS (Rs) 11.3 12.7 13.6 18.0 22.0
P/E (x) 57.9 51.5 48.0 36.3 29.7
EV / EBITDA (x) 37.5 33.2 32.6 25.1 20.8
Core RoCE (%) 33.9 26.7 24.5 30.8 37.1
Source: Company, HDFC sec Inst Research

10
HDFC sec Consumer Sector Investor Forum: Key takeaways
Voltas
Healthy RAC performance to continue in 2HFY20: Voltas clocked robust RAC show in 1HFY20 post strong summer 2019. Voltas has gained healthy market share in South and became 2nd largest player vs. 4th in 2018. Unlike in the North, where market share gap is huge between top players (500bps), the gap between the market leaders is not significant (80-100bps) in the Southern markets. Trade inventory is normal and Voltas has opportunity to fill inventory to drive healthy growth in the non-seasonal quarters. Besides, US-China trade war has made imports from China cheaper despite the custom duty hikes. Additionally, benign raw material inflation and range-bound currency has supported margins. We expect Voltas to expand margins in 2HFY20E.
Healthy order book to drive EMPS revenue: Voltas order inflow saw a surge during 1HFY20, however payment cycle still stretched. Project execution is not at its best level on concerns looming around payments due to tight liquidity. The management has maintained its guidance of 7-7.5% margins in EMPS.
Own manufacturing to drive Volt-Beko launches: New manufacturing plant will be commissioned in the current month only. The new plant will be broaden the Voltas-Beko portfolio in refrigerators by adding direct cool (75-80% of the industry), and hence increase the shelf space at large retailers. The JV will continue to import frost free refrigerators from Thailand and China. Within the washing machine variants, the JV imports top load WM while outsourcing the semi-automatic variants to OEMs. Voltas-Beko products have been made available at 4,000 touch points vs. 19,000 touch points for Voltas products. The JV is expected to break-even by of FY2024.
Stance: Voltas is winning in its product segment strategy as it is able to meet demand across the pyramid i.e. mass (window), mass premium (fixed speed and inverter) and premium (7 star products for EESL). This is in contrast with peers who have migrated towards inverters and 5-star products. Low channel inventory drives visibility for robust growth in 2HFY20. Besides, robust growth in order book is expected to drive recovery in EMPS business.
Outperformance to continue
YE March (Rs mn) FY18 FY19 FY20E FY21E FY22E
Net Sales 64,044 71,241 82,202 92,249 104,641
EBITDA 6,626 6,117 7,707 8,893 10,293
APAT 5,719 5,168 6,446 7,776 9,175
Diluted EPS (Rs) 17.3 15.6 19.5 23.5 27.7
P/E (x) 37.8 41.9 33.6 27.8 23.6
EV / EBITDA (x) 28.5 31.5 24.9 21.3 18.0
Core RoCE (%) 43.6 31.4 29.4 30.5 31.1
Source: Company, HDFC sec Inst Research
11
HDFC sec Consumer Sector Investor Forum: Key takeaways
Symphony
Strong domestic growth: Symphony continues to enjoy strong growth in the domestic business. The growth has been aided by normal trade inventory, a favorable base and historically the highest number of new launches. The new launches by the company have received positive response from the market. This provides good visibility on the likely performance in the non-seasonal quarters. Thereby, we expect strong revenues growth in 2HFY20.
Industrial Air Coolers: The Industrial Air Coolers business stands at an inflection point. Over the last 5 years, the cumulative installations have reached from 100 in FY14 to 2,000 in FY19. The number of installations in FY19 was at 500, and Symphony expects this number to be much higher in FY20.
Dividend payouts to improve: Symphony has been enjoying a healthy cash flow on a regular basis. The co has stated that it does not require a treasury larger than 300-400crore for its operations. Hence, dividend payouts to the extent of 50% of PAT will begin from FY20. Co will maintain health payouts in the coming years to.
Climate Tech opening up new markets: The Climate Tech acquisition has given Symphony access to the Australian and US markets. Although CT is still a WIP and its performance in the upcoming summer will be closely monitored, it enjoys a 28% market share in Australia, which is a Rs 9bn market. In the US, CT has a 2% share of a Rs 21bn market, and it is well positioned to improve this via new tie-ups with Lowe’s (retailer) and Amazon US coupled with its existing tie-up with Home Depot. CT’s distribution network in both these countries could unlock a large market for Symphony India’s product lineup.
Global potential: The global air cooling market potential is Rs 140bn (US Rs 21bn, China Rs 35bn, Australia Rs 9bn, Mexico Rs 4bn, and others Rs 72bn). Currently, Symphony enjoys a 3% share of that market. However, with a presence in multiple geographies, global R&D capabilities and cross selling opportunities, the co could enjoy healthy international performance and boost its overall profitability over the upcoming years.
Stance: Summer 2019 confirms our thesis that Symphony will deliver strong performance if summer is hot. Organised air cooler market (27/35% volume/value mix) will deliver 15% CAGR despite rising affluence towards RAC. Symphony’s constant focus on product innovation and superior franchise with distributors will make the company competitive. With trade inventory now at low levels, Symphony will enjoy off-season stocking, opportunity to launch tech-rich coolers and benefit from a favorable base. Besides, its international performance will improve given the various initiatives undertaken.
Growth acceleration to sustain in 2HFY20
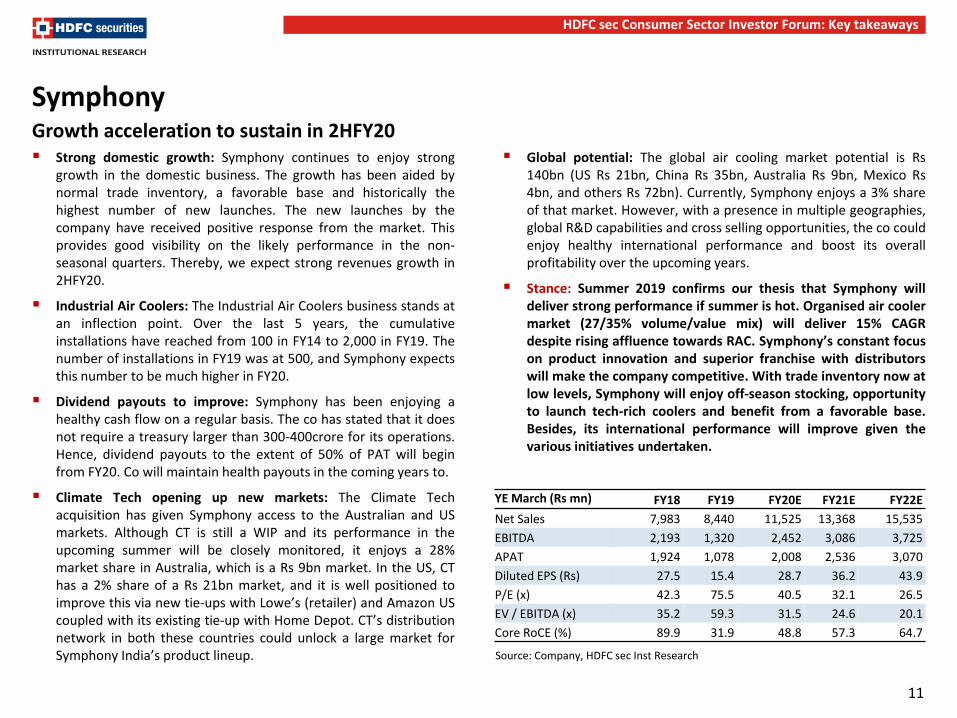
YE March (Rs mn) FY18 FY19 FY20E FY21E FY22E
Net Sales 7,983 8,440 11,525 13,368 15,535
EBITDA 2,193 1,320 2,452 3,086 3,725
APAT 1,924 1,078 2,008 2,536 3,070
Diluted EPS (Rs) 27.5 15.4 28.7 36.2 43.9
P/E (x) 42.3 75.5 40.5 32.1 26.5
EV / EBITDA (x) 35.2 59.3 31.5 24.6 20.1
Core RoCE (%) 89.9 31.9 48.8 57.3 64.7
Source: Company, HDFC sec Inst Research
12
HDFC sec Consumer Sector Investor Forum: Key takeaways
TTK Prestige
Demand remains tepid: TTK Prestige saw muted demand overall in the months of Oct and Nov. Although the growth in appliances was healthy, cookware continued to be under pressure as a result of economic slowdown.
Margins expected to be stable: Commodity inflation continues to benign. Despite tepid volume growth, EBITDAM are expected to remain stable.
New launches to boost pressure cooker sales: The co launched a new design of cooker which provides greater utility in the way of avoiding spillage while cooking. The new design will not dilute margins as the manufacturing cost is the same, and hence pricing will not see any change. The design will be patented and launched across the entire cooker portfolio. We expect pressure cooker sales to recover after a tepid 1HFY20.
Rural sales decline: Co witnessed churn in channel partners (NBFC) which fulfilled rural sales (7-8% revenue mix) of pressure cookers. As a result, rural sales in 1HFY20 declined sharply. TTK is now working to add more NBFCs and revive rural growth. We expect rural sales to pick up in 4QFY20.
Modern trade disruption: Sales from modern trade, which forms 15% of total revenues have been under pressure. Big Bazaar (2/3rd of MT) was seeking steep discounts from TTK in order to reduce ASP of cookers on its shelves. TTK refused to reduce prices, and as a result, BB tied up with other mass segment players and began promoting their products ahead of TTK’s. The co is now diversifying its MT portfolio by tying up with other players such as Dmart.
Stance: TTK has a unique product portfolio that caters to mid-premium kitchenware products. Among its peers, it is the only
company whose product portfolio is discretionary in nature. Hence, consumer sentiments & economy growth plays a vital role in TTK’s growth performance. We found that in strong GDP growth rate, TTK witnessed superior growth of 1.5-2.5x of real GDP growth as compared to 1-1.5x growth during tepid GDP growth rate. Rural recovery remains a key for TTK as rural is a key driver of growth for cookers (cash cow). Good monsoons should drive a recovery in demand. TTK remains aggressive with new launches. Co has a strong pipeline of new launches in cookers and appliances in 2HFY20. Commodity inflation is expected to remain benign in the near term and hence we expect 10% EBITDA growth in 2HFY20 vs 4% in 1HFY20. The stock is trading at 29/25x P/E on FY21E/22E EPS. TTK stock is under pressure on account of weak 1HFY20 performance and general slowdown. Co is launching several products in 2HFY20 and also expect growth recovery from the rural market. Growth acceleration will re-rate the stock.
Recovery expected from 4QFY20
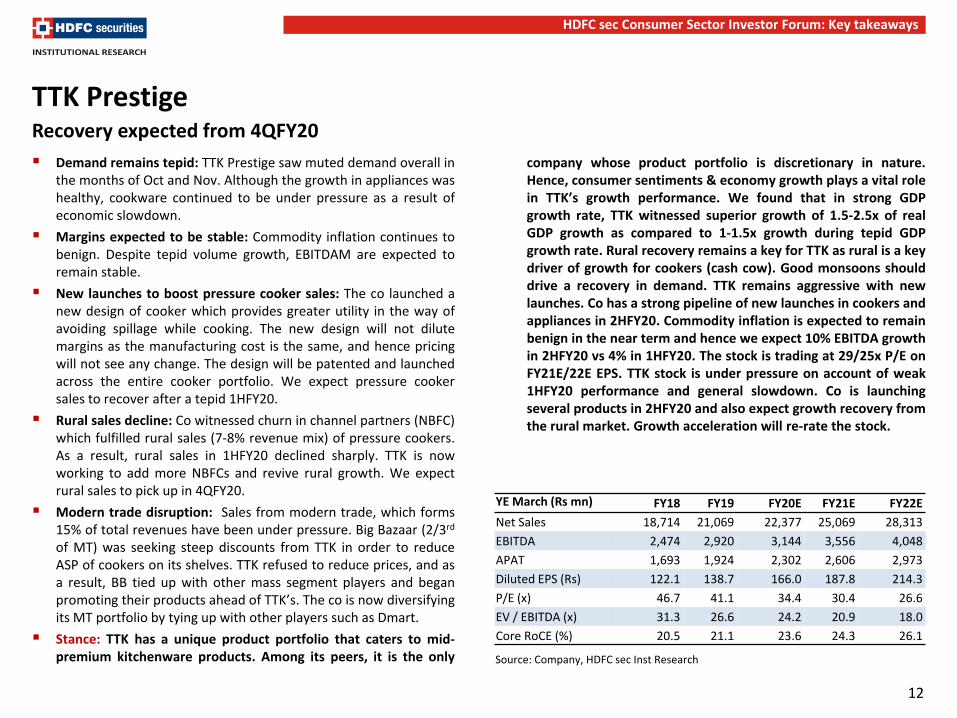
YE March (Rs mn) FY18 FY19 FY20E FY21E FY22E
Net Sales 18,714 21,069 22,377 25,069 28,313
EBITDA 2,474 2,920 3,144 3,556 4,048
APAT 1,693 1,924 2,302 2,606 2,973
Diluted EPS (Rs) 122.1 138.7 166.0 187.8 214.3
P/E (x) 46.7 41.1 34.4 30.4 26.6
EV / EBITDA (x) 31.3 26.6 24.2 20.9 18.0
Core RoCE (%) 20.5 21.1 23.6 24.3 26.1
Source: Company, HDFC sec Inst Research
13
HDFC sec Consumer Sector Investor Forum: Key takeaways
Orient Electric
Innovation the way forward: Orient Electric has been focusing on innovation and new launches in order to combat the slowdown in the economy. The focus of the new management is on bringing a culture of innovation across the board in the organisation. The co is bullish on its recent launches, and expects that they will get traction after 2-3 seasons as dealers gain confidence about product quality.
Rating change provides an opportunity: The co believes that the upcoming BEE Star rating changes in fans will provide an opportunity for Orient to increase its market share. Orient commands 20% market share in fans and is the no 2 player. Co is well positioned to benefit from these changes and capture market share from other players.
Market disruption on the horizon: The advent of BLDC fans (inverter fans) poses a risk to the status quo as they could prove to be a significant disruption in the market. The payback period for such fans for the consumer in terms of cost savings is a mere 1-2 years and this could have an effect on the replacement cycle, causing it to shorten.
Price decrease in LED: The LED market saw a sharp decline in prices in 1HFY20. However, price decline was accompanied by a deterioration in quality as well.
Launch of anti-flicker LED lights: Orient has launched anti-flicker LED lights which is a differentiated product in the over-heated lighting market. LED bulbs solid in the market are typically of poor quality and hence flicker after 6 months of usage.
Stance: Orient Electric is the no 2 player in fans with ~20% share (Crompton commands ~24% share). Co’s focus is to drive premiumisation in fans and re-invest cash flow into newer categories (Lighting, Air cooler, Switches, switchgear etc). We believe Orient can leverage its distribution network with new innovative launches. There is scope for the co to drive margin expansion with scale, premiumisation and GM accretive new launches. We don’t have a rating on the stock.
Innovation leading the way forward
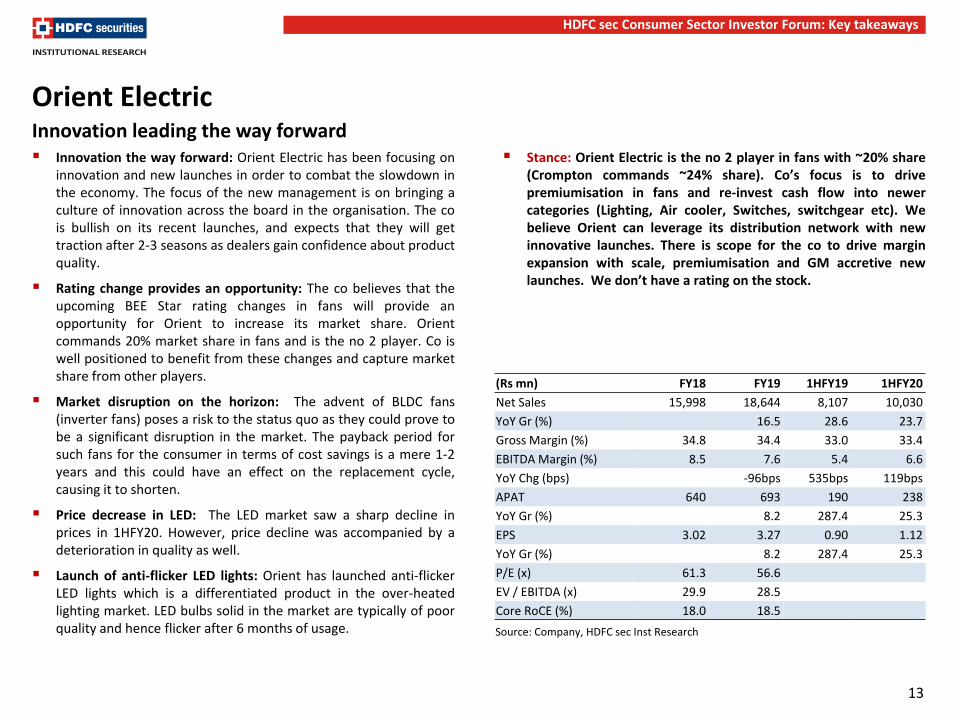
(Rs mn) FY18 FY19 1HFY19 1HFY20
Net Sales 15,998 18,644 8,107 10,030
YoY Gr (%) 16.5 28.6 23.7
Gross Margin (%) 34.8 34.4 33.0 33.4
EBITDA Margin (%) 8.5 7.6 5.4 6.6
YoY Chg (bps) -96bps 535bps 119bps
APAT 640 693 190 238
YoY Gr (%) 8.2 287.4 25.3
EPS 3.02 3.27 0.90 1.12
YoY Gr (%) 8.2 287.4 25.3
P/E (x) 61.3 56.6
EV / EBITDA (x) 29.9 28.5
Core RoCE (%) 18.0 18.5
Source: Company, HDFC sec Inst Research
14
HDFC sec Consumer Sector Investor Forum: Key takeaways
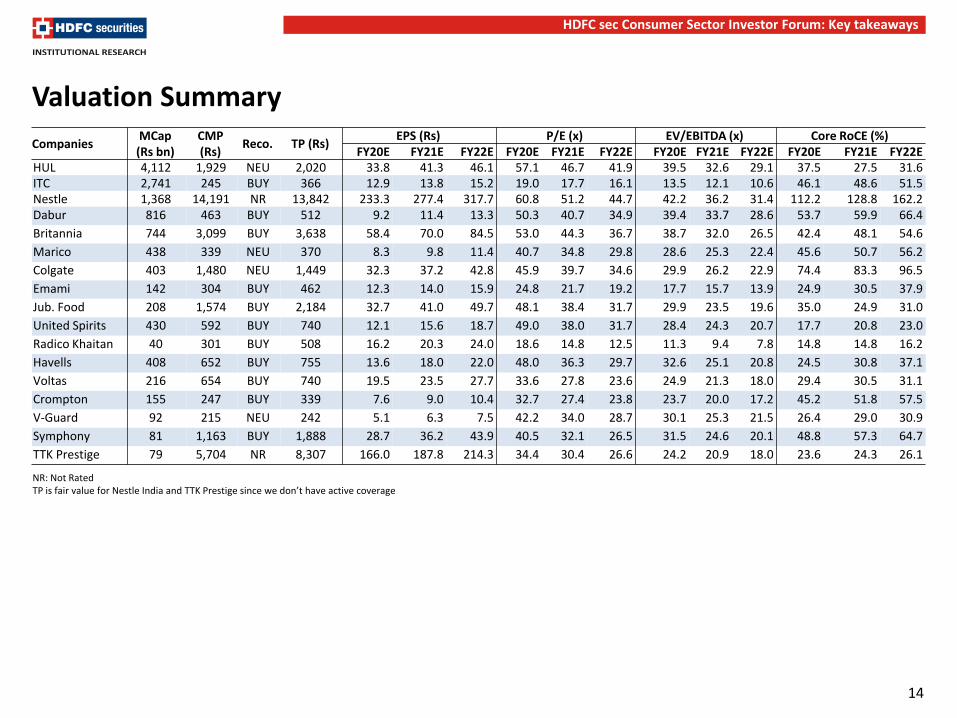
Valuation Summary
NR: Not Rated TP is fair value for Nestle India and TTK Prestige since we don’t have active coverage
Companies MCap (Rs bn)
CMP (Rs)
Reco. TP (Rs) EPS (Rs) P/E (x) EV/EBITDA (x) Core RoCE (%)
FY20E FY21E FY22E FY20E FY21E FY22E FY20E FY21E FY22E FY20E FY21E FY22E HUL 4,112 1,929 NEU 2,020 33.8 41.3 46.1 57.1 46.7 41.9 39.5 32.6 29.1 37.5 27.5 31.6 ITC 2,741 245 BUY 366 12.9 13.8 15.2 19.0 17.7 16.1 13.5 12.1 10.6 46.1 48.6 51.5 Nestle 1,368 14,191 NR 13,842 233.3 277.4 317.7 60.8 51.2 44.7 42.2 36.2 31.4 112.2 128.8 162.2 Dabur 816 463 BUY 512 9.2 11.4 13.3 50.3 40.7 34.9 39.4 33.7 28.6 53.7 59.9 66.4
Britannia 744 3,099 BUY 3,638 58.4 70.0 84.5 53.0 44.3 36.7 38.7 32.0 26.5 42.4 48.1 54.6
Marico 438 339 NEU 370 8.3 9.8 11.4 40.7 34.8 29.8 28.6 25.3 22.4 45.6 50.7 56.2
Colgate 403 1,480 NEU 1,449 32.3 37.2 42.8 45.9 39.7 34.6 29.9 26.2 22.9 74.4 83.3 96.5
Emami 142 304 BUY 462 12.3 14.0 15.9 24.8 21.7 19.2 17.7 15.7 13.9 24.9 30.5 37.9
Jub. Food 208 1,574 BUY 2,184 32.7 41.0 49.7 48.1 38.4 31.7 29.9 23.5 19.6 35.0 24.9 31.0
United Spirits 430 592 BUY 740 12.1 15.6 18.7 49.0 38.0 31.7 28.4 24.3 20.7 17.7 20.8 23.0
Radico Khaitan 40 301 BUY 508 16.2 20.3 24.0 18.6 14.8 12.5 11.3 9.4 7.8 14.8 14.8 16.2
Havells 408 652 BUY 755 13.6 18.0 22.0 48.0 36.3 29.7 32.6 25.1 20.8 24.5 30.8 37.1
Voltas 216 654 BUY 740 19.5 23.5 27.7 33.6 27.8 23.6 24.9 21.3 18.0 29.4 30.5 31.1
Crompton 155 247 BUY 339 7.6 9.0 10.4 32.7 27.4 23.8 23.7 20.0 17.2 45.2 51.8 57.5
V-Guard 92 215 NEU 242 5.1 6.3 7.5 42.2 34.0 28.7 30.1 25.3 21.5 26.4 29.0 30.9
Symphony 81 1,163 BUY 1,888 28.7 36.2 43.9 40.5 32.1 26.5 31.5 24.6 20.1 48.8 57.3 64.7
TTK Prestige 79 5,704 NR 8,307 166.0 187.8 214.3 34.4 30.4 26.6 24.2 20.9 18.0 23.6 24.3 26.1
15
HDFC sec Consumer Sector Investor Forum: Key takeaways
Rating Definitions
BUY : Where the stock is expected to deliver more than 10% returns over the next 12 month period
NEUTRAL : Where the stock is expected to deliver (-) 10% to 10% returns over the next 12 month period
SELL : Where the stock is expected to deliver less than (-) 10% returns over the next 12 month period
Disclosure: We, Naveen Trivedi, MBA & Aditya Sane, CA, authors and the names subscribed to this report, hereby certify that all of the views expressed in this research report accurately reflect our views about the subject issuer(s) or securities. HSL has no material adverse disciplinary history as on the date of publication of this report. We also certify that no part of our compensation was, is, or will be directly or indirectly related to the specific recommendation(s) or view(s) in this report. Research Analyst or his/her relative or HDFC Securities Ltd. does not have any financial interest in the subject company. Also Research Analyst or his relative or HDFC Securities Ltd. or its Associate may have beneficial ownership of 1% or more in the subject company at the end of the month immediately preceding the date of publication of the Research Report. Further Research Analyst or his relative or HDFC Securities Ltd. or its associate does not have any material conflict of interest. Any holding in stock –No HDFC Securities Limited (HSL) is a SEBI Registered Research Analyst having registration no. INH000002475. Disclaimer: This report has been prepared by HDFC Securities Ltd and is solely for information of the recipient only. The report must not be used as a singular basis of any investment decision. The views herein are of a general nature and do not consider the risk appetite or the particular circumstances of an individual investor; readers are requested to take professional advice before investing. Nothing in this document should be construed as investment advice. Each recipient of this document should make such investigations as they deem necessary to arrive at an independent evaluation of an investment in securities of the companies referred to in this document (including merits and risks) and should consult their own advisors to determine merits and risks of such investment. The information and opinions contained herein have been compiled or arrived at, based upon information obtained in good faith from sources believed to be reliable. Such information has not been independently verified and no guaranty, representation of warranty, express or implied, is made as to its accuracy, completeness or correctness. All such information and opinions are subject to change without notice. Descriptions of any company or companies or their securities mentioned herein are not intended to be complete. HSL is not obliged to update this report for such changes. HSL has the right to make changes and modifications at any time. This report is not directed to, or intended for display, downloading, printing, reproducing or for distribution to or use by, any person or entity who is a citizen or resident or located in any locality, state, country or other jurisdiction where such distribution, publication, reproduction, availability or use would be contrary to law or regulation or what would subject HSL or its affiliates to any registration or licensing requirement within such jurisdiction. If this report is inadvertently sent or has reached any person in such country, especially, United States of America, the same should be ignored and brought to the attention of the sender. This document may not be reproduced, distributed or published in whole or in part, directly or indirectly, for any purposes or in any manner. Foreign currencies denominated securities, wherever mentioned, are subject to exchange rate fluctuations, which could have an adverse effect on their value or price, or the income derived from them. In addition, investors in securities such as ADRs, the values of which are influenced by foreign currencies effectively assume currency risk. It should not be considered to be taken as an offer to sell or a solicitation to buy any security. This document is not, and should not, be construed as an offer or solicitation of an offer, to buy or sell any securities or other financial instruments. This report should not be construed as an invitation or solicitation to do business with HSL. HSL may from time to time solicit from, or perform broking, or other services for, any company mentioned in this mail and/or its attachments. HSL and its affiliated company(ies), their directors and employees may; (a) from time to time, have a long or short position in, and buy or sell the securities of the company(ies) mentioned herein or (b) be engaged in any other transaction involving such securities and earn brokerage or other compensation or act as a market maker in the financial instruments of the company(ies) discussed herein or act as an advisor or lender/borrower to such company(ies) or may have any other potential conflict of interests with respect to any recommendation and other related information and opinions. HSL, its directors, analysts or employees do not take any responsibility, financial or otherwise, of the losses or the damages sustained due to the investments made or any action taken on basis of this report, including but not restricted to, fluctuation in the prices of shares and bonds, changes in the currency rates, diminution in the NAVs, reduction in the dividend or income, etc. HSL and other group companies, its directors, associates, employees may have various positions in any of the stocks, securities and financial instruments dealt in the report, or may make sell or purchase or other deals in these securities from time to time or may deal in other securities of the companies / organizations described in this report. HSL or its associates might have managed or co-managed public offering of securities for the subject company or might have been mandated by the subject company for any other assignment in the past twelve months. HSL or its associates might have received any compensation from the companies mentioned in the report during the period preceding twelve months from t date of this report for services in respect of managing or co-managing public offerings, corporate finance, investment banking or merchant banking, brokerage services or other advisory service in a merger or specific transaction in the normal course of business. HSL or its analysts did not receive any compensation or other benefits from the companies mentioned in the report or third party in connection with preparation of the research report. Accordingly, neither HSL nor Research Analysts have any material conflict of interest at the time of publication of this report. Compensation of our Research Analysts is not based on any specific merchant banking, investment banking or brokerage service transactions. HSL may have issued other reports that are inconsistent with and reach different conclusion from the information presented in this report. Research entity has not been engaged in market making activity for the subject company. Research analyst has not served as an officer, director or employee of the subject company. We have not received any compensation/benefits from the subject company or third party in connection with the Research Report. HDFC securities Limited, I Think Techno Campus, Building - B, "Alpha", Office Floor 8, Near Kanjurmarg Station, Opp. Crompton Greaves, Kanjurmarg (East), Mumbai 400 042 Phone: (022) 3075 3400 Fax: (022) 2496 5066 Compliance Officer: Binkle R. Oza Email: [email protected] Phone: (022) 3045 3600 HDFC Securities Limited, SEBI Reg. No.: NSE, BSE, MSEI, MCX: INZ000186937; AMFI Reg. No. ARN: 13549; PFRDA Reg. No. POP: 11092018; IRDA Corporate Agent License No.: CA0062; SEBI Research Analyst Reg. No.: INH000002475; SEBI Investment Adviser Reg. No.: INA000011538; CIN - U67120MH2000PLC152193 Mutual Funds Investments are subject to market risk. Please read the offer and scheme related documents carefully before investing.
16
HDFC sec Consumer Sector Investor Forum: Key takeaways
HDFC securities Institutional Equities Unit No. 1602, 16th Floor, Tower A, Peninsula Business Park, Senapati Bapat Marg, Lower Parel, Mumbai - 400 013 Board : +91-22-6171 7330 www.hdfcsec.com


