HDFC Small Cap Fund (An open ended equity scheme predominantly investing in small cap stocks) Small is Powerful! 1 25 th May 2018 Riskometer This product is suitable for investors who are seeking*: • To generate long-term capital appreciation /income. • Investments predominantly in Small-Cap companies. *Investors should consult their financial advisers if in doubt about whether the product is suitable for them. *For complete scheme related information refer scheme information document. Investors should consult their financial advisers if in doubt about whether the product is suitable for them.
Transcript
HDFC Small Cap Fund (An open ended equity scheme predominantly investing in small cap stocks)
Small is Powerful!
1 25th May 2018
Riskometer This product is suitable for investors who are seeking*: • To generate long-term capital appreciation /income. • Investments predominantly in Small-Cap companies. *Investors should consult their financial advisers if in doubt about whether the product is suitable for them.
*For complete scheme related information refer scheme information document. Investors should consult their financial advisers if in doubt about whether the product is suitable for them.
2
HDFC Small Cap Fund Fund History and Investment approach
• Launched as Morgan Stanley A.C.E. Fund on April 3, 2008 as a multi-cap fund. • Scheme acquired by HDFC Mutual Fund in 2014* and fund repositioned as HDFC
Small & Mid-cap Fund with a focus on small and midcap stocks. • Scheme repositioned** in November 2016 and renamed as HDFC Small Cap Fund,
with a focus on Small cap stocks.
Fund History
• Focus on well managed small cap companies. • Businesses operating in a niche environment. • Identify businesses at a relatively early stage in their life-cycle. • Focus on quality metrics like ROCE & ROE.
Investment Approach
• Invest predominantly in small cap companies. • Identifying companies with reasonable growth prospects. • Identify companies with sound financial strength and sustainable business. • Seek undervalued businesses.
Investment Strategy
*Scheme acquisition as on close of business hours on June 27th 2014. ** W.e.f. November 9th 2016
HDFC Small Cap Fund Small Cap Universe
3
Parameters Details
Small-Cap Universe Companies beyond 250th company in terms of full market
capitalization
Market Cap Range Rs.8,580 crores and below (As of 31st Dec’ 17)
Allocation to Small-Cap Stocks
65%-100%
Large caps – 100 Companies
Mid caps 150 Companies Rs 8,584 crores
Source: Classification as per SEBI circular (SEBI / HO/ IMD/ DF3/ CIR/ P/ 2017/ 114) dated October 6, 2017, the universe of “Small Cap” shall consist of companies below 250th company in terms of full market capitalization. *AMFI - As on 31st December 2017. Stock cut off – Market Cap above Rs 150 Cr
Above Rs 29,304 crores
Rs 29,304 crores to Rs 8,584 crores
Below Rs 8,584 crores
Classification as per SEBI circular on rationalization and merger of schemes.*
HDFC Small Cap Fund Why Small Caps
4
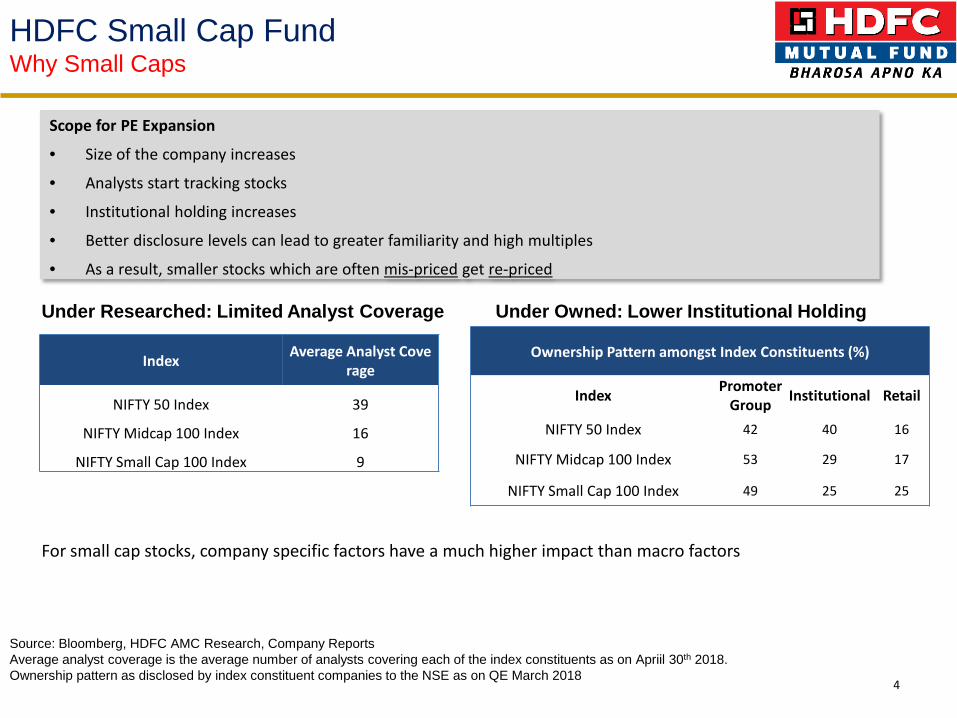
Scope for PE Expansion
• Size of the company increases
• Analysts start tracking stocks
• Institutional holding increases
• Better disclosure levels can lead to greater familiarity and high multiples
• As a result, smaller stocks which are often mis-priced get re-priced
Index Average Analyst Cove rage
NIFTY 50 Index 39
NIFTY Midcap 100 Index 16
NIFTY Small Cap 100 Index 9
Under Researched: Limited Analyst Coverage Under Owned: Lower Institutional Holding
Ownership Pattern amongst Index Constituents (%)
Index Promoter Group Institutional Retail
NIFTY 50 Index 42 40 16
NIFTY Midcap 100 Index 53 29 17
NIFTY Small Cap 100 Index 49 25 25
For small cap stocks, company specific factors have a much higher impact than macro factors
Source: Bloomberg, HDFC AMC Research, Company Reports Average analyst coverage is the average number of analysts covering each of the index constituents as on Apriil 30th 2018. Ownership pattern as disclosed by index constituent companies to the NSE as on QE March 2018
HDFC Small Cap Fund Why Small Caps :- High Return Dispersion
5
Within small caps there are large number of companies that show high returns and ones with low returns = High return dispersion
Therefore, scope for active stock picking. Focus on quality of business and management, consistency in earnings growth and reasonable valuations can lead to alpha generation
Segments 2017 2016
Large Cap Mid Cap Small Cap Large Cap Mid Cap Small Cap
Greater Than 50% 34 83 588 1 - 41
20-50% 41 33 232 1 2 47
0-20% 18 21 172 5 11 87
0 to -20% 5 11 98 29 26 210
-20-50% 2 2 58 57 79 462
Less Than -50% - - 18 7 32 319
Total observations 1416 1416
High Return
Dispersion
Source: HDFC AMC Research, Bloomberg Definition of large caps – Market cap above the largest stock by market cap in the NIFTY Midcap 100 Free float index , Midcaps – Market cap above the largest stock by market cap in the NIFTY Smallcap 100 Free float index. All other stocks are small caps. Stocks selected have been traded in each of the past 2 financial years. The above chart is for illustrative purposes only. Small Caps carry a higher risk of market fluctuations and are also prone to higher liquidity risks. Small caps are strictly not comparable to Mid-caps/Large caps stocks.
Small Caps : A strong case for Active Investing
• A common perception is that small caps are riskier
• Volatility exhibited by the Small Cap benchmark is in line with large and midcaps. (See charts below)
• Numbers say otherwise
6
Source: HDFC AMC Research, Bloomberg Calculations done from 1st April 2005 (NIFTY Full Mid cap 100 Index and NIFTY Full Small Cap Index– Base date) for all indices for the purpose of consistency of data. All calculations as of April 30th 2018. Annualized volatility calculated based on day wise changes in index values of mentioned indices. Past performance may not be sustained in the future. Historical performance indications and financial market scenarios are not reliable indicator for current or future performance. Small Caps carry a higher risk of market fluctuations and are also prone to higher liquidity risks. Small caps are strictly not comparable to Large caps stocks.
Small caps fall similar to Large / Mid caps on bad days Small caps are equally volatile as Large / Mid caps
Is risk higher?
24% 23% 23%
5%
10%
15%
20%
25%
NIFTY Small Cap 100 TRI
NIFTY Mid Cap 100 TRI
NIFTY 50 TRI
Annualized Volatility
624
408
271
591
356
215
578
346
216
- 100 200 300 400 500 600 700
Fall > 1% Fall > 1.5% Fall > 2%
Number of Days The Index Has fallen > 1%, 1.5% & 2%
NIFTY Small Cap 100 TRI NIFTY Mid Cap 100 TRI NIFTY 50 TRI
HDFC Small Cap Fund Are Small Caps very risky? …..Not really
HDFC Small Cap Fund Small Caps have outperformed Large Caps over long term
7
0.00
200.00
400.00
600.00
800.00
1000.00
1200.00
1400.00
Nifty 50 TRI NIFTY Small Cap 100 TRI
Source: HDFC AMC Research, Bloomberg All calculations as of April 30th 2018.1st January 2004 is the inception date of the NIFTY Small cap 100 index. Historical performance indications and financial market scenarios are not reliable indicator for current or future performance. Small Caps carry a higher risk of market fluctuations and are also prone to higher liquidity risks. Small caps are strictly not comparable to Large caps stocks.
* Portfolio as on 30th April 2018. Full Market Cap data as on April 30, 2018 from Capital Line. HDFC Mutual Fund/AMC is not guaranteeing returns on investments made in this scheme. ** Weighted Average Market Cap as on April 30, 2018 (Source: Capital Line). The current investment strategy is subject to change depending on the market conditions. Equity Exposure of Fund rebased to 100%.
• Invests at least 65% in small-cap companies.
• Targets high quality small cap business which are undervalued and have a sustainable business.
• Well diversified portfolio at all times.
Market Cap** ( In Rs. Crore) Weighted Average Market Cap** (in Rs Crore)
Bottom up stock picking approach with wide sectoral diversification
Source:-Bloomberg (Sector classification as per IISL). As of 30th April 2018.For detailed portfolio refer wwww.hdfcfund.com. Stocks/sectors referred above are illustrative and are not recommended by HDFC Mutual Fund/AMC. The Fund may or may not have any present or future positions in these stocks/sectors. The above statements / analysis should not be construed as an investment advice or a research report or a recommendation to buy or sell any security covered under the respective sector/s .The same has been prepared on the basis of information, which is already available in publicly accessible media.
17
11 10 9
7 7 6 6 6 5 4
3 2 2
1 0
12
10
5 5 5
20
8 8
1 2
7
5
2 4
3.
1
0
5
10
15
20
25 In
dust
rial
Man
ufac
turin
g IT
Serv
ices
Auto
mob
ile
Fert
ilise
rs &
Pes
ticid
es
Fina
ncia
l Ser
vice
s
Cons
truc
tion
Cons
umer
Goo
ds
Phar
ma
Med
ia &
En
tert
ainm
ent
Chem
ical
s
Text
iles
Met
als
Ener
gy
Cem
ent &
Cem
ent
Prod
ucts
Tele
com
% o
f Por
tfol
io
Fund Benchmark
10
HDFC Small Cap Fund Scheme Sectoral Allocation
Bottom up stock picking approach
5.0 5.0 4.4 4.3 3.5
-2.4 -2.4 -2.7 -2.9
-13.6 -16.0 -14.0 -12.0 -10.0
-8.0 -6.0 -4.0 -2.0 0.0 2.0 4.0 6.0
Indu
stria
l Man
ufac
turin
g
Serv
ices
Phar
ma
Auto
mob
ile
Med
ia &
Ent
erta
inm
ent
Ener
gy
Cons
umer
Goo
ds
Cem
ent &
Cem
ent P
rodu
cts
Chem
ical
s
Fina
ncia
l Ser
vice
s
% o
f Por
tfol
io
Overweight/ Underweight
Source:-Bloomberg (Sector classification as per IISL). As of 30th April 2018.For detailed portfolio refer www.hdfcfund.com. Stocks/sectors referred above are illustrative and are not recommended by HDFC Mutual Fund/AMC. The Fund may or may not have any present or future positions in these stocks/sectors. The above statements / analysis should not be construed as an investment advice or a research report or a recommendation to buy or sell any security covered under the respective sector/s .The same has been prepared on the basis of information, which is already available in publicly accessible media.
11
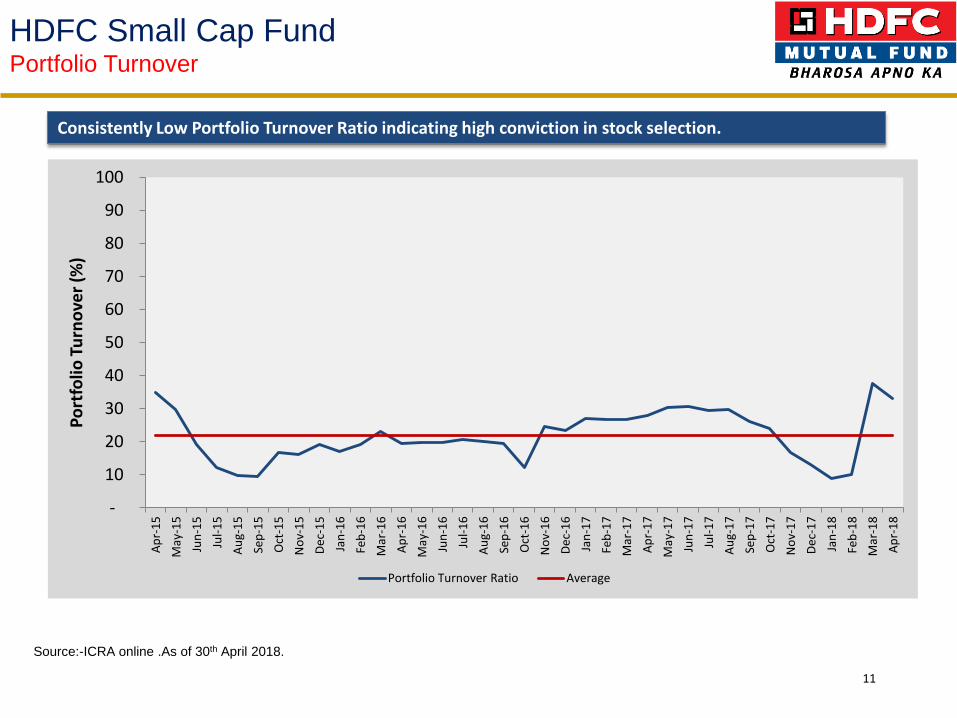
HDFC Small Cap Fund Portfolio Turnover
Consistently Low Portfolio Turnover Ratio indicating high conviction in stock selection.
Source:-ICRA online .As of 30th April 2018.
-
10
20
30
40
50
60
70
80
90
100 Ap
r-15
M
ay-1
5 Ju
n-15
Ju
l-15
Aug-
15
Sep-
15
Oct
-15
Nov
-15
Dec-
15
Jan-
16
Feb-
16
Mar
-16
Apr-
16
May
-16
Jun-
16
Jul-1
6 Au
g-16
Se
p-16
O
ct-1
6 N
ov-1
6 De
c-16
Ja
n-17
Fe
b-17
M
ar-1
7 Ap
r-17
M
ay-1
7 Ju
n-17
Ju
l-17
Aug-
17
Sep-
17
Oct
-17
Nov
-17
Dec-
17
Jan-
18
Feb-
18
Mar
-18
Apr-
18
Port
folio
Tur
nove
r (%
)
Portfolio Turnover Ratio Average
12
HDFC Small Cap Fund Risk Management through low portfolio concentration
Consistently low portfolio concentration
0
10
20
30
40
50
60
70
80
0.00
5.00
10.00
15.00
20.00
25.00
30.00
35.00
40.00
Num
ber o
f sto
cks
Top
10
Hol
ding
%
Top 10 % Number of Stocks
Parameter Average (Since Mar’ 15)
Top 10 holding (% of portfolio) 28%
Number of stocks 61
Source: HDFC AMC Internal, As on 30th April 2018
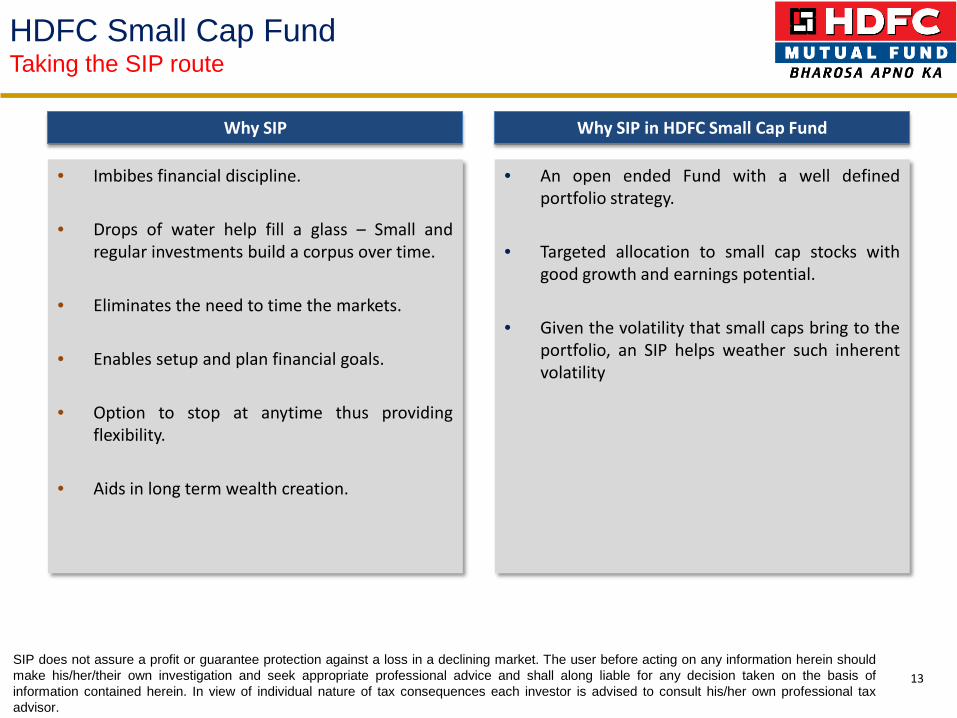
• Imbibes financial discipline.
• Drops of water help fill a glass – Small and regular investments build a corpus over time.
• Eliminates the need to time the markets.
• Enables setup and plan financial goals.
• Option to stop at anytime thus providing
flexibility.
• Aids in long term wealth creation.
• An open ended Fund with a well defined portfolio strategy.
• Targeted allocation to small cap stocks with good growth and earnings potential.
• Given the volatility that small caps bring to the portfolio, an SIP helps weather such inherent volatility
13 SIP does not assure a profit or guarantee protection against a loss in a declining market. The user before acting on any information herein should make his/her/their own investigation and seek appropriate professional advice and shall along liable for any decision taken on the basis of information contained herein. In view of individual nature of tax consequences each investor is advised to consult his/her own professional tax advisor.
HDFC Small Cap Fund Taking the SIP route
Why SIP Why SIP in HDFC Small Cap Fund
FY13 FY14 FY15 FY16 FY17 FY18E FY19E FY20E
GDP at market price (% YoY) 5.5 6.4 7.5 8.0 7.1 6.7 7.2 7.6
India 10 year Gsec Yield % (at yearend) 8.0 8.8 7.7 7.5 6.7 7.55 Na Na
Source: CEIC, CSO, RBI, Morgan Stanley Research ; Economic Survey, E-Morgan Stanley estimates
• RBI estimates growth outlook to improve. Expects GDP growth of 7.4% and 7.7% in FY19 and FY20 respectively vs 6.6% in FY18
• Sustained IIP growth in last few months led by improvement in manufacturing activity and pick up in capital goods, Infra & construction
• Pickup in credit growth, sharp increase in NHAI awarding activity, large industrial projects pipeline are positive
14
Source: Macquarie research
IIP above 7% for 4 consecutive months,
first time since 2013
Indian Economy Strong Fundamentals, Improving growth outlook.
• Earnings outlook is improving with improvement in operating margins, peaking NPA’s and higher metal prices
• Successful resolution in NCLT will positively impact banks, private capex and steel etc.
• Markets are trading at CY19(e) p/e of ~14.9x, which is reasonable, especially given improving growth and earning outlook
• Global developments, US rates, elections, setback to NCLT etc. can lead to increased volatility
15 Data Source: Kotak Institutional Equities, Morgan Stanley, updated till 31st March, 2018, Market Cap to GDP for 2018E and 2019E are based on current market cap to GDP and GDP estimate by Kotak Institutional Equities. Year is Calendar year
Marketcap to GDP ratio at 70%, specially at ~2.3% Corporate profit to GDP is attractive
Equity Market Outlook Strong earnings growth ahead.
16
Type of Scheme An open ended equity scheme predominantly investing in small cap stocks
Inception Date (Date of allotment)
April 3, 2008
Investment Objective To provide long-term capital appreciation /income by investing predominantly in Small-Cap companies.
Fund Manager$ Mr. Chirag Setalvad
Plans Direct Plan Regular Plan
Options Under Each Plan: Growth & Dividend. The Dividend Option offers Dividend Payout and Reinvestment facility.
Minimum Application Amount (Under Each Plan/Option)
Purchase: Rs 5,000 and any amount thereafter Additional Purchase: Rs 1,000 and any amount thereafter
Load Structure
Entry Load: Not Applicable. Upfront commission shall be paid directly by the investor to the ARN Holder (AMFI registered Distributor) based on the investors’ assessment of various factors including the service rendered by the ARN Holder. Exit Load: • In respect of each purchase / switch-in of Units, an Exit Load of 1.00% is payable if Units are redeemed /
switched-out within 1 year from the date of allotment. • No Exit Load is payable if Units are redeemed / switched-out after 1 year from the date of allotment. In case of Systematic Transactions such as SIP, GSIP, STP, Flex STP, Swing STP, Flex index; Exit Load, if any, prevailing on the date of registration / enrolment shall be levied.
Benchmark Index NIFTY Small cap 100 Index
$ Fund Manager Overseas investment –Rakesh Vyas For further details, refer SID and KIM available on www.hdfcfund.com and at Investor Service Centres of HDFC Mutual Fund
16
HDFC Small Cap Fund Fund Facts
17
The Scheme may invest up to 100% of its net assets in Derivatives. The Scheme may invest up to 35% of its net assets in foreign securities.
Type of Instruments Minimum Allocation (% of Total Assets)
Maximum Allocation (% of Total Assets)
Risk Profile of the Instrument
Equity and equity related instruments of Small Cap companies**
65
100
High
Equity and equity related instruments other than Small Cap companies
0 35 High
Debt Securities (including securitised debt) and money market instruments
0 35 Low to Medium
Units issued by REITs and InvITs 0 10 Medium to High
Non-convertible preference shares 0 10 Low to Medium
Under normal circumstances, the asset allocation of the scheme’s portfolio will be as follows:
HDFC Small Cap Fund Asset Allocation
** Investment universe of “Small Cap”: The investment universe of “Small Cap” shall comprise companies as defined by SEBI from time to time. In terms of SEBI circular SEBI/ HO/ IMD/ DF3/ CIR/ P/ 2017/ 114 dated October 6, 2017, the universe of “Small Cap” shall consist of 251st company onwards in terms of full market capitalization and that the Scheme will be required to adhere the following: The list of stocks of Small Cap companies prepared by AMFI in this regard will be adopted. The said list would be uploaded on the AMFI website and would be updated every six months based on the data as on the end of June and December of each year or periodically as specified by SEBI. Subsequent to any updation in the said list as uploaded by AMFI, the portfolio of the Scheme will be rebalanced within a period of one month.
18
Value of Rs 10,000 invested
Scheme Returns (%)
Benchmark Returns (%) #
Additional Benchmark
Returns (%) ## Scheme Benchmark
(Rs)#
Additional Benchmark
(Rs)##
Last 1 year 33.37 13.61 16.91 13,337 11,361 11,691
Last 3 years 23.94 16.51 10.89 19,051 15,822 13,640
Last 5 years 25.80 22.47 14.03 31,522 27,566 19,286
Since inception 16.84 9.87 9.67 48,011 25,817 25,350
The above scheme has been managed by Chirag Setalvad, the fund manager since June 27,2014. The performance of the Scheme is benchmarked to the Total Return Index (TRI) Variant of the Indices. Past performance may or may not be sustained in the future. Returns greater than 1 year period are compounded annualized (CAGR). Load is not taken into consideration for computation of performance. #NIFTY Smallcap 100 ## NIFTY 50. Different plans viz. Regular Plan and Direct Plan have a different expense structure. The expenses of the Direct Plan under the Scheme will be lower to the extent of the distribution expenses / commission charged in the Regular Plan. Returns as on 30th April, 2018
HDFC Small Cap Fund Scheme Performance Summary
19
Scheme Scheme managing since
Cumulative Performance
1 year 3 year 5 year CAGR (in %) CAGR (in %)
Chirag Setalvad manages 9 schemes Performance of Top 3 schemes managed by Chirag Setalvad
HDFC Long Term Advantage Fund Jan 02, 01 14.35 13.77 18.8 S&P BSE SENSEX 18.88 10.71 14.15 HDFC Retirement Savings Fund - Hybrid- Equity Plan Feb 25, 16 14.02 NA NA
NIFTY 50 Hybrid Composite Debt 65:35 Index 12.38 NA NA
HDFC Mid Cap Opportunities Fund Jun 25, 07 16.13 18.55 27.83
NIFTY Mid Cap 100 13.28 18.34 22.54 Performance of Bottom 3 schemes managed by Chirag Setalvad
NIFTY 50 Hybrid Composite Debt 15:85 Index 5.67 7.79 8.57
HDFC Retirement Savings Fund – Hybrid Debt Plan Feb 25, 16 6.88 NA NA
NIFTY 50 Hybrid Composite Debt 15:85 Index 5.67 NA NA
HDFC Retirement Savings Fund - Equity Plan Feb 25, 16 17.91 NA NA
NIFTY 500 16.91 NA NA
Performance of the Schemes are benchmarked to the Total Return Index (TRI) Variant of the Indices. Past performance may or may not be sustained in the future. Returns greater than 1 year period are compounded annualised (CAGR). The above returns are of Regular Plan - Growth Option. Load is not taken into consideration for computation of performance. On account of difference in the type of the Scheme, asset allocation, investment strategy, inception dates, the performance of these schemes is strictly not comparable. Top 3 and bottom 3 schemes managed by the Fund Manager have been derived on the basis of since inception returns. Returns as on 30th April, 2018 Different plans viz. Regular Plan and Direct Plan have a different expense structure. The expenses of the Direct Plan under the Scheme will be lower to the extent of the distribution expenses/ commission charged in the Regular Plan
HDFC Small Cap Fund Other schemes managed by the Fund Manager
The presentation is dated 25th May 2018 and has been prepared by HDFC Asset Management Company Limited (HDFC AMC) based on internal data, publicly available information and other sources believed to be reliable. Any calculations made are approximations, meant as guidelines only, which you must confirm before relying on them. The information contained in this document is for general purposes only and is not an offer to sell or a solicitation to buy/sell any mutual fund units/securities. The document is given in summary form and does not purport to be complete. The document does not have regard to specific investment objectives, financial situation and the particular needs of any specific person who may receive this document. The information/ data herein alone are not sufficient and should not be used for the development or implementation of an investment strategy. The same should not be construed as investment advice to any party. The statements contained herein are based on our current views and involve known and unknown risks and uncertainties that could cause actual results, performance or events to differ materially from those expressed or implied in such statements. Neither HDFC Asset Management Company (HDFC AMC) and HDFC Mutual Fund (the Fund) nor any person connected with them, accepts any liability arising from the use of this document. HDFC Mutual Fund/AMC is not guaranteeing returns on investments made in this scheme. The current investment strategy is subject to change depending on the market conditions The recipient(s) before acting on any information herein should make his/her/their own investigation and seek appropriate professional advice and shall alone be fully responsible / liable for any decision taken on the basis of information contained herein. Past performance may not be sustained in the future. Investments in Small cap stocks are entail risk of loss of capital invested. Investors are advised to take due caution while investing in this scheme.
MUTUAL FUND INVESTMENTS ARE SUBJECT TO MARKET RISKS, READ ALL SCHEME