24
HDPE DESIGN CON- SIDERATIONS

HDPEDESIGN CON-SIDERATIONS

CONTENTS
15PRESSURE
CONSIDERATIONS STATIC
15 →
17TEMPERATURE
CONSIDERATIONS EFFECT ON PRESSURE
EFFECT OF DIMENSIONS
→
→
17
17
04FLOW
FLOW→
NOMOGRAM→
04
05
DYNAMIC→16
WATER HAMMER→16
FLOW CHARTS→06

18TRENCH LOAD
CONSIDERATIONS TRENCH LOAD CONSIDER-ATIONS
→18
21ABOVE GROUND
INSTALLATION ABOVE GROUND INSTAL-LATION
→21
22BENDING
BENDING→22
SOIL AND TRAFFIC LOADS→18
SUPPORTING DISTANCES OF HDPE
→21

FLOWThe nomogram and tables that follow on page 4 provide a guide to friction losses that can be expected when using clean HDPE pressure pipes with clean water at 20°C. No account has been taken of any possible fit-tings in a line.The flow charts given here, on pages 6-13, have each been calculated for a particular SDR and can therefore by applied to various pressure classes depending on the material designation and design stress. Only sizes covered by SABS ISO 4427 have been included in these charts. The table below gives the PN classes (pressure in bar) covered by each SDR.
SDR PE100 PE80 PE63
33 -- 4 3.2
26 6.3 -- 4
21 8 6.3 --
17 10 8 6.3
13.6 12.5 10 8
11 16 12.5 10
9 20 16 12.5
7.4 -- 20 16

FLO
W 0
4 —
05
NOMOGRAM
Note: For sizes not covered by Nomogram, please con-tact Technical Support Department. The nomogram is based on the Prandti - Coalbrook for-mula using a k factor of k= 0.007mm.
↓Diagram for water at 20°CAppr. values only
Factors applicable to other flow formulae are: Hazen Williams c = 150Manning n = 0.010Darcy roughness factor = 0.007
↓

FLOW CHARTSTo interpret the information given in the following flow charts, follow the instructions below:
1. Choose the particular chart for the material designation (PE 100, PE 80, PE 63) and pressure class (PN 16, PN 10 etc.) of pipe being used.
2. In one of the first 3 columns find the nearest value of the quantity of water to be pumped. The three col-umns give the quantity of water in different units – GPH = Gallons per hour, m³/hr = cubic meters per hour, l/s = litres per second.
3. Run your eye along the horizontal line found in instruction 2 above until you get to numbers which are shaded light green. The number in the shaded block is the friction loss (expressed in meters per 100 me-ters) for the size of pipe given at the top of the particular column.
4. The reverse sequence can be used to determine the amount of water that can be put through a given pipe size (and the how much friction loss is created).
1. The colour coding represents the approximate velocity of the water in the size of pipe chosen.2. If two or more size columns have the same colouring then there is a choice of suitable sizes each with its
own friction loss value.3. The range of velocities (metres per second) represented be the colours is as above
COLOUR CODE VELOCITY-M/S COMMENTS
unshaded numbers above the < 0.5 but not < 0.3 too big
yellow - 0.5 to 0.99 a smaller pipe may be more suitable
light green - 1.0 to 1.49 about right
dark green - 1.5 to 1.99 about right
tan - 2.0 to 2.49 a bigger pipe may be more suitable
unshaded numbers below the > 2.5 but not > 3.0 too small

SDR 33
FLO
W 0
6 —
07

SDR 26

SDR 21
FLO
W 0
8 —
09

SDR 17

SDR 13.6
FLO
W 1
0 —
11

SDR 11
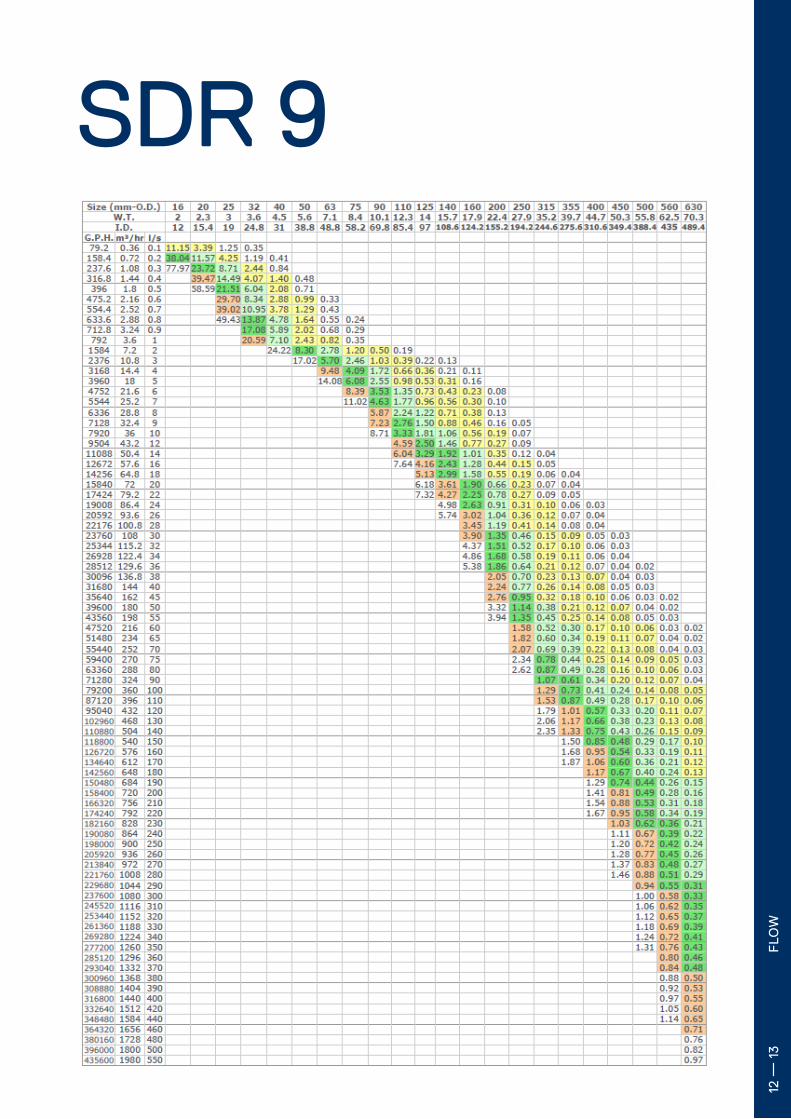
SDR 9
FLO
W 1
2 —
13

SDR 7.4
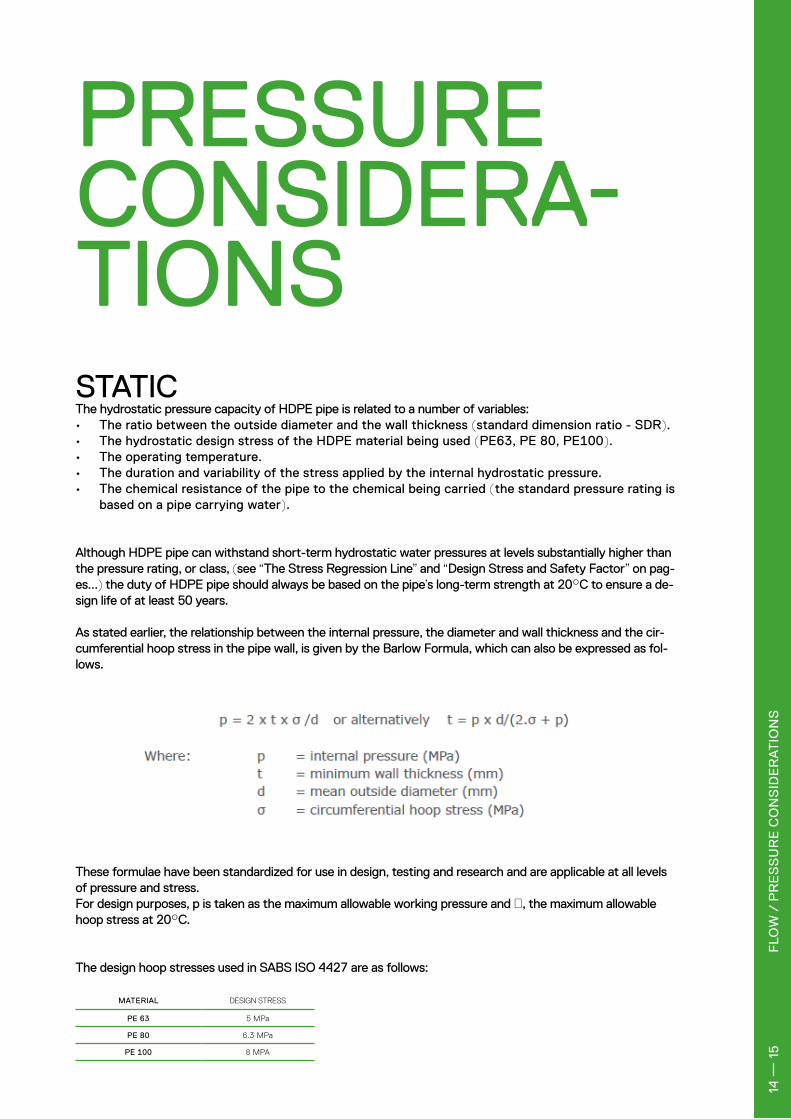
PRESSURE CONSIDERA-TIONSSTATICThe hydrostatic pressure capacity of HDPE pipe is related to a number of variables:• The ratio between the outside diameter and the wall thickness (standard dimension ratio - SDR).• The hydrostatic design stress of the HDPE material being used (PE63, PE 80, PE100).• The operating temperature.• The duration and variability of the stress applied by the internal hydrostatic pressure.• The chemical resistance of the pipe to the chemical being carried (the standard pressure rating is
based on a pipe carrying water).
Although HDPE pipe can withstand short-term hydrostatic water pressures at levels substantially higher than the pressure rating, or class, (see “The Stress Regression Line” and “Design Stress and Safety Factor” on pag-es...) the duty of HDPE pipe should always be based on the pipe’s long-term strength at 20°C to ensure a de-sign life of at least 50 years.
As stated earlier, the relationship between the internal pressure, the diameter and wall thickness and the cir-cumferential hoop stress in the pipe wall, is given by the Barlow Formula, which can also be expressed as fol-lows.
These formulae have been standardized for use in design, testing and research and are applicable at all levels of pressure and stress. For design purposes, p is taken as the maximum allowable working pressure and σ, the maximum allowable hoop stress at 20°C.
The design hoop stresses used in SABS ISO 4427 are as follows:
MATERIAL DESIGN STRESS
PE 63 5 MPa
PE 80 6.3 MPa
PE 100 8 MPA
FLO
W /
PR
ES
SU
RE
CO
NS
IDE
RA
TIO
NS
14
— 1
5

DYNAMICThe pressure classes of SABS ISO 4427 HDPE pipes are based on constant internal water pressures. HDPE pipes are however capable of handling dynamic pressure events which exceed the values given by the classes but such occurrences can have a negative effect on the standard 50 year life expectancy and in extreme cas-es can result in product failure.
WATER HAMMERPipelines may be subjected to short-term increase in pressure above the normal working pressure due to wa-ter hammer. Water hammer will occur in a pipeline when its equilibrium is disturbed by rapid changes in flow conditions. Examples of such conditions are; starting and stopping of pumps, rapid opening and closing of valves, pipe failures, etc.
A rapid change in the velocity Δv of water in the pipeline gives rise to a pressure increase Δp according to the formula:
The approximate wave celerities for HDPE pipes are as follows:
SDR WAVE CELERITY - M/S
33 190
26 215
21 242
17 270
13.6 307
11 349
9 395
7.4 450
It is important to note that the pressure increase due to water hammer in a particular class of pipe is a function of the change in velocity and it is therefore important (for this and other reasons) to keep pumping velocities in a pipeline within the conventional norm of 1 to 2 m/s. In general steps should be taken during design and operation to minimize the frequency and intensity of water hammer. However the total pressure may be permitted to reach a value 50% higher than the nominal pressure if the frequency can be described as “occasional”.
Since part of the formula for calculating wave celerity incorporates the ratio between diameter and wall thick-ness (SDR), which is roughly constant for all sizes within a pressure class, the wave celerities are also constant for all sizes within a pressure class.
By way of comparison the wave celerity for steel pipes is about 3-5 times higher than for HDPE – 1000 to 1400 m/s.
↓

TEMPERATURE MULTIPLY WORKING PRESSURE BY:
0 - 20°C 1
20 - 25°C 0.8
25 - 30°C 0.63
30 - 35°C 0.5
35 - 40°C 0.4
40 - 45°C 0.32
45 - 50°C 0.25
EFFECT ON PRESSUREPressure de-rating factors should be applied to HDPE pipes when operating temperatures rise above 20°C. The de-rating factors below are applicable to HDPE.
THE MAXIMUM RECOMMENDED WORKING TEMPERATURE IS 50°C
At lower temperatures, between 20°C and 0°C, the pressure handling capability does increase but it is recommended that this be ignored. In the unlikely event of water freezing inside an HDPE pipe da-mage is unlikely to occur. Nonetheless it is recommended that the pipeline system be protected against freezing to obviate flow restrictions.
TEMPERA-TURE CONSI-DERATIONS
EFFECT ON DIMENSIONSDue to the relatively high co-efficient of expansion and contraction (given in “Expansion and Contraction” earlier) it is necessary to make allowance for this in any design and ins-tallation which is exposed to wide variations of temperature.HDPE pipes will expand or contract by 0.2mm per meter per °C rise or fall in temperature. A 30°C
PR
ES
SU
RE
CO
NS
IDE
RA
TIO
NS
/ T
EM
PE
RA
TU
RE
CO
NS
IDE
RA
TIO
NS
16
— 1
7
↓

It has been well established by researchers over many years that, for flexible pipes, it is the interacti-on between the soil and the pipe which has to be considered more extensively than is the case for ri-gid pipes where the material strength of the pipe is the critical issue. The points discussed here are given as a guide only to good design by the engineer.
SOIL AND TRAFFIC LOADSThe vertical load on a HDPE pipe due to soil is a function of the trench width and depth, the unit weight and type of the soil and the pipe diameter and wall thickness. This loading must generally be corrected for the fact that the soil is cohesive and the side fill reacts with the fill above the pipe. Furthermore flexible pipes deflect and shed load to the side fill. This vertical deflection is limited by lateral soil resistance. The resultant load is therefore less than that which column theory suggests.
The Soil Loading graphs below show that, after initial rapid increases with increased depth, this rate of increase falls away to almost zero at depths of about 6 metres or more. Typical maximum values of soil loads (without live loads) are between 500 and 27000 N/m (for sizes up to 630mm), depending largely on soil type, modulus and pipe stiffness. As soil compaction is increased so the maximum soil load on the pipe reduces, assuming that good backfilling procedures have been followed.
If a 60KN live load is added then the soil load increases dramatically (if compaction is poor but less dramatically if it is good) at shallow depths, but from about 3 metres deep this difference becomes negligible.
As can be seen from the Deflection vs. Soil Load graph there is a straight line relationship between deflection and soil load for each size and class of pipe. Therefore when the soil load reaches a maxi-mum then the deflection is also at a maximum. These graphs include the maximum soil loads from the soil load graphs and as can be seen the maximum deflection (for the conditions represented) is less than 2% - for a 630 mm SDR 26 pipe - even with a 60 KN live load. This Deflection vs. Soil Load graph also shows that the small diameter, lower pressure-class pipes (thinner walls) are at the left hand side of the graph and are almost vertical while the bigger diameter, higher pressure class pipes are progressively further right and are not as vertical. Large diameter pipes carry more load because of their greater surface area – thicker pipes carry more soil load because it is more difficult to deflect them since less load shedding occurs.
The graphs have been based on calculations using values typical for reasonable backfill material which has been poorly compacted (soil modulus of 3 MPa) and on two scenarios – excluding and including a 60 kN live load. Trench widths of 0.4m, 0.6m, 0.7m, 0.8m and 0.9m were used for the following groups of pipe sizes: 50mm - 160mm, 200mm - 315mm, 355mm - 400mm, 450mm - 500mm and 560mm - 630mm. Different soil cover over the pipes were used, varying from 0.9m to 10m. The me-thod of calculation was provided by Professor David Stephenson formerly of Witwatersrand Universi-ty.
The effect of these loads on HDPE pipes is very similar to that on PVC pipes.
TRENCH LOAD CONSI-DERATIONS

TR
EN
CH
LO
AD
CO
NS
IDE
RA
TIO
NS
18
— 1
9

Calculations with a higher soil modulus (not shown), implying better compaction, show much lower deflection percentages and reduce the gap between the static soil load and the live load.

ABOVE GROUND IN-STALLATION
TR
EN
CH
LO
AD
CO
NS
IDE
RA
TIO
NS
/ A
BO
VE
GR
OU
ND
INS
TALL
AT
ION
20
— 2
1
For exposed above-ground pipework proper anchorage and support is essential. It must cater for thermal stresses or movement over the ambient temperature range to which the pipe system will be exposed.
Above-ground HDPE systems should preferably be installed at or near maximum operating tempera-ture. This will ensure that the pipe is thermally expanded when clamps or supports are bolted into po-sition and the pipe will be prevented from contracting. Tensile stresses will develop as the pipework cools, and the pipeline will therefore remain straight between supports. When reheated to installation temperature, any sagging will be minimized.
When suspending HDPE pipes the recommended centre distance between supports at various tempe-ratures is given by the following graph. The graph is based on PE63 material and SDR 11 and SDR 17.
As a rule of thumb the following adjustments can be made for variations in temperature and class:• Reduce the centre distance by 3% for every 10°C increase in temperature. • Increase the centre distance by 2.5% for every 10% increase in wall thickness above above/be-
low SDR 17.
Pipe clamps used for anchorage and support should have flat, non-abrasive contact faces, or be lined with rubber sheeting and should not be over-tightened. The width of support brackets and hangers should normally be either 100mm or half the nominal pipe diameter, whichever is the greater. Support brackets should allow free axial movement.
SUPPORTING DISTANCES OF HDPE AT VARIOUS OPERATING TEMPERATURES

BENDINGOne of the important features of using HDPE pipes is its flexibility. However it is important that the bending radius at any point should not be less than 20 times the pipe outside diameter when at an ambient temperature of 20°C. When lower temperatures are encountered it is necessary to progressi-vely increase the minimum bending radius by a factor of up to 2.5 times at 0°C.

BE
ND
ING
/ N
OT
ES
22
— 2
3
NOTES

OKE South Africa (PTY) Ltd.10 Dawn Road - Montague Gardens 7442 Cape Town / SOUTH AFRICA
T +27 21 5512464F +27 21 5512488info @ oke.co.za


