"Higher Education: Students at the Heart of the System" – an Analysis of the Higher Education White Paper John Thompson and Bahram Bekhradnia 1. The higher education White Paper, published by the Government on 28 June, followed the Browne report and the Government's statements about its policies on higher education in the light of that report. These were all underpinned by a philosophy of relying increasingly on competition between institutions, increased choice for students and greater diversity of institutions, which would determine the level of fees and lead to greater social equity and mobility. 2. This analysis follows and builds on the HEPI reports on the Browne review (Thompson et al 2010a) and the Government’s response to that review (Thompson et al 2010b). It is based on the White Paper itself (BIS 2011a) and the reports and papers published with it (BIS 2011b-f) as well as the HEFCE consultation on student number controls (HEFCE 2011a). Where we have quoted from the White Paper itself we indicate with ‘WP paragraph number’. Other sources are referenced in the normal way. 3. Rather than provide a commentary on the White Paper Chapter by Chapter, we have taken five themes and concluded by speculating as to what will happen. Details of our calculations are set out in the appendices. Reducing the public deficit 4 An end to the burden of quotas? 10 Well informed students? 20 Greater competition, more choice? 27 Improved social mobility? 33 What will happen? 49 References 63 Appendix 1: Costs of proposals Excel workbook Appendix 2: RAB charge calculations Separate document Appendix 3: Students’ backgrounds Excel workbook 1
Transcript
"Higher Education: Students at the Heart of the System" – an Analysis of the Higher Education White Paper
John Thompson and Bahram Bekhradnia
1. The higher education White Paper, published by the Government on 28 June, followed the Browne report and the Government's statements about its policies on higher education in the light of that report. These were all underpinned by a philosophy of relying increasingly on competition between institutions, increased choice for students and greater diversity of institutions, which would determine the level of fees and lead to greater social equity and mobility.
2. This analysis follows and builds on the HEPI reports on the Browne review (Thompson et al 2010a) and the Government’s response to that review (Thompson et al 2010b). It is based on the White Paper itself (BIS 2011a) and the reports and papers published with it (BIS 2011b-f) as well as the HEFCE consultation on student number controls (HEFCE 2011a). Where we have quoted from the White Paper itself we indicate with ‘WP paragraph number’. Other sources are referenced in the normal way.
3. Rather than provide a commentary on the White Paper Chapter by Chapter, we have taken five themes and concluded by speculating as to what will happen. Details of our calculations are set out in the appendices.
Reducing the public deficit 4
An end to the burden of quotas? 10
Well informed students? 20
Greater competition, more choice? 27
Improved social mobility? 33
What will happen? 49
References 63
Appendix 1: Costs of proposals Excel workbook
Appendix 2: RAB charge calculations Separate document
Appendix 3: Students’ backgrounds Excel workbook
Appendix 4: Fees required to maintain tuition funding Excel workbook
Appendix 5: Student number controls Excel workbook
1
Reducing the public deficit
4. On 20 October 2010, eight days after the publication of the Browne Review, the Treasury announced that by 2014-15 there would be a 40 per cent cut in the teaching spend for higher education.
5. On 3 November 2010 we learned more about the Government’s response to the Browne proposals.
‘The bulk of universities' money will not come through the block grant, but will instead follow the choices of students. It will be up to each university or college to decide what it charges, including the amounts for different courses. . . . We also propose to open up higher education provision to new providers, including further education colleges. These proposals offer a thriving future for universities, with extra freedoms and less bureaucracy, and they ensure value for money and real choice for learners.’
The Minister for Universities and Science (Mr David Willetts), House of Commons statement on higher education funding.
6. The Browne review proposal for no cap on fees was rejected, instead there would be a basic threshold of £6000 a year, and in ‘exceptional circumstances’ there would be an ‘absolute limit of £9000’. No student would have to pay ‘up front’. There was to be a very generous loan repayment scheme and increased student support through grants, loans, bursaries and scholarships.
7. The statement provided no explanation as to how Government costs would be controlled. In answer to a question about student numbers over the next ten years, the Minister replied that they envisaged ‘the absolute number of students remaining broadly flat, although we cannot be sure exactly.’ The Government’s cost estimates were based on this assumption, but there was no clear indication how a system which ‘followed the choices of students’ could ensure that student numbers did not increase. The Browne proposal for a control through a Government-defined minimum entry qualification level was neither endorsed nor rejected. That question was left for the promised White Paper.
8. The cost of the proposals is also highly dependent on the fee levels that universities decide to charge. HEPI concluded that there was ‘every reason to expect – not immediately but over time – most universities to increase their fees towards £9,000’ (Thompson et al 2010b). We used a value of £8850 in our modelling of the proposals, which was the figure we thought the sector would reach after a few years. The Government assumed an average fee less fee waivers of £7500 for its costing.
2
9. As universities announced their fees, it became clear that the Government’s assumption was likely to be an underestimate. In February, in its guidance to the Office for Fair Access (OFFA), it suggested that fee waivers should be encouraged and warned that, if this did not happen, it would seek new powers. In July 2011 OFFA published its agreements with institutions; the average fee across the whole sector, including those institutions (all further education colleges) without an agreement, was £8476, reducing to £82281 after fee waivers2. This meant that, even with fee waivers, as things stood, the Government could not implement its proposals and make the savings planned in the Spending Review.
10.The White Paper gives us the Government’s solution for controlling both student numbers and net fee levels. We describe and analyse these controls in the ‘An end to the burden of quotas?’ and ‘What will happen?’ sections.
Costs and savings of the new system
11. Will the proposals reduce public spending, and, if so, by how much? This is a question we addressed in our response to the Government’s proposals, but we return to it here now that the Government’s impact analysis has been published (BIS 2011b).
12.The new arrangements will be introduced in 2012-13, but these will not apply to continuing students. While the transition arrangements are very important for implementation, for this discussion we assess the costs and savings when the system is fully implemented. Though the figures we present here are in 2012-13 prices, they all refer to a system which is 100 per cent ‘old system’, as applies in 2011-12 and earlier, or 100 per cent ‘new system’ even though that will not be fully operational until the last 2011-12 entrant has left. Not all the assumptions used in the Government’s costings are published in its impact assessment, but it has made them available to us and we set them out in Appendix 1 along with the details of our calculations. As we did previously, we commend the Government for its openness with regard to this.
13. Students are not required to pay fees up-front, and in most cases it is expected that they will seek a loan from the Government. Since significant levels of repayments are not expected until 2016-17, in cash terms public expenditure will increase in the medium term. Now that public accounts are based on Resource Accounting and Budgeting (RAB), for public accounting purposes the cost of loans is taken from an
1 These figures are for 2015-16 (at 2012-13 prices) which were not included with OFFA’s first release of information. The figures that were published, for 2012-13, only include entrants and are therefore not representative of the system when fully established. 2 Throughout this report ‘net fee’ refers to fees less fee waivers. Fee refers to the fee before waivers, sometimes referred to as ‘headline fee’ to emphasise that waivers are not deducted.
3
estimate of the difference between the initial outlay and the expected repayments discounted to take account of inflation and the Government’s cost of borrowing. The figures we present here follow this procedure.
14. Apart from the reduction of the HEFCE grant, most of the changes to the new system involve increased costs. First and foremost the increase in net fee levels means bigger loans, and the generous repayment arrangements mean that the RAB charges for these loans are higher. Student support has also increased, with higher average maintenance loans and grants, and a new scholarship scheme is to be introduced. Table 1sets out the extra costs of the new proposals following the Government’s assumption of an average fee, less fee waivers, of £7,500.
Table 1: Increased costs of White Paper proposals (£7500 net fees) (£million, 2012-13 prices, to nearest £10 million)
Full-time net fee loans 1,320
Full-time maintenance loans 210
Full-time grants 150
National Scholarship Programme 120
Part-time net fee loans 350
Part-time study support grants -90
SLC and HMRC administration 10
Total increased costs (excluding reduction in grant) 2,070
Table 1 note: See Appendix 1 for assumptions and calculations
15. These £2.1 billion costs have to be taken off the gross savings of the £3.4 billion made by reducing the HEFCE grant3 .
Net fee levels and Government costs3 The £3.4 billion reduction in HEFCE grant is significantly larger than the £2.8 billion we assumed in our previous analysis taken from the Browne revue (Thompson et al, 2010b). The BIS £3.4 billion is derived from the BIS costing (see Appendix 1). This uses estimates for years after the end of the current Spending Review period (2014-15) and should not be viewed as official Government policy.
4
16. The total of £2.1 billion costs shown in table 1 depend on the assumption that fees less waivers will, on average, be set at £7500. If they are higher than this, the total debts will be higher as will the RAB charge, as more former students will fail to repay their loans in full. We do not have any Government estimates of RAB charges for other net fee levels, but we have made our own estimates using earnings assumptions consistent with a RAB charge for a £7500 net fee of 32.0 per cent, in line with the Governments estimates. (Details in Appendix 2). Table 2 shows how the costs of the proposals increase with increases in average net fee levels.
17. We can see that if average fees less waivers were to be charged at the £8228 institutions have agreed with OFFA, the savings would be £370 million less than expected. If the net fees reached the maximum of £9000 then the extra cost rises to £780 million pa. The expectation is that, were this to be the case, the Government would further reduce the HEFCE grant or possibly even cut student numbers.
18. Because of the measures that the Government has taken, net fees will be closer to the £7500 value assumed in the costings4. We show the extra costs for net fees between £7500 and £8000 in £100 steps. Note that these figures relate to a fully implemented system. Were the higher net fee levels to apply in 2012-13, the impact on Government savings in that year would only be about a third of the values shown, because the new arrangements would only apply to students starting in that year.
4 See paragraphs 194 to 197 for an assessment of how much the average net fee level will be reduced.
5
Table 2: Increased costs from White Paper proposals when fully implemented for different fee assumptions (£ million, 2012-13 prices, to nearest £10 million)
Table 2 note: See Appendix 2 for assumptions and calculations
Resource Account Budgeting (RAB) charge
22. The RAB rates used in the BIS costings are 32 per cent for full-time student loans and 65 per cent for part-time. (The White Paper quotes a figure of 30 per cent (WP 1.7), but it is unclear what that refers to. The two per cent difference is worth over £190 million pa in costs to Government. ) The high value for part-time reflects the large degree of uncertainty about the repayment profile of these students, and may turn out to be pessimistic. The cost of part time loans in total, even with this high RAB value, is only £350 million, so the consequences of repayments being less than expected is not as great as for full-time loans. The loan cost for full-time students is 74 per cent of the total increase in estimated costs, so any uncertainty in this estimate affects the total, and that is why this RAB charge on these loans is so important.
23. We understand that the modelling used by Government to derive their RAB values has been revised and has not yet been published. However, we have been told by BIS that the approach and data sources were similar to those used in the previous modelling, on which the BIS ‘Ready Reckoner’ was based. The Ready Reckoner, the tool used for the HEPI analysis, was prepared for the Browne Review to enable them to explore different options. Though it is a simplified version of the modelling used to derive the RAB values for Government accounts, there is no reason to think that it is unduly optimistic. The measures that Government have taken to ensure that net fees are reduced means that
6
the details of our previous results no longer apply - the Government has taken effective steps to reduce one element in the RAB cost; but our conclusion that the full-time student loan RAB values are both uncertain and optimistic still holds.
Why the RAB charges are uncertain
24. The repayment scheme was designed to keep repayments low and consequently a large proportion of the repayments are expected towards the end of the 30 year repayment period. This means that the RAB charge depends on long term forecasts of earnings. In a response by BIS to a request for information about the longer term accumulation of debt, we were told that forecasting student loan repayments ‘several decades into the future is inherently difficult and relies upon a great number of assumptions’. Hence the RAB is uncertain.
Why the RAB charges are optimistic
25. The male average earnings used in the BIS Ready Reckoner at the end of the repayment period is £99,500 pa (2016 prices)5. We do not have a comparable figure for the model used to derive the RAB used in the Government costings, but it is difficult to see how a charge of 32 per cent could be calculated were the earning assumptions to be lower. These high earnings arise from an extrapolation from past trends. Defending this extrapolation, Government has pointed out that the graduate premium has held up through decades of increasing participation in higher education. However, though the average premium has been broadly maintained, the distribution of graduate earnings has widened, both in the UK (Green et al 2010) and in the US (Brown et al 2011). This is important because a high proportion of low earners will lead to a high RAB, whatever the average earnings, and very high earners will not provide the same subsidy as the middling high earners.
26. The importance of these middling high earners to the overall repayments gives us more cause to view the RAB estimates as optimistic. These are the former students who earn enough to be charged an interest rate higher than the Government cost of borrowing. The repayment consultation refers to them as contributing to the ‘full cost of their tuition’ (BIS 2011d), but they would actually be contributing more than the full cost. The RAB charge for these former students is negative, without them the RAB charge would be higher. It is the case
5 Even with these very high average earnings the BIS Ready Reckoner, adjusted to give the correct proportions of males and females but otherwise with the BIS assumptions, with net fee loan of £7500 and maintenance loan of £4100 gives a RAB value of 35.8 per cent compared to the 32.0 per cent in the BIS costing. (See Appendix 2 for details.) Given that the data sources for the Ready Reckoner and the BIS modelling were similar, the difference in the RAB charge estimates is surprising.
7
that their payments would be less than they would have to pay if borrowing on commercial terms, but this does not mean that it would not be worth their while to pay off the loan, and deprive Government of the surplus repayments they expect to receive. This, rather than a desire to make the repayment system ‘progressive’, may be why Government is considering an early repayment charge. (The suggestion that such a charge would be progressive is hard to maintain. Those who were in a position to pay fees ‘up front’ would face no similar surcharge and those on the highest incomes would pay off more quickly without any charges.6)
What will happen if the RAB value proves too low?
27. If the RAB charge estimate is too low, then the long-term cost of the Government’s proposals would be significantly higher than anticipated. For example, if the charge were 37 rather than 32 per cent7, with the average net fee at £7500, the costs to Government would increase from the £2070 million shown in table 1 to £2560 million. A charge of 46 per cent would mean that costs would equal the reduction of £3.4 billion in HEFCE grant - the overall savings would be zero.
28. Unless the Government RAB estimates are challenged by the Office for Budget Responsibility or the Office for National Statistics, they will be used in National Accounts and the deficit reduction will occur ‘on paper’ whether or not the expected repayments are eventually made. If the RAB estimates are too low it will be the taxpayer who will have to make up the difference in the end, but that may not become clear for some time. However, an alternative estimate of the value of the student loans could arise if a decision is taken to sell them (WP 1.38 to 1.43.) The Rothschild feasibility study on how to ‘monetise the loan book’ will be awaited with interest. It does, on the face of it, look an unlikely option given the uncertainties and timescale of the repayments. And with loans rising to an estimated £190 billion8 it will be difficult to find a partner that will
6 Using the modified BIS Ready Reckoner we find that a former student with a starting salary of £40,000 has a RAB of -9.3 per cent, while a former student starting on £60,000 would have a RAB of -5.9 per cent. See Appendix 2 for details.7 London Economics estimated the RAB charge at 37.0 per cent in the work they undertook for BIS in estimating the returns to higher education (London Economics 2011), while the Institute of Fiscal Studies used a RAB value of 28.2 per cent in their estimates of the costs of the proposals (Chowdry et al 2010). Neither research group gave any information about the earnings growth underlying these estimates. 8 BIS have informed us that the amount borrowers are liable to repay (WP 1.39) will have risen to £101 billion in 2021-22 and will peak at £191 billion in 2047-48, both in 2011 prices. (The graph at paragraph 1.39 of the White Paper shows balances in 2010 prices.) We still do not know all the assumptions behind these long term figures. We have been told that: (a) student numbers remain constant, (b) current proposed levels increase with inflation,(c) average net fee loans in 2012-13 are £7500, (d) loan take up is 90 per cent for fees and 80
8
genuinely be taking the risk away from Government. If, however, arrangements are made to sell the loans we hope they are transparent, and the value of the loans to the taxpayer is not hidden under the cloak of commercial confidentiality.
per cent for maintenance loans. These are the assumptions also used in the impact costing, so it is likely that the other assumptions are also the same, in particular a RAB charge of 32 per cent.
9
An end to the burden of quotas?
29. The case for ‘liberating student number controls’ lies at the heart of the White Paper (WP 4.12 to 4.23). Quotas for student places are said to protect universities from competition and limit student choice, leaving little incentive for universities to focus on teaching (WP 2.7). Further, quotas, by specifying exactly how many students should be recruited, generate a burden on institutions (WP 1.1) and prevent sponsorship from employers (WP 3.33). We examine the issue of competition in the ‘Greater Competition, More Choice?’ section. Here we look at why there is a need to control student numbers, how it has been done in the past, whether the proposals will actually reduce the burden, and what are the obstacles to employer sponsorship.
A brief history of student number controls
30. The description of the existing arrangements in the White Paper is simplified and may be misleading. It is important to get a fuller understanding of the recent past in order to assess what is likely to happen as a result of the proposed changes.
31. A higher education system supported by public funds will usually involve some form of control of student numbers. The period of great expansion, when participation rates doubled between the late 1980s and the early 1990s, is an exception. Then the Government was prepared to increase public expenditure with increasing demand, though not in proportion to the increasing numbers of students. The difference was made up by the students who were not deterred by the gradual replacement of their maintenance grants by loans, and some HE providers who were willing to see their unit of resource decrease in a dash for growth.
32. The funding allocation methods for distributing the HEFCE grant that followed this expansion have all had the same basic structure. The guiding principle was and is to fund ‘similar activities at similar rates.’ Following the early 1990s there was a broad consensus that if quality had not already been eroded, any further decrease in the unit of resource would damage the learning experience, and, on the other hand, there needed to be some guarantee that Government got the provision it had paid for. The system was designed to maximise the freedom of institutions while meeting these objectives.
33. Each institution received a grant based on their historic numbers of students grouped into four different subject ‘price groups’. They were then free to recruit entrants and increase or decrease the numbers of students taking different subjects so long as the overall ‘unit of resource’ based on fee and grant remained within limits set by a ‘tolerance band’. Institutions
10
failing to recruit a mix of students sufficient to justify the maximum unit of resource would have their grant reduced in the following years. As additional funds became available, either through the recycling of grant reductions, or through additional funds from the Government, they would be allocated to institutions through a bidding process. These controls did not apply to students who were wholly funded for tuition by employers or other private sources, what were called ‘independently funded students‘. There were extra controls applied to students studying to be doctors and dentists. The controls based on a tolerance band were much looser than the quota that, as the White Paper puts it, specify ‘exactly how many students each institution should recruit each year’ (WP 1.1).
34. For 2010-11 and again in 2011-12 an additional control was applied9 to the recruitment of home and EU full-time undergraduate students, including independently funded students. Each institution had what the White Paper refers to as ‘quota’ of entrants which they must not exceed. Note that this does not apply to taught postgraduate students, or part-time undergraduate students, where the only control remains through the tolerance band. As with other part-time and postgraduate courses, part-time and postgraduate independently funded students are not controlled by a quota, nor are they subject to the looser controls based on tolerance bands.
Why were ‘quota’ controls introduced?
35. The weakness of the tolerance band system is that it does not control those drivers of public expenditure which increase with each additional student. Between the ‘planning number’ and the ‘tolerance band’ the number of students can increase, and the greater the excess demand the greater the cost to the Government of grants and loans, and so the greater the pressure to introduce quotas. For part-time undergraduate students the only unit costs were relatively small sums for the provision of means-tested grants for help with tuition costs, and the supply broadly met demand, so quotas were not needed. For taught postgraduate students there were no unit costs. Conversely, those independently funded students entitled to maintenance loans and grants, that is those on full-time undergraduate courses, generated unit costs and had to come under the quota. It is not the ‘grants from the Exchequer’ (WP 1.1) [assuming that refers to HEFCE funding] that leads to quotas, but the Government expenditure generated by loans for student fees and loans and grants for maintenance, which give rise to unit costs and therefore need to be tightly controlled.
36. The relationship between the demand for higher education from ‘all those who are qualified by ability and attainment’ and ‘who wish to do so [attend HE]’, and what funding Government has made available, 9 A similar ‘quota’ type control operated between 1994-95 and 2001-02.
11
determines whether quotas are needed. If supply meets demand, quotas are not needed. If demand exceeds supply, either the number of places needs to be controlled, or the supply increased – the latter paid for through additional funding or through a reduction in the funding per place or through a combination of both.
Controlling student numbers with the new arrangements
37. The transfer of public funding from the HEFCE grant to a subsidised loan for fees means that the public expenditure for each additional student will remain. Improved maintenance loans and grants further increase these unit costs. The introduction of tuition fee loans for part-time students means that the unit costs for these students also become significant.
38. The Government’s planned expenditure allows for no increase in student numbers and though there will be a decline in the size of the age groups from which most HE entrants come, the Government’s own analysis suggest that there will continue to be unmet demand10, a conclusion that mirrors HEPI’s conclusion in its most recent report on demand for HE (Coleman et al 2011). As the unit costs are likely to be at least as high as the Government has budgeted for (see paragraphs 16 to 18), the only potential for a growth in places is through an increase in the number of places sponsored by private sources, and indeed unless the Government succeeds in reducing unit costs or other expenditure it is going to have to reduce the number of places in order to stay within its budget. No estimate of the number of privately sponsored places is given and it seems unlikely that there will be sufficient to meet the estimates of unmet demand.
39. This combination of significant unit costs and probable excess demand suggests that controlling student numbers will become more important, and that controls will need to be extended to part-time undergraduate provision. Numbers must therefore be controlled at the sector level, but at the same time the Government wishes to relax the controls over institutions’ recruitment.
40. In addition, as we have seen, the Government assumed that the average net fee with be £7500, so that it also needs to create a mechanism for reducing costs to match its assumptions (and therefore budget).
41. This is the context for the White Paper proposals for a new system with two features: the ‘High achieving threshold’ and the ‘Core and margin’ model.
10 See BIS 2011b, page 68.12
‘High Achieving’ threshold
42. A threshold for the designation of ‘high achieving’ students is defined by the Government. Initially this will be defined as at least AAB grades at A-level or equivalent11. (We will refer to these qualifications and the students with these qualifications as ‘AAB+’. Qualifications below this will be referred to as ‘non-AAB+’.)
43. Institutions will be able to recruit AAB+ students without limit, so long as they are not studying to be doctors or dentists who are to continue to be subject to separate controls. The sector-wide control of student numbers depends on the following assumptions.
a. The average number of years spent studying does not increase. The average length of course would increase if there were a greater take up of longer courses or if there were a reduction in non-completion.
b. The growth in the number of well qualified students is not greater than the HEFCE estimate. The risk is that the system itself will result in an above-trend rise in AAB+ results.
c. The entry rate to English providers does not increase. An increase in the number of places at high prestige universities could result in students who otherwise would study outside England, or not at all, taking places in the English sector.
44. If one or more of these assumptions leads to an under-estimation of the number of AAB+ students that enter higher education in England, it will be possible to make an adjustment in the following years to the non-AAB+ number used in the ‘core and margin’ model, described below.
Core and margin
45. Each institution will be assigned a number of home and EU full-time undergraduate entrants based, with some modifications, on their historic numbers. From this adjusted historic total a number of AAB+ entrants will be taken off. This AAB+ reduction will be based on each institution’s reported number of such entrants with an adjustment for the number of entrants where the ‘high achieving’ attribute is unknown. Finally a further reduction of about 8 per cent (the ‘margin’) will be made from the remaining total of each institution whose average fee with waivers is more than £6000 and put into a ‘margin pool’. This remaining ‘core’ is the institution’s initial quota for non-AAB+ entrants. 11 The proposed equivalents to AAB grade A-levels are set out in Annex C of the HEFCE consultation (HEFCE 2011a). The definition has been chosen on pragmatic grounds in order to define a ‘predictable, stable population’.
13
46. HE providers will be able to bid for margin pool places released through the 8 per cent reduction, so long as their average net fee would be less than or equal to £7500, were the bid to be successful.
47. In 2012-13 the non-AAB+ quota will only apply to EU and home full-time undergraduate entrants, but the HEFCE consultation12 makes it clear that from 2013-14 controls are likely to be extended to total student numbers rather than entrants, and that it will be extended to part-time students. This would represent an increase in the scope of quota controls compared to the current system.
Fewer controls?
48. The impact of these changes differs for different groups of institutions, which will fall into one of five situations, or somewhere in between.
The most selective universities – almost all AAB+ entrants
49. These institutions will be able to expand at will; there will be no more quotas. In theory they will be competing with other universities for a limited number of AAB+ entrants, estimated at about 65,000 in total, but in practice their reputation and prestige would ensure that they would be preferred by many students over other universities, even those with excellent teaching, good outcomes and generous bursaries. However, even these most selective universities would not be totally free from controls. If they wanted to recruit more students with discounted or ‘contextual’ offers, or applicants with qualifications they judged to be of equal standing to AAB+ which were not on HEFCE’s list, they would be limited by a very small non-AAB+ quota. Should such a situation arise, no doubt a fix could be devised with HEFCE, but that would involve a complication to the system.
Other universities with significant numbers of AAB+ entrants and net fees over £7500
50. In theory these universities could reduce their fees and/or greatly increase fee waivers to bring the average net fee down to £7500, but this would not be seen as a viable option. These institutions will be vulnerable to losing some of their AAB+ students to more selective, more prestigious, institutions, and will at the same time be competing with their peers both to hold onto their existing and to recruit additional such students. This is likely to give rise to an arms race of ‘merit-based’ scholarships exclusively available for AAB+ students – if one university offers them others will be obliged to do so too or risk losing AAB+ students13. The upshot may be that there will not in reality be a large movement in AAB+ students, but
12 See paragraph 164 of HEFCE 2011a.14
these universities will pay a high price to maintain their AAB+ numbers. They will also lose 8 per cent of their remaining quota. To maintain their numbers they will have to recruit AAB+ students from other less selective universities. Ultimately, and if these are unsuccessful, they will have to reduce their net fees to £7500 in order to win back some of the numbers cut from their quota, or else, over time, they will become unviable
51. Some of the universities in this group, with larger numbers of non-AAB+ students, could be in the position of having to turn away students with, say, ABB applying for popular courses for which they are quite willing to pay in excess of £7500.
Universities with mainly non-AAB+ entrants and net fees over £7500
52. These universities will be forced to reduce their fees and/or greatly increase fee waivers to bring the average net fee down to £7500. Some may delay the decision for a year, but in the medium term there is no credible alternative.
53. Having reduced their net fees these institutions will have the opportunity to bid for ‘margin’ places, either to make up for the places that have been cut, or to expand. To retain its non-AAB+ quota an institution will have to enter this bidding competition on an annual basis.
Institutions with non-AAB+ entrants and headline fees above £6000 and net fees of £7500 or below
54. These institutions will be in the same situation as those who have reduced their fee to £7500.
Institutions with non-AAB+ entrants and headline fees of £6000 or less
55. These institutions will not have their non-AAB+ quota reduced in the creation of the margin. They will only have to enter the bidding competition if they want to increase their quota. Similarly, new providers will also have to bid for places even if they are charging £6000 or less. (NB private providers will not be able to bid in 2012-13.)
13 Sir Steve Smith, president of Universities UK and vice-chancellor of Exeter University, said in an interview with the Sunday Times (31/07/2001) that AAB+ students will ‘become like gold dust’ to universities. Research into the impact of bursaries suggests that differences in inducements of £2000 or less have no measurable impact on student choice (Cover 2010). To be effective universities would have to spend much more that this to ‘buy’ students; they would therefore have to restrict inducements to those applying to their departments most at risk.
15
An ever reducing core
56. The White Paper makes it clear that over future years the AAB+ threshold will be lowered (WP 4.19) and the quota cuts to create a margin will be repeated each year and the size of the margin will increase (WP 4.21). It is not clear at what point this twin reduction in the non-AAB+ quota of student allocations will stop or what kind of sector will be created. We set out some suggestions in the ‘What will happen?’ section.
57. Reducing the ‘high achieving’ threshold would create greater uncertainties because those with lower qualifications have lower HE participation rates, so the scope for unplanned growth is correspondingly greater. Also, the identification of qualifications equivalent to A-levels would become more difficult and complex, which would further increase the uncertainty as to how many students would be recruited. As the core shrinks, the scope for correcting any underestimation of the numbers of ‘above threshold’ students would be reduced. Reducing the threshold can only be done in steps, for example lowering it to ABB/AAC+ would increase the number of ‘above threshold’ students by about 46 per cent, lowering it to BBB/ABC would increase the threshold by about 76 per cent14.
Reduced burden?
58. Until the new student control system is operating it is hard to say whether the net effect of these changes will be to increase or decrease the burden on institutions. It is clear that:-
a. All institutions will still have a quota for some of their recruitment – most will have a quota for the majority.
b. The non-AAB+ quota will be extended to part-time students, and possibly to total student numbers.
c. A large number of institutions (those with headline fees of more than £6000 and net fees less than or equal to £7500) will have to go through a bidding process simply to retain their non-AAB+ quota, and they will have to do this year after year. The HEFCE consultation document makes it clear that in order to be successful, institutions will have to put their bids together with attention to detail. There is a signal that a case to restore student numbers based on the standing of the institution will not be sufficient. Institutions are encouraged to put in bids based on focussed
14 Figures supplied by HEFCE. There are uncertainties caused by unknowns and the identification of equivalents – they should only be taken to give a broad indication of how the ‘high achieving’ group would increase with a change of threshold.
16
proposals for particular provision, like courses15. Previously institutions have only had to prepare such proposals if and when they wanted to bid for an increase in student numbers.
59. There are also some new burdens. For example, the data that have been provided on entry qualifications are no longer fit for purpose16. With the pressures being exerted through cuts in funded places there is bound to be a search for loopholes, which HEFCE will then have to counter, creating an increasingly complex system with its associated burden.
60. The AAB+ threshold is designed to give a predictable and stable population with the simplest possible definition. It is viewed as an instrument for controlling student numbers but, having been established, it will take on a life of its own with unintended consequences. For example, it is likely that ‘merit’ scholarships are likely to be awarded to entrants with AAB+ qualifications, which will give an incentive to gain those grades in any way possible, like, for example, taking the same subject with two different examination boards. The fix will be to eliminate duplicates, as is done with calculating the UCAS tariff. This is not a problem in itself, but systems become complex and burdensome through the cumulative effects of many small refinements like this.
61. The admission process will become more difficult to administer. Currently institutions have to ensure that they recruit the right number of students. In future they will have to try to recruit the right number of students below the ‘high achieving’ threshold, which will introduce a whole set of new complications. The most obvious risks to institutions arise from recruiting too many non-AAB+ students, but if they under-recruit these students, there is a risk that their core will be reduced. There is no guidance on this point, but it seems unlikely that HEFCE would allow a university to carry forward a non-AAB+ quota from one year to the next if there were significant under-recruitment. As well as the increased burden these complications could lead to, they have implications for ‘fair’ access. We consider those issues under the ‘Improved social mobility?’ section.
62. The balance of these considerations is that the quota to which many universities will be subject will be more limiting, extensive and burdensome than those to which they are subject at present.
15 See paragraphs 136-139 HEFCE 2011a 16 The data that HESA prepared for the consultation (HEFCE 2011a) showed that in 30 per cent of cases the status of the student as AAB+ or not could not be determined. Where a student has an HE qualification the A-level or equivalent qualifications are not recorded. This is important in some circumstances, as when an HND or Foundation Degree qualifier is applying for a first degree course.
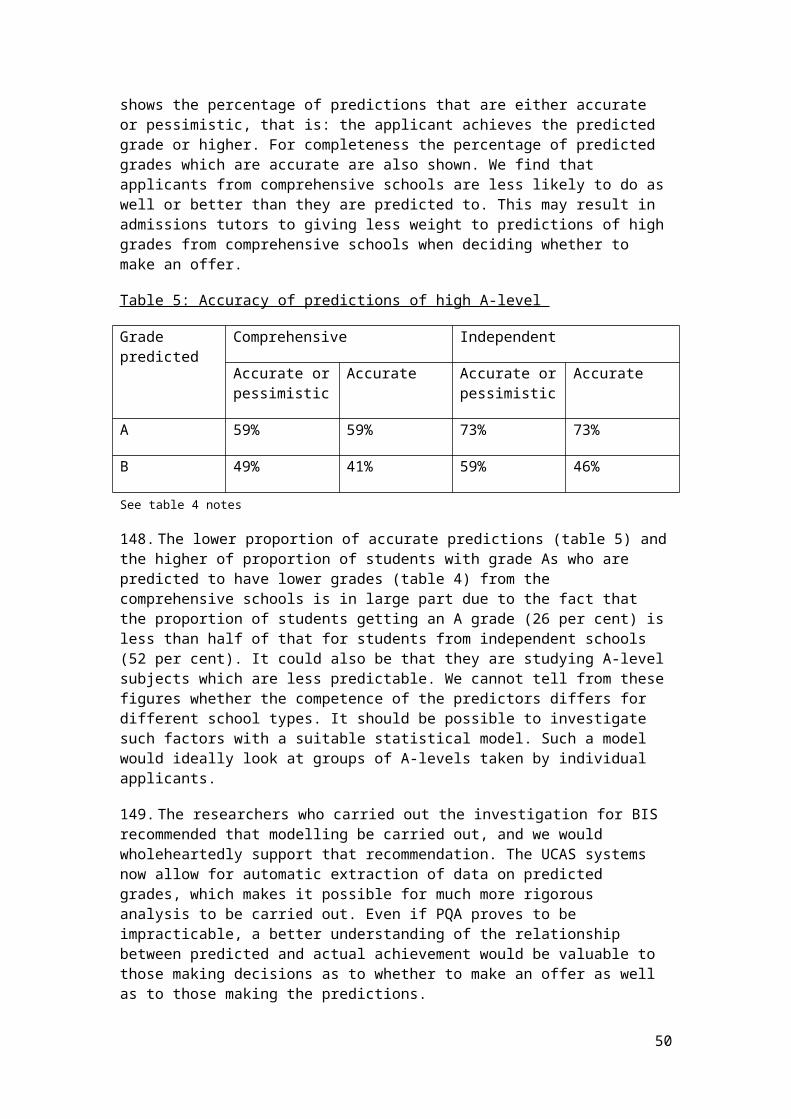
17
Employer and charity sponsorship of places
63. According to the White Paper, ‘institutions have no incentive to encourage employer- or charity-supported places because such places count against an institution’s student number limit, even if all costs are covered by the sponsor’ (WP 4.22). In fact, this only applies for sponsorship of students on ‘open’ full-time undergraduate courses with all maintenance as well as tuition costs paid for. Here ‘open’ means a course available to any suitably qualified candidate, not restricted, for example, to employees of particular companies. We do not know exactly how many students fall into this category, but the number is likely to be low17. If desired this disincentive could be eliminated with a small technical change, and is not dependent on the radical reforms proposed.
64. In most cases courses attracting employer sponsorship, covering all the costs of both tuition and maintenance, are likely to be tailored to the employer’s needs, and hence will be ‘closed’, that is they are not open to any suitably qualified candidate. A good example is the KPMG school leavers programme quoted in the White paper as an exemplar (WP 5.35). However, students on closed courses are not actually included in the current quota because they do not qualify for maintenance grants and loans. The White Paper refers to the 6000 students (not entrants) on such courses. Of these, 21 per cent - around 1200 students - are full-time undergraduates, most of them sponsored by public sector employers18. The remaining 79 per cent would not be restricted by the current quota even if the courses were open.
65. There is no disagreement about the value of employer involvement, but the removal of the very limited restriction identified in the White Paper, is unlikely in itself to lead to a significant increase in places. The difficulty of attracting employer- involvement and support is illustrated by the fact that ‘employers have been steadily less interested in investing resources’ in sandwich placements (WP 3.34), despite the proven benefits to employers, as well as students, of such arrangements.
66. There is a risk that sponsorship could be misused to buy places on oversubscribed courses. This is recognised in the White Paper (WP 4.23) 17 Between 2002-03 and 2009-10, when there were no quota restrictions, the average number of home and EU full-time undergraduate students reported as being independently funded was 160. This will be an underestimate because institutions were not required to return students as independently funded. On the other hand, we do not know whether these students were receiving maintenance loans or grants from public funds. If they were they would not come under the scheme proposed in the White Paper. Source HEFCE HESES and HEIFES returns, columns 1 and 2. Information provided by HEFCE.18 Data provided by HEFCE. Numbers refer to HESA standard population counts of students at English HEIs on closed courses in 2009-10. Three quarters of the students are studying for qualifications related to the health sector, the probation service, the police and the military.
18
which sets out the principles that must be adhered to to prevent this happening. We set out our concerns about this in the ‘Improved social mobility?
19
Well informed students?
67. In Chapter two of the White Paper it is argued that better informed students will drive teaching excellence by taking ‘their custom to the places offering good value for money’ (WP 2.24). This is taken as a given. We discuss to what extent it is likely to be the case, in the section ‘Greater More competition, More choice?’, and conclude that the impact of better information may not be as dramatic as is suggested. However, we do recognise the value of information whether or not it has quite the effect on teaching that the Government expects. Even if the information does not often sway prospective students to choose this course or that, the more they know about what to expect, the better they should be prepared.
68. HEPI therefore shares with the Government and most other commentators the view that the provision of reliable, relevant and comprehensive information is important for prospective students and for all those with an interest in higher education. We also agree with most of the measures proposed to further improve the collection and dissemination of information set out in the White Paper. Indeed HEPI has pioneered the collection of data on the time spent in different learning and teaching activities (WP 2.3). However, there are huge challenges involved in providing information to help students choose courses, and in failing to recognise this there is a consequential underestimation of the resources and commitment required to make progress.
What we have already
69. While it is acknowledged that there is not an issue with the ‘existence or collection of data’ (WP 2.9), there does not seem to be an appreciation that the information available about the UK higher education sector, when judged by its coverage, consistency, accuracy and scope, is probably the best in the world. Not only are the data collection systems of the highest quality, but data have been linked using leading edge techniques to provide information more efficiently, and with greater accuracy. The situation is summed up in the BIS supporting analysis for the White Paper.
“There is a large amount of information available to prospective students about the value of undertaking HE (such as employment prospects, earnings of previous graduates, the different courses available, the quality of those courses (for example, student satisfaction surveys, success rates), as well as various league tables, reputation and marketing). The amount of information available, the tools to analyse the information and increased provision of independent websites with tools to facilitate sorting and comparing information, is making it easier for students to use and compare courses and HEIs” (BIS 2011c, page 105)
20
70. The authors go on to say that ‘there is still room for improvement in the type, consistency and quality of information provided’, and we would agree with that as well, but these further improvements will not be easy: otherwise they would have been implemented, and so the gains will necessarily be marginal given what has been achieved already.
Future improvements
71. Efforts are being made to improve information provision. These planned improvements are described in the White Paper itself (WP 2.1 – 2.24) and in a HEFCE consultation (HEFCE 2011b).
72. The ‘Key Information Set’ (KIS) project aims to ensure that all the relevant information for comparing courses is available and accessible. One of the biggest challenges is to prepare data which are consistent across the whole sector, yet which relate to highly specific institutional programmes. What the KIS project will do is to create a link between sector wide datasets and these individual courses, process the data centrally, thus ensuring consistency, and then make the final course Key Information Set available to each university to host on its own web site as well as centrally on a new website. These developments will improve presentation along with the incorporation of new information.
73. There is also a need to improve the accuracy of data on graduates and other leavers. As the Minister for Higher Education and Science has pointed out, these data are more reliable than their equivalents in the USA (Willetts 2011), but they still suffer from all the disadvantages of survey data. The solution is to get more accurate and complete data by linking to other data generated from operations, like the data that are held by the Student Loan Company (SLC) and HMRC. With the computing power now available, and the experience of data linking, this is technically possible, but resolving the data protection issues is unlikely to be straightforward and it is likely to be some years before we see any results19.
74. Advice and guidance in finding and using information is important, particularly for prospective students whose family and friends have limited knowledge of higher education. The success of the proposals to improve guidance (5.9 – 5.16) will be crucial if the benefits of improved information are to be realised.
19 The data linking has the potential to obtain information as graduates have progressed into their career, say five years after graduation, which is very difficult to do through a survey. However, even these alternative sources are not without difficulties. Not all former students take out loans, and the links with HMRC data may not be good enough for courses with small numbers of students.
21
75. So far there has been an information gap between HEIs and further education colleges. In the future data will be collected to provide consistent information from all higher education providers designated for student support, including private providers20.
Why is providing and using information on courses so difficult?
76. If the activities described above are successful, resulting in more complete and accurate data, will we then have what prospective students want and need? The answer, unfortunately, is, ‘not always’. This is because for information to be useful it must be timely and robust. The problems are most severe with a new course where there is no information at all for many items. Nothing, short of inventing a time machine, can fix this.
77. But equally insurmountable obstacles exist for long standing courses. Consider information on the employment of former students after they have left university. It is generally agreed that information about employment about three years after graduating is much more relevant than that after six months when the main ‘first destination’ survey is carried out, because graduates often spend time in temporary employment or further study before they start their career. There is a later survey but the costs are much greater and response rates much lower. It may be possible to collect more accurate and complete data, possibly through data linking, but the prospective students using the information will be starting the courses at least seven or eight years after the students whose careers they hope to follow.
78. Not all data have such a long lead time, but that still does not mean that useful data will be available. Take, for example, the proportion of students who continue studying beyond their first year (i.e. those who do not drop out). These data are accurate and timely, yet for many courses there are too few students to calculate a reliable statistic. The only possibility is to combine data from cohorts in different years, which takes us back to the problem of timeliness.
79. This means that even if all the planned improvements are successfully implemented, many prospective students still will not be able to access the information they want. This does not mean that it is not worth making these improvements, but we should do so with realistic expectations.
20 Chapter 2 of the White Paper refers to ‘higher education institutions’ only. At 6.13 it states that institutions that want their students to access loans and grants will need to publish more detailed information, without specifying that it should be as extensive as is required of HEIs. However, the HEFCE consultation makes it clear that HEIs, FECs and private providers that subscribe to the QAA (HEFCE 2011b) will need to provide the same data.
22
80. Finally, even when information is timely, accurate and robust, it still sometimes needs some care and contextual information if it is to be interpreted. Take, for example, the proposal to publish the typical entry qualifications of previously successful applicants. This could give the impression that there are only a few, very narrow entry routes, when in fact there are options for candidates with non traditional qualifications21. It would be difficult to provide such context on the web itself, and to reinforce the need for expert advice and guidance.
Management, expertise and resources needed to develop web based course comparison tools
81. Under the heading, ‘presenting information more imaginatively’ (WP, 2.16) it is proposed that holders of student data should make data available to facilitate the provision of information. It is suggested that the data are made available on websites. This is likely to run into problems with data protection rules, but other ways can and have been found. For example, the National Student Survey is made available in a file format suitable for Newspapers and others to create their own tables.
82. The thinking behind this proposal only becomes clear on reading the BIS impact report.
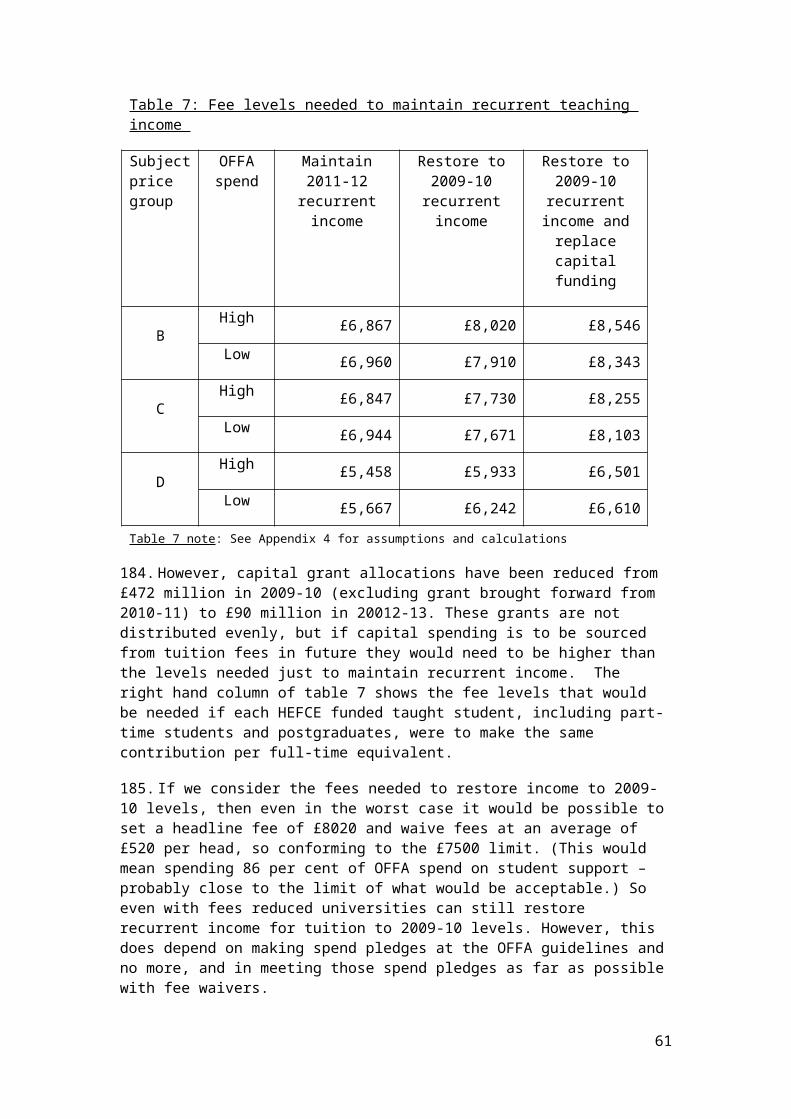
‘The Government does not have the resources to develop commercial standard information tools (such as consumer price comparison websites) and the current Government supported website, Unistats, has relatively low usage. So our long-term strategy is to ensure that relevant student data is made available to third party providers, so that they can turn the raw data into meaningful information, innovatively presented.
However, it will take time for third parties to come into the information market, so we are taking action to help improve existing information sources such as HEI websites and Unistats.’
‘Whereas Government is not equipped to develop commercial standard web tools, we are convinced that - armed with the data they need - private providers will provide the investment and innovation needed to re-present information to students in an interactive, personalised format’ (BIS, 2011b, page 56)
83. These statements show a misunderstanding of what is required and a disappointing lack of commitment.
84. Despite stating that information is ‘fundamental to the new system’ The Government ‘does not have’ (or cannot find) the resources to develop information tools. According to the BIS impact assessment (BIS 2011b) the 21 This example was provided by the BIS impact assessment, see BIS, 2011b, page 62.
23
Government plans to spend £150,000 pa on information provision. To put that in context it is expected that the Student Loan Company and HMRC running costs will increase by £10 million pa with the introduction of the new fee and repayment schemes. Given the importance placed on information to the proper working of the new system, and given the new role that the Government sees for HEFCE as ‘consumer champion for students’, this is a serious abrogation by the Government of its responsibility.
85. The references to ‘commercial standard information tools’ show that there is little understanding of what is involved. In many respects the web facility for student information is much more complex, and it is certainly different, to most commercial web sites. In the development of the predecessor to Unistats, the software developers had great difficulties. Their experience and expertise in building commercial systems did not prepare them. It is now clear that the development of Unistats involves two distinct skills, one for data manipulation, the other for web design.
86. According to the BIS Impact Assessment Unistats ‘has relatively low usage’. Research commissioned by HEFCE (HEFCE 2010) found that 29 per cent of prospective students had used the site, and of these 79 per cent found it ‘useful’ or ‘very useful’. This compares with the most used source, university websites, with 88 per cent and 90 per cent respectively. These figures suggest that making Unistats more well known is at least as important as improving the site. Loading the Key Information Sets on both Unistats and on the university sites with links back to Unistats should get the information used more. It would also be helpful if Unistats were promoted in schools and those working in the careers service.
87. The Government seems to view the development of Unistats as no more than a stop-gap, believing that private providers ‘will provide the investment and innovation needed to re-present information to students’ and that this is how students will become better informed.
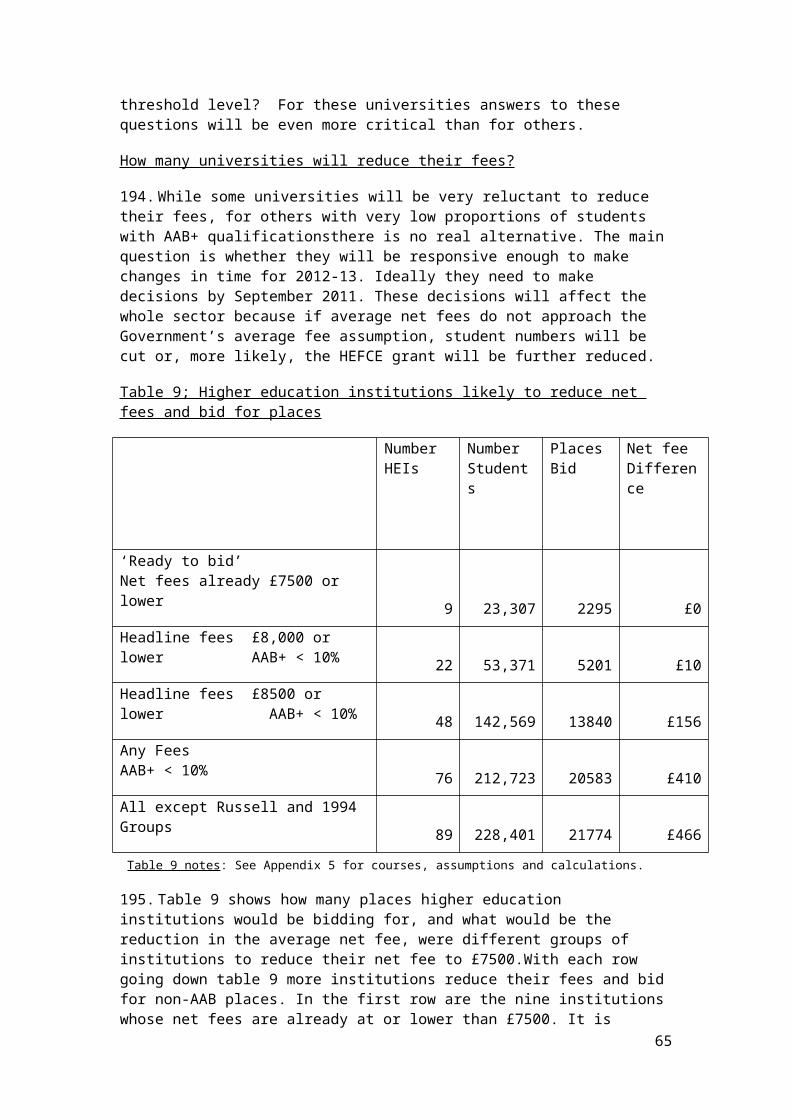
88. Third parties should continue to be given access to data and this service can be extended where possible, but this is quite different from seeing the provision of data to private providers as the main strategy for giving students the information tools that they need.
89. BIS does not outline the business model it expects these private providers to adopt; we must assume that in most cases their income will be through advertising revenue22. It may be possible to separate these
22 Of the three providers mentioned in the White Paper, the ‘Student Fact File’ does not provide course or even institutional level data and is not relevant. Of the other two, the Push website has advertisements, including advertisements for particular courses and institutions, while the bestcourse4me website relies on sponsorship from supportive companies and organisations.
24
advertisements from the content, but there can be no certainty that this will happen. Further, in order to maximise the income from advertisements there will be a strong incentive to increase the number of hits, which may create a preference for the ‘interesting’ or even the ‘sensational’ over the ‘informative’. The US based ratemyprofessors website has 10 million student comments and, no doubt, a huge hit list. Promoted as a fun way to choose the best courses and professors it includes ratings of professor’s appearance as ‘hot’ or ‘not’, and ratings of ‘easiness’ - useful for finding a module which will not involve hard work. This is not to say that every private provider would emulate ratemyprofessors, but it does show how high usage can be achieved. It also indicates why it is unwise of the Government to duck its responsibility in the key matter of information provision.
90. This is not to view private providers as a problem; they do not have the same responsibilities and are freer to ‘publish and be dammed’. So when the Push Guide first published ‘flunk rates’ this strengthened the case for the publication of official non-completion and qualification rates23. It is unlikely that Unistats will follow ratemyprofessors and publish how hot university teachers are, but it is possible, even likely, that a private provider will pioneer the publication of some information which later gets taken up by those developing the Key Information Set and Unistats24. For information provision to evolve and improve we need both Government supported and private providers.
91. Where HEFCE has identified a software development as being of critical importance, it has usually been able to find the resources. It is to be hoped that the case for an authoritative students’ information website is made, the resources found, and that a long-term and continuing development established. Given the importance the White Paper attaches to well informed student choices, not just for the direct benefit of those students themselves, but as driver for improving quality, it is greatly to be hoped that the Government will rethink its proposed approach to information provision.
23 The Push Guide rates first published in August 1998 were grossly inaccurate. For example they showed the University of Cambridge had a ‘flunk rate’ of 11%. The first official institution completion and qualification rates for the whole HEI sector were published in December 1999.24 The first set of information on time spent indifferent activities, while raising important policy issues about the sector, was not robust enough to safely inform student choice, but its publication by HEPI has led to plans to collect these data systematically. bestcourse4me has a facility to enter a career and find out the proportion of graduates, and other information. The lack of precision in specifying a career, and the data quality means that it is not of real practical use, but it may act as a prototype for future developments.
25
Some reservations about publishing data on individuals
92. Under the heading of ‘student engagement’ (WP 3.7) it is proposed that summaries of student evaluation of teaching surveys (SETs) on individual lecturers and modules should be published on universities’ websites to ‘inform student choice and stimulate competition between peers’ (WP 3.7). It is asserted that this will help ‘to drive an improvement in the quality of teaching’.25
93. In the UK such surveys have not usually been used in this way26. Information from SETs would typically be used alongside peer observation and appraisal as part of professional development. Publishing module level student feedback alone could undermine its use in this way.
94. Competition need not be incompatible with team work and co-operation, but if competition becomes too strident there could be a problem. Almost always serious problems with the quality of students’ experience are due to organisational and managerial failure, rather than the inadequacies of individual lecturers.
95. Some will take a more tough minded view, though there will be wider agreement that decisions as to whether and how to use SETs should be left to universities themselves. For the Government to ‘expect all universities to publish’ summaries of SETS ‘by 2013/14’ is embarking on the kind of micro-management it has said it wants to avoid.
25 Neither the White paper, nor the BIS supporting analysis provide, an evidence for this assertion. It may be that in the US where students take a large number of units from many different departments they do find SETs useful in choosing their units.26 A survey of UK HEIs found that where institutions collected student feedback to measure teacher performance the information was confidential to the person concerned and sometimes their line manager. (Brennan,et al 2004).
26
Greater competition, more choice?
96. A theme running through the White Paper is that the quality of the academic experience is compromised by a lack of competition. The solution is to replace the ‘burdens of bureaucracy’ and student number quotas ‘determined in Whitehall’ with the ‘forces of competition’. In this way ‘excellent teaching will be placed back at the heart of every student’s university experience’ (WP 2.24)27.
97. This argument contains elements of truth; it is likely that constraints on competition weaken the drive to improve teaching. However, the analysis in the White Paper is based on a misunderstanding of the factors driving universities’ behaviour, the nature of competition within higher education, and what constrains that competition. It follows that the prescription put forward to increase effective competition is, for the most part, likely to be ineffective or even damaging.
What drives universities’ behaviour? 28
98. Almost all higher education teaching in England is provided by not-for-profit organisations. While they have a keen interest in raising revenue, this is to ensure there are the resources to recruit and retain high quality staff, and to maintain and improve the infrastructure. They are not driven to maximise profits, and increasing income is a secondary, not a primary aim. Under most circumstances29 universities do not see growth as a priority, though growth in a particular area may be a means to an end.
99. It is difficult to describe exactly what it is that universities are attempting to maximise. To some extent it will differ for different institutions, but it includes some combination of quality, reputation and prestige, as reflected in the quality of their research and their ability to attract students, particularly students with high academic qualifications or potential to excel. The relative important of teaching, research and other
27 The hint of a former golden age, as in ‘placed back’, is found throughout the White Paper. When and where they are referring to is not explained.28 The analysis in this section and that headed ‘Nature and extent of competition’ owes much to that set out in the BIS supporting analysis, BIS 2011c, pages 111—115. 29 The expansion that took place in the late 1980s and early 1990s is an exception. The polytechnics and some further education colleges which became ‘new universities’ expanded rapidly with enthusiasm. There were many reasons for this, but the motivation for expansion was not the same as that of a firm seeking to maximise profits. For some it was seen as passing opportunity to gain university status. In some fields excellence in research involves achieving a critical mass, and thus the striving for excellence has entailed growth for some universities.
27
activities will differ for different institution. The elaboration of what high quality teaching means will be specific to the subject area and institution.
100. Those constructing league tables are trying to measure what makes one university better than another, something close to what universities are trying to maximise. The attempts are clumsy, and necessarily so, because the data that they have available are not subtle enough, and there is not one sort of ‘better’. But it would be unwise to dismiss league tables as irrelevant. Research commissioned by HEFCE (HEFCE 2008) showed that the senior management and governing bodies of all universities pay a great deal of attention to them, so much so that it would seem that league tables do capture something of what universities are trying to achieve. Or at least that they influence those that universities are trying to reach. Entry qualifications and highly correlated measures like completion rates and degree class, as well as measures of research quality, usually form the main component of league table scores. Most league tables do not assume ‘big is beautiful’ which is also consistent with our description of universities’ priorities30.
The nature of competition within higher education
101. The tradition of studying away from home in England means that students have more choice than in many other countries31. For those students living in the large conurbations, there are wide choices even if they decide to stay at home. Part-time and mature students, who could be restricted by geography, often have more than one institution from which to choose, and also have opportunities through distance learning at the Open University and many other institutions. So, more than in most other countries, English students have a choice as to where to study. Even with quotas in place, universities cannot and do not ignore the fact of this student choice. For ‘selecting’ universities, with a surfeit of applicants, their concern is to maintain the quality of their student uptake. For ‘recruiting’ universities, that is those that accept students with lower grades, their imperative is sometimes to ensure enough students are enrolled; and if demand is buoyant, they too will seek recruit the students with the most potential.
102. The situation was summarised in the BIS supporting analysis as follows.
‘HEIs do compete with each other in the current system, particularly on non-price factors, but also on price for some groups of students – particularly international and postgraduates. Current competition is
30 An important exception is the Shanghai Jiao Tong University Institute of Higher Education ‘Academic Ranking of World Universities’. It does have a curious partial adjustment for size but these still results in a bias towards larger institutions. 31 20 per cent of young, full-time, first degree entrants live at home. (HEFCE 2009)
28
providing a constraint on HEIs to be more efficient and innovative, but there is potential that the changes being made will increase competition between HEIs.
Student behaviour is important and provides a constraint on HEIs. Non-price factors are central to the nature of competition and influence student choices, particularly around the courses on offer, the quality of teaching and learning (including the facilities) and reputation’ (BIS 2011c, page 117)
103. Note that the authors write that ‘there is potential’ for the White Paper proposals to increase competition, somewhat more nuanced than the claims in the White Paper itself. The changes proposed will do very little to increase effective competition because they do not recognize what causes it to be restricted.
How competition is curtailed and made less effective
What the White Paper says about the lack of competition
104. Student quotas are identified as ‘protecting universities from competition for students’ and thereby giving ‘little incentive to focus on teaching’ (WP 2.7). There is no recognition that these quotas only apply to full-time undergraduate home and EU students, and that even for these students quotas were only re-introduced in 2009-1032. It is the case that before the quotas were reintroduced there were constraints on the numbers of students that universities could recruit, but for most universities there was scope for some increase within the ‘tolerance band’ and in most years there was the opportunity to bid for additional numbers.
105. The need for quotas arose because the demand for places exceeded the supply. If demand exceeds supply this will provide some protection, but not for all universities, and not as much as might be supposed. ‘Not for all universities’ because those with the highest reputation and prestige are competing to recruit the best qualified students – in some case ‘the very best'33. Neither the total supply of places, nor any quotas introduced, will have much impact on their efforts to maximize whatever it is they judge makes them a ‘good’ university. For the least popular institutions, even when demand overall exceeds supply, and even if we assume they have no interest beyond getting ‘bums on seats’, if a department gets a bad name, the size of the sector is such that that department would not be secure. That said, increasing the supply would keep all providers ’on their toes’ and would put prospective students, and to a lesser extent students, in a more influential position.
32 There were no quota controls for full-time undergraduate home and EU students between 2002-03 and 2009-10 (see paragraphs 30 to 34). 33 Oxford’s aim is ‘to admit the very best’. Oxford Access Agreement 2012-13
29
106. The difficulty is that the Government does not intend to increase the supply of places. It has proposed two relevant measures. Firstly there is the freedom to recruit AAB+ students. But this will affect those institutions which are already in a competition for ‘high achieving entrants’. This competition may become keener, particularly for middle ranking institutions, but that seems more likely to increase spending on ‘merit’ scholarships than provide an incentive to ‘focus on teaching.’ Secondly, there is the ‘core and margin system’ which will free up places to new providers. Bringing in new providers maybe a good thing in itself, but it will not increase competition, or at least not competition driven by student choice. While demand exceeds supply the ‘competition’ will be won and lost in convincing HEFCE’s panels. It will not be the students who are ‘more than ever’ ‘in the driving seat’.
An alternative explanation of the constraints on competition
107. According to the supporting analysis provided by BIS (BIS 2011c) high entry qualifications and research quality are two important measurable components of what many universities are trying to maximise. High entry qualifications are taken as a signal of quality, since for the most part the best qualified applicant will have the widest choice of universities. In addition other students are an important part of the higher education experience, so that a university with more able students should, all other things being equal, offer better learning opportunities34. This is something of a simplification, but as we have noted, these are the most important components of league table scores, which reflect and/or influence universities’ behaviour. This provides a clue to how competition is constrained.
108. Both high entry qualification recruitment and success in research exhibit the ‘Matthew effect’, or positive feedback loops: advantage leads to further advantage. High entry qualifications enhance an institution’s reputation, which further attracts entrants with high entry qualifications. Success in research leads to increased research funding, which leads to more success in research. The result is a large degree of stability in the ranking of universities by reputation and prestige, a stability which is reinforced by the branding resulting from membership of ‘Mission groups’. We have a sector in which institutions are highly differentiated and where the differences are stable. This creates a large number of small markets, with products defined by entry qualification and subjects, so that each institution or department is effectively in competition with a relatively small number of others. The differentiation creates a form of monopolistic competition, and the feedback reinforcement creates an effective barrier 34 The same argument can also used to make the case for a mix of students, by age, ethnicity and background, particularly in the social sciences and humanities. This is one of the themes of the ‘The Shape of the River’ by Bowen and Bok which has shaped the debate on higher education admissions in the USA, but it has had less recognition in the UK.
30
to entry. The effect of the proposed system for controlling student numbers will be to further amplify these differences, providing more resources to institutions most advantaged by their current situation, and so to reinforcing these differences and further reducing competition.
109. Even if course information is improved it will necessarily still be far from ideal. (See the ‘Better information?’ section.) Almost always the student will only make ‘one purchase’ and will not be able to compare different providers directly. In such circumstances reputation and prestige, largely informed by entry qualifications and research standing, will usually be the most important factor in determining most students’ initial shortlist35. Measures of teaching quality will continue to play only a minor role in the final decision as to where to study. The competitive pressures on institutions to strive for ‘excellent teaching’ will not be increased by the proposed changes, they may actually be diminished.
A more diverse sector, more choice?
110. Though the system of margin cuts and allocation through a bidding process will not in itself increase the number of places, and is inconsistent with the competition for students that the White Paper describes, it should result in a more diverse range of higher education providers. It is possible that these providers will be able to identify some latent demand, by providing a new opportunity, a new choice. To the extent that this new provision does generate and meet new demand, because there will be no expansion overall, every extra place which results in one applicant gaining their preferred choice will result in another place removed elsewhere, and consequently another disappointed applicant.
111. The freedom to expand provision for ‘highly qualified’ students may make more places available at the most sought after universities. If we assume that there is a linear hiercarchy of preference, then this could result in a win win situation, with all students more likely to gain a place on the course of their choosing. But because of the way the system has been set up, some universities with excess demand will have their numbers cut, so that some students will fail to get the place they would have done.
112. The overall net effect is difficult to determine in advance, but the difference one way or the other will be small while there is a cap on
35 Reputation generally’ was cited by 48 per cent of applicants as an influence in their choice of university, third only to ‘offered the particular course I wanted’ and ‘visit to institution’. For applicants whose parents both have HE qualifications, who we would expect to be better informed, this increases to 59 per cent. Research reputation, while less frequently cited is still identified as an influence by 21 per cent of the whole sample and 28 per cent of those with ‘HE parents’. Purcell, et al 2008, page 49, table 4.4
31
places. In trying to identify what limits student choice, the White Paper confuses ‘quotas’ – a consequence of excess demand - with the real cause - excess demand itself.
32
Improved social mobility?
113. The White Paper identifies higher education as a potential force for increasing social mobility and Chapter 5 lends support for measures taken by universities, like taking into account applicant’s background when making an offer. Given the accusations of ‘social engineering’ routinely made by sections of the press, these proposals are most welcome. Chapter 5 also describes the measures to be taken by the Government, like, for example, the increase in grants for students from low income families and the strengthening of the Office for Fair Access (OFFA).
114. There is, however, no discussion of the possible effects on social mobility of the other proposals that make up the White Paper package . In this section we look at the impact of those other policies on widening participation and fair access, as well as the particular measures to improve social mobility set out in Chapter 5.
Widening participation
115. The proportion of young people participating in higher education varies greatly according to their background. It is this inequality that widening participation policy attempts to redress. ’Participation’ is usually measured by entry to higher education, but in its fullest sense it includes the successful completion of the course of study, a prerequisite for the social mobility that is the ultimate aim. As the White Paper acknowledges, in recent years there has been progress, demonstrated by the reduction in the participation gap between those from advantaged and disadvantaged areas.
116. The increased grants and maintenance loans, available to students from low income backgrounds, should improve their experience of university, reduce their need to take paid work for excessive hours (which has been shown to reduce their chances of success36), and increase their chances of qualifying with a good degree, all making participation in higher education a more attractive proposition. These sources of student support will be supplemented by bursaries and scholarships that are set out in Universities and Colleges’ Access Agreements with OFFA. While these extras will be welcomed by the students who receive them, they are unlikely to be well targeted. (For an explanation as to why this is, see the section on OFFA.) However, the ‘merit’ scholarships made without reference to need, that universities seem likely to award to attract AAB+ students, seem likely to - be mis-targeted, favouring the better off.
117. Even if some of the student support package will be complicated and misdirected, overall students from low income backgrounds will have
36 See section 8.3 of a study by CHERI and London South Bank University (CHERI 2005).33
more support. However, we do not know whether, or to what extent, the headline figures of increased debt will reduce participation in general, and by those from low income backgrounds in particular37
118. If we assume that the changes do not reduce the demand for higher education to any significant extent, the progress in widening participation will depend on the number of places available, assuming there is no decrease in participation for the more advantaged groups. The planned Government expenditure only allows for student numbers to be maintained, so that the only growth would be through an increase in places sponsored by employers and charities, and these are likely to be small in number, at least in the medium term.
119. From 2007-08 to 2020-21 changes in the population sizes of different age groups would be expected to reduce student demand by about seven per cent (Coleman et al 2011), so that maintaining the number of places will allow for some increase in the participation rate, though probably not enough to meet unmet demand38. There is a risk that progress in widening participation will be slowed by a lack of places39.
120. The Government expects to see more higher education in further education colleges40, and given the lack of overall expansion this will mean fewer places at universities. Further education colleges have strengths: some provide specialist courses not available elsewhere, and generally their students are more satisfied with assessment and feedback41 . But with fewer resources and without the kudos of a university title, the option of HE study at a further education college will be less attractive for many young people and, if there is no alternative, some may decide not to go on to higher education study. The HEFCE guidance asks institutions to provide evidence that the places asked for will be filled, but the decision as to where students can go will be made by the panel, not the students. If students are discouraged by decisions to replace university places with further education places, it will affect students from disadvantaged backgrounds disproportionately, because they are less likely to have the qualifications to gain access to the reduced number of university places.
37 We described the uncertainties in the analysis carried out by the Institute of Fiscal Studies (Dearden et al 2010) in our response to the Government proposals (Thompson et al 2010b at paragraph 35). 38 The HEPI report (Coleman 2011) identified both unmet and ‘latent’ demand. BIS impact assessment concluded that there was excess demand over current supply (BIS 2011b).39 Widening participation has in the past generally been achieved principally when the number of places has been expanding relative to the size of the relevant age group population.40 See Foreword to the White Paper.41 National Student Survey results show that, compared to students at HEIs, students at FECs are more satisfied with assessment and feedback, but less satisfied with the resources available and the organisation of the. (HEFCE 2011c).
34
121. The possible transfer of places from universities to further education colleges is the most visible outcome of the ‘core and margin’ student number controls, but that system will also result in a large disparity of resources for teaching available for different universities. Those able to attract the ‘high achieving’ students will be free to charge the £9000 fee, whereas those dependent on the non-AAB+ quota would have to drop their net fees to £7500 to be able to bid for places, or reduce their headline fee to £6000 to be able to maintain their student numbers without going through an annual bidding process. It is those very universities that are faced with a reduction in fees that have been responsible for the recent advances in widening participation42. In recruiting less well-prepared students, their teaching costs are higher43, and in recognition of this under present arrangements they receive additional funding, which will continue. However, this funding, which equates to about £400 per student44 is less than the differences in recurrent income from £9000 maximum fee and the fees that the ‘wide participation’ universities will be allowed to charge.
122. So, even without consideration of the possible impact of higher fees – enhanced widening of participation is unlikely, given the constraints on numbers. In addition, there is a risk that the pattern of provision that comes out of the ‘core and margin’ system could be less attractive to the marginal entrant, that is the entrant for whom the pros and cons of further study are finely balanced. This too would work against making further progress in widening participation.
‘Fair’ access
123. ‘Fair’ access has come to refer to the social mix of students at individual institutions, and how that compares with the student population across the sector or, more restrictively, to the student population studying the same subject mix and with the same entry qualifications. To say that ‘fair’ access has not been achieved does not mean that the admissions process is unfair in the ordinary sense that it is biased in some way.
124. Whilst progress has been made in widening access as a whole, the participation rate for disadvantaged young people at the more selective institutions has remained flat since 1994-95 (WP 5.6). There are many 42 See the figure at paragraph 5.6 of the White Paper. Note that this figure is wrongly titled. The participation rates are not for the bottom 40 per cent by income, but the bottom 40 per cent of an area classification based on the level of parental education. 43 A study by JM Consulting found that ‘preparedness is one of the main cost drivers’ and that these and other costs of teaching relatively disadvantaged students increased tuition costs by 31 per cent (JM Consulting 2004) 44 This is the approximate difference in funding per student for ‘widening access’ and for ‘improving retention’ between a highly selective university with a low proportion of students from disadvantaged backgrounds and a ‘wide participation’ university.
35
possible reasons for this and it would be difficult to untangle them but, so long as those from disadvantaged backgrounds have weaker entry qualifications on average, and so long as institutions are not willing to make more use of contextual data, any increase in the difference in selectivity between institutions will further increase the social segregation, all other things being equal.
Fair access and the AAB+ threshold
125. Table 3 shows the ratios of the actual numbers of relatively disadvantaged young entrants to the expected number with AAB+, non-AAB+ and unknown entry qualifications. A value of 1.00 means that the number of students in the population is what we would expect, given the number of students in the disadvantaged group and the number of students with the particular qualifications. A value of less than 1.00 means that there are fewer students than expected, more than 1.00 means that there are more than expected. We can see that those from relatively disadvantaged backgrounds have a lower representation in the AAB+ group than would be expected.
Table 3: Ratios of actual to expected numbers of relatively disadvantaged young entrants in AAB+ , non-AAB+ and unknown populations
Entry Qualification
Type of disadvantage
Low participation areas (POLAR Q1)
NS-SEC 4-7 State schools
AAB+ 0.51 0.68 0.88Non-AAB+ 1.08 1.18 1.13Unknown 1.24 0.75 0.70Table 3 note: See Appendix 3 for sources, definitions and calculations.
126. The area based measure is for the most disadvantaged fifth of the population. Figure 1 below shows a plot of the ratio of actual to expected number with AAB+ qualifications from the least advantages (Q1) to the most advantaged (Q5). We see that the ratio increases through the quintiles.
Figure 1: Ratio actual/expected number of young entrants with AAB+ qualification by POLAR quintiles
36
Figure 1 note: See Appendix 3 for sources, definitions and calculations.
127. Very few mature students have AAB+ qualifications. If we exclude those entering with higher education qualifications just one to two per cent have AAB+ qualifications45.
128. The introduction of the AAB+ threshold was designed to increase competition between institutions for these students, and as their non AAB+ quotas are cut, institutions will have to recruit more AAB+ students if they are to maintain their student numbers and continue to charge net fees of more than £7500. This is likely to concentrate further the numbers of AAB+ students in institutions with high prestige and reputation and, as a consequence, reinforce the social segregation between groups of institutions. This risk was identified in the BIS impact assessment but not in the equality impact assessment46.
45 HEFCE did not provide information on the numbers of AAB+ students excluding those with higher education qualifications. The 1- 2 per cent estimate was derived from the 2009 PI supplementary table SP3 published by HESA. The definitions of entry qualifications and populations do not exactly follow those used by HEFCE and they include all UK HEIs and exclude English FECs46 The BIS impact assessment points out that others, including disabled students and BME students could be adversely affected (BIS 2011b, page 71). The equality impact assessment only considers participation across the sector and so does not recognise this risk (BIS 2100e, paragraph 62). This is unfortunate because although BME overall HE participation is high, their representation in the most selective universities is low. The HEFCE data show that black entrants have and actual/expected ratio for AAB+ qualifications
37
Admissions - academic judgements or Government regulation?
129. The proposal from the Browne report to set a minimum qualification level for entry to higher education has not been accepted because this would mean ‘Government taking on a new regulatory role over university admissions, which are currently only a matter between the student and the university’ (WP 4.17). However, establishing a threshold defining a high achievement is, in effect, bringing in Government regulation to admissions.
130. We know from the importance attached to the UCAS tariff how a designation of an entry qualification can be seen as more than a convention and can shape behaviour. There is a risk that having been given an official ‘high achieving’ status the AAB+ qualifications and their equivalents will be accorded an unjustified status. This would happen even if there were no consequences for securing ‘merit’ scholarships or gaining admission, but the freedom to recruit an unlimited number of AAB+ students will make the threshold even more important.Consider the following scenario. Two applicants from identical backgrounds present themselves: candidate 1 has ABB grades, candidate 2 has AAB grades. Candidate 1 is better qualified for the course, because she has taken ‘hard’47 subjects and has an A grade in the subject required for this course. Candidate 2 meets the formal requirements for the course but has taken two ‘soft’ subjects and has a B grade in the subject required for the course. The admissions tutor would prefer candidate 1 but the university has a low non-AAB+ quota, so candidate 2 gets an offer and candidate 1 does not.
Offers using contextual data
131. The above example has no implications for social equity but the same potential to distort decisions arise when institutions are using what is called ‘contextual data’, which is important for ‘fair’ access. The idea is to identify the applicants with the most potential by going beyond simply choosing those with the best grades. The White paper endorses the use of contextual data (WP 5.180). Consider the following examples.
Royal Veterinary College
132. The White paper highlights an example of discounted offers made as part of a recognised scheme, the ‘Gateway Programme’, designed by the Royal Veterinary College. Students can be admitted with CCC at A-level to include Biology and Chemistry to a foundation year which, if successfully completed, guarantees admission to a degree programme to qualify as a vet.
47 For suggestions as to what these ‘hard’ subjects might be see ‘Informed Choices’ published by the Russell Group.
38
University of Oxford
133. Numerous studies have demonstrated that, all other things being equal, students from state schools on average are more likely to complete the course and get a good degree than those from independent schools48. A study of admissions to the University of Oxford for entry in 2003 found that admission tutors were discounting independent school performance, that is they were requiring better prior qualifications from independent school applicants, but that, judging by their likelihood to get a first, this ‘was not only justified but did not go far enough’ (Zimdars 2007). Since this research was carried out the university has supported the use of contextual data through the provision of information to all admissions tutors49.
134. The risks to grade discounting posed by the AAB+ threshold are recognised in the BIS impact assessment (BIS 2011b), but they are thought to be mitigated by the fact that for the most selective universities AAB would represent a discounted offer. This argument assumes that the historic discounts are enough which, as we have seen with the research into Oxford’s admissions, may not be the case. Even if a AAB+ lower limit is low enough for the most selective universities, as we can see with the example from the Royal Veterinary College, many discounted offers fall below the ‘high achieving’ threshold. Even the most selective universities have traditionally been prepared to accept mature students without high grade A-levels, using other evidence of their abilities. Given that only about one or two per cent of mature students have AAB+ qualifications, a non-AAB+ quota is essential for recruiting mature students.
135. An analysis of the actual grades of students is likely to understate the problem. Suppose an admissions tutor is considering an applicant that looks to have potential, perhaps even has high predicted grades, but who lacks confidence. Perhaps he/she was only persuaded to apply as a result of an outreach programme. They may want to give a lower conditional offer by way of encouragement, but with a low non-AAB+ quota that may not be possible. Should the applicant do as well as expected, the discounted offer will not be visible from an analysis of the entry qualifications obtained.
136. It may be possible to fix these problems through adjustments to the student control system. The Government and HEFCE want to promote ‘fair’ access and it is in their power to allocate non-AAB+ quota places to achieve this. Such increases in the complexity of the system will not be without cost, and discounting which is not part of a recognised scheme it is less likely to be secured by such fixes. 48 See HEFCE 2003, HEFCE 2005, Kirkup et al 2010 and Smith et al 2001. 49 Oxford’s Access Agreements from 2007-08 onwards outline their development of the use of contextual information. These are available on the OFFA website.
39
Sponsorship - will it be possible to buy places?
137. The Government wants to encourage the sponsorship of places as a way of expanding provision. It believes that this could be achieved by allowing recruitment outside the full-time undergraduate student number controls when a sponsor covers all the tuition and maintenance costs (WP 3.33-3.36, 4.22-4.23).50
138. Students who were independently funded were not subject to any quota controls between 2002-03 and 2009-10 and the evidence suggests that such sponsorship was very unusual. (See paragraphs 64 to 65) Though removing the quota control on its own is very unlikely to lead to a significant addition to the number of places available, the replacement of the HEFCE grant by a fee means that it should be easier to administer the replacement of Government financial liabilities on a small scale, even for just one student.
139. The Government is aware that sponsorship introduces risks to the principles of fair access, and it proposes three principles that are intended to ensure that no individual student is able to ‘purchase a place’ WP 4.23). These are:-
a. There ‘should be fair access for all students regardless of the ability to pay.’ Presumably this refers to the ability of the student to pay, rather than the ability of the sponsor. Otherwise it would create a liability for the university to provide places without funding.
b. The ‘places must be genuinely additional.’ We take this to mean that the university cannot charge standard fees, backed by Government loans, in addition to the sponsorship payments.
c. There ‘must be no reduction in academic entry standards in recruitment.’ We take this to refer to the entry requirements for a course, rather than the average for the entry cohort. For example, suppose a course has a requirement for ABB A-level grades. 50 per cent of the students recruited in the ordinary way, without sponsorship, have grades of ABB and 50 per cent AAB. Suppose additional places are filled by sponsored students with ABB grades. This would not be considered to be a reduction in academic entry standards because the course requirement was met by all students on the course. The recruitment of the sponsored students would, however, lower the average entry qualification grades.
50 Nowhere in the White Paper does it make clear that the current quota control of sponsored places only applies to full-time undergraduates. Nor is it made explicit that the sponsor would have to cover maintenance costs, but this follows from the statement that ‘extra students do not create a cost liability for Government’ (WP 4.23)
40
140. These requirements, on their own, would not prevent the purchase of places. Consider again the course with 50 per cent ABB students and 50 per cent AAB students, all recruited with standard Government grants and loans. Let us further suppose the university has used up its non-AAB+ quota. No further Government backed students with ABB can be recruited. Does this mean that the university cannot accept the sponsored ABB students? If the answer is “yes, it can recruit the sponsored students”, then, in effect, the sponsor has purchased the additional places. If the answer is it cannot recruit the sponsored students and the university has to work within its not-ABB+ quota, then the Government imposed quotas will have continued to limit expansion. A third option would be for sponsored and non-sponsored students to compete under a ‘sponsorship blind’ application process, but it is difficult to see how a university could ensure it met its non-AAB+ quota limits with such arrangements.
141. What kind of restrictions can be made on the eligible population from which the sponsored students are drawn? If there are to be no restrictions at all, it is difficult to see what advantages the sponsor or student would gain for the extra expenditure compared with sponsorship that adds to the public investment51.
142. Perhaps the model that the Government has in mind is like the KPMG scheme52, but applied to an open course, that is: a scheme restricted to the sponsor’s employees but for a course which is also open to any suitably qualified candidate. If that is allowed, it would be difficult to draft conditions that would prevent places being purchased for individuals53. It is clear that The Government’s intention is that sponsorship should not be used to buy places for individuals, but having good intentions is no guarantee that it will not happen. It is difficult to envisage a workable scheme that will avoid the purchase of places for individuals who would not otherwise have gained entry.
Post-qualification application (PQA)
143. The introduction of the AAB+ threshold would make the admissions process more complex for many institutions, so using actual rather than predicted grades would be particularly welcome. The White Paper points out that there are practical difficulties to be overcome for a PQA system to work.51 The ‘Lloyds Scholars’ scheme (WP 3.35) is a good example of such a top-up sponsorship. This is open to any student coming from a household with a residual income of less than £25,000 pa. The benefits are additional to the loans and grants paid out of public funds. 52 In the KPMG scheme the course has been devised to meet the needs of KMPG and its employees (WP 5.35). 53 Consider the three person business of parents and child, with the child sponsored for a university course. As well as the potential for buying a place that the child would not otherwise get, the arrangement could have tax advantages.
41
144. Data collected for a study commissioned by BIS (Everett et al 2011) do suggest that the reliance of the present system on predicted grades may have implications for fair access.
145. As can be seen from table 4, applicants from comprehensive schools who did get a good grade, were more than twice as likely to have had a predicted grade lower than they achieved. For example 11.2 per cent of those who got an A grade were not predicted to, and as a result they may not have got an offer that their subsequent achievement justified.
146. For this entry cohort (2009) ‘A’ was the highest grade, so it was not possible to predict higher. For those getting a B grade the proportion that had been predicted to get an A grade was higher for students from independent schools. This may have worked to their advantage or disadvantage. The optimistic predictions may have resulted in an offer, which they subsequently met despite slipping a grade, or they may have been given a discretionary place even though they just missed the conditional offer. On the other hand, they may have had to use their insurance offer or even go through clearing as a result of failing to meet a conditional offer. Overall, the applicants from independent schools would seem to be more likely to gain a place at a selective university, though they may be of increased risk of failing to meet a conditional offer.
Table 4: Per cent of applicants who achieved high A-level grades who were predicted to have lower or higher grades
Grade achieved
Comprehensive Independent
Lower grades Higher grades
Lower grades Higher grades
A 11.2% 0.0% 5.5% 0.0%
B 10.3% 43.7% 4.6% 57.9%
Tables 4 notes Data taken from BIS study (Everett et al 2011). Note that comprehensives are described as ‘state’ in that study.
147. The same data can be re-presented to make them relevant from the universities’ viewpoint. Their biggest concern is whether the applicant will achieve the predicted grades or better. Table 5 takes as its starting point all those who have been predicted to get a certain grade. (This is how such data are usually presented, as it was in the BIS report.) The table shows the percentage of predictions that are either accurate or pessimistic, that is: the applicant achieves the predicted grade or higher. For completeness the percentage of predicted grades which are accurate are also shown. We find that applicants from comprehensive schools are less likely to do as well or better than they are predicted to. This may
42
result in admissions tutors to giving less weight to predictions of high grades from comprehensive schools when deciding whether to make an offer.
Table 5: Accuracy of predictions of high A-level
Grade predicted
Comprehensive Independent
Accurate or pessimistic
Accurate Accurate or pessimistic
Accurate
A 59% 59% 73% 73%
B 49% 41% 59% 46%
See table 4 notes
148. The lower proportion of accurate predictions (table 5) and the higher of proportion of students with grade As who are predicted to have lower grades (table 4) from the comprehensive schools is in large part due to the fact that the proportion of students getting an A grade (26 per cent) is less than half of that for students from independent schools (52 per cent). It could also be that they are studying A-level subjects which are less predictable. We cannot tell from these figures whether the competence of the predictors differs for different school types. It should be possible to investigate such factors with a suitable statistical model. Such a model would ideally look at groups of A-levels taken by individual applicants.
149. The researchers who carried out the investigation for BIS recommended that modelling be carried out, and we would wholeheartedly support that recommendation. The UCAS systems now allow for automatic extraction of data on predicted grades, which makes it possible for much more rigorous analysis to be carried out. Even if PQA proves to be impracticable, a better understanding of the relationship between predicted and actual achievement would be valuable to those making decisions as to whether to make an offer as well as to those making the predictions.
150. We would also recommend that the relationship between GCSE results and A-level achievement is investigated because admission tutors also make use of GCSE results in deciding whether to make an offer.
Access to HE courses
151. Access to HE courses, by providing a route to higher education for those who missed out when leaving school, play an important part in increasing social mobility. The recognition of Access to HE courses in the White Paper is, therefore, welcome.
43
152. These courses do not fit neatly into the higher education or further education landscapes. They are designated as being at FE level and are mostly delivered in further education colleges, though they are regulated by the QAA and do not fit into the standard FE qualifications frameworks. They are directly relevant to widening participation in higher education yet funded by the Skills Funding Agency (SFA), and therefore subject to that Agency’s priorities. As a bridge between two sectors, Access to HE courses are vulnerable.
153. The White Paper notes that there may be an opportunity to develop work-based options for these courses (WP 5.33). If these places are additional to the current provision that would be welcome, but if this is an indication that Access to HE courses in general are to be remoulded into something closer to other SFA provision, it could be damaging.
154. In the past access courses were sometimes overlooked by policy makers in their development of vocational routes to higher education, based on students’ current employment. The access course route, at least as traditionally organised, is different. The need for both approaches is apparent given that some of those who left school with few or no qualifications are not in the kind of employment where work-based learning is likely to lead to higher education.
Aimhigher
155. In November 2010 the Minister for Universities and Skills announced that the funding for Aimhigher would not be extended beyond 2011. Aimhigher had been formed in 2004 through the merging of two earlier initiatives: Partnerships for Progression and Excellence Challenge. It involved a series of partnerships between schools, colleges and universities which worked to provide information and raise aspirations of young people from disadvantaged backgrounds. Though this decision is not referred to in the White Paper, it is an important aspect of the Government’s policy on widening participation, and needs to be considered.
156. At the time of the announcement the funding for Aimhigher was £78 million pa. The Government emphasised that it was to spend £150 million on the National Scholarship Programme. This and the outreach work that OFFA would oblige universities to carry out if they charged more than £6000 for fees was presented as a better alternative.(In effect students, through their fees, would fund outreach rather than the Government.) In the ‘funding letter’ from BIS to HEFCE in December 2010 BIS advised about the ‘move away from the Aimhigher programme towards a new and improved approach to outreach’.
157. The new outreach programme may be claimed to be ‘new and improved’ but this assessment as far as we can tell is devoid of any details
44
or evidence of how or why. In March 2011 BIS published a review of social mobility (Crawford et al 2011). Though the report was published five months after the announcement to end Aimhigher, the contents may have been available to the Government earlier. The reviewers noted that, ‘we do not know what effect it [Aimhigher] actually had on HE participation and further research in this area is called for.’ We would agree, except that the research had been done (Morris et al 2009). It found, amongst other things, that the impact of the Aimhigher on the participation of young people entitled to school meals was to raise the progression to HE rate by just over one per cent (from 13.5 per cent to 14.6 per cent).
158. As well as (wrongly) thinking research on actual entry (rather than intentions to enter) HE had not been done, the reviewers also concluded that, ‘the variation in returns to HE by institution as well as degree subject suggests that simply encouraging HE participation per se will not be sufficient to ensure that we improve social mobility’. This might suggest to policymakers that ‘fair’ access is more important than widening participation. There is indeed a suggestion of such a shift in emphasis in the White Paper which refers to participation of young people from disadvantaged backgrounds ‘in particular to the most selective universities’. The move of outreach from partnerships to individual universities may have followed such a shift in policy priorities.
The Office for Fair Access (OFFA)
159. OFFA was created as part of a package of measures to address the fears that raising fees to a maximum of £3000 would deter students from entering higher education54. With an aim to replace the ‘burdens of bureaucracy’ with the forces of competition (WP 1.45), and a desire to ‘strip back excessive regulation’ (WP 6.18) it might have been expected that OFFA would be a candidate to join the ‘bonfire of the quangos’, but its capacity is to be increased up to fourfold, and the White Paper signals that the Government would support an increase in its powers, for example, to be able to ‘instruct an institution to spend a specific amount on access or retention.’ (WP 5.25)
160. The aim of OFFA to help ‘safeguard and promote fair access to higher education’ would find few detractors, but is such a regulatory body necessary and effective in achieving this aim? The loss of institutional autonomy that OFFA’s powers represent was the quid pro quo for giving universities the freedom to vary fees, initially up to £3000. That was the bargain struck, but now the Government wants to tighten the controls. With a maximum fee of £9000 the Government may appear to be 54 The position, powers and duties of the ‘Director of Fair Access to Higher Education’ were established under the Higher Education Act 2004. OFFA is the body established to administer these powers and duties.
45
increasing universities freedom to set fees, but this has to be seen in the context of the removal of the HEFCE grant, and the measures which are being taken to constrain universities’ real freedom to set a fee.
161. Given that charging a fee of more than £6000 is conditional on OFFA’s approval, it is not surprising that all English HEIs have approved Access Agreements along with sixteen FECs. These agreements have two main parts. Firstly, a commitment to spend in three areas: student support, outreach and activities to improve student retention. Secondly, to set targets for improving ‘fair’ access.
162. Student support accounts for 69 per cent of the spend pledges for 2015-1655. This student support comes in a variety of forms - fee waivers, bursaries, scholarships, etc. This distribution of funding will not be well directed to need, because different universities have different numbers of students from low income backgrounds and, perversely, the guidance from OFFA has resulted in the universities with fewest students from low income backgrounds pledging to spend the most. For example, the average support per head for students at universities in the Russell Group is nearly twice that for students at the Million+ universities and more than seven times that for students at FECs 56. Furthermore, the mixture of grants, loans, bursaries and scholarships creates a confusing and complicated system which could result in those who are entitled to support failing to claim57. Part of this expenditure, amounting to £246 million pa by 2015-1658, is, in effect, from public funds through subsidy of loans (which will pay fees which will in turn be used to provide bursaries) and, more directly, through the funding of the National Scholarship Programme.
163. It is surprising that OFFA has put so much emphasis on the provision of financial support in Access Agreements, considering research that it published last year that concluded that the bursaries that had been provided hitherto had had not influenced disadvantaged young people in 55 £414 million spend on financial support out of a total of £602 million (OFFA 2011a).56 The 'institutional financial support' includes bursaries, scholarships and other in-kind support offered under access agreements and the National Scholarship Programme. Values without fee waivers and with in parenthesis for 2015-16 are: FECs £167(£76), Million+.£485 (£283), Russell £903 (£546).This is per student over the whole population, not just for students receiving support (OFFA 2011b).57 The Browne Review concluded that the student finance system was complex and confusing. In 2006-07 bursary take-up was estimated at 80 per cent. (OFFA 2009).This was in part due to teething problems that were subsequently addressed. While more students who enter higher education may now find their way round the system, those considering whether to enter are unlikely to have a clear view as to what is available.58 Student support less fee waivers £246 million, Government scholarship contribution £136 million, RAB fee 32 per cent. Spending figures OFFA 2011a. RAB charge as used in Government costings (BIS 2011b).
46
their choice of institution (Corver 2010). Given a decision to spend this money on student support, it would be more efficient, effective and just to channel it through the established system of loans and grants59. The ultimate source of funds for institutional bursaries is the repayments that students will make after they have left university. This cross subsidy does not fit well with the message that, even without bursaries, there are no ‘up front’ costs and that repayments are ‘progressive’. A graduate on a middle income could be paying for the bursaries received by a graduate billionaire60.
164. OFFA has been asked by Ministers to place more emphasis on outcomes, and the White Paper proposes a ‘shift away from assessment of inputs and processes, to focus on clear outputs from access activities and measurable progress against appropriate measures and targets’ (WP 5.22). The difficulty with measuring outputs, and even greater difficulty with measuring outcomes, is in deciding what would have happened without the intervention. If a university fails to meet its targets, it will often be difficult to know why. In these circumstances it seems very unlikely that OFFA would be able to impose a fine, or withdraw its licence for the university to charge fees of more than £600061.
165. What are the costs and benefits of the access agreements? The BIS impact assessment does not shed much light on either. It concludes that the new arrangements will be similar to costs that universities have already incurred, but fails to quantify these. Given that OFFA is now directed to review Access Agreements annually, and is going to see a possible fourfold increase in resources, this seems optimistic. It also makes no estimate of the benefits, because of the uncertainty of what would happen without the Agreements.
166. OFFA has a statutory duty to protect the freedom of universities to determine their criteria for admissions. It is, therefore, unsurprising that the Access Agreements reflect institutions’ aims and ambitions. Consequently, without these Agreements, it seems likely that most universities would strive for fair access along the same lines as they set out in their Agreements with OFFA. In the first years of Access Agreements the formality of the process probably made universities more focussed, 59 The need for some funds held by universities to deal with hardship cases through unusual circumstances has long been recognised, but the sums proposed for satisfying an Access Agreement are of a different order. 60 The Institute of Fiscal Studies identified some if the ‘counter-intuitive (or even perverse)’ implications of the system of scholarships and bursaries shortly after the proposals were announced (Chowdry et al 2010).61 The BIS guidance asks OFFA to take action to fine an HEI or reduce fees to £6000 if ‘a breach is well proven’. It is unlikely to be ever possible to prove a case based on measures of outcome (BIS 2011f). In some cases the annual improvements set out in Access Agreements would be impossible to measure due to random fluctuations.
47
but the further measures proposed will bring diminishing returns. The Agreements may result in increases in universities’ spend on outreach and retention, though it is not clear how much they would have spent without the Agreements, or to what extent they are the result of describing spend under different headings.
167. Without Access Agreements it is likely that universities would not spend so much on student support. This means that the main achievement of an increasingly elaborate system will be to provide student support in, what might be seen by some, to be an inefficient and inequitable way.
168. We would suggest that the real reason for this expansion of bureaucracy was initially to try and rein in the freedom to charge fees up to £9000. When the Government first announced its proposals it declared that it would be for universities to decide what fee to charge, but that they thought that only in ‘exceptional cases’ would they charge more than £6,000. By February 2011 it was clear that this forecast was inaccurate and the guidance to OFFA suggested that OFFA encourage fee waivers, warning that if average net fees charged were ‘ at the upper end of what is legally possible’ then they would ‘reconsider what powers are available, including changes to legislation’ (BIS 2011f). This steer did not work either. The average fee less waivers agreed with OFFA for HEIs for 2015-16 is £8320, and we now have the ‘core and margin’ system as the principal mechanism to drive down fees.
48
What will happen?
169. The outcomes from the White Paper proposals will depend on the decisions of all the players involved: the higher education providers, the students and the Government and its agencies. All have choices to make and we cannot guess what each will decide to do, nor can the Government; hence the difficulties that have arisen for them. Here we attempt to describe the choices open to each of the stakeholders, the constraints on those choices and speculate as to what kind of sector could be created, depending on the choices that are made.
170. We concentrate on full-time home and EU undergraduates. The outcomes for part-time provision are less clear and we only devote a short section to them. We also consider what may happen in certain subjects where student demand is less buoyant. Finally we speculate about where the sector is heading in the medium term.
An opportunity to expand
171. There are four universities, Oxford, Cambridge, Imperial College and LSE which have distinctive entrant profiles. Less than 10 per cent of their home entrants are identified as non-AAB+ and they reject many applicants with AAB+ qualifications. Other universities are similarly oversubscribed in particular departments, but these four universities are the only examples where it applies across the whole institution. Though they are outliers, and represent less than three per cent of the sector in terms of the numbers of home and EU full-time undergraduates entrants, they need to be considered because, though the decisions of other institutions will have little or no impact on them, their decisions will affect others.
172. For these four universities the promise that they will be able to charge what they like (up to the £9000 maximum) and that there will be ‘extra freedoms and less bureaucracy’, have for the most part been met. They will have to submit to annual monitoring by OFFA, and their opportunities to use contextual information to make offers may be curtailed, but they are free to decide how many students they want to teach. They will easily be able to recruit enough AAB+ students to replace the trivial reduction in their core non-AAB+ quota, and, should they choose to, they could expand. Will they?
173. These universities have had opportunities to expand through HEFCE’s allocation of additional student numbers in the past but for the most part they have not bid for places. Research funding would not follow additional numbers through this process and that would have been a disincentive. Would the new arrangements reduce that disincentive? Table 6 shows income for both research and teaching expressed as income per student.
49
(The figures are fictitious, they are not based on particular university departments, but follow assumptions which would approximate to departments with high research ratings across the sector.)
174. 2009-10 has been used as the comparator because there were significant reductions in recurrent funding in the following two years. (See paragraph 183 for more details.)
Table 6 Tuition and research income per student (2012-13 prices)
Income source English Physics
Additional 2012-13 students
Fee £9,000 £9,000
OFFA agreed payments (£1050) (£1050)
HEFCE teaching grant £0 £1,500
Total £7,950 £9,450
2009-10 students
Fee £3,480 £3,480
OFFA agreed payments (£419) (£419)
HEFCE teaching grant £2,872 £5,853
HEFCE research grant £2,750 £4,500
Total £8,625 £13,414
Table 6 notes See appendix 4 for assumptions and details of calculations. NB does not correspond to an actual university – fictitious data.
175. Table 6 shows that the additional student studying English would represent an 8 per cent drop in real income per student. For Physics the decrease is 30 per cent.
176. These calculations assume that the university would want to maintain its staff student ratios in order to retain the quality of teaching, and give time for staff to carry out research. On the other hand, the loss of income per student that the additional students represent could be viewed as an investment with the returns coming in 2015-16 after the ‘Research Excellence Framework’ is completed.
177. These universities will not make its decisions on the basis of a balance sheet alone; they will take a view as to how much undergraduate
50
teaching they want to do, but the financial disincentives will be much reduced for low cost subjects like English.
178. Further, bidding for additional numbers involves a positive decision, whereas the new system would allow student numbers to drift up. So the most likely outcome for the most selective institutions is that there will be no sharp increase in the number of students, but that a small, gradual increase is possible, especially in the low cost subjects.
179. For other research intensive universities, with lower proportions of AAB+ students, expansion of popular subjects like English, as a way of replacing cuts to their quota of non-ABB+ students looks an attractive proposition.
To bid or not to bid?
180. The crucial decision facing universities is whether to buy the right to bid for the margin of non-AAB+ places by reducing their net fees to an average of £7500.
What fee level is needed to maintain resources for tuition?
181. Universities had expected to at least maintain their levels of funding, and hopefully reverse the recent cuts in grants. Can this be done with a net fee of £7500?
182. The fee level required to maintain the resources available for tuition depends on both the subject of study and the spending pledges that an institution makes to OFFA. The OFFA spend includes items like bursaries and fee waivers that are clearly not part of tuition costs, and retention that may be, depending on what activities are included. The institution decides on the balance of spend both on how much is spent on, say, retention and what activities are included under that heading. In our calculations we assume that the amount of spend follows OFFA’s guidelines, and that all that spend is not related to tuition.
183. Table 7 shows the fee levels required to maintain recurrent income at 2011-12 levels, to restore recurrent income to 2009-10, and to restore income and replace cuts in capital spending. The figures in table7 do not include all the funding that institutions receive for teaching. The allocations for widening participation and improving retention, the largest part of these other funds, have been maintained.
51
Table 7: Fee levels needed to maintain recurrent teaching income
Table 7 note: See Appendix 4 for assumptions and calculations
184. However, capital grant allocations have been reduced from £472 million in 2009-10 (excluding grant brought forward from 2010-11) to £90 million in 20012-13. These grants are not distributed evenly, but if capital spending is to be sourced from tuition fees in future they would need to be higher than the levels needed just to maintain recurrent income. The right hand column of table 7 shows the fee levels that would be needed if each HEFCE funded taught student, including part-time students and postgraduates, were to make the same contribution per full-time equivalent.
185. If we consider the fees needed to restore income to 2009-10 levels, then even in the worst case it would be possible to set a headline fee of £8020 and waive fees at an average of £520 per head, so conforming to the £7500 limit. (This would mean spending 86 per cent of OFFA spend on student support – probably close to the limit of what would be acceptable.) So even with fees reduced universities can still restore recurrent income for tuition to 2009-10 levels. However, this does depend on making spend pledges at the OFFA guidelines and no more, and in meeting those spend pledges as far as possible with fee waivers.
186. For subjects groups B and C we cannot restore recurrent income and generate income sufficient to match the reduction in capital funding with a net fee level of £7500. However, most universities would be able to generate sufficient income from courses funded at price group D to
52
restore recurrent income and generate funds to replace capital grants within the £7500 net fee limit.
How much does it cost to bid?
187. Even making maximum use of fee waivers, institutions wishing to bid are going to have to accept a reduction in income. The most uncertain parameter in the calculation is the proportion of OFFA spend that can go to student support (as distinct from outreach and retention activity), and therefore to fee waivers. OFFA does not provide a firm figure, but indicates that it would expect a reduction from the average of 85 - 90 per cent under current arrangements. For the purposes of this comparison we take a figure of 80 per cent. Table 8 compares the income from the maximum fee with that within the net fee limit of £7500.
Table 8: Cost of reducing fees
Bidding Not bidding
Fee less waivers £7,500 £9,000
Headline fee £7,974 £9,000
Per cent over £6000 OFFA spend 30% 35%
OFFA spend £592 £1,050
Income after OFFA spend £7,382 £7950
Table 8 notes: Does not correspond to an actual university – fictitious data.
188. The AAB+ ‘not bidding’ recruiter pledges 35 per cent for OFFA spend, above the OFFA broad guideline maximum of 30 per cent. Fee level is not included as a criterion in deciding whether such extra spending pledges should be made, but we would expect a university charging the highest fee might be obliged to interpret the guidelines more generously. The high fee university in this example is providing student support through bursaries rather than fee waivers, but it would make no difference to the university’s finances if it were to use fee waivers instead.
189. With these assumptions it costs £568 per student to qualify for the bidding process. This sum could easily be spent on ‘merit’ scholarships were the university to decide to recruit AAB+ students rather than bid for non-AAB+ places. There may be little financial advantage in holding out for the maximum £9000 fee.
53
It’s not just money
190. However, many universities will be extremely reluctant to take the lower fee route. As we have argued in the section ‘Greater Competition, More Choice?’, universities are not maximising income, rather they maximise what it is they judge makes them a ‘good’ university. Accepting that the university was unable to recruit enough high- achieving students would be damaging, and the high fee in itself may be taken as indicating prestige and quality62. We would expect the 1994 and Russell groups of universities, which describe themselves as ‘internationally renowned, research-intensive universities’ and ‘leading UK universities’ respectively, to try and avoid having to bid for places to retain student numbers. These universities account for 74-82 per cent63 of the share of AAB+ entrants outside controls (that is excluding students of medicine and dentistry). They would only have to increase their share by about three percentage points to retain their student numbers by recruiting additional AAB+ students in 2012-13. However, for some of these universities, retaining their student numbers through AAB+ recruitment will be very difficult.
62 Research from the USA concluded that ‘increases in tuition also contributed to improved admissions indicators, even though tuition is not necessarily connected with institutional quality... Clearly, then, students and/or parents must view high tuition as reflecting some positive aspect of institutions, whether it be prestige, quality, or a combination of the two.’ (Bowman et al 2009). [By ‘tuition’ the authors mean tuition costs or fees.]63 The uncertainty is caused by the large number of unknowns. See Appendix5 for more details.
54
Can the extra AAB+ students be recruited?
Figure 2; Required percentage increase in AAB+ students next year to retain student numbers by percentage of AAB+ entrants this year
Figure 2 note: Sources, assumptions and calculations at Appendix 5
191. The proportional increase in AAB+ students required to maintain student numbers gives an indication of how difficult it would be for a university to avoid the bidding process. Figure 2shows how this varies with the existing proportion of AAB+ students.
192. We can see that some 1994 Group universities (squares) and Russell Group universities (triangles) would need large percentage increases in their numbers of AAB+ entrants. The total number of AAB+ entrants is expected to increase: the HEFCE estimate puts the expected increase at 7 per cent. The changes of the White Paper itself may produce some further off-trend increases, but even with this, some of the increases that the 1994 and Russell Group universities need to make look unachievable.
193. We should not expect these universities to make a change for 2012-13. The loss in the number of entrants will not be large and they are likely to adopt a ‘wait and see’ policy. Will the Government really continue year after year with the cuts in the non-AAB+ quota? Will there be a reduction in the threshold level? For these universities answers to these questions will be even more critical than for others.
55
How many universities will reduce their fees?
194. While some universities will be very reluctant to reduce their fees, for others with very low proportions of students with AAB+ qualificationsthere is no real alternative. The main question is whether they will be responsive enough to make changes in time for 2012-13. Ideally they need to make decisions by September 2011. These decisions will affect the whole sector because if average net fees do not approach the Government’s average fee assumption, student numbers will be cut or, more likely, the HEFCE grant will be further reduced.
Table 9; Higher education institutions likely to reduce net fees and bid for places
Number HEIs
Number Students
Places Bid
Net fee Difference
‘Ready to bid’ Net fees already £7500 or lower 9 23,307 2295 £0Headline fees £8,000 or lower AAB+ < 10% 22 53,371 5201 £10Headline fees £8500 or lower AAB+ < 10% 48 142,569 13840 £156Any Fees AAB+ < 10% 76 212,723 20583 £410All except Russell and 1994 Groups 89 228,401 21774 £466 Table 9 notes: See Appendix 5 for courses, assumptions and calculations.
195. Table 9 shows how many places higher education institutions would be bidding for, and what would be the reduction in the average net fee, were different groups of institutions to reduce their net fee to £7500.With each row going down table 9 more institutions reduce their fees and bid for non-AAB places. In the first row are the nine institutions whose net fees are already at or lower than £7500. It is assumed that these institutions will bid for places to replace the cuts made to their non-AAB+ quota. They could, of course, bid for additional places.
196. The second row adds those HEIs who have less than 10 per cent AAB+ entrants, and whose headline fee is £8000 or less. If they so choose these institutions should be able to achieve a fee less waivers total of
56
£7500 without reducing their income significantly by swopping bursaries for fee waivers. The third and fourth rows show the effect of institutions with the same low percentage of AAB+ entrants but with headline fees of £8500 or less and £9000 or less.
Table 10: Reduced fees or reduced numbers?
Reduce numbers
Reduce fees
Headline fee £8,500 £7,800
Fee less waivers £8,400 £7,500
OFFA spend (15%) £375 £375
Income after OFFA spending £8,125 £7,425
Non-AAB+ students 833 930
AAB+ student 70 70
Total number of students 903 1,000
Total income after OFFA spending £7.34 million £7.43 million
Table 10 notes - Does not correspond to an actual university - fictitious data.
197. The decision as to whether to take a fee cut is finely balanced when the costs and benefits of just one year are taken into account. Take the case of an institution with 7 per cent AAB+ entrants, which has set a fee at £8500. Its OFFA spend is at the low end, 15 per cent, or £375 per student. If it were to lower the fee, OFFA would probably accept a switch from bursaries to fee waivers, but a reduction in the total spend would be difficult at this stage. Table 10 shows the income for both options, under the assumption that the university is able to maintain, but not increase, its number of AAB+ entrants. The difference in overall income for the two options is not great, and could go the other way with slightly different assumptions. If universities with these characteristics believe that the Government will make margin cuts year on year, their best policy is to reduce fees without delay. If they think a change of policy is possible, they may be inclined to put off the decision.
At risk departments
198. Even with those highly selective universities, where most departments have far more well qualified applicants than places, and where more than half the students have AAB+ qualifications, some departments find it more difficult to recruit well qualified students. This is
57
particularly true of the physical sciences. When departments close lack of student demand is not usually the only or even the main problem, but it can be a contributing factor.
199. If the ‘elite’ institutions, those who routinely reject AAB+ applicants across the whole range of subjects, were to expand their chemistry and physics departments this could have a knock on effect on those departments in other universities. The combination of a shortage of well-qualified applicants, and a small and reducing core with which to recruit students with potential but without high grades, could make it difficult for them to maintain their recruitment of suitably qualified students. Added to this, HEFCE has warned that the funding for high cost subjects could be reduced in future if fees remain higher than the Government anticipated.
200. The impact will not be large in 2012-13, but in the longer term it could be damaging to some of our leading science departments. It is essential that the patterns of recruitment are monitored closely.
Will there be more provision at further education colleges?
201. There will be 20,000 places in the ‘margin’ for allocation. Where these will go will depend on which institutions bid and what decisions the panels make. As we have seen, it is very difficult to predict how many universities will be bidding for places in 2012-13, and for and for how many places. It could be for anything between 5000 and 20,000.
202. If universities do bid for 20,000 places or more it is unlikely we will see a large transfer of places to further education colleges. In general universities will be better placed than colleges to demonstrate that they can meet the conditions that HEFCE have set out. Further education colleges do win on price, and their fee levels are lower than for universities, but fee level is not a criterion for awarding places, so long as it is at or below £7500 after fee waivers.
203. If the universities bid for fewer places, say at our lower estimate of about 5000, a rapid expansion of places at further education colleges would seem likely64. This would not necessarily be a good outcome for students. Firstly, though colleges would have had to provide evidence ‘that they can reasonably be expected to fill the places’, with a large increase in number of places there is always a risk that they would not be filled. Secondly, if they were filled, and there were a rapid increase in the
64 The potential increase in places at further education colleges may seem modest compared to the total of 171 thousand higher education students taught at further education colleges (Rashid et al 2011). However, this figure includes all students (not just entrants), students registered at universities and part-time students including those on non-prescribed courses. An additional 15,000 places would represent a 82 per cent increase in the number of full-time undergraduate entrants taught and registered at further education colleges (See appendix 5).
58
number of entrants, the quality of the student experience would be at risk. We know from the NSS that further education colleges on average score less well on ‘the course is well organised and is running smoothly’ (HEFCE 2011c) and when there was a rapid increase in foundation degree provision such problems became more severe65.
Other measures that universities may be considering
204. Faced with this dilemma of reduced fees or reduced student numbers, or perhaps with the prospect of an annual bidding competition, universities may consider other measures. For those that have provision which is currently taught under a franchise agreement at a further education college it would be possible to bring the teaching into the university. More radically, a university could establish a private college charging £6000 for low cost, low entry level courses, to take up part of its intake. This would have a number of advantages. The provision that remained with the university would have smaller ‘margin’ cuts and its profile and league table position would improve with the removal of students with weak entry qualifications and higher non-completion.
Part-time
205. Although it is not made clear, most of the discussion in the White Paper relates to full-time provision. In a paragraph on part-time (WP 5.27) it confirms that for students studying ‘at an intensity of 25 per cent, in each academic year’ there will be a loan to cover fees. The cost of these loans is very uncertain. It is unclear what universities will charge, what proportion of students will take out a loan and what their repayments will be. The Government has budgeted for £350 million pa (2012 prices) when the new scheme has completely replaced current arrangements.(See appendix 1).
206. The maximum fee is to be £6750. This is independent of the intensity, so in theory a university could charge this for 25 per cent intensity, which equates to a full-time equivalent of £27,000. Full-time students become liable for repayments after they have left the course; part-time students will be liable to start repaying loans three years after they began studying, even if they continue. The same threshold applies to part-time students, so they will only have to pay if they are earning over £21,000 pa.
65 ‘There are indications from the NSS that, in some cases, the rapid growth in foundation degree provision may have had an adverse impact on the student experience, with teething problems affecting the organisation and smooth running of courses. Institutional course planners and national and regional policy makers should bear this in mind. It is especially important given that weak organisation can be particularly disruptive for mature students, who may have to fit their studies in around other commitments.’ (HEFCE 2007)
59
207. The grants that are currently provided for study expenses will be discontinued with a saving estimated at £90 million (2012 prices).
208. The Open University, which provides a third of the undergraduate part-time provision in England, has set fees for all its undergraduate courses at £5000 per full-time equivalent. The current fees vary. To take an example, for a six year course leading to BSc (Hons) Psychology degree the average fee per full-time equivalent (120 credits) is £1773. Birkbeck College, the other university specialising in part-time provision will be charging £6000 or £6750 for intense (75 per cent) four year degree courses. It is very difficult to determine what impact these changes will have on ‘high intensity’ part-time study.
209. Low intensity, what are often referred to as continuing education, courses with 10 credits would attract a fees over a wide range from under £100 to over £300. If other universities were to follow the Open University’s lead the fee would rise to £417. This provision is already in decline, first with the rise in fees to £3000 for full-time students, and then with the withdrawal of funding for graduates. Given that this study is discretionary for most students, a rise in fees to this level would almost certainly lead to a sharp decrease in demand for many of the courses.
Beyond 2012-13
210. The White Paper says that the Government wants ‘the size of the margin to grow steadily in future years’ (WP 4.21) and that it wants to widen the ‘higher achieving’ threshold ‘in the life of this Parliament’, that is by 2015 (WP4.19). These are just two of the six parameters that are available to the Government.
Parameter Value in 2012-13
Maximum fee £9,000
Maximum fee without OFFA agreement £6,000
Maximum fee to retain student numbers £6,000
Maximum net fee to bid for student numbers £7,500
Margin cut 20,000
High achieving threshold AAB+
211. The first two maxima will increase with inflation, but otherwise are unlikely to change. However, all the other parameters can change year on year, with all the consequent uncertainty.
60
212. Will the Government really follow through their plan to increase the margin and reduce the threshold? If fees are brought down to something close to their target of £7500 in the first year or two, will it continue to force universities to bid annually if they are to avoid cuts in their quota of not ‘high achieving’ students? Whatever happens, the next few years will be interesting times, with potentially great disruption and uncertainty.
Private providers
213. Private providers will not be able to bid for places in 2012-13, and will have to wait for the promised change in regulations. It is expected they will be able to bid for places in 2013-14. If the Government does follow the plan to increase the margin in the second year, we would expect larger numbers of universities to reduce their net fees and enter the bidding, if they had not already done that for 2012-13. With the current criteria for judging bids, this could jeopardise the Government’s plans to diversify the sector with more higher education in further education colleges and with private providers. To ensure that places went to further education colleges and private providers the Government could lower the entry ticket to a £6000 fee. A slightly softer way of achieving this would be to set out the criteria for the panels such that, after certain basic standards were met, choice would be made on fee level.
214. If this policy is implemented, or if we see a large increase in places for further education colleges in 2012-13, what will happen if these places are not filled? Just because the Government would like more places in FE colleges, that does not mean that students will seek out these places. As the Government has said, the market will have its say. Would HEFCE be asked to recycle these places, or would this be taken as evidence that demand had been met, and the consequential savings are used to help reduce the deficit?
Where will we end up?
215. The White Paper does not give us a clear description of where the Government believes this process will take us, or what it is aiming for in the long term. The ‘core and margin’ system will force down net fees, if not far enough in the first year, then later. The threshold device removes the necessity for elite and influential universities to go through the indignity of bidding for student numbers each year while charging at or close to the maximum fee. These measures are presented as creating ‘competition’, but the starting lines are so far apart, the winners and losers can be identified in advance.
216. The logic of the twin measures is to create two sets of institutions, a new binary divide. One group will charge net fees over some Government limit (currently £7500) and be free to recruit students without any Government quota. Their students will be eligible for a range of bursaries
61
and scholarships, and there will be increased resources for teaching. The other group of providers will charge below a net fee level set by the Government, in effect a maximum net fee. Each institution would be allocated a quota of student places which would cover part-time as well as full-time students that it could not exceed. There would be fewer resources for teaching and less generous bursaries and scholarships than awarded by the other group of institutions.
217. The size of these two groups will depend on the relative speed of the changes in qualification threshold and margin allocations, and the response of providers and potential entrants to HE. At one extreme the outcome could be close to something like that proposed by the Browne review, where the Government sets the minimum qualifications for supported entry to higher education on an annual basis. At the other extreme most institutions would work under controls similar, though more stringent, than they have had up to now, with a relatively small number of institutions free from quota controls.
62
References
Bowman NA and Bastedo MN (2009), “Getting on the Front Page: Organizational Reputation, Status Signals, and the Impact of U.S. News and World Report on Student Decisions”, Research in Higher Education, 50 (5), 415-436
BIS (2011a), ‘Higher Education: Students at the Heart of the System.’
BIS (2011b), ‘Higher Education: Students at the Heart of the System: Impact Assessment.’
BIS (2011c), ‘Supporting analysis for the Higher Education White Paper’, BIS Economics Paper No. 14
BIS (2011d), ’Consultation on potential early repayment mechanisms for student loans.’
BIS (2011e), ‘Students at the Heart of the System: Equality Impact Assessment.’
The five White Paper documents BIS 2011a-e are available at:- http://discuss.bis.gov.uk/hereform/all-documents/
BIS (2011f), ‘Guidance to the Director of Fair Access’ www.bis.gov.uk/assets/biscore/higher-education/docs/g/11-728-guidance-to-director-fair-access
Brennan J and Williams R (2004) ‘Collecting and using feedback – a guide to good practice’, section 6.2. www.heacademy.ac.uk/assets/documents/tla/collecting_and_using_student_feedback.pdf
Brown P, Lauder H and Ashton D, ‘The Global Auction’ (2011) Oxford University Press. Figure 8.1, page 118.
CHERI (2005), ‘Survey of higher education students’ attitudes to debt and term-time working and their impact on attainment’, A report to Universities UK and HEFCE by the Centre for Higher Education Research and Information (CHERI) and London South Bank University. www.hefce.ac.uk/pubs/rdreports/2005/rd15_05/
Chester J and Bekhradnia B (2008), ‘Financial support in English universities: the case for a national bursary scheme’, HEPI Report www.hepi.ac.uk/466/Reports.html
Chowdry H, Dearden L and Wyness G (2010), ‘Higher Education Reforms: Progressive but Complicated with an Unwelcome Incentive’, IFS Briefing Note 113. www.ifs.org.uk/bns/bn113.pdf
Coleman R and Bekhradnia B (2011), ‘Higher Education Supply and Demand to 2020’. HEPI Report www.hepi.ac.uk/466/Reports.html
Corver M (2010), ‘Have bursaries influenced choices between universities?’, OFFA Report 2010/6. www.offa.org.uk/wp-content/uploads/2010/09/Have-bursaries-influenced-choices-between-universities-.pdf
Crawford C, Paul Johnson P, Machin S and Vignoles A (2011), ‘Social Mobility – A Literature Review’ , BIS Report. www.bis.gov.uk/assets/biscore/economics-and-statistics/docs/s/11-750-social-mobility-literature-review
Dearden L, Fitzsimons E and Wyness g (2010), “The Impact of Higher Education Finance on University Participation in the UK”, Department for Business. Innovation and Skills Research Paper Number 11 (September 2010). www.bis.gov.uk/assets/biscore/corporate/docs/i/10-1188-impact-finance-on-university-participation.pdf
Everett N and Papageorgiou J (2011), ‘Investigating the accuracy of predicted A-level grades as part of the 2009 UCAS admission process’ BIS Research paper number 37 www.bis.gov.uk/assets/biscore/higher-education/docs/i/11-1043-investigating-accuracy-predicted-a-level-grades.pdf
Green F and Zhuy Y, (2010), “Overqualification, job dissatisfaction, and increasing dispersion in the returns to graduate education”, Oxford Economic Papers 62, 740–763
HEFCE (2008), ‘Counting what is measured or measuring what counts? League tables and their impact on higher education institutions in England’ HEFCE Report 2008/14 www.hefce.ac.uk/pubs/hefce/2008/08_14/
HEFCE (2009), ‘Patterns in higher education: living at home’ HEFCE Report 2009/20 www.hefce.ac.uk/pubs/hefce/2009/09_20/
HEFCE (2010) “Understanding the information needs of users of public information about higher education – Report to HEFCE by Oakleigh Consulting and Staffordshire university”, HEFCE Research Report www.hefce.ac.uk/pubs/rdreports/2010/rd12_10/
HEFCE (2011a), ‘Teaching funding and student number controls Consultation on changes to be implemented in 2012-13’ HEFCE Report 2011/20. www.hefce.ac.uk/pubs/hefce/2011/11_20/
HEFCE (2011b) ‘Provision of information about higher education - Outcomes of consultation and next steps’, HEFCE Report 2011/18 www.hefce.ac.uk/pubs/hefce/2011/11_18/
HEFCE (2011c) ‘National Student Survey; Findings and trends 2006 to 2010s’, HEFCE Report 2011/11 www.hefce.ac.uk/pubs/hefce/2011/11_11/
JM Consulting (2004), ‘The costs of widening participation in higher education’, HEFCE, UUK and SCOP Report www.hefce.ac.uk/pubs/rdreports/2004/rd03_04/
Kirkup C, Wheater R, Morrison J, Durbin B and, Pomati M(2010), ‘Use of an aptitude test in university entrance: a validity study’, BIS Research Paper Number 26 www.bis.gov.uk/assets/biscore/higher-education/docs/u/10-1321-use-of-aptitude-test-university-entrance-validity-study.pdf
London Economics (2011), ‘The Returns to Higher Education Qualifications’, BIS Research Report. www.bis.gov.uk/assets/biscore/higher-education/docs/r/11-973-returns-to-higher-education-qualifications.pdf
OFFA (2009), ‘ Access Agreement Monitoring: Outcomes for 2007-08’. www.offa.org.uk/wp-content/uploads/2009/08/monitoring-outcomes-07-08_offa-report-a-w.pdfzz
OFFA (2011a), ‘OFFA decisions on 2012-13 access agreements’ www.offa.org.uk/press-releases/universities-and-colleges-to-increase-their-spending-on-access-to-600-million-a-year/
Morris M, Rutt S and Mehta P (2009), ‘The longer term impact of Aimhigher: Tracking individuals’, Report to HEFCE by the National Foundation for Educational Research www.hefce.ac.uk/pubs/rdreports/2009/rd21_09/
Purcell K, Elias P, Ellison R, Atfield G, Adam D and Livanos I (2008), “Applying for Higher Education – the diversity of career choices, plans and expectations”. HECSU Research Report www.hecsu.ac.uk/applying_for_higher_education.htm
Rashid S, Parry G, Thompson A and Greg Brooks G (2011), ‘Patterns of further and higher education in colleges and universities in England’ www.hefce.ac.uk/pubs/rdreports/2011/rd04_11/
Smith J and Naylor R A (2001), ‘Determinants of degree performance in UK universities: a statistical analysis of the 1993 student cohort’ Oxford Bulletin of Economics and Statistics, 63, 29-60.
Thompson J and Bekhradnia B (2010a), ‘The Independent Review of Higher Education Funding: an analysis ’, HEPI Report. www.hepi.ac.uk/466/Reports.html
Thompson J and Bekhradnia B (2010b), ‘The Government's proposals for higher education funding and student finance – an analysis’, HEPI Report. www.hepi.ac.uk/466/Reports.html
Willetts D (2011) ‘Don’t look to the Ivy League’, London Review of Books, 33(14), Letters
Zimdars A (2007), “Challenges to Meritocracy? A study of the social mechanisms in student selection and attainment at the University of Oxford”, DPhil thesis, Sociology, University of Oxford.