31
Headline Verdana Bold Holiday shopping trends survey 2018 November 2018

Headline Verdana BoldHoliday shopping trends survey 2018November 2018
2
Content
Key Trends 3
Consumer Perception 5
Holiday Shopping 8
Omnichannel User Experience 20

3
Key Trends
ECONOMIC OVERVIEW
The Dutch population is significantly more positive about the current state and future of the economy than the European average
Although 4 out of 5 people are neutral or positive about the current state of the economy, only 65% thinks their spending power has increased compared to last year
WE’RE CONNECTED
1 out of 3 consumers uses the internet to search for ideas.
1 out of 4 actually purchases the products online, resulting in 30% of our spend through online channels
Mobile purchases increased by 21% compared to last year, showcasing its popularity
CONSUMER HABITS
Most holiday shopping is done in November or in the first half of December
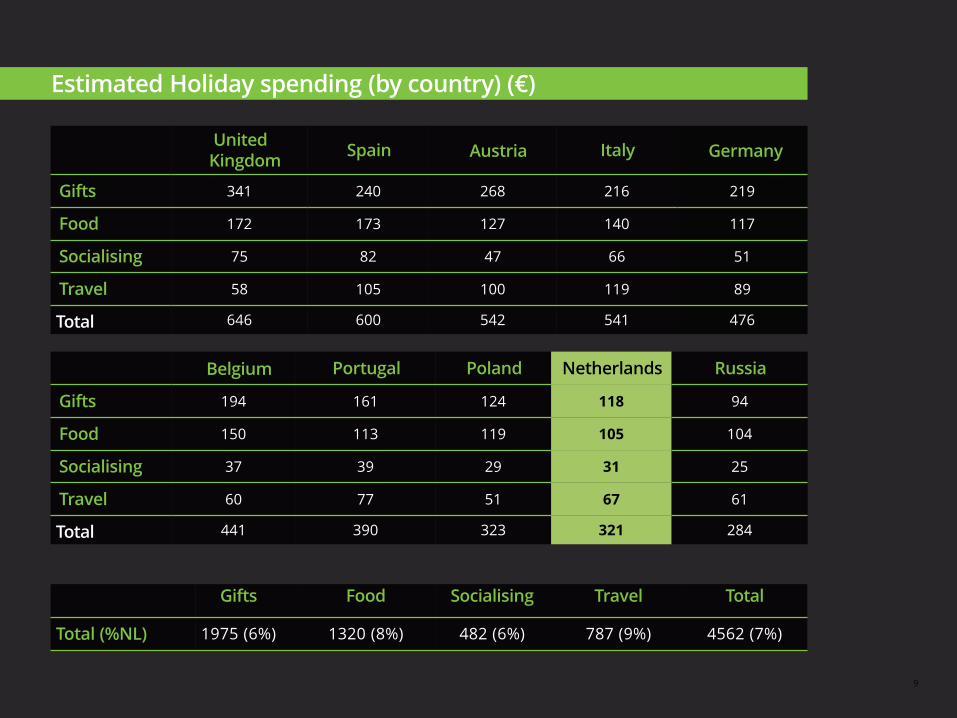
The Netherlands scores second-lowest in terms of holiday spending, with only Russia spending less
Sinterklaas (5 December) spending makes up 21% of total holiday purchases. This is similar to last year but still 2.5 times less than Christmas spending
WHERE, WHEN, WHAT
The shopping street is still most valued by consumers for Holiday shopping, with 7 out of 10 purchasing products in-store, resulting in 70% of spend through the stores
When shopping online, there is a limited difference in preference between purchasing with pure online players or brick and click retailers. However, when searching for ideas, brick and click retailers are preferred almost twice as much
Black Friday popularity increased by almost 50% compared to last year. For the younger generation it’s even 68% who purchases during this sales event
3

4
Content
4
Key Trends 3
Consumer Perception 5
Holiday Shopping 8
Omnichannel User Experience 20

5
79% of the
participants in the Netherlands is positive or neutral about the current state of the economy
65% of those
participants rates the expected state of the economy in 2019 as positive or neutral
Compared to the rest of Europe, the Dutch population is significantly more positive about the current state of the economy, and next year’s state of the economy (18% and 16% more positive compared to cross country average for 2018 and 2019, respectively).
The Dutch population is less optimistic about next year’s economy compared to the current state. However, last year the respondents were also pessimistic about the 2018 state of the economy (32% was negative about the expected state of the economy), while the actual state is perceived similar (80% last year versus 79% this year).
Current state of the economy
+80% 80-70% 70-60% 60-50% 40-30%50-40%
European average: 67% European average: 56%
6
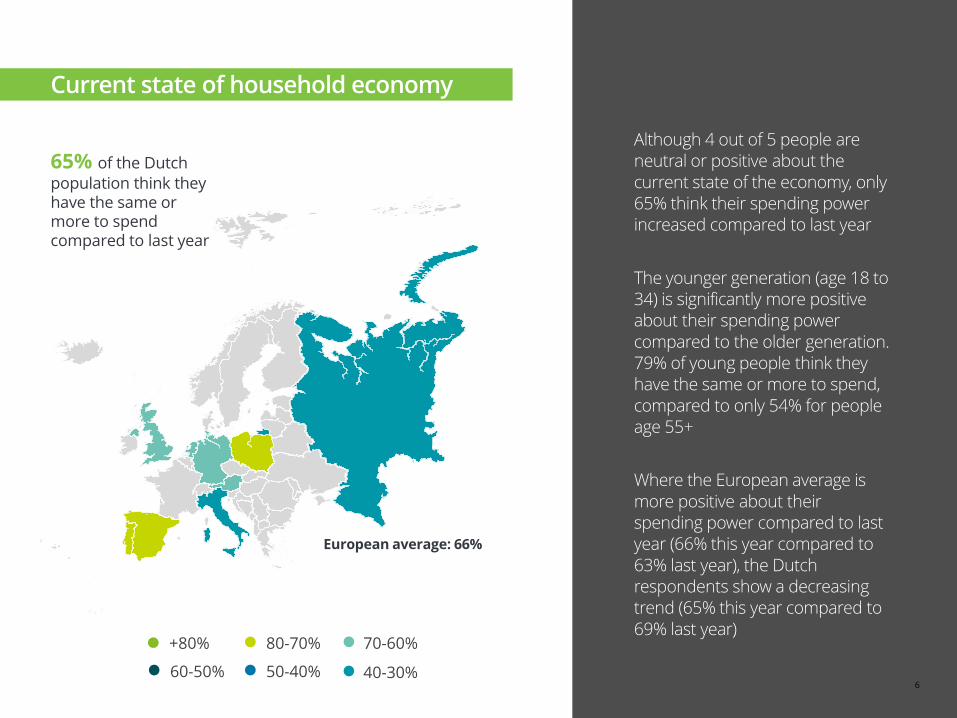
Current state of household economy
65% of the Dutch
population think they have the same or more to spend compared to last year
Although 4 out of 5 people are neutral or positive about the current state of the economy, only 65% think their spending power increased compared to last year
The younger generation (age 18 to 34) is significantly more positive about their spending power compared to the older generation. 79% of young people think they have the same or more to spend, compared to only 54% for people age 55+
Where the European average is more positive about their spending power compared to last year (66% this year compared to 63% last year), the Dutch respondents show a decreasing trend (65% this year compared to 69% last year)
+80% 80-70% 70-60%
60-50% 40-30%50-40%
European average: 66%
6
7
Content
7
Key Trends 3
Consumer Perception 5
Holiday Shopping 8
Omnichannel User Experience 20
8
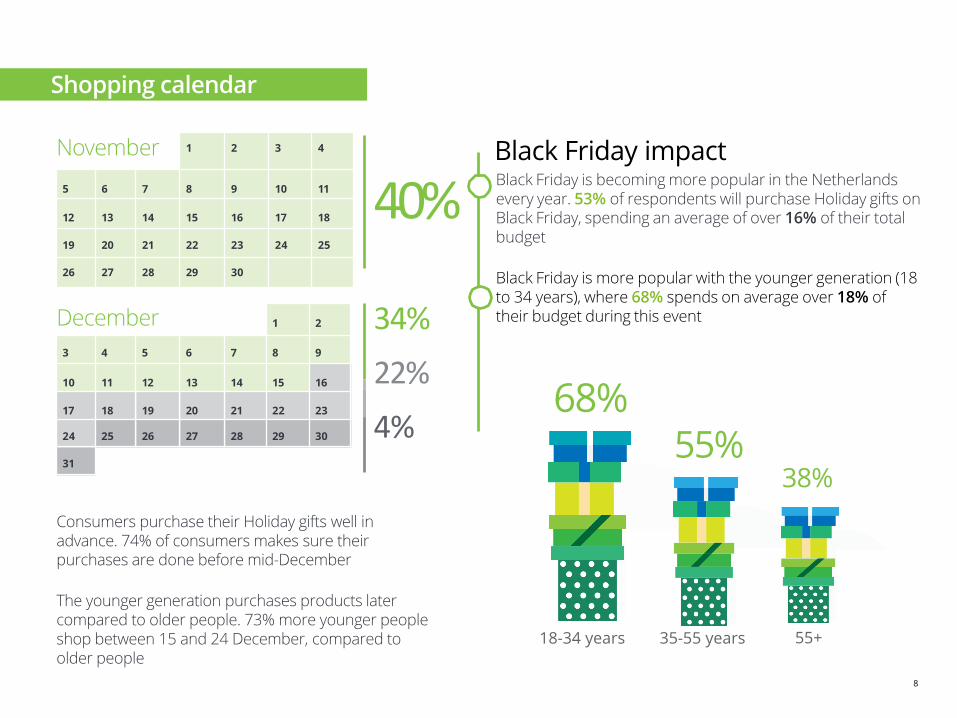
Shopping calendar
Black Friday is becoming more popular in the Netherlands every year. 53% of respondents will purchase Holiday gifts on Black Friday, spending an average of over 16% of their total budget
Black Friday is more popular with the younger generation (18 to 34 years), where 68% spends on average over 18% of their budget during this event
November 1 2 3 4
5 6 7 8 9 10 11
12 13 14 15 16 17 18
19 20 21 22 23 24 25
26 27 28 29 30
December 1 2
3 4 5 6 7 8 9
10 11 12 13 14 15 16
17 18 19 20 21 22 23
24 25 26 27 28 29 30
31
40%
34%
22%
4%
Black Friday impact
Consumers purchase their Holiday gifts well in advance. 74% of consumers makes sure their purchases are done before mid-December
The younger generation purchases products later compared to older people. 73% more younger people shop between 15 and 24 December, compared to older people
38%
68%
55+
55%
18-34 years 35-55 years
8
9
United Kingdom
Spain Austria Italy Germany
Gifts 341 240 268 216 219
Food 172 173 127 140 117
Socialising 75 82 47 66 51
Travel 58 105 100 119 89
Total 646 600 542 541 476
Belgium Portugal Poland Netherlands Russia
Gifts 194 161 124 118 94
Food 150 113 119 105 104
Socialising 37 39 29 31 25
Travel 60 77 51 67 61
Total 441 390 323 321 284
Gifts Food Socialising Travel Total
Total (%NL) 1975 (6%) 1320 (8%) 482 (6%) 787 (9%) 4562 (7%)
Estimated Holiday spending (by country) (€)
10
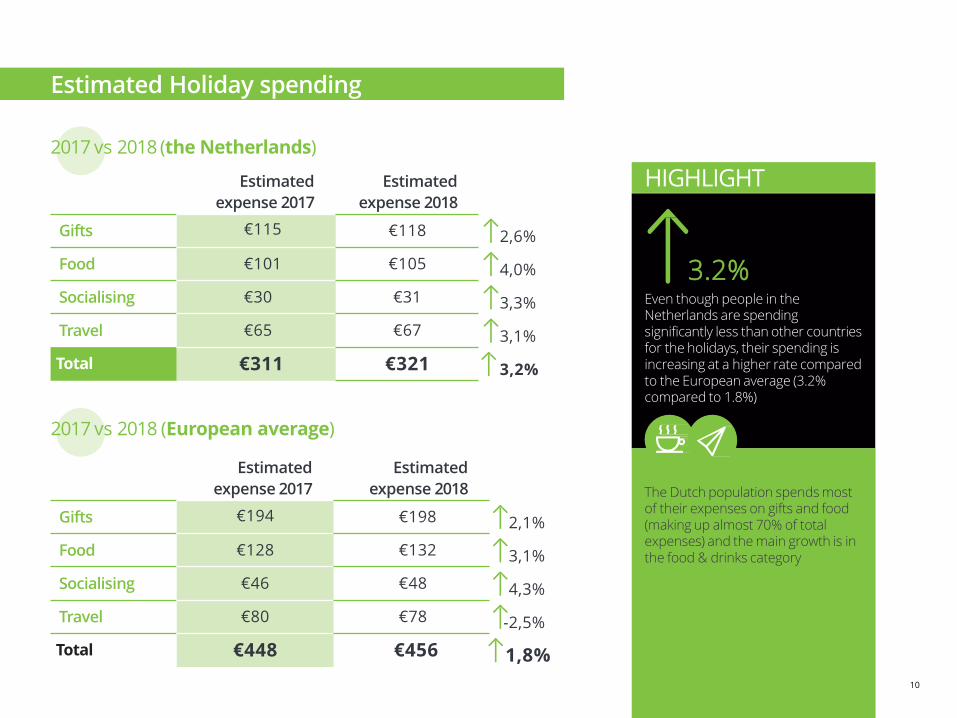
Estimated Holiday spending
Estimated
expense 2017
Estimated
expense 2018
Gifts €115 €118 2,6%
Food €101 €105 4,0%
Socialising €30 €31 3,3%
Travel €65 €67 3,1%
Total €311 €321 3,2%
2017 vs 2018 (the Netherlands)
Estimated
expense 2017
Estimated
expense 2018
Gifts €194 €198 2,1%
Food €128 €132 3,1%
Socialising €46 €48 4,3%
Travel €80 €78 -2,5%
Total €448 €456 1,8%
2017 vs 2018 (European average)
3.2%Even though people in the Netherlands are spending significantly less than other countries for the holidays, their spending is increasing at a higher rate compared to the European average (3.2% compared to 1.8%)
The Dutch population spends most of their expenses on gifts and food (making up almost 70% of total expenses) and the main growth is in the food & drinks category
HIGHLIGHT
10

11
Estimated Christmas spending
The Dutch population spends a smaller percentage of their holiday expenses on gifts, while more is spent on food and drinks compared to the European average
Holiday budget composition 2018
UK
Spain
Austria
Italy
Germany
TOP 5
37%
10%
21%
The Netherlands
Europe
GIFTS FOOD SOCIALISING TRAVEL
43%
33%
11%
29%
17%
Estimated Holiday spending
12
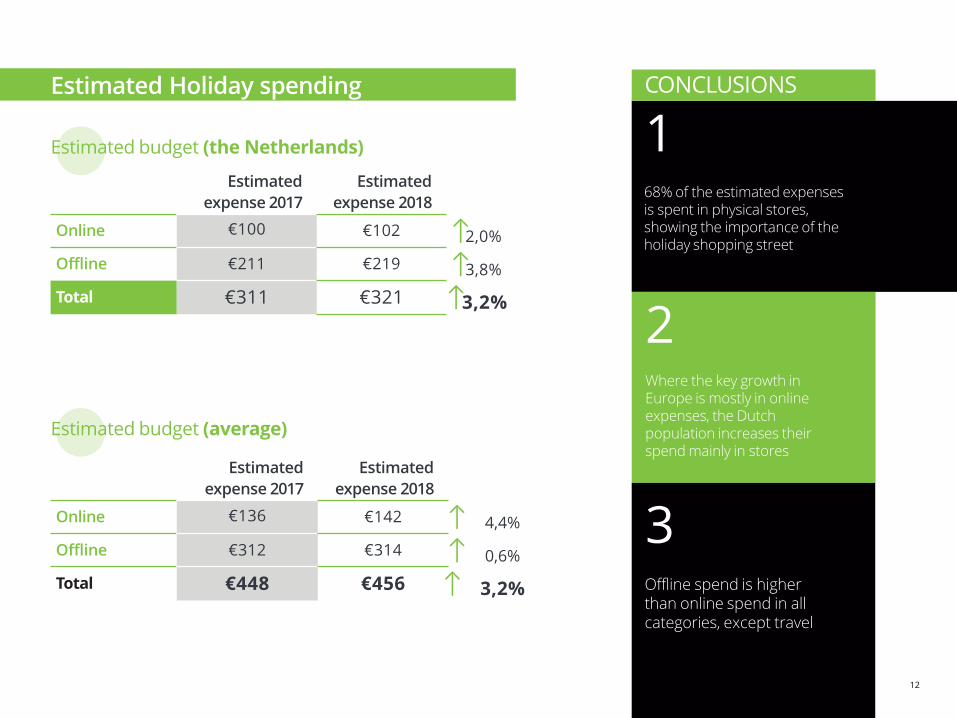
Estimated Holiday spending
Estimated
expense 2017
Estimated
expense 2018
Online €100 €102 2,0%
Offline €211 €219 3,8%
Total €311 €321 3,2%
Estimated budget (the Netherlands)
Estimated
expense 2017
Estimated
expense 2018
Online €136 €142 4,4%
Offline €312 €314 0,6%
Total €448 €456 3,2%
Estimated budget (average)
168% of the estimated expenses is spent in physical stores, showing the importance of the holiday shopping street
CONCLUSIONS
2Where the key growth in Europe is mostly in online expenses, the Dutch population increases their spend mainly in stores
3Offline spend is higher than online spend in all categories, except travel
12
13
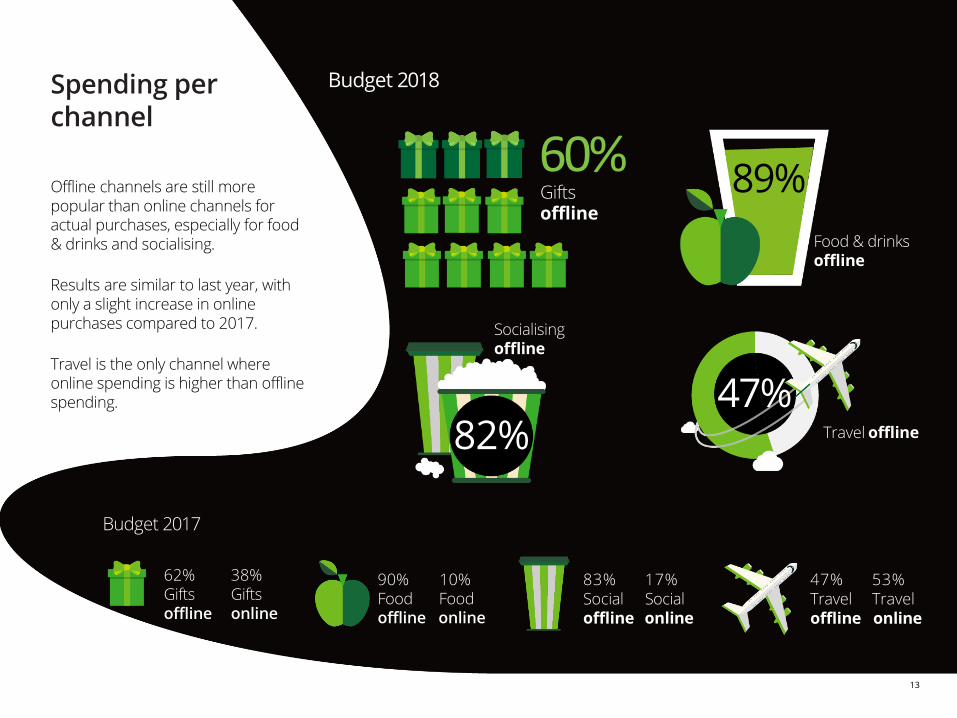
Spending per channel
Offline channels are still more popular than online channels for actual purchases, especially for food & drinks and socialising.
Results are similar to last year, with only a slight increase in online purchases compared to 2017.
Travel is the only channel where online spending is higher than offline spending.
60%Giftsoffline
Budget 2018
Budget 2017
62% 38%Gifts Giftsoffline online
90% 10%Food Foodoffline online
83% 17%Social Socialoffline online
Travel47% 53%
Traveloffline online
82%
Socialisingoffline
89%
Food & drinksoffline
47%Travel offline
14
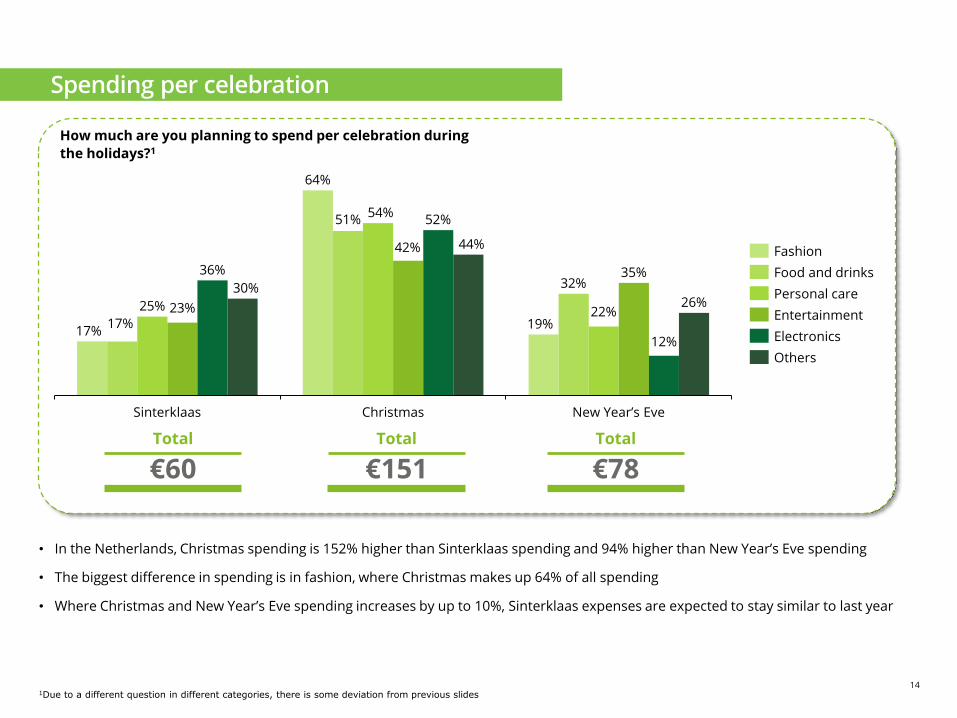
• In the Netherlands, Christmas spending is 152% higher than Sinterklaas spending and 94% higher than New Year’s Eve spending
• The biggest difference in spending is in fashion, where Christmas makes up 64% of all spending
• Where Christmas and New Year’s Eve spending increases by up to 10%, Sinterklaas expenses are expected to stay similar to last year
How much are you planning to spend per celebration during
the holidays?1
€60Total
€151Total
€78Total
1Due to a different question in different categories, there is some deviation from previous slides
26%
36%
25%
Sinterklaas
17%
Christmas New Year’s Eve
17%23%
30%
64%
51%54%
42%
52%
44%
19%
32%
22%
35%
12%
Fashion
Food and drinks
Entertainment
Personal care
Electronics
Others
Spending per celebration
15
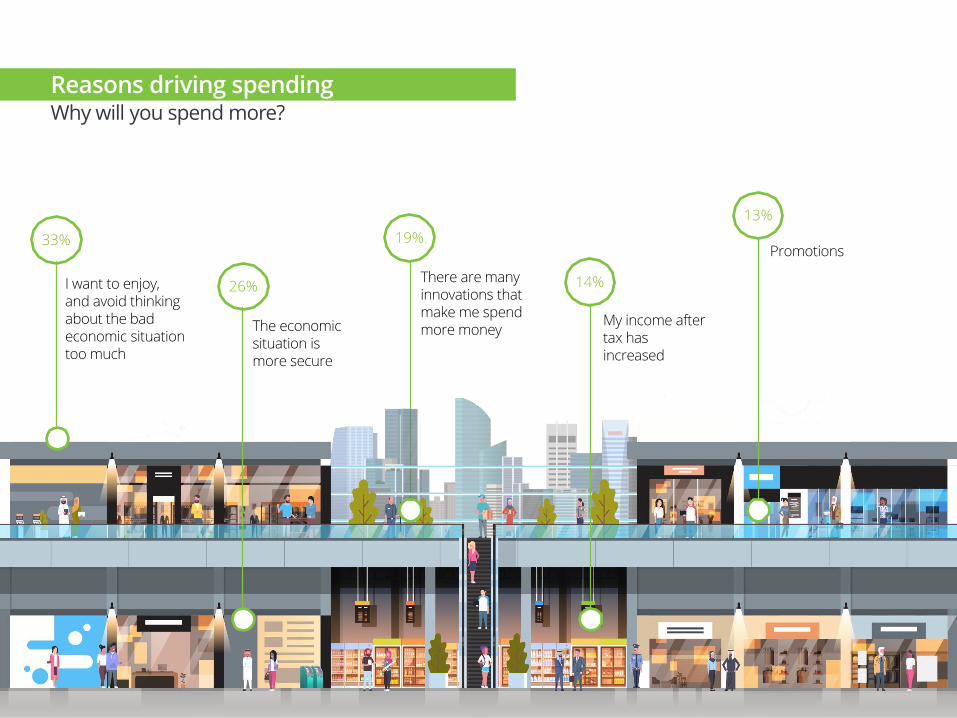
ing changesWhy will you spend more?
I want to enjoy, and avoid thinking about the bad economic situation too much
33%
The economic situation is more secure
There are many innovations that make me spend more money
My income after tax has increased
Promotions
26%
19%
14%
13%
15
Reasons driving spending

16
1 Chocolates 35%
2 Books 34%
3 Cosmetics/perfumes 26%
4 Gift vouchers 26%
5 Food & drink 24%
6 Beauty care 19%
7 Money (cash) 16%
8 Clothes/shoes 15%
9 CDs 13%
10 Games 13%
Most desired gifts for females and males
• The most popular gifts are chocolates (35%) and books (34%), similar to last year. Cosmetics/perfumes is third on the list of most desired gifts in 2018 with a 26% share
• Cosmetics, beauty & care, and CDs became more popular compared to last year, where food & drinks, money, and games declined in popularity
Position compared to 2017
Increase Same position Decrease
FEMALE MALE
1. Chocolates
2. Cosmetics/perfumes
3. Books
4. Gift vouchers
5. Beauty care
1. Books
2. Chocolates
3. Food & drink
4. Gift vouchers
5. Money (cash)
Most desired gifts (adults)
17
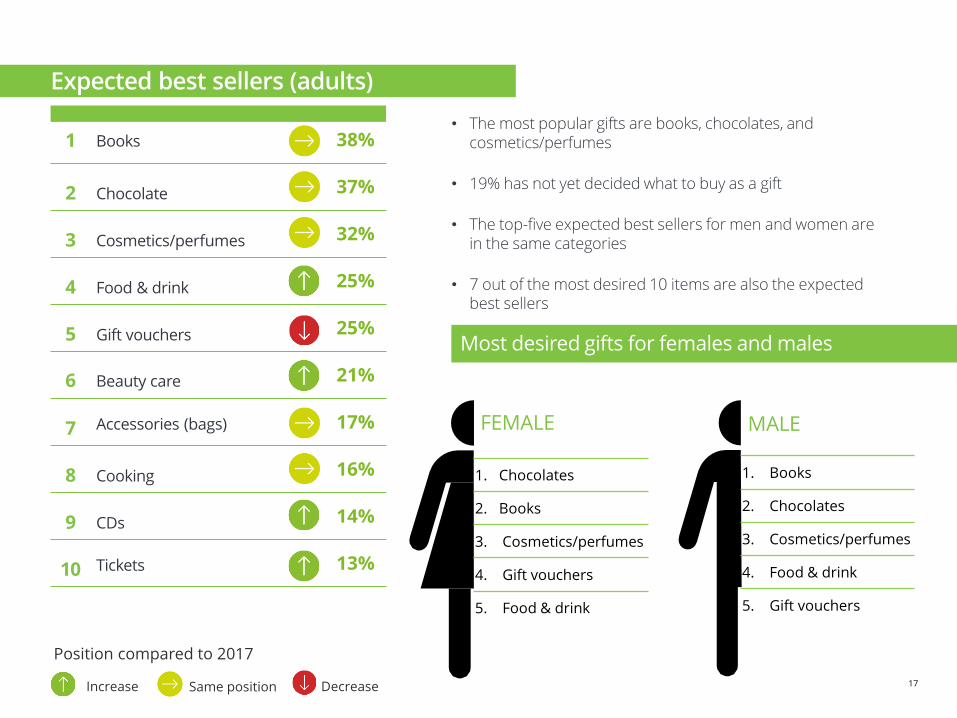
Most desired gifts for females and males
FEMALE MALE
1. Chocolates
2. Books
3. Cosmetics/perfumes
4. Gift vouchers
5. Food & drink
1. Books
2. Chocolates
3. Cosmetics/perfumes
4. Food & drink
5. Gift vouchers
Position compared to 2017
Increase Same position Decrease
1 Books 38%
2 Chocolate 37%
3 Cosmetics/perfumes 32%
4 Food & drink 25%
5 Gift vouchers 25%
6 Beauty care 21%
7 Accessories (bags) 17%
8 Cooking 16%
9 CDs 14%
10 Tickets 13%
• The most popular gifts are books, chocolates, and cosmetics/perfumes
• 19% has not yet decided what to buy as a gift
• The top-five expected best sellers for men and women are in the same categories
• 7 out of the most desired 10 items are also the expected best sellers
Expected best sellers (adults)
18
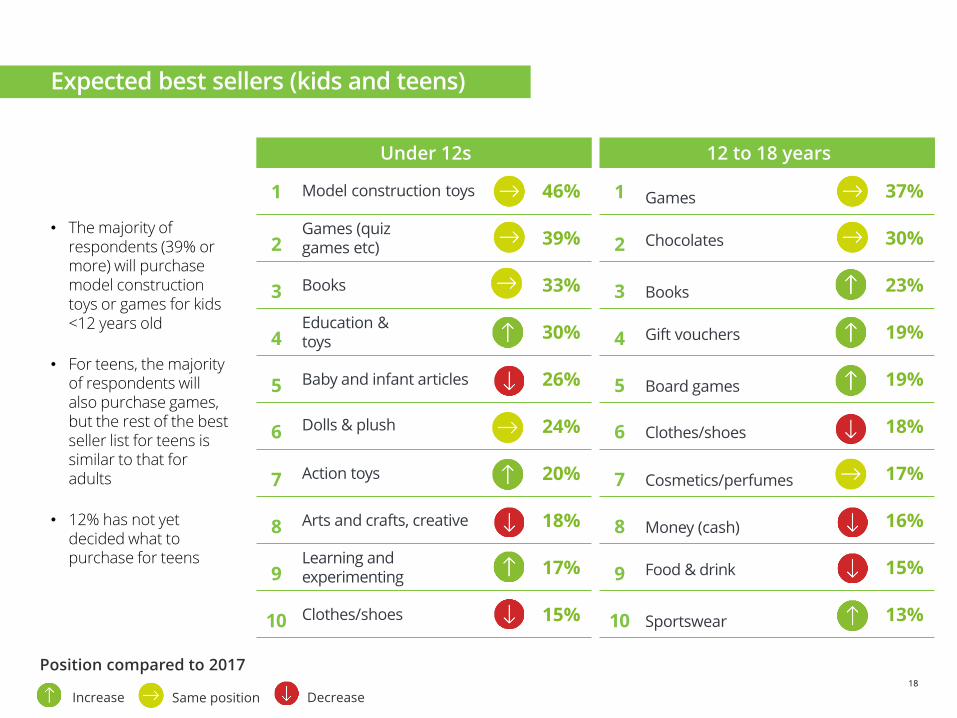
• The majority of respondents (39% or more) will purchase model construction toys or games for kids <12 years old
• For teens, the majority of respondents will also purchase games, but the rest of the best seller list for teens is similar to that for adults
• 12% has not yet decided what to purchase for teens
Position compared to 2017
Increase Same position Decrease
Under 12s
1 Model construction toys 46%
2Games (quiz games etc)
39%
3 Books 33%
4Education & toys
30%
5 Baby and infant articles 26%
6 Dolls & plush 24%
7 Action toys 20%
8 Arts and crafts, creative 18%
9Learning and experimenting
17%
10 Clothes/shoes 15%
12 to 18 years
1 Games 37%
2 Chocolates 30%
3 Books 23%
4 Gift vouchers 19%
5 Board games 19%
6 Clothes/shoes 18%
7 Cosmetics/perfumes 17%
8 Money (cash) 16%
9 Food & drink 15%
10 Sportswear 13%
Expected best sellers (kids and teens)

19
Content
19
Key Trends 3
Consumer Perception 5
Holiday Shopping 8
Omnichannel User Experience 20
20
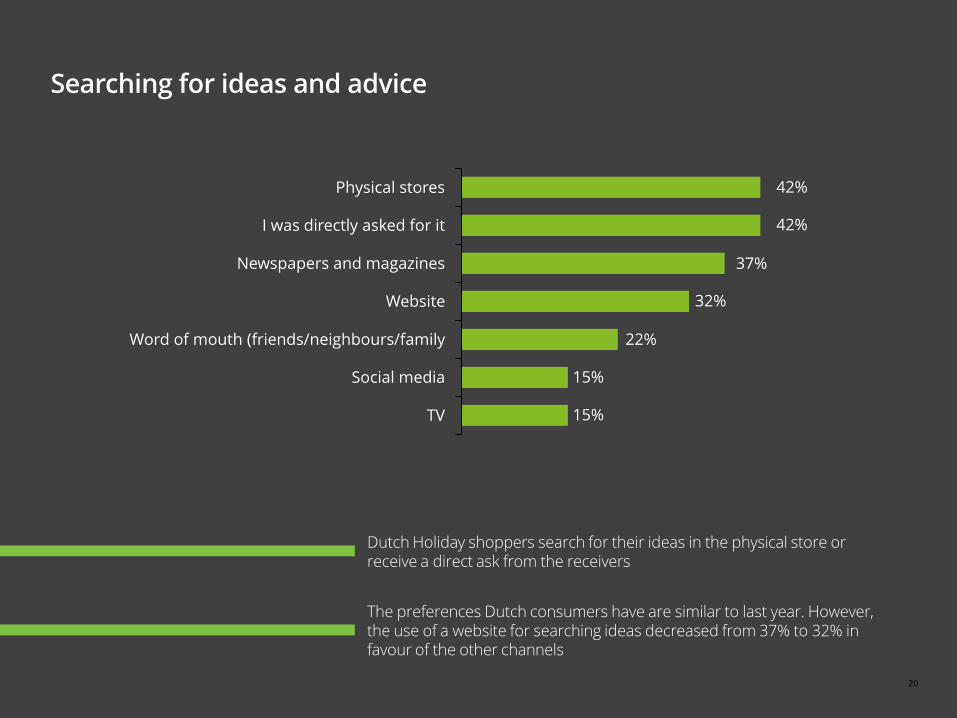
Searching for ideas and advice
Dutch Holiday shoppers search for their ideas in the physical store or receive a direct ask from the receivers
TV
Physical stores
I was directly asked for it
Newspapers and magazines
Social media
Word of mouth (friends/neighbours/family
Website
42%
42%
37%
32%
22%
15%
15%
The preferences Dutch consumers have are similar to last year. However, the use of a website for searching ideas decreased from 37% to 32% in favour of the other channels

21
Searching for ideas and advice(Internet sources)
Websites with coupons and offers
Website of stores with one or more physical stores
Search engines
Websites of brands/suppliers
Email newsletters and online leaflet I receive via email
Comparison site
Website of stores without physical stores
Forums and blogs
53%
45%
40%
32%
32%
31%
29%
16%
Internet sources are mainly websites of brick and click retailers, specific brands, or the use of search engines
22
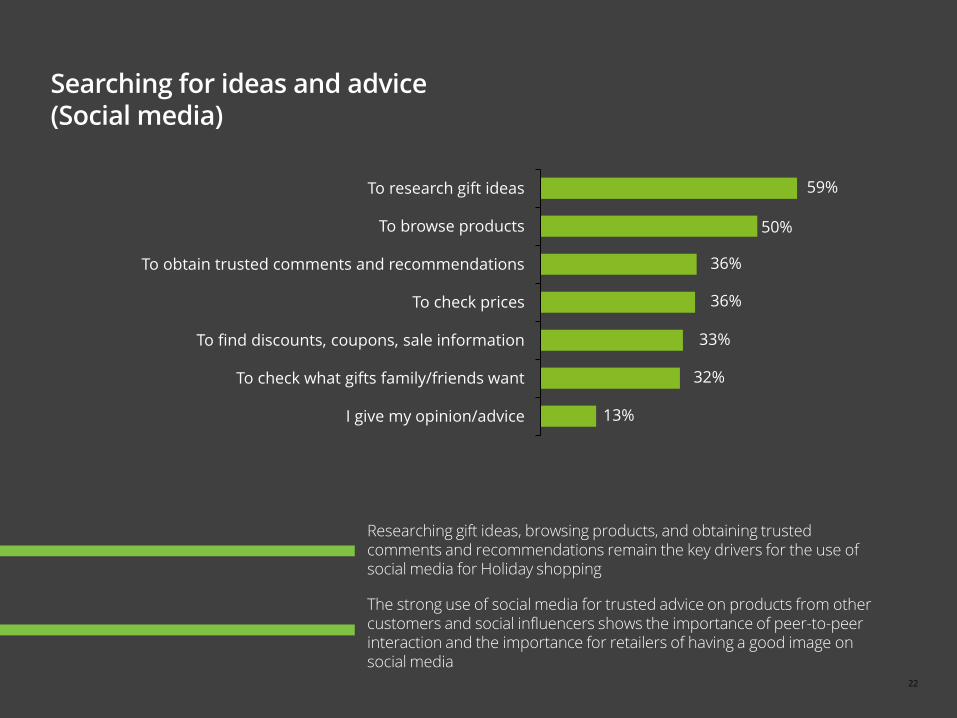
Searching for ideas and advice(Social media)
To obtain trusted comments and recommendations
I give my opinion/advice
To research gift ideas
To browse products
To check what gifts family/friends want
To check prices
To find discounts, coupons, sale information
59%
50%
36%
36%
33%
32%
13%
Researching gift ideas, browsing products, and obtaining trusted comments and recommendations remain the key drivers for the use of social media for Holiday shopping
The strong use of social media for trusted advice on products from other customers and social influencers shows the importance of peer-to-peer interaction and the importance for retailers of having a good image on social media
23
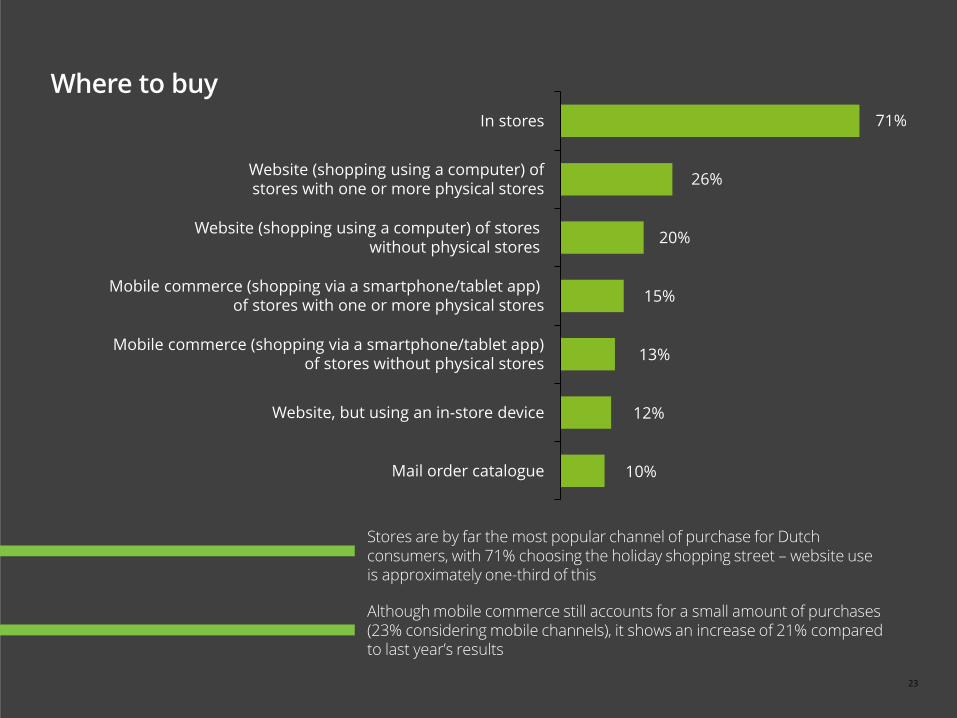
Stores are by far the most popular channel of purchase for Dutch consumers, with 71% choosing the holiday shopping street – website use is approximately one-third of this
Where to buy
Mobile commerce (shopping via a smartphone/tablet app) of stores with one or more physical stores
Website (shopping using a computer) of stores without physical stores
In stores
Website (shopping using a computer) ofstores with one or more physical stores
Mobile commerce (shopping via a smartphone/tablet app)of stores without physical stores
Website, but using an in-store device
Mail order catalogue
71%
26%
20%
15%
13%
12%
10%
Although mobile commerce still accounts for a small amount of purchases (23% considering mobile channels), it shows an increase of 21% compared to last year’s results

24
Where to buy (Physical stores)
45% Traditional local stores
50% Specialised chains
22% Traditional department stores
23% Hypermarket
Most popular channel per country
Considered Dutch purchasing channels
Hypermarket
Traditional local stores
Traditional department stores
Specialised chains
25
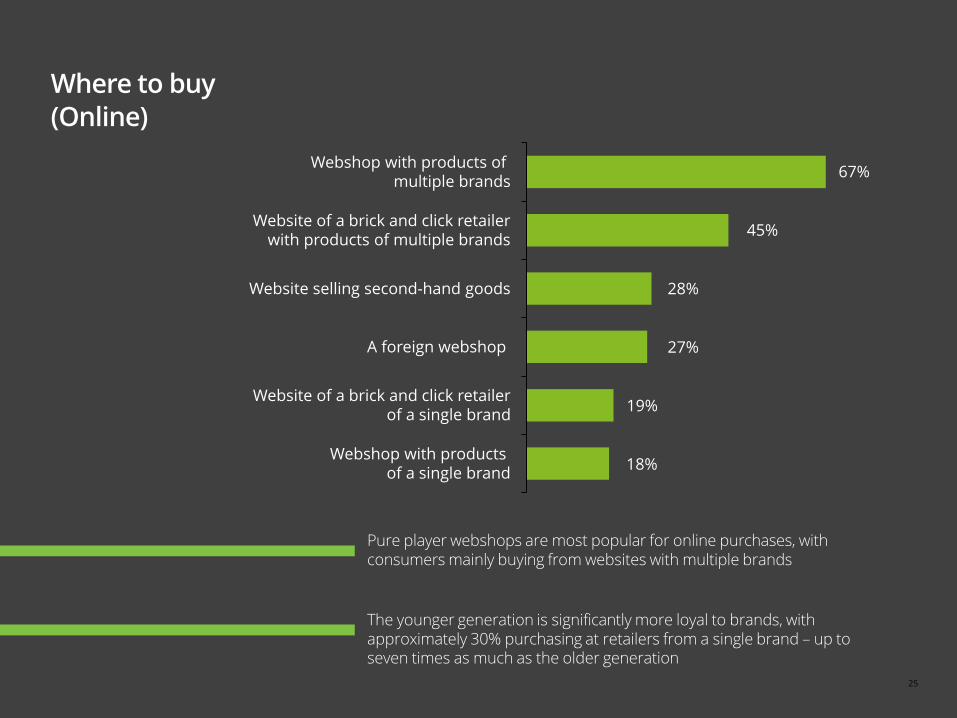
Pure player webshops are most popular for online purchases, with consumers mainly buying from websites with multiple brands
Where to buy (Online)
Website selling second-hand goods
Webshop with products of multiple brands
Webshop with products of a single brand
Website of a brick and click retailerwith products of multiple brands
A foreign webshop
Website of a brick and click retailerof a single brand
67%
45%
28%
27%
19%
18%
The younger generation is significantly more loyal to brands, with approximately 30% purchasing at retailers from a single brand – up to seven times as much as the older generation

26
Where do you spend more than budgeted?
When spending more than budgeted, the overspending is more often from purchases at physical stores than in webshops. It is also more often from multi-branded retailers than from single-branded retailers
Channels of overspending

27
ONLINE mobile OFFLINE
Competent and professional advice
Pleasure while shopping (nice experience)
I immediately get the products I purchased
After-sales services (repair)
Protection of my personal data
Price level
Following delivery
time to order
Products can be compared easily
Competent and professional advice
ONLINE web
Home delivery
Broad assortment
Access to other consumer reviews 62%
62%
61%
59%
57%
It’s easy to search for and choose what I need
24%
22%
20%
19%
18%
87%
82%
77%
74%
72%
Prices can be compared easily
Shopping when I want
Online shopping vs physical stores: advantages

28
1 al 15
50%
€7
Same day
41%
€5
Next day
30%
€5
In two days In a week In two weeks
50% of consumers are willing to pay on average €7 to ensure their package arrives in time for same-day orders
• Half of consumers would be willing to pay on average €7 to ensure the desired package arrives on the same day during the holiday
season
• The younger generation is more willing to pay for their delivery, with up to 75% willing to pay for same-day delivery. The younger
generation is up to three times more willing to pay for delivery compared to the older generation. However, the amount they want to
pay is up to 30% lower compared to the older generation
• In ‘non-holiday’ periods, a similar amount of consumers (50-60%) is willing to pay for same day delivery, but the amount they are
willing to pay is only €4 on average, showing the increased importance of a reliable same-day delivery option during the holiday
season1
1Source: Deloitte Digital Omnichannel Fulfilment 2017
Assuring on-time delivery
19%
€4
15%
€4
29
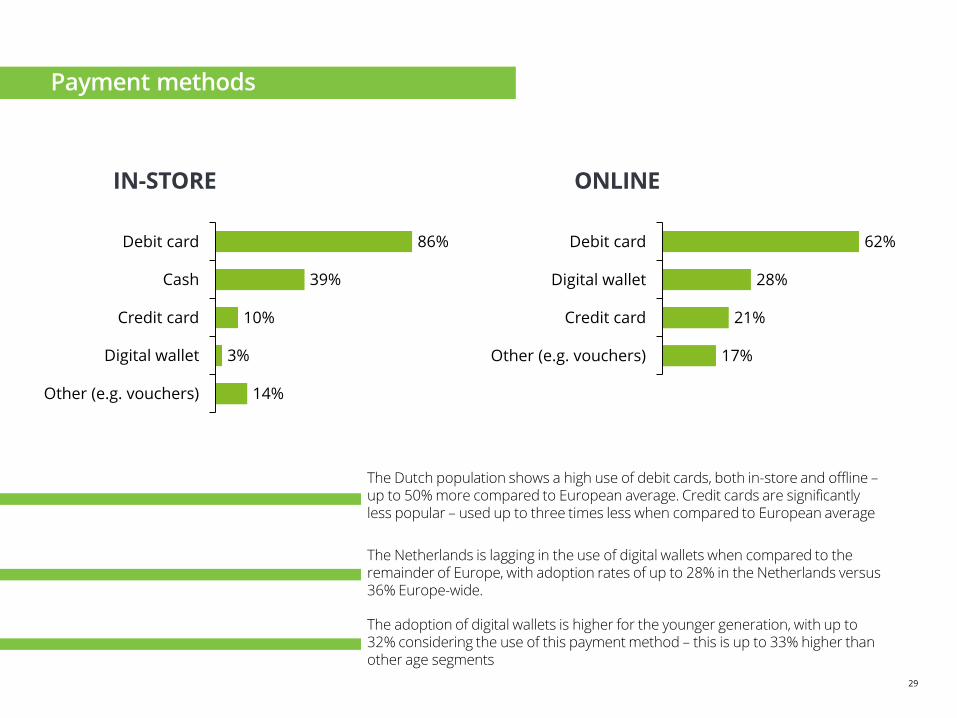
The Dutch population shows a high use of debit cards, both in-store and offline –up to 50% more compared to European average. Credit cards are significantly less popular – used up to three times less when compared to European average
IN-STORE ONLINE
Other (e.g. vouchers)
Debit card
Digital wallet
Cash
Credit card
86%
39%
10%
3%
14%
Debit card
21%
28%Digital wallet
62%
Credit card
Other (e.g. vouchers) 17%
The Netherlands is lagging in the use of digital wallets when compared to the remainder of Europe, with adoption rates of up to 28% in the Netherlands versus 36% Europe-wide.
The adoption of digital wallets is higher for the younger generation, with up to 32% considering the use of this payment method – this is up to 33% higher than other age segments
Payment methods

30
Holiday shopping trends survey 2018
Methodology
The conclusions of this study have been drawn from the results of a survey conducted over the internet to a population sample of more than 9,000 people
The data has been obtained through a structured questionnaire on a sample of the population between 18 and
65 years old within a controlled panel
The sample was chosen based on socio-demographic characteristics,
personal interests, income level and consumption behaviours
The information was collected between 3 and 15 October, 2018
Austria Belgium Germany Italy Netherlands Poland Portugal Russia Spain UK TOTAL
Participants 842 897 1,150 1,022 840 831 780 949 921 937 9169
This year, 10 countries participated, all of them European

31
Adgild HopPartner – Dutch Retail LeadTel: +31 (0)88 288 8721Mobile: +31 (06) 3463 5321Email: [email protected]
Patrick SchunckPartner – Dutch Consumer Business Consulting & Consumer Products LeadTel: +31 (0)88 288 1671Mobile: +31 (0)6 2126 7379Email: [email protected]
Wesley SnoerenConsultant – Strategy & Operations | Omnichannel Retail
Lars MulderAnalyst – Strategy & Operations | Omnichannel Retail
Contacts
Authors
Holiday shopping trends survey 2018


